a cross section along the western atlantic ocean note the minimum in , which seems to imply a...
TRANSCRIPT

A Cross Section along the Western Atlantic Ocean
Note the minimum in , which seems to imply a vertical instability. However, it is because is not adequate. In fact, using 4 gets stable stratification.
Antarctic Intermediate Water
North A
tlantic Deep W
ater
Antarctic Bottom Water
The Sources of the North Atlantic Deep WaterThe next densest water is the North Atlantic Deep Water (NADW, Temperature 2.5oC, salinity 35.03).
NADW fills the depth range between 1000 m and 4000 m. In vertical sections, it is seen as a layer of relatively high salinity (>34.9) and oxygen (above 5.5ml/L) extending southward from the Labrador Sea to the Antarctic Divergence.
More detailed inspection reveals two oxygen maxima within the NADW in the subtropics, at 2000-3000 m and 3500-4000 m depth, indicating the existence of two distinct Deep Water varieties. In fact, there is also a third branch.
The three branches are called as the lower, middle, and higher NADW, which show slight density differences and remain vertically layered along their southward paths.
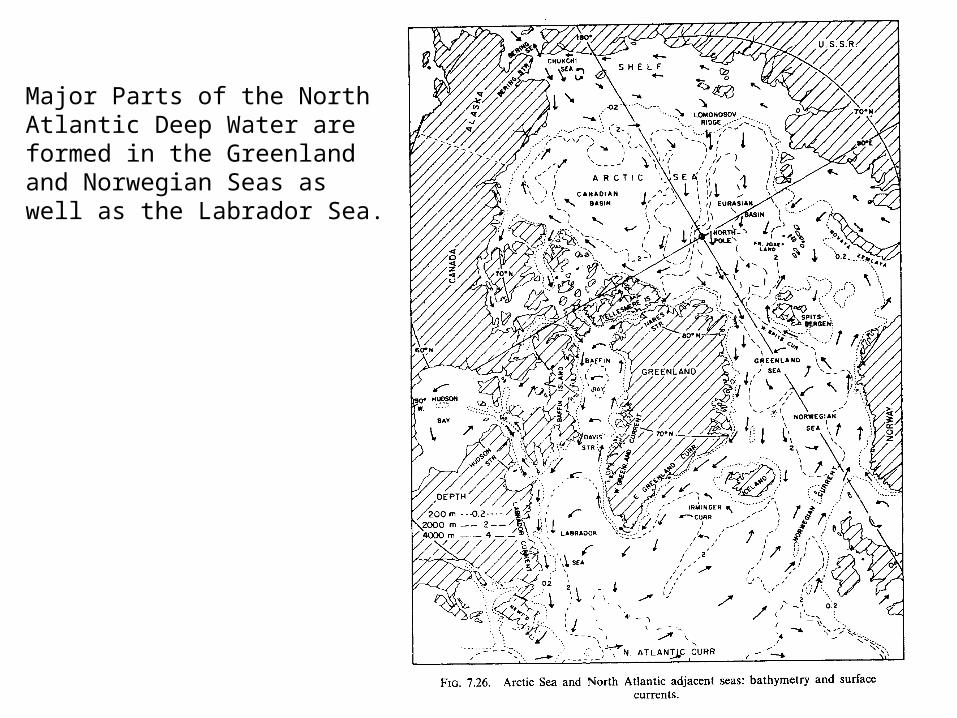
Major Parts of the North Atlantic Deep Water are formed in the Greenland and Norwegian Seas as well as the Labrador Sea.

Greenland Sea and Norwegian Sea: The lower NADW
The NADW is mainly formed in the Greenland Sea and the Norwegian Sea (80%).
A submarine ridge extending from Greenland to Scotland limits the water exchange between the North Atlantic Ocean and the Norwegian Sea.
In the Greenland Sea, relatively light incoming water from the North Atlantic becomes denser by strong local winter cooling and sinks (the open ocean process, different from the shelf water in the Antarctic).
The sinking is associated with the passage of storm systems, each event lasting less than a week. The Greenland Sea Deep Water is combined with the waters from the Arctic shelf region to form the Arctic Bottom Water.
The Norwegian Sea is the mixing basin where Arctic Bottom Water obtain its final characteristics (potential temperature is close to -0.95oC and Salinity 34.9).
The dense Arctic Bottom Water flows into the North Atlantic over the ridge connecting Greenland and British isles.

Open Ocean Sinking
1) A background cyclone gyre circulation in response to winds raise a dome of isotherm (scale~100km)
2) Density increase in the upper ocean due to surface cooling to form the preconditioning pool
3) Mixed layer penetration into the intermediate water dome
4) Narrow plumes with width on the order of 1km develop, with downward speed as high as 10 cm/s
5) Vertical homogeneous fluid forms6) Horizontal spreading of the deep water
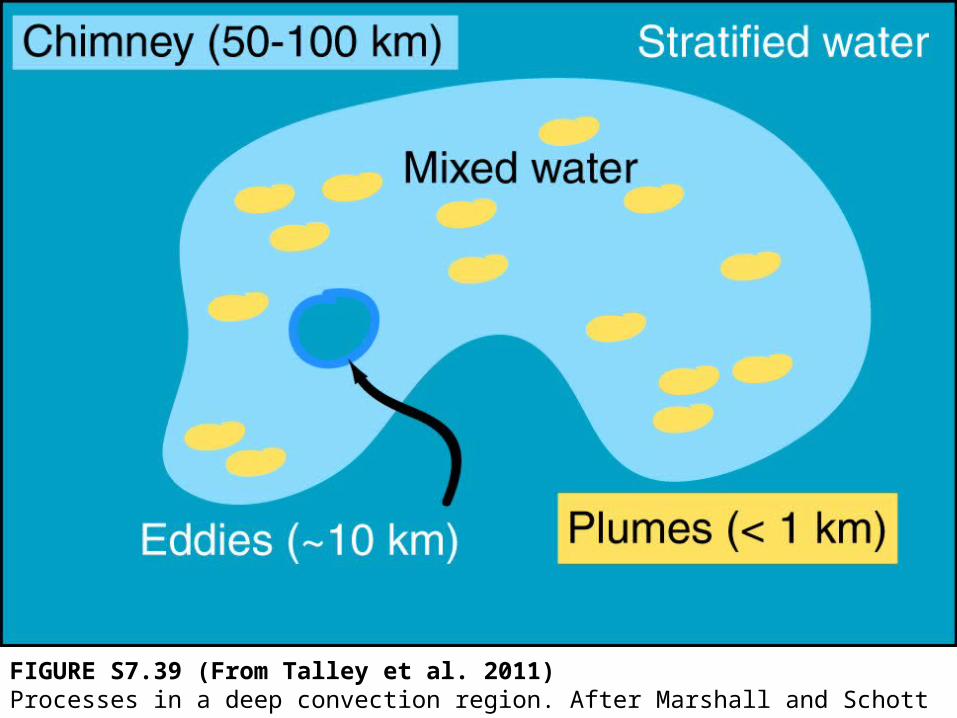
FIGURE S7.39 (From Talley et al. 2011)Processes in a deep convection region. After Marshall and Schott (1999).

The Faroe Bank Channel is about 800 m, outflow roughly 1x10⁶ m3/s (1 Sv).The second channel passes over the ridge between the Faroe Islands and Iceland (sill depth 300-400 m, transport 1 Sv).The combined Iceland-Scotland overflow, after leaving the ridge is about 5 Sv (3 Sv is entrained Atlantic water).
This overflow continues southward against the eastern side of the Mid-Atlantic Ridge, and passes through the Gibbs Fracture Zone near 53oN into the Labrador Basin. Its westward transport is still 5 x 10⁶ m3/s (little direct flow into low latitudes).This current then flows northward in the eastern Labrador basin, and, south of Greenland, joins the third flow from the Denmark Strait (about 600 m).
1Sv (2-2.5Sv)
1Sv (0.5-1Sv)
5Sv
5Sv (3Sv)
10Sv

FIGURE 9.24(a) (From Talley et al. 2011)(a) Potential density in Denmark Strait. The heavy contour marks the upper bound on the overflow layer in the strait. Source: From Macrander et al. (2005).

FIGURE 9.24(b) (From Talley et al. 2011)(b) Potential temperature (°C) crossing the Iceland-Faroe Ridge. Source: From Hansen and Østerhus (2000).
The total transport is 10 (6) x106 m3/s for the full flow south of Greenland, thereby indicating a contribution of 5 (3) x106 m3/s from the Denmark Strait overflow. Part of it is Atlantic water entrained by the Denmark Strait overflow as it descends the Greenland continental slope.
Even though the overflows on either side of Iceland originate from the same Norwegian Sea water, the Denmark Strait overflow water (DSOW) is distinctly colder and fresher (=0.0-0.2oC, S=34.88-34.93) (-1.8oC, 34.88 psu, σθ=28.02 kg/m3 to 0.17oC, 34.66 psu, σθ=27.82 kg/m3, Talley et al. 2011) than Iceland-Scotland overflow water (ISOW, =1.8-3oC, S=34.98-35.03), (-0.5-3oC, 34.87-34.90 psu, σθ=28.02-27.8 kg/m3, Talley et al. 2011) mainly because the upper kilometer Atlantic water entrained in the east is warmer and more saline.
The DSOW and ISOW are sometimes collectively referred to as the Nordic Sea Overflow Water (NSOW)

The overflow is highly variable. Measurements show that overflow is coming in bursts 1-2 day long, with speeds up to 140 cm/s, separated by 1 to several days. It probably reflects the fact the overflow is generated by cyclonic winds from intense storm systems that lift up the bottom water by a hundred meters or so behind the sill.
The lower NADW has its origin in the Greenland-Iceland-Scotland overflow region, which indicates that some Deep Water is formed before the Arctic Bottom Water reaches the Labrador Sea through mixing of the overflow water with the surrounding waters. East of the Mid-Atlantic Ridge, this is the only mechanism for the formation of Deep Water and the lower NADW is particularly prominent in the eastern basins. Therefore, it is also called as the eastern NADW.

Labrador Sea: Middle NADWFor a long time, the origin of the NADW was thought to be in the Labrador and Irminger Seas off the southern tip of the Greenland where winter cooling of relatively saline water was considered to cause it to sink to considerable depths and then spread southward. Now it is generally recognized that the NADW is mainly produced in the Greenland and Norwegian Seas.
However, sinking in the Labrador Sea is still a major source of the formation of NADW. In the region south of the southern tip of Greenland, the water properties in late winter are almost uniform from the surface to near bottom. The explanation for this situation was that the deep water was actually forming at the time. This Labrador Sea Water is the product of deep convection during the winter months.
However, the deep convection is not an annual event. Estimates are that they occur in 6 out of 10 years. Moreover, no “event” of large-scale convective overturn was observed until more recently. The processes causing the convection in this region are not totally clear, probably through small space and time scales.
The middle (or western) NADW can be traced back to the surface near 55oN, The transport is estimated to be 3.5x10⁶ m3/s.

Labrador Sea Water (LSW)
• A lateral and vertical salinity minimum in the subpolar North Atlantic
• A lateral and vertical minimum in potential vorticity (maximum in layer thickness) in the subpolar North Atlantic and subtropical western boundary region
• A lateral and vertical extremum in dissolved gasses, such as O2, that mark recent ventilation

From this column of the Labrador Sea, a tongue of 3o to 3.25oC water extended south at depths of 2000 to 2500 m. This water had a high oxygen content; even at 2000 m depth it was still 90% of that at the surface.
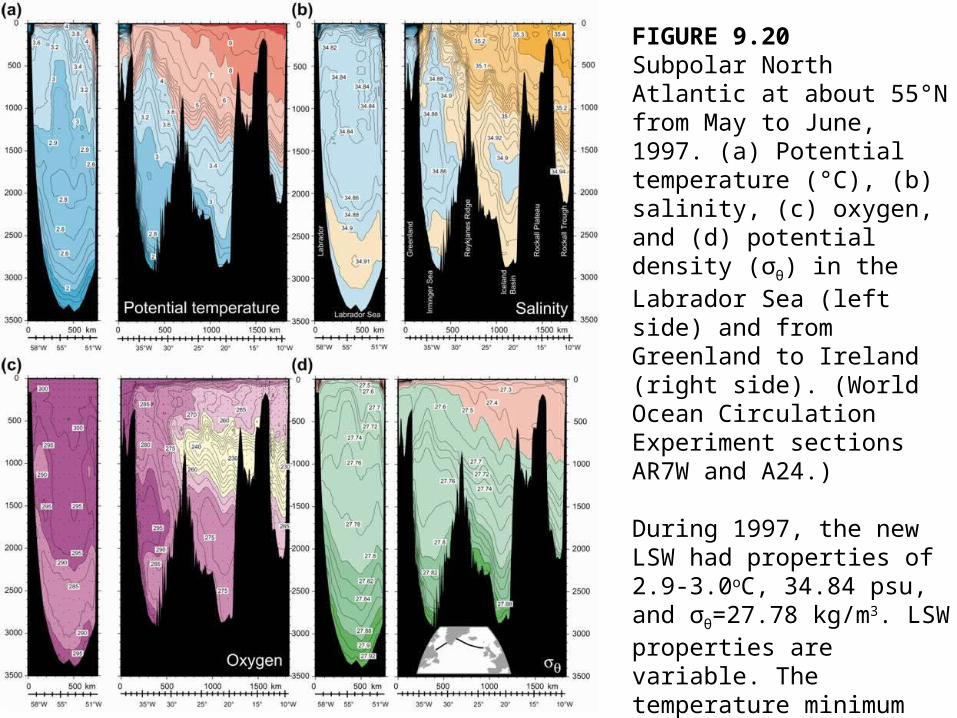
FIGURE 9.20Subpolar North Atlantic at about 55°N from May to June, 1997. (a) Potential temperature (°C), (b) salinity, (c) oxygen, and (d) potential density (σθ) in the Labrador Sea (left side) and from Greenland to Ireland (right side). (World Ocean Circulation Experiment sections AR7W and A24.)
During 1997, the new LSW had properties of 2.9-3.0oC, 34.84 psu, and σθ=27.78 kg/m3. LSW properties are variable. The temperature minimum (<2.8oC) at about 2000m is remnant LSW from more rigorous convection at a historically low temperature several years prior. (From Talley et al. 2011)

FIGURE 9.21(ab) (From Talley et al. 2011)LSW.(a) Salinity at the LSW potential vorticity minimum. Dark curve is the limit of the PV minimum; salinity on an intersecting isopycnal is shown south and east of this limit. Source: From Talley and McCartney (1982). (b) Chlorofluorocarbon-11 (pmol/kg) in the upper LSW layer, at σθ ~ 27.71 kg/m3. Figure 9.21b can be found in the color insert. Source: From Schott et al. (2009) and from Kieke et al. (2006).

FIGURE S9.31(From Talley et al. 2011)Labrador Sea Water. (a) Mixed layer depths in winter (1996–1998) from profiling floats. Red: >800 m. Blue: 400 to 800 m. Green: <400 m. Source: From Lavender et al. (2000). (b) Potential density profiles from a deep convection region in the Labrador Sea in late winter of 1997 (“119” in the deep convection patch, “62” in a western boundary convection regime, “59” typical of stratified water). (c) Vertical section through the Labrador Sea in late winter 1997 that includes deep convection stations. ©American Meteorological Society. Reprinted with permission. Source: From Pickart, Torres, and Clarke (2002).
Estimated LSW production rates vary from 2 to 11 Sv; the most recent is 3 to 9 Sv based on CFC inventory in the subpolar Atlantic. The southward export rate in the DWBC, as estimated at 24oN is around 6-8 Sv, which is a significant fraction of the total NADW export of 15-20 Sv.

Mediterranean Sea: Upper NADW
The rate of outflow through the Straits of Gilbratar is estimated from the overall salt budget for the Mediterranean Sea and current measurements; both agree on a mean of about 1x10⁶ m3/s (0.7 Sv). The Mediterranean Water Mass (MW) leaves the Strait of Gilbratar with T=13.5oC and S=37.8 (38.4, σθ=28.95kg/m3). Within 250km its T & S are reduced by mixing to 11o-12oC and 36-26.2. By the time the outflow current completes its descent and departs from the continental slope, its volume transport has increased, by entrainment of Atlantic water, to roughly 10x106 m3/s.

FIGURE 9.23(ab) (From Talley et al. 2011)(a) Temperature, salinity, and potential density profiles near the strait sill in spring. Source: From Bray, Ochoa, and Kinder (1995). (b) Potential density at 6° 30’W just west of the Strait of Gibraltar, in spring. Source: From Ochoa and Bray (1991).

FIGURE 9.23(c) (From Talley et al. 2011)(c) Outflow pathways of the MW. Source: From Zenk (1975).

FIGURE 6.4Different types of surfaces for mapping. The Mediterranean Water salinity maximum illustrated using: (a) a standard depth surface (1200 m); (b) an isopycnal surface (potential density σ1 = 32.2 kg/m3 relative to 1000 dbar, σθ ~ 26.62 kg/m3 relative to 0 dbar, and neutral density ~ 26.76 kg/m3); (c) at the salinity maximum of the Mediterranean Water and North Atlantic Deep Water (white areas are where there is no deep salinity maximum); and (d) data locations used to construct these maps. This figure can also be found in the color insert. (From Talley et al. 2011)

The Smax marking the core of the Mediterranean outflow (named as the Upper NADW by Wüst) is found at about 1200 m in the southeastern North Atlantic. (Relatively high salinities can be detected at least as deep as 3000m.)
The MW spreads isopycnally across the ocean, mixing gradually with the Deep Water below. Relative to the other NADW it has higher T & S maximized at 1000m depth near the upper limit of the NADW.
MW first flows northward under the influence of the Coriolis force and mixes into the subtropical gyre circulation, eventually spreading southward and westward. The T-S core sinks as the water spreads.

• These ‘Meddies” propagate southwestward into the North Atlantic, retaining their coherence and high salinity for enormously long distances and over 2-3 years. They are entirely subsurface.
• At formation, the Meddies are small-about 9 km in diameter. After aging and propagation, their radii become 20-100 km, with a thickness of about 650 m, and centered at about 1000m depth.
• Approximately 15-20 may be found each year. They may carry up to 50% of the MW into the North Atlantic.
• The “Mediterranean salt tongue” is associated with eddy diffusivity related to planetary wave and eddy-like motion (8-21 × 106 cm2/s)
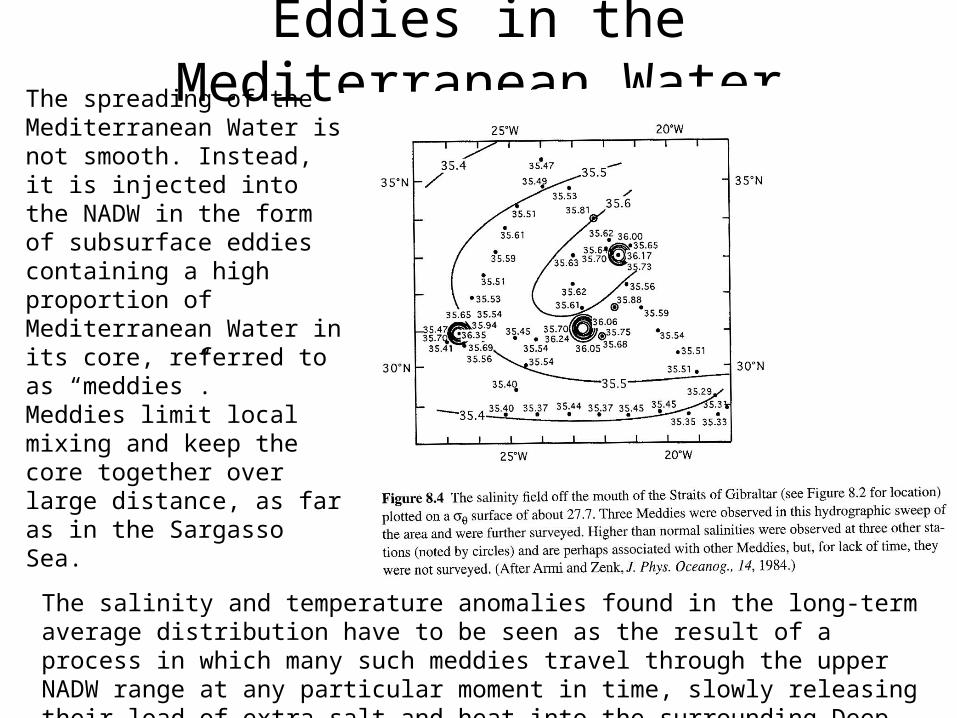
Eddies in the Mediterranean Water
The spreading of the Mediterranean Water is not smooth. Instead, it is injected into the NADW in the form of subsurface eddies containing a high proportion of Mediterranean Water in its core, referred to as “meddies”. Meddies limit local mixing and keep the core together over large distance, as far as in the Sargasso Sea.
The salinity and temperature anomalies found in the long-term average distribution have to be seen as the result of a process in which many such meddies travel through the upper NADW range at any particular moment in time, slowly releasing their load of extra salt and heat into the surrounding Deep Water.

FIGURE S9.32a (From Talley et al. 2011)Meddies. (a) Occurrences in historical hydrographic data, superimposed on a map of salinity anomaly of Mediterranean Water near 1100 m depth. (b) Float trajectories in Meddies. Source: From Richardson, Bower, and Zenk (2000).
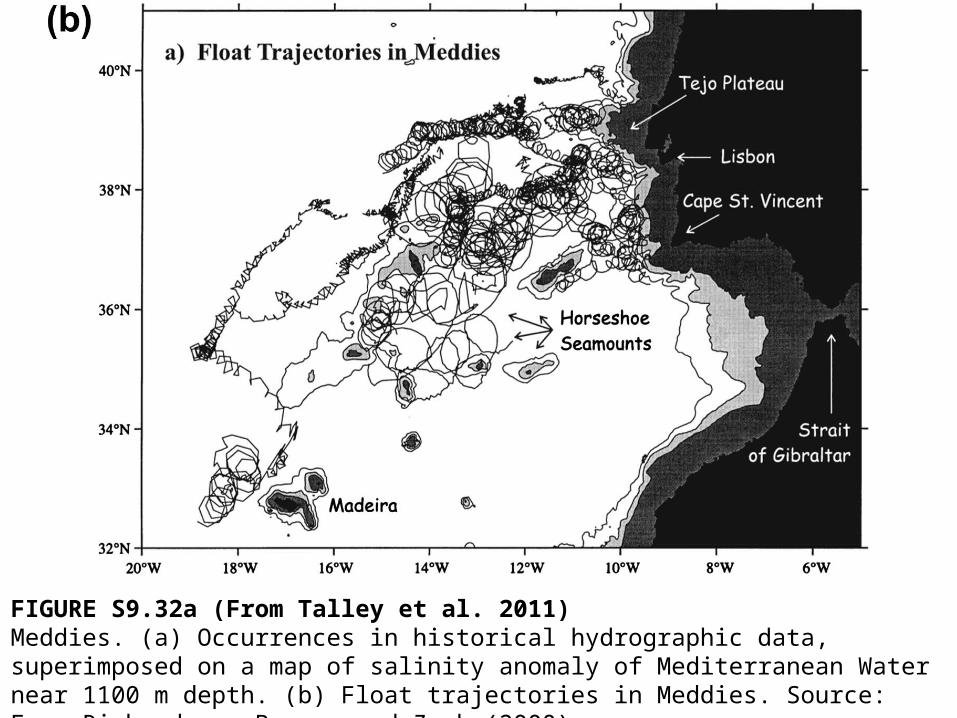
FIGURE S9.32a (From Talley et al. 2011)Meddies. (a) Occurrences in historical hydrographic data, superimposed on a map of salinity anomaly of Mediterranean Water near 1100 m depth. (b) Float trajectories in Meddies. Source: From Richardson, Bower, and Zenk (2000).

FIGURE S9.33 (From Talley et al. 2011)Meddy structure. (a) Salinity and (b) potential density through the only two Meddies found on a synoptic section in 1988, with adjacent profiles, at 26°N, 26°W (large dots on inset map). Inset map: salinity contoured at potential density referenced to 1000 dbar = 32.2 kg/m3 (around σθ = 27.65 kg/m3), with all stations from the 1988 section. After Tsuchiya, Talley, and McCartney (1992).

The Track of the North Atlantic Deep Water
Both lower and middle NADW are more saline at their sources than the ABW, and their salinities are increased somewhat in mid-latitudes of the North Atlantic through mixing with the outflow from the Mediterranean Sea.
Although the lower and middle NADW are made dense by cooling, their temperatures are not reduced to freezing point before sinking, but remain high enough that, despite more saline, they are less dense than the Antarctic Bottom Water, and therefore override it.
This high-salinity water spreads throughout the South Atlantic, is carried eastward around Antarctica in the Circumpolar Current, and its elevated salinities can be followed into low latitudes of the South Indian and South Pacific Oceans.