a ctionable k nowledge d iscovery for t hreats i ntelligence s upport ~ a m ulti -d imensional d ata...
Post on 20-Dec-2015
212 views
TRANSCRIPT

ACTIONABLE KNOWLEDGE DISCOVERYFOR THREATS INTELLIGENCE SUPPORT
~A MULTI-DIMENSIONAL DATA MINING METHODOLOGY
2nd Int. Workshop on Domain Driven Data Mining
Pisa - Dec 15th, 2008
Olivier ThonnardRoyal Military Academy
Polytechnic FacultyBelgium
Marc DacierSymantec Research Labs
Sophia AntipolisFrance

Outline
1. Introduction2. A multi-dimensional & domain-driven approach
for mining network traffic (eg malicious)3. Experimental environment4. A real-world example5. Conclusions

Introduction
According to the security community, today’s cybercriminality: Is increasingly organized Involves the commoditization of various activities :
By selling 0-days and new (undetected) malwares By selling /renting compromised hosts or entire botnets
Seems to be specialized in certain countries Coordination patterns …

Threats intelligence What is the prevalence of emerging coordinated malicious
activities? Which countries / IP blocks seem to be more affected? Can we observe various “communities” of machines coordinating their
efforts?
How to discover knowledge about:1. The modus operandi of attack phenomena2. The underlying root causes of attacks
How to analyze Internet threats from a global strategic level? Can we enable some sort of Internet threat “situational awareness”

Our « multi-dimensional KDD » approach to analyze network threats
Collect real-world attack traces from a number of (worldwide) distributed sensors Network of honeypots = “Honeynet”
Threats analysis (semi-automated): Collect “attack events” from each sensor Multi-dimensional KDD:
1) Extract relevant nuggets of knowledge DDDM (with expert-defined features )– Using Clique algorithms (clique-based clustering)
extraction of maximal weighted cliques
2) Synthesizing those pieces of knowledge, to create “concepts” describing the attack phenomena– Using Cliques combinations DDDM
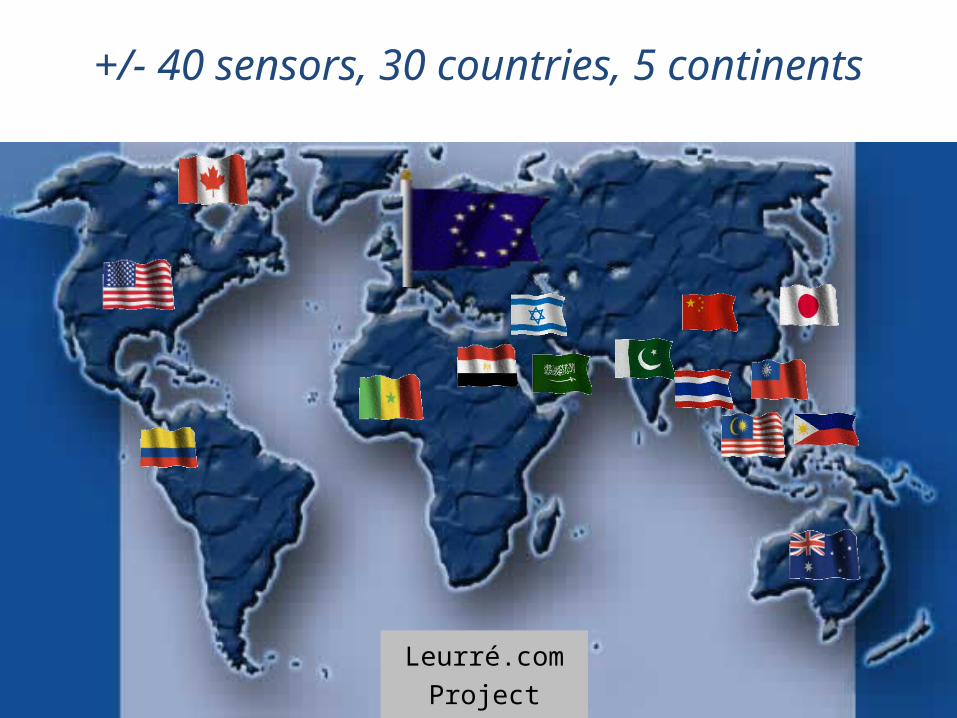
+/- 40 sensors, 30 countries, 5 continents
6
Leurré.comProject
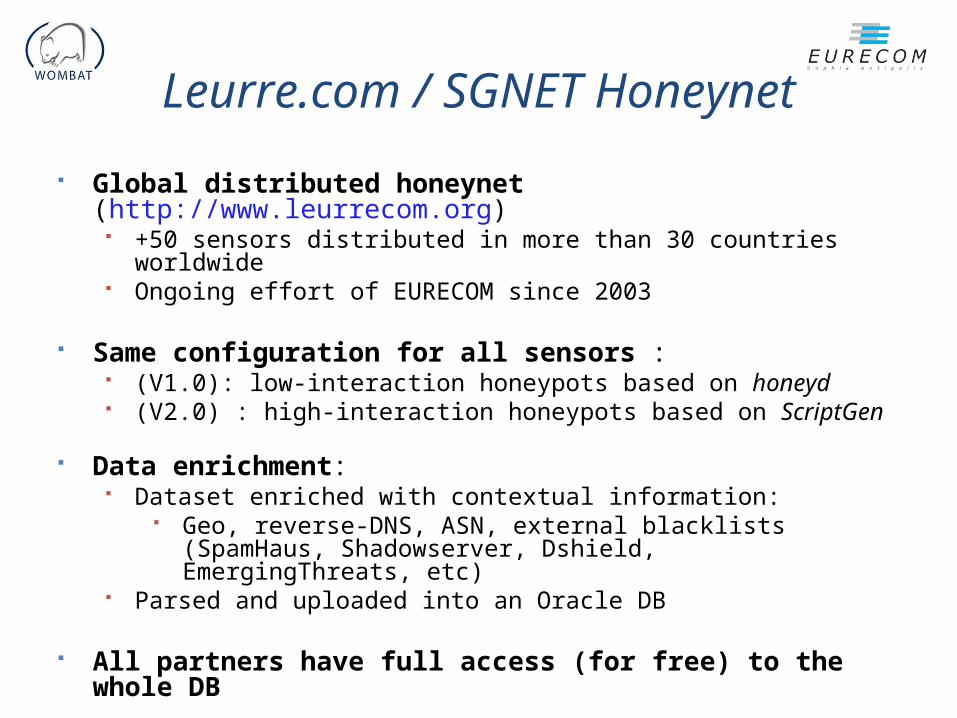
Leurre.com / SGNET Honeynet
Global distributed honeynet (http://www.leurrecom.org) +50 sensors distributed in more than 30 countries worldwide Ongoing effort of EURECOM since 2003
Same configuration for all sensors : (V1.0): low-interaction honeypots based on honeyd (V2.0) : high-interaction honeypots based on ScriptGen
Data enrichment: Dataset enriched with contextual information:
Geo, reverse-DNS, ASN, external blacklists (SpamHaus, Shadowserver, Dshield, EmergingThreats, etc)
Parsed and uploaded into an Oracle DB
All partners have full access (for free) to the whole DB

Research contextWOMBAT
Worldwide Observatory of Malicious Behaviors And Threats EU-FP7 project ( http://www.wombat-project.eu ) Joint effort in collecting, sharing and analyzing data on global Internet
threats

Definition 1: Attack profiles
In our honeynet: A source = an IP address that targets a honeypot platform
on a given day, with a certain port sequence. All sources are clustered into “attack (profiles)” based on
certain network characteristics(*): targeted port sequence, #packets, attack duration, packet payload, …
(*) F. Pouget, M. Dacier, Honeypot-Based Forensics. AusCERT Asia Pacific Information technology Security Conference 2004.
Attack tool
Fingerprint(s)

Definition 2: Attack event on sensor ‘x’
Event 1
Event 2
Event 3

Dimensions usedto create “attack cliques”
We need to identify salient features for the creation of meaningful cliques (“viewpoints“) expert-defined characteristics for each dimension
Geolocation Botnets located in specific regions So-called “safe harbors” for the hackers
IP netblocks / ISP’s of origin Bias in worm propagation (e.g. malware coding strategies) “Uncleanliness” of certain networks (e.g. clusters of zombie machines)
Many others Time series
Synchronized activities targeting different sensors
Targeted sensors
Remark: distance used for distributions Kullback-Leibler, Chi-2, and Kolmogorov-Smirnov

Cliques combination:Creating multi-dimensional “concepts”
Geographical cliquesof attack events
Temporal cliquesof attack events
time
time
Dimension 2-concept
time+
Remark: for each dimension, we extract maximal weighted cliques using the « dominant sets » approximation (! needs a full similarity matrix)

Dynamic creation of Concept latticesD
imensional Level
Cliques = D1-concepts
D4-concept
Initial set of attack events
D2-concepts
D3-concepts

Some experiments
Some analysis details: Timeframe: Sep 2006 June 2008 Network traffic volume : 282,363 IP sources (grouped into
351 attack events) Nr of targeted sensors: 36
In 20 different countries, 18 different subnets 136 different attack profiles (i.e. attack clusters)

Experimental resultsCliques overview
Attack Dimension Nr of cliques Volume of
sources (%) Most targeted port sequences
Geolocation 45 66.4
1027U, I, 1433T, 1026U, I445T, 5900T, 1028U, 9763T, I445T80T, 15264T, 29188T, 6134T,6769T, 1755T, 64264T, 1028U1027U1026U, 32878T, 64783T, 4152T, 25083T, 9661T, 25618T, …
IP Subnets (Class A) 30 56.0
1027U, I, 1433T, 1026U, I445T, 5900T, 1028U, 9763T, 15264T, 29188T, 6134T, 6769T, 1755T,50656T, 64264T, 1028U1027U1026U, 32878T, 64783T, 18462T, 4152T, 25083T, 9661T, 25618T, 7690T, …
Targeted sensors 17 70.1
I, 1433T, I445T, 1025T, 5900T, 1026U, I445T139T445T139T445T, 4662T, 9763T, 1008T, 6211T, I445T80T, 15264T, 29188T, 12293T, 33018T, 6134T, 6769T, 1755T, 2968T, 26912T, 50656T, 64264T, 32878T, …
Attack time series 82 92.2
135T, I, 1433T, I445T, 5900T, 1026U, I445T139T445T139T445T, I445T80T, 6769T, 1028U1027U1026U, 50286T, 2967T, …

Visualizing Cliquesusing Multi-dimensional Scaling
High-dimensional dataset Low-dimensional map retaining the global and local structure ‘Dimensionality reduction’
Build a matrix with e.g.: Rows = attack events Columns = feature vectors
Example : Geolocation vector of 226 country variables
MDS techniques Linear PCA Non-linear Sammon mapping, Isomap, LLE, (t-)SNE

Visualizing Cliquesusing MDS and Country labels
Cliq
ue n
umbe
r

Combining Cliques: Real-world example
Platform cliquesp7p7
Attack events
{1,2,3,…,67}
Attack events
{1,2,3,…,67}
Botnet scans on ports:I, I-445T, I-445T-139T, I-445T-80T
Botnet scans on ports:I, I-445T, I-445T-139T, I-445T-80T
Cliques of Time seriests1ts1 ts4ts4 ts6ts6ts2
time
Geo cliques
Subnets cliques
g1g1
s12s12
g9g9 g16g16 g12g12 g32g32 g3g3
s4 s19 s26 s28 s30 s24s2
superclique
Only scanners !(ICMP)
Only scanners !(ICMP)
Only attackers!(I-445T-139T…)
Only attackers!(I-445T-139T…)
Dim
ension

Visualizing Cliquesusing Multi-dimensional Scaling
Cliq
ue n
umbe
r
attackers
scanners

Real-world example:Botnet attack waves
Inferred facts: Different waves in time
Those 4 botnet waves have hit the same group of platforms
Dynamic evolution of the botnet population (IP blocks)
between each attack wave
Separation of attackers and scanners

Scanners vs Attackers …
Scanning bots Attacking bots

Conclusions
This KDD methodology can produce concise, high-level summaries of attack traffic: Attack cliques deliver insights into global attack phenomena
Facilitates the interpretation of traffic correlations: Attack concepts are rich in semantic It helps to uncover certain modus operandi
Flexible and open to additional correlation « viewpoints »: New clique dimension can be added easily when experts find it
relevant (i.e. domain-driven)
Future work
Integration of other relevant attack features: Botnet / worm patterns separation Malware characteristics (e.g. from high-interaction traffic)
Find appropriate combination of attack dimensions: Generation of higher-level “concepts” describing real-
world phenomena Knowledge engineering:
Exploit attack concepts “reasoning system” Decision tree, expert system, kNN, … ?

Thank you.Any question?
Note:If you’d like to participate in the WOMBAT project (*),
please do not hesitate to contact us:
Engin Kirda: [email protected] Marc Dacier: [email protected]
Olivier Thonnard: [email protected]
(*) Leita, C.; Pham, V.; Thonnard, O.; Ramirez-Silva, E.;Pouget, F.; Kirda , E.; Dacier, M.The Leurre.com Project: Collecting Internet Threats Information Using a Worldwide Distributed Honeynet. 1st WOMBAT workshop, April 21st-22nd, Amsterdam.

Leurre.com V2.0:SGNET(*)
Novel high-interaction honeypots SGNET = ScriptGen Hpots + Argos emulator + Nepenthes Malware analysis: VirusTotal + Anubis Sandbox
Anubis
Malwarerepository
ScriptGen
“0-day”Automatedsubmissions
(*) Corrado Leita and Marc Dacier. SGNET: a worldwide deployable framework to support the analysis of malware threat models. (EDCC 2008, Lithuania)