a decision model for public sector assessment of
TRANSCRIPT

1
DECISION MODEL FOR PUBLIC SECTOR ASSESSMENT OF SUSTAINABLE BUILDINGS IN FLORIDA
By
JAMES G. SULLIVAN
A DISSERTATION PRESENTED TO THE GRADUATE SCHOOL OF THE UNIVERSITY OF FLORIDA IN PARTIAL FULFILLMENT
OF THE REQUIREMENTS FOR THE DEGREE OF DOCTOR OF PHILOSOPHY
UNIVERSITY OF FLORIDA
2007

2
© 2007 James G. Sullivan

3
To my family; thank you

4
ACKNOWLEDGMENTS
My thanks and appreciation is extended to the entire Blaney family for their guidance,
concern, and support throughout my life. If it was not for Bill, I would have never developed my
fascination for hardhats and drafting tables. My gratitude to Dr. Charles Kibert for his
inspirational leadership, and thanks to the entire staff at the M.E. Rinker, Sr., School of Building
construction for their generosity and seemingly endless patience. To Dr. James Lynch and his
staff I am enduringly beholden. Finally I acknowledge my friends, classmates, and students for
their support, for I rarely travel alone.

5
TABLE OF CONTENTS page
ACKNOWLEDGMENTS ...............................................................................................................4
LIST OF TABLES .........................................................................................................................10
LIST OF FIGURES .......................................................................................................................12
CHAPTER
1 INTRODUCTION ..................................................................................................................15
Introduction .............................................................................................................................15 Sustainability Defined ............................................................................................................16 Problem Statement ..................................................................................................................16 Purpose of the Study ...............................................................................................................17 Methodology ...........................................................................................................................17 Research Objectives and Limitations .....................................................................................18
Objective 1 .......................................................................................................................18 Objective 2 .......................................................................................................................18 Objective 3 .......................................................................................................................19 Objective 4 .......................................................................................................................19 Objective 5 .......................................................................................................................19 Limitation 1 .....................................................................................................................19 Limitation 2 .....................................................................................................................19 Limitation 3 .....................................................................................................................19 Limitation 4 .....................................................................................................................20 Limitation 5 .....................................................................................................................20 Limitation 6 .....................................................................................................................20
2 LITERATURE REVIEW .......................................................................................................22
Introduction .............................................................................................................................22 Defining Green ................................................................................................................24 Designing Green ..............................................................................................................25 Costing Green ..................................................................................................................26 UF’s First Green Project – Rinker Hall ...........................................................................28
Sustainable Construction ........................................................................................................29 Driving Forces ........................................................................................................................33 Business Case for Green .........................................................................................................34
First-Cost Benefits ...........................................................................................................35 Building Performance Benefits .......................................................................................36 Health and Productivity Benefits .....................................................................................37 Environmental Benefits ...................................................................................................40 Social Benefits .................................................................................................................41
Barriers to Sustainable Design ................................................................................................43

6
Local Adoption of LEED Programs .......................................................................................44 Gainesville and Sarasota ..................................................................................................45 Market Trends .................................................................................................................45 Florida ..............................................................................................................................46 Florida Universities and Community Colleges Construction Background .....................47 Funding for University Projects ......................................................................................48 Construction Costs for Postsecondary Projects ...............................................................49 UF, FSU, and UCF Cost Comparison .............................................................................49
University of Florida LEED History ......................................................................................51 Cost Impact of LEED Credits .................................................................................................53 Evaluation of LEED Prerequisites ..........................................................................................55 Cost Anchoring and Adjusting ...............................................................................................55
Florida Code and LEED Prerequisites ............................................................................57 Sustainable Site Prerequisite ...........................................................................................59 Energy and Atmosphere Prerequisite 1 Fundamental Commissioning ...........................59 Energy and Atmosphere Prerequisite 2 Minimum Energy Performance ........................62 Energy and Atmosphere Prerequisite 3 CFC Reduction in HVAC and R Equipment ....62 Materials and Resources Prerequisite 1 Storage and Collection of Recyclables ............62 Indoor Environmental Quality Prerequisite 1 ..................................................................63 Indoor Environmental Quality Prerequisite 2 Environmental Tobacco Smoke ..............63
Separation of Preference and Cost ..........................................................................................65
3 DECISION MODEL METHODOLOGY ..............................................................................81
Introduction .............................................................................................................................81 Current Building Method ........................................................................................................81 Existing Delivery Method Performance Evaluation ...............................................................82 Global Performance Level ......................................................................................................83 Goal Identification and Program Assessment .........................................................................84 Decision to Change .................................................................................................................85 Logical Scoring of Preferences ...............................................................................................87 Sustainable Requirements and Parameter Tree ......................................................................87 Preference Analysis Model .....................................................................................................89
Multi-attribute Decision Analysis (MADA) ...................................................................89 Analytic Hierarchy Process (AHP) Detail .......................................................................91 Preference Weighting of LEED Alternatives ..................................................................95
Cost Analysis Model ...............................................................................................................96 Costing Assumptions and Limitations .............................................................................97 Cost Preference Analysis .................................................................................................98
Ranking of Competitive Systems ...........................................................................................99 Decision ..................................................................................................................................99 Transition to More Sustainable Methods ..............................................................................100 Sustainable Building Practices in Operation ........................................................................100
4 DECISION MODEL FUNCTIONS .....................................................................................109
Introduction ...........................................................................................................................109

7
Preference Analysis Model ...................................................................................................109 Cost Analysis Model .............................................................................................................112 Cost Preference Analysis ......................................................................................................113 Ranking of Competitive Systems .........................................................................................114 Decision (Selection of Best Alternative) ..............................................................................114 Transition to More Sustainable Practices (Trend Analysis) .................................................114
5 RESULTS .............................................................................................................................131
Model Summary ...................................................................................................................131 UF’s No-Cost LEED Certification .......................................................................................131 Sample Output by Preference for Identical Project Data Input ............................................132
UF Based Preference-Cost Analysis .............................................................................133 High-Low Cost Analysis ...............................................................................................133
Outcome Impacts ..................................................................................................................135 Case Study ............................................................................................................................135
6 CONCLUSIONS ..................................................................................................................146
APPENDIX
A LEED PROJECT CHECKLIST ...........................................................................................148
B LEED OVERVIEW ..............................................................................................................151
Introduction ...........................................................................................................................151 Incorporation of UF Directives and LEED Credit Ratings ..................................................151 LEED Credit Summary .........................................................................................................151 Sustainable Sites (SS) ...........................................................................................................151
SS FPC Directive Prerequisite 2 – Cultural Resources Protection (Required) .............152 SS FPC Directive Prerequisite 3 – Clean Water Protection (Required) ........................152 SS Credit 1 Site Selection (Highly Recommended) ......................................................152 SS Credit 2 Urban Redevelopment/Development Density (Recommended) ................152 SS Credit 3 Brownfield Redevelopment (Conditionally Recommended) .....................153 SS Credit 4.1 Alternative Transportation: Public Transportation Access (Highly
Recommended) ..........................................................................................................153 SS Credit 4.2 Alternative Transportation: Bicycle Storage and Changing Rooms
(Highly Recommended) .............................................................................................153 SS Credit 4.3 Alternative Transportation: Low Emitting and Fuel Efficient Vehicles
(Recommended) .........................................................................................................154 SS Credit 4.4 Alternative Transportation: Parking Capacity (Highly
Recommended) ..........................................................................................................155 SS Credit 5.1 Site Development: Protect or Restore Habitat (Highly
Recommended) ..........................................................................................................155 SS Credit 5.2 Site Development: Maximize Open Space (Highly Recommended) .....155 SS Credit 6.1 Stormwater Design: Quantity Control (Recommended) ........................156 SS Credit 6.2 Stormwater Design: Quality Control (Highly Recommended) ..............157

8
SS Credit 7.1 Heat Island Effect: Non-Roof (Highly Recommended) ........................157 SS Credit 7.2 Heat Island Effect: Roof (Highly Recommended) .................................157 SS Credit 8 Light Pollution Reduction (Highly Recommended) ..................................158
Water Efficiency (WE) .........................................................................................................159 WE Credit 1.1 Water Efficient Landscaping: Reduce by 50% (Highly
Recommended) ..........................................................................................................159 WE Credit 1.2 Water Efficient Landscaping: No Potable Water Use or No
Irrigation (Highly Recommended) .............................................................................159 WE Credit 2 Innovative Wastewater Technologies (Highly Recommended) ...............160 WE Credit 3.1 Water Use Reduction: 20% (Highly Recommended) ...........................160 WE Credit 3.2 Water Use Reduction: 30% (Highly Recommended) ...........................161
Energy and Atmosphere (EA) ..............................................................................................161 EA Credit 1 Optimize Energy Performance (Highly Recommended) ..........................162 EA Credit 2 On-Site Renewable Energy (Conditionally Recommended) ....................163 EA Credit 3 Enhanced Commissioning (Highly Recommended) .................................163 EA Credit 4 Enhanced Refrigerant Management (Conditionally Recommended) .......164 EA Credit 5 Measurement and Verification (Highly Recommended) ..........................164 EA Credit 6 Green Power (Conditionally Recommended) ...........................................165
Materials and Resources (MR) .............................................................................................166 MR Credit 1.1 Building Reuse: Maintain 75% of Existing Walls, Floors, and Roof
(Conditionally Recommended) ..................................................................................166 MR Credit 1.2 Building Reuse: Maintain 95% of Existing Walls, Floors, and Roof
(Conditionally Recommended) ..................................................................................167 MR Credit 1.3 Building Reuse: Maintain 50% of Interior Non-Structural elements
(Conditionally Recommended) ..................................................................................167 MR Credit 2.1 Construction Waste Management: Divert 50% from Disposal
(Recommended) .........................................................................................................167 MR Credit 2.2 Construction Waste Management: Divert 75% from Disposal
(Recommended) .........................................................................................................167 MR Credit 3.1 Materials Reuse: 5% (Conditionally Recommended) ..........................168 MR Credit 3.2 Materials Reuse: 10% (Conditionally Recommended) ........................169 MR Credit 4.1 Recycled Content: 10% (post-consumer + ½ pre-consumer) (Highly
Recommended) ..........................................................................................................169 MR Credit 4.2 Recycled Content: 20% (post-consumer + ½ pre-consumer)
(Recommended) .........................................................................................................169 MR Credit 5.1 Regional Materials: 10% Extracted, Processed and Manufactured
Regionally (Highly Recommended) ..........................................................................170 MR Credit 5.2 Regional Materials: 20% Extracted, Processed and Manufactured
Regionally (Recommended) ......................................................................................171 MR Credit 6 Rapidly Renewable Materials (Conditionally Recommended) ................172 MR Credit 7 Certified Wood (Recommended) .............................................................172
Indoor Environmental Quality (EQ) .....................................................................................173 EQ Credit 1 Outdoor Air Delivery Method (Conditionally Recommended) ................173 EQ Credit 2 Increased Ventilation (Conditionally Recommended) ..............................173 EQ Credit 3.1 Construction IAQ Management Plan: During Construction (Highly
Recommended) ..........................................................................................................174

9
EQ Credit 3.2 Construction IAQ Management Plan: Before Occupancy (Highly Recommended) ..........................................................................................................174
EQ Credit 4.1 Low-Emitting Materials: Adhesives and Sealants (Highly Recommended) ..........................................................................................................175
EQ Credit 4.2 Low-Emitting Materials: Paints and Coatings (Highly Recommended) ..........................................................................................................175
EQ Credit 4.3 Low-Emitting Materials: Carpet Systems (Highly Recommended) .....175 EQ Credit 4.4 Low-Emitting Materials: Composite Wood (Highly Recommended) ..176 EQ Credit 5 Indoor Chemical and Pollutant Source Control (Highly
Recommended) ..........................................................................................................176 EQ Credit 6.1 Controllability of Systems: Lighting (Conditionally Recommended) ..177 EQ Credit 6.2 Controllability of Systems: Thermal (Conditionally Recommended) ..177 EQ Credit 7.1 Thermal Comfort: Design (Recommended) ..........................................178 EQ Credit 7.1 Thermal Comfort: Verification (Conditionally Recommended) ...........178 EQ Credit 8.1 Daylight and Views: Daylight 75% of Spaces (Highly
Recommended) ..........................................................................................................178 EQ Credit 8.2 Daylight and Views: Views for 90% of Spaces (Recommended) ........179 ID Credits 1 to 1.4 Innovation in Design (Conditionally Recommended) ....................179 ID Credit 2: Innovation and Design LEED Accredited Professional (AP) ...................181
Summary ...............................................................................................................................182
LIST OF REFERENCES .............................................................................................................185
BIOGRAPHICAL SKETCH .......................................................................................................188

10
LIST OF TABLES
Table page 2-1 Initial capital construction costs for IHS LEED projects ...................................................72
2-2 USGBC Sample cost data ..................................................................................................72
2-3 LEED criteria development ...............................................................................................72
2-4 LEED certification levels ...................................................................................................73
2-5 LEED 2.2 rating system points per category .....................................................................73
2-6 LEED certified and registered projects ..............................................................................73
2-7 Business case for high performance green buildings summary .........................................74
2-8 Florida LEED certified projects location and award level .................................................74
2-9 Number of Florida LEED registered projects by owner type ............................................74
2-10 Impacts of green building by survey respondents ..............................................................75
2-11 Florida university enrollment for 2004-05 .........................................................................75
2-12 Florida’s post-secondary construction costs based on 2004 data ......................................76
2-13 Comparison of project costs on Florida campuses ............................................................77
2-14 Comparison of professional fee percentage across campuses ...........................................78
2-15 University of Florida green building stock ........................................................................79
2-16 LEED cost values (LCV) ...................................................................................................79
2-17 Associated LEED costs for North Boulder Recreation Center ..........................................79
2-18 LEED prerequisite standards .............................................................................................80
2-19 Construction phase commissioning costs ..........................................................................80
3-1 Sample existing system global performance evaluation checklist ...................................106
3-2 The pairwise comparison scale ........................................................................................107
3-3 Sample applied construction cost percentages for college student union ........................108
4-1 LEED alternatives preference outcomes ..........................................................................128

11
4-2 Balanced LEED alternatives (Evenly Distributed) ..........................................................128
4-3 Performance weighted LEED alternatives .......................................................................128
4-4 Environment weighted LEED alternatives ......................................................................129
4-5 Social weighted LEED alternatives .................................................................................129
4-6 Health weighted LEED alternatives .................................................................................130
5-1 UF certified and silver standard and low cost credit breakdown by costs .......................144
5-2 Preference weights applied to UF standards and options ................................................144
5-3 Low and high cost conceptual estimates ..........................................................................145
5-4 Outcome impacts by preference weights with GSF cost ranges ......................................145
B-1 University of Florida LEED Credit Ratings ....................................................................183
B-2 Bike rack and shower facilities for commercial users .....................................................183

12
LIST OF FIGURES
Figure page 1-1 Research progression .........................................................................................................21
2-1 Relationship between LEED alternatives and outcomes ...................................................68
2-2 Building demand for average southeast commercial building ...........................................69
2-3 University of Florida LEED credit evaluation steps ..........................................................70
2-4 LEED first cost impacts based on building standards .......................................................71
3-1 Decision model for assessment of sustainable construction (DMASC) ..........................101
3-2 Green education conduits among construction participants ............................................102
3-3 Traditional linear design approach ...................................................................................103
3-4 Sustainable integrated design approach ...........................................................................103
3-5 Logical scoring of preferences method ............................................................................104
3-6 LEED sustainable requirements and parameter (SRP) tree .............................................104
3-7 An example hierarchy for the problem of selecting the best LEED alternatives .............105
4-1 LEED alternatives composite score and ranking .............................................................115
4-2 LEED alternatives with synergistic sums across three out of four outcomes ..................116
4-3 Preference impact weights ...............................................................................................116
4-4 Initial ranked evaluations of alternatives for evenly weighted alternatives .....................117
4-5 Initial ranked evaluations for 70% performance weighted alternatives ...........................118
4-6 Initial ranked evaluations for 70% environment weighted alternatives ...........................119
4-7 Initial ranked evaluations for 70% social weighted alternatives .....................................120
4-8 Initial ranked evaluations for 70% health weighted alternatives .....................................121
4-9 Project data sheet .............................................................................................................122
4-10 Project/LEED specific data. .............................................................................................123
4-11 LEED scorecard costing ..................................................................................................124

13
4-12 Sample LEED credit cost summary/take-off ...................................................................125
4-13 Cost preference analysis ..................................................................................................126
4-14 DMASC cost-preference summary sheet .........................................................................127
5-1 UF’s standard only LEED credit project .........................................................................137
5-2 Lowest cost credits for UF ranked by low-cost and weighted ranking. ...........................138
5-3 Highest cost credits for UF ranked by low-cost and weighted ranking. ..........................139
5-4 Sample medical center project data input. .......................................................................140
5-5 Sample medical center LEED specific project data. ........................................................141
5-6 Health weighted certified medical center case study. ......................................................142
5-7 Sample certified medical center scorecard. .....................................................................143
B-1 Construction waste management plan implementation ...................................................184

14
Abstract of Dissertation Presented to the Graduate School of the University of Florida in Partial Fulfillment of the Requirements for the Degree of Doctor of Philosophy
DECISION MODEL FOR PUBLIC SECTOR ASSESSMENT OF SUSTAINABLE BUILDINGS IN FLORIDA
By
JAMES G. SULLIVAN
August 2007
Chair: Charles Kibert Major: Design, Construction, and Planning
My study examines first costs and design outcomes in pursuing a United States Green
Building Council’s (USGBC) Leadership in Environmental and Energy Design (LEED)
certification for new commercial construction in the state of Florida. My study notes the two
greatest drivers determining first costs are project specific LEED credits selected and the degree
to which current building standards and practices meet those required by the USGBC.
The model incorporates a Logical Scoring of Preferences (LSP) method that evaluates
decision makers’ preferences and cost separately and then combines preference rankings and
costs to provide a range of costs and sustainable impacts. Each LEED credit is automatically
conceptually estimated based on a limited number of project specific inputs. The resulting
output presents certification benchmarks and cost ranges for the evaluation of LEED alternatives.

15
CHAPTER 1 INTRODUCTION
Introduction
While sustainable design and construction practices continue to grow within the United
States, and specifically within the State of Florida, there is continued confusion regarding
designed benefits and associated first costs of certified green construction. This research
presents a current and applicable Decision Model for the Assessment of Sustainable Construction
(DMASC) in Florida. The DMASC model incorporates a logical scoring system which provides
a way to independently evaluate sustainable alternatives based on building performance,
environment, social, and occupant health impacts and associated first costs. The model provides
public entities a means for evaluating sustainable construction methods compared with current
traditional methods based on first costs. The tool identifies key factors for successful adaptation
from traditional to integrated sustainable design and construction. Decision processes are broken
into three phases 1) an initial evaluation stage, 2) a combined preference and cost stage, and 3) a
final ranked decision stage to aid in the selection of sustainable alternatives. The model
incorporates the United States Green Building Council’s (USGBC) Leadership in Energy and
Environment Design (LEED) for new construction 2.2 point based building evaluation and
certification tool. Appendix A provides a LEED scorecard listing alternatives under category
headings. Established in 1998, the USGBC LEED certification process is the predominant
sustainability criteria used in evaluating buildings throughout the United States (US). It has been
adopted by the Government Service Agency (GSA), branches of the US Military, and used in
several state- and university-based construction programs.

16
Sustainability Defined
Often used interchangeably, the terms sustainable construction and sustainable
development, have different connotations for different audiences. Some may even argue that the
phrase “sustainable construction” is oxymoronic and that other phrases such as “more
sustainable” or “more environmentally friendly construction” be used in its stead. Sustainable
has been defined as “... non-declining human well-being over time (Pearce and Warford 1993);
“providing for the needs of the present generation without compromising the ability of future
generations to meet their needs (WCED 1987).; and “the use of energy and materials in an urban
area in balance with what the region can supply continuously through natural processes such as
photosynthesis, biological decomposition, and the biochemical processes which support life”
(Lyle 1994).
In the construction realm, sustainable is often used as a relative term compared to its
traditional counterpart. Traditional construction emphasizes project schedules, code compliance,
quality, and cost. Sustainable construction includes these same elements but also emphasizes
performance, resource conservation, environmental degradation, occupant well-being, and social
benefits as important factors for consideration. Sustainability has evolved to incorporate various
economic and socio-political factors such as human quality of life, and it is this global view that
we, as a species, must move towards to build a common standard of living and education.
However, the current traditional construction mindset is primarily based on maximizing limited
natural resources and basic short-term economics of exploiting those natural resources.
Problem Statement
Currently there is no model available to evaluate project specific LEED building criteria
based on local standards, key decision makers’ sustainable preferences and building program,
cost, location, and LEED certification level. Two of the most cited LEED critiques are: 1)

17
LEED costs too much and 2) point mongering becomes the goal of design rather than building
the best sustainable building as possible given constraints (Schendler and Udall 2005). Too
often in consulting sessions the process of selecting credits is based on lowest cost, not on owner
preference, program fit, or credit impact. During these sessions the relationship between project
function and point impacts tends to be lost altogether as project teams focus on achievability of
“no cost” credits above all other considerations. DMASC was developed in part to address this
void.
Purpose of the Study
My research developed a decision model that allows for the evaluation of sustainable
criteria for use in public buildings in Florida. I provided decision makers with a way to assess
sustainable criteria based on preferences, outcome impacts, project applicability, and cost as to
provide a more comprehensive way to make a selection. My study builds upon the experiences
of staff at the University of Florida over the past eight years as they have gone managing their
first LEED certified building, Rinker Hall in 2000, to the adoption of a minimum LEED
certification for all buildings constructed on campus in 2007.
Methodology
The Decision Model for the Assessment of Sustainable Construction (DMASC) is a three
stage model that provides a structure and means for the adoption of more sustainable practices
and evaluation of USGBC LEED sustainable criteria. The model consists of the following:
• Phase I – Analysis of current building methods and decision process for moving to the adoption of more sustainable building practices.
• Phase II – The incorporation of Logical Scoring of Preferences (LSP) methods that evaluate objectives of decision makers and initial costs separately.
• Phase III – The process of reconciling preferences and costs to determine a hierarchy of best fit criteria for a building program.
18
My methodology serves to link the attributes of sustainable construction (i.e., building
performance impacts, environmental impacts, social impacts, and health impacts) with owner
preference in a systematic way. Critiques of the LEED system refer to point shopping and
seeking the cheapest points regardless of building program or owner preference for impact
(Schendler and Udall 2005). My methodology addresses this concern.
Research Objectives and Limitations
The primary purpose of this research is to provide a structure to assess the impacts and
costs of sustainable construction techniques for use in Florida-based public projects. The
objective is to develop a research assessment tool that allows decision makers to evaluate the
potential success of adopting sustainable standards and guidelines. The end-user focus is the
public sector (i.e., local municipalities, county governments, and public universities).
Objective 1
Provide an overview of current trends, perceptions, and cost studies associated with LEED
design in the United States.
Objective 2
Examine history and current practices of the Facilities and Planning Department (FPD) at
the University of Florida (UF) to identify benchmarks for sustainable design. The DMASC
assessment logic builds upon the FPD processes that have been developed between years 2000
and 2007. Included in these processes are energy modeling, commissioning, and construction
costs, as well as architect and engineering (A and E) costs and fees associated with sustainable
design.

19
Objective 3
Base the DMASC on a Logical Scoring of Preferences (LSP) model that initially evaluates
preference and cost criteria separately, and subsequently uses both criteria in the final ranking
and eventual sustainable criteria selection process.
Objective 4
Use Analytical Hierarchy Process (AHP) techniques in the evaluation of LEED
alternatives during the preference analysis phase of the LSP model. Alternatives will be
evaluated based on environment, building performance, occupant health, and social impacts.
These scores determine the DMASC model preference rankings.
Objective 5
Provide recommendations for future research and applicableness of the model for
stakeholders outside the Florida public sector.
Limitation 1
The model is based for use in a public setting where decision makers have direct input as
to the development and adoption of building standards.
Limitation 2
This model does not seek to derive an optimal solution. Rather it is an assessment and
decision tool that allows for decision makers to weigh alternatives at the conceptual phase of a
project. The preference scoring systems provides ranking data relative to alternatives and as
such is a unit-less measure.
Limitation 3
Estimates of cost are for sample solutions to meet LEED credit requirements and are in no
way meant to be the only solution or method to achieve a credit. In addition the relative wide
range in low- and high-estimates, plus or minus 25 percent, are intended to account for time

20
factors (i.e., inflation, interest rates) and regional material, labor, and cost variety within the
state. Detailed estimates for each credit should be completed by the build team during the
program phase of construction. A key design feature of the model was to base conceptual
estimates on information that would be available at the programming stage of design.
Limitation 4
The model is not designed to formulate a best solution. The strength of the DMASC
model is that it allows for users to adjust rankings, impacts, and costs as it relates to their specific
project. Its purpose is to provide a logical structure and system that adds value to the sustainable
design process.
Limitation 5
Part of my study is to determine costs based on differences between traditional methods
and sustainable methods. As such the cost estimates reflect the conceptual additional costs and
should not be used to base contract values for achieving credits.
Limitation 6
My study looks at first costs and does not address payback, return-on-investment, or
possible cost lowering scenarios in anyway. For example it does not assume that there is a
payback for sorting construction debris and how this debris value, such as metal, may offset the
cost of separating waste. This is up to the project team to evaluate the strategy. The model does
allow for a credit identifier as “Standard” or no-cost to identify credits that the team determines
are no-cost without having to justify these costs with an estimate.
The individual research objectives provide the framework for this project. This chapter
provides the rationale and reasons for developing a sustainable construction evaluation model.
Figure 1-1 summarizes the research progression.

21
Figure 1-1. Research progression
Problem Statement and Literature Review
Review of UF Data /GSA Study
LSP model evaluated
LSP based Decision Model for Assessment of Sustainable Construction
Preference and Cost Paths developed with Model
Constraints
Assessment Tool Preference Scenarios
Conclusions and Recommendations

22
CHAPTER 2 LITERATURE REVIEW
Introduction
The kind of environment we live in—and will leave to our children—depends on the kind of society we create within our communities. The social infrastructure fundamental to a healthy environment in this human-dominated world includes not only good laws and public institutions; a thriving, rational economy; and a responsive political system but also shared information, knowledge, goals and values; active civic organizations; and, crucially mutual tolerance and regard among the citizens of a community and concern for one another’s well being. - Shabecoff
The nexus for the Decision Model for the Assessment of Sustainable Construction
(DMASC) was a request to succinctly present the tie between sustainable construction impacts or
benefits with associated first costs to a local Florida county commission’s budget hearing. The
commissioners wanted a path explained to them that led from their traditional methods to ones
that were more sustainable. Along with this path they wanted to know the exact costs of each
step. After costs were determined they wanted to know specific benefits of having a certified
green building. Their interest was in pursuing a LEED certification. This was a difficult request.
There was no reference to a systematic way of explaining the impacts of credit categories or how
decision makers come to grips with first costs and LEED certification levels other than
answering the question with a statement similar to “it depends.”
Due to the nature of the LEED scoring system, that is after the completing a set of
prerequisites, the credits selected are up to the owner and project team. It was difficult to
guarantee performance outcomes solely based on certification levels. In order to address the
concerns regarding first costs and performance impacts a model was needed to explain how an
entity, be it private owner or public institution, transitions from current traditional methods to
more sustainable ones. Information regarding integrated sustainable design benefits and costs is

23
widespread across several countries, states, and cities, but little or no information is available in
print regarding efforts made in the state of Florida.
The basic tenets of sustainable construction are straightforward and stress the importance
of human health, energy and water conservation, site planning, and material selection in order to
provide a measurable benefit to the inhabitants of the building, the environment, and the
community, but how these tenets drive design and cost decisions is less discernable. Although
decision makers are willing to embrace the tenets of sustainability they are not willing to fund
them blindly. There was need to develop a decision model.
Over the past decade several states, notably California, Minnesota, and Massachusetts,
have enlisted the aid of Greg Kats and his staff at Capital E Analysis, to provide detailed cost
reports regarding the economic benefits of green design for school systems (Kats 2003). This
data emphasizes the return-on-investment (ROI) of sustainable energy savings and increased
gains in staff productivity by providing a healthy controllable indoor environment. At the same
time the United States Green Building Council (USGBC) has developed a powerful tool, the
Leadership in Engineering and Environmental Design (LEED) Rating System, which has
become the benchmark for evaluating the ‘greenness’ of commercial projects. The LEED tool is
a third- party verification system for which designers and contractors supply project information
to be verified by the USGBC. The USGBC then rates a project on a scale of certified, silver,
gold, or platinum, based on material submitted and on total points awarded. With the success of
the LEED program, along with strong political and administrative support, 18 states have
adopted, mandated, or reviewed aspects of LEED for large state projects. All branches of the
armed services incorporate sustainable planks in their building program guidelines, as well as the
U.S. General Services Administration (GSA). In the state of Florida, the City of Gainesville, the

24
University of Florida, and Sarasota County have adopted green standards for large projects. This
chapter provides an overview of LEED cost studies and how the impacts of green construction
are perceived. The USGBC website provides an updated comprehensive overview of LEED
based resolutions and initiatives established for branches of government, states, cities, public
institutions, and colleges throughout the United States.
Defining Green
To first form an opinion of sustainable practices, a working definition is in order. In
academic, social, political and ecological circles, sustainable development is often defined by a
quote from a UN-sponsored commission (UN 1993): “those paths of social economic and
political progress that meet the needs of the present without compromising the ability of future
generations to meet their own needs.” From a design, planning, and construction view, the
Office of the Federal Environmental Executive defines green building as "the practice of
1) increasing the efficiency with which buildings and their sites use energy, water, and materials,
and 2) reducing building impacts on human health and the environment, through site selection,
design, construction, operation, maintenance, and removal--the complete building life cycle."
Typically, the first question asked by decision makers is what types of buildings are
currently being delivered? Designers and contractors follow the design program requirements
requested by owners and conform to existing code regulations. To review what is being
delivered, one must review current program requirements. Most traditional building programs
require the project to meet building code and to provide a specified square footage of space for
each user or activity. Sustainable programs incorporate traditional requirements but expand the
role of designers and contractors to include additional considerations such as erosion and
sedimentation control, indoor air quality, and levels of building performance.

25
Designing Green
A building does not need to register with a third party verification system to be more
sustainable. In fact, there are a number of hindrances with regard to subscribing to a LEED-type
program, most notably the costs associated with tracking and submitting documentation for
verification. Similar to any type of auditing practice, the only way to achieve LEED credits is to
provide the necessary paper trail to support one’s claims. For the most part, this cost impact may
be reduced with experience. Project Managers on staff at the University of Florida, for example,
state a LEED certified building can currently be delivered on campus at no additional expense.
This claim is rooted in the following:
• Experience with over sixteen registered LEED projects on campus. • Current level of construction standards. • Recent market transformation towards lower ‘green’ material costs. • Requiring both designer and contractor previous experience on a minimum of two LEED
projects. • Processing LEED submittals by UF project staff. This model verifies this claim.
LEED emphasizes five key elements in design: 1) sustainable sites, 2) water efficiency, 3)
energy and atmosphere, 4) material and resources, and 5) indoor environmental quality. By
stressing these categories and providing guidelines to meet key requirements, the USGBC has
allowed for common dialogue among owners, architects, engineers, contractors and building
users. This collaborative dialogue provides unique opportunities for communication that may
not typically occur in a traditional construction setting. The DMASC model re-shuffles the
LEED alternative intents into four outcome categories. Figure 2-1 illustrates the relationship
between LEED sustainable categories and DMASC sustainable outcomes.

26
Costing Green
Three main costing studies have been produced over the past five years, one a prescriptive
estimating study examining the General Service Administration’s (GSA) design program (GSA
2004), another prescriptive study examining cost impacts to the existing Indian Health Service
(IHS) building program(IHS 2006), and one post-built study of actual design and construction
costs for projects built throughout the US (Morris 2004). The GSA study shows a progression of
cost increases through the LEED system from certified to platinum. Essentially, the GSA will
increase project funding by 2.5% to cover LEED certification costs. The caveat to this number is
that GSA was already performing tasks associated with significant costs in their base program.
Items such as commissioning and meeting ASHRAE guidelines were included in their base
building.
The second study is a 2006 report put together by a team from Seattle that was
commissioned by the Division of Engineering Services (DES). The DES is responsible for
overseeing all new healthcare facilities for the IHS. This study examined the cost impact of each
applicable LEED credit based to existing IHS program standards. The study also demonstrated
Life-Cycle Costs (LCC) for each credit. Additionally, it compared its findings with that of the
GSA report. This gives insight to how the LEED process impacts two different building types
developed under two different building programs. Table 2-1 illustrates the cost impacts based on
the existing $197 per square foot construction cost and 84,895 Gross Square Foot (GSF) IHS
building program. Estimated budget for the IHS project is $16,753,370.
The third study often cited includes a report produced by the Davis Langdon firm, a design
firm that provides “comprehensive cost planning and sustainable design management services to
architects and owners (Langdon 2004).” In this study the company reviewed its proprietary cost
database to compare green versus non-green buildings on the basis of cost. The USGBC’s

27
LEED Rating System was also used as a basis for determining the level of sustainability a project
achieved. Individual credits were not assessed. Forty-five library, laboratory, and academic
classroom projects designed with some level of LEED certification were selected for comparison
with 93 non-LEED projects of the same types. All costs were normalized for location and time
of construction.
Given the common perception that LEED projects cost more than non-LEED projects, the
analysis was striking. The results showed no statistically significant difference between LEED
and non-LEED projects. The LEED projects were dispersed through the range of all projects
based on cost. It is important to note that the standard deviation of building square footage costs
was high, based on the different types of buildings and different square footages of the sample
buildings. In addition the study focused on projects in states that had relative high performance
existing standards such as California, Oregon, and Washington.
Davis Langdon also reviewed the non-LEED projects to determine what, if any, LEED
certifications would be achieved. Ten random non-LEED projects were selected from the
original list of 93. The ten buildings scored between 15 and 29 points based on the LEED
scorecard. The project that scored an estimated 29 points would have surpassed the necessary 26
points needed to achieve LEED certification. Overall, the study indicated that typically, 12
LEED points can be earned without altering design, based on location of building and local code
requirements. Furthermore, up to 18 additional LEED points may be accomplished with
minimum design effort at little or no additional cost. What is not noted in this study are the fee
structure and schedule for the project designers, engineers, and contractors.
A common way to determine the cost of green is to compare the project’s final budget with
the initial budget. This tends to include all cost overages, not only those associated with LEED

28
points. Over half of the projects studied had no additional costs allotted for LEED and came in
within budget. The remaining projects had additional monies set aside for items such as
photovoltaic systems and other special enhancements. These projects’ additional ‘green’
supplements ranged between 0.0 and 3.0 percent of the initial budget. The most successful
projects identified LEED goals from the onset and maximized integrated design opportunities.
Bidding climate was also a key element in determining the final cost of a building. Contractors
unfamiliar with LEED, or any new constraint system or regulation, will include additional
monies to cover their unknown risks associated with learning a new system. In areas new to
LEED two main trends occur: 1) bidders add contingency for the unknown, and 2) the number of
bidders is reduced, thus reducing the competitive nature of bidding against multiple players.
Davis Langdon suggests the following to achieve LEED within budget constraints:
• Understand feasibility and costs for each point on a project. • Sustainability is a design/program issue, not an added requirement. • Establish team goals and responsibilities. • Align budget with program.
Morris and colleagues concluded “It is the choices made during the design which will ultimately
determine whether a building can be sustainable, not the budget set.”
The USGBC does not provide detailed cost data for credits as part of its service to its
members, and cost data that is provided is cryptic and does not provide any dollar ranges for
LEED alternatives or credit options. Table 2-2 illustrates a sample of the cost data for
Sustainable Site Credits (SSCredit) and Sustainable Site Prerequisite (SSPrereq) provided by the
USGBC. No associated dollar values are given for the various symbols used in Table 2-2.
UF’s First Green Project – Rinker Hall
After reviewing costs for Rinker Hall, UF’s first LEED building, it is estimated that an
additional 10% of the building’s base budget was spent on achieving a LEED-NC 2.1 Gold

29
certification (REF for the estimate). This has resulted in energy savings of approximately 30%
per year and water savings of over 75% per year. The payback period is less than seven years,
after which the university will benefit from the reduced operation cost. User estimates for
increase construction costs associated with this project hover around 10%. My study confirms
this cost at the time of construction. This percentage would have been less if Rinker Hall was
built today due the lessons learned and program requirements noted previously.
Sustainable Construction
As an industry in the United States, construction represents significant consumer use
(40%) of raw materials while giving back a significant amount (33%) of total landfill waste
(Kibert 2002). It is this relationship of consuming vast amounts of raw materials and production
of large volumes of waste that causes leaders in the construction industry to look for systems that
may limit the environmental impacts. Kibert looks to natural systems and ecology as a basis to
understand the harm caused and for methods to mitigate this harm by potentially mimicking the
natural world Industrial ecology is given as an example of system- based thinking used to close
the consumption-to-waste loop. Similar areas of interest include industrial metabolism, eco-
efficiency, and design for the environment (DFE). These like fields suggest moving from a
linear consumption/waste module to a cyclical “natural” model that limits waste and leads to a
continuous process rather than a simplified dead end (i.e., land fill).
Forward thinking construction models look not only to close consumption/waste loops
through building designs but to also examine buildings continued use and long-term effects on
the inhabitants and surroundings. While buildings may represent designers’ ability to control
and dominate their surroundings, each structure is also part of a lacuna of natural systems within
the design community. Thus, while human abilities are impressive, the lack of understanding of
the systems that surround and interact with a structure limits its potential for efficiency and

30
harmony with its environment. Current industry practices have various degenerative effects such
as soil erosion, biodiversity degradation, and water pollution and waste. Odum’s work is
mentioned as a link between embodied energy and relative input of system components to the
operational whole (Odum 2001; Kibert 2002). The intriguing aspect of this is the use of the
hierarchal structure to better understand the selection and use of building components. The
DMASC structure also includes a hierarchal element in the decision process.
According to Steele (Steele 1997), the first use of the term sustainability in reference to
human impact on environment was in a 1980 International Union for the Conservation of Nature
(UCN) publication entitled “World Conservation Strategy.” This work focused on the debate
between pro-growth and anti-growth sentiments as to which course would ultimately best serve
humankind and the planet. Although this report did not lead to any large change in public
policy, it did influence two other more significant reports: the Brandt Commission Report and
the Brundtland Commission Report (Steele 1997).
The Brandt Commission was initiated when the World Bank appointed Willy Brandt,
Chair of the Social Democratic Party of the Federal Republic of Germany, to head a 20-member
commission from non-industrial countries to study the relationships among resource degradation,
waste, and international financing. The Commission initially authored a report titled “North-
South: A Program for Survival” in 1980. The report promoted changes in the operational
procedures and policies of the International Monetary Fund and the World Bank. In hindsight,
the commission findings have been questioned due to turmoil caused by third-world countries
faulting on loans; however, the commission work was valuable, bringing to the forefront the
need to recognize global negotiations and the impacts that industries in one country have on the
entire planet.

31
Following the Brand Commission, the next universally lauded report on sustainability is
the Brundtland Report., an outcome of the 1987 United Nations World Commission on
Environment and Development that focused on the compromise between growth and non-growth
factions. Heading this committee was Norwegian Prime Minister, Gro Harlem Brundtland, who
helped produce “Our Common Future,” a seminal report that defined sustainability in terms of
growth and future environmental impacts or “those paths of social economic and political
progress that meet the needs of the present without compromising the ability of future
generations to meet their own needs.” This definition is supported by the land, material resource,
and energy efficiencies of the green design movement.
The USGBC started to develop LEED design criteria between 1994 and 1995 in response
to market-driven demand for a definition of environmentally friendly or ‘green’ design and
product initiatives. LEED categories and supporting alternatives were developed by a host of
designers, architects, engineers, and environmentalists focused on improving environmental
impacts, health of building occupants, and economic benefits of the building environment. The
LEED criteria have evolved since their conception in 1994 as noted in Table 2-3. Currently the
USGBC reports 986 million square feet of registered and certified commercial space within the
United States (USGBC 2007).
The first LEED criteria developed in 1994/1995 included a simple pass or fail system in
which a project meeting minimum requirements would be certified. This was followed by the
LEED 1.0 Program in 1998, in which different levels of achievement would be recognized. In
2000, and with minor re-submittal requirements in 2004 and 2005, the LEED 2.1 and 2.2
Programs were issued that support the points program currently in effect.

32
The “Green” building movement incorporates several aspects of social design (Gifford
2002) in that it looks to provide a healthier environment for its users via collaboratively agreed-
upon design criteria. The USGBC has expanded from LEED for new construction to include a
number of different applicable design and construction criteria. The following lists the various
LEED rating programs in place or under development (USGBC 2007):
• New Commercial Construction and Major Renovation projects • Existing Building Operations and Maintenance • Commercial Interiors projects • Core and Shell Development projects • Homes • Neighborhood Development • Guidelines for Multiple Buildings and On-Campus Building Projects.
As discussed above, this criterion has gone through 3 major revisions since 1993 with the
latest version titled LEED Rating System 2.2 (USGBC 2007). Building evaluation and
accreditation is based on a prerequisite and point system. The more points or credits achieved
out of the total of 69 available points, the higher the buildings ratings. Table 2-4 provides a list
of certification levels and associated number of minimum credits or points needed. As noted in
Chapter 1, Appendix A provides a complete LEED-NC 2.2 Scorecard. Points may be accrued in
various combinations of design strategies, but prerequisites must be achieved or the building will
not receive any form of accreditation from the USGBC. The main six (6) categories have
remained consistent over time (updates have only been in terms of defining individual credits).
The six (6) categories consist of five (5) environmental headings and one (1) design
process general heading. The five environmental categories are Sustainable Sites, Water
Efficiency, Energy and Atmosphere, Indoor Environmental Quality, and Materials and
Resources. The additional design category is titled Innovation and Design. Each category is
designated with several sub-categories or credits, which is assigned a total maximum number of

33
points. Points and prerequisites vary among categories. See Table 2-5 for listing of points
available per LEED category.
Within each category there are alternatives tied to certain design or performance criteria.
For example, under Water Efficiency, Credit 1.1 has two measures worth one (1) point each.
The first part of this credit states that high efficiency irrigation technology or use of captured rain
water be incorporated in the design to reduce landscaping consumption by 50% over
conventional means. The second part of this credit states that if no potable water is used for
landscaping, an extra point will be awarded. Thus xeroscaping with no water usage will result in
two (2) points towards the projects point total.
Table 2-6 summarizes LEED certified and registered projects by LEED certification
program (USGBC 2007). LEED registered projects are those projects which have paid fees to
register with the USGBC but have not made it through the evaluation stage and have not been
awarded their final certification level.
Driving Forces
Why are those functioning as owners of construction projects choosing to pursue LEED
certified projects? Current green designers question why owners would choose to design any
other way. “Why would anyone choose to build in a way that isn’t comfortable, healthy, and
energy efficient?” (Wilson 2005). Is choice dictated by expectations less comprehensive than
those who choose to pursue green buildings? Are not all owners making assumptions regarding
comfort, health, and energy efficiency? Current research does not address the driving forces that
have caused the increase in interest in high performance buildings.
For those who support high performance buildings, the short and long term rewards, both
for the environment and those who will work in the constructed space, are obvious. However,
owners may also be driven by factors other than environmental or employee health concerns.

34
Federal or state funded projects may be dictated to pursue high performance buildings. Build-to-
own developers may be driven by lower operation costs and greater lease rates. Corporate
buildings or factories are perhaps driven by greater productivity and increased employee
retention. The following summarize perceived benefits of green design.
Business Case for Green
In 2000, the Environment and Public Works Committee of the U.S. Senate convened a
special meeting to bring members of congress, industry, and the U.S. Green Building Council
together to help enlighten those on the hill regarding sustainable construction. The group
produced a report titled “Making the Business Case for High Performance Green Buildings”
(USGBC 2000). The meeting helped educate those with an interest in green building and allowed
discussion about the benefits of core principles of the delivery method. Table 2-7 lists a
summary of the committee’s findings:
The report included key case studies for each of the points noted in the summary.
Regarding first costs, the comparison is often made as to which is more expensive—an efficient
car or an inefficient car—the result depending on options, features, and preferences of the car
and the buyer. Construction and design first cost of Johnson Control’s LEED-certified office in
Milwaukee was quoted at 10 to 15% less than similar buildings (USGBC 2000).
Although tenants may not directly benefit from the energy savings of sustainable design,
(this depends on how their energy consumption is tied to their lease rate), they will benefit from
churn cost reductions from the use of open floor plans and raised floors. Herman Miller’s
MarketPlace building reports a 66% reduction in churn-related costs. The business case
presented in 2000 bolstered support for pursing integrated sustainable design by illustrating the
‘real world’ value and cost savings earned by leaders in the property management and production
fields.

35
First-Cost Benefits
Some city governments have streamlined permitting and approvals (time savings) and
lessened fees (cost savings) for high performance projects. In cities with large construction
volume, such as Chicago, this time savings may be considerable.
Project teams may see benefits and cost synergies throughout the design process. Use of
high efficiency water fixtures may reduce the size and cost of sewage lines throughout the
project. These savings may be used to finance other features in the project or simply lower the
project’s overall cost. In addition, there are frequent savings derived from design decisions that
create additional savings in other systems. For example, changing to a more efficient thermal
glass exterior may lead to a reduction in heating/cooling loads, which, in turn, may reduce duct
lines/size as well as reduce the total size of the conditioning units. Day lighting and open floor
plans may allow for a reduction of materials, and associated costs, for a project. A reduction in
non-structural dividing walls would save in material, labor and time as compared to a traditional
divided space. The DMASC model allows for these tradeoffs to be entered on a credit by credit
basis but does not automatically capture these tradeoffs in terms of cost.
A more environmentally sensitive construction plan may reduce waste processing costs.
During the construction of Rinker Hall at the University of Florida, project managers separated
drywall, metal, and general waste. Waste gypsum was recovered by the drywall supplier at
additional cost; however, the recycled metals were recovered at no cost by a local metal recycler.
Several state and local governments are offering tax credits and other financial incentives
to green developers. States such as New York, New Jersey, Maryland, and Oregon are offering
financial incentives to build high performance structures (Wilson 2005).

36
Building Performance Benefits
Energy and Atmosphere credits account for the largest percentage, 24.6 percent, of the
USGBC category credits. Savings from energy design strategies are often viewed as having the
single most cost-to-benefit ratio as other green strategies. Increased fuel and energy costs will
continue to push the envelope of energy saving design.
The goal of sustainable design is to reduce the amount of energy used to effectively
operate a building. Energy optimization credits account for the largest percentage of points
available for one credit under LEED-NC 2.2.
Lowering water usage is also a mainstay of green design. Water efficiency credits account
for five out of sixty-nine, or 7.4%, possible LEED credits. The USGBC reports commercial
buildings use 12.2% of all potable water, or 15 trillion gallons a year during operation(USGBC
2007). Rinker Hall at the University of Florida incorporates rainwater capture cistern to supply
non-potable plumbing fixtures within the building. In addition the University of Florida has a
greywater supply system running through campus to support irrigation services.
Facility managers and owners are concerned with renovation costs associated with
changing tenets’ needs. Design features such as an elevated floor reduce the costs associated
with tenant layout changes. The National Renewable Energy Lab, a 20-thousand square foot
laboratory estimates a $35,000 a year savings as a result of using a raised floor system with
regard to annual office design and layout changes(Torcellini, Pless et al. 2006).
Depending on the credits pursued, LEED-designed buildings have an energy savings of 14
to 50% less than conventional buildings. International developer Hines, Inc., is quoted regarding
energy star buildings, “Efficiencies gained from its Energy Star buildings are generating $13
million in annual savings, based on 2000 evaluation (Council 2000).” The energy savings
numbers will increase relative to increased energy costs and demands. An EPA report from 2002

37
predicts that an Energy Star labeled office building generates a 40% savings over the average
code-built office buildings. Energy Star is a joint program between the United States
Department of Energy and the United States Environmental Protection Agency that identifies
energy efficient designs and practices. Although these savings are significant, integrated
sustainable design incorporating LEED-type models focus on the building and process as a
whole. This is the key difference and advantage of sustainable programs from those similar to
Energy Star.
Health and Productivity Benefits
The USGBC reports that the average American spends between 80 and 90% of the day
indoors. Addressing concerns of indoor environmental quality helps to ensure a healthy and
productive society both in the long and short term.
Companies are seeking to improve their competitive edge in terms of employee
recruitment and retention. Similar to leasing and tenant issues, marketing the space that an
employee will occupy as a healthier (i.e., better indoor air quality and natural lighting) provides
support for attracting and keeping employees. Wilson (Wilson 2005) reports that an accounting
firm, Deloitte and Touche, estimates the cost of recruiting a non-professional worker to be
approximately $12,000 and a professional worker to be $35,000. He also notes that the Families
and Work Institute estimates costs associated with replacing non-managerial staff averages about
75% of the new employee’s annual salary, while managerial costs are twice that at roughly 150%
of an employee’s annually salary.
Legal issues regarding mold and sick building syndrome have increased in recent years.
Green building design strives to reduce these concerns by addressing dust, moisture, and
envelope construction throughout the building process. Liability insurance for such instances is
also becoming more expensive.

38
The ability to control light and temperature for an individual work area, as well as having a
view of outdoors, enhances employee attitude and improve employee performance. It may even
result in higher employee morale, reduced absenteeism, and better productivity.
Costs related to employee salary and productivity far exceeds those of building
construction, climate control, and energy control. The goal for all employers is to maximize
productivity of workers while reducing the costs of housing them. Wilson (Wilson 2005) notes
that costs associated with the average U.S. office building break down as $318 per square foot
for the building space, $50 per square foot for technology, $16 per square foot for mortgage,
$2.35 per square foot for energy, and $1.00 per square foot for churn or tenant renovation. He
also points out that a one percent increase in productivity would more than cover the costs of
energy for a building. This offset for costs is what drives many corporate owners to pursue high
performance designs.
Sustainable Development International cites several success stories regarding productivity
and green design. One example is the Lockheed-Martin $50-million engineering facility, built
with extensive day lighting and energy efficient systems. The result of the design showed a 15
percent increase in productivity with a paralleled 15 percent reduction in absenteeism.
Additionally, the plant saved over $300,000 annually in energy savings. The reduction in
absenteeism alone more than covered the $2,000,000 additional price tag for costs associated
with the high performance design.
School systems are looking to high performance design to add day lighting to improve
learning. In a report submitted to the Pacific Gas and Electric Company, the Heschong Mahone
Group (Heschong Malone Group 1999) reported a positive correlation between day lighting and
students test performance. Day lighting is typically referred to as the amount of natural task

39
lighting available in a given space. In the Capistrano School District, students with the most day
lighting advanced 20% faster on math tests and 26% faster on reading tests compared to those
students with the least day lighting.
Increased productivity is often cited as a key benefit of sustainable design although
elements of productivity are difficult to tie directly to particular elements of design. Productivity
gains may also derive from reduced absenteeism. The final form of a building is ‘Gestalt-like’ in
nature, in that the sum of the building as a whole is more than the sum of its aspects and the
interactions of its users. There are a few case studies that support the notion of increased
productivity. Lockheed Martin’s design program for Building 157 in Sunnydale, California,
included substantial natural lighting and a 50% energy savings compared to California’s rigorous
energy code. The EPA sites a 15% decrease in employee absenteeism at the 600,000 square foot
plant that employs over 2,500 workers. This drop in absenteeism produced savings that
recovered associated first costs of increased day lighting and other design features within the first
year of operation. William Fisk’s Lawrence Berkley National Laboratory report on indoor
environments and energy efficiency reflects that although there is uncertainty with proving direct
linkages, the potential increases in productivity in the United States results in staggering figures.
“For the United States, the estimated potential annual savings and productivity gains are $6 to
$14 billion from reduced respiratory disease, $1 to $4 billion from reduced allergies and asthma,
$10 to $30 billion from reduced sick building syndrome symptoms, and $20 to $160 billion from
direct improvements in worker performance that are unrelated to health“ (Fisk 2000). Reduction
of sick building syndrome also lessons the potential liability of the owner, property management
team, architect, and builder. Sustainable design may lesson the possibility of claims for health-

40
related problems stemming from a poorly functioning building. These costs are rarely factored
when considering upfront construction dollars.
Environmental Benefits
Environmental benefits associated with green design include: resource conservation, waste
diversion, material selection, and site selection and management. High performance design
stresses reduction in water and electrical needs. These reductions result in less stress imposed
upon municipal supplies and less waste generated compared to standard construction. These
reductions help to lessen the need for greater infrastructure that supports the buildings and the
energy and chemicals used to process waste. Reduction of stormwater runoff and erosion are
also key benefits of high performance design. Techniques such as porous pavement, green roofs,
green swales, and natural vegetative wetlands help to reduce the amount of stormwater and
particles introduced to a municipal waste water system. Reduction of stormwater runoff also
helps to reduce the amount of infrastructure used to transfer and process the water.
An essential aspect of green design is the reduction of the amount of urban sprawl
associated with current trends in U.S. cities’ development. Use of land within a developed area
and incorporation of existing mass transit help to reduce the costs tied to sprawl. Sprawl costs
include expansion of municipal services, road construction, and devastation of undeveloped land.
Emphasis is also placed on incorporating alternative fuel vehicles and bicycles as part of
addressing the transportation needs of the tenants.
Urban redevelopment serves to protect undeveloped land, preserve natural resources, and
provide a sense of community to the existing, and perhaps decaying, urban core. New Urbanism
is a movement that stresses the revitalization of and return to city centers after years of suburban
sprawl.

41
Environmental benefits of high performance design are often cited as those things that sum
the collective good for the planet. The collective good includes reductions in carbon production,
greenhouse gases, increased energy production, and negative impacts on natural and
undeveloped lands. The goals of these designs are to lessen damage to the ozone layer and
lessen man’s potential to accelerate dangerous changes to the global climate.
Social Benefits
Social responsibility or stewardship definitions vary among countries, cultures and
communities. For this report portions of the International Organization for Standardization
(ISO) Strategic Advisory Group on Social Responsibility (SAG) derived common definition will
apply (IISD 2004). SAG found that the common elements or threads running through definitions
for social responsibilities include “a balanced approach for organizations to address economic,
social, and environmental issues in a way that aims to benefit people, community, and society.”
Social impacts for this report apply to short-term benefits that impact the immediate local
community for which a LEED building is located. Short-term benefits include local jobs during
the construction process, community improvements, increase in neighborhood perceived value,
and access via public transit for local workers to access new LEED facilities. Examples of long-
term benefits of the community might be reduced energy loads of buildings delay the cost
associated with new power plants or how reduced waste streams may negate the costs associated
with the construction of new land fills.
Furthermore, social impacts of LEED credits bear in the mind the influence the built
environment plays in the social well being of individuals and communities. This influence may
be in terms of aesthetic benefits, accessibility, job creation, or municipal infrastructure cost
savings that may be passed on to the community at large. The concept of social equity plays a
large roll within the larger socio-economic views and planks of sustainability. As mentioned

42
previously the term sustainable is often linked to social imbalance and global equality among
societies. Three credits have direct ties to social impacts. Site selection, with its requirements
for density or community connectivity, support social networks and access to infrastructure
within a community. Alternative transportation credits support access to jobs for those without
means to getting to and from work efficiently. Local and regional material credits support local
businesses that produce goods used in the construction.
In addition to the three credits that directly tie to social benefits, there are social benefits
that are not directly tied to the USGC intent or credit requirements. For example Sustainable
Sites Credit 1 Site Selection main intent was to preserve green space and promote the use of
infill sites. While this is predominantly an environmental credit the use of infill and protection
of green space has a positive social aspect to the individuals that come in contact with the
building site and preserved site.
LEED points are available for incorporating local materials in the construction of the
building. The goal of these points is to reduce the effects of shipping and transporting
construction elements from great distances. Reducing shipping costs, as well as supporting the
local economy, help save transportation fuel, wear on tires, and pollution by shipping vehicles.
Increased property value and increases in the initial project budget may result if green
strategies are incorporated in a project’s design. Wilson (Wilson 2005) observed that
“increasing the Net Operating Income (NOI) of a building increases the building’s appraised
value by ten times the annual cost savings – a capitalization rate (CR) of 10%. For example, a
75,000 sf (7,000 m2) office building that saves $0.50 sf (5/m2) per year in operating costs
($37,500 per year) will see the vale of the building increase by $375,000. A higher building
value (appraisal) can increase the loan amount available from lending institutions.”

43
Tenant retention and initial tenant lease rates are concerns for all owners/developers.
Wilson notes that developer Joe Bellgehem, BuildGreen Developments, successfully marketed
green aspects of his Vancouver Island Technology Park during a time of slow growth for the
technology sector. Arguments for green design and technologies are easily supported, but unless
consumers support developers’ efforts, positive inroads to the marketplace may not occur.
Increased positive publicity for cities, companies, builders, and developers is also a
positive by product of building green. National and local positive coverage promotes high
performance design and provides free exposure that may help developers with leasing and
companies with corporate image and sales.
Barriers to Sustainable Design
A paper produced in the Netherlands addresses the central question for expansion of
sustainable practices, including widespread reluctance to accept green design: “To what extent
do institutions in the building and real estate sector form a barrier to the application of
sustainable construction measures that result in a breakthrough?” (van Bueren and Priemus
2002). Discussions as to why sustainable construction practices have been slow to take hold
resulted in two conclusions: 1) institutional barriers have limiting effects, and 2) technical ‘know
how’ was not a limitation for sustainable uptake.
The impact of construction on the environment in the Netherlands mirrors that of the
impact in the US. Construction and design affect the use of space, consumption of materials, and
depositing of waste. Policymaking focuses on two basic types of models. Financial models
focus on incentives and communicative models focus on policy and guidelines. Institutional
barriers include a vast spectrum of the construction process, from legal regulations to patterns,
habits or traditions of building practices

44
Policy developments in the Netherlands, similar to those in the US, are substantial and
varied; however, the ‘breakthrough’ of sustainable construction as common practice has yet to
take place. The primary focus for lack of interest in sustainable practice is placed on the decision
makers in the real estate sector. The phasing at this point is based on the physical design
requirements, legal requirements for zoning, acquisition of land and permits, and building
program requirements. The authors note the “actors” in this stage, and almost every stage, act
according to their own set of rules and traditions in a very fragmented process. This can be seen
in the US as well, where much of sustainable construction has been mandated or pushed upon
builders by “actors” functioning as financiers or owners of the project. There tends to be little
backward or forward feedback during the phases of construction. These are missed opportunities
to move toward more sustainable practices.
Several gaps in the construction process are noted as hindrances to sustainable
construction. These gaps are between the following entities: 1) location development and
building project development, 2) construction and management, 3) construction and use, and 4)
asymmetric distribution of pluses and minuses (i.e., energy cost savings of user versus upfront
cost to the developer). Regarding the 4th gap, van Bueren and Priemus summarized this
financial chasm as follows, “The developer becomes strongly fixated on the investment decisions
related to the development costs of a building and much less on the management and user costs”
(van Bueren and Priemus 2002).
Local Adoption of LEED Programs
Several cities, counties, states, and institutions have adopted LEED-based programs
throughout the US. Nineteen out of 50 (38%) states in the U.S. have some form of sustainable
benchmarks in their construction guidelines.

45
Gainesville and Sarasota
The two cities in Florida that have adopted local incentives for green buildings are
Gainesville and Sarasota. Both plans are similar in that the incentive includes a reduction in
permit fees and an expedited tag placed on their plan review. Sarasota extends their incentive to
include a limit any one builder may receive from permit reductions.
The city of Gainesville’s green incentive plan includes fast-track permitting, reduced
permitting fee (50%) and final project designation by the City. The city of Sarasota’s incentive
plan includes fast-track permitting for building permits, reduced building permit fees, totaling 50
percent reduction up to a maximum of $1,000, and up to a maximum of $5,000 per person or
entity and the county has set aside a maximum of $50,000 per year to cover the building permit
fee refunds.
As of March 2006 there were eight certified projects in the state of Florida. Table 2-8
designates project and location of these buildings. In addition, there were 63 projects registered
in the state of Florida. Table 2-9 lists these projects by owner type to illustrate the decision
makers involved.
As of March 2006, Gainesville accounts for eleven registered buildings while Sarasota
accounts for one. As of spring, 2007 the University of Florida has a mix of 16 certified and
registered projects on campus.
Market Trends
The green building movement has seen a steady increase in market share of U.S. non-
residential market since the early 1990’s. According to a research conducted by McGraw-Hill
(Construction 2006) in 2004, green building has accounted for approximately two percent of the
non-residential market in the U.S. This number is expected to be between five and ten percent,
or roughly $10 and 20 billion, of the new non-residential market in the U.S. by 2010. Survey

46
data from this study also shows 85 percent of the architects and engineers surveyed have had
some participation in green building activities and over half, 60 percent, have specified green
products in their designs. Table 2-10 outlines the market identifiers and predicted trends based
on McGraw-Hill research.
This same survey indicated the largest obstacle facing green building is perceived higher
first costs. The most important reasons given for pursing green building are lower operating and
energy costs as well as greater health and well being. The greatest triggers for architectural and
engineering firms to design to green standards are owner demand and owner concerns for energy
costs, plus any potential rebates or incentives.
Florida
As this country’s population nears 300 million people, energy consumption and supply will
be dramatically challenged to meet current demand rates. States’ economies are dependent on
adequate and dependable supplies of energy. Both new technologies and conservation allow for
greater means of control over energy consumption. Florida currently ranks third nationally in
both population, approximately 18 million in 2005, and in energy consumption. Government
officials estimate over the next few years the state’s energy consumption needs may grow nearly
30%. Conservative estimates predict fuel consumption increases from 28 million gallons a day
to over 32 million gallons a day. The 2006 Florida Energy Act provides a four year plan that
holds a $75 million cache for improving energy efficiencies within the state (Energy 2006).
Florida’s energy use is dominated by buildings. Just under half of the energy consumed in
the state (47%) goes for building operations. The other half consists of transportation
consumption at 35% and industry use at 18 % (Center 2006). Building energy use is split almost
evenly between homes (55%) and commercial buildings (45%). Electricity powers over 90% of
the demand.

47
Air conditioning demands the largest share of demand in building operations, accounting
for between 30 and 45% of total demand. Through the use of current technologies it is believed
that a 30% percent reduction of energy is proven cost-effective, while the most aggressive
strategies may be able to reduce consumption by 75%. Figure 2-2 illustrates average energy
usage by demand for 8000 office buildings in the southeast climate zone (e.g., Atlanta). Typical
energy use is estimated to be 92.6 kBtu/sf (Geshwiler 2003).
Florida Universities and Community Colleges Construction Background
As of 1995 the state’s public universities and community colleges have had individual
control over their construction processes with oversight provided by their local board of trustees.
Each institution is responsible for monitoring and reporting their construction needs via capital
improvement plans. Prior to decentralization, the Florida Department of Education staff,
operating under construction policy guidelines adopted by the Board of Regents, made
overriding decisions regarding capital improvement plans for the 11 public universities. The 28
individual community colleges traditionally functioned and continue to function with autonomy,
submitting improvement plans to their local Boards of Trustees.
Currently, the 11 state universities submit their overall capital improvement plans,
including construction costs, to the Board of Governors (BOG), while the community colleges
submit their plans to Division of Community Colleges and Workforce Education. The upper
state divisions use the campus data to develop statewide funding recommendations to the
Department of Education’s K-20 Legislative Capital Outlay Budget Requests. These
recommendations are reviewed and compared to state projections for enrollment, space
standards, and current facilities. The overall budget and allocation process is reviewed by
several state level organizations, in conjunction with the Board of Education, Board of
Governors (BOG), and institutions’ strategic plans.

48
The Board of Governors (BOG) is the governing body of the Florida State University
System (SUS). The SUS BOG was established in 2003 by Florida constitutional amendment. It
consists of a 17-member committee, of which 14 members are governor-appointed, and senate
approved. The remaining members consist of the Commissioner of Education, the Chair of the
Advisory Council of Faculty Senates, and the president of the Florida Student Association. This
Board oversees the 11 primary institutions as well as two additional and independent satellite
campuses of the University of South Florida, located on the St. Petersburg and Sarasota/Manatee
campuses. The 11 primary institutions and corresponding student enrollment for academic year
2004-05 are listed in Table 2-11.
Funding for University Projects
Based on a March 2006 report from the Office of Program Analysis and Government
Accountability (OPPAGA), Fiscal Year 2005-2006 funding for public universities and
community college capital outlay projects was $743.8 million, which includes construction and
infrastructure projects as well as land acquisitions. According to OPPAGA Public Education
Capital Outlay (OPPAGA 2006), funds are the largest source for postsecondary education fixed
capital outlay projects. The use of PECO funds is limited to academic and academic support
classified projects. Other sources of funding include general revenue, matching donor funds, and
concurrency funds. Concurrency funds are typically used for infrastructure improvements such
as utilities, roads, and drainage. Non-state funds are derived from private funds and student fees.
Student fee money is typically used to support student-related projects such as recreation
projects. Additional projects are supported by foundations, boosters, private companies and
individuals who may be approved by the legislature but are not subject to legislative oversight or
policy guidelines.

49
Construction Costs for Postsecondary Projects
Postsecondary education costs tend to run higher than other K-12 education costs for a
number of reasons. The OPPAGA (OPPAGA 2006) cites reasons for the increases as higher
land costs, stricter building codes, and regulations and standards associated with postsecondary
institutions. In addition, university facilities tend to include state-of-the-art technology, and,
depending on the individual university’s standards, long-term life schedules for up to 100 years’
usage for a building. Contractors also have to deal with tight construction sites and limited
disruption of ongoing campus activities.
The Florida Department of Education (FDE) lists the breakdown of overall monies spent at
the 11 major universities and the 28 supported community colleges. The overall differences in
spending are related to the primary mission or goals of the two types of institutions. Community
colleges do not bear the costs of residence halls and supporting research infrastructure, and
reallocate this spending toward classroom space and vocational laboratories. The OOPAGA
provided data outlined in Table 2-12 as reported in the March 2006 (OPPAGA 2006)report
regarding postsecondary construction costs.
It is important to note that the information reported in Table 2-12 represents only
construction costs based on initial contract awards. Information in Table 2-12 does not include
design and engineering costs and is not reconciled with final project cost data.
UF, FSU, and UCF Cost Comparison
Since the University of Florida is currently the only institution in the state university
system that mandates LEED construction it is of interest to compare its construction costs with
non-LEED mandated institutions. The University of Florida (UF), Florida State University
(FSU), and University of Central Florida (UCF) have similar design programs, serve similar
student bodies, and have similar life-cycle usage plans for their buildings. The difficulty in

50
comparing building program costs is the limited number of like projects with similar
characteristics (i.e., facades, gross square footages), however a cursory view of the data is
worthwhile to demonstrate, at a minimum, that LEED programmed buildings do not differ
greatly in general costs. Table 2-13 provides a comparison of project costs across Florida
campuses.
Although the data in Table 2-13 is limited, it does demonstrate that overall the LEED
process at the University of Florida does not make it the most expensive building program in the
state. In addition for the two UF projects that were pre-LEED mandate included in Table 2-13,
the Whitney Center and Accounting Building, costs were similar to post-LEED mandate costs.
After Gross Square Footage (GSF) cost comparisons are made the typical next question is
with regards to how professional fees are impacted by sustainable design. The previously
discussed Davis-Langdon study illustrates that these costs may be driven by the experience of the
design house rather than the general program requirements of a project. The University of
Florida has gained experience from earlier projects for which they would allow additional lines
within the budget for architects and engineers to participate and evaluate LEED processes and
strategies. UF has addressed the issue of professional fees in three ways. One, architect and
engineer firms must have at least two previous LEED certified projects within their current
portfolio to be considered for work on campus. Two, professional fees are based on a fee curve
that takes into account previous contract awards, function of the building, and gross square
footage of building. This fee trends at approximately 6.5% plus or minus 1% for most jobs on
campus. The professional fees noted in Table 2-14 include two non-LEED projects as well as
two expansion and renovation projects, the law school and library expansion that involved
additional renovation design. In addition, energy modeling and commissioning costs are

51
included in the professional fees for UF projects. Sustainable design processes are considered
part of their general award. The third approach in which UF has curtailed requests for additional
funding from designers is by having staff assume the role of LEED Accredited Professional (AP)
for all jobs. The LEED AP assigns, tracks, and reviews all LEED associated paper work and is
the main contact with for the USGBC regarding LEED registration, LEED submission, and
LEED certification processes.
University of Florida LEED History
The uniqueness of design and construction makes it difficult to compare costs. Location,
owners, contractors, standards, designers, types of contracts, regulations and requirements,
program requirements, and timing all influence the final price of a project. This section focuses
on the University of Florida (UF) experience with LEED. To begin the section will outline
LEED projects built within the University of Florida system over the past ten years and describes
how the processes has developed into being a national leader in the field of integrated sustainable
construction.
In 2001, the leadership within Facilities and Planning Department at the University of
Florida, with support from the University President’s Office and various campus wide groups,
adopted the USGBC’s LEED based standards for all construction projects with budgets greater
than one million dollars. This bold initiative was based on a conviction that integrated
sustainable design offers more than mere energy saving, rather it is a system based, third party
verification, and environmentally sensitive means, both in terms of external and internal design
considerations, of delivering a sound product with a long life cycle. These sustainable concepts
were an extension of already existing practices with the planning department but with leadership
and staff’s personal commitment the LEED evaluation process raised the bar in terms of design

52
deliverables and processes. Table 2-15 lists the projects that are registered with USGBC on the
UF’s campus along with their corresponding size in gross square footage (gsf).
UF’s plan of adoption followed means outlined in several texts regarding change and
uptake of sustainable processes. The Sustainable Building Technical Manual suggests the
following benchmarks be established for initial review of the process:
• Establish vision statement that embraces sustainable principles and an integrated design approach. The project team should articulate a vision statement that will support and enforce sustainable goals throughout the project.
• Establish the project’s green building goals developed from the vision statement.
• Establish green design criteria
• Set priorities for the project design.
Crucial to this process is a vision statement that is accepted and supported throughout the
entire project’s design and construction cycle. Integrated sustainable delivery differs from other
forms of construction models in that it requires from designers to break away from their
traditional form of linear design and to communicate and adopt an integrated form of design.
Over the past six years UF’s planning department has transitioned from explaining LEED
criteria to designers and contractors to demanding a history of LEED projects to qualify to be
short-listed for review. This emphasizes the inroads sustainable techniques have had on the
construction industry in Florida as well as the ability for the University to influence positive
change in its local building trades. UF’s team made a strong and clear commitment to educate
and train all parties involved regarding the LEED process. This took a dedicated and educated
staff in the planning department to push for others to adopt and adapt to the new processes. The
Sustainable Building Technical Manual emphasizes the design team selection as follows:
• Create a design and construction team that utilizes the whole-building integrated design approach.

53
• Develop a Statement of Work (SOW) and a Request for Qualifications (RFQ), in preparation for hiring appropriate design professionals.
• Select a team leader and encourage communication and integration among team members. • Determine the most appropriate method for contractor selection, given the project goals.
Through this process UF’s planning department has developed several tools to track and
manage the LEED process. These tools aid in assigning Credit responsibility among team
members and recommendations for credit achievability. The University’s process is similar to
that outlined in the GSA application guide. Figure 2-3 outlines UF’s LEED process. Although
UF has been practicing sustainable construction for some time the Facilities and Planning
Department serve their individual owner groups (i.e., colleges or schools which are receiving a
new building) and as such struggle with educating these groups as to the value of LEED credits.
In essence the university benefits from a non-traditional green design, maximizes no-cost credits,
and seeks to educate users groups as to the benefits of moderately costly credits. As Figure 2-3
illustrates costing points and searching for no-cost credits takes precedent over applicability of
credits.
Cost Impact of LEED Credits
Currently the University of Florida is in the process of analyzing cost impacts per LEED
credit with regard to a projects overall budget. Previously this information was not collected on
a credit by credit basis across projects. Most professional fees associated with LEED such as
energy modeling and commissioning were part of the university’s building program prior to
LEED uptake and are not considered additional costs. In addition, LEED documentation
processing is now processed by staff as part of their internal project management responsibilities
and is not charged as an additional cost to LEED projects. UF considers LEED credit costs as

54
part of the building program and LEED processes and analyzing tradeoffs has become standard
practice.
Cost estimates for my study were based on three sources: 1) Conceptual estimates and
proven costs based on UF Facility and Planning experience with over 16 projects, 2) the GSA
LEED Cost Study (GSA 2004), and 3) the Indian Health Services (IHS) LEED Cost Evaluation
Study (IHS 2006). As mentioned previously he GSA estimates were conducted by the Steven
Winter group and submitted and reviewed by the GSA analyzed the cost impacts and tradeoffs of
LEED credits associated with two traditional GSA produced buildings, a 262,000 gross square
foot (gsf) courthouse and a typical mid-rise modernization of a 306,000 gsf federal building.
While the building types differ from a traditional campus style buildings the square footage costs
fit within the range of a campus building types and the cost for much of the points is similar in
their impact compared to typical commercial building construction.
My study initially categorized cost impacts in similar fashion as the GSA study
incorporated. Mandated program cost, those items required regardless of seeking LEED
certification, and “No Cost” items are assigned LEED Cost Values (LCV) of 1 and 2 respectively
while cost increases directly related to LEED prerequisites are assigned values between 3 and 5
depending on their cost impacts between $50,000 dollars and over $150,000 dollars respectively.
Cost impacts are assigned a value based on their estimated cost. The values are outlined in Table
2-16.
Throughout this chapter each individual prerequisite and credit cost impacts will be noted
by individually. Case studies will be included where applicable. The LCV values are noted on
the individual credit estimate sheets to provide background information for project specific

55
conceptual estimates. The LCV scores served as an initial evaluation tool to compare UF’s
experience with those of the GSA study and IHS study.
Evaluation of LEED Prerequisites
The LEED standard is comprised of seven prerequisites that are required in order to submit
a project for LEED certification. The cost associated with these prerequisites, as with other
credits as well, is highly dependent on the variance between existing design and building
requirements of the local authority and LEED requirements. One of the limitations to the costing
node of the model is that all prerequisites are adopted as building standards for all projects
during Phase I of the model. This acceptance is necessary to achieve LEED certification and as
such is considered a non-cost for the Phase II cost portion of the model. The seven prerequisites
are as follows:
• Sustainable Sites o Prerequisite 1 – Construction Activity Prevention
• Energy and Atmosphere
o Prerequisite 1 – Fundamental Commissioning of the Building Energy Systems o Prerequisite 2 – Minimum Energy Performance o Prerequisite 3 – Fundamental Refrigerant Management
• Materials and Resources o Prerequisite 1 – Storage and Collection of Recyclables
• Indoor Environmental Quality
o Prerequisite 1 – Minimum Indoor Air Quality (IAQ) Performance o Prerequisite 2 – Environmental Tobacco Smoke (ETS) Control
To provide a context for the evaluation of LEED prerequisites the topic of cost anchoring
is discussed next. In addition a case study examining additional versus traditional costs is noted.
Cost Anchoring and Adjusting
Anchoring in decision processes vernacular refers to the process by which informal
guesses are taken when estimating an amount (Beach and Connolly 2005). The difficulty with

56
anchoring is that unless the person doing the estimating has valid concrete experiences with
estimating whatever that is being evaluated is that the “guess” number is typically incorrect if not
way off. Due to the amount of press and types of cost data provided, as noted in this chapter,
costs for green design range anywhere from an initial cost savings to greater than 10% over
conventional construction techniques. Cost mentioned informally at the county budget meeting
referenced at the introduction of this chapter ranged as high as 30%. The DMASC decision
model allows for credit consideration and cost to be separated where as not to influence the
decision process until the final ranking. Should cost be the overriding factor it may be
considered but the strength of the process is to evaluate the credits without cost anchoring
influencing the process.
One of the main reasons for the range in sustainable cost estimates is the fact that they
studies do not account for standard program embedded costs. For example, both fundamental
and enhanced commissioning was considered standard practice at the University of Florida prior
to the adoption of their LEED mandate. As such these costs are not considered as “adds” to their
project budget. The GSA has a rather progressive building standard, as does the IHS, so the two
study overall impacts do not include items already included in their base programs. Figure 2-4
illustrates the relationship between building standards and LEED first costs.
An example of examining LEED costs is the case of the North Boulder Recreation Center
which earned a LEED Silver certification in March 2003 (Colorado 2003). The North Boulder
recreation center tracked costs associated with achieving their LEED Silver rating. Table 2-17.
list the LEED associated costs for the recreation center.
The big ticket items with regard to construction costs was $256,000 for a solar water
system that pre-heats water for the recreation swimming pools, $32,000 for higher efficient

57
boilers, $7,400 for additional commissioning, and $157,300 for additional material costs across
the achieved credits. The point of examining this case is to examine the non-construction
upgrade costs. The energy modeling costs ($33,000), commissioning costs ($24,300 plus
$7,400), and integrated design consultant costs ($15,450) are considered extras for the city of
Boulder but not so currently at the University of Florida. Although UF initially provided line
items in budgets for accounting for similar costs on their first green buildings they no longer do
so. Energy modeling and commissioning were considered part of the design standard prior to
LEED and expected on all buildings pre and post the adoption of the LEED mandate. There is
no longer an integrated design consultant assigned to projects at the University of Florida.
Architects, engineers, and contractors must have two prior LEED jobs completed to be short-
listed to work on UF projects. In addition LEED processing is assigned to the UF Facility and
Planning staff to handle in-house.
Florida Code and LEED Prerequisites
Florida Building Code 2004 is based primarily on the incorporation of the following codes:
• National and International Codes: o International Building Code , 2003 edition o International Plumbing Code , 2003 edition o International Mechanical Code , 2003 edition o International Fuel Gas Code , 2003 edition o International Residential Code , 2003 edition o International Existing Building Code , 2003 edition o National Electrical Code , 2002 edition o American Society of Heating, Refrigerating and Air-conditioning Engineers’
(ASHRAE) Standard 90.1-2001 • State and Local Codes
o Florida Energy Efficiency Code for Building Construction o Florida Accessibility Code for Building Construction o Special hurricane protection standards for the high-velocity hurricane zone.

58
The USGBC references the following codes with regard to various credits and
prerequisites relating to building codes and practices:
• 2003 EPA Construction General Permit • Stormwater Best Management Practice Design Guide, EPA/600/R-04/121A, September
2004 • ASHRAE/IESNA Standard 90.1 2004, Energy Standard for Buildings Except Low-Rise
Residential: o Section 5 – Building Envelope o Section 6 – Heating, Ventilation and Air Conditions (HVAC) o Section 7 – Service Water Heating o Section 8 – Power (including all building power distribution) o Section 9 – Lighting (without amendments) o Section 10 – Other Equipment (all permanently wired electrical motors) o Appendix G – Performance Rating Method (Energy Modeling)
• ASHRAE Advanced Energy Design Guide for Small Office Buildings 2004 • ASHRAE Standard 62.1-2004: Ventilation for Acceptable Indoor Air Quality • ASHRAE Standard 55-2004, Thermal Comfort Conditions for Human Occupancy • ANSI/ASHRAE 52.2-1999: Method of Testing General Ventilation Air-Cleaning Devices
for Removal Efficiency by Particle Size • The Energy Policy Act (EPAct) of 1992 (Plumbing Standard) • International Performance Measurement and Verification Protocol (IPMVP) Volume III:
Concepts and Options for Determining Energy Savings in New Construction, April 2003 • IAQ Guidelines for Occupied Buildings Under Construction • EPA “Compendium of Methods for the Determination of Air Pollutants in Indoor Air”
The USGBC requires only three specific project standards to meet LEED prerequisites.
Should a prerequisite not be met then the project would not receive LEED certification.
Table 2-18 lists the LEED prerequisites that have an associated reference standard. The USGBC
does allow for the incorporation of local standards should they be more stringent than the stated
reference standards.

59
Sustainable Site Prerequisite
The intent of the Sustainable Site Prerequisite 1 regarding erosion and sedimentation
control is to reduce the negative impacts on water and air quality on and surrounding the
construction site. The requirements involve designing erosion and sedimentation control plan
that meets or exceeds the 2003 EPA Construction General Permit, or local erosion control
standards, whichever is more stringent regardless of project size. The USGBC lists the
objectives of the plan as follows:
• Prevent loss of soil during construction by stormwater runoff and/or wind erosion, including protecting topsoil by stockpiling for reuse.
• Prevent sedimentation of storm sewer or receiving streams. • Prevent polluting the air with dust and particulate matter.
This is a good example of a prerequisite or credit that may be of no cost should the local
authority meet or exceed the EPA standard. This credit is considered to have a LEED Cost
Value (LCV) of one since this has become standard practice at university main campuses in the
state.
Energy and Atmosphere Prerequisite 1 Fundamental Commissioning
Prerequisite 1 Fundamental Building Systems Commissioning of the Energy and
Atmosphere category focuses on verifying that fundamental building systems are designed,
installed and operating as intended. The USGBC outlines the requirements as follows:
• Designate an independent experienced individual as the Commissioning Authority (CxA) to lead, review and oversee the completion of the commissioning process activities.
• The Owner shall document the Owner’s Project Requirements (OPR) and the Design team
shall develop the Basis of Design (BOD). • The team shall develop and incorporate commissioning requirements into the construction
documents.

60
• Develop and implement a commissioning plan. • Verify the installation and performance of the systems to be commissioned. • Complete a summary commissioning report.
The USGBC stresses the importance of having the following minimum energy-related
systems included in the plan and final report:
• Heating, ventilation, air conditioning, and refrigeration (HVAC and R) systems (mechanical and passive and associated controls.
• Lighting and daylighting controls. • Domestic hot water systems. • Renewable energy systems.
Commissioning tends to be the most costly and debated of all the prerequisites if it is
currently not part of the local building program. From an owner’s perspective questions arise as
to the need for having an additional party involved in checking other professional’s work, and
Contractors echo similar sentiments along with issues relating to documenting and meeting
additional burdens placed on them as a result of the commissioning plan. Owner’s currently
incorporating various levels of commissioning site the complexity of systems, lack of Contractor
quality control with regard to checking systems, and cost savings of having a properly
functioning building as driving forces in favor for some level of commissioning. The
commissioning industry reports benefits that include:
• Improved building system control and performance • Improved indoor air quality, occupant comfort, and productivity • Decreased potential for owner liability • Studies show an annual energy savings of between 15 and 30 percent • Early detection of potential problems
For the University of Florida this prerequisite has a LCV of one since commissioning was
part of the building program prior to the uptake of LEED. For building programs that currently

61
do not incorporate commissioning the cost ranges are considered considerable by many
professionals not convinced of the overall commissioning process value. The Portland Energy
Conservation, Inc. (PEC) (Portland Energy Conservation 2002), provides guidelines with regard
to the cost associated with commissioning. Table 2-19 outlines commissioning costs based on
phase or construction elements. The general rule sited by the PEC is that commissioning will
run between 0.6 and 1.8% of the overall construction costs of a project. Using a construction
budget of $7 million for an average campus school building as an example the commission fee
would range between $42,000 and $126,000. For programs not including this as a base program
costs, this would earn this prerequisite a LCV of 3 for Fundamental Commissioning required to
meet this prerequisite or LCV of 4 for enhanced commissioning services related to Energy and
Atmosphere Credit 3.
The GSA reports that fundamental commissioning runs approximately $0.75 to $1.00 per
gross square foot (GSF) with more comprehensive commissioning costing slightly higher than
that range. Since commissioning is considered a GSA standard the GSA report does not include
commissioning as an increase cost to subscribe to LEED standards. This does not mean that it is
‘free.’ Using the GSA suggested costs for the base courthouse it would have been an additional
a dollar extra for each square foot and would result in a cost impact of $262,000.00. Given the
$57,640,000.00 total construction cost budget, the overall impact to as a percentage would have
been a 0.5% cost increase to the total construction budget. UF’s Facilities Department confirms
the cost for the prerequisite commissioning and Energy and Atmosphere Credit 3 combined is
approximately $0.75 per gross square foot.

62
Energy and Atmosphere Prerequisite 2 Minimum Energy Performance
Prerequisite 2 Minimum Energy Performance of the Energy and Atmosphere category
focuses on establishing and meeting minimum energy requirements based on ASHRAE/IESNA
Standard 90.1-2004.
For the University of Florida this was a no cost item since this standard applied prior to the
adoption of LEED standards and as been amended as ASHRAE has updated its standard.
According to university staff and contracts energy modeling at costs has remained steady at
$0.25 per gross square foot on recent projects. For university campuses not incorporating this
standard the additional costs would have to be compiled by an engineering service familiar both
with the current standard and the LEED applied ASHRAE/IESNA standard.
Energy and Atmosphere Prerequisite 3 CFC Reduction in HVAC and R Equipment
Prerequisite 3 CFC Reduction in HVAC and R Equipment of the Energy and Atmosphere
category focuses on zero use of CFC-based refrigerants in HVAC and R systems. Should a
project be reusing equipment then a complete CFC phase-out conversion plan is required.
In the United States CFC-based refrigerants are no longer available as options for new
equipment. This has a LCV of 1 being a no cost option.
Materials and Resources Prerequisite 1 Storage and Collection of Recyclables
Storage and Collection of Recyclables Prerequisite 1 of the Materials and Resources
category focuses on providing means and space for recyclables. The intent of this prerequisite is
to reduce tenant generated waste that would be disposed of by traditional means (i.e., landfills).
Designers must coordinate the size of the recycled area based on the square footage of the overall
building. Most government institutions require or support recycling efforts and as such this is
minimal or no cost prerequisite.

63
Recycling mandates across campus support and insist on recycling efforts be conducted on
campuses. The size requirements and design efforts are not a burden with regard to cost and
meet the overall design program of most campus buildings.
Indoor Environmental Quality Prerequisite 1
Indoor Environmental Quality Prerequisite 1 regarding Minimum IAQ Performance
focuses on providing adequate indoor air quality that will support tenant productivity and
comfort. The USGBC outlines the minimum requirements as meeting Sections 4 through 7 of
ASHRAE 62.1-2004, Ventilation for Acceptable Indoor Air Quality. In addition, mechanical
ventilation systems shall be designed using the Ventilation Rate Procedure or the applicable local
code, whichever is more stringent. For naturally ventilated buildings ASHRAE 62.1-2004,
paragraph 5.1, shall apply.
The cost associated with this prerequisite is largely dependent on current local standards
and the experience and familiarity of the designers with the applicable ASHRAE standards.
Should local standards already incorporate these types of requirements then it should be no
additional costs; for those unfamiliar with the standards there may be initial learning curve cost
associated with design.
Indoor Environmental Quality Prerequisite 2 Environmental Tobacco Smoke
Indoor Environmental Quality Prerequisite 2 regarding Environmental Tobacco Smoke
(ETS) Control is probably the most diverse prerequisite in that designers are given choices
regarding conditions that satisfy the requirement. The intent of the standard is to limit or
minimize the building occupants, surfaces, and ventilation system to tobacco smoke. The
USGBC lists three options that will meet the intent of this prerequisite:
OPTION 1
• Prohibit smoking in building.

64
• Locate any exterior designated smoking areas at least 25 feet away from entries, outdoor
air intakes and operable windows.
OPTION 2
• Prohibit smoking in the building except in designated smoking areas • Locate any exterior designated smoking areas at least 25 feet away from entries, outdoor
air intakes and operable windows. • Locate designated smoking rooms to effectively contain, capture and remove ETS from the
building. At a minimum, the smoking room must be directly exhausted to the outdoors with no re-circulation of ETS-containing air to the non-smoking area of the building, and enclosed with impermeable deck-to-deck partitions. Operate exhaust to create negative air pressures with regard to adjacent spaces.
• Performance of the smoking room differential air pressures shall be verified by conducting
measurements of the differential pressure in the smoking room with respect to each adjacent area and in each adjacent vertical chase with the doors to the smoking room closed.
OPTION 3 (For residential buildings only)
• Prohibit smoking in all common areas of the building. • Locate any exterior designated smoking areas at least 25 feet away from entries, outdoor
air intakes and operable windows opening to common areas. • Minimize uncontrolled pathways for ETS transfer between individual residential units by
sealing penetrations in walls, ceilings, and floors in the residential units, and by sealing vertical chases adjacent to the units.
• All doors leading to common hallways shall be weather-stripped to minimize air leakage
into the hallway, unless properly pressurized with respect to residential units. Testing and sampling per ANSI/ASTM-E779-03, Standard Test Method for Determining Air Leakage Rate by Fan Pressurization, is required to meet this option.
The majority of institutional and government buildings are designated no-smoking and
meet Option 1 above at no additional design or equipment costs and is assigned a LCV of 1. For
buildings selection Option 2 or 3 a takeoff of additional equipment, design effort, and testing
requirements would have to be included as an additional cost over base design.

65
Separation of Preference and Cost
The unique aspect of the USGBC LEED criteria is that there is no single way to meet any
of the certification levels. Similarly, designers, within code limits, may produce any number of
versions of a building that meet the program goals set forth by the owner. Contractors are often
given plans and a sum of money and are left to their own experience to develop a successful
project schedule and means to achieve the schedule. Sustainable integrated design, in particular
those pursuing third party certification (e.g. LEED accreditation), in effect require that designers
and contractors meet basic prescriptive program design and project delivery requirements.
Overall design and construction cost impacts are heavily influenced by local design standards
concurrency with sustainable standards, contractor methods, site selection, and points pursued
throughout the certification processes. During the integrated design process seeking low-cost
LEED points tends to override the applicability of the points to the project and the owner’s
original program goals. The focus of this chapter is to develop a method for local decision
makers, both in supervisory and direct construction roles, to evaluate their current building
delivery system, establish preferences for more sustainable practices, and determine the impact
these preferences have in achieving LEED certification.
Sustainable ideals transform the way in which buildings are delivered and the way in
which design considerations are evaluated. As discussed previously sustainable delivery
methods require designers at all levels to communicate and integrate their design responsibilities.
Likewise traditional monetary evaluation methods, such as Return-On-Investment, net-present
value, rate of return, and payback, need to be expended to include non-financial characteristics,
such as the value of better indoor air quality and daylight, which are require judgment to
monetize. Qualitative impacts may be too costly to quantify, or impossible to determine, but
their impact in a building program may be obvious. Because of the difference in nature in

66
evaluating these characteristics a method for evaluating the combined impacts of these criteria is
needed. My study looks to the field of multiattribute decision analysis (MADA) for methods to
accommodate non-monetary benefits and costs (Norris and Marshall 1995). MADA type
decision models are best suited for decisions involving a generally small set of discrete variables
such as certification checklists. In addition the overall methodology/study design borrows from
work that evaluated the cost-benefits of selecting data management systems (Su, Dujmovic et al.
1987). This model serves the following primary goals:
• Provides a mathematically based theory for evaluating sustainable criteria • Provides a systematic method for deriving decisions • Provides an evaluation technique for incorporating both cost data and decision maker’s
preferences
Current building methods are typically evaluated periodically by facility personnel and
various identities associated with campus planning and construction. Changes to construction
methods typically do not occur unless there is a perceived need to make improvements to the
global performance level. Once the decision is made that there is a need to upgrade the existing
global performance levels the organization then moves to the analysis phase and goal
identification. Examples of improvement with regard to more sustainable building methods
might be the inclusion of LEED criteria for all construction projects, greater energy performance,
or reduced water consumption.
In addition to identifying the goals for an improved system, a thorough review of estimated
resources needed to carry out the changes would have to take place. This review would have to
examine the affects the shift in methods would have on infrastructure and personnel associated
with the improved methods. Should it be decided that the new goals fall inline with the program
assessment then the decision to change to a more sustainable program is made.

67
At this point the organization is faced with myriad decisions regarding how to implement
change. The organization may stress energy performance of their building as the key to their
improved system. It may decide worker productivity be emphasized. It may be obvious that first
costs for design and construction are the limiting factors overriding all other sustainable goals.
Both preference impact and cost must be considered to determine the best alternative.

68
Figure 2-1. Relationship between LEED alternatives and outcomes
Sustainable Sites
Water Efficiency
Energy and Atmosphere
Materials and Resources
Indoor Environmental
Quality
LEED Criteria Outcomes
Building Performance
Environment
Social
Occupant Health

69
Figure 2-2. Building demand for average southeast commercial building
Lighting36%
Water heating4%
Ventilation8%
Space cooling14%
Space heating12%
Other26%

70
Figure 2-3. University of Florida LEED credit evaluation steps
Step 1: Evaluate LEED Prerequisites
Step 2: Evaluate “UF Recommended”
Credits
Step 3: Evaluate Non-applicable
Credits
Step 4: Evaluate No Cost and Low
Cost Credits
Step 5: Review LEED Scorecard after
Initial Considerations Steps 1-4
Step 6: Evaluate Moderate and High
Cost Credits
Step 7A: Review High Design Impact
Credits
Step 7B: Review Synergistic and
Integrated Design Tradeoffs
Step 8: Establish Initial LEED Approach for Project
Initi
al C
onsi
dera
tions
D
esig
n Ev
alua
tions

71
Figure 2-4. LEED first cost impacts based on building standards

72
Table 2-1. Initial capital construction costs for IHS LEED projects Certified Silver LEED Construction cost impacts Low High Low High Cost impact $170,700 $507,900 $589,700 $1,268,500 $/Gross Square Foot $2.01 $5.98 $6.95 $14.94 % Change 1.0% 3.0% 3.5% 7.9%
Table 2-2. USGBC Sample cost data
Design Effort and
Hard Costs Documentation Costs
Alternative Design Effort
Hard Costs
No Added Cost
No add for Exemplary Design
Doc. Costs
Learning Curve Reduce
SSCredit 1 Site E ● SSCredit 2 Density E ● $$ SSCredit 4.1 Alternative
Transportation E $
SSPrereq 1 Pollution + $ ● SSCredit 4.4 Alternative
Transportation + $ ●
SSCredit 6.1 Storm Quantity
+ $ ● ●
SSCredit 7.1 Heat Island Non-Roof
++ $ ●
SSCredit 8 Light ++ $ ● Table 2-3. LEED criteria development Year LEED Criteria 1994/1995 Pass/Fail Criteria 1998 LEED 1.0 Pilot Program 2000 LEED 2.0 2004 LEED 2.1 2005 LEED 2.2

73
Table 2-4. LEED certification levels Certification Level Points Certified 26 to 32 Silver 33 to 38 Gold 39 to 51 Platinum 52 or more
Table 2-5. LEED 2.2 rating system points per category Category Number of alternatives Number of possible points Water Efficiency 3 5 Material and Resources 7 13 Sustainable Sites 8 14 Indoor Environment 8 15 Energy and Atmosphere 6 17 Subtotal: 64 Design Innovation and LEED Professional:
2 5
Total: 69 (USGBC 2007)
Table 2-6. LEED certified and registered projects Project Level
New Construction
Commercial Interiors
Existing Building
Core and Shell
Total
Registered 4,572 579 356 478 5,985Certified 600 110 42 29 781

74
Table 2-7. Business case for high performance green buildings summary 1. In The event up-front costs are higher for high performance green buildings, they
can be recovered.
2.
Integrated design lowers ongoing operating costs.
3. Better buildings equate to better employee productivity.
4. New technologies enhance health and wellbeing.
5. Healthier buildings can reduce liability.
6. Tenants’ costs can significantly be reduced.
7. Property value will increase.
8. Many financial incentive programs are available.
9. Communities will notice your efforts.
10. Using best practices yields more predictable results.
Table 2-8. Florida LEED certified projects location and award level Happy Feet Plus Clearwater Gold Stetson University DeLand Certified University of Florida-Gainesville Campus Gainesville Gold University of Florida – Gainesville Campus Gainesville Certified Navy Federal Credit Union Pensacola Gold Sarasota County Government Sarasota Gold Whole Foods Market Sarasota Silver Sarasota County Government Sarasota Gold
Table 2-9. Number of Florida LEED registered projects by owner type Federal Government 8 Local Government 12 Nonprofit Corporation 7 Other 9 Profit Corporation 21 State Government 6 Total 63

75
Table 2-10. Impacts of green building by survey respondents Market Identifier Predicted Trend Operating costs Decrease operating costs between 8.0 and
9.0 % across the industry.
Building values Average increase in value expected to be approximately 7.5 %
Return-on-investment (ROI) On average, to improve to 6.6 %
Occupancy ratio Increase by 3.5 %
Rent ratio Expected to rise by 3.0 % on average.
Table 2-11. Florida university enrollment for 2004-05
University Under –graduate Graduate
Under-class Total Percent
Florida Agricultural and Mechanical University, Tallahassee 10,372 1,529 278 12,179 4.3%Florida Atlantic University, Boca Raton 19,951 3,386 2,367 25,704 9.0%Florida Gulf Coast University, Ft. Myers 5,978 762 524 7,264 2.5%Florida International University, Miami 28,406 5,085 3,484 36,975 13.0%Florida State University, Tallahassee 30,418 7,926 1,308 39,652 13.9%New College of Florida, Sarasota 761 0 1 762 0.3%University of Central Florida, Orlando 37,568 6,328 1,057 44,953 15.8%University of Florida, Gainesville 34,028 14,310 1,378 49,725 17.4%University of North Florida, Jacksonville 13,077 1,618 658 15,353 5.4%University of South Florida, Tampa 32,968 7,910 2,143 43,021 15.1%University of West Florida, Pensacola 7,828 1,239 634 9,701 3.4%Total state university system 221,355 50,093 13,841 285,289 100.0%

76
Table 2-12. Florida’s post-secondary construction costs based on 2004 data
Building Type
National Median Total Cost
National Low Quartile Cost/Square Foot
National Median Cost/Square Foot
National High Quartile Cost/Square Foot
Florida Median Cost/Square Foot (2004)
Academic $8,000,000 $129.09 $172.82 $221.11 $148.73 Library $16,000,000 $191.48 $235.29 $326.62 $152.58 Office $6,500,000 $107.64 $138.44 $235.29 $155.11 Science $20,000,000 $201.83 $240.00 $294.05 $183.99

77
Table 2-13. Comparison of project costs on Florida campuses Florida State University
Project Bid Date Build Type Total Budget GSF Cost/GSF College of Medicine May-03 Research $60,246,450 299,092 $201 Communications Building Apr-02 Teaching $32,970,968 163,518 $202 Psychology Oct-04 Research $49,819,662 184,679 $270 Classroom Facility Sep-05 Class $22,636,289 88,000 $257 Chemistry Building Sep-05 Research $53,939,705 168,063 $321 University of Central Florida
Project Bid Date Build Type Total GSF Cost/GSF Alumni Center (FairWinds) Aug-04 Office $4,959,864 17,983 $276 Psychology Jul-05 Office $14,136,600 76,257 $185 Student Health Center Aug-04 Office $6,500,000 48,725 $133 University of Florida
Project Bid Date Build Type Total GSF Cost/GSF Orthopaedic Surgery Jan-03 Research $26,929,411 120,000 $224 *Accounting Classroom Building Jan-02 Class $9,063,800 51,089 $177 Library West Nov-03 Library $30,942,207 177,000 $175 Law Info Center Jan-03 Library $25,328,042 132,620 $191 *Whitney Center for Marine Studies Feb-05 Teaching $3,152,300 19,750 $160
Note: University of Florida projects highlighted with asterisk (*) are pre-LEED mandated projects.
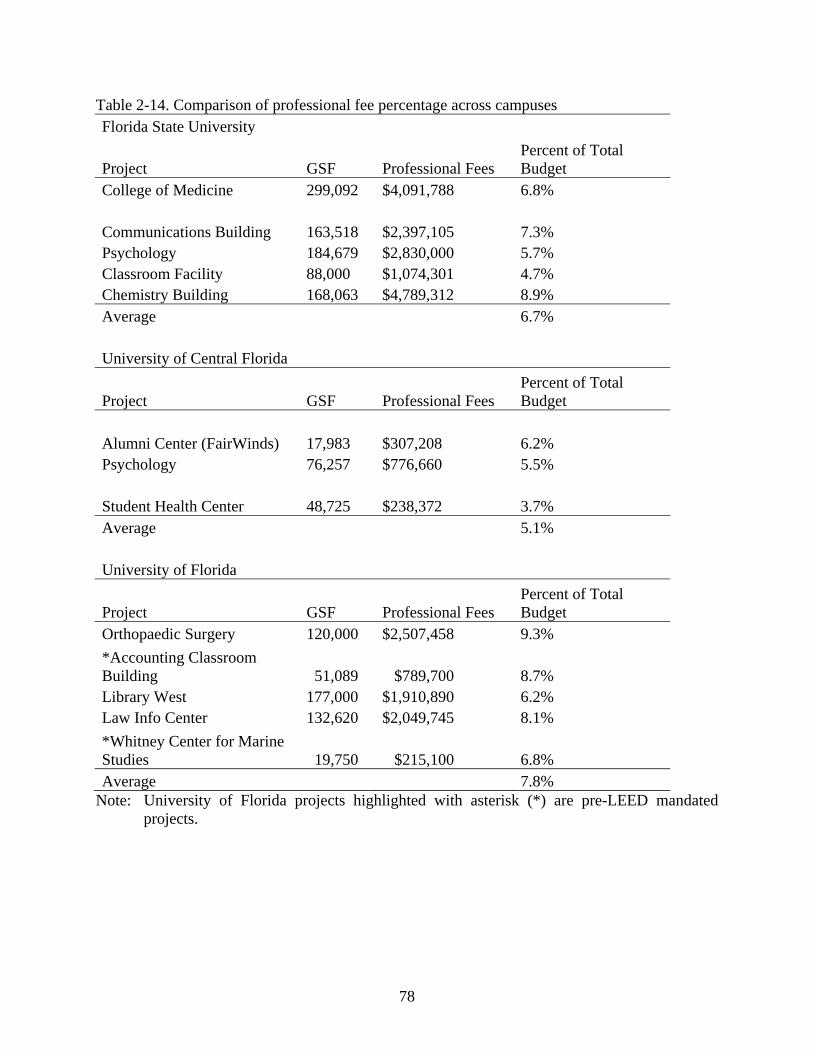
78
Table 2-14. Comparison of professional fee percentage across campuses Florida State University
Project GSF Professional Fees Percent of Total Budget
College of Medicine 299,092 $4,091,788 6.8%
Communications Building 163,518 $2,397,105 7.3% Psychology 184,679 $2,830,000 5.7% Classroom Facility 88,000 $1,074,301 4.7% Chemistry Building 168,063 $4,789,312 8.9% Average 6.7% University of Central Florida
Project GSF Professional Fees Percent of Total Budget
Alumni Center (FairWinds) 17,983 $307,208 6.2% Psychology 76,257 $776,660 5.5%
Student Health Center 48,725 $238,372 3.7% Average 5.1% University of Florida
Project GSF Professional Fees Percent of Total Budget
Orthopaedic Surgery 120,000 $2,507,458 9.3% *Accounting Classroom Building 51,089 $789,700 8.7% Library West 177,000 $1,910,890 6.2% Law Info Center 132,620 $2,049,745 8.1% *Whitney Center for Marine Studies 19,750 $215,100 6.8% Average 7.8%
Note: University of Florida projects highlighted with asterisk (*) are pre-LEED mandated projects.

79
Table 2-15. University of Florida green building stock
Building Gross Square Footage (gsf) Band Building 11,263Baseball Lockers 15,000Biomedical Science 163,000Cofrin-Harn Pavilion (LEED Certified) 19,240Genetics/Cancer Research 280,000Hub Renovation 53,000IFAS 5,550Law Library 132,620Library West McGuire Center (LEED Certified)
177,00054,000
Nanoscience Institute 53,000Powell Structures Lab (LEED Certified) 8,565Pugh Hall 45,000Rinker Hall (LEED Gold) 46,530Sports Medicine (LEED Certified) 119,105Stadium Expansion 49,000Veterinary Facility 11,900Total gsf 1,208,443
Table 2-16. LEED cost values (LCV) Cost Impact Category Value University mandate (part of existing building program) 1 No or Minor cost (<$500) / Potential savings 2 Low cost impact (<$50 K) 3 Moderate cost impact ($50K - $150K) 4 High cost impact (>$150K) 5
Table 2-17. Associated LEED costs for North Boulder Recreation Center Items required to achieve LEED Item Cost LEED registration $750 LEED certification $1,500 Integrated design consultant $15,450 Energy modeling $33,000 Commissioning $24,300 Total cost of construction/equipment upgrades $461,700 Total $536,700 Total % (as percent of the $11.6 million project budget) 4.6%

80
Table 2-18. LEED prerequisite standards LEED Prerequisite Referenced Standard Sustainable Sites – Construction Activity Pollution Prevention
2003 EPA Construction General Permit
Energy and Atmosphere – Minimum Energy Performance
ASHRAE/IESNA Standard 90.1-2004 (referenced sections)
Indoor Environmental Quality (IAQ) – Minimum IAQ Performance
ASHRAE 62.1-2004 (referenced sections)
Table 2-19. Construction phase commissioning costs Commissioning System Commissioning Cost HVAC and controls 2.0% to 3.0% of total mechanical system Electrical system 1.0% to 2.0% of total electrical system HVAC, controls, and electrical 0.5% to 1.5% of total construction costs

81
CHAPTER 3 DECISION MODEL METHODOLOGY
Introduction
The Decision Model for Assessment of Sustainable Construction (DMASC) outlined in
Figure 3-1 provides a systematic approach for determining cost impacts associated with adopting
sustainable building processes and techniques. The model consists of three main phases. Phase I
address the institutional-wide analysis of traditional construction and building methods,
institutional resources, and rationales for seeking a change to sustainable methods. Phase II
presents the Logical Scoring of Preferences (LSP) portion of the model. Phase III involves the
final decision making portion of the model. The model establishes program requirements; in this
case United States Green Building Council’s (USGBC) Leadership in Environmental and Energy
Design (LEED)-NC 2.2, then splits the decision processes into separate cost and preference
analysis, and finally combines both evaluation methods into a single cost preference analysis
phase.
Current Building Method
Current building delivery methods and standards vary throughout the state. With regard to
university construction programs each has its own building standard. Building standards are
periodically evaluated for such things as code compliance, construction material trends and
availability, and technological fit. A key difference between the University of Florida’s (UF)
LEED based standards and other campus standards throughout the state is that UF’s Building
Standard provides a mandate for LEED certification. Other institutions, such as the University
of Central Florida (UCF) list sustainable practices as recommended or suggested practices where
practical. The DMASC model provides institutions a systematic framework to review current
standards.

82
Existing Delivery Method Performance Evaluation
University personnel provide architects, designers, engineers, and contractors with
building standards or guidelines that describe the requirements and preferences that apply to all
university projects. These guidelines typically state that the designers are to incorporate
applicable portions of the guide into contract documents (i.e., contract drawings and
specifications). In turn, contractors are to follow prescriptive guidelines during the course of a
project. These guidelines generally provide a caveat that allows for modifications and
clarifications to guidelines when opportunities for change and or conflicts among professionals
arise.
In addition designers and builders must comply with various life-safety codes, building
codes, and policy requirements of the university staff. Similarly, the USGBC requires that
certain prerequisites be met per the designated prescriptive standards or methods. These
prerequisites are similar to adhering to ADA requirements or fire codes in that require an
understanding of the design intent and a fulfillment of design or performance standard. An
example of such a prerequisite would be the Sustainable Sites Prerequisite 1: Construction
Activity Pollution Prevention which addresses reduced pollution from construction activities.
The prerequisite requires the contractor to create and adhere, and document adherence, to a
erosion and sedimentation control (ECS) plan that conforms or goes beyond the 2003 EPA
Construction General Permit. In addition to including meeting LEED as an overall project
objective, individual prerequisite and desired alternatives would have to be annotated throughout
the guidelines and specifications. As mentioned in Chapter 2, the evaluation of credits is based
on the acceptance of LEED prerequisite requirements.

83
At this stage in the process the entire building delivery system is evaluated on a set of
performance and cost impacts. For My study the main criteria used for this evaluation are as
follows:
• Environmental factors • Social factors • Building performance factors (energy and water efficiencies) • Health and productivity of workers • Construction costs • Design costs
A simple table indicating whether or not the current system addresses these concerns
provides the basis for the evaluation. The evaluation is based on a pass/fail premise to provide a
global evaluation. Table 3-1 lists sample evaluation checklist.
Global Performance Level
The global performance level is key point in which the decision to pursue or consider more
sustainable practices is often made. For proponents of green design this change seems obvious,
for skeptics this change may seem burdensome and unnecessary. Proponents see building trends
towards green building and scientific and anecdotal persuasive arguments in favor of green
design. These supporters see the holistic and ecological balance that LEED buildings may
contain. They are interested in what final building design has to offer in terms of tenant comfort,
reduced environmental impacts, and reduced energy consumption. Arguments for LEED based
design include the following:
• Better indoor air quality to improve employee productivity • Better indoor air quality improves employees health and well-being • Integrated design processes lowering operating costs • Healthier buildings reduce liability • Best practices produces more predictable outcomes in terms of building performance • Reduced impacts translates to environment and social community benefits • Lessened burden on municipal infrastructure in terms of energy and sewer requirements

84
Those opposed to change typically stand on the sole premise that it is not worth the
additional upfront design and construction costs. They propose these upfront costs impact the
functionality and size of a project. An example of this claim is the total useable square-footage
of building space is often sacrificed in lieu of the increased costs. In addition to the increased
cost arguments those against change also understand the education curve involved throughout the
process to effect change and the amount of effort and resources it takes to educate all those
involved in the process. See Figure 3-2 which details necessary education conduits among
construction participants. Barriers to green design include:
• Lack of life-cycle cost analysis and use • Real and perceived perceptions of increased first costs • Budget separation between construction and operation costs • Divide between building aesthetics, function, operation, and human needs • Too much paperwork to achieve credit approvals and final certification from USGBC • Informal resistance to change from those involved in the building process
This stage is one in which the facilities staff reviews current building practices and
building stock. The staff would then compare current practices with those required by LEED.
The evaluation may be simply reviewing current LEED standards to the local standards. This
evaluation would determine the ‘greenness’ of the local standards. Once this baseline evaluation
has been performed, the next step may be to complete a LEED scorecards for the last five
applicable projects completed to determine the hypothetical point total for these projects. These
totals would provide a snapshot to evaluate the areas for improvement and possible costs
associated with performance improvement. This is similar to the Davis-Langdon approach of
evaluating the non-LEED projects.
Goal Identification and Program Assessment
This stage is one in which the influential and deciding players move beyond the question
of ‘can we do it?’ to developing a path that identifies improvements needed to be made and

85
begin to develop strategic and program assessments. Goal identification discussions need to take
place regarding time tables for change and what type of certification is to be sought regarding
future projects. Key personnel need to identified to champion different aspects of sustainable
impacts and what levels of improved performance will be sought (i.e., water use reduction or
energy reduction). Reviewing data from the Global Performance Level with heads of
departments responsible or in control of possible improvements is a key step. This provides
feedback with regard to possible improvements and an education opportunity to sway decision
makers as to the possible improvements.
It is beneficial at this point to identify the informal and formal barriers to change within the
organization that will resist the process of moving to more sustainable building practices.
Special transition sessions and educational seminars may be needed to ‘win over’ various
individuals and departments within the organization.
Decision to Change
This is the point in which a project is registered with the USGBC and the process of
moving from the existing development process to the more sustainable development process
takes place. Without question this is the most difficult step for an organization or individual with
regards to change. The decision to move from status quo is always difficult within an
organization. Typically the decision is a prescriptive one (Beach and Connolly 2005) which is
based on the assumption that the decision maker will do what is best for the company or
organization. The premise to the decision is that what is best or most favorable has the most
favorable outcome with maximum benefits or limited loses. Decision makers, like those at the
University of Florida chose sustainable construction practices because they perceive the
processes, and final products, to have greater benefits than the previous traditional methods.

86
The next part of the decision process involves cost. Decision makers at the county budget
meeting I mentioned at the beginning of Chapter 2 were concerned project gross square footage
costs would increase as a result of implementing green standards. They were clear that
regardless of benefits or proposed savings initial cost was the factor driving their decision to
change. The level of understanding the benefits of sustainable construction were very low within
this circle of decision makers. They perceived change as a risk that was accompanied by a real
cost that they would have to explain and budget for in the very short term. Once a decision
maker is exposed to the benefits and utility of sustainable design they look toward impacts and
improvements the process has over traditional design. The DMASC model provides both a cost
branch and preference impact branch to allow for various options with regard to both cost and
perceived benefits.
While each project is different in terms of scope and use, the initial evaluation process,
architectural conceptual processes, and various department and committee inputs take place for
all jobs. The sustainable LEED based approach to design benefits from an integrated approach
in which all stakeholders have input to the design and construction process. This is a drastic
change from the traditional linear design approach in which plans are passed from the architect
to the engineer and from the engineer to the contractor and from the contractor to the operations
staff, all in which takes place void of any tenant or community input. See Figure 3-3 and 3-4
which illustrates the differences between traditional and integrated design relationships.
The process of moving from a linear design approach to an integrated one may meet with
some resistance. Strong players from the traditional school may not see the benefits of the
additional inputs, however previously excluded players tend to support the process. The benefits
of including user groups in design decisions have been incorporated in other design based

87
businesses such as automobile manufacturing for years. Designs are often improved with
feedback from those who use, install, support, and maintain equipment that is selected for use in
a project. Compatibility issues, performance tradeoffs (i.e., daylighting strategies), Return-On-
Investment (ROI) strategies, and cost savings may also be addressed during this time. Location
of equipment to minimize installation costs and support ease of maintenance will improve the
overall quality of a job. All of these types of resolutions may be a result of breaking the
traditional model and forcing designers, engineers, and users to discuss the options that meet the
Owner’s overall sustainable design program.
At this point in the decision process the prerequisite standards would be adopted by the
decision makers. The DMASC model provides a no cost constraint for these prerequisites.
However, costs noted for energy modeling and commissioning were included in the UF analysis.
Logical Scoring of Preferences
After the initial decision is made to move from the existing construction program to a more
sustainable program the evaluation of project specific alternatives begins. The following is a
descriptive summary of the logical scoring of preferences (LSP) model. The model is used to
analyze and evaluate sustainable requirements based on LEED for New Construction (NC)
version 2.2. The LSP Method portion of the model is shown in Figure 3-5.
Sustainable Requirements and Parameter Tree
The sustainable requirements and parameter (SRP) tree stage is designed to preliminarily
assign cost impacts and preferences to the selected alternative. In this case the SRP criteria is
composed of the LEED major categories and corresponding alternatives. Owner preferences or
impacts are defined by building performance, environment, social and health. Using the LEED
checklist as the basis for the tree design allows for meaningful comparisons for decision makers
while developing their sustainable building program. Figure 3-6 illustrates how the LEED

88
checklist transfers to the SRP format. At the outset, the SRP tree category nodes are divided by
LEED general categories with applicable prerequisites being labeled R for requirement. Each of
these categories, or nodes, is then broken down into their decomposed individual lower level
subcategories, or nodes or alternatives, based on the following general criteria.
• The decomposition of each general category should account for how (a) the existing program meets the prerequisite and (b) what costs are incurred to develop and meet the new program requirements. These nodes are represented, or labeled, as “R” for requirement, “P” for preference or impact, and “C” for cost.
• Beyond the LEED prerequisite nodes, the SRP model accounts for each individual
alternative. Since these alternatives are not required to achieve LEED certification the corresponding nodes are labeled “P” for preference or impact and “C” for cost. Each node is represented under its unique parent branch and no two sublevel nodes appear under different parent branches.
• A “C” or cost node may be broken down into two or more distinct costs such as “higher
initial cost” for certified woods or impacts or “standard” implying no additional costs compared to traditional methods.
• The decomposition of a “C” or cost node is only to the level they may be generalized based
on the initial project information and budget.
The main goal of decomposition is to allow for an alternative by alternative analysis based
on the owner design program preferences, existing standards, and design and construction first
costs. Current reviews of cost tend to lump all services and construction costs into one overall
percentage increase which leaves newcomers to more sustainable design without the necessary
detailed information to make a sound decision. One point to note that is difficult to gleam from
the initial review is the synergies associated with alternative selection. The model will note
alternatives that have impacts across criteria, synergistic alternatives, to allow for more
comprehensive model output other than simple cost.
The SRP model is based on cost judgments of the user. The simplicity of this model, and
power, is that each user may assign and alter the weights and costs for each alternative. This

89
increases the accuracy based on decision makers’ insights local standards and regional concerns.
Key points are that the overall design tree is based on (1) cost parameters assigned by decision
makers, (2) preference parameters ranked by the decision makers, and (3) cost and preference
parameters that have both cost values and preferences. The associated “R” for requirement, “P”
for preference, and “C” for cost allow for the splitting of the parameter tree into a Preference
Analysis Tree and Cost Analysis Tree using two different models. The “P” for preference node
consists of any combination of the following descriptors: “S” for social, “Env” for
environmental, “E” for building or project efficiencies or performance, and “H” for occupant
health and performance. These initial identifiers are based on regional application and analysis
developed by Eijadi et al (Eijadi, Vaidya et al. 2002). Impact criteria were expanded to account
for tenant health and social relevance. Exemplary alternatives and alternatives falling under
Innovation and Design were not considered for the SRP tree.
Preference Analysis Model
Owners and facility decision makers will have their own set of ideas, goals, and perceived
benefits tied to sustainable design. The preference analysis allows for the LEED alternatives to
be evaluated based on beneficial impacts and how these impacts meet the goals or preference of
decision makers. As stated previously, the purpose is to provide structure and means to evaluate
alternatives beyond simple initial cost.
Multi-attribute Decision Analysis (MADA)
Given the varied nature of the LEED alternatives it was decided to use an Analytic
Hierarchy Process (AHP) approach to evaluate the impacts or outcomes for each alternative.
Falling under the multi-attribute decision analysis (MADA) category of decision making models
(Norris and Marshall 1995), AHP provides methods to evaluate an alternative based on its
relative importance to all other alternatives. Originally developed by Saaty (Saaty 1982) in the

90
early 1980s AHP methodology has been used extensively to evaluate data that contains a mix of
quantitative, non-financial characteristics that take judgment to monetize, and qualitative impacts
that may be impossible or impractical to quantify such as aesthetics or values. AHP formalizes
the process of making pairwise comparisons.
The seminal work describing how MADA techniques may be used in the building industry
to evaluate various decision processes was put together by Norris and Marshall in 1995 for
National Institute of Standards and Technology (NIST) titled “Multiattribute Decision Analysis
Method for Evaluating Buildings and Buildings Systems” (Norris and Marshall 1995). MADA
problems are best suited for a situation involving a finite number of alternatives, in this case
LEED alternatives, measured by two or more relevant attributes, which in this case is their
respective potential performance, environment, social, and health impacts. Other classic
elements of MADA problems define a predetermined set of options to be evaluated, tradeoffs
among attributes, incommensurable units of measure, and the ability to replicate the problem in a
decision matrix noting the same alternatives running down as well as across the top of the
matrix. All of these traits are applicable to the problem facing a decision maker involved in
evaluating LEED alternatives.
It is important to note that MADA type decisions do not seek to quantify certainties and
precision like other statistical means of evaluation. Rather MADA neglects both uncertainty and
imprecision due to the inherent nature of the types of decisions being made (i.e., good versus
bad). AHP does employ various strategies to check for consistency among judgments by
comparing final rankings with either a geometric means method or calculating a consistency
index where applicable (n less than 15) (Saaty 1982). AHP is applicable for rating, screening,

91
and ranking alternatives thus its inclusion in this model. Figure 3-7 illustrates a decision process
regarding LEED alternatives and impacts that may be important for a decision maker.
Analytic Hierarchy Process (AHP) Detail
As noted previously the AHP process is one that allows for a systematic means to evaluate
pairwise comparisons as they relate to certain overriding attributes or impacts. For this decision
model Saaty’s classic intensity of importance scale was utilized(Saaty 1982). Table 3-2 provides
an explanation of the pairwise comparison scale incorporated.
The basic process for determining the end resulting ranking of alternatives is as follows:
• Determine the relevant attributes – in this case building performance, environment, health, and social impacts
• Determine set of alternatives – in this case LEED-NC 2.2 Scorecard • Develop matrices for each attribute • Calculate eigenvalues (relative ranking) values using AHP processes • Perform a consistency check • Apply attribute weighting values (AWV) • Produce preference ranking output
Relevant attributes to be considered are building performance, environment, social, and
tenant health impacts. The alternatives were rated based on the following judgments:
• Building Performance – How does alternative i compare to alternative j based on providing a higher performing building compared to traditional methods or standards? Energy savings and water conservation measures were affirmed. The general impact assessment which influenced judging was as follows (listed in order of importance):
o Energy savings o Water conservation
• Environment – How does alternative i compare to alternative j based on beneficial
environmental impacts, both long-term and short-term? The general impact assessment which influenced judging was as follows (listed in order of importance):
o Emissions/Energy savings

92
o Water conservation o Heat island o Waste reduction o Site selection (one time impact) o Material conservation/practices (one time impact)
• Social – How does alternative i compare to alternative j based on short-term social benefits
of neighboring residents? This may include aesthetic benefits as well as immediate economic benefits such as employment or access. For purposes of this study, long-term benefits of sustainable practices (i.e., tax savings from not building additional infrastructure) were not addressed. For applying a judgment economic impacts were judged slightly more in favor of aesthetic impacts.
• Health – How does alternative i compare to alternative j based on the health and well being
of building occupants? The general impacts assessment which influenced judging was as follows (listed in order of importance):
o Air Quality o Lighting o Thermal comfort
The LEED alternatives were judged using the pairwise comparison scale noted in
Table 3-2. It is important to note that during the scaling phase the LEED alternatives were
looked at independently. For example, although Indoor and Environmental Quality Alternative
8.1: Daylight and Views is typically linked with energy savings and thereby also having an
environmental benefit, it was not considered an environmental benefit because there is no direct
environmental benefit of daylighting per se.
The intensity of importance scores are applied in a matrix of paired comparisons (MPC).
The MPC is the tool that captures the decision makers input with regard to the relative
importance of the model criteria based on the overriding attribute. This model developed four
initial MPC’s focusing on performance, environment, occupant health, and social impacts as the
overriding attributes. For example, if energy savings is the overriding attribute than the LEED
alternative is compared to each other with regard to their role or impact in energy savings. A
score is placed in the matrix with importance of the attribute running down the matrix always

93
compared to the attribute running across the top of the matrix. A key concept with regard to
scoring a matrix is that of reciprocals. For the matrix to be consistent it is given that for any
importance score for an x attribute relative to a y attribute the reciprocal score must be applied to
the y attribute relative to the x attribute. A simple way for think of this concept is that if attribute
x is twice as important that attribute y, then conversely attribute y must be half as important as
attribute x. Another way to view the scaling system in a pairwise matrix is to consider a rating
scale progressing from 1/9th to 9 in relative importance from lowest order of affirmation to
highest order of affirmation
Like comparisons of attributes diagonally across and down a matrix earn the value of 1
since attributes must have equal importance to themselves. The benefit of the concept of
reciprocals is that the matrix may be set up in a software package in such a way that only the top
or bottom have of the matrix needs to be filled out. The DMASC model was developed by the
author using Microsoft Excel.
Once the matrix is complete it is processed to determine the principal vector or eiganvalue
which is a score that normalizes individual comparisons by the column total (sum equals to one),
then sums the normalized individual scores into row totals to determine the final priority weight
or ranking of alternatives. A consistency index may be used for matrices with n less than fifteen
(Saaty 1982). For my study an alternative consistency check method using the geometric mean
of the normalized row totals was incorporated to check eigenvalues. AHP is a powerful to
organize intuitions, preferences, and logic into a formal decision process (Crowe and Noble
1998).
The matrices provided a mathematical means to identify the criteria impacts for each
alternative. The alternatives represented the LEED alternatives listed on the LEED-NC 2.2

94
scorecard. Since the alternatives were judged based on intent individual credit options were not
judged nor were any Innovation and Design alternatives, Prerequisites, or the LEED AP
alternative. Innovation and Design alternatives are project specific alternatives awarded for
exemplary performance or innovation on a project by project case.
Due to the relatively large initial size of the matrices (n=50), and to add precision and
value to the final rankings, second-stage matrices of paired comparisons (MPC) were developed.
These matrices took those alternatives that met an impact threshold relative to the other
alternatives based on the individual matrix attributes.
After the second evaluation was complete the number of alternatives identified under each
performance category was determined to be as follows:
• Building Performance – 15 LEED Alternatives (30%) • Environment – 39 LEED Alternatives (78%) • Social – 12 LEED Alternatives (24%) • Health – 18 LEED Alternatives (36%)
The resulting baseline ranking scores supported the category identifications noted on the
Sustainable Requirement and Parameter (SRP) Tree. This allowed for an applicable criteria
score to be developed for each alternative. The process involved is summarized as follows:
• Based on the full-scale MPCs abbreviated MPCs were developed across all four criteria incorporating those LEED alternatives meeting a minimum threshold impact.
• The abbreviated MPC were re-evaluated following the same AHP processes. • The subsequent LEED alternative preference rankings for the individual criteria were
normalized by dividing each alternative value by the highest ranking criteria value. • An impact matrix was developed to sum the composite score for each LEED alternative. • The composite scores where then ranked in value descending order.
The scores for each MPC were normalized by dividing the each preference ranking by the
highest scoring preference ranking in that column. This provided a basis to rank the scores on

95
their relative impact to the scoring criteria. An alternative composite score was then tabulated by
summing the normalized value across all four criteria. The ranking of normalized composite
score demonstrates the overall balanced impact individual alternatives have across all four
preference criteria relative to each other. This is unique to this model. The outcome at this stage
of the model is a balanced score that evaluates alternatives across criteria, or perceived benefits,
to determine a relative impact of LEED alternatives.
Preference Weighting of LEED Alternatives
Preference weighting of the LEED alternative normalized scores allows a decision maker
to place importance on design outcomes. The traditional construction design follows a series of
steps from programming through preconstruction. During these phases the design team sets
goals to be achieved based on owner demands and feasibility constraints. The weighting of the
balanced impact alternatives allows for an owner to prioritize the LEED alternatives to meet
program performance outcomes or expectations. For example, if an owner is focused on having
a LEED certified building that she may market as a healthier workplace compared to traditional
design then it would be vital to include those alternatives that focus on health of occupants.
Likewise, if an owner is more concerned with building performance, than the identified building
performance alternatives should be emphasized over other non-performance alternatives during
the initial phase of design. The weighting of the normalized scores allows for the owners
preference to influence the hierarchy of alternative rankings.
Preference weights across the four outcome criteria are applied to the initial balanced
weights to provide for a weighted ranking for each alternative. Preference weights are applied as
percentages summing to one across the four criteria. Weights may be applied evenly across all
criteria whereby the initial composite rankings would not change (i.e., 25% applied to each
criteria), or weighted to reflect the owners preference for outcome. The process result is a

96
ranked list of alternatives that takes into account alternative impact, as it relates to outcome, as
well as the decision maker’s program goals. At this point the project team evaluates the
alternatives and assigns each alternative one of the following identifiers:
• Required or building standard (no additional cost to LEED project) • Essential • Optional • Non-applicable The process allows for the alternatives to be evaluated along side their relative ranking. This
provides a context for credit evaluation.
Cost Analysis Model
The cost analysis model is designed to assist project teams at the initial, or program, phase
of a project. The goal of the process is to provide conceptual estimates to allow for relative
comparisons of LEED alternative costs.
Conceptual estimates at the program level are traditionally based on the past experience of
the project team and the type or classification of a building. These numbers typically are linked
to the size of a project in terms of gross square footage (gsf), the project location, and the project
function or complexity. The more difficult or complex a project tends to be reflected in a higher
gsf construction cost compared to a similar less complex project. Since project elements, such as
foundation work or exterior wall construction costs, tend cost the same in terms of percentage of
construction budget across similar functions and design criteria it is common to conceptually
estimate a project based percentages of the overall or construction budget. For example it is
common to estimate site work and substructure for a typical office building at between 3.5% and
5% of the total construction budget.

97
Costing Assumptions and Limitations
The USGBC allows for LEED credit cost estimates to be determined as percentages of a
project’s construction budget. For example the baseline estimate for material costs is determined
by taking a project’s entire contract value for CSI divisions one through 10 and multiplying this
value by 45 percent. My study followed this same type of logic in estimating costs wherever
possible.
Table 3-3 contains a sample breakdown of the first steps in a conceptual estimate. The
percentages would be applied to the construction budget for a typical two story college student
union.
Costing alternatives were applied with the following limitations and assumptions:
• Prerequisites are considered “no cost” as the adoption of these standards was accounted for during the decision to change phase. Regardless, where data was readily available cost estimates are provided.
• The purpose of the costing was to reflect the increase cost of the LEED process over
traditional methods. The numbers reflect the delta between traditional costs and LEED requirements.
• Whenever possible gross square footage and overall construction budget was used for the
basis of estimating cost. • In addition to project budget and gsf information the following alternative specific data
was required as input: o Peak building users o Number of Full-time Employees o Total number of parking spaces o Number of Acres restored or protected o Total square footage of roof area o Project build schedule in months o Wood material cost as a percentage of total material cost o Low-e wood material cost as a percentage of total wood material cost o Whether or not LEED processing and LEED AP duties would be handled “in-
house” (no additional cost). o Whether or not the architect’s fee schedule was adjusted for LEED projects (is
there additional line item costs for LEED projects?).

98
• Alternative options applying to residential construction or building reuse were not considered.
• The following alternatives required project specific information that was impossible to
conceptually estimate and or were not applicable to projects on the University of Florida campus. These alternatives require user input on a project specific basis.
o Sustainable Site Alternative 6.1 – Option 1 and Sustainable Site Alternative 6.2 requiring cost estimates for storm water quantity thresholds compared to existing site. Not applicable for projects at UF.
o Sustainable Site Alternative 7.1 – Option 2 require 50% of parking to be covered. This is not applicable to projects at UF.
o Water Efficiency Alternative 2.2 requires treating 50% of wastewater to be treated onsite to tertiary standards. This is not applicable to projects at UF.
• The model does not consider cost synergies among alternatives. For example a building
that pursues five or more Optimization Energy Performance alternatives may under the same design concept and cost qualify for Thermal Comfort alternatives. It is left up to the user to re-assign these types of additional benefit alternatives as standards or no cost.
• Conceptual estimates are multiplied by plus or minus 25% to allow cost variations such as
inflation, regional differences, or material selection.
The individual cost sheets provide the ability to change applied percentage or material
costs as they relate to specific projects.
Cost Preference Analysis
It is at this point that the information from the preference analysis model and cost analysis
model are combined for an examination of alternative impacts or best fit. The preference
analysis provides a context by which the costs may be examined as they relate to the owner’s
outcome goals. Initial preference identifiers and weighted rankings appear along side cost
estimates for each alternative. Since the intent of the alternative is what was evaluated each
option is given the same preference weight as its parent alternative. Each credit is then re-
evaluated based on initial preference identifiers, cost, and ranking. Alternative identifiers (i.e.,
Standard, Essential, Optional, and Non-applicable) may be revised at this point. This step is
unique to the DMASC model.

99
Ranking of Competitive Systems
After the re-evaluation of alternatives ranking of alternatives may take place. Alternatives
may be sorted by anyone of the following processes:
• Sort by order of alternative identifiers and rankings– Standard, Essential, Optional, and Non-applicable. In this case the Optional credits would be sorted by ranking.
• Sort by order of alternative identifiers, rankings, and cost – Standard, Essential, Optional,
and Non-applicable. In this case those alternatives noted as Optional would be ranked by their ascending cost.
• Sort by ascending alternative cost. This ranking completes the LSP portion of the decision model. The next step involves final
decisions and progress towards creating a more sustainable construction standard.
Decision
The decision phase of the DMASC model allows for the owner and project team to
evaluate the final selection of alternatives to be pursued that best fit their outcome goals, budget
constraints, and desired LEED certification level (i.e., Certified, Silver, Gold, or Platinum).
One of the unique aspects of the LEED process is the fact the registration and certification
cost is not linked to certification level being applied for by the Owner. On one level this means
there is no extra cost burden from the USGBC that influences certification level sought. On
another level the effort involved in the certification process from an alternative submittal process
increases as the number of alternatives sought by the Owner increases.
The decision phase involves an examination of the ranking of alternatives and the final
evaluation of alternative identifiers. At this point any optional alternatives should be assigned to
one of the three remaining alternative identifiers (i.e., Standard, Essential, or Non-applicable)
and a final certification level should be decided upon. Each alternative should be assigned an
alternative champion responsible for successfully ensuring the LEED alternative is achieved and

100
submitted for approval. The cost module provides a conceptual range of cost impacts and the
preference evaluation module compares the final alternatives to the owner’s original weighted
preference rankings.
Transition to More Sustainable Methods
As more buildings are completed and the owner and project teams increase their exposure
to the LEED process a natural trend may develop as to which alternatives are best suited for the
evolving building program. The University of Florida developed a system of alternative
recommendations to aid project teams during the conceptual levels. Those recommended
alternatives that appeared consistently across projects have now become linked to the overall
campus building standards. As such these alternatives are now considered no cost compared to
non-LEED buildings.
Sustainable Building Practices in Operation
At the point most, if not all, of the LEED alternatives that apply to a building program are
intertwined in the building program the need for LEED certification from an impact perspective
is minimal The impacts, costs, and design results of each LEED building would now compared
to proposed and existing building stock. The more sustainable methods adopted into the building
program standard becomes the new current building method and the program evaluation stage is
set to begin again.

101
Figure 3-1. Decision model for assessment of sustainable construction (DMASC)

102
Figure 3-2. Green education conduits among construction participants

103
Figure 3-3. Traditional linear design approach
Figure 3-4. Sustainable integrated design approach

104
Figure 3-5. Logical scoring of preferences method
Figure 3-6. LEED sustainable requirements and parameter (SRP) tree

105
Figure 3-7. An example hierarchy for the problem of selecting the best LEED alternatives
Objective: Select Best Fit LEED
Alternative
Environment Impacts
Building Performance
Impacts
Health Impacts
Social Impacts
First Cost Impacts

106
Table 3-1. Sample existing system global performance evaluation checklist Factor Description Evaluation (Y/N) Environmental
Does current delivery method address limiting negative impacts of construction on building site and associated area?
Yes or No
Social
Does current delivery method address social context of construction, including but not limited to employee access and local economic impact of building location?
Yes or No
Energy and water
Does current delivery method address potential cost savings of energy and water modeling or optimization?
Yes or No
Health and productivity
Does current delivery method address best method of systems installation, worker health during installation, short and long-term effects of product off-gassing, and tenant worker conditions regarding daylighting and temperature and light controls?
Yes or No
Project delivery methods
Does current delivery method address contractor responsibility with regard to waste-management; recycle content and environmental impact of building products, and indoor environmental quality at time of turnover?
Yes or No
Design Costs
Does current delivery method provide an evaluation, in terms of score or grade, of how well the final design has met the overall program intent?
Yes or No

107
Table 3-2. The pairwise comparison scale Intensity Scale Definition Explanation
1 Equal importance of both elements
Two elements contribute equally to the property
3 Weak importance of one element
over another
Experience and judgment slightly favor one element over another
5 Essential or strong importance of
one element over another
Experience and judgment strongly favor one element over another
7 Demonstrated importance of one
element over another
An element is strongly favored and its dominance is demonstrated in practice
9 Absolute importance of one element
over another
The evidence favoring one element over another is of the highest possible order of affirmation.
2, 4, 6, 8 Intermediate values between two
adjacent judgments
Compromise is needed between two judgments
Reciprocals If activity i has one of the preceding numbers assigned to it when compared with activity j, the j has the reciprocal value when compared to i.

108
Table 3-3. Sample applied construction cost percentages for college student union
Remaining contract budget after fees: Substructure: 5.40% Shell - Superstructure: 18.40% Exterior Enclosure: 12.70% Roofing: 2.40% Interiors - Typical Finishes: 21.50% Gypsum on metal stud Cast-in-place stairs 50% Carpet/50% VCT Services - Elevators: 2.60% Plumbing: 2.40% HVAC: 18.10% Fire Protection: 2.00% Electrical: 14.50% Equipment and Furnishings: 0.00% Special Construction: 0.00% Total: 100.00%

109
CHAPTER 4 DECISION MODEL FUNCTIONS
Introduction
This chapter focuses on the use of the Logical Scoring of Preference (LSP) methodology
and the final decision phases of choosing LEED credits and project certification level. The data
presented provides details regarding the processes involved in evaluating and selecting LEED
alternatives.
Preference Analysis Model
Preference weights allow for emphasis placement alternatives as they relate to project
outcomes. Ranking LEED alternatives based on outcome criteria allows project team members
to evaluate credits in a hierarchical fashion as they relate to certification levels. Normalized data
from the outcome specific AHP MC tables is presented in Figure 4-1.
To measure the effect of preference weighting an outcome analysis was performed by
certification level. For this analysis each alternative with an impact score was assigned a value
of one. This allowed for the summation impacts by certification level as preference weights
were applied. To recap from Chapter 3, the total number of impacts is outlined in Table 4-1.
An analysis was conducted by varying the outcome preferences and summing the ranked
alternatives impacts across preference or outcome criteria. For this analysis two input constraints
were applied: four credits assigned to EA Credit 1 Energy – Optimization (EA Credit 1) and one
credit assigned EA Credit 2 – Onsite Renewable Energy.
Several LEED credits had impact scores across three out of four of the preference criteria
(9 out of 50). Figure 4-2 provides a snapshot of the LEED alternatives with synergy scores
totaling three. This credits had a criteria synergy value of three. Others had impacts across two
criteria (16 out of 50), and the several, mostly falling evenly between the environment and health

110
criteria, scored only one criteria (25 out of 50). No alternative had a synergy score of four.
Preference weights are on the Preference Impact Sheet (PIS) as noted in Figure 4-3. For
balanced weights the user may enter 25% for each criterion.
Table 4-2 illustrates the balanced (evenly weighted) distribution of alternatives across the
four evaluation criteria by certification level. This table illustrates the alternatives impacts across
criteria based on a balanced preference impact weight.
Table 4-3 illustrates a performance weighted distribution of credits across the four
evaluation criteria by certification level. The alternatives are weighted 70% Performance, 10%
Environment, 10% Social, and 10% Health. Evenly criteria sum in parenthesis next to weighted
criteria total.
Table 4-4 illustrates an environment weighted distribution of credits across the four
evaluation criteria by certification level. The alternatives are weighted 10% Performance, 70%
Environment, 10% Social, and 10% Health. Evenly criteria sum in parenthesis next to weighted
criteria total.
Table 4-5 illustrates a social weighted distribution of credits across the four evaluation
criteria by certification level. The alternatives are weighted 10% Performance, 10%
Environment, 70% Social, and 10% Health. Evenly criteria sum in parenthesis next to weighted
criteria total.
Table 4-6 illustrates a health weighted distribution of credits across the four evaluation
criteria by certification level. The alternatives are weighted 10% Performance, 10%
Environment, 10% Social, and 70% Health. Evenly criteria sum in parenthesis next to weighted
criteria total.

111
Due to the synergies of credits receiving impact ratings across multiple criteria it is
expected to see a limited fluctuation of credits at the certification level. The greatest changes
occur across the Silver and Gold certification levels. Those credits that receive multiple impacts
tend to fall within the top 20 credits regardless of weighting. Recall nine alternatives received
contributions from three criteria. The added value of this process is the final alternatives are
ranked so that a project team may prioritize the selection of alternatives. This analysis allows a
project team to evaluate their collection of credits to determine, as a whole, whether or not they
are meeting the Owner’s preferences for certification outcomes. It also allows a cross
comparison of any number of buildings across certification levels to compare their respective
impacts. This is unique to this model.
After preference weights are applied, the owner would then evaluate each alternative in the
context of their synergies and ranking. Figure 4-4 illustrates how the owner would select one of
four options to apply to each alternative: Standard (no additional cost compared to traditional
requirements), Essential, Optional, and Non-applicable (NA) for evenly weighted alternatives.
Figure 4-5 displays a portion of the selection table for LEED alternatives with a 70%
Performance weighting. Remaining criteria are assigned 10% each. Figure 4-6 displays the
selection table for LEED alternatives with a 70% Environment weighting. Remaining criteria
are assigned 10% each. Figure 4-7 displays a portion of the selection table for LEED
alternatives with a 70% Social weighting. Remaining criteria are assigned 10% each. Figure 4-8
displays the selection table for LEED alternatives with a 70% Health weighting. Remaining
criteria are assigned 10% each.

112
The LEED alternatives would be given preference identifiers with regard to synergies
associated with alternatives, weighted ranking, and project fit. The owner or project team then
moves to costing individual LEED credits.
Cost Analysis Model
In order to perform initial costing of credits project specific information was entered on
two data request sheets. The first sheet asks for build team information, job budget information,
and project gross square footage as shown in Figure 4-9. The second data sheet requests
information specific to LEED credits as outlined in Figure 4-10. Cells highlighted in white were
input by the user.
After project data and LEED specific data was entered the Scorecard Sheet was accessed.
This sheet has links to each credit takeoff sheet (credit is highlighted in blue) and allows for the
notation of credit status according to current university standards. Three options are given:
standard (no additional cost compared to standard construction), required (all prerequisites are
hard coded required), and not-applicable. These identifiers do not influence criteria preferences
and are solely to aid anyone filling out the scorecard with regard to costs.
Credit or point conceptual estimates of LEED alternatives were conducted. In My study
those credits, including each credit option and exemplary credits, falling within the realm of
possibility for University of Florida campus projects were estimated for cost. Conceptual
estimates were conducted based on very broad terms such as total project budget, total
construction budget, and gross square footage area. Figure 4-11 provides a snapshot of the
LEED scorecard developed. Each sheet is linked to this scorecard for ease of calculations. It is
important to note that costs are based on the existing building standards and local market
conditions. The only information passed through to the preference and cost analyses are the low
and high cost ranges (takeoff plus and minus 25% of estimate). Figure 4-12 provides a sample

113
Cost/Takeoff Sheet for LEED Credits. Sustainable Credit 4.3 Option1 entails providing low-
emitting and fuel efficient vehicles for 3% of the full-time equivalent (FTE) occupants. The
takeoff sheet provides the calculation for the number of vehicles needed to meet credit and cost
premium for each vehicle. UF incorporates the use of electric vehicles that plug into standard
outlets and as such considers this a no-cost credit. This worksheet provides a lump-sum cost for
training staff with regard to re-charging and operation of vehicles. UF does not consider the cost
of the vehicles as construction costs and does not apply costs to the total project budget. As
noted on the sheet the GSA study allows for costs associated with vehicles specific recharging
and the IHS study includes the cost of vehicles to the project and credit.
The scorecard accounts for 106 requirement and credit option takeoff sheets and two sheets
accounting for registration and soft-costs for a total of 108 conceptual estimates. The cost
analysis is designed to allow for takeoffs for each project based on existing standards. The
unique part of this method is the ability for project teams to estimate each credit from project to
project. The resulting data would be used to track trends and utility of credits over time.
Cost Preference Analysis
The cost preference analysis provides for side-by-side comparison of previously
established preferences of ranked credits, low and high conceptual cost estimates, and a final or
revised determination of credit preference (i.e., standard, essential, optional, or non-applicable).
The cost preference sheet allows for a team to evaluate credits with outcome weighted
preferences as guide for prioritizing credit selection. This is unique to this model. Figure 4-13
contains the information used in the revising of preferences.
This cost preferences process is the key to this model. It allows for the identification of
preferences prior to costing, costing of each credit at a conceptual level, and a reconsideration
phase that allows the design team to consider preferences, impacts, and costs.

114
Ranking of Competitive Systems
Ranking of competitive systems is done through the analysis of revised credit identifiers.
Costs are summed and categorized by corresponding individual LEED credit identifiers. Figure
4-14 contains the Cost-Preference Summary output. Summary sheet data is linked to costs and
final credit identifiers. Should a team make changes to any of the individual LEED credit
takeoff sheets or reassign credit identifiers those changes would automatically be reflected on the
summary sheet.
Decision (Selection of Best Alternative)
The selection of best alternative is that which matches cost, preferences to outcome criteria
and certification level. The DMASC approach allows the project team to develop various
scenarios at the conceptual level to address such constraints as owner preferences and limited
budgets.
Transition to More Sustainable Practices (Trend Analysis)
The collection of preference, cost, and credit selection allows for a systematic way to
address making changes to building standards that incorporate LEED goals. The University of
Florida Facilities Planning Division has informally adopted those standards they deem
consistently no-cost from project to project.

115
Figure 4-1. LEED alternatives composite score and ranking
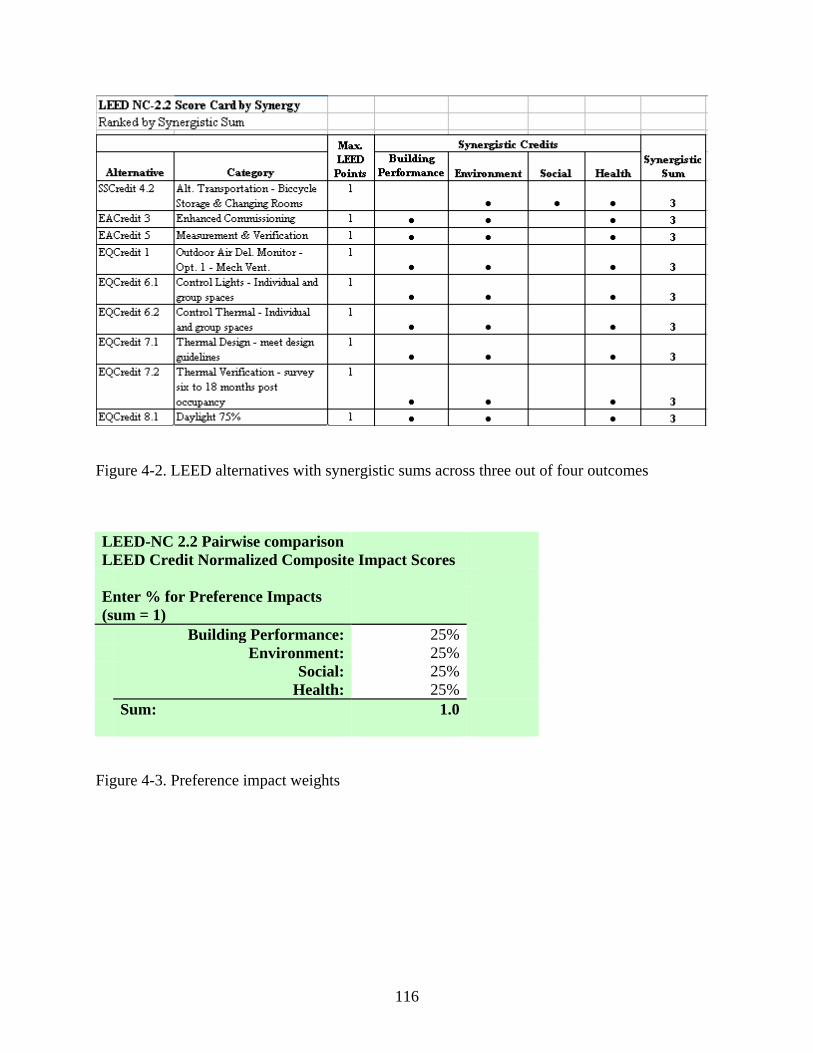
116
Figure 4-2. LEED alternatives with synergistic sums across three out of four outcomes
LEED-NC 2.2 Pairwise comparison LEED Credit Normalized Composite Impact Scores Enter % for Preference Impacts (sum = 1) Building Performance: 25% Environment: 25% Social: 25% Health: 25% Sum: 1.0
Figure 4-3. Preference impact weights

117
Figure 4-4 Initial ranked evaluations of alternatives for evenly weighted alternatives

118
Figure 4-5 Initial ranked evaluations for 70% performance weighted alternatives

119
Figure 4-6 Initial ranked evaluations for 70% environment weighted alternatives

120
Figure 4-7 Initial ranked evaluations for 70% social weighted alternatives

121
Figure 4-8 Initial ranked evaluations for 70% health weighted alternatives

122
Figure 4-9 Project data sheet

123
Figure 4-10. Project/LEED specific data.

124
Figure 4-11. LEED scorecard costing

125
Figure 4-12. Sample LEED credit cost summary/take-off

126
Figure 4-13. Cost preference analysis

127
Figure 4-14. DMASC cost-preference summary sheet

128
Table 4-1. LEED alternatives preference outcomes Preference Outcome Number of LEED alternatives with associated outcomes Performance
15
Environment
39
Social
12
Health 18 Table 4-2. Balanced LEED alternatives (Evenly Distributed) LEED Certification Levels
Outcome Criteria Certified Silver Gold Platinum Building Performance 14 15 15 15
Environment 23 28 32 39
Social 5 9 11 11
Health 9 10 11 17
Table 4-3. Performance weighted LEED alternatives LEED Certification Levels
Outcome Criteria Certified Silver Gold Platinum Building Performance 15 (14) 15 (15) 15 (15) 15 (15)
Environment 23 (23) 28 (28) 32 (32) 39 (39)
Social 4 (5) 9 (9) 11 (11) 11 (11)
Health 9 (9) 10 (10) 11 (11) 17 (17)

129
Table 4-4. Environment weighted LEED alternatives LEED Certification Levels
Outcome Criteria Certified Silver Gold Platinum Building Performance 14 (14) 15 (15) 15 (15) 15 (15)
Environment 23 (23) 30 (28) 36 (32) 39 (39)
Social 3 (5) 9 (9) 9 (11) 12 (11)
Health 9 (9) 9 (10) 9 (11) 17 (17)
Table 4-5. Social weighted LEED alternatives
LEED Certification Levels
Outcome Criteria Certified Silver Gold Platinum Building Performance 11 (14) 14 (15) 15 (15) 15 (15)
Environment 21 (23) 28 (28) 32 (32) 39 (39)
Social 12 (5) 12 (9) 12 (11) 12 (11)
Health 9 (9) 9 (10) 11 (11) 17 (17)

130
Table 4-6. Health weighted LEED alternatives LEED Certification Levels
Outcome Criteria Certified Silver Gold Platinum Building Performance 14 (14) 14 (15) 15 (15) 15 (15)
Environment 20 (23) 21 (28) 27 (32) 38 (39)
Social 3 (5) 4 (9) 8 (11) 12 (11)
Health 12 (9) 18 (10) 18 (11) 18 (17)

131
CHAPTER 5 RESULTS
Model Summary
The Decision Model Assessment for Sustainable Construction (DMASC) is an insightful
and systematic way to evaluate current building standards and LEED alternatives from both a
preference outcome perspective as well as from a project budget perspective. The model
addresses the short-comings in previous studies that seek to determine or apply a universal
percentage across all projects regardless of type of project, local context for standards, or
owners’ objectives for green design.
UF’s No-Cost LEED Certification
As of the spring of 2007 the University of Florida’s Facility and Planning Division (FPD)
has raised its internal project LEED certification goal from certified to silver or from a minimum
of 26 LEED points to 33 LEED points. This is decision is prompted by their understanding that
LEED certified (26 points) is now achieved via no additional project costs. The DMASC model
demonstrates this by identifying all credits UF considers standard as “Standard” and identifying
all remaining credits as “Non-Applicable” on the Cost Preference Analysis Sheet. Figure 5.1
displays sample output for UF’s standard LEED credits totaling 26 points which is the minimum
needed for a base LEED certified rating and seven additional credits selected based on lowest
cost to arrive at a total of 33 credits or the minimum LEED silver certification. UF notes
required credits and standard credits as construction alternatives that would be required or
pursued regardless of seeking a LEED certification. As such the facilities and planning staff do
not consider them additional costs.
The analysis of UF’s “standard only” selected credits illustrates the impact of adopting
LEED principles within current building standards when determining the overall cost impact.

132
The Requirement Costs noted in Table 5.1 consist of energy modeling and fundamental and
enhanced commissioning. The majority of the Standard Costs estimate for waste diversion
which had a cost range of $112 thousand to $187 thousand and Design soft costs that had a range
of $63 thousand to almost $105 thousand. Both these costs are considered no additional costs at
UF. Construct waste diversion is considered a no cost by contractors, partly because of the
recycled value of sorted materials although there is no hard data to support this assumption.
Design fees are not considered for two main contributing reasons: 1) UF requires the design team
to have completed a minimum of two LEED projects, and 2) UF’s design fee is based on curve
that accounts for square footage and complexity of the job. No additional fees are allotted for
LEED design.
Table 5-1 breaks the cost data obtained from the DMASC Summary Sheet, noted in Figure
5.1, into percentages of costs based on certification levels and total associated costs and adjusted
costs which are those costs less the required and standard costs.
UF’s process for selecting LEED credits, as outlined in Chapter 2, involves the initial
review of no-cost or standard credits as they apply to a project and then the evaluation of
moderately cost credits, and then compares the results of both processes with required and
optional certification levels. What this process is lacking is an analysis of user group desired
outcomes.
Sample Output by Preference for Identical Project Data Input
The model was run to demonstrate how credit preference and credit selection influence
overall cost impacts for a project across certification levels. Project data input (i.e. project
budget, construction budget, gross square footage, and LEED specific inputs). Two scenarios
were run with regard to preference and costing credits. First scenario, the “UF Outcome”
scenario, assigned identifiers consistent with UF’s building program used in the “no-cost”

133
scenario above but optional identifiers were applied to credits that may be achieved on projects.
The second scenario was a high and low cost scenario with all identifiers options open to
consideration. This “high-low” scenario assumed there were no existing standards.
UF Based Preference-Cost Analysis
For UF based scenarios the model was run with the following preference weights assigned.
• Evenly weighted (25% across all criteria) • Performance 70% weighted (10% across remaining criteria) • Environment 70% weighted (10% across remaining criteria) • Social 70% weighted (10% across remaining criteria) • Health 70% weighted (10% across remaining criteria)
For each of the UF scenarios credits other than standard and non-applicable were assigned
identifiers based on the following restrictions:
• Based on credit preference rankings the first credits summing to 26 were assigned Essential.
• Based on preference rankings the remaining credits were assigned Optional until 33 points,
LEED Silver rating, was achieved. • Credits not incorporated in the initial 33 credit total were assigned non-applicable. • When given a choice between two options the lowest cost option was selected.
Table 5-2 provides a summation of costs across all five preference weights.
High-Low Cost Analysis
The “High-Low” scenario involved disregarding UF’s standards and solely identifying
credits ranked by cost. Four constraints applied to this analysis. First, four credits were assigned
to Optimize Energy Performance at no cost. Second, the previously defined non-applicable
alternatives on campus still applied (i.e., onsite waste treatment). Third, LEED AP costs were
noted as standard. Fourth, as in previous analyses LEED registration costs were considered
essential as in they would be necessary additional costs to purse a LEED certification. For the

134
low-cost scenario credits were first ranked by low-cost estimate. For credits with more than one
option the selection of the first low-cost option obviously forced the remaining options to non-
applicable status. The high-cost scenario held the same non-applicable constraints however
Optimize Energy Performance was assigned ten credits and associated costs applied. Data was
sorted by cost as a primary condition and evenly weighted ranking as a secondary condition.
The credits were identified as essential for a certified rating and optional for a silver rating and
remaining credits were assigned non-applicable identifiers. The key difference between the low
cost analysis in this scenario and the UF Standard and low-cost estimate noted above is that this
low cost analysis solely based on cost. The previous UF example was first selected based on
standards which may or may not have had an embedded cost.
Table 5-3 contains the cost information associated with both low and high cost evaluations.
For the low-cost scenario the seven credits selected to move from a certified to silver rating had
minimal cost impacts. Same is true for seven credits associated with the high-cost scenario.
Figure 5-2 shows the top “lowest-cost” credits sorted by lowest cost and then evenly
weighted ranking. Figure 5-3 shows the top “highest-cost” credits sorted by highest cost and
then evenly weighted ranking.
The insightful aspect of this model is the ability for design teams to simultaneously
evaluate outcome impacts, preference ranking, and cost on the same sheet. It allows for
discussions regarding design and LEED credits to move from simply point shopping for the
lowest credit to issues centering on applicability for the overall project program. A unique
byproduct of this process is the ability to perform impact profiles for projects based on the LEED
alternatives selected. Outcome impact tallies are a means for providing such insights.

135
Outcome Impacts
Outcome data was summarized to determine the impacts of preference ratings as well as
cost across the sustainable impact criteria. Table 5-4 provides a snapshot of outcome impacts
across all criteria based on preference weights at the LEED Silver certification level for an
identical project.
Case Study
Sample data from a LEED certified medical center on the University of Florida (UF)
campus was used to illustrate the processes associated with the DMASC model. Sample project
specific data was entered into the model as noted in Figures 5-4 and 5-5. Two analyses were
then conducted using this baseline case data. The first represents credit preference weighting
health identifiers at 70 percent and performance, environment, and social identifiers at 10 percent
each. The cost summary noted in Figure 5-6 illustrates the costs associated with achieving a
LEED certified building by selecting the highest ranked 26 credits. The second analysis, as
noted in Figure 5-7, reflects credits chosen for an actual LEED-NC 2.1 certified medical center
on the UF campus.
The results are powerful in two ways. First the results demonstrate how current building
standards and credit selection influence cost estimates. The health weighted analysis indicated
an adjusted cost increase between 2.15% and 3.58%. The sample scorecard data presents an
adjusted cost increase of 0.03% and 0.05% over a traditionally designed building on UF’s
campus. This outcome is somewhat predictable based on UF’s LEED review process that places
an emphasis on low-cost or standard-cost LEED credits. Secondly the results illustrate the role
credit selection has on building outcome criteria. The health weighted study incorporates those
credits which ranked highest on overall composite score. These credits reflect a greater or equal
influence on outcome criteria across all four categories. Noticeably building performance rated

136
11 out of a possible 15 outcome points for the health weighted analysis, while the actual medical
center scorecard data demonstrated only four out of 15 possible points. Additionally the health
weighted analysis tallied 15 out of 18 health outcome points while the sample card tallied nine
out of 18 possible health outcome points.
This case study demonstrates the value of the DMASC for use at the conceptual stages of a
project. Understanding the influence of building standards and credit selection are keys to
determining both first costs and building outcomes.

137
Figure 5-1. UF’s standard only LEED credit project

138
Figure 5-2. Lowest cost credits for UF ranked by low-cost and weighted ranking.

139
Figure 5-3. Highest cost credits for UF ranked by low-cost and weighted ranking.

140
Figure 5-4. Sample medical center project data input.

141
Figure 5-5. Sample medical center LEED specific project data.

142
Figure 5-6. Health weighted certified medical center case study.

143
Figure 5-7. Sample certified medical center scorecard.

144
Table 5-1. UF certified and silver standard and low cost credit breakdown by costs
Table 5-2. Preference weights applied to UF standards and options

145
Table 5-3. Low and high cost conceptual estimates
Table 5-4 Outcome impacts by preference weights with GSF cost ranges

146
CHAPTER 6 CONCLUSIONS
One key to advancing a topic or research field is the ability to provide accurate and
relevant information. Unclear or oversimplified information regarding LEED first costs
continues to be a hurdle for expanded acceptance. It is difficult for experienced builders and
designers to accept statements such as there is no-cost associated with method, material, and
design changes that vary from tradition. The message sounds false to an audience that is
stereotypically resistant to change.
This model serves to explain the nuances of LEED design and how practitioners at the
University of Florida have learned from their experiences. The way in which owners and design
teams approach a LEED project plays a significant role in which credits are selected and why.
Should first costs be of concern it is rather simple to evaluate the credits based on costs. The
uniqueness of this model is that allows owners and project teams to evaluate credit tradeoffs both
in terms of cost and building function.
This model incorporated Analytical Hierarchical Processes (AHP) as means to determine
the LEED alternative impacts. The method of evaluating alternatives against themselves
supported previous studies with regard to identifying outcome categories, but also went beyond
previous studies with the ability to rank alternatives in terms of relative importance. These
impacts scores where then summed to an overall composite score for each credit that provided a
means for ranking credits across four broad sustainable benefits: Building Performance,
Environment, Social, and Occupant Health. By having the user set preference weights for these
four impact criteria the overall alternative composite score was adjusted to reflect the users’
preferences. This enabled LEED alternatives to be ranked in terms of user impact preferences.
This is unique to this model.

147
In addition to the evaluation of alternatives via impacts, each LEED credit option
applicable to the UF building environment was conceptually estimated. These estimates were
broad “back of the envelope” estimates that are the type typically performed at the programming
stage of a project. The key to each of the estimates is the flexibility for which cost percentages
are linked predominately to gross square footage or project budgets. In addition providing a cost
sheet alone is useful in providing a like method to track costs across projects.
A key focus for future studies would be to incorporate this model prospectively as projects
begin in the conceptual stage through final construction. Previous often sited studies have all
been performed retrospectively or theoretically with little or no direct contact with the teams
involved in forming the LEED strategy or tracking costs. Furthermore the model falls
significantly short in capturing two relevant points. One is the lack of ability to capture cost
synergies among credits. Energy optimization, daylighting, and measurement and verifications
are credits that are often used in conjunction. This model does not capture how the synergies
among credits influences design or construction costs. Secondly, return-on-investment or
payback, both in terms of hard and soft costs, is often given as a reason for pursuing green
design. As energy costs and environmental sensitivity continue to trend upward in the state of
Florida the issue of payback will become of greater interest.

148
APPENDIX A LEED PROJECT CHECKLIST
LEED project checklist (USGBC 2007): Sustainable sites 14 Points Prerequisite 1 Construction activity pollution prevention Required Credit 1 Site selection 1 Credit 2 Development and community connectivity 1 Credit 3 Brownfield redevelopment 1 Credit 4.1 Alternative transportation, public transportation access 1 Credit 4.2 Alternative transportation, bicycle storage and
changing rooms 1
Credit 4.3 Alternative transportation, alternative fuel refueling stations
1
Credit 4.4 Alternative transportation, parking capacity 1 Credit 5.1 Site development: protect or restore habitat 1 Credit 5.2 Site development: maximize open space 1 Credit 6.1 Stormwater design: quantity control 1 Credit 6.2 Stormwater design: quality control 1 Credit 7.1 Heat island effect: non-roof 1 Credit 7.2 Heat island effect: roof 1 Credit 8 Light pollution reduction 1 Water efficiency 5 Points Credit 1.1 Water efficient landscaping, reduce by 50% 1 Credit 1.2 Water efficient landscaping, no potable use or no
irrigation 1
Credit 2 Innovative wastewater technologies 1 Credit 3.1 Water use reduction, 20% reduction 1 Credit 3.2 Water use reduction, 30% reduction 1 Energy and atmosphere 17 Points Prerequisite 1 Fundamental building systems commissioning Required Prerequisite 2 Minimum energy performance Required Prerequisite 3 Fundamental refrigerant management Required Credit 1 Optimize energy performance 1-10 Credit 2.1 On-site renewable energy 1-3 Credit 3 Enhanced commissioning 1 Credit 4 Enhanced refrigerant management 1 Credit 5 Measurement and verification 1 Credit 6 Green power 1

149
Materials and resources 13 Points Prerequisite 1 Storage and collection of recyclables Required Credit 1.1 Building reuse, maintain 75% of existing shell 1 Credit 1.2 Building reuse, maintain 100% of shell 1 Credit 1.3 Building reuse, maintain 100% shell and 50% non-shell 1 Credit 2.1 Construction waste management, divert 50% 1 Credit 2.2 Construction waste management, divert 75% 1 Credit 3.1 Resource reuse, specify 5% 1 Credit 3.2 Resource reuse, specify 10% 1 Credit 4.1 Recycled content, specify 10% 1 Credit 4.2 Recycled content, specify 20% 1 Credit 5.1 Local/regional materials, 10% 1 Credit 5.2 Local/regional materials 20% 1 Credit 6 Rapidly renewable materials 1 Credit 7 Certified wood 1
Indoor environmental quality
15 Points Prerequisite 1 Minimum IAQ performance Required Prerequisite 2 Environmental tobacco smoke (ETS) control Required Credit 1 Outdoor air delivery monitoring 1 Credit 2 Increase ventilation 1 Credit 3.1 Construction IAQ management plan, during
construction 1
Credit 3.2 Construction IAQ management plan, before occupancy 1 Credit 4.1 Low-emitting materials, adhesives and sealants 1 Credit 4.2 Low-emitting materials, paints 1 Credit 4.3 Low-emitting materials, carpet 1 Credit 4.4 Low-emitting materials, composite wood 1 Credit 5 Indoor chemical and pollutant source control 1 Credit 6.1 Controllability of systems: Lighting 1 Credit 6.2 Controllability of systems: Thermal Comfort 1 Credit 7.1 Thermal comfort design 1 Credit 7.2 Thermal comfort verification 1 Credit 8.1 Daylight and views, daylight 75% of spaces 1 Credit 8.2 Daylight and views, daylight 90% of spaces 1 Innovation and design process 5 Points Credit 1.1 Innovation in design: Specific title 1 Credit 1.2 Innovation in design: Specific title 1 Credit 1.3 Innovation in design: Specific title 1 Credit 1.4 Innovation in design: Specific title 1 Credit 2 LEED accredited professional 1

150
Project Totals: Certified 26-32 Points Silver 33-38 Points Gold 39-51 Points Platinum 52-69 Points

151
APPENDIX B LEED OVERVIEW
Introduction
The University of Florida (UF) is one of the countries leading institutions with regard to mandating LEED standards for campus wide construction projects. This appendix provides an overview of UF’s sustainable building practices and costs associated with each LEED alternative. The data is based on University of Florida experience, a study conducted for the GSA, and a study conducted for the IHS.
Incorporation of UF Directives and LEED Credit Ratings
UF’s Facilities Planning and Construction (FPC) office has incorporated additional directives into the LEED sustainable matrix to account for items the University chose to emphasize in the design and construction processes. Since these directives are required on all UF projects the for such items is not considered and they are assigned an LEED Cost Value (LCV) of 1. Additionally each LEED credit has been estimated and given an LCV score to facilitate the design process. Cost associated with each credit is descriptively noted under the comments of each credit. Credits are labeled according to the chart listed in Table B-1.
The University of Florida ratings appear in parenthesis following the credit titles in the
next section of this chapter.
LEED Credit Summary
LEED alternatives are summarized following the LEED scorecard outline. Individual alternatives fall under the main category titles of Sustainable Sites (SS), Water Efficiency (WE), Energy and Atmosphere (EA), Materials and Resources (MR), Indoor Environmental Quality (IEQ), and Innovation and Design Process (ID). An overview, brief summation of how the credit relates to existing UF standards, and predicted costs based on the GSA and IHS models and UF’s experiences are given for each credit.
Sustainable Sites (SS)
Land development and construction activities tend to be inherently destructive to native species and habitats. In addition development activity on any given piece of property has potential impacts to surrounding developed infrastructure as well as undeveloped connected land. Sustainable site alternatives address a wide scope of issues from reduced site selection to reduced light pollution. The merits of the individual alternatives may be debated, for example only a select number of sites will qualify for the Brownfield Redevelopment Credit 3, however, taken as a whole these alternatives are designed to reduce the impacts of construction and reduce the amount of negative influence these activities have on the planet.

152
SS FPC Directive Prerequisite 2 – Cultural Resources Protection (Required)
This additional FPC Directive serves as an addendum to the LEED Sustainable Sites Prerequisite 1 noted above and addresses the issues of historical and cultural resources. Projects must meet requirements of the National Historic Preservation Act and memorandum of understanding of division of historic resources.
This is a regulatory requirement at the University of Florida. Compliance is mandatory on
UF campus. This is an example of how local authority may add, but not subtract, to LEED prerequisites so that the designers and builders may work from the same uniform program matrix. No LEED points are associated with this additional owner driven prerequisite. As a mandate this earns an LCV of 1.
SS FPC Directive Prerequisite 3 – Clean Water Protection (Required)
This is another FPC Directive noting the regulatory requirement that projects meet the Clean Water Act (CWA), the Safe Drinking Water Act (SDWA), and all related state and local laws. Again, this directive is regulatory in nature and compliance is mandatory on all campus projects. No LEED points are associated with this additional owner driven prerequisite. As a mandate this earns an LCV of 1.
SS Credit 1 Site Selection (Highly Recommended)
The intent of the sustainable site credit is to avoid the development of environmentally sensitive sites and reduce the impacts of the placement of the building footprint, hardscapes, roads, and parking areas.
There is no additional direct cost associated with this credit. Typically the Owner has
selected a site prior to or in conjunction with the planning phase of a project and property will either meet or fail to meet the set criteria regardless of costs. This credit has an LCV of 1.
SS Credit 2 Urban Redevelopment/Development Density (Recommended)
The intent or purpose of this credit is to promote urban infill. The logic being there is less infrastructure costs and environmental damage associated with urban infill as compared to a pristine green field site. The credit is divided into two options with Option 1 relating to a density factor and Option 2 relating community connectivity and promotion of a more pedestrian friendly development design concept. Proximity is determined by drawing a 1/2 mile radius around the main building entrance on a site map and counting the services within that radius.
As with other site specific credits this does not have a direct additional design or
construction cost. The only soft cost is associated with the LEED submittal which is noted as a separate cost in the LEED evaluation tool. This has an LCV of 1 for projects built on the main campus.

153
SS Credit 3 Brownfield Redevelopment (Conditionally Recommended)
The rational with credit is to rehabilitate sites that have been damaged by environmental contamination, thereby potentially saving an undeveloped site. Key to this credit is to pursue creative financing and government support to contribute to the cost of remediation. Baltimore, Maryland, for example has set up a tax increment financing program where the increase in revenue from completed projects is ear marked to pay for future project cleanup.
As with other site specific credits this does not have a direct additional design or
construction costs. The only soft cost is associated with the LEED submittal which is noted as a separate cost in the LEED evaluation tool. This has an LCV of 1 and should be part of the university’s campus wide goals.
SS Credit 4.1 Alternative Transportation: Public Transportation Access (Highly
Recommended)
The intent behind this credit is to facilitate the use of public transportation by building occupants. Projects have been given support by local authority by having bus stops moved to meet the guidelines of this credit. If tenants are known during the LEED strategy process it may be useful to survey them as to their potential uptake or use by types of public transportation.
Fortunately for projects on the UF campus this credit is readily achievable due to the park-
and-ride focus for use by students. As with other site specific credits this does not have a direct additional design or construction cost. The only soft cost is associated with the LEED submittal which is noted as a separate cost in the LEED evaluation tool. This credit earns an LCV of 1.
SS Credit 4.2 Alternative Transportation: Bicycle Storage and Changing Rooms (Highly
Recommended)
This credit is to support the use of bicycles as means of transportation to and from the site. Bicycle commuting is popular on most US campuses for students and in other cities around the United States, such as Portland, Oregon, as transportation means for professionals. The critique of this credit is that it maybe incorporated in a project where it is doubtful to be utilized by tenants. For example a suburban site in which the prospective tenants have long commutes with little access to bicycle friendly roadways or trails. Requirements consist of two options, one commercial and the other residential.
The bicycle storage portion of this credit is included in most plans of a commercial or
institutional building on UF’s campus. The placement of storage is a design constraint. The additional requirement of having shower and changing facilities is an added cost for most projects. The financial benefits may be in having a healthier staff that incorporates daily exercise in their commute.
The cost driver in this credit for commercial buildings is the estimate of Full-Time
Equivalent (FTE) occupants due to the costs and design requirements for shower and changing facilities. For classroom based buildings on campus this number is relatively low. For laboratory research buildings or administrative staff buildings this number may be significantly

154
higher. The two cost categories associated with this credit are the bike rack costs and showering facilities cost. Bike racks are common requirements for campus buildings and are considered no cost with regards to this credit. Showering facilities are not common in most traditional academic facilities and may be a substantial increase. The cost estimate is based on a design component, a square-footage designation component, and material and construction component. Construction and installation cost for a ten capacity permanent bike rake is approximately $420. The costs associated with Table B-2 are prorated based on this rate. Shower facility costs will vary according to the amount of space allocated, types of finishes, and how the raw space needed for the facilities is calculated in the cost. For this report the raw cost is not considered. Shower facility costs are based on a floor plan of 200 square feet per shower of ceramic tile floor finish with the inclusion of two lockers and one bench per installation. For this report an ADA compliant shower unit was selected which was six times the cost of a non-ADA self-contained unit, $3,350 and $670 respectively. Table B-2 illustrates calculation for thresholds for commercial users.
This credit is dependent on the total number of occupants using the building on a fulltime
basis. In general terms this will be an addition for most university buildings. As such this earns an LCV of between 3 and 5.
SS Credit 4.3 Alternative Transportation: Low Emitting and Fuel Efficient Vehicles
(Recommended)
The intent of this credit is to reduce the negative impacts from automobile use such as exhaust. The benefit of this design consideration is that it allows for current and future flexibility for building occupants. UF’s Facility and Planning division purchased the first electric GEM vehicle for use on campus in 2003.
For the purposes of this credit, low-emitting and fuel-efficient vehicles are defined as
vehicles that are either classified as Zero Emission Vehicles (ZEV) by the California Air Resources Board or have achieved a minimum green score of 40 on the American Council for an Energy Efficient Economy (ACEEE) annual vehicle rating guide. “Preferred parking” refers to the parking spots that are closest to the main entrance of the project (exclusive of spaces designated for handicapped) or parking passes provided at a discounted price.
Building costs associated with this credit are centered mainly on Option 3 due to additional
supply sources and technology associated with alternative-fuel refueling stations. A cost estimate will need to be provided by specialty subcontractor based on the type of alternative fuel and number of spaces needed to meet this credit. The GSA study sites a cost of $16,426 for three electric-vehicle charging stations. Note that Option 2 and 3 are based on parking onsite and not total FTE occupants. Option 3 would earn an LCV of 3. This cost includes associated electrical distribution costs for an underground parking structure. Option 1 costs are not associated with construction and design fees but rather the Owner or tenets choice to purchase low emitting vehicles. Option 2 costs are minor marking and signage costs or discounted parking fees associated with operating costs. Options 1 and 3 would earn an LCV value of 2.

155
SS Credit 4.4 Alternative Transportation: Parking Capacity (Highly Recommended)
The main goal of this credit is to reduce the impacts from single occupancy vehicle use by encouraging ride sharing among occupants. In addition the reduction of impervious surfaces related to parking structures reduces infrastructure and impacts of stormwater runoff. This credit is divided into four options: two non-residential, one residential, and an ‘all’ or either option that involves no new parking.
This credit may be achieved at no cost depending on the project’s location and local
parking conditions. For Rinker Hall on UF’s campus, which was built over part of an existing parking lot, the total number of spaces surrounding the project was actually reduced meeting the requirement for Option 4 – provide no new parking. In each option the credits call for a minimum of parking facilities and have a zero construction cost and potential savings and a LCV 2. SS Credit 5.1 Site Development: Protect or Restore Habitat (Highly Recommended)
This credit promotes the conservation of natural areas and the restoration of impacted areas so to provide local habitat and promote biodiversity. The key to this credit is a primary site survey to identify key natural elements and adopt a master plan outlining the means by which the requirements of this credit will be met. The credit is divided into two options noted for sites that are either greenfields (pristine undeveloped sites) or previously developed.
The design strategy for Option 1 is to minimize the impact of the buildings footprint and
related infrastructure, and the design strategy for Option 2 is to mitigate the pre-existing harm by restoring a portion of the site to its natural state. For Option 1 the General Contractor should be able to perform tasks without any additional costs. Option 2 would be considered part of the landscape costs and no additional costs. Both of these options should be achieved at less than or at no additional costs compared to traditional strategies and earn a LCV value of 2.
SS Credit 5.2 Site Development: Maximize Open Space (Highly Recommended)
This credit is similar to SS Credit 5.1 in that the design team looks to develop a master site plan as the design program progresses. This credit differs from 5.1 in that it centers on a maximizing the amount of open space on a site on the overall site in relationship to the building footprint. There are three options available for this credit depending on the presence of local zoning requirements with additional criteria that apply to any applicable designated option.
This credit promotes stacking of building elements and underground parking to limit the
impact on the building site. This credit falls within the same classifications as the other site specific credits. Where possible it is considered a no cost option but that is given the overall design program considering this credit from the onset of the project and did not attempt to redesign the project specifically to meet this credit. This credit has an LCV of 2.

156
SS Credit 6.1 Stormwater Design: Quantity Control (Recommended)
The purpose of this credit is to limit the amount of stormwater leaving the site and promote onsite infiltration. Credit 6.1 addresses the quantity of water leaving a site while Credit 6.2 addresses the quality of water leaving the site. The strategies involved in dealing with these issues support local recharge and reduce burdens placed on local stormwater infrastructure. In addition there is an option to reduce impacts on local watersheds and aquatic life. This credit consists of two cases, one for existing impervious less than 50% of jobsite for which there are two options, and a second case for existing impervious cover is greater than 50% of the site. There are several strategies that may be incorporated to achieve the criteria listed above. The goal of this point is to design the site to maintain natural water flows, protect those receiving points from excessive silts and contaminates, and promotes onsite infiltration or alternative uses for stormwater.
Several factors go into the costing for this credit. Factors include the level and percentage
of coverage of existing site’s impervious conditions, lot coverage of the new building, the amount of area available for landscape, and existing soil conditions. In addition to these factors there are two extreme differences in how to approach this credit in terms of design and construction costs. One approach would be to reduce the hardscape and turf grasses and replace both with natural plantings and vegetative collection areas to reduce the amount of runoff. This would actually result in a significant cost savings over traditional construction and earn an LCV of 2. The other common design option is include a vegetated or green roof in the overall design program. The additional cost for this option would be the obvious difference in cost between the base case roofing material and the vegetated roof system selected. For this report it is assumed that there would be no additional structural material needed or load considerations for a light-weight vegetative roof system. For My study the comparison is between a base case single-layer (60 mils) ballasted EPDM (ethylene propylene diene terpolymer) and a green roof. The GSA detailed estimate for a 46,150 sf EPDM standard roof installation is $548,421 which translates to $11.88 per sf. A vegetative roof system covering 65% of the roof area, or 30,550, sf consisting of a America Hydratech four inch system along with Hydratech inverted membrane roofing supporting the vegetative roof and the remaining 35% of the roof area being standard EPDM costs $981,542 or $21.27. This is a delta of $9.38 between the two systems given the GSA building design. This cost is somewhat misleading because the true cost difference depends on the amount of coverage that is vegetative. The square footage cost of the Hydratech 4” system and inverted membrane is estimated at $30.00 per sf which would be a delta of $18.12 per sf. For My study the vegetative roof cost will assume to be $30.00 per sf and cost difference will be based on delta between this cost and whatever the current building standard requires.
For designs that incorporate Best Management Practices and natural design controls this
would rate an LCV of 2. For those designs incorporating a vegetative-roof system in all likelihood would develop costs with an LCV of 5 due to the high first cost differential between standard roofs and vegetative roofs.

157
SS Credit 6.2 Stormwater Design: Quality Control (Highly Recommended)
As noted above Credit 6.2 focuses on the quality of water runoff. The criteria defines quality in terms of number of total suspended solids (TSS) removed by water treatment strategies incorporated in the design.
Several design strategies, both natural and mechanical, can be used to address this credit.
Best Management Practices natural design techniques include vegetative roofs, pervious pavements, and grid pavers for alternative surface use and rain gardens and vegetative swales as non-structural techniques.
The cost for this credit is predominantly site related. On a site that has room to incorporate
Best Management Practice (BMP) techniques such as infiltration basins, wetlands, vegetative-filter rows, and retention ponds than this is a low cost item. Should the site be limited and this credit be pursued than mechanical systems such as sand filters and water separators need to be incorporated. Mechanical filtering means raises the cost of this credit significantly. For a point of reference the GSA study calls for a standard DC Sand Filter System to cover a 2-acre impervious runoff at a cost of $75,000. This credit would earn a LCV of 2 for a non-mechanical system and a LCV of 4 for a mechanical system (for a 2-acre impervious area).
SS Credit 7.1 Heat Island Effect: Non-Roof (Highly Recommended)
Heat island effects are caused by heat differences between natural surfaces and man-made developments. These heat effects may have negative impacts to microclimates and human and wildlife habitats. Credit 7.1 focuses on non-roof techniques and Credit 7.2 focuses on roof techniques to limit heat island effects. Credit 7.1 is divided into two options, Option 1 address strategies for hardscapes and Option 2 addresses parking structures. The goal of this credit is to provide or restore natural shade and incorporate high-reflectance material to limit heat gain and retention. Keys to design include substituting high-albedo and vegetative surfaces for traditional constructed surfaces.
One of the keys to this credit is that standard concrete will often meet the credit-standard
0.3 reflectance. An additional key is that the USGBC allows for an average to be used across the entire site so not all materials need to meet the minimum. A hindrance to this credit is that many institutions have prescribed service that is used on all projects such as asphalt paving and parking. Given the flexibility of the credit and availability of light paving materials this credit has an LCV of 2 as a no cost item.
SS Credit 7.2 Heat Island Effect: Roof (Highly Recommended)
Credit 7.2 specifically addresses the use of roofing materials and options that will help reduce the causes of heat island effect. This credit consists of three options that incorporate the use of high albedo products, vegetative roofs, and a combination of both techniques.
This credit outlines options for achieving cooler roof surfaces which in turn promotes
better cooling efficiencies. SRI is calculated according to ASTM E 1980. Reflectance is measured according to ASTM E 903, ASTM E 1918, or ASTM C 1549. Emittance is measured

158
according to ASTM E 408 or ASTM C 1371. Default values will be available in the LEED-NC v2.2 Reference Guide. Product information is available from the Cool Roof Rating Council website at www.coolroofs.org.
The two basic approaches for this credit are to use an Energy Star compliant light colored
roof that meets the requirements for Option 1 or incorporate a vegetative roof for at least 50% of the roof surface and other requirements outlined in Option 2. The most cost effective measure to meet this requirement is Option 1. The GSA report notes the following typical systems to meet this requirement as follows:
• White TPO • White PVC • White EPDM
Option 2 calls for a vegetative roof system. Costs for this option are outlined under Sustainable Site Credit 6.1 and the cost increase for such a system depends on the square footage incorporated in the design and the comparative existing standard of the project being considered.
The use of a light-colored roof membrane to meet the requirement for Option 1 has no
additional costs compared to a standard EPDM roof and is considered to have an LCV of 2. Option 2 designs that incorporate vegetative-roof systems would incur significant cost increases compared to a standard roof. Vegetative-roof systems delta between standard EPDM roof systems is approximately $20.00 per sf. For buildings with roof areas greater than 7,500 sf this would have considerable costs and rate an LCV of 5.
SS Credit 8 Light Pollution Reduction (Highly Recommended)
The rational for this credit is to limit wasted light from leaving the building or site and to reduce the effects this light has on the nocturnal environment. This credit is divided into interior and exterior requirements, both of which must be met to earn the point. The interior requirements provides for two options one of which dictates angles of light and the other types of controls. All projects shall be classified under one of four zones as defined in IESNA RP 33. The zones note the building in terms of its surrounding context such as city or rural.
Design strategies focus on lighting criteria to maintain safe light levels and limiting off-site
and night pollution. Keys to design features include cutoff luminaries and low-angle spotlights. Local code requirements may influence design criteria.
This credit rates an LCV value of 2 being obtained at no additional costs. Partial and full
cutoff exterior luminaries are readily available and cost the same as their non-cutoff counterparts. The only caveat for this credit is for those facilities requiring additional lighting for security purposes. In these cases the applicability and cost for this credit may need to be looked at in greater detail.

159
Water Efficiency (WE)
The water efficiency credits, all highly recommended by UF’s Facilities and Planning Division, focus on reducing or eliminating the use of potable water. The first two points look to reduce or eliminate potable water use for general landscaping, the second credit looks to reduce the amount of potable water used for sewage conveyance, and the last credit looks to reduce overall potable water use throughout the building. There are synergies between Credit 2 (Innovative Wastewater Technologies) and Credit 3 (Water Use Reduction / 20% and 30%). Although the economic impacts in terms of savings are small for an individual project, the ecological benefits to society are great. These techniques may be used to lesson burdens on local water supplies and treatment plants as well as mitigate potential drought impacts.
WE Credit 1.1 Water Efficient Landscaping: Reduce by 50% (Highly Recommended)
This credit was designed to both promote natural landscapes and reduce potable and natural surface and subsurface water for use in landscaping irrigation. This credit, along with the other Water Efficiency credits, looks to reduce the amount of potable water used for functions that do not require potable water (i.e., landscaping, sewer conveyance). The savings are two fold. First there is no need to pay and use infrastructure to supply potable water that is simply going to be used in irrigation or flushed backed to the supply source for re-treatment. Second there are conventional methods at no cost, and other outlying more costly methods, that reduce the overall use of potable water. These methods should be incorporated, or at minimum closely considered, in the building design. Basic design features to achieve this requirement may include plant species factors, irrigation efficiencies, and use of captured rain water or recycled/gray water.
WE Credit 1.2 Water Efficient Landscaping: No Potable Water Use or No Irrigation
(Highly Recommended)
This credit goes a step beyond the 50% reduction in WE Credit 1.1 and requires either that no potable water used in irrigation or no permanent irrigation system be installed on a project site. Design features for this credit tend to limit turf grass and increase the use of native plantings and low-water groundcovers.
Both Credit WE 1.1 and W.2 earn a LCV of 2 and with regard to both cases would result in
cost savings compared to a design standard that incorporates potable water for irrigation. Groundcover and native plants may have slight increase in cost over turf grass but these costs are design and species dependent. This credit may be achieved by a number of individual design features or various features combined. Use of indigenous plants and captured rainwater, or greywater, are examples of two design techniques that may be used individually or combined to meet this credit. Should WE Credit 1.2 be met the project would be awarded two points since this credit exceeds the requirements of its predecessor. The University of Florida campus irrigation is 100% reclaimed water. Campus planners also stress the use of native landscaping throughout the design process.

160
WE Credit 2 Innovative Wastewater Technologies (Highly Recommended)
This credit looks to accomplish the simultaneous goals, the first being to reduce the total wastewater created, secondly reduce the dependency on potable water to convey waste, and thirdly provide an opportunity to recharge local aquifers. This credit is divided into two options, one of which must be met to earn the category point. This credit has received its fair share of attention on the University of Florida campus with the inclusion of the waterless urinal in Rinker Hall. Several building professionals and contractors on campus sought to exclude waterless urinals as a design option to such extent that the first floor urinals were installed as traditional flush valve systems and the second and third floor urinals were plumbed for water should the waterless urinal ‘experiment’ fail. Fortunately the urinals have prevailed and are now the building standard throughout campus saving an estimated 40,000 gallons of water per each installation. Other options for reduction of water include dual flush toilets and low flush toilets. Use of greywater and captured water are also examples of reducing the use of potable water for conveyance.
The main hurdle for this credit is that potable water is still readily available and highly
subsidized and therefore difficult to make a case to pursue this credit based on initial cost for large scale commercial projects. Secondly, efficient fixtures alone typically do not achieve this credit unless self-contained units are utilized. The supply calculations on low-flow fixtures alone tend to push the design need to incorporate stormwater collection or greywater piping to achieve this credit. Waterless urinals have a lower installation cost due to the lack of supply pipes but alone may not be an effective strategy to earn this point.
This credit may be one of the hardest to cost due to variations in design strategies and
feasibility issues associated with this credit. This credit has only been pursed on UF’s campus on one building, the Hub renovation project, and is only achieved on less than 25% of over 100 LEED 2.0 sampled projects. This credit was not pursued on Rinker Hall due to the more stringent requirements of LEED-NC 2.0 that were in effect at the time of submission but cost data from Rinker Hall suggests that the cistern system and associated piping used to capture rain water cost $52,500. This credit earns a moderate cost impact LCV of 4 to address the costs of a rain water harvesting strategy. Other strategies may have greater or lesser costs depending on which strategy is chosen, supply needed, and size of the building.
WE Credit 3.1 Water Use Reduction: 20% (Highly Recommended)
WE Credits 3.1 and 3.2 focuses on the building’s, excluding irrigation, overall potable water consumption and design techniques that will reduce this consumption by 20% and 30% respectively. This credit focuses on reduction of potable water via internal plumbing fixtures. The scope of the credit does not include HVAC equipment and industrial equipment such as dishwashers or laundry facilities. With this narrow scope of internal occupant used plumbing fixtures a 20% reduction if feasible simply by incorporating low-flow fixtures. Low-flow fixtures without sensors do not cost more to purchase or install compared to their traditional counter parts. In some cases, as in the case of waterless urinals, they will cost less than their traditional counter part to install. As such this credit receives an LCV of 2 as a no cost item. The GSA (GSA 2004) recommends design strategies that include the following:

161
• Low-flow lavatory faucets / aerators (rated at 2.0 gallons per minute (gpm) or less) • Ultra-low flow lavatory faucets (rated at 0.5 gpm) • Electronic (infrared) sensors to automatically turn faucets on and off • Low-flow kitchen sinks (rated at 2.0 gpm or less) • Low-flow showerheads (rated at 2.0 gpm or less) Additional strategies recommended include: • Dual flush toilets (1.6/0.8 gallons per flush (gpf)) • Ultra-low flush toilets (1.1 to 1.4 gpf) • Foot pedal controls for lavatories • Low-flow urinals (rated at 0.5 gpf) • Waterless urinals
The GSA achieved reductions of 20% or more on their simulations by incorporating one basic strategy, specifying 0.5 gpm faucets at bathroom lavatories, at no cost.
WE Credit 3.2 Water Use Reduction: 30% (Highly Recommended)
WE Credit 3.2 requires an additional 10% reduction over what is required for WE Credit 3.1. Should this credit be achieved it would earn two points toward LEED certification since it exceed the requirements of its predecessor.
Both Credits WE 3.1 and WE 3.2 have synergies with WE Credit 2 which looks to reduce
potable water use for wastewater conveyance. Savings from WE Credit 2 may be included in the calculations for WE 3.1 and WE 3.2. University of Florida incorporates low-flow fixtures and waterless urinals to address these credits.
The design jump to meet a 30% reduction is significant in that simple switching to low-
flow fixtures alone makes it difficult to achieve such savings. Additional strategies typically need to be incorporated to meet this credit. As with all design credits what is chosen determines the cost basis. The incorporation of waterless urinals may be enough to achieve this credit, along with those used to achieve WE Credit 3.1. Strategies that add costs include stormwater collection, greywater collection, and composting toilets. This credit earns an LCV range of between 2 and 5 depending on the strategies incorporated in the design.
Energy and Atmosphere (EA)
The Energy and Atmosphere credits are heavily weighted in addressing the use and source of energy that is to be consumed on a project. Fourteen of the seventeen available points focus on energy reduction, renewable energy, and green sources of energy. The remaining three points fall across three broad categories, those being additional commissioning, ozone depletion concerns, and measurement and verification systems. The goal of this section is to reduce the amount of energy consumed by a building, verify the building is performing as designed, and reduce or mitigate the impacts of the power that is used.

162
EA Credit 1 Optimize Energy Performance (Highly Recommended)
This credit is based on comparing two sets of building data, one being the baseline data and the other being the final project model. There are three options to consider when evaluating this credit. Each option has different levels of compliance, complications, and costs. Percentage increase in performance of the project model over the baseline model is how the points are determined in Option 1. Options 2 and 3 are prescriptive in nature with various restrictions such as size of building and building location as being potentially influential in achieving the respective points.
For Option 1 there are significant energy and design model considerations. Options 2 and
3 are less costly but the rewards in terms of points are less and the restrictions somewhat greater. One of the goals of this credit is to maximize the coordinated benefits of envelope, lighting, and mechanical systems efficient design to save energy.
The GSA report (GSA 2004) lists three new courthouse scenarios with regard to energy
modeling: First is a one LEED Credit Certified takeoff, second is a three LEED Credit Silver takeoff, and third is a five LEED Credit Gold takeoff. The energy efficiency measures (EEM) for the Certified and Silver takeoffs included the following:
• Reduced lighting power densities to 1.0 watts per square foot incorporating low-power
ballasts at no added costs for materials or design. • Daylight dimming systems at perimeter offices with increased costs for dimmable ballasts,
light sensors, and controls. Daylight sensors estimated at $160.00 each and dimmable ballasts estimated at $150.00 each.
• Occupancy lighting sensors for all enclosed spaces and meeting rooms. Additional costs
for sensing and controls estimated at $160.00 per unit. • The incorporation of premium efficiency pump and air handling unit (AHU) motors.
Premium efficient pumps were estimated at $121.00 per unit and premium AHU motors are estimated at $106.00 per unit.
Estimated energy savings range from 16.9% above ASHRAE performance requirements
for a One-credit Certified takeoff to 25.4% savings for a three-credit Silver takeoff, and to 35.2% savings for five-credit Gold takeoff. Additional EEM techniques used in the Silver and Gold LEED takeoffs include the following:
• Upgrade from GSA standard Modulating Condensing Boilers (MCB) rated at 3,500,000
BTU/h each to four Condensing Boilers (CB) rated at 2,000,000 BTU/h each. Cost premium estimated at $50,000.00 for the courthouse project.
• Upgrade from GSA standard High-efficiency Chillers (HC) with variable frequency drives
to two 325-ton centrifugal chillers. Cost premium for two chillers estimated at $90,000.00.

163
• Variable frequency drive cooling tower fans at no cost premium. • Additional cost premiums to account for ducting and building monitoring for enthalpy heat
recovery units. • Addition of Carbon dioxide (CO2) monitors to adjust fresh air based on occupants in
courtrooms, conference rooms, and other group spaces. Premiums assigned for monitors as well as wiring, system tie-ins, and control programming.
EA Credit 2 On-Site Renewable Energy (Conditionally Recommended)
With the current state of petroleum dependency there is a push among all stakeholders involved in construction, development, and maintenance to seek alternative energy sources. This credit provides an opportunity to be rewarded for such efforts. Although current technology provides limited payback based on large initial costs for renewable systems, the potential for even greater costs for petroleum in the future seem to make these alternatives appealing nonetheless. In addition to reduction for demand these systems offer cleaner alternatives to petroleum based power. Three points are available under this credit.
Renewable energy systems include such non-polluting technologies such as solar, wind,
geothermal, and biomass and bio-gas. This credit is based on percentage of cost savings not necessarily power saved. The University of Florida supports these types of technologies locally.
The difficulty of the credit is achieving the necessary amount of energy based on cost and
the ability to produce enough energy to meet the necessary amounts. Several strategies are available to meet this credit. They include, but are not limited to, the following:
• Photovoltaics • Wind turbines • Solar • Geothermal • Biomass • Biogass
LEED-NC 2.2 reduced the minimum of energy production from 5% to 2.5%. This reduction may make the achievement of this credit more viable. First costs associated with this credit are dependent on the type and size of system to meet the amount of energy desired.
EA Credit 3 Enhanced Commissioning (Highly Recommended)
EA Credit 3 builds upon the commissioning prerequisite by requiring additional processes by the commissioning agent, owner, and design team. The USGBC outlines the requirements for enhanced commissioning as follows:
Keys to successful commissioning include involving the commissioning agent from the
start of the project and by getting buy in from all players in the construction team as to the value

164
and purpose of the additional commissioning requirements. Commissioning allows for a proactive stance with regard to fine tuning a building’s systems.
Commissioning costs are covered in detail under Energy and Atmosphere Fundamental
Building Systems Commissioning Prerequisite 1. The GSA notes complete commissioning costs associated with their extensive program cost runs over one dollar per gsf which resulted in a $0.05/GSF increase in total construction costs. The Portland reported noted under the commissioning prerequisite lists costs between $0.10 - 0.15/GSF of total construction costs as a fee range for total commissioning depending on the complexity of the project. This percentage is used in this reports model. The tasks associated with this credit involve more time upfront during the design process and significant amount of time post occupancy. The size and complexity of the building ultimately determine the commissioning costs, for My study this credit earns an LCV of between 3 and 5. UF’s Facilities and Planning consider this part of their building program and as such rates a zero additional cost. As noted in the under the Energy and Atmosphere Prerequisite 1: Fundamental Building Systems Commissioning discussion this does not mean that this a no cost item. UF’s Facilities and Planning department confirms this cost to be $0.75 per gross square footage. The IHS Study considers this an additional cost based on hourly estimates of work needed to be completed.
EA Credit 4 Enhanced Refrigerant Management (Conditionally Recommended)
The original intent of this credit was to install base building HVAC and fire suppression systems that did not contain HCFC or Halon so as to support and provide early compliance to the Montreal Protocol. This credit now provides two options and an additional requirement. Early critiques of this credit point out that non-HCFC equipment is less efficient than HCFC equipment posing this credit against earlier energy efficiency points. Regardless, existing HCFC based systems would need to show a phase-out plan to non-HCFC systems. Strategies for achieving this credit include natural ventilation and utilizing baseline HVAC systems that have minimal impact on global warming and ozone depletion.
This credit is often criticized due to the fact zero ozone depleting potential systems run less
efficiently than HCFC equipment thus putting it odds with Energy and Atmosphere Credit 1 Optimize Energy Performance. According to the GSA report vapor compression chillers using HFC refrigerants can typically be purchased with minimal or no cost impact compared to HCFC chillers at similar performance/load ratings. This earns an LCV of 2 but does not reflect the potential negative effect with regards to optimizing energy performance.
EA Credit 5 Measurement and Verification (Highly Recommended)
This credit, often referred to as the “Johnson Controls” credit, focuses on developing a real-time energy and performance project specific monitoring system. Similar to enhanced commissioning, EA Credit 5 looks to take a proactive stance to systems monitoring as opposed to waiting for progressive system failure. The additional benefit of this credit is that it allows for a higher level of performance monitoring and subsequent data to compare with pre-construction energy modeling. This allows for a greater feedback loop for designers to critique their models and estimates.

165
The key to this credit is to develop a system that allows for a comparison between actual and expected performance. The system installed would have to provide enough information to make this comparison meaningful. The greatest impact in terms of return-on-investment (ROI) is the ability to monitor performance throughout the lifecycle of the buildings. This information shows the degradation of equipment over time and when it would be most cost effective to replace system components.
The GSA report (GSA 2004) is based on LEED 2.1 and as a result has slightly different
constraints and requirements. Overall, the credit intent and reference standard remains the same. The difficulty with this credit is that the GSA baseline requirements include HVAC and building automation systems (BAS) which meet the necessary requirements for this credit. The GSA cost placed for this credit involves a soft cost of $0.41/GSF which resulted in a $107,058 for the 262,000 gsf new courthouse This credit is based on the complexity of the project, whether or not metering equipment is included in the baseline building, and total gsf of the project, as a result it earns an LCV value of between 3 and 5.
EA Credit 6 Green Power (Conditionally Recommended)
The goal of this credit is to support and encourage the development of renewable energy resources. The power may come from the local provider of grid power but a premium may be added to support the purchase of Green-e certified power source. The University of Florida has supported renewable energy from the local provider, Gainesville Regional Utility (GRU) since 2003. The minimum goal is to purchase at 35% of buildings energy from renewable sources.
The baseline measurement for achieving 35% is from the calculations performed for EA
Credit 1. Although Green-e provided details for green sources of power the contract with a local supplier does not have to be certified by Green-e as long as the source meets the technical requirements of the Green-e program. Forms of green power proof include renewable energy certificates (RECs), tradable renewable certificates (TRCs) and green tags.
The GSA study reports premiums ranging from 1.25 to 2.5 cents / kWh for most purchase
contracts depending on location and availability. Costs drop as contract amounts increase. Cost ranges for the courthouse in the GSA study demonstrated costs between $24,000 and $32,000, depending on the energy model used in the calculations. The following lists green power availability, premiums, and years made available in the state of Florida.
• FL City of Tallahassee/Sterling Planet Green for You biomass, PV 2002 1.6¢/kWh • FL City of Tallahassee/Sterling Planet Green for You PV only 2002 11.6¢/kWh • FL Florida Power and Light / Green Mountain Energy Sunshine Energy biomass, wind, PV
2004 0.975¢/kWh • FL Gainesville Regional Utilities GRUgreen Energy landfill gas, wind, PV 2003 2.0¢/kWh
166
• FL Keys Energy Services / Sterling Planet GO GREEN: USA Green wind, biomass,PV 2004 1.60¢/kWh
• FL Keys Energy Services / Sterling Planet GO GREEN: Florida Ever Green solar hot
water, PV, biomass 2004 2.75¢/kWh • FL Tampa Electric Company (TECO) Tampa Electric's Renewable Energy Program PV,
landfill gas, biomass co-firing 2000 5.0¢/kWh
The cost for this credit, as demonstrated in the GSA example, is dependent on the size and efficiency of the project. UF’s contracts have been consistently at 2.0 cents per kWh. With the broad assumption that most buildings on a university campus are less than 262,000 gsf this credit earns an LCV of 3.
Materials and Resources (MR)
Materials and Resource credits focus on reusing parts of an existing building for a renovation project, construction waste management to reduce landfill burden, recycle content of new building material, and regional and renewable building products. The synergies for these credits work together most efficiently in dense urban or municipal areas that have recycling infrastructure and building product manufacturing. The critique of these credits is that some areas do not have the infrastructure to accept recyclable material in the form of diverted waste. In addition some projects may have limited access to local and regional materials that match the design program that will meet the minimum cost ratio to achieve points. Overall the goal of these credits is to support and enact change that will look to divert waste and increase the recycling process within communities and the construction industry. The majority, if not all, of the points available under this category are influenced solely or partly by the General Contractor responsible for overseeing the project in its entirety.
MR Credit 1.1 Building Reuse: Maintain 75% of Existing Walls, Floors, and Roof
(Conditionally Recommended)
One of the basic tenants of conservation is to not build at all. This credit serves to provide opportunity to earn credits for renovation projects that reuse existing building stock. Additional benefits sited for these points are to preserve cultural resources and preserve existing neighborhood scale and character. MR Credit 1.1 relates to preserving 75% of the building structural elements while MR credit 1.2 relates to preserving 95% of the defined required elements, and MR credit 1.3 allows for a point for preserving 50% of interior non-structural elements. MR credit 1.3 may be achieved without complying with MR Credit 1.1 or 1.2.
There is typical community support for keeping existing building stock in historic and
community supported building centers.

167
MR Credit 1.2 Building Reuse: Maintain 95% of Existing Walls, Floors, and Roof (Conditionally Recommended)
Projects that meet the requirements for ME Credit 1.2 receive the point for ME Credit 1.1 as well.
MR Credit 1.3 Building Reuse: Maintain 50% of Interior Non-Structural elements
(Conditionally Recommended)
This credit is independent of MR Credit 1.1 and 1.2 and serves to allow a point for reusing exiting non-structural elements such as interior walls and floor coverings. This credit is based on square footage of the completed project including any additions. This credit serves to reduce the amount of waste produced from renovations and changes to existing floor plans. The key to this credit is the percentage is based on the final project’s square footage.
Material and Resources (MR) Credits 1.1 through 1.3 are difficult to estimate and are
highly project specific but in most cases they will not be an additional cost compared to new construction on a green site or demolition and rebuild on an existing site. One point to note with regard to these credits is that if the threshold for use is not met, any material incorporated in a new design may qualify to be counted in the waste diversion calculations (e.g., MR Credits 3.1 and 3.2) since it was essentially diverted by virtue of being incorporated in the new design.
MR Credit 2.1 Construction Waste Management: Divert 50% from Disposal
(Recommended)
Construction waste accounts for over 40% of landfill deposits. While only a fraction of this amount accounts for new construction, approximately six percent, this credit seeks to reduce construction waste leaving a jobsite by 50% while MR Credit 2.2 requires 75% of the waste leaving a jobsite be sent for recycling or salvage.
MR Credit 2.2 Construction Waste Management: Divert 75% from Disposal
(Recommended)
Both credit MR 2.1 and 2.2 are highly dependent on both the commitment of the General Contractor and the availability of landfill alternatives. In general it is agreed that wood, plastic, and steel products may be recycled at no cost or slight profit. All other materials are highly dependent on alternatives and options with regard to secondary use or even acceptance by original supplier to accept returned waste product.
MR Credit 2.1 and 2.2 are determined by either weight or volume however the select
method must be used consistently throughout the job. Detailed recordkeeping is essential to prove the claimed amount recycled. Strategies noted for this credit include recycling cardboard, metal, brick, acoustical tile, concrete, plastic, glass, gypsum wallboard, and insulation. The material can either be divided onsite or sent offsite to be separated. A key for success is to develop goals and a diversion plan early on in the design process and modify as needed to reach decided goal.

168
The cost range for these two credits will vary based on the size of the project, the waste divergence goal, the site location and associated local dumping costs, and the experience of both the design and construction teams. There are two important factors that determine whether these credits should be pursued. The first is the jobsite logistics and if there is room for staging multiple receptors for waste. If there is not enough room for multiple bins and there is no option for sorting trash offsite than this credit becomes unobtainable. The second is whether or not there are local institutions available to receive the sorted waste. An example of this is the collection and recycling of gypsum material at Rinker Hall on the UF campus. The general contractor had to pay a premium for the gypsum supplier to accept the waste and transfer it back to the plant over 100 miles away.
The GSA notes that a waste management plan is a team effort with several necessary steps
to ensure an effective plan. Figure B-1 illustrates the necessary steps of a successful waste management plan.
Costs for CWM plans vary by size of jobsite, types of materials being recycled, local
tipping fees, regional recycling, and standard practices of the contractors working on the job. The city of Seattle and its respective county, King County, issued a contractors guide to recycling in 2002 (Venture 2002). This report provides worksheets and sample specifications that may be used in developing a CWM plan.
The LCV for this credit ranges from 2 to 4 depending the experience of the
design/construction team, materials to be diverted, dumping fees, and any associated waste management fee. The GSA estimates $0.12/GSF for the courthouse project for a total cost of $31,658 as the high-end markup to subsidize a CWM plan to achieve the 50 percent level of waste diversion. To achieve the 75 percent diversion rate the GSA model adds a lump sum $20,000 to handle additional sorting and administration fees. This number is not substantiated in any way and the report does provide the caveat that this percentage may be reached at no additional cost depending on the types of materials diverted and ease of separation. This number would raise the GSF estimate by $0.08 to a total of $0.20 GSF to achieve MR Credit 2.2.
MR Credit 3.1 Materials Reuse: 5% (Conditionally Recommended)
This goal of this credit is to reuse building products to reduce the demand for new products and reduce the impacts of all the manufacturing processes that support new products. The difficulty in attaining this credit is two-fold. Firstly, the desired product must be readily available for reuse and secondly the cost is determined by cost of products in relationship to the entire project budget. MR Credit 3.1 is for a 5% Reuse percentage compared to the overall budget and MR Credit 3.2 is for 10% Reuse ratio. The credit is defined as follows:
• Use salvaged, refurbished or reused materials such that the sum of these materials
constitutes at least 5%, based on cost, of the total value of materials on the project. • Mechanical, electrical and plumbing components and specialty items such as elevators and
equipment shall not be included in this calculation. Only include materials permanently

169
installed in the project. Furniture may be included, providing it is included consistently in MR Credits 3–7.
Cost basis for this credit is covered under the MR Credit 3.2 Materials Reuse: 10% credit.
MR Credit 3.2 Materials Reuse: 10% (Conditionally Recommended)
The requirements for this credit match those of MR Credit 3.1 except for the increase in percentage from five to 10 percent relative to the cost of the entire project. Should this credit be achieved the project would be awarded two points, one for meeting the requirements for MR Credit 3.1 and the additional point for meeting the requirement for MR Credit 3.2.
This credit is difficult to achieve in large scale construction projects like those found on
university campuses. It may be viable for small buildings that present opportunities to used salvaged material. The USGBC does not include reused items from the original site in these cases thus making it even more difficult to achieve this credit. The only way to determine this credit is to calculate the value of the salvaged material versus the total value of material used on a project. The USGBC allows the use of 45% material factor, less MEP, labor, and equipment, to be applied to the entire construction contract to estimate the total dollar value of all the material contained in a job. For general estimating this will earn an LCV of 5.
MR Credit 4.1 Recycled Content: 10% (post-consumer + ½ pre-consumer) (Highly
Recommended)
This credit is directly supportive of the USGBC’s stated goal of market transformation. Their goal was to increase demand for products with recycled content such that corresponding supplies should increase. For the most part this has occurred with products such as carpets and flooring. The benefit of increased recycle content is to reduce the burden or demand for virgin materials and reduce waste.
This, similar to other credits with ratio requirements, it best achieved by developing a
project based goal and continuously monitoring progress as the job buyout and subcontractors are signed to the project. Credit MR 4.2 raises this requirement from 10% to 20%. Cost basis for this credit will be addressed under MR Credit 4.2 Recycled Content: 20% credit.
MR Credit 4.2 Recycled Content: 20% (post-consumer + ½ pre-consumer)
(Recommended)
As noted above this credit raises the recycled content requirement to 20% based on total materials cost. At this level it may be necessary to view the project from holistic view and consider recycled content for products that may not be readily obvious. The credit is outlined as follows:
• Use materials with recycled content such that the sum of post-consumer recycled content
plus one-half of the pre-consumer content constitutes an additional 10% beyond MR Credit 4.1 (total of 20%, based on cost) of the total value of the materials in the project.

170
• The recycled content value of a material assembly shall be determined by weight. The recycled fraction of the assembly is then multiplied by the cost of assembly to determine the recycled content value. Mechanical, electrical and plumbing components and specialty items such as elevators shall not be included in this calculation. Only include materials permanently installed in the project. Furniture may be included, providing it is included consistently in MR Credits 3–7.
• Recycled content shall be defined in accordance with the International Organization of
Standards document, ISO 14021—Environmental labels and declarations—Self-declared environmental claims (Type II environmental labeling).
• Post-consumer material is defined as waste material generated by households or by
commercial, industrial and institutional facilities in their role as end-users of the product, which can no longer be used for its intended purpose.
• Pre-consumer material is defined as material diverted from the waste stream during the
manufacturing process. Excluded is reutilization of materials such as rework, regrind or scrap generated in a process and capable of being reclaimed within the same process that generated it.
The crucial influencing factors with MR Credit 4.1 and 4.2 is the ratios are based on cost
which involve items from several divisions and across several trades and only applies to the dollar value of the portion of the material that is recycled not the entire dollar value of the whole material. For example concrete consists of Portland cement, large aggregate, fine aggregate, water, and additive mixtures in various amounts depending on the design strength and purpose of the concrete. If fly ash is used as replacement for Portland cement then only the value of the cement replaced, based on the cost times the weight ratio relative to the total weight of concrete, is calculated not the entire value of the placed concrete.
The GSA model notes a zero cost for MR-4.1: Recycled Content, 5% due to the types of
structures and materials used facilitates the use of high recycled products, specifically steel and concrete. This credit earns an LCV of 2. To achieve the minimum recycled content of 10% for the MR-4.2 credit, the GSA study gives a range of no cost to moderate cost. The high-end cost scenario assumes a lower percent recycled content for steel and the need to incorporate additional building products in the calculation. The sole cost driver being the need to pay additional shipping for 90% synthetic gypsum board that is made at only a limited number of plants in the United States (US). Synthetic gypsum is made from byproducts of other manufacturing process as opposed to natural gypsum that is mined. There is no cost difference between the synthetic and natural products. The additional figure to cover shipping for higher recycled content material is noted as $0.30/GSF or $79,331 for the courthouse project.
MR Credit 5.1 Regional Materials: 10% Extracted, Processed and Manufactured
Regionally (Highly Recommended)
This credit is similar to several of those in this category in that its main influence is to enact market change and support sustainability in a broader social and economic scale. By

171
supporting local processes the project provides monetary payback to the local citizenry involved in producing the goods. In addition there is the benefit and savings of limited transportation costs and corresponding impacts to the environment. This credit is based on the cost of the material value used in the product. Cost basis for this credit will be addressed under MR Credit 5.2: Regional Materials: 20% Extracted, Processed, and Manufactured Regionally.
MR Credit 5.2 Regional Materials: 20% Extracted, Processed and Manufactured
Regionally (Recommended)
This credit has been substantially reduced from the previous 50% requirement noted in LEED 2.1. Similar to previous credits that increase the required percentage this credit would provide both a point for meeting MR Credit 5.1 and MR Credit 5.2. The first step is to determine the total material costs on site. If this is unknown it is acceptable to estimate this value as 45% of the contract price. The second step is to determine the acquisition distance of the products used on site. The third step is to determine the value of the regional materials used to produce these products.
As noted previously the GSA report was based on LEED 2.1 which set the requirements
for MR-5.1 at 20% and MR-5.2 at 50%. LEED 2.2 currently lists the requirement levels for MR-5.1 at 10% and MR 5.2 at 20%. This credit has changed also in that LEED 2.1 counted the entire value of a product if it was assembled within 500 miles of the jobsite regardless of the origin of the parts whereas LEED 2.2 considers only the value of the materials produced locally in determining the final percentage. The estimating of LCV scores is highly dependent on the location of the job and the materials selected for construction. The predominate exterior walls on the UF campus are redbrick and the predominant structural elements are steel and concrete, all of which are produced with 500 miles of campus. The main influencing factors for this credit are those materials which makeup the lion share of construction material costs. Should the job incorporate traditional high value materials and if these materials are available within the 500 mile limit then the additional costs should be minimal to achieve these credits.
Sample big ticket items noted in the GSA report include the following (GSA 2004):
• Cast-in-place concrete • Structural steel • Stone/Brick • Precast concrete panels • Concrete masonry units • Gypsum wall board • Acoustical ceiling tiles These credits receive an LCV of between 1 and 5 depending on the job location and construction materials incorporated in design.

172
MR Credit 6 Rapidly Renewable Materials (Conditionally Recommended)
This is another credit which serves to aid market transformation and support the use of rapidly renewable resources as alternatives to traditional elements. An often cited example is the use of bamboo flooring in lieu of hardwood flooring. Bamboo reaches full growth in approximately five years whereas oak trees may take 20 years or more to reach full growth. By using renewable resources with allow for increased production without long-term impacts. This credit is also based on cost of material compared to total project material costs.
Not all renewable products are suited for all commercial applications and caution needs to
be taken in the design process to ensure reliability and long-term integrity of products selected. Sample of rapidly renewable materials include the following:
• Cork flooring • Linoleum flooring • Agrifiber substrates used in casework and partitions • Bamboo flooring • Wool/Natural fiber carpets
The USGBC has cut in half the minimum percentage necessary to achieve this credit from 5% to 2.5% with the revisions that took place in LEED 2.2. The GSA study did not pursue this credit at the 5% level due to the difficulty in achieving this credit on mid- to large-scale projects. This is an extremely difficult credit to achieve with only seven out of 111 or 6.3% of LEED 2.0 projects achieving this credit. UF has only applied for this credit on the Library West renovation and expansion project. This credit is dependent on the amount, type, and differential cost between traditional construction materials and rapidly renewable materials. As such it earns an LCV of between 2 and 5.
MR Credit 7 Certified Wood (Recommended)
The goal of this credit is to increase market demand for wood harvested from environmentally responsible forest managers that follow Forest Stewardship Council (FSC) guidelines. The FSC produces guidelines and criteria that wood harvesters and producers subscribe to in their daily operations. This credit applies to wood products permanently installed in the project. A common critique of this point is that for a building that does not incorporate structural or supporting wood products a single wood door purchased from a responsible manufacturer would qualify for a point should it be the only wood door in the design scheme. In defense of this point, more and more certified wood products are now available from suppliers at lower costs. The difficulty of this credit at times may be the education of the contractors on the job, tracking points of origin, and determining the correct percentages based on cost.
Costs for certified wood products have continued to decrease in the last ten years and the
price for FSC certified standard dimensional lumber is now equivalent to non-FSC certified lumber (Depot 2007). Millstead Corporation is the sole supplier of wood products for the Home Deport retail chain and reports that over 90% of its wood products are from old growth managed production sites in North America (Depot 2007) and FSC products are given preference and

173
produced when feasible. The difficulty in rating this credit is that buildings will vary in the amount and type of wood used in construction. Additionally a requirement for this credit includes non-rented temporary shoring and bracing. For standard construction products this earns an LCV credit of 2 however for projects with large amounts of specialty lumber this credit could have an LCV range of between 2 and 5. The GSA courthouse study determined a cost impact of $2.28/GSF for a total of $596,597. The majority of these costs, $395,394 worth or 66.3%, came from “Fixed Furnishings and Casework” and Judges’ chambers “Fixed Furnishings” associated with courtroom construction.
Indoor Environmental Quality (EQ)
Indoor Environmental Quality credits focus on increased ventilation and prescribed standards for Indoor Air Quality (IAQ), reduction of material off-gassing, occupant control over heating and lighting systems, and connecting indoor spaces with outdoor spaces by building upon a biophillia based premises. As with all credits there are those which may be readily achieved, like providing an on and off lighting switch for building occupants to have control of their workspace, and credits that may be difficult to achieve such as daylight and views for 90% of regularly occupied spaces for occupants, however the goals of this category are to provide a better working environment for employees than traditional design schemes and guidelines.
EQ Credit 1 Outdoor Air Delivery Method (Conditionally Recommended)
This credit provides two options, one for mechanically ventilated spaces and one for naturally-ventilated spaces. The purpose of this credit serves to provide constant CO2 monitoring to ensure proper and safe levels of air quality within the building space.
This credit requires that the system in place be either self correcting or provide a
mechanism to alarm tenants of possible air quality deficiencies. The inclusion of this credit may be heavily influenced by the number of building occupants and the type of work or processes taking place onsite.
There are two keys to this credit. One is that the credit does not require the CO2 sensors be
tied to outside ventilation damper to adjust flow of outside air for optimization. The second is that it does not require a CO2 sensor in every room. Sensors should be placed in large meeting areas, common rooms, and rooms that are most distant from air handling equipment. The GSA study lists 60 sensors (including tie-ins to BMS) at $1,080.00 each for a total cost of $64,800.00 or $0.25/GSF. This study yields a sensor per every 4,365/GSF as a benchmark for determining the number of sensors. This credit earns an LCV of between 2 and 5 depending on the size of the project and the number of CO2 monitors required.
EQ Credit 2 Increased Ventilation (Conditionally Recommended)
This credit demands additional outdoor ventilation provided over standard inclusion rates set forth in this category’s Prerequisite 1 Minimum IAQ performance. The critique for this credit is that conforming design systems usually require more energy and as such this credit competes with reduced energy credits noted in the Energy and Atmosphere category. The credit

174
is divided into two options, one for mechanically ventilated spaces and one for naturally ventilated spaces.
Several strategies may be incorporated to meet this goal. For mechanically ventilated
space heat recovery systems may be utilized to lesson energy costs. The GSA report states that a well designed building should meet this credit with not additional construction costs. The only caveat associated with this cost is the learning curve associated with performing and documenting Air Diffusion Performance Index (ADPI) calculations for submittal with LEED documents.
The GSA report provides an overview of this credit and states that although APDI
calculations are not typically performed for an HVAC submittal the calculation process typically verifies the existing design and does not require any significant changes. The APDI calculation process is more of a means of verifying and refining the initial design. This earns an LCV of 2.
EQ Credit 3.1 Construction IAQ Management Plan: During Construction (Highly
Recommended)
Achieving this credit falls squarely on the shoulders of the general contractor and mechanical contractor to produce and stick with a construction plan that meets the stated requirement. There are synergies with regard to this credit with EQ Credit 3.2 Construction IAQ Management Plan: Before Occupancy and EQ Credit 5 Indoor Chemical and Pollutant Source Control. As a requirement for achieving this credit, all absorptive materials must be protected. This is where the control and oversight of the general contractor is required. The sequencing of material installation is also a key in limiting the costs of temporary protection and possibility of contamination.
The costs associated with this credit will greatly be determined by the differences between
standards and the credit requirements. A low-cost example may be that the contractor currently follows SMACNA guidelines and will only add the cost of MERV 8 filters throughout the job duration. A high-cost example would be a contractor unfamiliar with the guidelines that adds additional labor and management to oversee and document the SMACNA process as well as additional materials.
The GSA study provides a range costs starting with a low-cost estimate of $8,519.00, or
$0.03/GSF, to a high-cost estimate of $45,452.00, or $0.17/GSF to achieve this credit. Based on this information this credit receives a LCV of between 3 and 5 depending on the size of the building.
EQ Credit 3.2 Construction IAQ Management Plan: Before Occupancy (Highly
Recommended)
This credit addresses the state of the building after construction completion and prior to or immediately upon occupancy of the building. The purpose of this credit is flush out the higher levels of off gassing associated with newly completed construction. Paints, adhesives, and carpets are all associated with detrimental elements that in high concentrations could negatively affect tenants. This credit provides two options, one of which is flushing the building with

175
specified quantities of outside air and the other is a prescribed Environmental Protection Agency provision to prove the quality of the air. This credit falls at a very busy and difficult time during the construction process and special attention must be paid to ensure proper documentation to meet the specifics and intent of the credit.
The difficulty with this credit is that for Option 1 there can be no punch-list work taking
place that involves VOC emitting toxins and since the HVAC system will be running in flush mode there can be no HVAC balancing work done at this time. Other commissioning activities such as fire alarm testing, lighting controls, conveying system testing, and communication system testing may take place at this time. If this time is set aside during the original construction schedule and allowable testing takes place in conjunction with the flush-out then there should be no additional costs. However, if this option is considered a separate activity specifically designated to achieve this credit then there would be a general conditions costs incurred by the contractor for time and personnel to oversee the flush-out process. Similarly, if Option two is selected there would be additional testing costs associated with testing and verifying results. Regardless of which option is selected the filters associated with all HVAC equipment would be cleaned or replaced at the end of the flush-out period. It is generalized that the testing requirements and general conditions costs would be similar and the additional costs would be associated with the filter replacements. The GSA study estimates $21,330, or $0.08/GSF, to cover contractor premiums and filter replacements for Option one. This earns an LCV score of 3.
EQ Credit 4.1 Low-Emitting Materials: Adhesives and Sealants (Highly Recommended)
EQ Credit 4 Low Emitting Materials defines acceptable levels of off gassing for common building elements such as adhesives, paints, carpets, and composite wood products. Each of these product groups have their own set of standards or associated trade requirements to help select designated acceptable materials. The overall applicability of products is designated as those products installed with the weatherproofing barrier. Exterior paints and the like are excluded from the credit requirements. A key to achieving all points associated with EQ Credit 4 Low-Emitting Materials is to include the requirements for low VOC products within the projects specifications and in all related construction documents. Common products for inclusion are noted as flooring adhesives, fire-stopping sealants, caulking, duct sealants and mastic, and plumbing adhesives. The costs associated with this credit will be discussed under EQ Credit 4.4 Low Emitting Materials: Composite Woods.
EQ Credit 4.2 Low-Emitting Materials: Paints and Coatings (Highly Recommended)
As with all points available under EQ Credit 4 Low-Emitting Materials the object of the category is to reduce or limit the quantity of indoor air contaminants that are irritating or harmful to builders and occupants. The costs associated with this credit will be discussed under EQ Credit 4.4 Low Emitting Materials: Composite Woods.
EQ Credit 4.3 Low-Emitting Materials: Carpet Systems (Highly Recommended)
Similar all credits that fall under EQ Credit 4.3 this credit requires carpeting products to meet a strict standard designed to limit product off gassing. Strategies for this credit include

176
clear specifications and product requirements throughout the construction documents and care during installation should adhesives be used. Products may be either certified under the Green Label Plus program or be tested by qualified independent laboratories to ensure product appropriateness. The costs associated with this credit will be discussed under EQ Credit 4.4 Low Emitting Materials: Composite Wood.
EQ Credit 4.4 Low-Emitting Materials: Composite Wood (Highly Recommended)
The purpose of this credit is to limit exposure to urea-formaldehyde resins used in wood products. Emphasis on the above should be placed on laminating adhesives used on-site and in shop production of finished materials. The inclusion of low-emitting material credits have truly transformed and educated the market place regarding low-VOC and urea-formaldehyde free wood products. Paints, carpets, and sealants are currently available at no additional costs compared to their traditional counterparts. EQ Credits 4.1, 4.2, and 4.3 all earn an LCV of 2.
Unlike its EQ Credit 4 predecessors, EQ Credit 4.4 Low-Emitting Materials: Composite
Wood currently carries a premium compared to its traditionally manufactured counterparts. The additional cost for this credit would be predicated on the amount of wood used in the building and strategy used in selecting the wood types used to meet the required percentage. For low-VOC wood interior applications the GSA study (GSA 2004) lists costs for a traditional solid core single door at $1,013.14 and a low-VOC solid core single door at $1,126.91 which equates to an 11.2% premium for ‘greener’ doors. The overall increase in budget for the GSA study, which focused mainly only on interior construction and furnishing wood products, showed a budget increase from $804,176 dollars to $868,187 dollars, or a 7.9% premium, for low-VOC wood products. Since this credit is largely design and feasibility oriented it earns an LCV value of between 3 and 5.
EQ Credit 5 Indoor Chemical and Pollutant Source Control (Highly Recommended)
This credit seeks to control cross contamination of dirt, pollutants, and cleaning materials via design schemes that limit intrusion, isolate, and ventilate sources of the contamination. The credit is divided into three main criteria all of which must be met to earn this point. The first criteria address limiting outside pollutants from entering the building via various forms of debris, the second looks to contain cleaning supply off gassing, and the third seeks to control dust and particles via improved air filtration.
• Employ permanent entryway systems at least six feet long in the primary direction of
travel to capture dirt and particulates from entering the building at all entryways that are directly connected to the outdoors. Acceptable entryway systems include permanently installed grates, grilles, or slotted systems that allow for cleaning underneath. Roll-out mats are only acceptable when maintained on a weekly basis by a contracted service organization. Qualifying entryways are those that serve as regular entry points for building users.
• Where hazardous gases or chemicals may be present or used (including garages,
housekeeping/laundry areas and copying/printing rooms), exhaust each space sufficiently to create negative pressure with respect to adjacent spaces with the doors to the room

177
closed. For each of these spaces, provide self-closing doors and deck to deck partitions or a hard lid ceiling. The exhaust rate shall be at least 0.50 cfm/sq.ft., with no air recirculation. The pressure differential with the surrounding spaces shall be at least 5 Pa (0.02 inches of water gauge) on average and 1 Pa (0.004 inches of water) at a minimum when the doors to the rooms are closed.
• In mechanically ventilated buildings, provide regularly occupied areas of the building with
air filtration media prior to occupancy that provides a Minimum Efficiency Reporting Value (MERV) of 13 or better. Filtration should be applied to process both return and outside air that is to be delivered as supply air. This credit needs to be addressed at the onset of design to ensure that all three criteria are
considered. Should the criteria be included in the design scheme early on there should limited or no additional costs. Similar to other design credits the cost associated with this credit is largely dependent on the variance between considerations accounted for in an existing standard and those detailed by the USGBC credit requirements. For example the GSA considers walk-off mats and segregated exhausts for all janitor closets as part of their existing building program and not additions to achieve this LEED credit. The GSA considers this a no cost credit. As for university projects, should this credit be tackled early on in the design process the credit will earn an LCV of between 2 and 4 depending on the amount of square footage space influenced by this credit and existing applicable standards. EQ Credit 6.1 Controllability of Systems: Lighting (Conditionally Recommended)
The design intent for this credit is to give occupants control over the building systems that may directly affect performance such as task lighting and thermal comfort. EQ Credit 6.1 Controllability of Systems: Lighting places design emphasis on individual and group control over lighting systems.
Both criteria must be met in order to achieve this point. Key design element is to
incorporate task lighting into the overall lighting and energy design scheme. The key to this credit is that the minimum requirement from the USGBC to earn this credit is the availability of an on/off switch for individual and multi-occupant spaces. Designing beyond the minimum switch requirement with techniques such as daylighting sensors, adjustable lights and switch controls, and motion sensing devices may add extra costs depending on the strategies applied to the project. This credit earns an LCV of between 2 and 4 depending on the complexity, or simplicity, of the control and lighting systems.
EQ Credit 6.2 Controllability of Systems: Thermal (Conditionally Recommended)
Similar to lighting control design program, the thermal comfort credit places an emphasis on individual and group control over thermal systems. Comfort system criteria must be met for both individual and group occupant space. A key to this credit is to note that occupants need to have control of at least one of the conditions for thermal comfort, either air temperature, radiant temperature, air speed, or humidity. This credit provides various options and strategies for achieving its goals. Any number of individual design techniques, individually or in conjunction with other techniques, may be used at various costs to meet the requirements.

178
Since the GSA utilizes under floor air distribution systems in its basic building program it considers this credit a no cost option. For programs not utilizing an under floor distribution system then options such as operable windows and individual controls become the main strategies for achieving this credit. This credit earns an LCV of between 2 and 5 depending on the base building program.
EQ Credit 7.1 Thermal Comfort: Design (Recommended)
This credit utilizes a design standard developed to maximize the optimum range of temperature and humidity based on the building site’s given climate range. The essential point of this credit is to include ASHRAE Standard 55-2004 from the onset of the design scheme. Also consider the impacts and synergies with other EQ credits such as EQ Credit 1 and EQ Credit 2. Should the existing building program include ASHRAE Standard 55-2004 then this credit earns an LCV of 1 or 2 as a no cost item. Should the current standard not be included then a building takeoff for the required materials and installation costs would be needed. This earns an LCV of between 1 and 5.
EQ Credit 7.1 Thermal Comfort: Verification (Conditionally Recommended)
This is a unique credit in that it requires a plan for data collection that will take place six to 18 months after occupancy. This point allows for follow-up data to be collected and analyzed in order to verify system performance. The noted standard above provides guidelines for follow-up and the USGBC has provided a point for those design teams to receive credit for capitulating.
This is a non-construction cost and is dependent on the amount of surveys and
measurements needed to be in accord with ASHREA Standard 55-2004. Unless considered part of the formal existing building program this would be considered an added costs for most building construction budgets since the work takes place six to 18 months after building completion. This earns an LCV cost estimate of 3.
EQ Credit 8.1 Daylight and Views: Daylight 75% of Spaces (Highly Recommended)
Daylighting may contribute to energy efficiency as well as providing for increases in occupant productivity and health. There needs to be attention paid for balancing daylighting goals and those of space planning and work function. The design intent is to maximize interior daylighting schemes. High performance glazing should be considered throughout the design plan.
Whether or not to pursue this credit is a design consideration. Once the decision has been made to pursue this credit then the costs become part of the associated requirement costs and subsequently part of the construction budget.
This credit would earn an LCV value of 5 for most buildings. It is important to note that daylight enhancing louvers were the significant additional cost, 41% of total identified additional LEED costs, with regard to design strategy pursued in Rinker Hall. Should a strategy been developed that did not rely on this technology it may have been completed for far less.

179
EQ Credit 8.2 Daylight and Views: Views for 90% of Spaces (Recommended)
This credit follows the trend biophilia hypothesis that humans have a need to be connected to the outdoors and whereby views of the outdoors enhance productivity. This need results in proposed benefits to human performance, health, and emotional wellbeing (Griffin 2007).
Design schemes used to meet these criteria are slender building footprints, lower partition heights, and interior glazing. The GSA study (GSA 2004) notes the following likely strategies for achieving this credit:
• Minimize number of enclosed spaces within the building and provide significant “open”
work areas. • Minimize number of enclosed spaces located along the building perimeter. • Incorporate view windows (interior glazing panels) in enclosed spaces. This applies to
spaces along the perimeter of the building that may block views to the exterior and to interior enclosed spaces.
• Select systems furniture with at least some low-height panels to allow for “view corridors.”
The primary issue with this credit is whether or not this type of connectivity to the outdoors is feasible given the buildings program design. If the general design principles provide for this opportunity then it is a matter of determining the additional costs associated with achieving this credit. Although the GSA courthouse study did not determine this credit feasible due to the security concerns it did provide an estimate of costs for an office remodeling project (GSA 2004). The design provided for the addition of 9,700 square feet of glazing panels to allow for view access. The panels measuring five feet by 3 and a half feet cost approximately $346,371 or $1.13/GSF. Due to the costs being directly tied to the design of the structure and space needs of the owner this credit earns an LCV of between 2 and 5. ID Credits 1 to 1.4 Innovation in Design (Conditionally Recommended)
• Credit 1.1 (1 point) In writing, identify the intent of the proposed innovation credit, the proposed requirement for compliance, the proposed submittals to demonstrate compliance, and the design approach (strategies) that might be used to meet the requirements.
• Credit 1.2 (1 point) Same as Credit 1.1 • Credit 1.3 (1 point) Same as Credit 1.1 • Credit 1.4 (1 point) Same as Credit 1.1 • Credit 2 (1 point) Having a LEED Accredited Professional (AP) involved with the job at
the earliest point possible.

180
Currently the USGBC allows for up to four exemplary credits to be submitted under the Innovation and Design Category. Exemplary Credits are those credits which exceed existing credit requirements by a defined percentage or amount or surpass the intent of the credit based on predetermined measure. There are a total of sixteen possible exemplary credits of which four will be allowed to be submitted under the Innovation and Design Category. Exemplary credits are available for the following items und LEED 2.2:
• Sustainable Sites Credit 4.1 – Alternative Transportation – Create and submit to the
USGBC an overall transportation plan for the project site noting the benefits and savings of incorporated techniques. This credit earns an LCV between 2 and 3 based soft costs involved in producing and documenting the plan and whether or not the credit was chosen at the start of the project.
• Sustainable Sites Credit 5.1 – Site Development – Protect or Restore Habitat –
Requirement is to protect or restore an additional 25% of the site for a total of 75% of the site. This is a site dependent and design program dependent credit earning an LCV of 2.
• Sustainable Sites Credit 5.2 – Maximize Open Space – Requirement involves doubling the
amount of open space required on a project. This is a design dependent cost and given a LCV of 2.
• Sustainable Sites Credit 7.1 – Heat Island Effect – Non-roof – Requirement is for 100%
albedo surfaces or 100% of the parking to be covered. This credit earns an LCV of between 2 and 5 depending on the options and techniques used in achieving this credit.
• Sustainable Sites Credit 7.2 – Heat Island Effect – Roof – Requirements are for a 100%
vegetative roof design. This credit earns and LCV of between 3 and 5. • Water Efficiency Credit 2 – Innovative Waste Water Technologies – Requirements 100%
reduction of potable water for sewage conveyance or to process 100% of wastewater onsite. Under LEED 2.2 this would involve an LCV of between 2 and 5.
• Water Efficiency Credit 3.2 – Water Use Reduction by 30% - Requirements are to reduce
overall potable water usage by an additional 10% for a 40% cumulative reduction. Depending on the design strategies and availability of grey water this credit would earn an LCV of between 2 and 5.
• Energy and Atmosphere Credit 6 – Green Power – Requirements are to double minimum
amount of power purchased to 70% or to double the minimum length of contract time to four years. Depending on the amount of power and surcharge for green power this credit earns an LVC of between 3 and 5.
• Materials and Resources Credit 2.2 – Construction Waste Management, Divert 75% from
Disposal – Requirements for this credit are to raise the amount of waste diverted an additional 20% for a 95% total waste diversion rate. In large scale construction this credit seems extremely difficult to achieve, as such it earns an LCV credit of between 3 and 5

181
depending on the materials used in construction and the waste management plan developed for the job.
• Materials and Resources Credit 3.2 – Materials Reuse, 10% - The Requirements for this
credit are to increase the reuse percentage by five resulting in a minimum 15% reuse rate. This cost would have been calculated on a job by job basis, as a result it earns an LCV of between 2 and 5.
• Materials and Resources Credit 4.2 – Recycled Content, 20% - Requirements for this credit
are to increase the recycled content percentage to 30%. Depending on the materials required this earns an LCV of between 2 and 5.
• Materials and Resources Credit 5.2 – Regional Materials, 20% Extracted, Processed, and
Manufactured – Requirements are to raise the minimum requirements 20% for a total of 40%. The GSA study lists products available for most projects that easily meets this requirement as a result this earns an LCV of 2.
• Materials and Resources Credit 6 – Rapidly Renewable material 2.5% total materials value
– Requirements for exemplary performance are to raise the percentage an additional 2.5% for a total of 5%. This earns an LCV of between 2 and 5.
• Materials and Resources Credit 7 – Certified Wood – 50% wood-based materials –
Requirements for exemplary performance are to raise the wood obtained from certified forests an additional 45% to a minimum of 95%. This earns an LCV of between 2 and 5.
• Indoor Environmental Quality 8.1 – Daylight and Views, Daylight 75% of spaces –
Requirements for exemplary performance are to provide daylight for 95% of the building spaces. This earns an LCV of between 2 and 5.
• Indoor Environmental Quality 8.2 – Daylight and Views, Views for 90 % - Requirements
are to exceed the 90% threshold established for this credit. The USGBC notes that this credit will be reviewed on a case-by-case basis. This earns an LCV of between 2 and 5.
ID Credit 2: Innovation and Design LEED Accredited Professional (AP)
The USGBC provides testing to certify individuals as LEED Accredited Professionals. There are no educational prerequisites or qualifications established for taking the exam. Once an individual takes and passes the exam they are allowed to note their qualifications as a LEED Accredited professional. The focus of the exam is on the understanding and interpretation of LEED credits and the processing of LEED documentation for submittal and review to the USGBC. The intent of the credit is to encourage members of the build team to have a working understanding of the LEED process to facilitate integrated design and streamline the submission of credit documents.
The GSA, IHS, and the University of Florida’s Facility and Planning Department have several staff members that are LEED accredited and do not consider this an additional cost.

182
There are, however, two distinctly different design team approaches that have evolved regarding LEED AP’s and how projects are coordinated and processed. The first approach is that of an experienced design team with several members having LEED experience and with team members having the ability to review, coordinate, and submit LEED documentation directly. Typically there is a central coordinator that tracks work and oversees the process and serves at the single source of contact with the Owner and the USGBC. The USGBC estimates this type of work to take between 80 and 150 hours. A cost estimate for this work would range between $8,000 and $15,000 for overseeing the process. The second approach is one in which the LEED AP serves as the sole coordinator, reviewer, and submitter of LEED project data.
The difference between the two approaches is the amount of time the LEED AP spends in
either creating supporting documentation or reviewing each credit in detail. An example of this might be the difference, in time and effort, between submitting the documentation for the Water Efficiency Credit 1.1: Water Efficient Landscaping and reviewing the calculations and supporting documentation prior to submitting to the USGBC. The first being a simple transfer of information with little time invested and the latter taking several hours to ensure the proper information is provided and is correct. UF’s Facility and Planning Department estimates that this takes twice the amount of time as estimated by the USGBC resulting in a cost estimate of between $16,000 and $30,000. UF processes all records submitted to the USGBC as part of their Project Managers general responsibilities and considers these functions as no additional costs.
Summary
The focus of this appendix was two-fold, firstly to provide an outline of the processes the University of Florida Facilities and Planning department follows with regard to achieving LEED credits and secondly to provide a summary of the individual LEED prerequisite and credit requirements.

183
Table B-1. University of Florida LEED Credit Ratings Rating Description Required (Req) Design criteria is either a LEED prerequisite or
falls under a FPC directive. Highly Recommended (HR) Designated as good building practice. Recommended (R) Provides benefits that can be easily justified,
however must be tested in the context of the specific design solution.
Conditionally Recommended (CR) Criteria is beneficial in some applications, however may be inappropriate in others.
Table B-2. Bike rack and shower facilities for commercial users
Number of FTE occupants Bike racks (5%)
Construction cost estimate
Shower facilities (0.5%)
Construction cost estimate
33
2 $100 1 $5,457
100
5 $220 1 $5,457
300
15 $660 2 $10,914
950 48 $2100 5 $27,282

184
Figure B-1. Construction waste management plan implementation
Design Team Develop a Construction Waste Management
(CWM) Specification and overall project goal (i.e., 50% Diverted waste). Include in all
Contract Documents.
General Contractor Develop formal jobsite CWM plan.
General Contractor or Waste Manager Sorting, hauling, and documenting tasks.

185
LIST OF REFERENCES
Beach, L. R., and Connolly, T. (2005). The psychology of decision making: People in organizations, Sage Publications, Inc., Thousand Oaks.
Crowe, T. J., and Noble, J. S. (1998). "Multi-attribute analysis of ISO 9000 registration using
AHP." International Journal of Quality and Reliability Management, 15(2), 205-222. Depot, H. (2007). "Millstead - Wood Purchasing Policy." Atlanta. www.homedepot.com (Last
accessed March 7, 2007). Eijadi, D., Vaidya, P., Reinertsen, J., and Kumar, S. (2002). "Introducing comparative analysis to
the LEED system: A case for rational and regional application." Lawrence Berkeley National Laboratory, Berkeley. http://repositories.cdlib.org/ibnl/LBNL-51291 (Last accessed May 13, 2007).
FDE (2006). "Florida's energy act." Florida Department of Energy, Tallahassee.
http://www.dep.state.fl.us/energy/fla_energy/incentives.htm (Last accessed June 1, 2006). Fisk, W. J. (2000). "Health and productivity gains from better indoor environments and their
relationships with building energy efficiency." Annual Review of Energy and Environment, 25, 537-566.
Foxon, T. "Applying systems thinking and practice for promoting sustainable innovation."
Science and Tecnology Policy Research, Sussex, England, 15. FSEC (2006). "Florida's building energy use." Florida Solar Energy Center University of Central
Florida, Orlando, FL. http://www.fsec.ucf.edu/ (Last accessed June 1, 2006). Geshwiler, M. (2003). "ASRAE green guide." W. Stephen Comstock, Atlanta, GA, 170. Griffin, C. (2007). "An introduction to biophilia and the built environment." Rocky Mountain
Institute, Berkely. http://www.rmi.org/sitepages/pid1079.php (Last accessed March 10, 2007).
Gifford, R. (2002). Environmental psychology:principles and practice, Optimal Books, Colville,
WA. Grumman, D. L. (2003). "ASHRAE green guide." American Society of Heating, Refrigerant,
and Air-conditioning Engineers, Inc., Atlanta, GA, 170. GSA. (2004). "GSA LEED cost study - final report." GS-11P-99-MAD-0565, U.S. General
Service Administration, Washington, DC. Heschong-Mahone-Group. (1999). "Daylighting in schools - an investigation into the
relationship between daylighting and human performance." The Pacific Gas and Electric Company, Fair Oaks, CA.

186
IHS. (2006). "LEED cost evaluation study." Deparment of Health and Human Services - Indian
Health Services, Rockville, MD. IISD. (2004). "Perceptions and definitions of social responsibility." International Institute for
Sustainable Development, Winnipeg. Kats, G. "The costs and financial benefits of green buildings." USGBC Annual Conference,
Pittsburgh, PA. Kibert, C. (2002). Construction ecology:nature as the basis for green buildings, Spon Press,
London ; New York. Lyle, J. T. (1994). Regenerative design for sustainable development, John Wiley, New York. McGraw-Hill. (2006). "Green building smart market report." Lexington, MA. Morris, P. (2004). "Examining the cost of green." Davis Langdon, Seattle, WA.
http://www.davislangdon.com/USA/Research/ResearchFinder/2004-Examining-the-Cost-of-Green/
Norris, G. A., and Marshall, H. E. (1995). "Multiattribute decision analysis method for
evaluating buildings and building systems." NISTIR 5663, National Institute of Standards and Technology, Gaithersburg, MD.
Odum, H. T. (2001). "An energy hierarchy law for biogeochmecial cycles. In Emergy Synthesis,
Theory and Applications of the Emergy Methodolgy." Center for Environmental Policy, Gainesville, FL.
OEMC (2003). "A high performance design success story: North Boulder Recreation Center
earns a silver." Governor's Office of Energy Management and Conservation, Denver, CO. http://www.colorado.gov/rebuildco/success/local/boulder_rec.htm (Last accessed May 15, 2007).
OPPAGA. (2006). "Higher education facility construction costs are reasonable; some
improvements could maximize use of campus classroom space." 06-31, Office of Program Policy Analysis and Government Accountability, Tallahassee, FL.
Pearce, D. W., and Warford, J. J. (1993). World without end:economics, environment, and
sustainable development : summary, World Bank, Washington, D.C. PECI. (2002). "Establishing commissioning costs." Portland Energy Conservation, Inc., Portland. Saaty, T. L. (1982). Decision making for leaders, Wadsworth, Inc., Belmont.

187
Schendler, A., and Udall, R. (2005). "LEED is broken . . . Let's fix it." Aspen. http://www.aspensnowmass.com/environment/news.cfm (Last accessed May 22, 2007).
Shabecoff, P. (2000). Earth rising, Island Press, Washington, DC. Steele, J. (1997). Sustainable architecture, McGraw-Hill, New York. Su, S. Y. W., Dujmovic, J., Batory, D. S., Navathe, S. B., and Elnicki, R. (1987). "A cost-benefit
decision model: analysis, comparison, and selection of data management systems." ACM Transaction on Database Systems, 12(3), 472-520.
Torcellini, P., Pless, S., Deru, M., Griffith, B., Long, N., and Judkoff, R. (2006). "Lessons
learned from case studies of six high-performance buildings." National Renewable Energy Labratory, Golden, CO.
UN. (1993). Agenda 21 : programme of action for sustainable development ; Rio Declaration on
environment and development;Statement of Forest Principles:the final text of agreements negotiated by governments at the United Nations conference on environment and development (UNCED), 3-14 June 1992, Rio de Janeiro, Brazil, United Nations, New York, NY.
USGBC. (2000). "Making the business case for high performance green buildings." United
States Green Building Council, Washington, D.C. USGBC (2007). "USGBC webpage." Washington, DC. www.usgbc.org (Last accessed June 1,
2007). van Bueren, E. M., and Priemus, H. (2002). "Institutional barriers to sustainable construction."
Enviromental Planning, 29, 75 - 86. Venture, B. a. I. R. (2002). "Contractors guide - Save money and resources through job-site
recycling and waste prevention." King County Solid Waste Division, Seatle, WA. Wilson, A. (2005). "Making the case for green building." Environmental Building News, 14(4),
12. WCED. (1987). "Our common future." United Nations World Commission for Environment and
Development, Oxford, England.

188
BIOGRAPHICAL SKETCH
James Sullivan’s professional and education background leading to this degree is quite
diverse. Upon graduating from Clearwater High School, Clearwater, Florida, in 1984 he applied
and was accepted to the University of Florida, Gainesville. After successfully graduating in four
years with an advertising degree, he was offered a graduate position in the College of Journalism
and Communications. He completed a Masters of Arts in Mass Communications within two
years and turned his attention to the business world. During his college years Jim had worked as
a general laborer, painter, landscape contractor, and rough carpenter. After a brief stint with
Arthur Anderson he moved toward the consulting field and spent the better part of six years
traveling the world working for BPA International. Having married a medical student who
“matched” in Gainesville, he accepted a position at the university, conducting statistical analyses
in the field of pediatric oncology. While working on this research, he was given the opportunity
to take additional course work at UF. After taking classes for several years and balancing
fulltime work with full-time school and a teaching assistant position, he resigned from his
research post to focus on the field of building construction. He worked for the Hines Company
as a construction manager during the summer of 2001 and as a project manager with the Clark
Construction Company in Bethesda, Maryland, after graduating in December 2001. He was
accepted into the Ph.D. program at the University of Florida in the fall of 2003. During the 2003
to 2004 academic calendar Jim worked as a teaching assistant in the soil’s lab as well as a
lecturer for the building materials course. Starting with the fall of 2005 he was awarded the
Rinker Fellowship for research studies. During this time Jim has also worked outside the college
giving lectures regarding green building and design. Upon the completion of his degree in
summer 2007 Jim accepted a position at UF lecturing in the field of building construction.