a deep learning based analysis of the big five personality
TRANSCRIPT

A Deep Learning Based Analysis of the Big Five Personality Traits from
Handwriting Samples Using Image Processing
Ahmed A. Elngar
Assistant Prof., Faculty of Computers and Artificial Intelligence, Beni-Suef University, Beni Suef,
62511, Egypt. E-mail: [email protected]
Nikita Jain*
*Corresponding Author, Assistant Prof., Department of Computer Science and Engineering, Bharati
Vidyapeeth’s College of Engineering, New Delhi, India. E-mail: [email protected]
Divyanshu Sharma
Department of Computer Science and Engineering, Bharati Vidyapeeth’s College of Engineering,
New Delhi, India. E-mail: [email protected]
Himani Negi
Department of Computer Science and Engineering, Bharati Vidyapeeth’s College of Engineering,
New Delhi, India. E-mail: [email protected]
Anuj Trehan
Department of Computer Science and Engineering, Bharati Vidyapeeth’s College of Engineering,
New Delhi, India. E-mail: [email protected]
Akash Srivastava
Department of Computer Science and Engineering, Bharati Vidyapeeth’s College of Engineering,
New Delhi, India. E-mail: [email protected]
Abstract
Handwriting Analysis has been used for a very long time to analyze an individual’s suitability for a
job, and is in recent times, gaining popularity as a valid means of a person’s evaluation. Extensive
Research has been done in the field of determining the Personality Traits of a person through
handwriting. We intend to analyze an individual’s personality by breaking it down into the Big Five
Personality Traits using their handwriting samples. We present a dataset that links personality traits to
the handwriting features. We then propose our algorithm - consisting of one ANN based model and

A Deep Learning Based Analysis of the Big Five Personality … 4
PersonaNet, a CNN based model. The paper evaluates our algorithm’s performance with baseline
machine learning models on our dataset. Testing our novel architecture on this dataset, we compare
our algorithm based on various metrics, and show that our novel algorithm performs better than the
baseline Machine Learning models.
Keywords: Computer vision, Convolutional neural networks, Artificial neural networks, Machine
learning, Big five personality traits, Handwriting, Graphology.
DOI: 10.22059/jitm.2020.78884 © University of Tehran, Faculty of Management
Introduction
Handwriting is a well-known way of communication and expression for humans. It's been
recently found that handwriting has a strong correlation with working of the brain and the
psychological side of humans. (Groot, et al., 2009) shows the study of human personality by
writing. Graphology is a projective test of personality that gives knowledge of temperament,
genetic factors contributing to a person’s behavior, biological foundation, and
character.(James, et al., 2012) show the relationship between handwriting in neuromuscular
and the effects of various factors like aging and health problems, on handwriting variability.
Handwriting is a motor ability that we tend to lose when it comes to neurological disorders.
Parkinson disease, depression among many other psychological disorders, is quickly detected
through handwriting analysis. Therefore, it is an effective and good predictor of behaviour
and personality and a useful method for many organizational processes, such as recruiting,
interviewing and selection, team foundation, counseling, and career based planning. At least
300 different handwriting features are used in the science of graphology in its investigative
approach. The National Pen Company in U.S., in a research, stated that, a person’s
handwriting can give away clues about 5,000 different personality traits based on the way the
person spaces letters, how the person signs his or her name, and even how the letters are
connected. The graphologist's interpretation skills are in the psychological art of
understanding the mix of handwriting features.
Dahlen, et al. (2006) show that one of the most well-known and commonly adapted
personality models is the “Big-Five” model which marks the five traits of Openness,
Conscientiousness, Extroversion, Agreeableness, and Neuroticism.
Cobb-Clark, et al. (2012) Elaborate that the Big-Five personality traits are stable for the
adults of working-age over four years and average population changes are constant or small

Journal of Information Technology Management, 2020, Special Issue 5
across age groups. Adverse life-events do not correlate with the Intra-individual changes and
are not economically meaningful
This personality analysis has important applications in many fields, such as human
resources, computer-assisted tutoring systems, and user feedback systems. Likewise, similar
work by Karan-yang, et al. (2010) has been done by evaluating the personalities by using
visual, audio features with the help of Computer Vision based on the first impression on the
video subject’s Big-Five personality traits.
However, Chen, et al. (2017) presented a new approach for identifying personality traits
by combining handwriting features with machine learning techniques. They conducted an
exploratory study where they collected participants’ handwriting data and personality data via
a questionnaire. From this data, they extracted handwriting features and created seven
personality dimensions classifiers. Their results included a unique set of writing features that
could be personality predictor and binary classifiers for the seven personality dimensions.
They used the Five-Factor Model (FFM) (Costa and McCrae, 2008) which is the dominant
model in personality research.
Gavrilescu, et al., (2018) proposed a three-layer architecture based on the neural
networks system that aims to determine the Big Five Personality traits of a person by
analyzing and extracting features. They also released a dataset in the literature that relates to
the Big Five personality types with the handwriting features extracted from the 128 subjects
containing random and predefined texts.
Our contribution: In this work, we aim to create the first literature architecture capable
of automatically analyzing a couple of handwriting features and creating an assessment of the
writer's personality using the Big-Five Model. This work provides an analysis of handwriting
in terms of psychological behavior. We created a unique dataset of handwriting samples and
linked it to the personality traits. The details of the dataset are mentioned in section 3, which
is the first open dataset of this kind. Our analysis proceeds by extracting the features from
handwriting samples and applying different supervised machine learning classification
models as the baseline. These baseline models are further compared with our proposed deep
learning models which showed significantly better results on our proposed architecture.
Related Work
Handwriting Extraction Techniques
Lee, et al. (2017) proposed a teaching assistant system that uses machine vision to create
content for e-Learning services. Lectures are recorded by two cameras. These lectures are
then merged on the two sides such that students can see the complete teaching content. The k-
means segmentation extracts the surface of the whiteboard and then the technique of

A Deep Learning Based Analysis of the Big Five Personality … 6
connected components completes the area covered by the lecturer’s body. Then they use an
adaptive threshold to detect handwriting in various light conditions and the time-series
denoising technique is designed to reduce noise. According to extracted handwriting, the
lecture videos can be automatically structured with a high level of semantics. The lecture
videos are segmented into video clips and all key-frames are integrated as handouts of the
education videos.
Sueiras, et al. (2018) proposed an architecture that aims to identify isolated handwritten
words by detecting the characters along with context from their neighbors to recognize any
given word. It uses a mixture of horizontal sliding windows and the LeNet-5 convolutional
architecture, to extract image patches and identify the character. They obtain a testing word
error rate of 12.7% (IAM Dataset) and 6.6% (RIMES Dataset).
Handwriting Analysis using Supervised Learning (Machine Learning)
Blumenstein et al. (2003) use deep neural networks for segmented character recognition. They
use a couple of architectures with two feature extraction techniques. They discuss a new
method for character feature extraction which is then compared with others present in the
literature. Each of the values comprising the input vector was defined as follows: 1. The total
count of horizontal lines, 2. The length of horizontal lines, 3. The count of the diagonal lines
(right), 4. The total length of diagonal lines (right), 5. The count of the vertical lines, 6.
Length of vertical lines, 7. The count of the diagonal lines (left), 8. The length of left diagonal
lines and 9. The count of intersection points. Recognition results above 80% were achieved
using characters segmented from the CEDAR benchmark database and the standard CEDAR
alphanumeric.
Champa, et al., (2010) proposed to predict the personality of a person from various
features such as the baseline of the handwritten text, the pressure the writer applied, various
characteristics of the letter ‘t’, the loop of letter ‘y’ and the slope of the handwritten text.
These parameters are fed into a Rule-Base which predicts the subject’s personality trait.
Luria et al., (2014) examine whether a non-intrusive computerized system that analyzes
handwriting can detect deception in health care. 98 participants were taken for the analysis
having age between 21-36. Participants were asked to write two short sentences out of which
one was false and the other a true explanation of their clinical condition. Features used for the
analysis were 1) Temporal measures: Time period for which the pen was not in contact with
the writing surface and on paper 2) Spatial measures included stroke path length 3) Stroke
height (Y-axis) - direct distance from the lowest to the highest point of the stroke, 4) stroke
width (X-axis) distance from the left to the other (right) side of the stroke, 5) Angular velocity
of a stroke.
Journal of Information Technology Management, 2020, Special Issue 7
Joshi et al. (2018) proposed to implement handwriting analysis focusing on features
such as the text margin, text baseline, the handwriting’s letter size, the features of the letter t
and the applied pen pressure. The handwriting samples were taken from university students of
the age of 20–24 years. The dataset has 1890 sample records. Different classifiers such as
Random Forests, Naïve Bayes and Support Vector Machines were compared based on their
performance. The processed features were fed to these classifiers to get the personality
description. Also, the Synthetic Minority Oversampling Technique (SMOTE) was used to de-
skew the dataset.
Handwriting Applications
Coll, et al. (2009) show that graphological features that define the personality of a person are
measured attributes like layout, size and shape of the letters, angle of handwritten lines etc.
Once these attributes are extracted, data is classified using a neural network.
Luria, et al. (2011) tested the effect of mental workload on handwriting behavior and
identified the characteristics of mental workload in handwriting. They contrast text written by
candidates under three different mental load conditions and create a profile that used these
indicators. About fifty six candidates were made to write three numerical progressions of
different difficulty levels on a digitizer. This was used to measure their handwriting
behaviour. Differences were found in time based, area based, and velocity based handwriting
measures, but the pen pressure measures were not too different. Using data reduction
techniques, the authors were able to identify three groups of handwriting, two of which
differentiated well according to the three mental workload conditions. The paper concluded
that handwriting was also dependent on the person’s mental workload and that each measure
was important and a detailed indicator of mental workload. Features used were 1) Pressure 2)
Duration of no contact and contact with the paper. 3) Segment length 4) Path distance from
starting to finish point for the segments 5) Vertical Segment Length/height (y-axis): distance
from the lower to the highest point of the segment. 6) Horizontal Segment Length/Width (x-
axis): distance from the left side of the segment to the right side. 7) The velocity of a segment
indicates the degrees the pen traverses in a segment.
Maadeed et al. (2014) proposed classification of handwriting samples into
demographics that was performed in two different steps: Feature extraction and Classification.
It is known that the performance of a system largely relies on the feature extraction step. In
this study, several geometric features were proposed and used to characterize handwriting and
classify handwriting with regards to age, sex, and one’s nation. Features were combined using
Random Forests and Kernel Discriminate Analysis. A rate of 74.05% was reported on the
QUWI dataset for gender prediction, 55.76% for age range prediction, and 53.66% for the
nation the participant belonged to, when all writers wrote the same text, whereas it was

A Deep Learning Based Analysis of the Big Five Personality … 8
73.59% for gender prediction, 60.62% for age range prediction, and 47.98% for one’s nation,
when each writer wrote different text.
Tang, et al. (2012) developed a framework of eight principles for lie detection using
basic communication models. When most honest people lie, they diverge from their standard
handwriting and break their moral standards. They exhibit 24 (cases) in 11 languages in
different areas of the world. (Siddiqi, et al., 2015) presented a study in which machine
learning models were developed to distinguish between male and female writers. The
methodology extracts features from handwriting samples of male and female writers. Features
like word slant, texture, curvature, and legibility were calculated and were fed into machine
learning models. Supervised learning was used to carry out the classification (SVM and ANN
to be specific). The main thing is the use of two different language databases for training the
model. One was in Arabic English and the other was in French. Qatar University Writer
Identification (QUWI) and a custom-developed Multiscript Handwritten Database (MSHD)
was used.
Mouly et al. (2007) differentiate letters written by subjects who have made suicide
attempts by self-poisoning, and healthy volunteers. They did a maximal blind controlled study
of the subjects. Forty patients who had attempted suicide but were now fully recovered, and
40 healthy volunteers wrote and signed a short letter or story which was not related to the
parasuicide or their mental health status. The evaluators attempted to classify the letters as
‘suicide’ or ‘no suicide’.
Ahmed et al. (2017) try to predict the gender of the person from the offline handwriting
samples. The technique relied on extracting a set of texture-based features from handwriting
samples of male and female writers. These samples were used to train different machine
learning classifiers to learn to differentiate between the two gender classes. The features
included local binary patterns (LBP), a histogram of oriented gradients (HOG), gray-level
statistics, the matrix of co-occurrence (GLCM) and features extracted through segmentation-
based fractal texture analysis (SFTA). To classify, they employed artificial neural networks,
support vector machines, nearest neighbor classifiers, decision trees, and random forests.
They further used bagging, voting, and stacking techniques to increase performance. The
proposed model outperformed the state-of-the-art model.
Psychology
Psychology is defined as the scientific study of the mind and the behavior of a being. It is a
multifaceted discipline and encompasses many sub-fields of study areas such as human
development, games, physical and mental health, social behavior and cognitive processes.
Professionals in human resources are known to use the description of the 'Big Five Personality
Traits' to identify employees. That is because those measurements are considered the

Journal of Information Technology Management, 2020, Special Issue 9
fundamental characteristics that make up the overall personality of an individual. The Big
Five traits of personality are: a) Openness b) Consciousness c) Extraversion d) Agreeability e)
Neuroticism.
Landers et al. (2006) show the relationship between Internet usage and the Big Five
Personality Features. The study also explored three specific personality characteristics using
117 undergraduates as research participants. Results showed that overall Internet usage was
negatively linked to three of the Big Five characteristics - Agreeability, Consciousness, and
Extraversion, as well as two specific characteristics - Optimism and Job Drive - and positively
related to being Tough-Minded. Current research findings indicate inconsistent or highly
variable estimates of such relationships. Meta-analysis was implemented in 29 studies to
synthesize the results from 32 samples. Findings suggest that while all traits show significant
relationships with awareness, the strongest relationships are associated with neuroticism,
negative influence, and conscientiousness. Komarraju et al. (2011) show that the personality
of a person along with the person’s learning style play a major role in influencing a person’s
academic achievements. College students (308 undergraduates) filled out the Five-Factor
Inventory and the inventory of learning processes. These students also registered their grade
point average. The Big Five traits managed to be accountable for 14% of the variance in grade
point average (GPA), and learning styles were able to explain an additional 3%, suggesting
that both personality traits and learning styles contribute to academic performance.
Psychology in Handwriting: Motivation
Richard et al. (2011) presented a work in the field of psychology and handwriting where they
showed how handwriting can reflect the person’s qualities. The literature showed that other
measures like the content of a script sample as well as professional skills required to analyze
the script also reflect the personality factors other than their writing features. Chaudhari et al.
(2019) presents the link between handwriting and personality psychology. They examined
different methods for feature extraction to analyze a candidate’s personality by considering
most of the handwriting features which were, however, limited to previous research work.
(Komarraju, et al., 2011) and (Landers, et al., 2006) investigate the relationship of the Big
Five Personality Traits with various factors such as academic achievement.
Dataset Description
The Personality Detection Dataset (PDD) includes; 1) basic information (ID, Gender, Age,
Academic Qualification); 2) Handwriting samples; 3) The personality questionnaire. Table 1
and Figure 1 represent gender distribution over the data. This indicates that the data has more
male entries than females which affects the overall personality trait distribution as gender
plays a significant role in determining the type of personality. The age distribution over the
data is shown in Table 2 and illustrated in Figure 2. It indicates that the age group of the

A Deep Learning Based Analysis of the Big Five Personality … 10
participants lies in the 18-21 group as the dataset consists of the undergraduates' entries. In
general, age does not have a significant effect on personality change. Figure 3 shows the
distribution of 5 personality types over the 5-score range labeled very low, low, average, high
and very high. It is inferred that scores lie on 'average' to 'very high' mostly for all five
personality labels. The distribution of 'very low' labels is zero in all the personality traits
indicating that everyone has a high composition of personality traits.
Table 1. Gender Distribution
Gender Count
Male 95
Female 30
Total 125
Table 2. Age Distribution
Age Count
17 8
18 26
19 46
20 32
21 12
23 1
Figure 1. Gender distribution of the dataset

Journal of Information Technology Management, 2020, Special Issue 11
Figure 2. Age Distribution of the Dataset
Figure 3. The distribution of the Big Five Personality traits
Experimentation Methodology
In this paper, we utilize the handwriting samples to estimate the composition of a human’s
personality by breaking it into the Big 5 Personality Traits using a novel Machine Learning
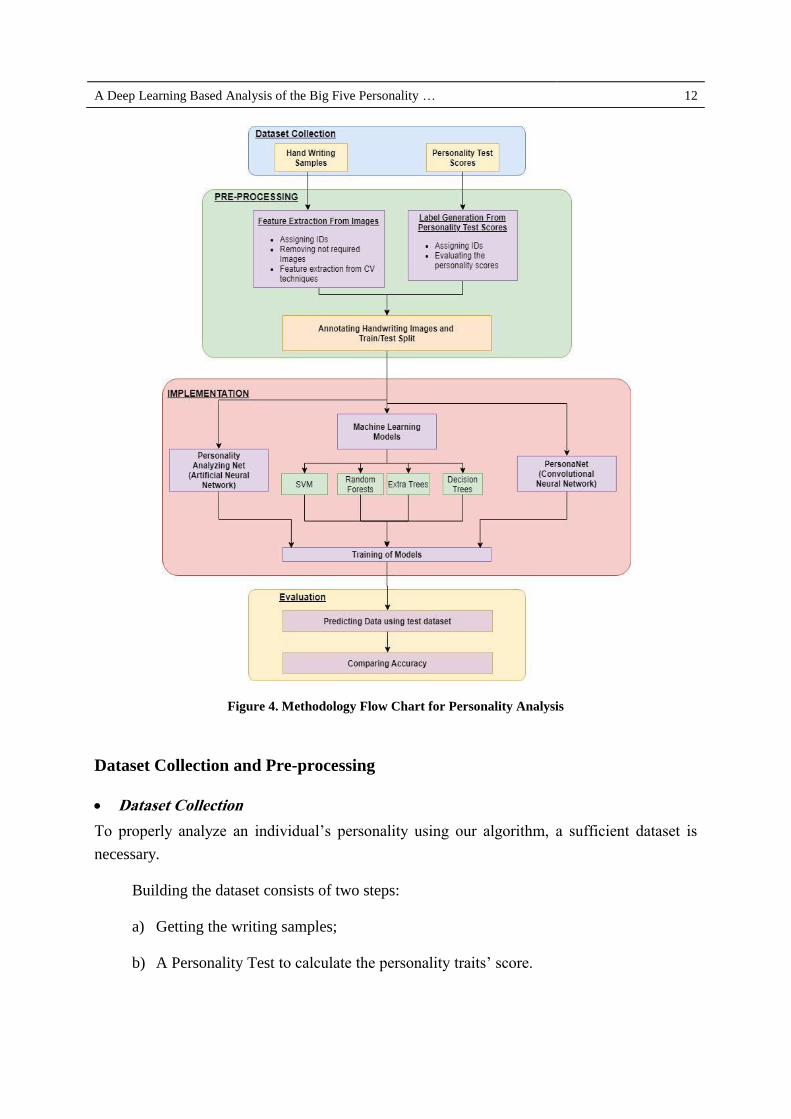
Algorithm - ‘Personality Trait Level Detection Model (PTLDM)’. As outlined in Figure 4, the
framework of our system consists of three major parts: dataset generation, feature extraction,
and algorithm application to analyze the personality.
A Deep Learning Based Analysis of the Big Five Personality … 12
Figure 4. Methodology Flow Chart for Personality Analysis
Dataset Collection and Pre-processing
Dataset Collection
To properly analyze an individual’s personality using our algorithm, a sufficient dataset is
necessary.
Building the dataset consists of two steps:
a) Getting the writing samples;
b) A Personality Test to calculate the personality traits’ score.
Journal of Information Technology Management, 2020, Special Issue 13
Handwriting Samples
Handwriting samples were collected from various individuals. The candidates were asked to
perform the following tasks:
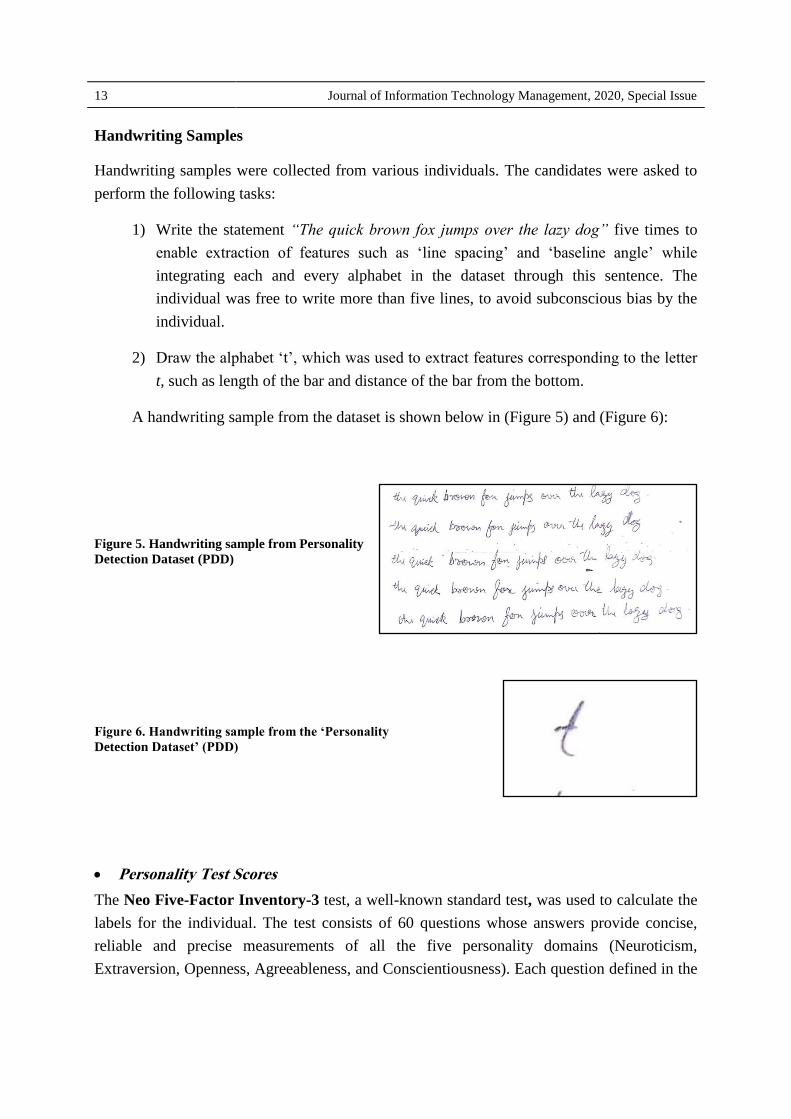
1) Write the statement “The quick brown fox jumps over the lazy dog” five times to
enable extraction of features such as ‘line spacing’ and ‘baseline angle’ while
integrating each and every alphabet in the dataset through this sentence. The
individual was free to write more than five lines, to avoid subconscious bias by the
individual.
2) Draw the alphabet ‘t’, which was used to extract features corresponding to the letter
t, such as length of the bar and distance of the bar from the bottom.
A handwriting sample from the dataset is shown below in (Figure 5) and (Figure 6):
Figure 5. Handwriting sample from Personality
Detection Dataset (PDD)
Figure 6. Handwriting sample from the ‘Personality
Detection Dataset’ (PDD)
Personality Test Scores
The Neo Five-Factor Inventory-3 test, a well-known standard test, was used to calculate the
labels for the individual. The test consists of 60 questions whose answers provide concise,
reliable and precise measurements of all the five personality domains (Neuroticism,
Extraversion, Openness, Agreeableness, and Conscientiousness). Each question defined in the

A Deep Learning Based Analysis of the Big Five Personality … 14
test is related to the particular personality defined in the Big-Five Factor Model. (Figure 7)
shows a few questions from the test.
Figure 7. Test to obtain the ground truth/labels
The labels are calculated as follows: Each question has five options to choose from,
which acts as a parameter for a particular personality question. The standard evaluation
procedure for Neo Five-Factor Inventory-3 is used to obtain the Raw Score and T Score for
the individual. The T-Score is then used to evaluate the Big Five Personality Traits of the
person. (Table 3) and(Table 4) illustrate the T-Score ranges used by the test inventory and
using the T-Score for scoring the Big Five Personality Traits respectively.
The raw score can be evaluated by the summation of the scores obtained by each
question provided by the participant. The scores are categorized in following categories:
1) N = Neuroticism
2) E = Extraversion
3) O = Openness
4) A = Agreeableness
5) C = Conscientiousness
The five categories are the respective classes defined for each question.

Journal of Information Technology Management, 2020, Special Issue 15
R-Score = ∑ where, i=i+5 for each iteration
T-Scores are calculated using the raw scores, the raw scores are listed in Table 5. The
T-Score is observed for each corresponding correct raw score.
Table 3. Constants for the evaluation for T-Score
Personality
type
Male Female
Division Value Subtraction value Division Value Subtraction Value
N 0.714285 1 1 -2
E 0.555555 13.77777 0.555555 14.44444
O 0.555555 13.77777 0.588235 11.47058
A 0.5 19.5 0.476190 21.6666
C 0.555555 19.44444 0.588235 20.29
Table 4. Neo Five Factor Inventory T Score ranges for Personality Evaluation
T Score Ranges
26-34 Very Low
35-44 Low
45-55 Average
56-65 High
66-74 Very High
Table 4 represents the T-Score range for the evaluation of each five classes of
personality. The range provided in Table 4 helps in evaluating the extremism of the
personality factor in a particular person.

A Deep Learning Based Analysis of the Big Five Personality … 16
Table 5. Scoring Key Sample using T Score for Males
N E O A C T Score
0 - - 20 20 26
- - - - - 27
- - - - - 28
- 15 15 - - 29
- - - - - 30
- - - - - 31
- - - - - 32
10 - - - - 33
- - - - 25 34
- - - 25 - 35
- 20 20 - - 36
Feature Extraction
After the dataset was procured, certain features were required to be extracted from the
handwriting samples. Taking reference from (Ahmed K., et al., 1980), the analysis of the
individual’s personality required the following features to be extracted:
Graphological Feature Analysis
a) Baseline: The baseline of a word or a sentence
b) Pen Pressure: Amount of pressure used while writing
c) Word Spacing: The space left between words
d) Line Spacing: The space between two consecutive lines
e) T-Features: Features extracted from the letter ‘t’:
I. Height
II. Width
III. A-distance
IV. B-distance
Baseline
The baseline is the invisible line between the middle zone and the lower zone of handwriting.
The baseline indicates the balance between the ego and consciousness (above) and somatic or

Journal of Information Technology Management, 2020, Special Issue 17
instinctive needs (below). If the baseline is steady but relaxed, the person is healthy in terms
of both body and mind. Deviation in either direction indicates trouble in that zone. Hence, the
baseline acts as an indicator of mood, morality, social well-being, temperament, and
flexibility.
Figures 8, 9 and 10 show samples with descending, zero and ascending baseline
respectively. Table 6 provides the interpretation of various forms of baselines. If the baseline
is levelled, the person seems to be composed and orderly. A rising baseline highlights a
restless or an ambitious person whereas a descending baseline highlights fatigue or
depression. Erratic baselines indicate unstable mood and indecisiveness. Baseline is
calculated by averaging angles from all the lines using word contours.
Figure 8. Handwriting with descending baseline
Figure 9. Handwriting with zero baseline
Figure 10. Handwriting with ascending baseline

A Deep Learning Based Analysis of the Big Five Personality … 18
Table 6. Baseline and its interpretation
Baseline Interpretation
Normally Straight Composure, orderliness, emotional stability, dependability, perseverance
Rising Ambition, optimism, restlessness
Falling Fatigue, depression, disappointment, unhappiness, discouragement.
Erratic Unstable moods and working habits, indecisiveness, confusion between reality
and illusion, hyper-emotional, lacking in will-power
Pen Pressure
The degree of pressure applied during writing can be interpreted as follows: A Heavy writer is
strong-willed, whereas a Medium pressure applier has a healthy level of vitality and will
power. A Light writer is sensitive and has high potential. The interpretations are listed in
Table 7.
Table 7. Pen Pressure and its interpretation
Pressure Interpretation
Heavy Strong willed, easy to excite and firm
Extremely Heavy If in Vertical direction: Self-reliant, proud and sometimes boastful
If in Horizontal direction: Erratic, flamboyant, highly anxious or erratic
Medium Healthy vitality and willpower
Light Sensitive, Impressionable, high potential
Word Spacing
The spacing between words represents the distance the writer would like to maintain between
himself/herself and the society at large i.e. the person’s boundaries.
The word spacing is calculated by detecting blank spacing between the words. The
binary image's vertical projection helps to detect the spacing.
Table 8 relates the various forms of word spacing with the person’s personality. Very
narrow spacing shows a need for constant contact and closeness, whereas very wide spacing
shows a need for isolation or privacy. Wide letters with wide spaces show a person wants to
be noticed, whereas a well-balanced spacing shows a socially mature and internally organized
person.

Journal of Information Technology Management, 2020, Special Issue 19
Table 8. Word Spacing and its interpretation
Word Spacing Interpretation
Very Narrow Crowds other for attention, craves constant contact and closeness
Very Wide Isolation or need of privacy; likes to maintain distance from society
Wide letters with Wide spaces Demands attention in an extravagant or exaggerated manner, stemming
from a need to be noticed, to be important
Well - Balanced Socially mature, Intelligent, Internally organized
Line spacing
The line spacing on the page describes and contributes to the clearness and orderliness of the
writer's philosophy and reasoning. It provides clues as to how much people want to interact
with people around them. If the lines are evenly separated then it is associated with the people
who are good at organizing and have clear thoughts however if the lines are overcrowded
with overlapping lopes then it is associated with the people with poor organizing skills and
confused thinking (Gavrilescu, et al., 2018; Chaudhari, et al., 2019). Figures 11 and 12 show
samples in the dataset with overcrowded lines and high line spacing respectively.
Table 9 lists the different line spacings and their interpretation. Evenly spaced lines
show good organizing skills and clear thoughts. Overcrowded lines show poor organization
skills and confused thoughts.
Figure 11. Overcrowded Lines
Figure 12. High Line Spacing

A Deep Learning Based Analysis of the Big Five Personality … 20
Table 9. Line Spacing and its interpretation
Line spacing Interpretation
Lines evenly spaced Good organizing skills, clear thoughts
Lines over crowded Poor organizing skills, confused thoughts
T - Features
The letter 't' is one of the letters that reveals a lot of precise writer information from their
handwriting. There are different ways to make the stem, the cross on the T-bar, and not even
the entrance and exit to this message, each of which relates to a person's particular personality
trait, thus allowing people to write the letter t in many different ways. A self-esteem
personality trait is revealed by the t-letter analysis (Champa, et al., 2010; Gavrilescu, et al.,
2018).
When the I) T-bar is crossed very high (Figure 13), it represents the high self-esteem ii)
T-bar is crossed above the middle zone (Figure 14), it represents medium self-esteem iii) T-
bar is crossed very low (Figure 15), it represents low self-esteem.
Figure 13. T-bar crossed very high
Figure 14. T-bar crossed medium
Figure 15. T-bar crossed very low
Table 10 enlists the various T-bar positions and their interpretation. The T-bar crossed
very high shows overall good self-image and self-confidence. The bar crossed at a medium

Journal of Information Technology Management, 2020, Special Issue 21
height indicates a practical nature, whereas the bar crossed low shows fear of failure and low
self-confidence.
Table 10. T-bar heights and their interpretation
t- bar height Interpretation
T-bar crossed very high Overall good self-image, self-confidence, ambitious, high goals
T-bar crossed medium Practical nature, most common positive attitude of successful people
T-bar crossed very low Fear of failure, low self-confidence, resists change
Implementation
The data firstly is trained on the standard models of machine learning and considered as our
models of foundation. We use the extracted features as described in Dataset Collection and
Preprocessing as our input set for training and divide the data points into five categories
within each personality category using Table 5 for the output set.
Logistic Regression
Logistic regression is a statistical model that uses the sigmoid function applied to a binary
variable. The dependent variable usually has two possible values, such as a 0 or 1.
Support Vector Machines
Support Vector Machines are Machine Learning models which perform Supervised Learning
and majorly used for classification and regression analysis. It processes the input and forms a
hyperplane which is a line in two dimensions, called the decision boundary.
Decision Trees
Decision tree is a tree-like structure, where each internal node represents the test case where
the attributes are split, each branch represents the test result and each leaf node represents the
class label. Decision tree algorithms are referred to as CART (Regression and Classification
Trees).
Random Forest
In the random forest algorithm, many decision trees are ensembled. The huge number of
decision trees are trained on slightly different training data, and the nodes are divided in each
tree by using a limited amount of features. The output of the random forest is generated by
averaging each tree's predictions.

A Deep Learning Based Analysis of the Big Five Personality … 22
Extra Trees
Extra is an ensemble learning technique. It accumulates the results of multiple de-correlated
decision trees puts together in a “forest” to generate its classification result. It is similar to a
Random Forest Classifier, differing only in the aspect of construction of the decision trees in
the forest
Gradient Boosting
Gradient Boosting is a technique that trains many models in a gradual manner. The difference
between Gradient Boosting Algorithm and other algorithms, such as the AdaBoost algorithm,
lies in the way the algorithms identify the shortcomings of weak learners. AdaBoost uses high
weight data points while gradient boosting uses gradients in the loss function. Once the
baseline models are established, we propose our own models for this task.
We experiment with various Artificial Neural Network architectures since they are
shown to work well for psychological analysis (Huijie ,et al., 2014).
We propose two models:
a) Personality Analyzing Network (PAN): An Artificial Neural Network based model
b) Persona Net: A Convolutional Neural Network based model.
The learning algorithm of a Neural Network can be divided into two parts:
1) Forward propagation
2) Back propagation.
It is a gradient descent-based algorithm.
Forward Propagation
The Input
(1)
Set the input vector x to a0
For l = 1, …, L layers
(2)
(3)
Journal of Information Technology Management, 2020, Special Issue 23
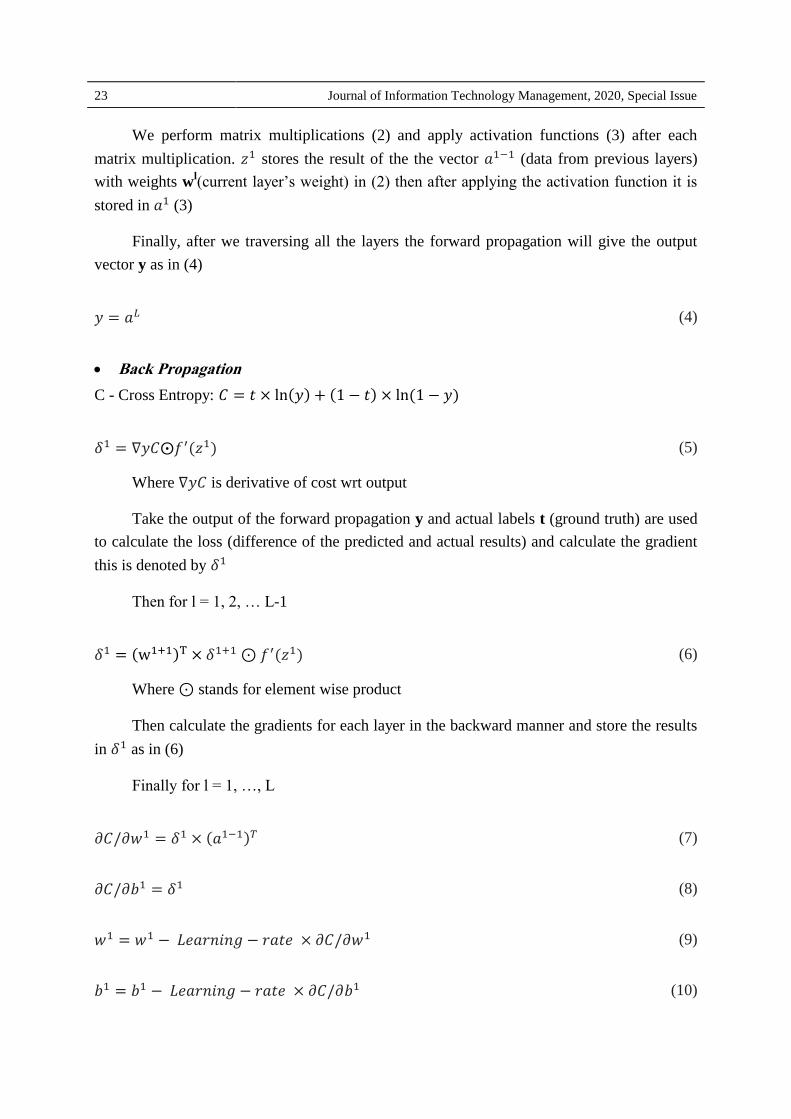
We perform matrix multiplications (2) and apply activation functions (3) after each
matrix multiplication. stores the result of the the vector (data from previous layers)
with weights wl(current layer’s weight) in (2) then after applying the activation function it is
stored in (3)
Finally, after we traversing all the layers the forward propagation will give the output
vector y as in (4)
(4)
Back Propagation
C - Cross Entropy:
(5)
Where is derivative of cost wrt output
Take the output of the forward propagation y and actual labels t (ground truth) are used
to calculate the loss (difference of the predicted and actual results) and calculate the gradient
this is denoted by
Then for l = 1, 2, … L-1
(6)
Where stands for element wise product
Then calculate the gradients for each layer in the backward manner and store the results
in as in (6)
Finally for l = 1, …, L
(7)
(8)
(9)
(10)

A Deep Learning Based Analysis of the Big Five Personality … 24
After calculating gradients for each layer, we calculate the gradients for each weights
(wl) as in (7) and biases (b
l) as in (8) and update w
l and b
l as in (9) and (10).
The proposed ANN based model consists of 3 different ANNs whose architectures are
shown below:
Figure 16. PAN model architecture trained to predict
levels of personality traits N, E and O
Figure 17. PAN model architecture trained to predict
levels of personality trait A

Journal of Information Technology Management, 2020, Special Issue 25
Figure 18. PAN model architecture trained to predict levels of personality trait C
The model specified in (Figure 16) is trained and tested on data for personality types N,
E, O. The Input layer is an 8-vector which are the features extracted from the images. It has 3
hidden layers and one output layer. Output Layer gives probabilities for the personality trait
level ranging from very low to very high in classes 0, 1, 2, 3, 4.
The model specified in (Figure 17) is trained and tested on data for personality types A.
The Input layer is an 8-vector which are the features extracted from the images. It has 4
hidden layers and one output layer. Output Layer gives probabilities for the personality trait
level ranging from very low to very high in classes 0, 1, 2, 3, 4.
The model specified in (Figure 18) is trained and tested on data for personality types C. The
Input layer is an 8-vector which are the features extracted from the images. It has 6 hidden
layers and one output layer. Output Layer gives probabilities for the personality trait level
ranging from very low to very high in classes 0, 1, 2, 3, 4.
Seeing the success of Convolutional Neural Networks (CNNs) in classifying images
(Li, et al., 2019), (Kim ,et al., 2019), (Sun ,et al., 2019), (Wertheimer,et al., 2019), (Tong ,et
al., 2019), (Ayan ,et al., 2019), (Arik ,et al., 2019), we also propose a CNN ‘PersonaNet’. Our
Convolutional Neural Network based model has the architecture shown in Figure 19.
Equation (11) shows the Convolution Operation used for 2D Images.
(10) ∑ ∑
The network uses Dropout and Regularization in order to avoid over fitting. The
network takes as input two images of shape (24, 24, 1) followed by two 2D convolutional
layers of stride = 2. The images are then flattened.
Once the images are flattened, they are then concatenated to form a dense layer. The
concatenation layer is followed by a ReLU activation. Batch Normalization and Dropout is
used to prevent over fitting.

A Deep Learning Based Analysis of the Big Five Personality … 26
Finally, the output is reshaped into the shape (5, 5) followed by a sigmoid layer in order
to classify the images.
Figure 19. PersonaNet architecture

Journal of Information Technology Management, 2020, Special Issue 27
Results
Baseline Models
Table 11. Precision and Recall for Baseline Machine Learning models
Model
N E O A C
P R P R P R P R P R
Support Vector Machine 0.7 0.7 0.85 0.85 0.65 0.65 0.0 0.0 0.0 0.0
Decision Trees 0.65 0.65 0.65 0.65 0.6 0.6 0.75 0.75 0.65 0.65
Random Forests 0.6 0.45 0.7 0.7 0.47 0.4 0.83 0.25 0.65 0.5
Extra Trees 0.66 0.5 0.85 0.85 0.61 0.55 0.72 0.4 0.69 0.45
Logistic Regression 0.70 0.6 0.85 0.85 0.625 0.5 0.0 0.0 0.7 0.35
Table 12. Accuracy of the Baseline Machine Learning Models
LR SVM DT RF ET
N 0.6 0.7 0.65 0.45 0.5
E 0.85 0.85 0.65 0.7 0.85
O 0.5 0.65 0.6 0.4 0.55
A 0.0 0 0.75 0.25 0.4
C 0.35 0 0.65 0.5 0.45
Figure 20. Accuracy of the different machine learning models over the five personalities
A Deep Learning Based Analysis of the Big Five Personality … 28
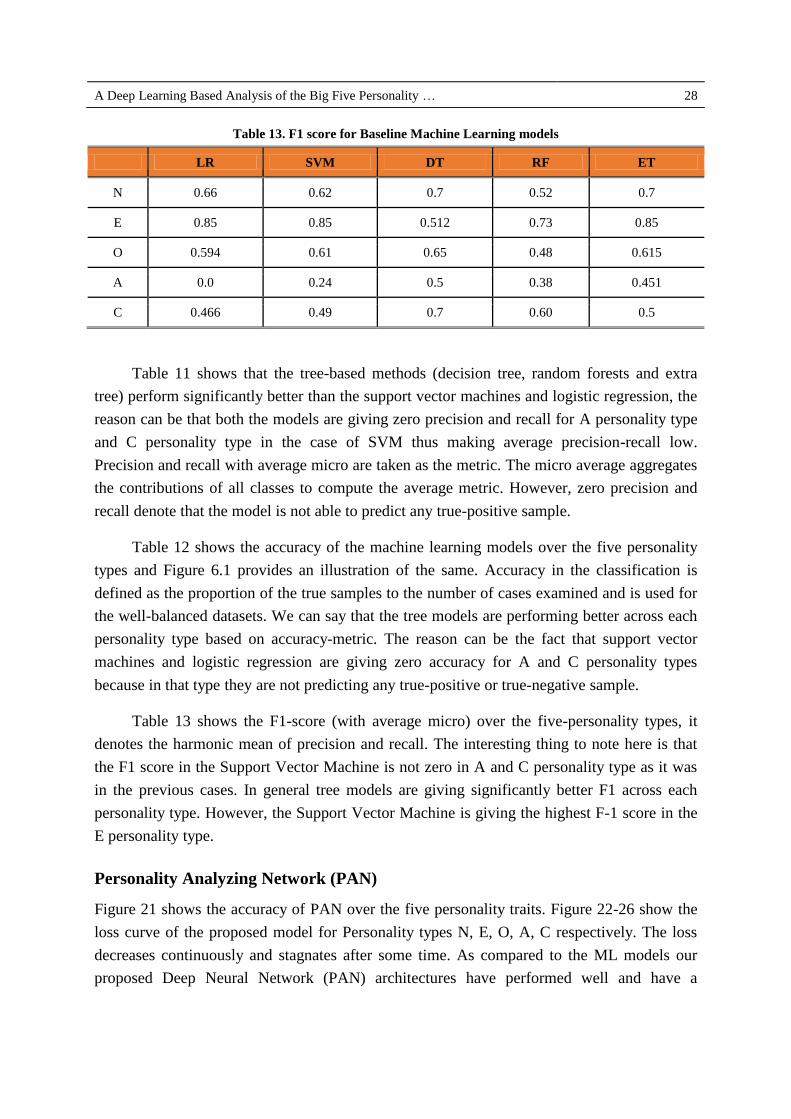
Table 13. F1 score for Baseline Machine Learning models
LR SVM DT RF ET
N 0.66 0.62 0.7 0.52 0.7
E 0.85 0.85 0.512 0.73 0.85
O 0.594 0.61 0.65 0.48 0.615
A 0.0 0.24 0.5 0.38 0.451
C 0.466 0.49 0.7 0.60 0.5
Table 11 shows that the tree-based methods (decision tree, random forests and extra
tree) perform significantly better than the support vector machines and logistic regression, the
reason can be that both the models are giving zero precision and recall for A personality type
and C personality type in the case of SVM thus making average precision-recall low.
Precision and recall with average micro are taken as the metric. The micro average aggregates
the contributions of all classes to compute the average metric. However, zero precision and
recall denote that the model is not able to predict any true-positive sample.
Table 12 shows the accuracy of the machine learning models over the five personality
types and Figure 6.1 provides an illustration of the same. Accuracy in the classification is
defined as the proportion of the true samples to the number of cases examined and is used for
the well-balanced datasets. We can say that the tree models are performing better across each
personality type based on accuracy-metric. The reason can be the fact that support vector
machines and logistic regression are giving zero accuracy for A and C personality types
because in that type they are not predicting any true-positive or true-negative sample.
Table 13 shows the F1-score (with average micro) over the five-personality types, it
denotes the harmonic mean of precision and recall. The interesting thing to note here is that
the F1 score in the Support Vector Machine is not zero in A and C personality type as it was
in the previous cases. In general tree models are giving significantly better F1 across each
personality type. However, the Support Vector Machine is giving the highest F-1 score in the
E personality type.
Personality Analyzing Network (PAN)
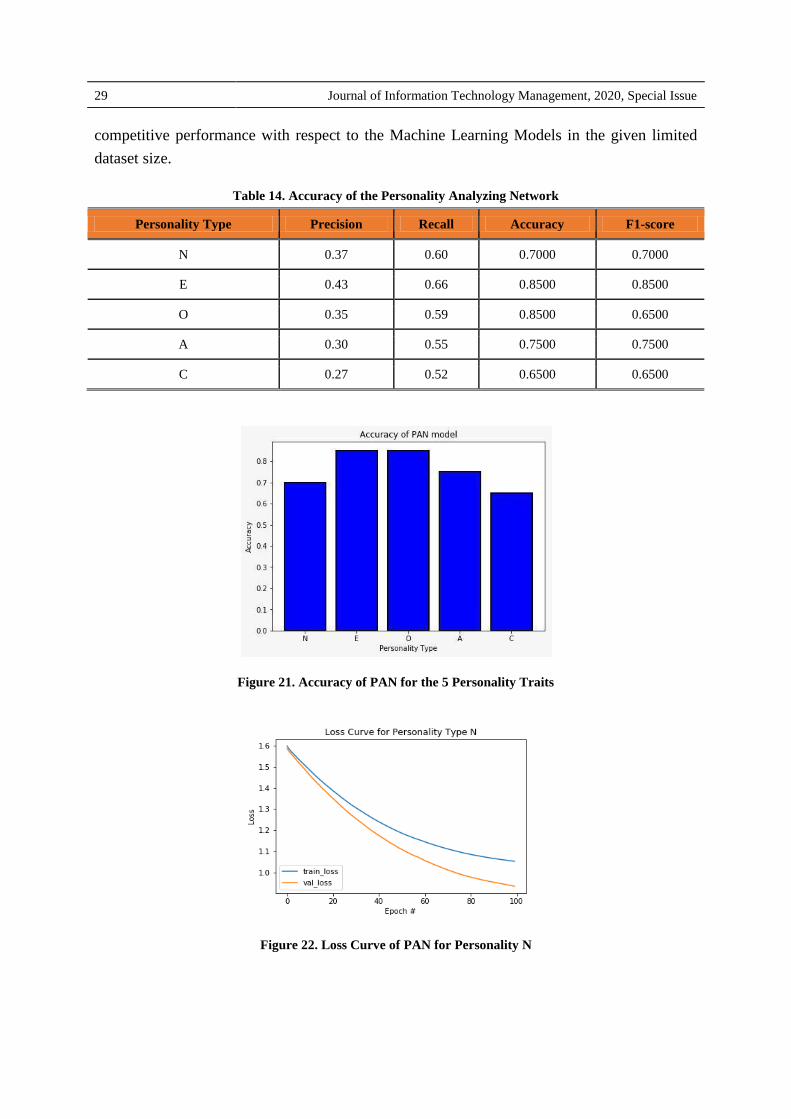
Figure 21 shows the accuracy of PAN over the five personality traits. Figure 22-26 show the
loss curve of the proposed model for Personality types N, E, O, A, C respectively. The loss
decreases continuously and stagnates after some time. As compared to the ML models our
proposed Deep Neural Network (PAN) architectures have performed well and have a
Journal of Information Technology Management, 2020, Special Issue 29
competitive performance with respect to the Machine Learning Models in the given limited
dataset size.
Table 14. Accuracy of the Personality Analyzing Network
Personality Type Precision Recall Accuracy F1-score
N 0.37 0.60 0.7000 0.7000
E 0.43 0.66 0.8500 0.8500
O 0.35 0.59 0.8500 0.6500
A 0.30 0.55 0.7500 0.7500
C 0.27 0.52 0.6500 0.6500
Figure 21. Accuracy of PAN for the 5 Personality Traits
Figure 22. Loss Curve of PAN for Personality N

A Deep Learning Based Analysis of the Big Five Personality … 30
Figure 23. Loss Curve of PAN for Personality E
Figure 24. Loss Curve of PAN for Personality O
Figure 25. Loss Curve of PAN for Personality A
Figure 26. Loss Curve of PAN for Personality C
Journal of Information Technology Management, 2020, Special Issue 31
Table 14 records the Precision, Recall, Accuracy, F1 score of the PAN architectures
with respect to the Five Personality traits N, E, O, A, C. The Personality Analyzing Network
(PAN) performs fairly well as compared to the machine learning models like Decision Tree,
given the limited size of data and the same features were fed into the ANN architectures. The
proposed architecture performs best for the ‘Extraversion’ personality trait.
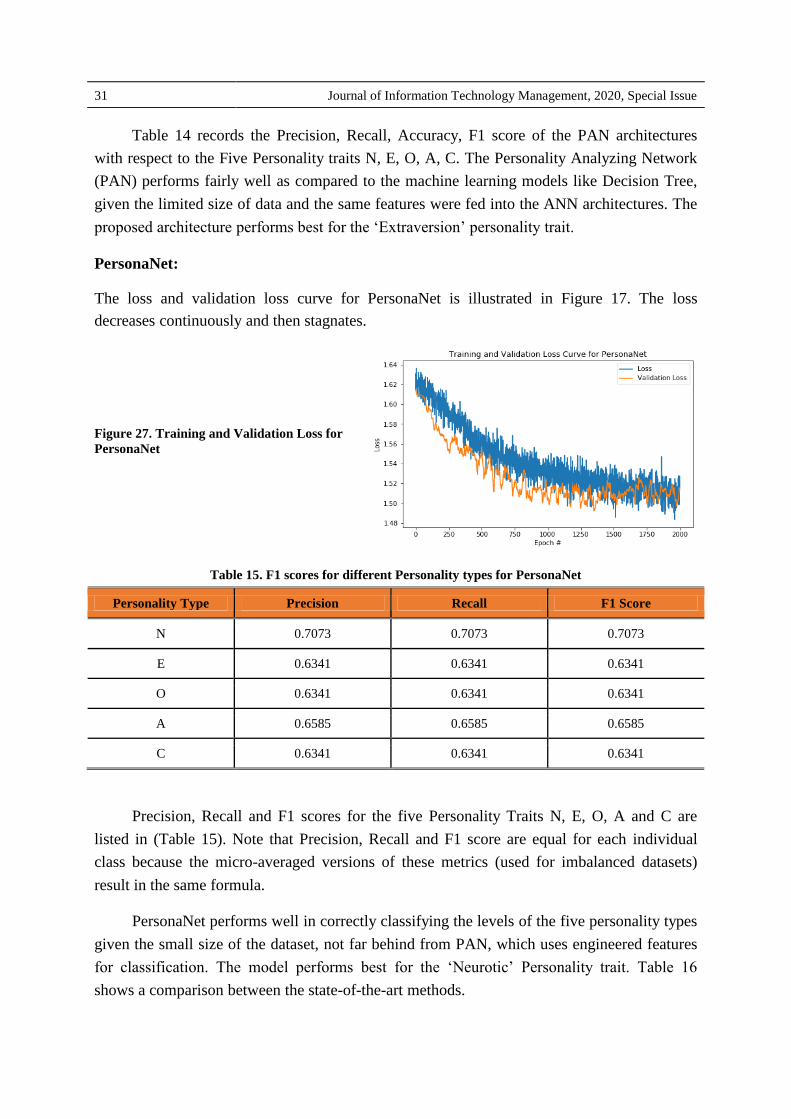
PersonaNet:
The loss and validation loss curve for PersonaNet is illustrated in Figure 17. The loss
decreases continuously and then stagnates.
Figure 27. Training and Validation Loss for
PersonaNet
Table 15. F1 scores for different Personality types for PersonaNet
Personality Type Precision Recall F1 Score
N 0.7073 0.7073 0.7073
E 0.6341 0.6341 0.6341
O 0.6341 0.6341 0.6341
A 0.6585 0.6585 0.6585
C 0.6341 0.6341 0.6341
Precision, Recall and F1 scores for the five Personality Traits N, E, O, A and C are
listed in (Table 15). Note that Precision, Recall and F1 score are equal for each individual
class because the micro-averaged versions of these metrics (used for imbalanced datasets)
result in the same formula.
PersonaNet performs well in correctly classifying the levels of the five personality types
given the small size of the dataset, not far behind from PAN, which uses engineered features
for classification. The model performs best for the ‘Neurotic’ Personality trait. Table 16
shows a comparison between the state-of-the-art methods.

A Deep Learning Based Analysis of the Big Five Personality … 32

Journal of Information Technology Management, 2020, Special Issue 33
Discussion
A comparison of our novel architecture with the baseline models shows a great boost in
classification performance. The Personality Analyzing Network (PAN), which takes in the
engineered features as input, performs better than all other models.
PersonaNet performs well given the small size of the dataset and class imbalance, which
may not be helpful in feature extraction. Given more data, PersonaNet may be able to
outperform PAN. So, as compared to the baseline models, our proposed architectures manage
to perform better.
Conclusion
We compare our algorithm’s performance with baseline machine learning models on our
dataset. Testing our novel architecture on this dataset, we compare our algorithm based on
various metrics, and show that our novel algorithm performs better than the baseline Machine
Learning models.
Hence, we see that our proposed architectures outperform the baseline Machine
Learning models for the analysis of the Big Five Personality Traits.
Acknowledgements
We thank Emaman Mansuri, M.A. Applied Psychology, South campus, University of Delhi
for assistance with the calculation of the Personality Scores and her valuable insight and
inputs on the tests necessary for label generation.
References
Ahmed, M., Rasool, A. G., Afzal, H., & Siddiqi, I. (2017). Improving handwriting-based gender
classification using ensemble classifiers. Expert Systems with Applications, 85, 158-168.
Al Maadeed, S., & Hassaine, A. (2014). Automatic prediction of age, gender, and nationality in offline
handwriting. EURASIP Journal on Image and Video Processing, 2014(1), 10.
Amend, K. K., & Ruiz, M. S. (2000). Handwriting analysis: The complete basic book. Red
Wheel/Weiser.
Bangerter, A., König, C. J., Blatti, S., & Salvisberg, A. (2009). How widespread is graphology in
personnel selection practice? A case study of a job market myth. International Journal of
Selection and Assessment, 17(2), 219-230.
Bhunia, A. K., Das, A., Bhunia, A. K., Kishore, P. S. R., & Roy, P. P. (2019). Handwriting recognition
in low-resource scripts using adversarial learning. In Proceedings of the IEEE Conference on
Computer Vision and Pattern Recognition (pp. 4767-4776).
Blumenstein, M., Verma, B., & Basli, H. (2003, August). A novel feature extraction technique for the
recognition of segmented handwritten characters. In Seventh International Conference on
Document Analysis and Recognition, 2003. Proceedings. (pp. 137-141). IEEE.
A Deep Learning Based Analysis of the Big Five Personality … 34
Champa, H. N., & AnandaKumar, K. R. (2010, August). Automated human behavior prediction
through handwriting analysis. In 2010 First International Conference on Integrated Intelligent
Computing (pp. 160-165). IEEE.
Chaudhari, K., & Thakkar, A. (2019). Survey on handwriting-based personality trait
identification. Expert Systems with Applications, 124, 282-308.
Cobb-Clark, D. A., & Schurer, S. (2012). The stability of big-five personality traits. Economics
Letters, 115(1), 11-15.
Coll, R., Fornés, A., & Lladós, J. (2009, July). Graphological analysis of handwritten text documents
for human resources recruitment. In 2009 10th International Conference on Document Analysis
and Recognition (pp. 1081-1085). IEEE.
Dahlen, E. R., & White, R. P. (2006). The Big Five factors, sensation seeking, and driving anger in the
prediction of unsafe driving. Personality and individual differences, 41(5), 903-915.
Gavrilescu, M., & Vizireanu, N. (2018). Predicting the big five personality traits from
handwriting. EURASIP Journal on Image and Video Processing, 2018(1), 57.
Giluk, T. L. (2009). Mindfulness, Big Five personality, and affect: A meta-analysis. Personality and
Individual Differences, 47(8), 805-811.
He, T., Zhang, Z., Zhang, H., Zhang, Z., Xie, J., & Li, M. (2019). Bag of tricks for image
classification with convolutional neural networks. In Proceedings of the IEEE Conference on
Computer Vision and Pattern Recognition (pp. 558-567).
James, K. H., & Engelhardt, L. (2012). The effects of handwriting experience on functional brain
development in pre-literate children. Trends in neuroscience and education, 1(1), 32-42.
Joshi, P., Ghaskadbi, P., & Tendulkar, S. (2018, July). A Machine Learning Approach to
Employability Evaluation Using Handwriting Analysis. In International Conference on
Advanced Informatics for Computing Research (pp. 253-263). Springer, Singapore.
Kim, J., Kim, T., Kim, S., & Yoo, C. D. (2019). Edge-labeling graph neural network for few-shot
learning. In Proceedings of the IEEE Conference on Computer Vision and Pattern
Recognition (pp. 11-20).
Klimoski, R. J., & Rafaeli, A. (1983). Inferring personal qualities through handwriting
analysis. Journal of Occupational Psychology, 56(3), 191-202.
Komarraju, M., Karau, S. J., Schmeck, R. R., & Avdic, A. (2011). The Big Five personality traits,
learning styles, and academic achievement. Personality and individual differences, 51(4), 472-
477.
Landers, R. N., & Lounsbury, J. W. (2006). An investigation of Big Five and narrow personality traits
in relation to Internet usage. Computers in human behavior, 22(2), 283-293.
Lee, G. C., Yeh, F. H., Chen, Y. J., & Chang, T. K. (2017). Robust handwriting extraction and lecture
video summarization. Multimedia Tools and Applications, 76(5), 7067-7085.
Li, H., Eigen, D., Dodge, S., Zeiler, M., & Wang, X. (2019). Finding task-relevant features for few-
shot learning by category traversal. In Proceedings of the IEEE Conference on Computer Vision
and Pattern Recognition (pp. 1-10).
Lin, H., Jia, J., Guo, Q., Xue, Y., Li, Q., Huang, J., ... & Feng, L. (2014, November). User-level
psychological stress detection from social media using deep neural network. In Proceedings of
the 22nd ACM international conference on Multimedia (pp. 507-516).

Journal of Information Technology Management, 2020, Special Issue 35
Luria, G., & Rosenblum, S. (2012). A computerized multidimensional measurement of mental
workload via handwriting analysis. Behavior research methods, 44(2), 575-586.
Luria, G., Kahana, A., & Rosenblum, S. (2014). Detection of deception via handwriting behaviors
using a computerized tool: Toward an evaluation of malingering. Cognitive Computation, 6(4),
849-855.
Mouly, S., Mahé, I., Champion, K., Bertin, C., Popper, P., De Noblet, D., & Bergmann, J. F. (2007).
Graphology for the diagnosis of suicide attempts: a blind proof of principle controlled
study. International journal of clinical practice, 61(3), 411-415.
Poznanski, A., & Wolf, L. (2016). Cnn-n-gram for handwriting word recognition. In Proceedings of
the IEEE conference on computer vision and pattern recognition (pp. 2305-2314)
Siddiqi, I., Djeddi, C., Raza, A., & Souici-Meslati, L. (2015). Automatic analysis of handwriting for
gender classification. Pattern Analysis and Applications, 18(4), 887-899.
Sueiras, J., Ruiz, V., Sanchez, A., & Velez, J. F. (2018). Offline continuous handwriting recognition
using sequence to sequence neural networks. Neurocomputing, 289, 119-128.
Sun, Q., Liu, Y., Chua, T. S., & Schiele, B. (2019). Meta-transfer learning for few-shot learning.
In Proceedings of the IEEE conference on computer vision and pattern recognition (pp. 403-
412).
Tang, T. L. P. (2012). Detecting honest people’s lies in handwriting. Journal of Business
Ethics, 106(4), 389-400.
Wertheimer, D., & Hariharan, B. (2019). Few-shot learning with localization in realistic settings.
In Proceedings of the IEEE Conference on Computer Vision and Pattern Recognition (pp.
6558-6567).
Wertheimer, D., & Hariharan, B. (2019). Few-shot learning with localization in realistic settings.
In Proceedings of the IEEE Conference on Computer Vision and Pattern Recognition (pp.
6558-6567).
Yang, K., Mall, S., & Glaser, N. (2017). Prediction of personality first impressions with deep bimodal
LSTM. Technical report, arXiv, 2017. URL http://cs231n. stanford. edu/reports/2017/pdfs/713.
pdf.
Bibliographic information of this paper for citing:
Elngar, A. Ahmed; Jain, Nikita; Sharma, Divyanshu; Negi, Himani; Trehan, Anuj & Srivastava, Akash (2020).
A Deep Learning Based Analysis of the Big Five Personality Traits from Handwriting Samples Using Image
Processing. Journal of Information Technology Management, Special Issue, 3-36.
Copyright © 2020, Ahmed A. Elngar, Nikita Jain, Divyanshu Sharma, Himani Negi, Anuj Trehan and Akash Srivastava.