a dynamical model of human immune response to influenza a …swigon/papers/hsc_jtb.pdf · ·...
TRANSCRIPT

ARTICLE IN PRESS
0022-5193/$ - se
doi:10.1016/j.jtb
�CorrespondUniversity of
15260, USA. T
E-mail addr
Please cite thi
Biology (2007
Journal of Theoretical Biology ] (]]]]) ]]]–]]]
www.elsevier.com/locate/yjtbi
A dynamical model of human immune responseto influenza A virus infection
Baris Hancioglua, David Swigona,b,c, Gilles Clermontb,c,d,�
aDepartment of Mathematics, 301 Thackeray, University of Pittsburgh, Pittsburgh, PA 15260, USAbCIRM (Center for Inflammation and Regenerative Modeling), 100 Technology Drive Suite 200, Pittsburgh, PA 15219-3110, USA
cCRISMA Laboratory, University of Pittsburgh, Pittsburgh, PA 15261, USAdDepartment of Critical Care Medicine, 3550 Terrace St, University of Pittsburgh Medical Center, Pittsburgh, PA 15261, USA
Received 11 May 2006; received in revised form 8 November 2006; accepted 11 December 2006
Abstract
We present a simplified dynamical model of immune response to uncomplicated influenza A virus (IAV) infection, which focuses on
the control of the infection by the innate and adaptive immunity. Innate immunity is represented by interferon-induced resistance to
infection of respiratory epithelial cells and by removal of infected cells by effector cells (cytotoxic T-cells and natural killer cells).
Adaptive immunity is represented by virus-specific antibodies. Similar in spirit to the recent model of Bocharov and Romanyukha [1994.
Mathematical model of antiviral immune response. III. Influenza A virus infection. J. Theor. Biol. 167, 323–360], the model is
constructed as a system of 10 ordinary differential equations with 27 parameters characterizing the rates of various processes
contributing to the course of disease. The parameters are derived from published experimental data or estimated so as to reproduce
available data about the time course of IAV infection in a naı̈ve host. We explore the effect of initial viral load on the severity and
duration of the disease, construct a phase diagram that sheds insight into the dynamics of the disease, and perform sensitivity analysis on
the model parameters to explore which ones influence the most the onset, duration and severity of infection. To account for the
variability and speed of adaptation of the adaptive response to a particular virus strain, we introduce a variable that quantifies the
antigenic compatibility between the virus and the antibodies currently produced by the organism. We find that for small initial viral load
the disease progresses through an asymptomatic course, for intermediate value it takes a typical course with constant duration and
severity of infection but variable onset, and for large initial viral load the disease becomes severe. This behavior is robust to a wide range
of parameter values. The absence of antibody response leads to recurrence of disease and appearance of a chronic state with nontrivial
constant viral load.
r 2007 Elsevier Ltd. All rights reserved.
Keywords: Immunology; Mathematical modeling; Human immune response; Influenza; Antigenic distance
1. Introduction
Influenza is a highly cytopathic, contagious, acuterespiratory disease caused by an influenza virus infection(Mohler et al., 2005; Nicholson et al., 1998; Tamura andKurata, 2004). Transmission is caused by direct contactsuch as hand shake or by airborne virus (Mohler et al.,2005). The virus is an enveloped virus with seven internal
e front matter r 2007 Elsevier Ltd. All rights reserved.
i.2006.12.015
ing author. Department of Critical Care Medicine,
Pittsburgh, Scaife 606B, 3550 Terrace, Pittsburgh, PA
el.: +1 412 647 7980; fax: +1 412 647 3791.
ess: [email protected] (G. Clermont).
s article as: Hancioglu, B., et al., A dynamical model of human
), doi:10.1016/j.jtbi.2006.12.015
proteins (nucleoprotein (NP), three polymerase proteins(PA, PB1, and PB2), two matrix proteins (M1 and M2),and nonstructural proteins (NS2)) and two externalglycoproteins, hemagglutinin (HA) and neuraminidase(NA) (Tamura et al., 2005). It is divided into types A, B,and C, according to the antigenic differences between NPand matrix protein (M) (Tamura et al., 2005). Influenza Aviruses are subdivided into subtypes such as H1N1,H16N9, etc. based on the antigenic signatures of the majorsurface proteins HA (16 subtypes differ by 30%) and NA(Webster et al., 2006). The viruses in each subtype regularlyundergo gradual changes in genetic makeup through pointmutations in the HA and NA molecules (antigenic drift)
immune response to influenza A virus infection. Journal of Theoretical

ARTICLE IN PRESSB. Hancioglu et al. / Journal of Theoretical Biology ] (]]]]) ]]]–]]]2
which cause local outbreaks of influenza and small sizeepidemics. Occasionally, a major change in the HA andNA proteins can arise from the exchange of geneticmaterial (reassortment) between the avian influenza genepool and human influenza genes during co-infection(Tamura and Kurata, 2004) or adaptive mutation. Such achange is termed as ‘‘antigenic shift’’ and since thepopulation has typically limited or no immunity againstthe modified virus, a global pandemic may result.
In the 20th century, three global pandemics occurred.The ‘‘Spanish flu’’ of 1918–19, which was of the subtypeH1N1, infected approximately one third of the entirehuman population (Taubenberger and Morens, 2006).More than a half million people died in the US and about50 million people died worldwide (Taubenberger andMorens, 2006). In 1957–58, ‘‘Asian flu’’ of the subtypeH2N2 caused about 70,000 deaths in the US. In 1968–69,‘‘Hong Kong flu’’ of the subtype H3N2 caused about34,000 deaths in the US. Many scientists believe that it isonly a matter of time until the next pandemics occurs. Inthe absence of proper preparation, a pandemic could cause89,000–207,000 deaths, 314,000–734,000 hospitalizations,18–42 million outpatient visits, and another 20–47 millionpeople being sick in the US (Meltzer et al., 1999). Theeconomic impact could range between $71.3 and $166.5billion and between 15% and 35% of the US populationcould be affected from the infection (Meltzer et al., 1999).Currently, there is a big concern about the pandemicpotential of the avian flu of subtype H5N1 which hasalready caused considerable damage, mainly to birds: morethan 140 million domestic birds have been killed by thevirus or culled to stem its spread till now and more than130 people have been infected in various countries in Asia(Webster et al., 2006). Almost half of the infected peopledied. These numbers show the potential danger of IAVinfection for human population and the importance ofunderstanding virus–immune system interactions whichhelps for taking necessary control measures (vaccination orantiviral drugs).
Mathematical modeling has proven to be a valuable toolin the understanding of immune response to infectiousdiseases (Perelson, 2002) which helps in clarifying andtesting hypotheses, finding the smallest number of factorssufficient to explain the biological phenomena and analyz-ing the experimental results (Asquith and Bangham, 2003).Modeling has a substantial impact on research at themolecular level (Nowak and May, 2000). Recently,important results have been obtained in the mathematicalmodeling of virus dynamics for the HIV (Nowak andBangham, 1996; Perelson et al., 1993, 1996), hepatitis B(Marchuk et al., 1991), hepatitis C (Neumann et al.,1998) and influenza (Bocharov and Romanyukha, 1994)infections.
In this paper we construct a simplified, biologicallyjustified, mathematical model of the dynamics of IAVinfection and the human immune response to suchinfection. We do not strive to obtain a detailed model
Please cite this article as: Hancioglu, B., et al., A dynamical model of human
Biology (2007), doi:10.1016/j.jtbi.2006.12.015
accounting for all known components of the immunesystem and their interactions. Rather, we focus on threeimportant components of the immune response: theinterferon and cellular components of innate immunityand the adaptive immunity, all of which have the same goalof limiting the concentration of the virus and the damageto the system, but which achieve this goal using differentstrategies: interferon immunity by removing the ‘‘sub-strate’’ that virus needs for reproduction (i.e., the healthycells), cellular immunity by removing the source of newviruses (i.e., the infected cells), and adaptive immunity bylowering the effective concentration of the virus.Our main goal is to uncover the relative roles played by
each immune strategy during the course of the disease tohave a better understanding of what drives the intensity ofsymptoms, infectivity of the virus and the host, andduration of the disease. In subsequent research, the modelwill serve as a tool for predicting the effect of therapeuticinterventions on the course of the disease, as well as amodel for understanding of basic processes of immuneresponse to multiple infections. Our second goal is todevelop a model of the immune response of individualsthat can be used as a practical basis for multi-scalepopulation susceptible-infected-recovered (SIR) modelsthat are used to describe geographic disease spread andevaluate the impact of containment strategies. As such, thisbiological model should account for individual character-istics of the human host and the virulence of a specific virussubtype or strain and should yield predictions about theonset, severity and infectivity of the IAV infection in anindividual as a function of the initial viral load and existingimmunity (Clermont et al., 2004). Yet, the model should besufficiently simple to allow fast computation of individualimmune responses as part of multi-scale simulations.
2. Methods
2.1. Biology of influenza
Influenza A virus (IAV) attacks the host respiratory tractmucosa, interacts with healthy epithelial cells and infectsthem by binding to cell surface receptors via one of themajor surface glycoproteins, HA (Tamura and Kurata,2004). The virus replicates in infected cells and severalhours after cellular infection, newly synthesized virusparticles are released by the action of another majorglycoprotein, NA (Tamura et al., 2005). The response ofthe host to IAV infection involves a cascade of eventsmediated by several effector cells and molecules (Ada andJones, 1986; Tamura and Kurata, 2004) that neutralize freevirus, kill infected cells and limit the spread of viralparticles by increasing healthy cell resistance to infection.Antigen presenting cells (APC) are essential in the
induction and amplification of the human immuneresponse (Akira et al., 2001). Exogenous viral antigens,which comprise inactive viral particles, intact viruses andapoptotic, infected cells, are taken up by APC through
immune response to influenza A virus infection. Journal of Theoretical

ARTICLE IN PRESS
Effector
cells
E
Antigen
presenting
cells
M
Resistant cells
RInterferon
F
Dead cells
D
Healthy cellsH
Infected cells
I
IAV
V
Plasma cells
P
Antibody
A
Antigenic
compatibility
S
Th2 Th1
Bcells
Fig. 1. Schematic representation of interactions included in the model.
The influenza virus (IAV) is shown as red hexagon, the four different cell
types are shown in cyan. Components of adaptive immunity are shown in
orange, cellular component of innate immunity in purple, and interferon
component in green. Upregulation is represented by lines terminated with
arrows and inhibition by lines terminated with bars. The inter-conversion
of cell types (cyan) is indicated by dashed arrows. Dashed ovals represent
details of the mechanism ignored in this model. Homeostatic maintenance
of effector and plasma cell populations are indicated by self-regulating
loops.
B. Hancioglu et al. / Journal of Theoretical Biology ] (]]]]) ]]]–]]] 3
endocytosis and provide a potential source of peptides thatcould bind to MHC class I or II molecules in the APC(Nguyen et al., 1998; Tamura and Kurata, 2004; Tulpet al., 1994). The role of the APC is to stimulate bothinnate and adaptive immunity.
As the first line of defense, APC and infected cellsstimulate the innate immunity by secreting interferon a andb (IFN) molecules (Julkunen et al., 2000; Lamb, 1996;Ronni et al., 1995; Sareneva et al., 1998; Stark et al., 1998)which interact with healthy cells and convert them to aninfection resistant state, thereby preventing the virus fromspreading efficiently and allowing the adaptive immuneresponse enough time to develop and eliminate the virus(Price et al., 2000). Another role of IFN is to stimulatesymptoms such as fever which occurs in the early stages ofinfection. IFN levels rise rapidly after infection andcorrelate directly with the degree of viral replication inferrets, mice and humans (Tamura and Kurata, 2004;Wyde et al., 1982). Magnitude of the fever correlatesstrongly with the level of virus shedding in humans andanimals (Tamura and Kurata, 2004).
As a second line of defense, APC stimulate the cellularcomponent of innate immunity which consists of effectorcells (cytotoxic T cells (CTL) or natural killer cells (NK))that destroy infected cells before they can release a maturevirus. Activated T cells produce various factors which areextremely important for the kinetics of the IAV infection:helper T cells secrete IL-2 and other lymphocytes and CTLproduce IFN-g, which increases the expression of MHCantigens acting to enhance virus-infected cell destruction.The peptide-class I MHC complexes presented on theinfected cells are recognized by class-I MHC-restrictedCD8+ memory T cells (Th1 cells), which destroy theinfected cells (Tamura et al., 2005). The specificity ofmemory T cells is directed against viral internal proteins;NP is the strongest of these antigens (Yewdell et al., 1985).Since structure of these antigens is conserved within thetype of virus, Th1 cells against these antigens are cross-reactive within the type of influenza (Tamura et al., 2005).
Finally, APC stimulate adaptive immunity by activatingthe proliferation of virus-specific plasma cells whichproduce antibodies (Abs) that bind with IAV and renderit ineffective. HA and NA are taken up in an endocyticvesicle pathway of the APC and are degraded; the peptidesof these antigens are loaded on class-II MHC moleculesand then expressed on the APC (Tulp et al., 1994).Thepeptide class II MHC complexes are recognized by class-IIMHC-restricted CD4+ T cells (Th2 cells). Th2 cellstimulation by antigen recognition results in the produc-tion of specific Abs to HA and NA molecules. Anti-HAAbs neutralize the infectivity of the virus, whereas anti-NAAbs prevent the release of viruses from infected cells(Johansson et al., 1989). Thus, anti-HA Abs are primarilyresponsible for preventing infection, while anti-NA Absand CTL specific for viral core proteins are responsible forreducing viral spread and thereby for accelerating therecovery from influenza (Tamura et al., 2005).
Please cite this article as: Hancioglu, B., et al., A dynamical model of human
Biology (2007), doi:10.1016/j.jtbi.2006.12.015
The respiratory tract mucosa is not only the site ofinfection by influenza viruses but also the site of defenseagainst viral infection in the host (Tamura and Kurata,2004). The recovery process after primary infectioninvolves two phases: an early phase (days 5–7), character-ized by a rapid decrease in virus titer via killing of the virus-infected epithelial cells by MHC class I restricted CD8+
CTLs, which appear with a peak at day 7 is cellularresponse dependent, while a late phase (day 7 onwards),characterized by a more protracted decrease that ultimatelyresults in clearance, depends on the adaptive response(Tamura and Kurata, 2004). Since flu symptoms emergewithin a few days of inoculation, acquired immunityappearing after the first week of infection cannot preventthe onset of respiratory symptoms. Therefore, effectiveimmunity must be induced in advance by natural infectionor vaccination in order to prevent disease.
2.2. Model development
The model of human immune response against IAVinfection we consider is a simplified model of population-dynamics type which consists of the following interactions(see Fig. 1). The epithelial cells of the respiratory tract areassumed to be in one of four possible states: healthy (H),infected (I), dead (D), or resistant (R) to infection. Thetotal number of epithelial cells (i.e., H+I+D+R) isassumed constant. The virus particles (V) interact withhealthy cells and infect them. Infected cells release newvirus particles upon their death. Proliferation of healthycells causes regeneration and decrease in the proportion ofdead cells. Dead cells stimulate the activation of APC (M).
immune response to influenza A virus infection. Journal of Theoretical

ARTICLE IN PRESS
Table 1
Model variables and scaling factors
Variable Decription Scaling factor
V Viral load per epithelial cell� H� ¼ 1.7� 10�11M
H Proportion of healthy cells H� ¼ 1.7� 10�11M
I Proportion of infected cells H� ¼ 1.7� 10�11M
M Activated antigen presenting cells per homeostatic level M� ¼ 10�15M
F Interferons per homeostatic level of macrophages M� ¼ 10�15M
R Proportion of resistant cells H� ¼ 1.7� 10�11M
E Effector cells per homeostatic level E� ¼ 10�16M
P Plasma cells per homeostatic level P� ¼ 1.8139� 10�20M
A Antibodies per homeostatic level A� ¼ 7.2� 10�11M
S Antigenic distance
�V ¼ 1 corresponds to 1010 particles/ml respiratory epithelial cells.
B. Hancioglu et al. / Journal of Theoretical Biology ] (]]]]) ]]]–]]]4
APC stimulate the production of interferon a and b (F)that interact with healthy cells and convert them to aresistant state. APC also stimulate the proliferation ofeffector cells (E) that destroy infected cells. Finally, theystimulate the production of plasma cells (P) which, in turn,produce antibodies (A) that neutralize virus. This neutra-lization is modulated by the antigenic compatibility (S)between virus and antibodies currently produced bythe organism. S quantifies the affinity between antibodiesand virus.
These interactions were used in the construction of asystem of 10 ordinary differential equations describing thedynamics of the main variables, listed in Table 1, whichcorrespond to the components of the immune responseshown in Fig. 1:
dV
dt¼ gV I � gVA SAV � gVH HV � aV V �
aV1V
1þ aV2V, (1)
dH
dt¼ bHDDðH þ RÞ þ aRR� gHV VH � bHF FH, (2)
dI
dt¼ gHV VH � bIE EI � aI I , (3)
dM
dt¼ ðbMDDþ bMV V Þð1�MÞ � aMM, (4)
dF
dt¼ bF M þ cF I � bFH HF � aF F , (5)
dR
dt¼ bHF FH � aRR, (6)
dE
dt¼ bEM ME � bEI IE þ aEð1� EÞ, (7)
dP
dt¼ bPM MPþ aPð1� PÞ, (8)
dA
dt¼ bAP� gAV SAV � aAA, (9)
Please cite this article as: Hancioglu, B., et al., A dynamical model of human
Biology (2007), doi:10.1016/j.jtbi.2006.12.015
dS
dt¼ rPð1� SÞ. (10)
No differential equation is needed for the proportion ofdead cells (D) which is given by
D ¼ 1�H � R� I . (11)
The variable D serves as a marker for tissue damage(Hayden et al., 1998) and an indicator of the severity ofdisease. All variables have been rescaled by their constanthomeostatic values (see Table 1) and hence the system(1)–(11) is dimensionless.The interactions are based on clonal selection theory,
mass–action kinetics, characteristics of interactions and thebirth–death balances of populations of cells and molecules:Eq. (1) of the system describes the rate of change of virusconcentration V. It expresses the production rate of a viralparticle by infected cells, rate of neutralization of IAV byspecific antibodies, the rate of adsorption of viral particlesby healthy cells, and the natural decay of viral particles.The viral particles are also removed from the respiratorytract by nonspecific mechanisms. The nonspecific muco-ciliary removal of virions supported by cough and othermechanisms is described by the term (aV1V)/(1+aV2V),which saturates with increasing V as the available capacityof these mechanisms is exhausted. Note that the lethaldamage of an infected cell by the effector cells does notcause any release of infective IAV and hence in Eq. (1)there is no term of the form EI.
Eq. (2) determines the time rate of change of healthy cellsH. During recovery, new healthy cells are generated as aresult of proliferation of both healthy and resistant cells(the offspring of resistant cells lose resistance) and hencethe proliferation term is proportional to (H+R), and to D
(in a logistic fashion) since regeneration can only occur inthe presence of damage. Resistant cells R gradually losetheir resistance to infection and return into their initialsensitive state (healthy state) (Joklik, 1985), which ischaracterized by the term aRR. The term gHV VH is theloss of healthy cells due to infection and the term bHFFH
characterizes transition of the healthy cells into resistantstate.
immune response to influenza A virus infection. Journal of Theoretical

ARTICLE IN PRESSB. Hancioglu et al. / Journal of Theoretical Biology ] (]]]]) ]]]–]]] 5
Eq. (3) characterizes the time rate of change of infectedcells I. The infection of healthy cells by virions is describedin the term gHVVH. The term aII indicates the naturaldeath of infected cells during which new virus particles areproduced. The term bIEEI characterizes the destruction ofinfected cells by effector cells (CTL and NK) during whichno new virus is produced.
Eq. (4) establishes that the time rate of increase ofactivated APC (M) is proportional to the amount of thevirus and the amount of dead cells. The natural decay ofactivated state of APC is represented by the last term inthat equation.
Eq. (5) describes the time rate of change of interferons aand b (F) which depends on the production rate of F byAPC and by infected cells, on the rate of F binding healthycells, as well as on the nonspecific decay of F.
Eq. (6) shows that resistant cells R are induced fromhealthy cells (bHFFH) and convert back to healthy cells(aRR) with finite lifetime.
Eq. (7) characterizes the rate of change of effector cells E
concentration and takes into account the production rateof effector cells stimulated by APC (first term) and thedestruction rate of infected cells by effector cells (secondterm, bEIIE). The terms aE(1�E) and aP(1�P) in Eqs. (7)and (8) are approximate expressions for homeostaticmaintenance of the levels of active effectors and plasmacells, reflecting the observation that the healthy body tendsto maintain their concentrations within narrow bounds. Ina healthy state the effectors and plasma cells are naturallylocated in lymph nodes and blood, and migrate intothe infected tissue upon activation. Both the activationand migration of those cells to the infected tissue areassumed to be much faster than their proliferationand hence are not explicitly accounted for. The first termin Eq. (8) characterizes the activation process of plasmacells stimulated by APC.
Eq. (9) stands for the time rate of change of theconcentration of antibodies A describing the productionrate of A by plasma cells (first term), the neutralization rateof free viral particles by specific antibodies (second term)and the natural decay rate of A (last term).
The variable S in our model represents the compatibilitybetween antibodies and the virus strain in an individual andranges from 0 (no compatibility) to 1 (maximal compat-ibility) and can be interpreted as a measure of bindingaffinity of the antibody and the virus (Smith et al., 1999).The immune memory of the host is described by the initialvalue S(0) of S. During the course of the disease, S increasesas plasma cells produce antibodies increasingly compatiblewith viral antigens. The rate of increase of S is approxi-mated by the term rP(1�S) which accounts for two naturalobservations: (i) the increase in S is stimulated by plasmacells and (ii) S cannot increase beyond 1. By adjusting thetime evolution of S we may observe how the course of thedisease depends on the evolution of antigenic distance.
It has been established that IAV boosts T cell and B cellmemory (Ada and Jones, 1986). However, the majority of
Please cite this article as: Hancioglu, B., et al., A dynamical model of human
Biology (2007), doi:10.1016/j.jtbi.2006.12.015
IAV-induced CTL are fully cross-reactive with relatedstrains and would provide heterotypic immunity, whileantibodies (and consequently B memory cells) are protec-tive only against reinfection by strains closely related to thestimulating IAV (Bocharov and Romanyukha, 1994). Thusa variable analogous to S for description of the antigenicdistance between effectors and the virus is not necessary.We note that a number of assumptions in the model are
strong simplifications of our knowledge of immunephysiology. The populations of cells and virions areassumed to be uniformly distributed over the epitheliallayer at all times. It is also assumed that time rate of changeof any model variable is determined by the present value ofall variables. Some of the variables do not have uniquelyidentifiable biological counterparts. For example, there isno single biological entity or marker that represents theAPC in our model, which are assumed to provide bothantigen presenting and IFN producing functions. We havealso omitted intermediate steps in the pathways: forexample, we do not account for the intermediate steps inthe production of effector cells and plasma cells such asTh1 and Th2 helper cells and B-cells. We do not considertime delays in the reproduction of cellular components.Although our model is similar on that of Bocharov and
Romanyukha (1994), it differs in a number of instancesthat reflect the latest knowledge about biology of influenza:(i) we include a new nonspecific virus removal term inEq. (1), which results in clearing out extremely low initialvirus concentrations, (ii) we make the cell regeneration rateproportional to the product of healthy cells and dead cells,as opposed to only dead cells, (iii) we include reproductionof resistant cells, (iv) we make the activation of APCproportional to the amount of both viral particles and deadcells, (v) we include a new term describing the productionof interferons by infected cells and (vi) we introduce a newvariable that accounts for the antigenic distance betweenantibodies and the virus.
2.3. Simulations
We use the dynamical systems analysis softwareXPPAUT (www.pitt.edu/�phase/) to run all simulations.The time courses of variables were obtained by numericalintegration using parameters provided in Table 2. Modelparameters were adjusted so that the response of the naı̈vehost to the standard initial conditions (see below) satisfiesthe following criteria, extracted from available experimen-tal and clinical data (Bocharov and Romanyukha, 1994):(i) Virus titers V peak 4–5 days after infection with anapproximately 104-fold increase over the initial level. (ii)The maximum amount of activated APC M is 40%. APCbecome deactivated within 8–10 days. (iii) Effector cells E
peak with approximately 102-fold increase over thehomeostatic level. (iv) P cells peak with approximately104-fold increase. (v) S changes gradually. After 15 days,the antibodies A are 80% compatible with the virus. (vii)Maximum level of dead cells Dmax is 36%. (ix) Interferons
immune response to influenza A virus infection. Journal of Theoretical

ARTICLE IN PRESS
Table 2
Model parameters used for the baseline case
Parameter Value Description Comments Sources
gV 510 Rate constant of influenza A virus (IAV)
particles secretion per infected epithelial
cells
About 103–104 virus particles are released
from a single infected cell within a day
Zdanov and Bukrinskaja (1969)
gVA 619.2 Rate constant of neutralization of IAV by
antibodies
1–10 antibodies are sufficient to neutralize
a single IAV (Wohlfart, 1988)
Bocharov and Romanyukha (1994)
gVH 1.02 Rate constant of adsorption of IAV by
infected epithelial cells
In vitro experiments show that a single
epithelial cell can adsorb 1–10 influenza
virions
Bocharov and Romanyukha (1994)
aV 1.7 Rate constant of nonspecific IAV removal Nonspecific physical removal of infective
virions takes about 4–24 h
Bocharov and Romanyukha (1994)
aV1 100 Rate constant of nonspecific IAV removal
aV2 23000 Rate constant of nonspecific IAV removal
bHD 4 Rate constant of regeneration of epithelial
cells
The duration of a single division of an
epithelial cell is about 0.3–1 day
Keenan et al. (1982)
aR 1 Rate constant of epithelial cells’ virus
resistance state decay
Marchuk et al. (1991)
gHV 0.34 Rate constant of epithelial cells infected
by IAV
The difference between gVH and gHV is
caused by the fact that more than one
virion are required to infect a healthy cell
Marchuk et al. (1991)
bHF 0.01 Rate constant of epithelial cells’ virus
resistant state induction
Bocharov and Romanyukha (1994)
bIE 0.066 Rate constant of infected epithelial cells
that CTL damage
A single effector cell can deliver
approximately 10 lethal hits
Bocharov and Romanyukha (1994)
aI 1.5 Rate constant of infected epithelial cells
damage by cytopathicity of IAV
The life time of an infected cell is
approximately 1 day
Zdanov and Bukrinskaja (1969)
bMD 1 Rate constant of stimulation of antigen
presenting cells by dead cells
Marchuk et al. (1991)
bMV 0.0037 Rate constant of stimulation of antigen
presenting cells by virus particles
Marchuk et al. (1991)
aM 1 Rate constant of stimulated state loss of
antigen presenting cells
Marchuk et al. (1991)
bF 250,000 Interferon (IFN) production rate per APC Bocharov and Romanyukha (1994)
cF 2000 Interferon (IFN) production rate per
infected cell
Interferon a and b (IFN) are secreted also
from infected cells (Julkunen et al., 2000)
Estimated
bFH 17 Rate constant of epithelial cells that IFN
binds
Bocharov and Romanyukha (1994)
aF 8 Rate constant of IFN’s natural decay Bocharov and Romanyukha (1994)
bEM 8.3 Rate constant of stimulation of effector
cells
Marchuk et al. (1991)
bEI 2.72 Rate constant of death of effectors by lytic
interactions with infected epithelial cells
A single effector cell can kill about 100
infected cells
Bocharov and Romanyukha (1994)
aE 0.4 Rate constant of natural death of effector
cells
Marchuk et al. (1991)
bPM 11.5 Rate constant of plasma cells production Marchuk et al. (1991)
aP 0.4 Rate constant of natural death of plasma
cells
Marchuk et al. (1991)
bA 0.043 Antibody production rate per plasma cells Marchuk et al. (1991)
gAV 146.2 Rate constant of antibodies which binds
to IAV
Bocharov and Romanyukha (1994)
aA 0.043 Rate constant of natural death of
antibodies
Marchuk et al. (1991)
r 3e�5 Rate constant for S variable Estimated
B. Hancioglu et al. / Journal of Theoretical Biology ] (]]]]) ]]]–]]]6
F peak with approximately 104-fold increase. (x) Anti-bodies A peak with approximately 103-fold increase. Mostof our parameters are close to those in Bocharov andRomanyukha (1994) yet rescaled to dimensionless quan-tities. To examine the robustness of infection dynamics toparameter values and to provide insight into inter-individual variation in disease dynamics, we conducted afull set of one-dimensional sensitivity analyses.
Please cite this article as: Hancioglu, B., et al., A dynamical model of human
Biology (2007), doi:10.1016/j.jtbi.2006.12.015
3. Results
3.1. Standard behavior
The standard behavior describes the course of infec-tion in a naı̈ve host. We assume that initially the hosthas no dead, infected or resistant cells, no interferonmolecules, and no activated APC (i.e., H(0) ¼ 1,
immune response to influenza A virus infection. Journal of Theoretical

ARTICLE IN PRESSB. Hancioglu et al. / Journal of Theoretical Biology ] (]]]]) ]]]–]]] 7
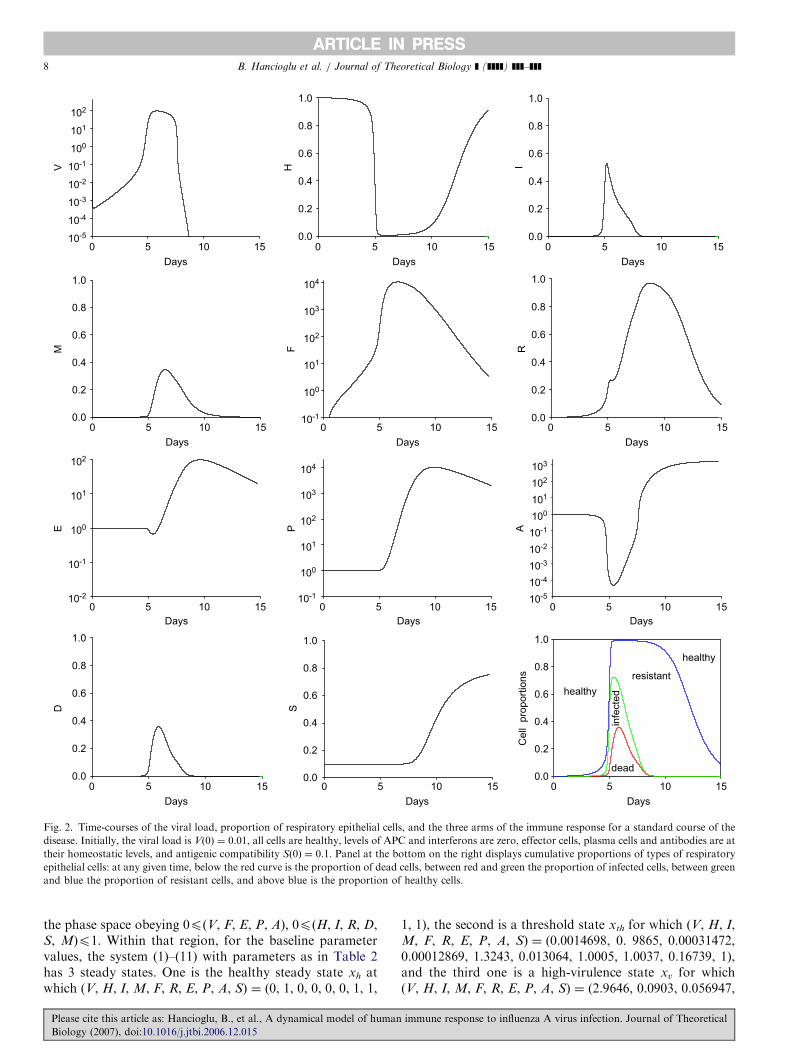
I(0) ¼M(0) ¼ F(0) ¼ R(0) ¼ 0). The initial levels of effec-tors, plasma cells, and antibodies are assumed to be at thehomeostatic values (i.e., E(0) ¼ P(0) ¼ A(0) ¼ 1) (Asquithand Bangham, 2003). The influence of antigenic compat-ibility S on the progression of infection is described in thesubsection ‘‘Impact of Antigenic Distance’’ below. In anaı̈ve host, we assume that S(0) ¼ 0.1 which corresponds toa relatively low compatibility with the virus strain, thatmay have resulted from previous exposure to IAV andsubsequent genetic drift. In the typical course of acute IAVinfection, the initial concentration of aerosol deliveredvirus particles that the host receives is about 108 particleper ml on day 0, corresponding to V(0) ¼ 0.01 in ourdimensionless system.
The resulting time courses of model variables corre-sponding to naı̈ve infection are depicted in Fig. 2. As seenin Fig. 2(a), virus level peaks (period of maximum antigenconcentration) after 5 days. This relatively late onset of thedisease is the result of relatively low initial viral load usedin our simulation. Peak viral load is increased by 104-foldwith respect to initial value staying at peak approximately3 more days, in accord with experimental data (Tamuraet al., 1998). Viral load starts to decline to inoculation levelafter day 8 (early stage of recovery, disappearance of IAVparticles). The host is considered infectious when the viruslevel exceeds 1, which happens at day 4.9. The host remainsinfectious for 2.6 days. APC are activated after 5 dayspeaking after about 7 days and returning to homeostaticlevels within 8–10 days.
The resulting loss of respiratory epithelial cells (deadcells) is one major reason for several of the symptoms thataccompany infection, such as cough, depressed tracheo-bronchial clearance, and altered pulmonary function(Hayden et al., 1998). We consider the host ‘‘symptomatic’’if the damage level exceeds 10% of the epithelial cells(Marchuk and Berbentsova, 1986), which occurs when theviral load peaks at day 5. The maximum proportion ofdead cells is 36% attained at day 6.1. The host stayssymptomatic for 2.4 days after which time most of the cellsbecome resistant to the infection. Infected cells reach amaximum proportion of 53% of all cells after day 5.2,while the proportion of resistant cells peak after 9 days,which is in accord with the experimental observation thatthe expression of nucleoprotein (NP) mRNA in epithelialcells, showing the presence of infected cells, changes inparallel with viral titer (Fig. 2(b)) (Tamura and Kurata,2004).
Interferon response comes into play once the virus peaksat day 5 making most of the cells resistant to infection. Theinterferon level is increased by 104-fold peaking approxi-mately at day 6. Plasma cells are produced after 6 dayspeaking at 9 days, before virus-specific antibodies aredetectable, in accord with empirical observations (Ada andJones, 1986). Antibody production by plasma cells beginsat day 7. There is a 103-fold increase in the amount ofantibodies when the adaptive immune response comes intoplay to remove all viral particles and generate immune
Please cite this article as: Hancioglu, B., et al., A dynamical model of human
Biology (2007), doi:10.1016/j.jtbi.2006.12.015
memory. Furthermore, antigenic compatibility is increas-ing monotonically starting right after when the adaptiveimmunity is activated (after day 8) and the antibodies arecapable of inhibiting viral particles with 80% probabilityafter 15 days of infection.
3.2. Impact of viral load
We investigated the impact of initial viral load on theonset, duration and severity of infection to understandthe immune response of a naı̈ve host to a moderate virusstrain. It has been realized that IAV infection could resultin large spectrum of disease states, however, this spectrumof severity has not been understood well (Yetter et al.,1980).As seen in Fig. 3, the immune response falls into one of
the three categories depending on initial viral load, V(0):asymptomatic disease, typical disease, and severe disease(Asquith and Bangham, 2003). If V(0) is less than thethreshold V1, the disease never develops. This correspondsto asymptomatic infection in which no virus shedding isobserved. The host is considered not contagious in this casesince the virus is eliminated from the host promptly andviral load remains very low with almost no ensuingdamage. If V(0) is in the range between V1 and V2, thedisease follows the same trajectory but the larger V(0) thesooner the onset of the disease. In other words, in thisrange of V(0), the maximum viral load (Vmax ¼ 138),maximum damage (Dmax ¼ 36%), the duration of symp-toms, and length of contagious period are all independent ofV(0). If V(0) is larger than V2, the disease state correspondsto severe disease for which the maximum viral load anddamage increase with V(0). In this case maximum damagecan exceed 50% of the respiratory cell population. Suchlevels of damage represent serious situation in whichsecondary infections could develop resulting in the deathof the host. For standard parameter values the thresholdsare V1 ¼ 0.00227 and V2 ¼ 0.1, with V1 producing atrajectory terminating at a saddle node (see below), andV2 being an approximate quantity determined as the lowestvalue of V(0) for which the trajectory perceptibly departsfrom the typical behavior.Fig. 3(c) shows the projection of the phase diagram onto
the variables V and D. In this projection the trajectorieshave only a very limited tendency to cross. The trajectoriesfor initial conditions V1oV(0)oV2 all coincide, in accordwith the observation that the trajectories are very similarand only shifted in time. On this plot the trajectory withV(0) ¼ V1 terminates at the point (V, D) ¼ (0.0015,0.0001). Note that because the graphs are plotted on alogarithmic scale and D(0) ¼ 0, the trajectories originateoff the graph on the left.
3.3. Stability analysis
As expected, the flow of the dynamical system defined byEqs. (1)–(11) leaves invariant the physiological region of
immune response to influenza A virus infection. Journal of Theoretical
ARTICLE IN PRESS
Days
0 10 15
V
10-5
10-4
10-3
10-2
10-1
100
101
102
10-5
10-4
10-3
10-2
10-1
100
101
102
103
10-1
100
101
102
103
104
10-1
100
101
102
103
104
10-2
10-1
100
101
102
M F
Days
0 10 15
Days
0 5 10 150.0
0.2
0.4
0.6
0.8
1.0
0.0
0.2
0.4
0.6
0.8
1.0
0.0
0.2
0.4
0.6
0.8
1.0
0.0
0.2
0.4
0.6
0.8
1.0
0.0
0.2
0.4
0.6
0.8
1.0
0.0
0.2
0.4
0.6
0.8
1.0
0.0
0.2
0.4
0.6
0.8
1.0H I
RC
ell
pro
po
rtio
ns
healthy
resistant
infe
cte
d
dead
healthy
P A
S
ED
5
Days
0 10 155
5
Days
0 10 155
Days
0 10 155
Days
0 10 155
Days
0 10 155
Days
0 10 155
Days
0 10 155
Days
0 10 155
Days
0 10 155
Fig. 2. Time-courses of the viral load, proportion of respiratory epithelial cells, and the three arms of the immune response for a standard course of the
disease. Initially, the viral load is V(0) ¼ 0.01, all cells are healthy, levels of APC and interferons are zero, effector cells, plasma cells and antibodies are at
their homeostatic levels, and antigenic compatibility S(0) ¼ 0.1. Panel at the bottom on the right displays cumulative proportions of types of respiratory
epithelial cells: at any given time, below the red curve is the proportion of dead cells, between red and green the proportion of infected cells, between green
and blue the proportion of resistant cells, and above blue is the proportion of healthy cells.
B. Hancioglu et al. / Journal of Theoretical Biology ] (]]]]) ]]]–]]]8
the phase space obeying 0p(V, F, E, P, A), 0p(H, I, R, D,S, M)p1. Within that region, for the baseline parametervalues, the system (1)–(11) with parameters as in Table 2has 3 steady states. One is the healthy steady state xh atwhich (V, H, I, M, F, R, E, P, A, S) ¼ (0, 1, 0, 0, 0, 0, 1, 1,
Please cite this article as: Hancioglu, B., et al., A dynamical model of human
Biology (2007), doi:10.1016/j.jtbi.2006.12.015
1, 1), the second is a threshold state xth for which (V, H, I,M, F, R, E, P, A, S) ¼ (0.0014698, 0. 9865, 0.00031472,0.00012869, 1.3243, 0.013064, 1.0005, 1.0037, 0.16739, 1),and the third one is a high-virulence state xv for which(V, H, I, M, F, R, E, P, A, S) ¼ (2.9646, 0.0903, 0.056947,
immune response to influenza A virus infection. Journal of Theoretical

ARTICLE IN PRESS
V(0)
Days
0 5 10 15
D
0.0
0.2
0.4
0.6
0.8
1.0
0.010.1200
V(0)
Days
V
10-810-710-610-510-410-3
10-1100101102
0.0010.002270.010.1200
D
V
Vmax
Dmax
V2
V1
Asymptomaticdisease
Typical disease
Severe disease
0.001
0.00227
0.01
0.1
200
10-2
0 5 10 15
10-7
10-7
10-6
10-6
10-5
10-5
10-4
10-4
10-3
10-3
10-1
10-1
100
100
101
102
10-2
10-2
Fig. 3. Time-courses of (a) viral load and (b) damage for various levels of the initial viral load V(0). For V(0) in the range from 0.00227 to 0.1 the
dependence of V on t (and of D on t) follows the same trajectory but the larger V(0) the sooner the onset of the disease. (c) Phase diagram of the
dependence on initial viral load V(0) as a plot of logV versus logD. The direction of time is indicated by arrows. The maximum viral load and maximum
damage for typical disease are Vmax ¼ 1.3� 1010 particles/ml and Dmax ¼ 36. The thresholds V1 ¼ 0.00227 for the typical disease and V2 ¼ 0.1 for the
extreme disease are indicated and the corresponding trajectories are shown in black.
B. Hancioglu et al. / Journal of Theoretical Biology ] (]]]]) ]]]–]]] 9
0.034516, 916.91, 0.82797, 1.49024, 130.29, 0.012925, 1).The threshold state corresponds to the separator for thedynamics of influenza between the asymptomatic diseaseand typical disease cases as seen in Fig. 3. The Jacobianmatrix for the linearization of system (1)–(11) about thehealthy state xh admits eigenvalues that are all real andnegative, and hence the healthy fixed point is asymptoti-cally stable. We find that, with the exception of a smallnumber of cases, the healthy state remains stable underperturbations of the parameters of the system. TheJacobian matrix for the threshold state xth has two complexand one positive eigenvalue and hence xth is a saddle node.The Jacobian matrix for the high-virulence state xv has twocomplex eigenvalues with positive real parts and hence xv isan unstable spiral. As discussed below, the xv becomesstable at fixed, extremely low values of S(0).
3.4. Sensitivity analysis
The goals of sensitivity analysis with respect to randomperturbations of the model parameters are the following:
�
P
B
To show how robust the simplified uncomplicated influenzamodel is in relation to perturbed parameter values.
lease cite this article as: Hancioglu, B., et al., A dynamical model of human
iology (2007), doi:10.1016/j.jtbi.2006.12.015
�
To explore to which parameters the system is moresensitive to understand key processes and immunesystem mechanisms.Our approach to investigate sensitivity was basedon studying the effect of changes in the parameters (inevery case we increased and decreased the baselinevalue threefold) on the duration, onset and severity ofthe disease (Table 3). In clinical studies, the assessment ofinfluenza virus pathogenicity is based on the magni-tude and duration of fever, the frequency and amount ofvirus shedding, and the level and persistence of theinfection. Within the model framework we can generalizethese clinically relevant correlates into the followingcharacteristics: (I) the severity of the disease measuredas the maximum attained proportion of dead cells Dmax ¼
maxt40D(t), (II) the duration of symptomatic infec-tion Dtillness ¼ t2�t1, where t1 is the time that D exceeds0.1 and t2 is the time that D drops below 0.1 (III) simi-larly, the value V ¼ 1 is considered to be the thresholdlevel for becoming contagious and the duration ofinfectivity will be referred to as Dtcontagious. For typi-cal disease, we find that Dtillness ¼ 2.4 days andDtcontagious ¼ 2.6 days.
immune response to influenza A virus infection. Journal of Theoretical

ARTICLE IN PRESS
Table 3
One-way sensitivity analysis on model parameters
Parameter Baseline (range) Model behavior
gHV 0.34(0.1–1) � At high virulence, disease always develops. At low virulence, asymptomatic disease is possible.
� The higher the virulence, the earlier the onset of disease.
� The higher the virulence, the shorter the duration of disease.
� At high virulence, damage (Dmax ¼ 68%) is at least five times larger than that of low virulence (Dmax ¼ 12%).
So, high virulence may cause death.
� At peak, virus shedding is about the same for high and low virulent viruses.
� The less virulent the virus, the longer the contagious period when disease is developed.
gV 510(150–1500) The model behavior is same as in case for gHV.
gVA 619.2(200–1800) � For low gVA, disease always develops.
� The higher the gVA, the later the onset of disease.
� At high and low values of gVA, the duration of disease is about the same.
� At high and low values of gVA, the damage is about the same. At peak, virus shedding is about the same for
high and low gVA.
� The contagious period is about the same for various values of gVA. So, gVA only affects the onset of the disease
which has the same characteristics.
bMD 2(0.6–6) � Disease always develops for all bMD.
� The onset of disease stays the same.
� The higher bMD, the shorter the duration of disease.
� The higher bMD, the lesser the damage. Very low values of bMD may cause death. At peak, virus shedding is
about the same for high and low bMD
� The higher bMD the shorter the contagious period.
� If bMD is very high the onset is very late, duration is short, damage is very low, contagious period is very short.
bIE 0.066(0.02–0.1) � At high bIE, asymptomatic disease is observed for standard V(0) and S(0).
� The higher bIE, the later the onset of disease.
� The higher bIE, the shorter the duration of disease.
� At high values of bIE , the damage is lower. Changes only in bIE only cannot cause death.
� At peak, virus shedding is about the same for high and low bIE.
� The higher bIE, the shorter the contagious period when disease is developed.
aI 1.5(0.5–4.5) � At high aI, asymptomatic disease is observed for standard V(0) and S(0).
� The higher aI, the later the onset of disease.
� The higher aI, the shorter the duration of disease.
� At high values of aI, the damage is lower. Changes only in bIE only cannot cause death.
� Virus shedding is very sensitive to aI. When aI is higher, at the peak viruses shed less.
� The higher aI, the shorter the contagious period. But the time difference is very small.
bHD 4(2–8) � Disease always develops for all bHD for standard V(0) and S(0).
� Onset of disease is about the same for all bHD.
� The higher bHD the shorter the duration of disease.
� At high values of bHD, the damage is lower. Changes only in bHD cannot cause death.
� Virus shedding is very sensitive to bHD When bHD is higher, at the peak viruses shed more.
� The higher bHD, the longer the contagious period. The time difference is significant.
bF 25,000(125,000–500,000) � Disease always develops for all bF for standard V(0) and S(0).
� Onset of disease is the about same for all bF.
� The higher bF, the shorter the duration of disease.
� At high values of bF, the damage is lower. Very low values of rG may cause death.
� Virus shedding is very sensitive to bF. When bF is higher, at the peak viruses shed less.
� The higher bF, the longer the contagious period. The time difference is significant.
bA 0.043(0.01–0.12) � Disease always develops for all bA for standard V(0) and S(0).
� The higher the bA, the later the onset of disease.
� The duration of disease is about the same for all bA.
� At high values of bA, the damage is lower. Changes only in bA cannot cause death.
� Virus shedding is sensitive to bA. When bA is higher, viruses shed a little at the peak less.
� The higher bA, the shorter the contagious period. The time difference is small.
bHF 0.02(0.005–0.03) � At high bHF, asymptomatic disease is observed for standard V(0) and S(0).
� Onset of disease is about the same for all bHF.
� The higher bHF, the shorter the duration of disease.
B. Hancioglu et al. / Journal of Theoretical Biology ] (]]]]) ]]]–]]]10
Please cite this article as: Hancioglu, B., et al., A dynamical model of human immune response to influenza A virus infection. Journal of Theoretical
Biology (2007), doi:10.1016/j.jtbi.2006.12.015

ARTICLE IN PRESS
Table 3 (continued )
Parameter Baseline (range) Model behavior
� At high values of bHF, the damage is lower. Very low values of bHF may cause death.
� Virus shedding is very sensitive to bHF. When bHF is higher, at the peak viruses shed significantly less.
� The higher bHF, the longer the contagious period. The time difference is significant.
bEM 8.3(2.5–25) � At high bEM, asymptomatic disease is observed for standard V(0) and S(0).
� Onset of disease is about the same for all bEM.
� The higher the value of bEM, the shorter the duration of disease.
� At low values of bEM, the damage is lower. Very high values of may cause death.
� Virus shedding is not sensitive to bEM.
� The higher the value of bEM, the shorter the contagious period. The time difference is not significant.
bPM 11.3(3–30) � For low values of bPM, flow goes through disease trajectory and converges to the fixed point for standard V(0)
and S(0).
� Onset of disease is about the same for all bPM.
� The duration of disease is about the same for all bPM.
� The damage is about the same for all bPM.
� Virus shedding is not sensitive to bPM.
� The higher the value of bPM, the shorter the contagious period. The time difference is significant.
S(0) 0–1 � For S(0) ¼ 0 disease always develop for standard V(0).
� The higher the S(0), the later the onset of disease. The duration of disease is about the same for all S(0).
� At high values of S(0), the damage is lower. When S(0) is higher, viruses shed less at the peak. The higher the
value of S(0), the higher the contagious period during the typical disease.
B. Hancioglu et al. / Journal of Theoretical Biology ] (]]]]) ]]]–]]] 11
3.5. Sensitivity to pathogen virulence
Virulence is characterized by the parameters gHV and gV,which represent the rate of infection of epithelial cells byIAV and the rate of IAV particles secretion per infectedepithelial cell, respectively. When virulence is high, theviruses are able to infect the healthy cells at much higherrate and they reproduce and replicate themselves ininfected cells much faster. Since the sensitivity to gHV andgV are essentially the same, we will consider only parametergHV.
The virulence gHV affects the range of viral loads V(0)causing typical disease. When the value of gHV is threetimes more than the baseline value, then no matter whatthe initial viral load is, disease always develops (seeFig. 4(b)). When gHV is three times less than the baseline,we observe the presence of asymptomatic, typical andsevere disease regimes depending on V(0). When V(0) islow, the disease stays asymptomatic. The higher thevirulence, the earlier the onset of disease and the shorterthe duration of disease. The variation in maximumdamage, mmax, between the case of low gHV and the caseof high gHV is significant (we found a fivefold differencebetween Dmax ¼ 68% for gHV ¼ 1 and Dmax ¼ 12% forgHV ¼ 0.1). As expected, infection by virus of highvirulence causes substantial damage, while infection by avirus of low virulence may go unnoticed. The lower thevirulence, the longer the contagious period Dtcontagious. Theduration of the disease and maximum level of virus titer atthe peak are not sensitive to the virulence. When gHV is 0.1,the threshold value for V(0) to cause typical disease is
Please cite this article as: Hancioglu, B., et al., A dynamical model of human
Biology (2007), doi:10.1016/j.jtbi.2006.12.015
0.00227. The phase diagram for gHV is 0.1 (not shown) isessentially the same as Fig. 3(c). The threshold point of thedynamics between the typical disease case and theasymptomatic case is due to the presence of an unstablethreshold state xth, the stable manifold of which intersectsthe locus of initial conditions.
3.6. Sensitivity to interferon response
The parameters bF and bHF characterize the interferonproduction rate constant and the rate constant of inductionof resistant state in epithelial cells, respectively. If bF
increased or lowered from its standard value, diseasealways develops for standard values of V(0) and S(0).However, when bHF is high, the host remains asympto-matic. The time of onset of disease does not depend on bF
and bHF, but when either of these constants is higher, theduration of disease becomes shorter. Damage increases ifeither bF or bHF is decreased. Very low values of bF or bHF
result in excessive damage (over 50%) which maypresumably lead to secondary infections or death (Iwasakiand Nozima, 1977). Virus shedding is sensitive to themagnitude of bF or bHF: higher values are associated with aless virus shedding but a longer contagious period. Whenthe interferon production rate constant is two times biggerthan the baseline value (i.e., when bF ¼ 500,000), then thehost remains contagious for about 3.5 days. When this rateis two times less than the baseline (i.e., when bF ¼ 125,000)then the contagious period is about 2.3 days. So, thedifference in the length of infectious period is significant forvarious levels of innate immune response.
immune response to influenza A virus infection. Journal of Theoretical

ARTICLE IN PRESS
Days
V
10-810-710-610-510-410-310-210-1100101102
10-7
10-7
10-6
10-6
10-5
10-5
10-4
10-4
10-3
10-3
10-2
10-2
10-1
10-1
100
100
101
102
0.10.341
Days
0 5 10 15
D
0.0
0.2
0.4
0.6
0.8
1.0
0.341
D
V
Vmax
Dmax
V2
Typical disease
Severe disease
0.001
0.01
0.1
200
γ γ
0 5 10 15
Fig. 4. Time-courses of (a) viral load and (b) damage for various values of gHV. (c) Phase diagram of the dependence on initial viral load V(0) for value of
gHV (gHV ¼ 1) that is threefold higher than the standard value. The direction of time for each curve is indicated by arrows. The maximum viral load and
maximum damage for typical disease are Vmax ¼ 1.1� 1010 particles/ml and Dmax ¼ 68.
B. Hancioglu et al. / Journal of Theoretical Biology ] (]]]]) ]]]–]]]12
Even in the absence of an innate response (when bF ¼ 0and bHF ¼ 0), the disease is eventually healed by theadaptive immune response and the organism will approachthe healthy state.
3.7. Sensitivity to cellular component of innate immunity
The parameters bEM and bIE stand for the rate constantof production of effector cells and rate constant of removalof infected cells by effectors, respectively. For sufficientlylarge bEM or bIE, the host is able to clear the diseasewithout symptoms and typical disease conditions, given thestandard initial immunity and standard initial amount ofthe virus. Although bEM has no effect on the onset of thedisease, when infected cell removal rate constant is high,the onset of infection happens later. At low values of bEM
or bIE, the symptoms last longer. When bEM is high, theresulting maximum damage, Dmax, is large and may resultin death. On the other hand, when bIE is high, we observelower damage of epithelial cells. Even under a significantdecrease in bIE, Dmax will stay under 50% and hence adecrease in bIE has no effect on the mortality. Virusshedding is the same for different levels of bEM or bIE.When there is a less vigorous cellular response, the hostremains infectious for longer. But the time differences in
Please cite this article as: Hancioglu, B., et al., A dynamical model of human
Biology (2007), doi:10.1016/j.jtbi.2006.12.015
the contagious period of the host for various levels of bEM
or bIE are small.Even in the absence of a cellular response (when bEM ¼ 0
and bIE ¼ 0), virus is eventually cleared by the innateand adaptive immune responses and the organism willapproach the healthy state.
3.8. Sensitivity to adaptive response
Activation of adaptive immune response is slower thanactivation of cellular and interferon components of innateimmunity. The parameters bPM, bA and gVA stand for theplasma cell production rate constant, antibody productionrate constant and the rate constant of neutralization ofIAV by antibodies. For sufficiently large bPM, bA or gVA,the host is able to clear infection without symptoms afteradministration of a standard inoculum. Although bPM hasno effect on the onset of the disease, later onset is observedwith higher bA and gVA. The duration of illness does notdepend on bPM, bA or gVA. Damage is lower with higher bA,while damage is insensitive to the two other rate constants.Variations in bPM, bA or gVA never result in excessivedamage. Virus shedding is sensitive to bA. With higher bA,fewer viruses are shed at the peak of the disease and thecontagious period is significantly shorter.
immune response to influenza A virus infection. Journal of Theoretical

ARTICLE IN PRESSB. Hancioglu et al. / Journal of Theoretical Biology ] (]]]]) ]]]–]]] 13
In summary, gVA only affects the onset of the disease,while bPM affects only virus shedding at the peak. Thesystem is much more sensitive to the bA. We will discuss thesituation where there is no adaptive response or very weakresponse in the next subsection.
3.9. Impact of antigenic distance
The efficiency of the existing antibodies of the organismto neutralize the virus of the strain causing the illness isrepresented by the variable S which describes the prob-ability of a match between the existing antibodies and theantigenic structure of the viral strain. Fig. 5(a) displays thedependence of incurred damage on S(0), the initial value ofS. Previous infection with one subtype induces little or noimmunity to other subtypes of the IAV (Couch and Kasel,1983; Murphy and Clements, 1989), therefore S(0) for the
Days
0 5 10 15
D
0.0
0.2
0.4
0.6
0.8
1.0
0
0.1
S(0)
S(0)
0.0 0.1 0.2 0.3
V(0
)
10-6
10-5
10-4
10-3
10-2
10-1
100
V1
V2
Asymptomatic disease
Typicaldisease
Severe disease
Fig. 5. (a) Time courses of the damage for various levels of the initial
probability of the existing antibodies to neutralize IAV particles, S(0). The
larger S(0) the sooner the onset of the disease. (b) Diagram of the
dependence of the expected type of disease on V(0) and S(0). The lines
correspond to the threshold values V1 (triangles connected by green lines)
and V2 (circles connected by red lines). The regions corresponding to
asymptomatic, typical and severe disease are indicated.
Please cite this article as: Hancioglu, B., et al., A dynamical model of human
Biology (2007), doi:10.1016/j.jtbi.2006.12.015
individual facing a new subtype is very low. For thestandard value of S(0), corresponding to the standardresponse, we chose S(0) ¼ 0.1 which corresponds to partialmatch of antibodies due to the history of previous contactsof the individual with the virus, perhaps during the lastseason. This standard S(0) is much lower than 1 because ofthe antigenic drift of the virus strain. When there is noinitial match at all (S(0) ¼ 0), damage is higher (Yetteret al., 1980). When S(0) is sufficiently large, then theindividual remains asymptomatic (Liew et al., 1984;Yoshikawa et al., 2004). As seen in Fig. 5(b), whenS(0) ¼ 0, disease always develops regardless of initial viralload, i.e., V1 ¼ �N. The threshold for severe disease, V2,increases with S(0). The threshold for typical disease, V1,becomes finite when S(0) ¼ 0.0124 and then increases withS(0). For values of S(0) above 0.2, corresponding toreasonably compatible initial immunity, the disease isasymptomatic unless V(0)40.1. This situation correspondsto an immunized individual. The higher the S(0), the laterthe onset of disease. The duration of disease is about thesame for all S(0). At high values of S(0), the damage islower (Yetter et al., 1980) When S(0) is higher, less virusesare shed at the peak. The higher the value of S(0), the lessthe contagious period (Yetter et al., 1980).The parameter r controls the rate of improvement of
antigenic distance. A zero rate r corresponds to thesituation in which antibodies do not improve their abilityto match antigens. Complete failure to develop antibodies(when S(0) ¼ 0 and r ¼ 0) results in recurrence of thedisease and transition to a chronic state, as seen Fig. 6(a)and (b). This state is characterized by the following values:(V, H, I, M, F, R, E, P, A) ¼ (5.26, 0.06, 0.018, 0.05, 1484,0.89, 67.0). As the immune system produces virus-specificantibodies, the host is able to clear the disease even in thecase when the production rate of compatible antibodies isquite low such as r ¼ 10�5, as seen in Fig. 6(c) and (d). Apartial failure to develop antibodies occurs when S(0)40and r ¼ 0. In that case, if S(0) is sufficiently small (below10�7), complete failure occurs, with recurrence of thedisease and transition to a chronic state (not shown).To obtain further insight into the influence of the
variable S on the behavior of the system we considered thereduced system of Eqs. (1)–(9) with S treated as a constant,and studied changes in the location and stability of fixedpoints of this reduced system as a function of S. Thecorresponding bifurcation diagram, shown in Fig. 7(a) and(b), reveals that when SoS* ¼ 0.000224555, the highvirulence state xv is stable while the healthy state isunstable. (This is compatible with the behavior of the fullsystem for S ¼ 0 and r ¼ 0 described above.) At S ¼ S*, asubcritical Hopf bifurcation occurs which gives rise to afamily of unstable periodic orbits. That family continues asa family of stable limit cycles for values S4S*. (Only aportion of that branch is shown in Fig. 7 (a); difficultieswith numerical calculation of that branch prevent us fromdetermining whether the stable limit cycle persists for allSo ¼ 1.) The healthy steady state xH is unstable until
immune response to influenza A virus infection. Journal of Theoretical

ARTICLE IN PRESS
Days
0 5 10 15 20 25
V
Days
0 5 10 15 20 25
He
alh
y C
ells
Days
0 5 10 15 20 25
V
Days
0 5 10 15 20 25
He
alth
y C
ells
0.0
0.2
0.4
0.6
0.8
1.0
0.0
0.2
0.4
0.6
0.8
1.0
10-5
10-4
10-3
10-2
102
101
10-1
100
10-5
10-4
10-3
10-2
102
101
10-1
100
Fig. 6. Time-courses of (a) the viral load and (b) the proportion of healthy cells for an individual with no initial and no improvement in antibody
compatibility, S(0) ¼ 0, r ¼ 0, i.e., an individual without adaptive immune response. Failure to develop compatible antibodies results in recurrence of the
disease and transition to a chronic state. Time-courses of (c) the viral load and (d) the proportion of healthy cells in an individual whose existing antibodies
are incompatible but improving, i.e., S(0) ¼ 0, r ¼ 10�5. As virus-specific antibodies appear with the adaptive response, IAV particles are removed from
the host completely.
B. Hancioglu et al. / Journal of Theoretical Biology ] (]]]]) ]]]–]]]14
S reaches S#¼ 0.0129294, at which value xH gains stability
through a transcritical bifurcation. A branch of unstablethreshold steady states xth bifurcates off of xH and existsfor S4S#.
4. Discussion
We presented a simplified model of the human immuneresponse to the IAV infection in individual hosts whichincludes innate and adaptive immunity, and analyzed itsbehavior. Such a model could be used to explore in moredetail individual determinants of symptoms and behaviorof clinical relevance, especially in large-scale simulations ofdisease spread and containment. Simulation and sensitivityanalysis of this model suggest that for majority of possibleparameter values and initial conditions the course of thedisease falls into one of three categories: asymptomaticdisease, typical disease, and severe disease. In specialcircumstances a recurrence of infection may occur,followed by a transition to either healthy or chronic state.The magnitude of initial viral load V(0) determines whichof the paths will be taken, in accord with experimentalobservations (Tamura and Kurata, 2004). With sufficientlysmall viral inoculum, disease is asymptomatic in the sensethat the virus level decreases monotonically to 0 anddamage remains very low. With inocula within the intervalof values corresponding to typical disease, virus shedding,
Please cite this article as: Hancioglu, B., et al., A dynamical model of human
Biology (2007), doi:10.1016/j.jtbi.2006.12.015
duration of sickness and the severity of symptoms, as wellas the duration of contagious period are independent ofsize of inoculum; only the time of the onset of diseasechanges: disease peaks earlier for larger inocula. Animportant epidemiological implication of this result is thatfrom observations of a typical disease it is impossible todetermine a posteriori both when the infection occurredand what was the initial virus load since these data areinter-dependent. When the inoculum is sufficiently large(more than 0.1 particles per epithelial cell in some cases),disease becomes severe with maximum viral load andmaximum damage increasing proportionally to the size ofthe inoculum.Analysis of the adaptive immune response revealed that
whenever there is sufficient antibody response with enoughspecificity, the dynamics will restore health, irrespective ofthe intensity of the innate responses and of the trajectoryfollowed by the disease. However, if memory cells cannotproduce sufficiently compatible antibodies against the IAVparticles initially (very low S(0)) or cannot improve theantigenic compatibility sufficiently rapidly (S is notincreasing during the disease), there is rebound of virusshedding and transition of the system to a chronic state.The role of antigenic compatibility in virus clearance can
be viewed as a series of transitions in the bifurcationdiagram of Fig. 7, once one realizes that S is slowly, butsteadily, increasing during the course of the disease in
immune response to influenza A virus infection. Journal of Theoretical

ARTICLE IN PRESS
0
VV
S
S
10-5 110-4
10-4 10-210-3
10-3
-10-3
2x10⁻³
10-2
102
10-1
10-5 110-4 10-210-3 10-1
1
Fig. 7. Bifurcation diagram for a reduced system of Eqs. (1)–(9) with S
treated as a bifurcation parameter. Two separate parts of the diagram are
shown: (a) the high virulence steady state and connected branches and (b)
the healthy state and connected branches. Stable states are shown as solid
black curves, unstable steady states as dashed red curves, unstable periodic
orbit as hollow red circles and stable periodic orbit as solid black circles.
(The branch of limit cycles is terminated due to difficulties in its numerical
calculation, but is expected to persist up to the value S ¼ 1.)
B. Hancioglu et al. / Journal of Theoretical Biology ] (]]]]) ]]]–]]] 15
initially naı̈ve individuals. Near S ¼ 0 the healthy steadystate is unstable and the system initially approaches thechronic state. Eventually, S increases beyond S*, the limitof stability of the chronic state, and the system willapproach the limit cycle. Eventually, S will increase beyondS#, at which instant the healthy state becomes stable andthe immune system clears the infection.
The reduced model underlines the importance ofantigenic distance between the virus strain which causesIAV infection and the existing virus-specific antibodies ofthe adaptive response represented in the model by S
variable. Children who previously experienced naturalinfection or who received a live virus vaccine exhibit amarked reduction in both the amount and duration of virusshedding when compared to subjects without priorexposure to IAV infection (Tamura and Kurata, 2004).Compared with adults, children can shed virus earlierbefore illness begins and for longer periods once illness
Please cite this article as: Hancioglu, B., et al., A dynamical model of human
Biology (2007), doi:10.1016/j.jtbi.2006.12.015
starts. In children absolute levels of virus shedding may behigher than those in adults. These experimental findingsconfirm our model predictions (see Fig. 5) which take intoaccount the immune memory of the individual providingnot only much accurate predictions for the host but also asolid foundation as individual-based model for realisticepidemic models. Our results suggest that in the absence ofinitial immune memory (low S(0) or S(0) ¼ 0) due to lackof proper vaccination or new subtype of the virus, theindividual would experience severe disease which mightresult in death and remains contagious for a longer periodof time. Therefore, such an individual has a largerprobability to die and spread the disease in an epidemic.Our results illustrate the point that IAV infection caused
by high virulent viruses may cause death due to substantialdamage, while infection by a virus with low virulence maybe cleared without any symptoms: a combination of viralproperties and host susceptibility determines the outcomeof infection (Price et al., 2000). High virulence correspondsin our model to high values of the parameters gHV and gV
which characterizes the rate of infection of epithelial cellsby IAV and the rate of IAV particles secretion per infectedepithelial cell, respectively. In the three global pandemic ofthe last century, new subtypes with higher values of gHV
and gV arose due to antigenic shift. Since there was no orvery little immunity of human population to these newsubtypes (0 or very low S(0)) combining with highvirulence, they caused excessive mortality rates with largeprobability of death for particular individuals as our resultsindicated. Although the H5N1 subtype of avian flu hasvery limited ability to bridge the species barrier andhumans to human has not been observed (Kuiken et al.,2006; Shinya et al., 2006), it might mutate into a form forwhich it can be transmitted from human to human. Sincethis new subtype (i.e. very low S(0) for individuals) of theIAV is very virulent (i.e. gHV and gV both high), it would bepredicted to cause excessive damage in individuals,conditions conducive to a pandemic. Containment mea-sures should be taken such as antiviral drugs which canneutralize the actions of NA (i.e. decreased gV) and efficientvaccination which can improve host immunity by theexistence of very affine subtype-specific antibodies neutra-lizing the actions of HA (i.e very low S(0) and decreasedgHV). Sensitivity analysis of the model suggest that innateresponse is an early, important line of nonspecific defensewhich has significant impact on lowering the duration ofsickness, virus shedding and tissue damage. Contagiousperiod of an individual which is an important measure fordisease control is increased by the higher interferonresponse. Sensitivity analysis also suggests that highercellular response result in lower period of symptomatic caseand contagious period.Although each component of innate and adaptive
immune response contributes to the recovery of IAVinfection, the simulations suggest that, in the absence ofone component of innate immunity, the remaining twodefense mechanisms are sufficient for viral clearance.
immune response to influenza A virus infection. Journal of Theoretical

ARTICLE IN PRESSB. Hancioglu et al. / Journal of Theoretical Biology ] (]]]]) ]]]–]]]16
For example, when cellular component are not involved inviral clearance, antibodies (sufficient in the amount andaffinity) on their own can mediate clearance of influenza(Scherle et al., 1992). The cellular response can also besufficient to clear the IAV infection from an individual(Asquith and Bangham, 2003). In the absence of adaptiveimmunity, the viral load is brought down to very low levels,although not completely cleared, which is supported byexperiments showing that in some circumstances antibodyresponse is necessary to clear the infection (Iwasaki andNozima, 1977). For example, in nude mice withoutantibodies the viral particles survive with chronic infection(see Fig. 6(a)) (Scherle et al., 1992). After transferring Thelper cells into the infected mice that promotes antibodyresponse, the disease is completely cleared (Iwasaki andNozima, 1977; Scherle et al., 1992). Therefore, one canconclude that innate defense mechanisms are not capableof curing the disease on their own in the absence ofantibody response, and can only reduce the disease to achronic state (see Fig. 6(b)). Host may escape from thischronic state with sufficient adaptive response or throughsufficient cellular response (Epstein et al., 1998).
The biological relevance of our analysis and conclusionsare limited by the significant oversimplification present inour reduced model and the difficulty in translatingfunctions such as ‘‘antigen presenting cells’’, ‘‘damage’’,‘‘effector cells’’ into measurable quantities as we have donein more specific models (Chow et al., 2005). Our modeldoes not permit the derivation of the number of new casesper infected cases, or R0. Yet, inscribed in a simulationfurnishing distributions of viral loads/contact and contactdensity, such a number could be derived. Future develop-ment of the biological model include detailed mathematicalanalysis of the system of equations of the model,correlating infectivity and classes of symptoms to specificcomponents of the model such as viral load, interferonlevels and proportion of unhealthy respiratory epithelialcells, and improved biological fidelity and calibration data.We wish to include the effects of age and genetic variationsthrough realistic distributions of key model parameters.Such an extension will be used to conduct large scalesimulations of clinical trials of antiviral strategies ingenetically heterogeneous hosts and to construct responsesurfaces to be integrated in multi-scale models of IAVinfection (Clermont et al., 2004). We also wish to develop amore sophisticated model of antigenic distance.
Acknowledgments
This work is supported under grant NIH R01-GM67240(Clermont). We are grateful to Dr. Ted Ross for criticalcomments on the manuscript.
References
Ada, G.L., Jones, P.D., 1986. The immune response to influenza infection.
Curr. Top. Microbiol. Immunol. 128, 1–54.
Please cite this article as: Hancioglu, B., et al., A dynamical model of human
Biology (2007), doi:10.1016/j.jtbi.2006.12.015
Akira, S., Takeda, K., Kaisho, T., 2001. Toll-like receptors: critical
proteins linking innate and acquired immunity. Nat. Immunol. 2,
675–680.
Asquith, B., Bangham, C.R., 2003. An introduction to lymphocyte and
viral dynamics: the power and limitations of mathematical analysis.
Proc. Biol. Sci. 270, 1651–1657.
Bocharov, G.A., Romanyukha, A.A., 1994. Mathematical model of
antiviral immune response. III. Influenza A virus infection. J. Theor.
Biol. 167, 323–360.
Chow, C.C., Clermont, G., Kumar, R., Lagoa, C., Tawadrous, Z., Gallo,
D., Betten, B., Bartels, J., Constantine, G., Fink, M.P., Billiar, T.R.,
Vodovotz, Y., 2005. The acute inflammatory response in diverse shock
states. Shock 24, 74–84.
Clermont, G., Bartels, J., Kumar, R., Constantine, G., Vodovotz, Y.,
Chow, C., 2004. In silico design of clinical trials: a method coming of
age. Crit. Care Med. 32, 2061–2070.
Couch, R.B., Kasel, J.A., 1983. Immunity to influenza in man. Annu. Rev.
Microbiol. 37, 529–549.
Epstein, S.L., Lo, C.Y., Misplon, J.A., Bennink, J.R., 1998. Mechanism of
protective immunity against influenza virus infection in mice without
antibodies. J. Immunol. 160, 322–327.
Hayden, F.G., Fritz, R., Lobo, M.C., Alvord, W., Strober, W., Straus,
S.E., 1998. Local and systemic cytokine responses during experimental
human influenza A virus infection. Relation to symptom formation
and host defense. J. Clin. Invest. 101, 643–649.
Iwasaki, T., Nozima, T., 1977. Defense mechanisms against primary
influenza virus infection in mice. I. The roles of interferon and
neutralizing antibodies and thymus dependence of interferon and
antibody production. J. Immunol. 118, 256–263.
Johansson, B.E., Bucher, D.J., Kilbourne, E.D., 1989. Purified influenza
virus hemagglutinin and neuraminidase are equivalent in stimulation
of antibody response but induce contrasting types of immunity to
infection. J. Virol. 63, 1239–1246.
Joklik, W.K., 1985. Interferons. In: Fields, B.N., Knipe, R.M., Melnick,
J.L., Chanok, M.S., Riozman, B., Shope, R.E. (Eds.), Virology. Raven
Press, New York, pp. 281–307.
Julkunen, I., Melen, K., Nyqvist, M., Pirhonen, J., Sareneva, T.,
Matikainen, S., 2000. Inflammatory responses in influenza A virus
infection. Vaccine 19 (Suppl. 1), S32–S37.
Keenan, K.P., Combs, J.W., McDowell, E.M., 1982. Regeneration of
hamster tracheal epithelium after mechanical injury. I. Focal lesions:
quantitative morphologic study of cell proliferation. Virchows Arch. B
Cell Pathol. Incl. Mol. Pathol. 41, 193–214.
Kuiken, T., Holmes, E.C., McCauley, J., Rimmelzwaan, G.F., Williams,
C.S., Grenfell, B.T., 2006. Host species barriers to influenza virus
infections. Science 312, 394–397.
Lamb, R.K.R., 1996. Orthomyxoviridae: The Viruses and their Replica-
tion. Lippincott-Raven Publishers, Philadelphia, pp. 1353–1396.
Liew, F.Y., Russell, S.M., Appleyard, G., Brand, C.M., Beale, J., 1984.
Cross-protection in mice infected with influenza A virus by the
respiratory route is correlated with local IgA antibody rather than serum
antibody or cytotoxic T cell reactivity. Eur. J. Immunol. 14, 350–356.
Marchuk, G.I., Berbentsova, E.P., 1986. [Results using a quantitative
method for evaluating the severity and dynamics of acute pneumonia,
chronic bronchitis and bronchial asthma]. Ter. Arkh. 58, 63–70.
Marchuk, G.I., Petrov, R.V., Romanyukha, A.A., Bocharov, G.A., 1991.
Mathematical model of antiviral immune response. I. Data analysis,
generalized picture construction and parameters evaluation for
hepatitis B. J. Theor. Biol. 151, 1–40.
Meltzer, M.I., Cox, N.J., Fukuda, K., 1999. The economic impact of
pandemic influenza in the United States: priorities for intervention.
Emerg. Infect. Dis. 5, 659–671.
Mohler, L., Flockerzi, D., Sann, H., Reichl, U., 2005. Mathematical
model of influenza A virus production in large-scale microcarrier
culture. Biotechnol. Bioeng. 90, 46–58.
Murphy, B.R., Clements, M.L., 1989. The systemic and mucosal immune
response of humans to influenza A virus. Curr. Top. Microbiol.
Immunol. 146, 107–116.
immune response to influenza A virus infection. Journal of Theoretical

ARTICLE IN PRESSB. Hancioglu et al. / Journal of Theoretical Biology ] (]]]]) ]]]–]]] 17
Neumann, A.U., Lam, N.P., Dahari, H., Gretch, D.R., Wiley, T.E.,
Layden, T.J., Perelson, A.S., 1998. Hepatitis C viral dynamics in vivo
and the antiviral efficacy of interferon-alpha therapy. Science 282,
103–107.
Nguyen, H.H., Boyaka, P.N., Moldoveanu, Z., Novak, M.J., Kiyono, H.,
McGhee, J.R., Mestecky, J., 1998. Influenza virus-infected epithelial
cells present viral antigens to antigen-specific CD8+ cytotoxic T
lymphocytes. J. Virol. 72, 4534–4536.
Nicholson, K.G., Webster, A.G., Hay, A.J., 1998. Textbook of Influenza.
Blackwell Science, Oxford.
Nowak, M.A., Bangham, C.R., 1996. Population dynamics of immune
responses to persistent viruses. Science 272, 74–79.
Nowak, M.A., May, R., 2000. Virus Dynamics: The Mathematical
Foundations of Immunology and Virology. Oxford University Press,
Oxford.
Perelson, A.S., 2002. Modelling viral and immune system dynamics. Nat.
Rev. Immunol. 2, 28–36.
Perelson, A.S., Kirschner, D.E., De, B.R., 1993. Dynamics of HIV
infection of CD4+ T cells. Math. Biosci. 114, 81–125.
Perelson, A.S., Neumann, A.U., Markowitz, M., Leonard, J.M., Ho,
D.D., 1996. HIV-1 dynamics in vivo: virion clearance rate, infected cell
life-span, and viral generation time. Science 271, 1582–1586.
Price, G.E., Gaszewska-Mastarlarz, A., Moskophidis, D., 2000. The role
of alpha/beta and gamma interferons in development of immunity to
influenza A virus in mice. J. Virol. 74, 3996–4003.
Ronni, T., Sareneva, T., Pirhonen, J., Julkunen, I., 1995. Activation of
IFN-alpha, IFN-gamma, MxA, and IFN regulatory factor 1 genes in
influenza A virus-infected human peripheral blood mononuclear cells.
J. Immunol. 154, 2764–2774.
Sareneva, T., Matikainen, S., Kurimoto, M., Julkunen, I., 1998. Influenza
A virus-induced IFN-alpha/beta and IL-18 synergistically enhance
IFN-gamma gene expression in human T cells. J. Immunol. 160,
6032–6038.
Scherle, P.A., Palladino, G., Gerhard, W., 1992. Mice can recover from
pulmonary influenza virus infection in the absence of class I-restricted
cytotoxic T cells. J. Immunol. 148, 212–217.
Shinya, K., Ebina, M., Yamada, S., Ono, M., Kasai, N., Kawaoka, Y.,
2006. Avian flu: influenza virus receptors in the human airway. Nature
440, 435–436.
Please cite this article as: Hancioglu, B., et al., A dynamical model of human
Biology (2007), doi:10.1016/j.jtbi.2006.12.015
Smith, D.J., Forrest, S., Ackley, D.H., Perelson, A.S., 1999. Variable
efficacy of repeated annual influenza vaccination. Proc. Natl. Acad.
Sci. USA 96, 14001–14006.
Stark, G.R., Kerr, I.M., Williams, B.R., Silverman, R.H., Schreiber, R.D.,
1998. How cells respond to interferons. Annu. Rev. Biochem. 67, 227–264.
Tamura, S., Kurata, T., 2004. Defense mechanisms against influenza virus
infection in the respiratory tract mucosa. Jpn. J. Infect. Dis. 57, 236–247.
Tamura, S., Iwasaki, T., Thompson, A.H., Asanuma, H., Chen, Z.,
Suzuki, Y., Aizawa, C., Kurata, T., 1998. Antibody-forming cells in
the nasal-associated lymphoid tissue during primary influenza virus
infection. J. Gen. Virol. 79 (Pt 2), 291–299.
Tamura, S., Tanimoto, T., Kurata, T., 2005. Mechanisms of broad cross-
protection provided by influenza virus infection and their application
to vaccines. Jpn. J. Infect. Dis. 58, 195–207.
Taubenberger, J.K., Morens, D.M., 2006. 1918 Influenza: the mother of
all pandemics. Emerg. Infect. Dis. 12, 15–22.
Tulp, A., Verwoerd, D., Dobberstein, B., Ploegh, H.L., Pieters, J., 1994.
Isolation and characterization of the intracellular MHC class II
compartment. Nature 369, 120–126.
Webster, R.G., Peiris, M., Chen, H., Guan, Y., 2006. H5N1 outbreaks
and enzootic influenza. Emerg. Infect. Dis. 12, 3–8.
Wohlfart, C., 1988. Neutralization of adenoviruses: kinetics, stoichiome-
try, and mechanisms. J. Virol. 62, 2321–2328.
Wyde, P.R., Wilson, M.R., Cate, T.R., 1982. Interferon production by
leukocytes infiltrating the lungs of mice during primary influenza virus
infection. Infect. Immun. 38, 1249–1255.
Yetter, R.A., Lehrer, S., Ramphal, R., Small Jr., P.A., 1980. Outcome of
influenza infection: effect of site of initial infection and heterotypic
immunity. Infect. Immun. 29, 654–662.
Yewdell, J.W., Bennink, J.R., Smith, G.L., Moss, B., 1985. Influenza A
virus nucleoprotein is a major target antigen for cross-reactive anti-
influenza A virus cytotoxic T lymphocytes. Proc. Natl. Acad. Sci. USA
82, 1785–1789.
Yoshikawa, T., Matsuo, K., Matsuo, K., Suzuki, Y., Nomoto, A.,
Tamura, S., Kurata, T., Sata, T., 2004. Total viral genome copies and
virus-Ig complexes after infection with influenza virus in the nasal
secretions of immunized mice. J. Gen. Virol. 85, 2339–2346.
Zdanov, V.M., Bukrinskaja, A.G., 1969. Myxoviruses Reproduction.
Medicina, Moscow, Russia.
immune response to influenza A virus infection. Journal of Theoretical