a fetal weight reference for twins based on …digitool.library.mcgill.ca/thesisfile106242.pdf · a...
TRANSCRIPT
i
A FETAL WEIGHT REFERENCE FOR TWINS BASED ON
ULTRASOUND MEASUREMENTS
Sushmita Shivkumar, MSc Candidate
Department of Epidemiology, Biostatistics and Occupational Health
McGill University, Montreal
August, 2011
Thesis submitted to McGill University in partial fulfillment of the requirements of the
degree of Master of Science
© Sushmita Shivkumar, 2011
i
Abstract
Background and Objective
Fetal growth and size are known indicators of perinatal health, although the etiology of
this relationship is unclear, and twins are known to differ from singletons with respect to
fetal growth trajectories over the course of pregnancy. With a lack of research on
ultrasound-based fetal weight references in twin populations, this study aimed to
construct ultrasound-based in utero fetal weight references for each gestational age for a
twin population.
Methods
Twins delivered at a tertiary care hospital in Montreal were used in this study. Fetal
weight was calculated using a published formula that was validated in this population.
Fetal growth was then modeled in twins using serial ultrasound measurements of fetal
weight, and adjusting for sex and chorionicity. Linear mixed models were used to adjust
for the correlation between twins from the same pregnancy, and for the use of multiple
ultrasound measurements for each fetus. Restricted cubic splines were used to account for
the non-linear growth of fetuses over the course of pregnancy. Predictions were made
from this regression model for the 1st, 10
th, 50
th, 90
th and 99
th fetal weight percentiles for
the gestational period between weeks 22 and 37.
Results
Median gestational age at birth was 37 weeks, with a predicted median birth weight of
2686 g. The rate of change in fetal weight was observed to be S-shaped over the course of
pregnancy, with a period of accelerated growth in the second trimester, and slower
growth in the third trimester. Ultrasound-based fetal weight references constructed from
this population corroborated other published ultrasound-based fetal weight references in
twin populations. As expected, fetal weight in twins was consistently lower than

ii
singletons over the course of pregnancy, when compared with other published fetal
weight references.
Conclusions
The ultrasound-based fetal weight reference and predicts fetal weight at each gestational
age, estimates which could be used to assess fetal size at each gestational age in twin
pregnancies. This study additionally validates the use of formulae to estimate fetal weight
in a twin population, and adds to literature published in this field.

iii
Résumé
Considérations préliminaires et objectif
La croissance in utero des jumeaux diffère de celle des enfants uniques. La croissance et
la taille foetale sont des indicateurs communs de santé périnatale, bien que la nature
exacte du lien de causalité soit encore incertaine. La surveillance de la taille foetale
s'inscrit naturellement dans le suivi des grossesses. L'imagerie par ultrasons a permis
l'élaboration de normes pondérales ultrasonographiques in utero pour les enfants uniques.
Moins d'efforts ont été déployés pour quantifier les variations de taille des jumeaux au
cours de la grossesse. Le présent ouvrage cherche à proposer une norme pondérale in
utero pour les jumeaux.
Méthode
Le poids foetal a été estimé grâce à une formule validée pour la population retenue. La
croissance intrautérine des jumeaux a été modélisée à l'aide d'estimés pondéraux
ultrasonographiques prenant compte du sexe et de la chorionicité. Des splines cubiques
naturels ont été utilisés pour rendre compte de la non-linéarité de la croissance foetale. Le
modèle de régression a permis d'obtenir des prédictions pour les 1er, 10e, 50e, 90e et 99e
centiles du poids foetal de la 22e à la 37e semaine de grossesse.
Résultats
La norme pondérale ultrasonographique élaborée à partir de la population retenue était
compatible avec des normes de même nature publiées précédemment. Tel que prévu, le
modèle a révélé que le poids in utero des jumeaux était systématiquement plus bas que
celui des enfants uniques, les valeurs de référence pour ce dernier étant tirées d'une
norme pondérale reconnue.
Conclusion

iv
La norme pondérale ultrasonographique in utero pour les jumeaux tirée de cette étude
complémente la littérature traitant de la croissance intrautérine des jumeaux, peu étoffée
en comparaison avec celle portant sur la croissance intrautérine des enfants uniques.
Après validation externe, elle pourrait se révéler utile en pratique clinique.

v
Preface
The current thesis focuses on the construction of a fetal weight reference over the course
of pregnancy in a twin population. First, an introduction is provided to the project in
Chapter 1, outlining the rationale behind a fetal weight reference for twins. Then, in
Chapter 2, an outline of the objectives of this project are provided. Chapter 3 provides a
detailed explanation of the epidemiology of twinning, concepts central to twin
pregnancies and fetal growth, as well as a detailed summary of the literature on the
estimation of fetal weight, and assessment of fetal growth to date. Then, details of the
study methodology used are provided in Chapter 4. Chapter 5 consists of the results from
the analysis, presented as two manuscripts. Finally, Chapter 6, includes an interpretation
of the study findings, the strengths, limitations and scope of this work.
The following thesis has been prepared according to the guidelines for a manuscript-
based thesis. The results are outlined in two manuscripts:
A Comparison of Five Commonly Used Formulae to Estimate Fetal Weight in Twins
Sushmita Shivkumar, BA. BSc., Robert Platt, PhD.
An Ultrasound-Based Fetal Weight Reference for Twins
Sushmita Shivkumar, BA. BSc., Robert Platt, PhD.
Details of authors’ contributions are provided on page vi.

vi
Contributions of Authors
The original research idea was developed by Dr. Robert Platt. Specific study objectives
and study design were outlined by Ms. Sushmita Shivkumar. The study design and
objectives were presented to Dr. Olga Basso and Dr. Robert Gagnon, who offered input
regarding study design, and other issues specific to the conduct of the study.
Ms. Shivkumar wrote the study protocol, which was subsequently revised and approved
by Dr. Platt.
The merging of the databases necessary for the study, data cleaning, and data analysis
was conducted by Ms. Shivkumar with input from Dr. Platt. Complete drafts of the two
manuscripts: “A Comparison of Five Commonly Used Formulae to Estimate Fetal
Weight in Twins” and “An Ultrasound-Based Fetal Weight Reference for Twins” were
written by Ms. Shivkumar, and subsequently reviewed and revised by Dr.Platt.

vii
Acknowledgements
Financial support for this research project was provided by CIHR grant MOP-84379.
Financial support for my Master’s thesis was provided by a Studentship from the
Foundation of Stars/Montreal Children’s Hospital Research Institute. The Montreal
Children’s Hospital Research Institute also receives funds from the Fonds de la recherche
en Santé du Québec. I would like to extend my sincere gratitude to these organizations
for their financial support.
I would like to thank Dr. Robert Platt, my supervisor, for all the help, and advice
provided during my Master’s thesis. Also, I thank Dr. Olga Basso and Dr. Robert Gagnon
for providing their expertise on subject matter in the field of perinatal epidemiology.
Specifically, Dr. Basso was willing to talk about the strengths and weaknesses of the
methodology. I would also like to thank the members of the perinatal epidemiology
research group at the Montreal Children’s Hospital Research Institute, in particular Dr.
Jennifer Hutcheon, who was so helpful in the beginning stages of planning this thesis,
and provided valuable perspective from her years of working in this field, and Luc
Villandré, who provided so much informal statistical consulting, and feedback.
Finally, I would like to thank my family, my parents and my sister, who have been my
anchor over the years. And, all my friends, old ones, made over my years living in
Montreal, and new ones I have been lucky to meet over the past two years.

viii
Table of Contents
Abstract .................................................................................................................... i
Résumé ................................................................................................................... iii
Preface......................................................................................................................v
Contributions of Authors ....................................................................................... vi
Acknowledgements ............................................................................................... vii
Table of Contents ................................................................................................. viii
List of Tables ...........................................................................................................x
List of Figures ........................................................................................................ xi
List of Appendices ................................................................................................ xii
List of Abbreviations ........................................................................................... xiii
Chapter 1: Introduction ............................................................................................1
Chapter 2: Study Objectives ....................................................................................5
2.1 Primary Objective ..........................................................................................5
2.2 Secondary Objective ......................................................................................5
Chapter 3: Background and Review of Literature ...................................................6
3.1 The Epidemiology of Twinning .....................................................................6
3.1.1 Twinning .................................................................................................6
3.1.2 The Global Prevalence of Twinning and Trends over Time ...................8
3.1.3 Correlates of Twinning .........................................................................10
3.1.4 Outcomes Associated with Twinning ....................................................10
3.2 Fetal Growth Patterns in Twins ...................................................................13
3.3 Intrauterine Growth Restriction (IUGR) ......................................................15
3.3.1 Etiology .................................................................................................15
3.3.2 Perinatal and Long-Term Outcomes Associated with IUGR ................16
3.3.3 Cross-sectional and Longitudinal Assessment of Fetal Growth ...........17
3. 4 Birth Weight References .............................................................................18
3.4.1 Birth Weight References in Twins .........................................................18
3.4.2 Limitations of Birth Weight References ................................................20
3. 5 Use of ultrasound to monitor fetal growth ..................................................21
3.5.1 Estimation of Gestational Age ..............................................................21
3.5.2 Estimation of Fetal Weight ...................................................................22
3.5.3 Accuracy of Estimation of Fetal Weight ...............................................25
3.5.4 Ultrasound growth references ..............................................................30
3.5.5 Limitations of Ultrasound-Based References .......................................34
Chapter 4: Methods ................................................................................................36
4.1 Study Design and Setting .............................................................................36
4.2 Population ....................................................................................................36
4.2.1 Inclusion Criteria ..................................................................................36
4.2.2 Exclusion Criteria .................................................................................36
4.3 Data ..............................................................................................................37
4.3.1 Databases used in the study ..................................................................37
4.3.2 Outcome ................................................................................................39
4.3.3 Assessment of Exposure and Covariates ...............................................40
4.4 Statistical Analysis ......................................................................................42

ix
4.4.1 Primary Objective: Construction of Fetal Weight Reference ...............42
4.4.2 Secondary Objective: Assessment of Estimated Fetal Weight Formulae46
Chapter 5: Results ..................................................................................................49
5.1 Preface to Manuscript 1 ...............................................................................49
5.2 Manuscript 1: An Ultrasound-Based Fetal Weight Reference for Twins ....50
ABSTRACT .....................................................................................................51
Introduction ....................................................................................................52
Methods ..........................................................................................................53
Results ............................................................................................................58
Discussion ......................................................................................................60
Tables and Figures for Manuscript 1 ............................................................65
5.3 Preface to Manuscript 2 ...............................................................................75
5.4 Manuscript 2: A Comparison of Five Commonly Used Formulae to Estimate Fetal
Weight in Twins .................................................................................................76
ABSTRACT .....................................................................................................77
Introduction ....................................................................................................79
Methods ..........................................................................................................80
Results ............................................................................................................82
Discussion ......................................................................................................85
Tables and Figures for Manuscript 2 ............................................................88
Chapter 6: Discussion ............................................................................................94
6.1 Interpretation of Findings ............................................................................94
6.2 Strengths .....................................................................................................95
6.3 Limitations ...................................................................................................96
6.4 Future Research ...........................................................................................99
References ............................................................................................................101
APPENDIX 1: Procedure for merging the MOND and Ultrasound Records ......120
APPENDIX 2: Results from Sensitivity Analysis ...............................................124

x
List of Tables
Chapter 3
Table 1: Formulae Developed in Singletons (or Unspecified Populations) to
Estimate Fetal Weight……………………………………………………... 22-23
Table 2: Formula Developed in Twins…………………………………… 24
Chapter 4
Table 1: EFW Formulae Assessed for Accuracy and Precision…………... 46
Chapter 5 Section 5.2
Table 1: Maternal and Fetal Characteristics of Study Sample…………..... 64
Table 2: Predicted Fetal Weights for Overall Sample (Weeks 22-37)…..... 65
Table 3a: Predicted Fetal Weights for Males (Weeks 22-37)…………….. 66
Table 3b: Predicted Fetal Weights for Females (Weeks 22-37)………….. 66
Table 4a: Predicted Fetal Weights for Monochorionic Twins
(Weeks 22-37)…………………………………………………………...... 67
Table 4b: Predicted Fetal Weights for Dichorionic Twins
(Weeks 22-37)…………………………………………………………….. 67
Section 5.4
Table 1: Formulae Assessed in Study………………………………….…. 81
Table 2: Accuracy and Precision for Each Formula by Maternal and Fetal
Covariates……………………………………………….………………... 81-82
Appendix 2
Table 1: Predicted Fetal Weights
(Estimation of Gestational Age by LNMP)………………………………. 112
Table 2: Predicted Fetal Weights
(Estimation of Gestational Age by Ultrasound)………….…………….… 113

xi
List of Figures
Chapter 3
Figure 1: An Illustration of the Chorionic, and Amniotic Membranes…… 7
Figure 2: Trends in Prevalence of Twinning in
Developed Countries (1972-1996)………………………………………… 8
Figure 3: Median Birth Weights for Singletons, Twins,
and Triplets (United States)……………………………………………….. 13
Figure 4: Phases of Fetal Growth in Triplets and
Twins Relative to Singletons……………………………………………… 14
Chapter 4
Figure 1: Inclusion of Study Subjects for Primary Objective.…………….. 38
Chapter 5
Section 5.2
Figure 1: Predicted and Observed Fetal Weights for Study Sample……… 63
Figure 2: Predicted Median Fetal Weights for Males and Females………. 63
Figure 3: Predicted Median Fetal Weights for
Monochorionic and Dichorionic Twins…………………………………... 64
Appendix 2
Figure 1: Comparison of Fetal Growth using Three
Methods of Estimating Gestational Age…………………………………. 114

xii
List of Appendices
APPENDIX 1: Merging of the MOND and Ultrasound Records
APPENDIX 2: Results from Sensitivity Analysis

xiii
List of Acronyms
AC: Abdominal Circumference
AD: Abdominal Diameter
AGA: Appropriate-for-gestational age
AIC: Akaike Information Criteria
ART: Artificial Reproductive Technologies
BPD: Biparietal Diameter
BMI: Body Mass Index
CI: Confidence Interval
cm: Centimetre
CRL: Crown-Rump Length
EFW: Estimated Fetal Weight
FAA: Fetal Abdominal Area
FL: Femur Length
GA: Gestational age
g: Grams
HC: Head Circumference
HELLP: Hemolysis, elevated liver enzymes, low platelet count
IQR: Inter-quartile Range
IVH: Intra-ventricular hemorrhage
IUGR: Intrauterine Growth Restriction
kg: Kilogram
LBW: Low Birth weight
LMM: Linear Mixed Model
LNMP: Last Normal Menstrual Period
m: Metre
MOND: McGill Obstetrical and Neonatal Database
MRN: Medical Record Number
NEC: Necrotizing Enterocolitis
OR: Odds Ratio

xiv
RDS: Respiratory Distress Syndrome
ROC: Receiver Operating Curve
RVH: Royal Victoria Hospital
SGA: Small-for-gestational age
1
Chapter 1: Introduction
Although the occurrence of twin pregnancies in humans has been recognized throughout
history, with the advent of infertility treatments and changing demographics over time,
the importance of the study and characterization of twin pregnancies and multiple
pregnancies in general, has increased.1 After a decrease in the incidence of multiple
pregnancies between the 1930s and the mid 1970s, the rate of multiple pregnancies has
since been rising after the 1980s, in particular in Western Europe and North America.2
For instance, in Canada, the number of live twin births increased by 40% between 1974
and 1990.3 Factors such as delayed childbearing, increased use of ovulation induction,
and other artificial reproductive technologies (ART) have been suggested as contributing
to the observed increase in the incidence of twinning and multiple pregnancies in
general.2
Twin pregnancies, like all multiple pregnancies, are known to be associated with a higher
risk of adverse outcomes when compared to singletons. Twins have been shown to be
born at lower gestational ages and have significantly higher rates of perinatal mortality
and morbidity when compared to singletons.4 For instance, by 1999, multiple births were
found to represent 3% of all live births in the United States, up from 2% in 1980, and
simultaneously represent 14% of all infant deaths, up from 11% in the earlier time
period.5 This is within the context of an overall decrease in infant mortality of 42%
between 1980 and 1997, in the United States.6 Moreover, the growth patterns of twin
fetuses are different from that of singletons, characterized by a slow-down in fetal growth
in the third trimester, which is in turn, related to factors such as limited uterine capacity
or uteroplacental insufficiency.7
Fetal growth, in general, in utero is influenced by a number of physiological and
pathological factors including their genetic growth potential, maternal characteristics and
placental function.8 Maternal factors such as smoking, advanced age, placental function,
presence of disease, namely chronic hypertension, preeclampsia, eclampsia, HELLP
syndrome, and diabetes are all known to be associated with intrauterine growth restriction
2
(IUGR), as are fetal characteristics such as the presence of chromosomal or congenital
anomalies, fetal infections, and multifetal gestations.9
IUGR, specifically, when a fetus fails to reach its own growth potential during gestation,
is associated with a higher risk of adverse perinatal outcomes. These include intrauterine
or neonatal death,8, 10
respiratory distress syndrome (RDS), chronic lung disease,
necrotizing enterocolitis (NEC), intraventricular hemorrhage (IVH), low Apgar scores at
birth, umbilical cord pH< 7.0, a higher likelihood of requiring resuscitation,
hypoglycemia, hypocalcemia, polycythemia, compromised immune function and
hepatocellular dysfunction.8 Moreover, infants that experienced growth restriction in
utero are also considered to be at risk of long-term effects on growth into young
adulthood, neurologic outcome, metabolic disease,11
and other developmental outcomes,
although the etiology of this is unclear.8
Given the adverse perinatal and long-term outcomes associated with IUGR, there has
been much research focusing on the earliest possible detection of deviations from an
optimal growth trajectory, one that is associated with the least risk of adverse perinatal
outcome. This has implications for the clinical management and monitoring of
pregnancies, especially in higher-risk ones such as twin pregnancies. Over the years, a
number of approaches and definitions have been considered to appropriately detect when
a fetus experiences IUGR.
IUGR refers to a longitudinal process of fetal growth restriction, in which there is a
downward deviation from a steady growth trajectory. However, historically, this term has
often been used interchangeably with “small-for-gestational age” (SGA), which is an
assignment based on a cross-sectional comparison to a distribution of fetal weight or birth
weight at a given gestational age.12
Increasingly, there is a recognition that SGA fetuses
or infants are not a homogenous group, and include both those fetuses that are
physiologically small but growing normally, as well as those fetuses that experience
pathological growth restriction.9
3
Despite this caveat, however, there is value in comparing either the birth weight or fetal
weight estimates calculated using in utero biometric measurements such as biparietal
diameter (BPD), head circumference (HC), abdominal circumference (AC) and femur
length (FL),13
with cross-sectional references.9 A number of formulae have been
developed and tested in different populations using combinations of these biometric
measures in order to accurately estimate fetal weight. Fetal weight estimates or birth
weight of the fetus or infant are then usually compared against population-based birth
weight references,14
or estimated fetal weight references based on one or multiple serial
ultrasounds.15-16
A fetus or infant is usually classified as SGA when it falls under the 10th
percentile of weight for its gestational age, but other thresholds can be used.8
Alternatively, customized fetal growth standards have been proposed, which are specific
to maternal characteristics such as height, weight, parity and ethnicity.17
The rationale
behind customized growth standards is to distinguish between those fetuses that are
physiologically small but attaining their growth potential from those fetuses that are
pathologically growth restricted.18
While customized percentiles for fetal growth have
been shown to be superior to birth weight reference charts, there is evidence that their
performance is not different relative to intrauterine ultrasound-based references.18
In fact,
their enhanced performance relative to birth weight references may arise from the fact
that customized standards, in addition to adjusting for maternal characteristics, use an
intrauterine growth standard to calculate an infant’s “optimal weight”.18
This may, in turn, be related to the fact that the use of birth weight references for each
gestational age is known to be associated with bias, especially at lower gestational ages.19
At early gestational ages, the number of fetuses remaining in utero will be much higher
than those that are delivered. Therefore, substantial data are missing when references are
constructed based on the birth weights of those infants that are born preterm.19
Moreover,
preterm delivery due to spontaneous labour, or medical intervention is presumably linked
to poor fetal health or impaired fetal growth. This creates a selection bias whereby infants
whose birth weights are used to construct fetal weight references are not a random sample
of the entire cohort of fetuses at preterm gestational ages.19
Using growth references
constructed from the birth weights of these infants, who are probably less healthy than

4
their counterparts that remain in utero, is thus inappropriate for the purposes of
comparison.19
Given these findings, and in the context of routine ultrasound monitoring of pregnancies,
there has been a general recognition of the value of fetal weight references, constructed
from in utero estimations of fetal weight. However, while there have been a number of
fetal weight references constructed for singletons,20-23
and much research conducted in
charting the growth trajectory of individual biometric measurements in twins,24-27
there
has not been as much focus on creating ultrasound-based fetal weight references for
twins. This is the case despite the recognition, as early as 1978, that comparing the fetal
size of twins to references constructed from the fetal weight of singletons is
inappropriate.28
Overall, twins are smaller than singletons over the course of pregnancy,
with significant differences in fetal growth patterns manifesting after approximately week
30 of gestation.29
Moreover, there is evidence that clinically optimal birth weights for
twins associated with a minimal risk of adverse perinatal outcomes may be lower than
those for singletons.30
Therefore, there is a need for ultrasound-based fetal weight
references specific to twins that can be used for comparison and monitoring of fetal
weight over the course of gestation.

5
Chapter 2: Study Objectives
2.1 Primary Objective
The primary objective of this study was to construct fetal weight references for twins
based on in utero measurements from the second and third trimester, for each completed
week of gestation between weeks 22 and 37. Separate fetal weight references were
constructed by sex of the fetus and based on the placentation (chorionicity) of the
pregnancy, both of which are known to affect fetal weight over the course of pregnancy.
2.2 Secondary Objective
In order to inform the choice of formula to estimate fetal weight in the construction of
fetal weight references for twins, the accuracy and precision of five commonly used
formulae were assessed in a sub-sample of this hospital-based twin population.
Specifically, the performance of two Hadlock formulae, the Shepard formula, the Ong
formula, and the Combs formula were assessed for their accuracy and precision.

6
Chapter 3: Background and Review of Literature
3.1 The Epidemiology of Twinning
3.1.1 Twinning
Although the occurrence of twinning in humans has been recognized throughout history,
with the recent advent of biotechnology and with changing demographic trends, the study
of twin pregnancies has greatly expanded.1 Blickstein proposes a definition of twin
pregnancies as the “result of intracorporeal development of more than one zygote and/or
the intracorporeal development of a split zygote, which was produced in the same or in a
different ovulatory cycle.”1 This is a broad enough definition to include those
pregnancies that begin as multiple pregnancies but result in the birth of only one live
fetus due to spontaneous or iatrogenic fetal reduction; those twin pregnancies resulting
from ART, and surrogate pregnancies.1
In humans, twinning can occur either by the splitting of one fertilized ovum or from two
fertilized ova. Monozygous twins are the result of the splitting of one embryo into two
genetically identical halves, usually between fertilization and around day eight after
conception, while dizygotic twins result from the separate fertilization of two ova by two
different sperms.31
Monozygotic twins are of the same sex, while dizygotic twins may be
of like or unlike sex.32
A short aside on embryonic development is useful to understanding placentation in twins.
After fertilization, the embryo undergoes rapid cell division until it is made up of a mass
of cells, which, by the sixth day, forms a hollow fluid-filled cavity called the blastocyst.
Around the seventh day, the blastocyst implants in the uterus.33
A mass of cells in the
blastocyst known as the trophoblasts are involved in implantation of the blastocyst into
the uterus, and in subsequent placentation.34
These cells form part of the chorion, a
membrane that surrounds the fetus, and that forms the fetal contribution to the placenta.
Interior to this, in the second week of the developmental process, the amniotic membrane
forms, which directly surrounds and protects the fetus, bathing it in amniotic fluid.35

7
Figure 1 is an illustration of the general arrangement of fetal membranes and the
placenta.
Dizygotic twins have separate placentas, and separate placental membranes, including the
chorion and amnion. Monozygotic twins, on the other hand, may have different
arrangements of placental membranes, with separate membranes for each fetus, namely,
dichorionic diamniotic, or common membranes surrounding both fetuses, namely
monochorionic diamniotic (one chorion but two amnions for each fetus), or
monochorionic monoamniotic (only one chorion and amnion surrounding both fetuses).33
Monochorionic twins share one placenta, while each dichorionic twin usually has its own
placenta.33
In monozygotic twins with separate membranes and placentas (dichorionic
diamniotic), splitting of the zygote is thought to occur 0-3 days after fertilization, while
monochrionic diamniotic twins are thought to result from splitting of the zygote between
day 4 and 7, and monochorionic monoamniotic twins thought to arise from splitting of
the zygote between days 6 and 8.32
Figure 1 : An Illustration of the Chorionic and Amniotic Membranes36
The prevalence of dizygotic twinning is reported to be 1 in 100 live births in North
America and Britain, with the risk of dizygotic twinning thought to vary by race, use of
artificial reproductive technologies, season, parity, and levels of the follicle stimulating
hormone.32
Monozygotic twinning has been found to have a prevalence of 1 in 330 live births,32
with
20-30% of monozygous twins being dichorionic diamniotic, 60-70% being

8
monochorionic diamniotic, and a rare 1% being monochorionic monoamniotic and facing
the highest risk of adverse perinatal outcomes.37
3.1.2 The Global Prevalence of Twinning and Trends over Time
The incidence of twin births has been on the rise globally since the mid-1970s, related to
changes in biotechnology such as the increasing use of ART over time, and demographic
changes, primarily delayed childbearing.38
Prior to this, and related to a decrease in
average maternal age, the incidence of twinning had been observed to fall between 1930
and the mid 1970s.2 The United Kingdom reported incidence rates of between 9.9 and
12.3 twin births per 1000 pregnancies between 1971-1975, with an increase to between
14.6 and 15.6 twin births per 1000 pregnancies in 2001-2002.39
In 2001-2002, other
Western European countries reported similar incidences, with the lowest reported
incidence of 10.55 twin births per 1000 live births from Luxembourg and the highest
incidence of 20.05 twin births per 1000 pregnancies reported from Greece.39
Nordic
countries reported somewhat higher incidence of twin births, ranging from 15.1 per 1000
live births in Finland in 2002 to 22.1 per 1000 live births in Denmark in 2001. These
countries have also experienced increases in the incidence of twin births since the
1980s.39
Between the mid 1970s and 1996, the incidence of twinning increased in
Australia by 30%, from a reported rate of 5.8 per 1000 live births in 1974 to 8.9 per 1000
live births in 1996.40
Japan, Hong Kong and Singapore have all demonstrated increases since the 1970s,
although they report lower incidence of twinning compared to European countries, with
9.9 twin births per 1000 pregnancies, 8.7 twin births per 1000 pregnancies and 9.7 per
1000 pregnancies, respectively, in the 1990s and 2000s.39, 41
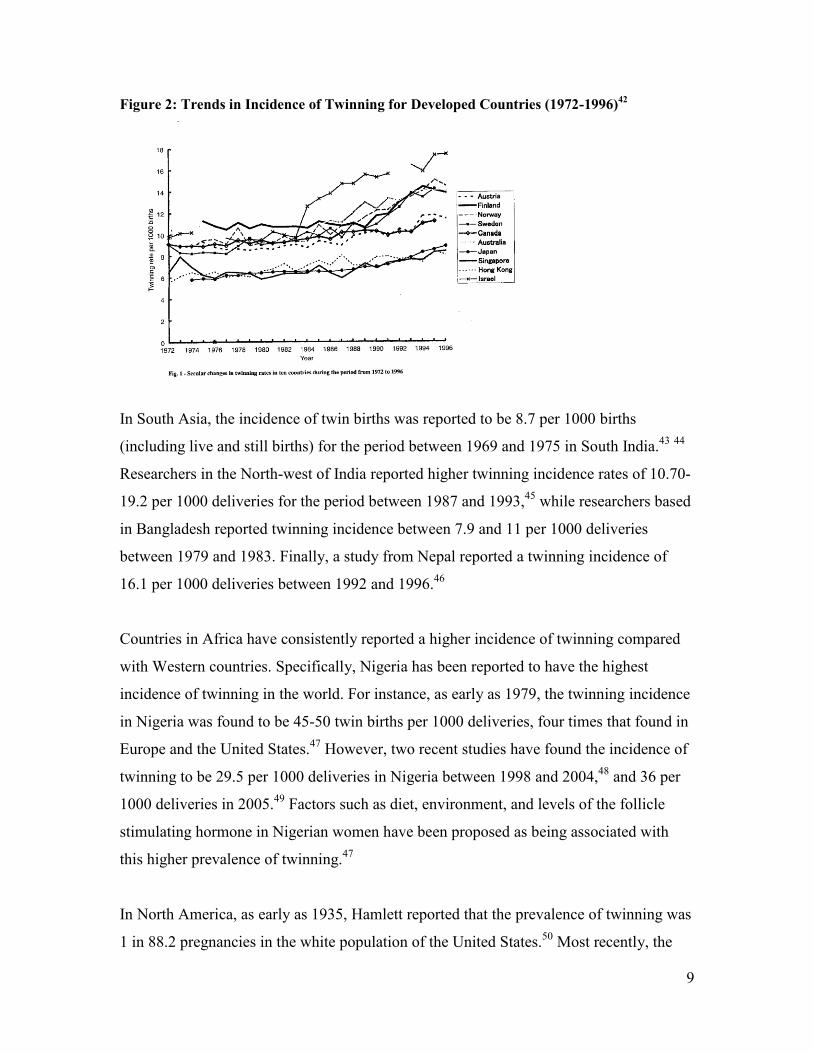
Figure 2 shows the trend in
incidence of twinning per1000 live births for ten developed countries, including Canada,
between 1972 and 1996.
9
Figure 2: Trends in Incidence of Twinning for Developed Countries (1972-1996)42
In South Asia, the incidence of twin births was reported to be 8.7 per 1000 births
(including live and still births) for the period between 1969 and 1975 in South India.43
44
Researchers in the North-west of India reported higher twinning incidence rates of 10.70-
19.2 per 1000 deliveries for the period between 1987 and 1993,45
while researchers based
in Bangladesh reported twinning incidence between 7.9 and 11 per 1000 deliveries
between 1979 and 1983. Finally, a study from Nepal reported a twinning incidence of
16.1 per 1000 deliveries between 1992 and 1996.46
Countries in Africa have consistently reported a higher incidence of twinning compared
with Western countries. Specifically, Nigeria has been reported to have the highest
incidence of twinning in the world. For instance, as early as 1979, the twinning incidence
in Nigeria was found to be 45-50 twin births per 1000 deliveries, four times that found in
Europe and the United States.47
However, two recent studies have found the incidence of
twinning to be 29.5 per 1000 deliveries in Nigeria between 1998 and 2004,48
and 36 per
1000 deliveries in 2005.49
Factors such as diet, environment, and levels of the follicle
stimulating hormone in Nigerian women have been proposed as being associated with
this higher prevalence of twinning.47
In North America, as early as 1935, Hamlett reported that the prevalence of twinning was
1 in 88.2 pregnancies in the white population of the United States.50
Most recently, the

10
prevalence of twin births in the United States has been reported to be around 32 per 1000
live births.51
Finally, in a study conducted for Statistics Canada, researchers found a 35%
increase in the incidence of twin pregnancies between 1974 and 1990, and an increase of
40% in live twin births, with a reported twin birth rate of around 10 per 1000 live births
in 1990.3
3.1.3 Correlates of Twinning
A number of factors have been proposed as being associated with the observed temporal
trends in twinning. Increased maternal age,38, 52
and use of ART have been associated
with a general increase in the incidence of twinning over time. Specifically, older age at
conception is associated with a higher risk of dizygotic twinning, which results from
double ovulation. This, in turn, may be linked to age-related hormonal changes and the
subsequent growth of multiple follicles, the precursor to oocytes, in any given menstrual
cycle.53
Moreover, ovulation induction and ART such as in vitro fertilization, and their
increased use over the years have been shown to be associated with a large increase in the
rates of dizygotic twinning specifically, and multiple pregnancies, in general, at a
population level over the years.54
Other factors proposed to be associated with an
increase in the frequency of dizygotic twinning are increased folic acid intake, peri-
conceptional multivitamin intake, diet and environmental factors.40, 47, 55
Additionally, parity,38, 46
race of the mother, and diet55
have also been associated with a
higher risk of twinning in general.
Consistent with the fact that the above-mentioned factors are all related to the risk of
dizygotic twinning and have changed over time, the incidence of monozygotic twinning
appears to have remained unchanged over the same time period that the overall twinning
incidence has increased.42
3.1.4 Outcomes Associated with Twinning
Twin pregnancies are known to be associated with higher perinatal morbidity and
mortality when compared to singletons,38, 56-59
although there is a general
11
acknowledgement that this may be linked with conditions that specifically affect twin
pregnancies, rather than inherent to being a twin.60-62
For instance, twins tend to be born at earlier gestational ages than singletons, with a mean
age at delivery of 35 weeks compared with 39 weeks in singletons, some proportion of
which can be attributed to medical intervention.29, 58, 63-66
As is the case in singletons,
delivery at earlier gestational ages is associated with higher rates of perinatal morbidity in
twins as well.67
Related to their tendency to be born earlier than singletons is the fact they are generally
of lower birth weight, a known predictor of adverse perinatal outcome.63
Twins are also
known to be at higher risk for intrauterine growth restriction,59
and are vulnerable to
complications unique to them such as growth discordance,59
and twin-to-twin transfusion
syndrome.
Growth Discordance
Some researchers consider small differences or discordance in the fetal growth of twins
over the course of pregnancy to be an adaptive mechanism that compensates for the
mother’s uterine capacity and promotes gestational age, allowing the mother to carry the
fetuses for longer.68-70
However, it is well recognized that when the fetal growth
trajectory of each twin from the same pair begins to diverge severely, a pathological
condition arises. Factors associated with growth discordance between twins include
maternal disease (hypertension, pre-eclampsia, eclampsia),71-72
the presence of congenital
anomalies,73
monochorionicity,74
and discordance in placental territory between twins,75-
79 while there is some conflicting evidence on the role played by conception by ART,
80-83
and reduction of multi-fetal pregnancies.80-81, 84-86
Increasing levels of birth weight discordance, generally quantified as the percentage
difference between birth weights of twins from the same pair, are associated with higher
rates of perinatal mortality, preterm birth, lower APGAR scores, lower cord pH at birth,
12
more frequent delivery by cesarean section, a higher risk of admission to intensive care,
longer hospital stays, higher incidence of RDS, and NEC.73, 81, 87-96
Increasingly, there is a
recognition that in the case of growth discordance, the smaller twin or the twin that is
SGA is at increased risk,72, 94, 96-97
a factor compounded by the fact that the risk of at least
one twin being SGA is higher in growth discordant pairs compared with concordant
pairs.71, 73, 92, 96
Twin-to-Twin Transfusion Syndrome
Twin-to-twin transfusion syndrome (TTTS) is a condition that develops predominantly in
monochorionic twins. The formation of anastomoses between the arteries and veins of
co-twins, as well as an imbalance in the blood pressure of either of the twins, can lead to
a transfusion of blood from the donor twin to the recipient twin.39
A more severe form of
this is a condition called twin reversed arterial perfusion (TRAP).39
As the severity of
TTTS increases, fetal growth is affected, and fetal demise of the donor twin is a
possibility, with the surviving co-twin then also at higher risk for adverse outcomes, or
death.39
Perinatal Outcomes Associated with Zygosity and Chorionicity
The association between zygosity and the risk of adverse perinatal outcome is still
somewhat controversial, with a growing tendency for the chorionicity of twin
pregnancies to be considered a more accurate predictor of adverse perinatal and neonatal
outcome than zygosity.98-101
Consistently, monochorionic twins have been shown to be at
higher risk for adverse outcomes such as perinatal mortality, IUGR, and preterm birth
than dichorionic twins.102-106
When twins are dizygous, due to their differing genetic makeup, they may experience
chromosomal abnormalities discordantly, with the possibility of one twin from the pair
remaining unaffected.59
However, the presence of a fetal anomaly in at least one twin has
13
been shown to have an influence on gestational age at delivery, on the mean birth weight
of twins from the affected pregnancy, and on the risk of perinatal mortality.107-112
Additionally, fetal death of one twin, especially after the first trimester, has been shown
to be associated with IUGR, preterm birth, and higher perinatal mortality for the other
twin.45, 59
Outcomes in Twins Conceived by ART
While some studies report no differences in outcomes between twins that are
spontaneously conceived and those that are conceived by ART,113-114
or even a lower risk
of adverse outcomes in those conceived using ART,115
some report a higher frequency of
premature deliveries, lower birth weights and a higher risk of IUGR.116-119
Specifically,
twins conceived by intracytoplasmic sperm injection appear to fare worse, with a higher
risk of stillbirth relative to those conceived by in vitro fertilization.38
Moreover, when
twins conceived by ART undergo fetal reduction from higher-order pregnancies to twins,
they appear to be at higher risk for preterm birth and lower birth weights compared with
non-reduced or spontaneously conceived twins.120-123
3.2 Fetal Growth Patterns in Twins
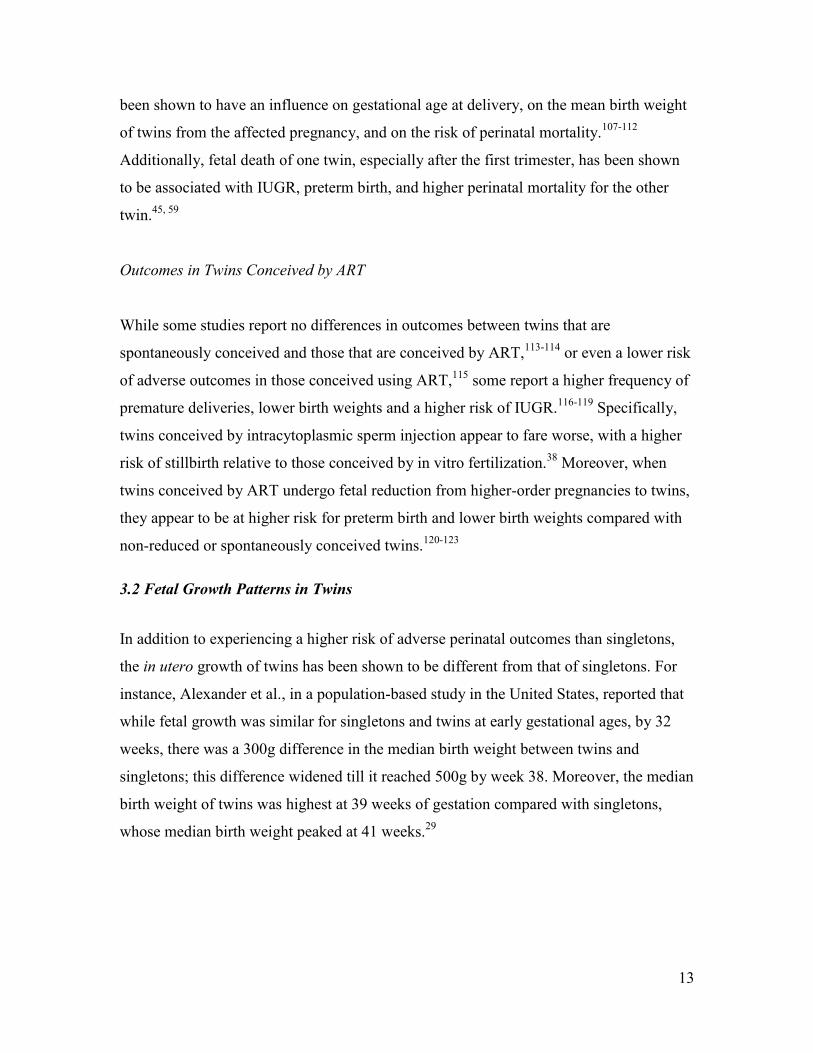
In addition to experiencing a higher risk of adverse perinatal outcomes than singletons,
the in utero growth of twins has been shown to be different from that of singletons. For
instance, Alexander et al., in a population-based study in the United States, reported that
while fetal growth was similar for singletons and twins at early gestational ages, by 32
weeks, there was a 300g difference in the median birth weight between twins and
singletons; this difference widened till it reached 500g by week 38. Moreover, the median
birth weight of twins was highest at 39 weeks of gestation compared with singletons,
whose median birth weight peaked at 41 weeks.29
14
Figure 3: Median Birth Weights for Singletons, Twins, and Triplets (United States) 29
These findings were in agreement with those from other research groups, who reported
similar fetal growth patterns till the late second trimester,124
with divergent growth
between twins and singletons setting in around weeks 30-33.27, 58, 125-127
One research
group has reported significant differences between the size of twins and singletons only
at around 35-36 weeks of gestation.128-129
This difference persists until birth, with twins
being classified SGA more often than singletons when compared to singleton-based
weight references.130
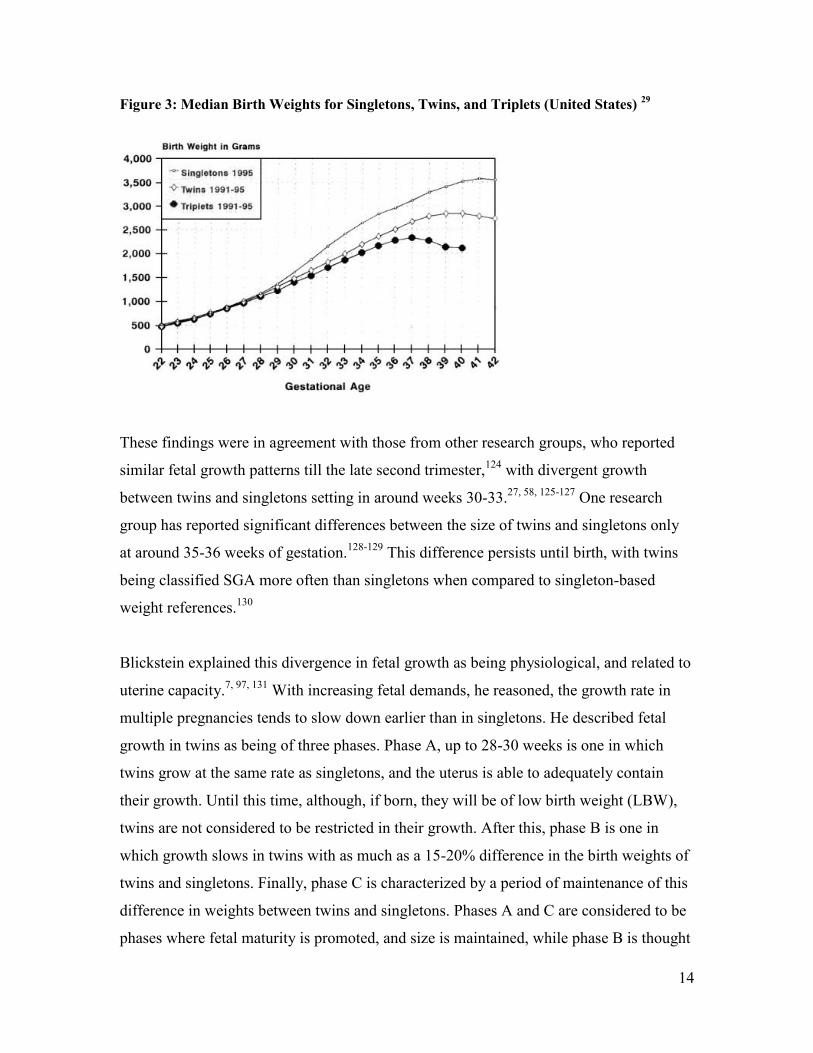
Blickstein explained this divergence in fetal growth as being physiological, and related to
uterine capacity.7, 97, 131
With increasing fetal demands, he reasoned, the growth rate in
multiple pregnancies tends to slow down earlier than in singletons. He described fetal
growth in twins as being of three phases. Phase A, up to 28-30 weeks is one in which
twins grow at the same rate as singletons, and the uterus is able to adequately contain
their growth. Until this time, although, if born, they will be of low birth weight (LBW),
twins are not considered to be restricted in their growth. After this, phase B is one in
which growth slows in twins with as much as a 15-20% difference in the birth weights of
twins and singletons. Finally, phase C is characterized by a period of maintenance of this
difference in weights between twins and singletons. Phases A and C are considered to be
phases where fetal maturity is promoted, and size is maintained, while phase B is thought
15
to promote maturity at the cost of fetal size.7, 97, 131
Twin-to-singleton fetal weight ratios
over the course of pregnancy are illustrated in Figure 4.
Figure 4: Phases of Fetal Growth in Triplets and Twins Relative to Singletons97
(Thick line – Triplet to Singleton Birth Weight Ratio.
Thin line – Twin to Singleton Birth Weight Ratio. )
3.3 Intrauterine Growth Restriction (IUGR)
3.3.1 Etiology
Fetal growth, the change in size and weight of the fetus over the course of pregnancy, is
largely influenced by the nutrients and uterine space available to the fetus.132
In this, the
placenta plays a pivotal role, mediating the transfer of nutrients, metabolites, and oxygen
from the mother to the fetus.132
Thus, IUGR of the fetus is a manifestation of numerous
placental, maternal and fetal factors and not a disease in and of itself.
The placenta acts as an interface for maternal and fetal oxygen and nutrient exchange133
The size of the placenta, specifically the placental surface area available, is thought to
influence fetal growth. Of importance are the placental disk shape, the location of
insertion of the umbilical cord relative to the edge of the placental disk, placental disk
diameter, placental thickness and weight.133
16
Maternal factors that may lead to compromised placental function, such as reduced
uteroplacental blood flow, reduced blood volume, or reduced oxygen-carrying capacity
have all been linked with IUGR.134
Conditions that are associated IUGR include living at
high altitudes, maternal disorders such as pre-eclampsia, chronic hypertension with or
without superimposed pre-eclampsia, autoimmune disorders, chronic severe nephropathy,
and pregestational diabetes complicated by vasculopathy.135
Other maternal behavioural
and environmental factors that are associated with a higher risk of IUGR include cigarette
smoking, alcohol consumption, cocaine use, use of anticonvulsants, and
chemotherapeutic drugs.136
Moreover, severe malnutrition and some environmental
pollutants have been implicated as risk factors for IUGR.136
Fetal factors that influence fetal growth include the presence of genetic and structural
anomalies, presence of umbilical cord abnormalities, infection with cytomegalovirus,
rubella, malaria or toxoplasmosis, and multiple gestation.134
With respect to multiple
gestations, overall reduced substrate availability can lead to IUGR in both fetuses, while
unequal proportions of placental mass per fetus, or in extreme cases, occurrence of TTTS
or TRAP may be responsible for the selective growth restriction of one of the twins.10
3.3.2 Perinatal and Long-Term Outcomes Associated with IUGR
Although IUGR may be reflective of upstream factors, regardless of its etiology, it is
associated with a number of perinatal and longer-term adverse outcomes. For instance,
an IUGR fetus is at higher risk for fetal death and neonatal mortality,137
a risk directly
proportional to the severity of IUGR, in both term and preterm fetuses.135
The incidence
of perinatal morbidity is also higher in IUGR fetuses, with respiratory, cardiac,
neurological, gastrointestinal, renal, immune and metabolic consequences.138
Specifically, IUGR infants are at higher risk for RDS, perinatal asphyxia, neonatal
encephalopathy and seizures, NEC, hypothermia, hypoglycaemia, polycythemia, and
culture-proven sepsis.138
Long-term consequences have been reported with regard to growth, academic
achievement, and neurodevelopment although the evidence on this is not definitive.138
17
Moreover, research by Barker and colleagues suggests that IUGR occurring during so
called “critical” periods in fetal growth and development may place adults at later risk for
diseases such as coronary heart disease, high blood pressure, insulin resistance and
diabetes.11
Thus, the assessment of fetal growth and detection of a downward trend in a fetus’
growth trajectory are important in the clinical monitoring and management of
pregnancies.
3.3.3 Cross-sectional and Longitudinal Assessment of Fetal Growth
Historically, birth weight, rather than gestational age, has been used as a proxy for
maturity of the fetus, due to the relative unreliability of the latter.139
A fetus with birth
weight of less than 2500 g is generally considered to be of LBW. While this classification
is associated with a higher risk of perinatal mortality and morbidity, it does not take into
account the gestational age at birth.140
Thus, very early on, there was a shift towards
assessing size given gestational age, with the 10th
percentile of the weight distribution at
each gestational age considered indicative of a fetus being SGA, although other
thresholds have been suggested as well.141
Although this is still arguably the most common method used to detect IUGR, and SGA
is known to be a predictor of adverse perinatal outcome, it is not reflective of longitudinal
growth in individual fetuses. Comparing a particular fetus to weight distributions at a
given gestational age is only a comparison of cross-sectional size, and is thus not an
effective manner to assess growth in a particular fetus.12
Ideally, fetal growth would be
assessed longitudinally, and by distinguishing fetuses that are physiologically small but
growing normally from those that experience pathological IUGR.
However, for the purposes of comparison in research and clinical settings, a number of
birth weight and fetal weight references have been elucidated over the years.

18
3. 4 Birth Weight References
In 1963, one of the first studies on the distribution of birth weights at each gestational age
was published by Lubchenco et al. for 5,635 live-born Caucasian and Hispanic infants.
The authors presented the 10th
, 50th
and 90th
percentiles of birth weight for each week of
gestation.142
Even in this early study, researchers recognised the deviation in fetal growth
of twins relative to singletons by the 35th
week of gestation, with the median weight of
twins matching the 10th
percentile of the singleton weight distribution at this time. While
of considerable value to perinatal literature, the fact that this reference was constructed
from data based on infants born at a higher altitude, which is known to affect infants’
birth weight, means that it may not be applicable to other geographic areas.142
Since then, a considerable number of birth weight references and standards have been
published on singletons. These tend to be population-based,29, 143-146
and have adjusted for
fetal sex,143-150
race,143, 145, 150
parity,143-145
and even maternal age150
and size.143
While there has been less research conducted on twins or higher order multiples, there
has been an increasing recognition for the need for separate references for this group.30
Comparisons of “optimal” birth weights that are associated with the lowest risk of
adverse perinatal outcome, have found that twins fare better at lower birth weights
compared to singletons at the same gestational age.30
3.4.1 Birth Weight References in Twins
In one of the earliest studies conducted on twins, Naeye et al. constructed a birth weight
reference for all twins delivered between 1957 and 1963 in a New York and a Boston
Hospital. Infants with congenital anomalies and those with hemolytic disease of the
newborn were excluded from the study.127
They found a difference between birth weights
of twins and singletons as early as 33 weeks, when they compared their findings with
those of Lubchenco et al.142
19
In 1982, Leroy and colleagues charted the height, weight, cranial circumference and
thoracic circumference of 1,049 twin infants born at gestational ages between 28 and 42
weeks.151
Again, weights of twins were found to be less than singletons as early as week
30 of gestation, with a difference at the 50th
centile of up to 610 g between twins and
singletons at week 40.151
Both research groups found that dichorionic twins were heavier
than monochorionic twins throughout pregnancy.127, 151
Arbuckle and colleagues conducted two studies in Canada examining birth weight
distributions by gestational age in singletons and in twins.149, 152
The first compared the
distributions in 1972 and 1986.152
Overall, the mean birth weight was found to increase
by 5.7% between 1972 and 1986, with 33.8% of babies born preterm in 1972 and 41%
born preterm in 1986. As expected, birth weights at each gestational age were
consistently lower for twins compared to singletons, and lower for females compared to
males.152
In a follow-up study covering the years between 1986 and 1988, the previous
findings were corroborated.149
Moreover, a bimodal peak at 30 weeks and 42 weeks in
birth weight observed in the 1989 study was observed again in the 1993 study. These
peaks were thought to be due to errors in dating of pregnancies by last normal menstrual
period (LNMP).149
Alexander et al. constructed birth weight references for singletons, twins, and triplets
using United States Natality data files for the years between 1991 and 1995.29
In the
463,856 twins included in the study, they found a difference in median birth weights of
300g between twins and singletons by 32 weeks of gestation, a difference that increased
to 500g by term. Moreover, similar to Lubchenco’s findings, by 38 weeks of gestation,
the 50th
percentile of twin birth weights was similar to the 10th
percentile of singleton
birth weights. Both race and fetal sex were found to influence weight at each gestational
age, with African-American mothers delivering lighter babies than Caucasians, and male
infants heavier than female infants at every gestational age.29
In 1998, Ananth et al. constructed birth weight references for live-born twins stratified by
placental chorionicity, a known predictor of birth weight in twin gestations.153
As
20
expected, dichorionic twins were heavier than monochorionic twins between 30 and 40
weeks of gestation with respect to the 10th
, 50th
and 90th
percentiles. Results from this
study agreed well with those of Naeye et al.153
Reflective of the change in practice over
time, and in contrast with previous studies where dating was done by LNMP only,
pregnancies were dated in this study by LNMP and confirmed by ultrasound.153
Unlike
other groups, in this study, Ananth et al. accounted for the correlation between twin
fetuses in each pregnancy.
3.4.2 Limitations of Birth Weight References
The historical use of birth weight as an indicator of adverse outcome included its use as
an implicit indicator of maturity.154
However, the use of birth weight as a marker of
perinatal risk does not consider the contribution of gestational length to fetal
development. This recognition has led to the development of birth weight references
adjusted for gestational age.
While they are the most commonly used references to compare fetal or infant weight,
birth weight references are associated with bias. Hutcheon and Platt illustrated this in a
recent paper by showing that, at lower gestational ages, the 10th
percentile of birth weight
references only captured the smallest 1% of the total population of fetuses in utero.19
Hutcheon and Platt reasoned that, at any given gestational age, all those fetuses that
remain in utero are not considered in the creation of birth weight references.19
At preterm
gestational ages, the percentage of fetuses remaining in utero will be much higher than
those who are born, with birth weight references then based on the weights of a small
(and selected) portion of the original cohort of conceptions, thus creating a situation of
missing data.19
The bias that is created by this depends on the nature of the missing data.
At preterm ages, birth weights of infants are not a random sample of all fetal weights for
the same gestational age.19
In fact, a number of other research groups have also found that, at lower gestational ages,
in utero estimates of fetal weight are higher than birth weights.155-158
Moreover, fetal
growth patterns are different in preterm infants, with IUGR occurring more frequently in
21
preterm infants than in infants born at term.158-161
Among those fetuses that go on to be
born preterm, evidence of IUGR appears as early as week 32.161
This association is
marked in medically induced preterm births with a reported OR of 6.4 (95% CI: 5.53,
7.43),159
which is reasonable given that IUGR is one of the most common indications for
preterm delivery.162
However, even in the case of spontaneous preterm delivery, this
association, although milder (OR 1.61, 95% CI: 1.43,1.82), persists.159
Using birth weight
for gestational age references derived from this population for comparison purposes is
likely to result in an under-estimation of the number of fetuses that are, in fact, SGA.
Within this context, and with a shift towards the routine use of ultrasound in the clinical
management of pregnancies, it is relevant to examine evidence on the use of ultrasound
to monitor fetal growth.
3. 5 Use of ultrasound to monitor fetal growth
Over the years, ultrasound has begun to play an ever-increasing role in the clinical
management of pregnancies, especially in the care of twins and higher-order multiple
pregnancies. Ultrasound is now used in the early detection of twin pregnancies,
congenital abnormalities, assessment of chorionicity, fetal demise, fetal malpresentation,
TTTS, and in guiding more invasive treatments required in the case of complications.163-
164 The monitoring of fetal growth, including assessment of fetal size and estimation of
gestational length, is arguably among the most routine uses of ultrasound.
3.5.1 Estimation of Gestational Age
An important component in the monitoring of fetal growth is the assessment of
gestational age of the fetus or infant. The use of ultrasound in the estimation of
gestational age has gained increasing acceptance over time against the backdrop of errors
associated with the use of LNMP as the means of estimating gestational age.165
Inaccurate recall of the date of LNMP, early bleeding in pregnancy mistaken for
menstrual bleeding, and irregular or delayed menstruation all lead to bias in the
22
estimation of gestational age using LNMP.165-166
The use of LNMP has been found to
over-estimate gestational age (and, hence, under-estimate rates of preterm birth) relative
to ultrasound estimates of gestational age.167
This may be due to the fact that, in general,
ovulation tends to occur later than the traditionally assumed day 14 in a normal menstrual
cycle, more often than it occurs earlier than day 14.167
Much of the evidence shows that ultrasound-based estimation of gestational age is more
accurate than LNMP-based estimates of gestational age in predicting the actual day of
delivery, and when compared in pregnancies conceived by ART where the actual date of
conception is known,168-169
with narrower margins of error.168-169
However, there is
evidence that a majority of LNMP estimates and ultrasounds estimates (~80%) agree
within 10 days of their estimate of gestational age.170
The concern with ultrasound-based estimates relates to the estimation of gestational age
by comparing biometric measurements such as CRL and BPD to published reference
values; errors in dating arise when true early variations in fetal size are interpreted as
differences in gestational age.170
Also, ultrasound-based estimates of gestational age have
been shown to be lower than those of LNMP, and thus to over-estimate the rate of
preterm births.170
3.5.2 Estimation of Fetal Weight
Formulae Used to Estimate Fetal Weight
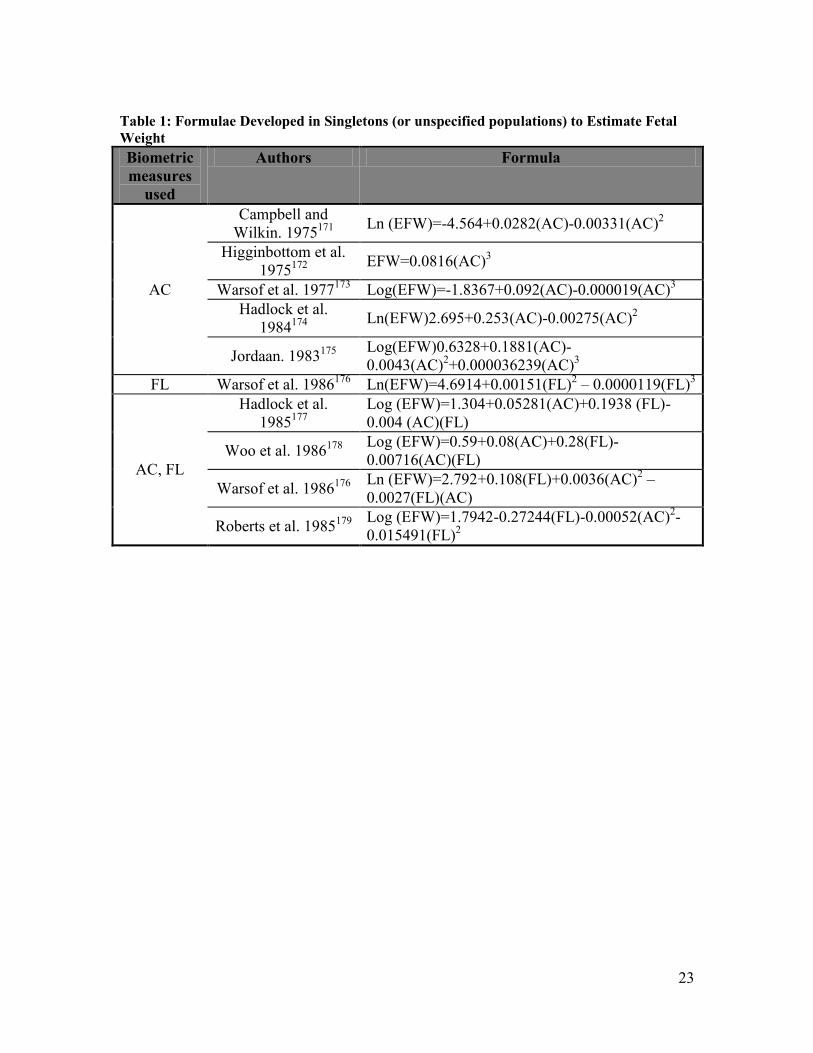
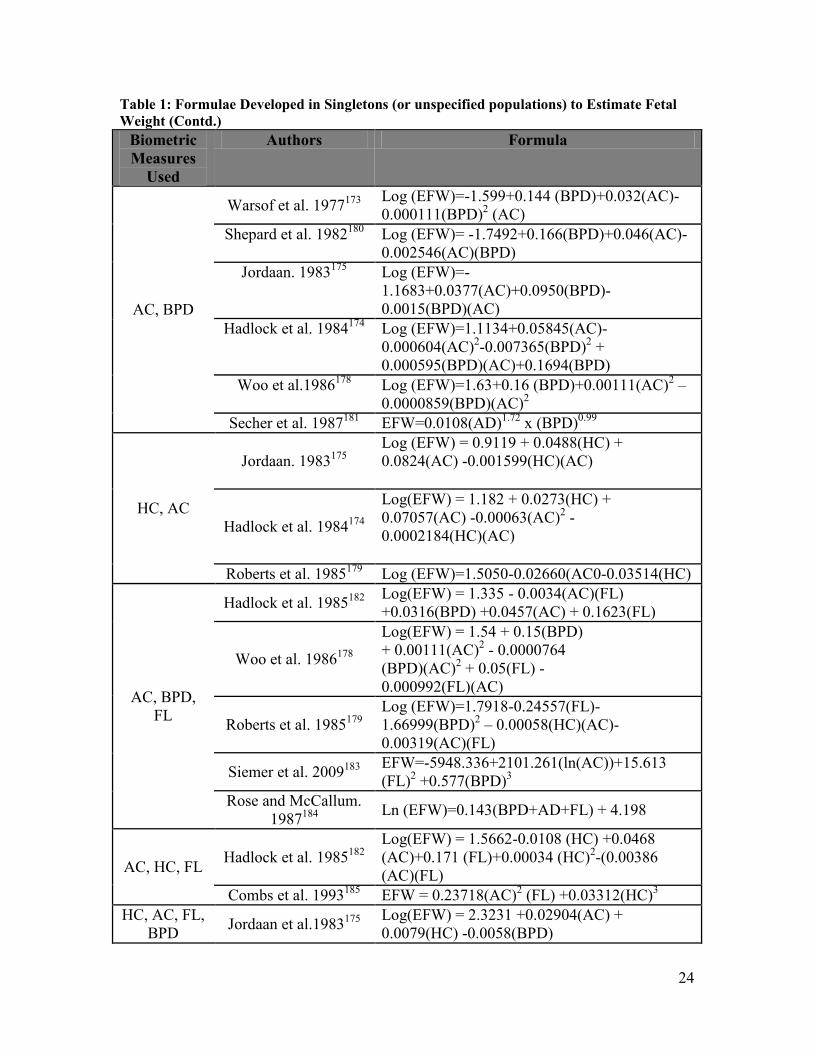
Over the years, a number of research groups have developed methods to estimate fetal
weight using biometric measurements of fetuses obtained by ultrasound. Table 1 lists
some of the formulae that have been developed over the years to estimate fetal weight.
This is not a complete list, but includes the major formulae that have been researched
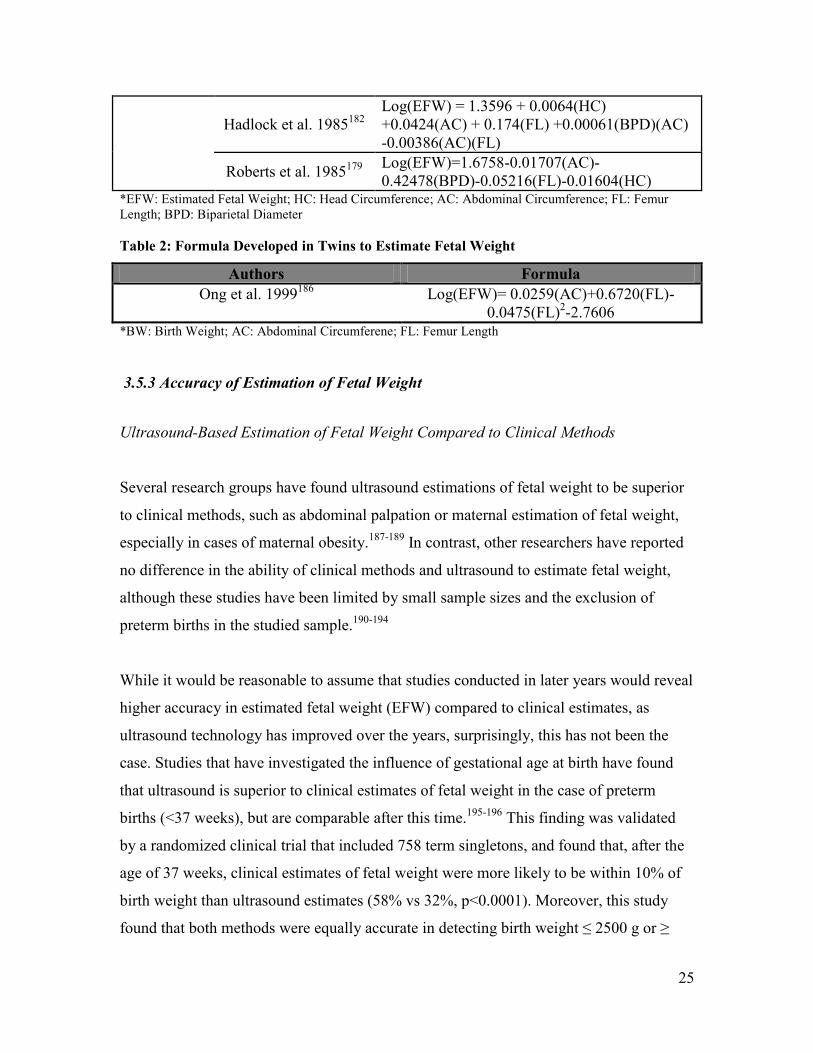
over the years. In contrast, to date, only one research group has developed a formula in a
twin population, which uses AC and FL to estimate fetal weight. This is listed in Table 2.
23
Table 1: Formulae Developed in Singletons (or unspecified populations) to Estimate Fetal
Weight
Biometric
measures
used
Authors Formula
AC
Campbell and
Wilkin. 1975171
Ln (EFW)=-4.564+0.0282(AC)-0.00331(AC)
2
Higginbottom et al.
1975172
EFW=0.0816(AC)
3
Warsof et al. 1977173
Log(EFW)=-1.8367+0.092(AC)-0.000019(AC)3
Hadlock et al.
1984174
Ln(EFW)2.695+0.253(AC)-0.00275(AC)
2
Jordaan. 1983175
Log(EFW)0.6328+0.1881(AC)-
0.0043(AC)2+0.000036239(AC)
3
FL Warsof et al. 1986176
Ln(EFW)=4.6914+0.00151(FL)2 – 0.0000119(FL)
3
AC, FL
Hadlock et al.
1985177
Log (EFW)=1.304+0.05281(AC)+0.1938 (FL)-
0.004 (AC)(FL)
Woo et al. 1986178
Log (EFW)=0.59+0.08(AC)+0.28(FL)-
0.00716(AC)(FL)
Warsof et al. 1986176
Ln (EFW)=2.792+0.108(FL)+0.0036(AC)
2 –
0.0027(FL)(AC)
Roberts et al. 1985179
Log (EFW)=1.7942-0.27244(FL)-0.00052(AC)
2-
0.015491(FL)2
24
Table 1: Formulae Developed in Singletons (or unspecified populations) to Estimate Fetal
Weight (Contd.)
Biometric
Measures
Used
Authors Formula
AC, BPD
Warsof et al. 1977173
Log (EFW)=-1.599+0.144 (BPD)+0.032(AC)-
0.000111(BPD)2 (AC)
Shepard et al. 1982180
Log (EFW)= -1.7492+0.166(BPD)+0.046(AC)-
0.002546(AC)(BPD)
Jordaan. 1983175
Log (EFW)=-
1.1683+0.0377(AC)+0.0950(BPD)-
0.0015(BPD)(AC)
Hadlock et al. 1984174
Log (EFW)=1.1134+0.05845(AC)-
0.000604(AC)2-0.007365(BPD)
2 +
0.000595(BPD)(AC)+0.1694(BPD)
Woo et al.1986178
Log (EFW)=1.63+0.16 (BPD)+0.00111(AC)2 –
0.0000859(BPD)(AC)2
Secher et al. 1987181
EFW=0.0108(AD)1.72
x (BPD)0.99
HC, AC
Jordaan. 1983175
Log (EFW) = 0.9119 + 0.0488(HC) +
0.0824(AC) -0.001599(HC)(AC)
Hadlock et al. 1984174
Log(EFW) = 1.182 + 0.0273(HC) +
0.07057(AC) -0.00063(AC)2 -
0.0002184(HC)(AC)
Roberts et al. 1985179
Log (EFW)=1.5050-0.02660(AC0-0.03514(HC)
AC, BPD,
FL
Hadlock et al. 1985182
Log(EFW) = 1.335 - 0.0034(AC)(FL)
+0.0316(BPD) +0.0457(AC) + 0.1623(FL)
Woo et al. 1986178
Log(EFW) = 1.54 + 0.15(BPD)
+ 0.00111(AC)2 - 0.0000764
(BPD)(AC)2 + 0.05(FL) -
0.000992(FL)(AC)
Roberts et al. 1985179
Log (EFW)=1.7918-0.24557(FL)-
1.66999(BPD)2 – 0.00058(HC)(AC)-
0.00319(AC)(FL)
Siemer et al. 2009183
EFW=-5948.336+2101.261(ln(AC))+15.613
(FL)2 +0.577(BPD)
3
Rose and McCallum.
1987184
Ln (EFW)=0.143(BPD+AD+FL) + 4.198
AC, HC, FL Hadlock et al. 1985
182
Log(EFW) = 1.5662-0.0108 (HC) +0.0468
(AC)+0.171 (FL)+0.00034 (HC)2-(0.00386
(AC)(FL)
Combs et al. 1993185
EFW = 0.23718(AC)2 (FL) +0.03312(HC)
3
HC, AC, FL,
BPD Jordaan et al.1983
175
Log(EFW) = 2.3231 +0.02904(AC) +
0.0079(HC) -0.0058(BPD)
25
Hadlock et al. 1985182
Log(EFW) = 1.3596 + 0.0064(HC)
+0.0424(AC) + 0.174(FL) +0.00061(BPD)(AC)
-0.00386(AC)(FL)
Roberts et al. 1985179
Log(EFW)=1.6758-0.01707(AC)-
0.42478(BPD)-0.05216(FL)-0.01604(HC) *EFW: Estimated Fetal Weight; HC: Head Circumference; AC: Abdominal Circumference; FL: Femur
Length; BPD: Biparietal Diameter
Table 2: Formula Developed in Twins to Estimate Fetal Weight
Authors Formula
Ong et al. 1999186
Log(EFW)= 0.0259(AC)+0.6720(FL)-
0.0475(FL)2-2.7606
*BW: Birth Weight; AC: Abdominal Circumferene; FL: Femur Length
3.5.3 Accuracy of Estimation of Fetal Weight
Ultrasound-Based Estimation of Fetal Weight Compared to Clinical Methods
Several research groups have found ultrasound estimations of fetal weight to be superior
to clinical methods, such as abdominal palpation or maternal estimation of fetal weight,
especially in cases of maternal obesity.187-189
In contrast, other researchers have reported
no difference in the ability of clinical methods and ultrasound to estimate fetal weight,
although these studies have been limited by small sample sizes and the exclusion of
preterm births in the studied sample.190-194
While it would be reasonable to assume that studies conducted in later years would reveal
higher accuracy in estimated fetal weight (EFW) compared to clinical estimates, as
ultrasound technology has improved over the years, surprisingly, this has not been the
case. Studies that have investigated the influence of gestational age at birth have found
that ultrasound is superior to clinical estimates of fetal weight in the case of preterm
births (<37 weeks), but are comparable after this time.195-196
This finding was validated
by a randomized clinical trial that included 758 term singletons, and found that, after the
age of 37 weeks, clinical estimates of fetal weight were more likely to be within 10% of
birth weight than ultrasound estimates (58% vs 32%, p<0.0001). Moreover, this study
found that both methods were equally accurate in detecting birth weight ≤ 2500 g or ≥

26
4000 g,197
in contrast with another study that reported ultrasound estimates to be
significantly more accurate than clinical estimates when birth weight was less than 2500
g.194
Estimation of Fetal Weight in Singletons
In singletons, despite their generally high accuracy in predicting birth weight, there has
been a tendency for most formulae to perform poorly at the extremes of birth weight. For
instance, there have been reports of systematic under-estimation of fetal weight at lower
birth weights, by the Hadlock formulae, the Warsof formulae, the Rose and McCallum
formula, the Woo formula, the Campbell and Wilkin formula, and others.35, 198-200
Among
all the formulae, the Hadlock formulae have been shown to have the smallest systematic
error in singletons weighing <2500g,183, 201
although one study reported the Schild
formula as having 100% sensitivity and 99.4% specificity in detecting singleton infants
that were SGA at birth.202
Overall, there is a general tendency in clinical practice towards
using the Hadlock formulae to estimate fetal weight across ethnicities and birth weight
ranges.200, 203
Estimation of Fetal Weight in Twins
It appears that the only formula developed in a twin population, so far, is the Ong formula
that incorporates AC and FL to estimate fetal weight.186
When compared with the
Hadlock (HC, AC, FL),182
Shepard (AC, BPD)180
and Campbell formulae (AC),171
the
formula developed by Ong et al. performed the best, with 71.4% of EFWs by the Ong
formula within 10% of birth weight, compared to 57.6% of EFWs for the Campbell
formula, 65% of EFWs for the Shepard formula and 65.5% of EFWs for the Hadlock
formula. However, when birth weights were below 2000 g, the Hadlock formula was
found to out-perform the Ong formula.186
Since most of the formulae currently in use have been developed using measurements
from singletons, it is relevant to question their accuracy in twin fetuses. Studies that have

27
compared the accuracy of EFW in twins compared to singletons have found some
differences in the errors associated with estimating fetal weight between the two groups.
Ott and colleagues found that with an interval between ultrasound and delivery of less
than 3 days, the Warsof formula (BPD, AC)173
had an overall mean error of 8.2%, with
66.3% of EFWs falling within 10% of birth weight.204
However, only four sets of twins
were included in the 101 infants studied, and the authors did not differentiate between
accuracy in singletons and twins. Other researchers found that with an interval between
ultrasound and delivery of four days, the Warsof formula173
performed comparably in
twins compared to singletons, with 77.9% of EFWs in twins within 10% of birth weight
compared to 79.3% in singletons.205
The Hadlock formulae (HC, AC, FL; AC, FL)182
and the Shepard formula (BPD, AC)180
have been found to over-estimate fetal weight in twins under 2500 g of birth weight
although, above 2500 g, these formulae performed equally well in twins as in
singletons.206
The Hadlock (AC, FL, BPD)182
formula has also been found to have a
higher mean absolute percentage error in twins (8.9%, 95% CI: 8.2,9.6) than in singletons
(6.8%, 95% CI: 6.4, 7.2), with a lower accuracy in second-born twins compared to first-
born twins.203
In contrast, a number of other studies have found that the Hadlock formulae perform well
in twins. For instance, Edwards et al. found that the formulae by Hadlock (AC, FL, BPD;
HC, AC, FL, BPD),182
Shepard (BPD, AC)180
, and the Combs formula (HC, AC, FL)185
showed similar systematic errors over a study sample of twins and singletons, with no
differences in accuracy observed between the two groups.207
The Combs formula was
found to perform poorly at the extremes of birth weight, over-estimating the weight of
smaller babies and under-estimating the weight of larger babies, a finding in conflict with
Combs et al.’s assessment of their own formula.185
In another study based only on twins that assessed the accuracy of the Hadlock formula
(AC, BPD),174
researchers found that the degree of correlation between EFW and actual
28
birth weight was high, at 0.954, that 41% of the EFWs were within 5% of the actual birth
weight, and that 72% of the EFWs were within 10% of the actual birth weight.208
Authors
found that this formula tended to over-estimate the EFW of smaller fetuses.208
Diaz-Garcia et al. compared the accuracy of two Hadlock formulae (AC, BPD, FL; HC,
AC, BPD, FL),182
the Shepard formula (AC, FL),180
the Ong formula (AC, FL),186
and the
Warsof formula (AC, FL)176
in twins, and found that the Hadlock formula (HC, AC, BPD
and FL)182
had the lowest systematic error and highest precision. A significantly higher
percentage, 62% of the study population, had EFWs within 10% of birth weight when
using this formula compared with 41.9% for Shepard’s formula, 52.5% for Ong’s
formula, and 49.6% for Warsof’s formula.209
In 1989, Secher et al. tested a formula that integrated BPD and abdominal diameter
(AD),181
and had originally been developed in singletons, to estimate fetal weight
specifically in twins.210
When ultrasound-to-delivery intervals were within four days, the
accuracy of this formula in twins was found comparable to what had been reported in the
literature for singletons, with 60% of birth weights within 10% of EFW.210
Ability to Detect SGA and Growth Discordance in Twins
In a study assessing the ability of the Secher formula181
to detect SGA in twins,
Henriksen et al. found that EFW was more predictive of SGA compared with just AD or
BPD alone, with an area under the receiver operating curve (ROC) of 0.85 compared with
0.69 and 0.65 respectively.211
The Hadlock formula (AC, FL, BPD)182
has been found to have a comparable ability to
detect fetal growth restriction in twins as in singletons, with a low overall sensitivity of
48.9% in twins and 47.5% in singletons, but with a higher specificity of 95.7% in twins
and 97.7% in singletons.203
Moreover, when stratifying for chorionicity, the same
Hadlock formula182
had a similar ability to detect SGA in first- and second-born twins of
a dichorionic pair, with sensitivities of 40% and 46% respectively, and specificities of
29
94% and 95% respectively. This was found in monochorionic twins as well, with
sensitivity and specificity of detecting SGA for the first-born twin at 50% and 97%
respectively, and, 67% and 96% respectively for the second-born twin.212
Therefore, birth
order and chorionicity do not appear to influence the ability of the Hadlock formula to
detect fetal growth restriction.
When HC was incorporated in addition to AC, FL and BPD, the Hadlock formula182
had
a higher ability to detect growth discordance between twins of >15%, >20% or 25%,
compared with the Hadlock formula that only used AC, FL and BPD, the Shepard
formula,180
the Ong formula186
or the Warsof formula.176, 209
The ability of the Hadlock formula to detect growth discordance between twins was
found to be lower by other researchers, with a sensitivity of 11.1% to detect >25%
discordance, 16.7% to detect growth discordance >20%, and 17.8% to detect discordance
of >15% between twins, with much higher specificities of 94.9% to detect growth
discordance>25%, 91.5% to detect growth discordance>20% and 94.2% to detect
discordance >15%.213
The levels of discordance tended to be under-estimated by
ultrasound, with authors explaining this as being due to a systematic under-estimation of
the weight of the larger twin. Specifically, this under-estimation was found to occur more
frequently in dichorionic twin pairs compared with monochorionic twins (OR 3.4, 95%
CI: 1.4, 8.4).213
However, the authors of this study did not specify which Hadlock
formula was used.
Factors Affecting the Accuracy of EFW
Difficulty in obtaining biometric measures such as HC and BPD in twins due to uterine
over-crowding, and more variable fetal positions has been suggested by some authors as
influencing the accuracy of EFW in twins.26, 208
Additionally, studies on the growth velocity of singletons have reported approximate
weight gains of 25-28g/day in the late third trimester.15, 35
Although fetal growth in twins
30
is expected to be slower closer to term,29
it is possible that not accounting for this daily
change in weight, especially in studies that use longer intervals-to-delivery, affects the
accuracy of EFW when compared to birth weight.212, 214
However, there is some evidence
that the actual interval between ultrasound and delivery has a minimal influence on the
accuracy of EFW, when the maximum interval between ultrasound and delivery
examined is seven days.215
In a systematic review of the accuracy of different formulae used to estimate fetal weight,
Dudley observed that the magnitude of systematic and random errors of ultrasound EFWs
tended to cluster by study site, and suggested that factors specific to each study, including
ultrasound protocols, study population, and equipment could explain this.214
Other factors that have been suggested to affect the accuracy of EFW are inter- and intra-
observer variability in obtaining measurements,35, 216-217
and operator experience,195
while
there is conflicting evidence on the effect of maternal body mass index (BMI),187, 215
chorionicity,213, 218
and birth order.203, 218
Fetal sex has been suggested to have no or
minimal influence on EFW accuracy.214-215, 218
The presence of IUGR in any one twin
increases the error associated with estimating its fetal weight, as does the presence of
severe growth discordance (≥ 25%) between twins.218
Finally, the accuracy reported when comparing the ability of different formulae to detect
SGA by different research groups may have been influenced by the use of different
growth references to classify infants as SGA at birth. For instance, while Danon et al.
used the Dolzberg curves specific to Israeli populations,203
Chauhan et al. used an
American reference from Ananth et al. that was stratified by chorionicity.212
3.5.4 Ultrasound growth references
Singletons
31
There has been much research investigating antenatal fetal growth using ultrasound
measurements in singletons. Weight at each gestational age has been charted using
individual biometric measurements,15, 21, 219-221
as well as EFW.16, 20-23, 35, 157, 222-223
Consistently, ultrasound-based fetal weight references in singletons have been found to
have higher EFWs than previously published birth weight curves, especially at lower
gestational ages.16, 23, 35, 157, 222
Dating of pregnancies in these studies has been performed
by ultrasound only,15, 35
LNMP only,21, 23, 220-221
or LNMP confirmed by ultrasound
measurements.16, 157, 222
A significant limitation of studies conducted in this field is the
lack of statistical adjustment for the use of serial measurements in the construction of
fetal growth references. Only one group used hierarchical models in their analysis,23
while another calculated fetal growth for each fetus and constructed references for fetal
growth velocity, thus taking into account the correlation between serial measurements.15
None of the other studies considered correlation between serial ultrasound measurements
on the same fetuses.
Twins
As early as 1978, Grennert et al. charted the growth of BPD measurements for 119 pairs
of twins with two ultrasound measurements over the course of pregnancy, and compared
their growth trajectory with that of singletons from the same population.25
Growth in
BPD was found to slow down in twins from around the 32nd
week relative to singletons,
and the variability of mean BPD values was also found to be higher for twins. Moreover,
the authors found that the second-born twin consistently had lower BPD values than the
first-born twin.25
Similarly, in 1979, Leveno and colleagues constructed BPD standards using 123 twin
pregnancies with 340 ultrasound examinations on a sample of uncomplicated pregnancies
with live-born twins and a discordance in BPD of less than 4mm between twins,
comparing these values with those of singletons.26
They found that the BPD of twins
32
were consistently smaller in twins than in singletons, with the difference increasing over
the course of pregnancy.26
In 1980, Crane et al. modeled BPD measurements for eighteen twin pairs between 15 and
40 weeks of gestation, whose mothers had a history of regular menses, no oral
contraceptive use in the three months prior to conception, a high correlation of the
pediatrician’s estimated gestational age at birth with the LNMP estimate, and who were
not growth discordant at birth.224
The pattern of growth for the BPD observed in growth
concordant twins was found to be similar to that observed in appropriate-for-gestational
age (AGA) singletons, with similar mean BPD values and standard deviations throughout
the course of pregnancy. This finding was confirmed at birth by comparing HC
measurements from twins with AGA singletons born at the same institution, and
suggested no slowing of growth in twins, at least with respect to head size.224
Socol et al. investigated growth patterns in BPD and AC in 43 twin pregnancies between
17 and 37 weeks of gestation, with reliable menstrual dates confirmed by neonatal
examination, no obstetric or medical complications, delivered after 34 weeks of gestation,
and with what they deemed to be concordant birth weights (<25% difference in weight).27
They found that the 50th
percentile values of twin BPD fell below previously published
singleton values for the 50th
percentile after 32 weeks, with 50th
percentile AC values for
twins falling below that of singletons after 34 weeks.27
The authors attempted to account
for pregnancy-level clustering of twins by comparing these results with those when an
average of the BPD and AC were taken for each twin pair. However, this may not have
been appropriate, given the high threshold of growth discordance that was accepted as the
inclusion criteria for this study (up to 25%). Additionally, the singleton comparisons used
were from a high-altitude reference, not the ideal comparator for their study population.27
In 1986, Gilstrap et al. charted the growth of twins based on BPD and FL measurements
between 18 and 38 weeks for 120 twins, who had 327 BPD and 107 FL measurements.24
Women were recruited from the military and were included in the study if they had
known normal LNMP history, if their estimated dates of confinement were in
33
concordance with BPD estimates, and if they did not have chronic hypertension, diabetes,
or other metabolic or connective tissue diseases.24
Both BPD and FL had a positive and
strong correlation with gestational age, the correlation of BPD was higher (0.997 vs.
0.97), and, as expected, the rate of growth was slower in twins than that reported for
singletons up to 36 weeks of age.24
These findings were limited by the fact that
researchers averaged measurements taken over each week of gestation.
Taylor et al. calculated growth velocities of fetal abdominal area (FAA) and BPD for 130
twin pairs in Scotland for each week of gestation between 30 and 37 weeks.225
They were
unable to study the period after this due to inadequate sample sizes. They found a lower
velocity of growth in both BPD and FAA between 30 and 37 weeks of gestation. Sex,
chorionicity, and birth order were found to have no influence on growth velocity.225
This
group adjusted for serial measurements by investigating growth for each fetus. Moreover,
since the authors did not model growth velocity using linear regression, accounting for
the correlation between twins was unnecessary. However, the authors did not provide
reference values of weight that might have served as a comparison for assessing weight at
each gestational age.
In 2002, Ong et al. charted standards for AC, BPD and FL for 884 twin pairs between 24
and 39 weeks of gestation after excluding any pregnancies where at least one fetus died
in utero, and cases of suspected IUGR.226
They only used one ultrasound measurement
from each twin in their analysis, and dated pregnancies using the LNMP estimate, unless
it differed from the ultrasound estimate by ten days, in which case the ultrasound estimate
was used. They found that, in twins, growth patterns in AC and BPD were similar to
those previously reported in singletons up to 32 weeks, with BPD in twins even larger
than singletons in early third trimester, after which there was a decline. On the other
hand, FL values remained the same throughout pregnancy for twins and singletons.226
While this study benefited from a large sample size, researchers acknowledged that,
although care was taken during ultrasound to correctly identify each twin,
misclassification of fetuses may have occurred.226
34
In one of the few studies conducted so far on EFW changes in twins over the course of
pregnancy, Yarkoni et al. studied 35 healthy women who had what they termed “normal”
pregnancies and no fetal deaths, and charted both weight at each gestational age and
growth velocity after the 15th
week of pregnancy.227
Changes in AC remained constant
throughout pregnancy, while BPD changes showed a linear increase in the second
trimester, and a flattening in the third trimester. The function of EFW against gestational
age was found to be curvilinear after the 15th
week of pregnancy. The rate of fetal weight
gain increased until 33 weeks of gestation, after which it slowed down. EFW differences
between co-twins were found to increase over the course of pregnancy, although the
difference was not statistically significant.227
In 1998, Min et al. constructed fetal weight references using a sample of 1,831 American
women who gave birth to live-born twins after 28 weeks of gestation, with no major
congenital anomalies.228
They used at least two ultrasound-based EFWs for each fetus, as
well as birth weight as an additional data point, to model weight at two-week gestational
age intervals, stratifying their sample by fetal sex, race, and chorionicity. As expected,
males were heavier than female fetuses, dichorionic twins were heavier (although not
significantly so) than monochorionic twins throughout pregnancy, and black twins were
lighter than Hispanic and non-Hispanic white twins. Twin fetal weights were found to
deviate from singleton fetal weights by 30 weeks, and peak fetal weight gain was found
to be between 34 and 36 weeks in twins, as opposed to between 36 and 38 weeks in
singletons.228
3.5.5 Limitations of Ultrasound-Based References
Ultrasound growth references are limited by the fact that just as birth weight references
exclude in utero measurements, ultrasound-based in utero growth references exclude data
from live born infants, which has the potential to create bias.19
Min et al. circumvented
this somewhat by using birth weight in addition to EFWs to model fetal growth.228
There
have been suggestions to move towards “hybrid” references, which either average birth
weight and fetal weight references,229
or switch from fetal weight to birth weight
35
references after 37 weeks.156
Ideally, growth references would be able to simultaneously
assess weight in live born infants and in utero fetuses, at each gestational age.9
Typical of studies that have created ultrasound-based growth references for twins is their
small sample size, with one study constructing growth references with as small a sample
size as 18 twin pairs.224
This affects the generalizability and standard deviation of the
estimates at each gestational age. Moreover, those studies that have used longitudinal
measures have not accounted for the two levels of clustering inherent in this population,
namely, the correlation between serial measurements on each fetus, and the correlation
between twins born to the same mother.
Despite these limitations, however, the greatest clinical value of ultrasound growth
references and standards lie in their ability to detect deviations from a particular
trajectory of fetal growth, which takes on added relevance in higher-risk pregnancies
such as twin pregnancies. Moreover, as outlined above, ultrasound-based weight
references are able to describe growth at earlier gestational ages more appropriately than
references and standards based on birth weight.
While there has been research investigating the growth patterns of individual ultrasound
biometric measurements, there has not been as much research on changes in EFW in
twins.
36
Chapter 4: Methods
4.1 Study Design and Setting
The present study was a retrospective cohort study. Data for this study were obtained
from the McGill Obstetrical and Neonatal Database (MOND), and the ultrasound records
maintained at the Royal Victoria Hospital (RVH) for the periods between 1996 and 2006.
A detailed description of each database is provided in Section 4.3.
4.2 Population
4.2.1 Inclusion Criteria
Women who gave birth to live twins at the RVH in the period between 1996 and 2006,
with at least one ultrasound conducted during pregnancy at the RVH, and with complete
information on HC, AC, FL and BPD were included. Since many of these measurements,
and fetal covariates such as sex are only available after the second trimester, only
ultrasounds from the second and third trimester were included in this study for
construction of growth references.
4.2.2 Exclusion Criteria
Pregnancies in which either infant had a congenital anomaly were excluded from the
study, as were those with intrauterine fetal demise (either spontaneous or iatrogenic fetal
reduction). Presumably, if performed early enough in pregnancy, iatrogenic fetal
reduction would have no impact on the surviving twin. However, since the gestational
age at the time of reduction was unknown, pregnancies in which iatrogenic fetal
reduction had occurred were excluded.
37
4.3 Data
4.3.1 Databases used in the study
McGill Obstetrical and Neonatal Database (MOND)
The MOND collects routine information on all women who give birth at the RVH, and
their infants. Routine entries are coded by an administrative clerk while a nurse,
obstetrician, and neonatologist are involved with coding items that require professional
judgement.230
Information is collected on both the mother and infant, including prenatal
and postnatal data.
Although data have been collected in this format since 1978, for the purposes of this
study only data collected between 1996 and 2006 were used. Data for the periods
between April 1, 1997 and March 31, 1998, and between April 1, 2000 and March 31,
2001 were missing due to administrative reasons (Ms Danielle Vallerand, personal
communication).
Ultrasound Records
Ultrasound data for this study came from routinely conducted ultrasounds at the RVH for
the study period under consideration.
Six ultrasound machines were used at the RVH during the study period: three Acuson
Sequoias (Siemens Medical Solutions USA, Inc., Malvern, PA, USA), two Toshiba
Aplios (Toshiba America Medical Systems, Inc., Tustin, CA, USA) and one GE Voluson
(GE Healthcare Bio-Sciences AB, Uppsala, Sweden). An Aloka SSD-2000 (Aloka
America, Wallingford, CT, USA) was used in the early study period, with the newer
machines used from 1999.215
Ultrasounds were performed by certified technologists with subspecialty training in
obstetrical ultrasound imaging or maternal-fetal medicine physicians with fellowship
38
training in obstetric ultrasound examination.215
Measurements taken during ultrasound
observations are automatically recorded in a database, along with ultrasound technician
and physician observations.
Merging of the MOND and Ultrasound Records
The MOND and ultrasound records were available separately from the RVH and, were
therefore merged for the purposes of this study. The merging of these databases is
explained in detail in Appendix 1.
Briefly, in the ultrasound records, a letter assignment (“A” or “B”) is made at the earliest
ultrasound to identify each fetus. This letter is then retained by that fetus as an identifier
throughout pregnancy, regardless of movement within the uterus, and is recorded in the
ultrasound records as the only unique identifier of each fetus along with the mother’s
medical record number (MRN).
At the time of birth, a letter is assigned separately in the MOND based on birth order
(first-born: “A”; second-born: “B”). Since these two databases are independent, and the
letter assignment is made early in pregnancy, it was impossible to ascertain whether the
letter assigned in each database did, in fact, correspond with the letter assignment from
the other. Therefore, it was not possible to match the serial ultrasound records for each
fetus with its birth record. However, since analysis for this project only required fetus-
specific variables from each ultrasound, and pregnancy-specific covariates from the birth
records, an exact match between the ultrasound and birth record for each fetus was not
necessary. Instead, the ultrasound and MOND datasets were merged based on the
mother’s MRN.
In a smaller subset of the data where it was possible to match the ultrasound and birth
records of each fetus based on fetal sex (in twin pairs of discordant sex) and another
variable (last EFW recorded by ultrasound), the choice of formula to estimate fetal
weight was validated.
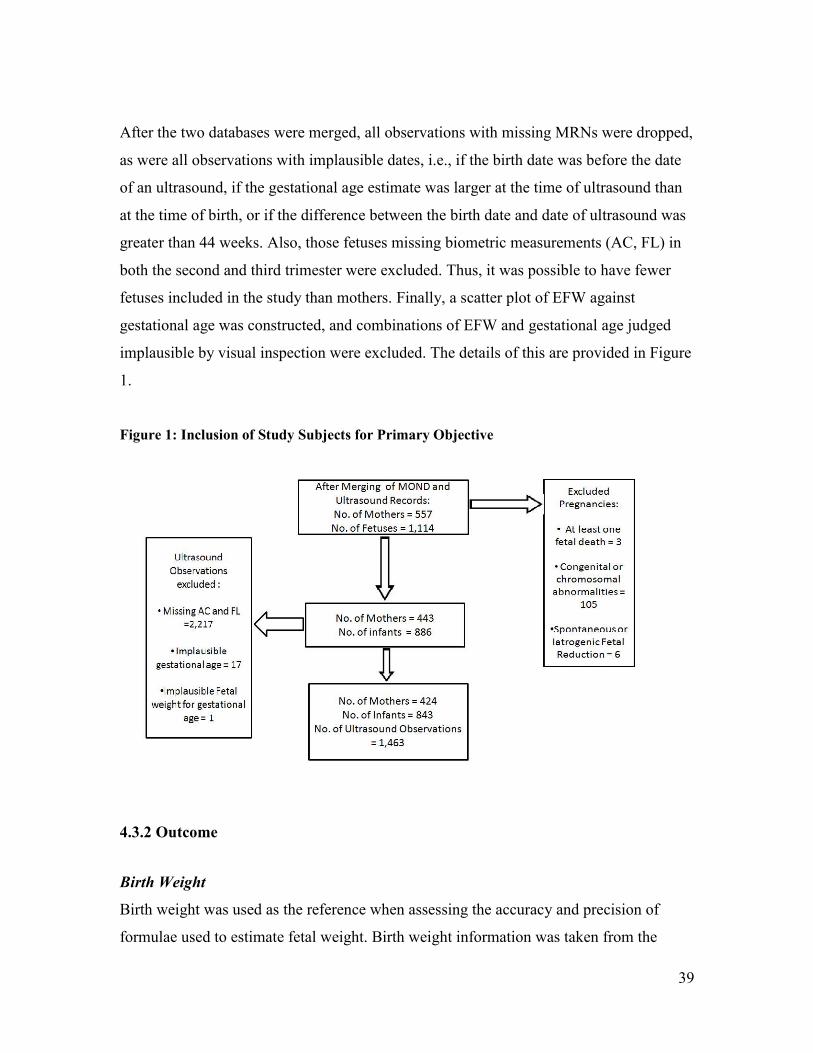
39
After the two databases were merged, all observations with missing MRNs were dropped,
as were all observations with implausible dates, i.e., if the birth date was before the date
of an ultrasound, if the gestational age estimate was larger at the time of ultrasound than
at the time of birth, or if the difference between the birth date and date of ultrasound was
greater than 44 weeks. Also, those fetuses missing biometric measurements (AC, FL) in
both the second and third trimester were excluded. Thus, it was possible to have fewer
fetuses included in the study than mothers. Finally, a scatter plot of EFW against
gestational age was constructed, and combinations of EFW and gestational age judged
implausible by visual inspection were excluded. The details of this are provided in Figure
1.
Figure 1: Inclusion of Study Subjects for Primary Objective
4.3.2 Outcome
Birth Weight
Birth weight was used as the reference when assessing the accuracy and precision of
formulae used to estimate fetal weight. Birth weight information was taken from the
40
MOND. At the RVH, newborn infants are weighed nude on an electronic scale by the
attending physician or resident, and weight is recorded to the nearest gram.
Ultrasound Biometric Measurements and Estimated Fetal Weight
According to internal protocols, at the time of ultrasound, AC is measured at the skin
level from a true transverse view of the fetal abdomen at the level of the junction of the
umbilical vein, portal sinus and fetal stomach (when visible). The outline of the abdomen
should be as circular as possible. The measurement can be taken as either a direct
circumference measurement or interpolated from anteroposterior and transverse diameter
measurements. The FL is measured with the beam of insonation perpendicular to the long
axis of the femoral shaft, excluding the distal femoral epiphysis. The diaphysis is
measured from the greater trochanter above to the lateral condyle below.185
HC and BPD
measurements are taken according to the protocols outlined by Doubilet and Greenes.231
Based on findings from the secondary objective (i.e., the comparison of the five formulae
used to estimate fetal weight), Ong’s formula was used to estimate fetal weight for the
construction of fetal weight references. The Ong formula estimates fetal weight using AC
and FL from the following formula:186
Log (Fetal Weight) = (0.0259 x AC) + (0.6720 X FL) – (0.0475 x FL2) – 2.7606
When constructing the fetal growth reference, fetal weight was modeled as a log-
transformed response variable. This was done to ensure that the assumptions of
homoscedasticity of model residuals and normality of the outcome variable were not
violated.
4.3.3 Assessment of Exposure and Covariates
Estimation of Gestational Age
At the RVH, dating of pregnancies is based on the LNMP as long as there is a difference
of less than ten days between the LNMP and ultrasound estimate. In the case of a
41
discrepancy of greater than ten days, the ultrasound estimate of gestational age is used.
We used the same method to date pregnancies, as it has been validated in the literature.232
In the case of either the LNMP estimate or ultrasound estimate being missing, the other
estimate was used.
At the RVH, until 13 weeks, ultrasound measurements of CRL are used to date the
pregnancy. After the first trimester, however, ultrasound-based BPD measurements are
used.215
At each ultrasound visit, an estimate of gestational age was assigned based on
ultrasound, as well as based on the LNMP estimate. Based on the above-mentioned
algorithm, either estimate of gestational age was used, under the assumption that
ultrasound dating is superior to LNMP estimates of gestational age.
If, at the time of ultrasound, a particular estimate of gestational age (LNMP or
ultrasound) was missing, then the other estimate was used.
Chorionicity
As per the recommendations of the Society of Obstetricians and Gynecologists of
Canada, determination of chorionicity is ideally done by ultrasound between 10-14 weeks
of gestation.233
The presence of a single placental mass in the absence of a lambda sign at
the inter-twin membrane-placental junction as seen on ultrasound is interpreted as
indicative of monochorionicity, while twins are classified as dichorionic if a single
placental mass is viewed on ultrasound, and the lambda sign is also present.234
The
determination of chorionicity was assigned in the database according to these guidelines
during the study period.
Maternal Obesity
Maternal obesity was defined as a pre-pregnancy BMI greater than 30 kg/m2. This was
calculated from maternal self-reported pre-pregnancy weight and height. If either height
42
or pre-pregnancy weight were missing, these observations were excluded from the
analysis for the validation of the formulae used to estimate fetal weight.
Pregnancy-Induced Hypertension
Data on pregnancy-induced hypertension were derived from the MOND, and were
represented as a binary variable. This variable included pregnancy-induced hypertension
ranging in severity from mild pre-eclampsia to HELLP syndrome. Since this was
intended for preliminary assessment of EFW formulae, the wide range of disease severity
was not considered to be an issue.
Gestational Diabetes
Data on gestational diabetes was derived from the MOND, and was represented as a
binary variable, representing a range of severity of disease.
4.4 Statistical Analysis
4.4.1 Primary Objective: Construction of Fetal Weight Reference
Multi-level linear regression was used to model the relationship between EFW and
gestational age. Fetal growth is known to be non-linear over the course of pregnancy, and
has been modeled using higher degree polynomials. Also, fetal growth is not constant
over the course of pregnancy, with periods of accelerated growth in the second trimester,
and slower growth in the third trimester.15
In order to account for this, fetal growth was
modeled using restricted cubic splines, which are described in more detail below.
Restricted Cubic Splines
Splines are piecewise polynomial functions that are specific to a particular interval of the
predictor variable, X, and are connected over each interval of X.235
The simplest form, a
linear spline, is a piecewise linear function that is connected at the knots, which delimit
each interval of X from the other.

43
Since fetal growth over the course of pregnancy does not follow a linear function, a cubic
spline incorporating a piecewise cubic polynomial function is necessary to model fetal
growth.15
Cubic splines are smoothed at each knot by forcing the first and second
derivatives of the function to be the same at the knots.235
Moreover, due to poor behavior
of the cubic spline in the extreme tails (before the first knot and after the last), the
restricted cubic spline function is generally used, which constrains the function to be
linear at the extreme tails.235
Five knots, as per the recommendations of Harrell, were
used in modeling fetal growth.223, 235
Clustering of Data
This dataset was hierarchical in nature and was composed of three levels, namely, each
mother’s pregnancy, twins born to the same mother, and serial measurements of EFW for
each fetus. In the cases whereby a mother had multiple twin pregnancies within the study
period, all her pregnancies were analysed together without accounting for clustering by
mother.
Twins born to the same mother are likely to be more similar than any other randomly
selected twins with respect to variables such as birth weight, resulting in a correlation in
outcomes between twins born to the same mother.236
Failure to account for the correlation
between twins has been shown to affect the precision of effects of both cluster-constant
and cluster-varying covariates.236
Moreover, serial measurements of EFW in the same
fetus also tend to be correlated, and it is thus necessary to take this into account in the
analysis.237
In order to adjust for the twin-level clustering and longitudinal nature of the
data, conditional (subject-specific) models were used in the present analysis.
Conditional Linear Regression

44
Linear mixed models (LMMs) take into account random effects or latent variables, in
addition to fixed effects that are constant across clusters, to model correlation between
observations in a cluster.238
A LMM models continuous mean response variables,
conditional on measured covariates and on unobserved variables.238
Effectively,
regression coefficients are allowed to vary from one individual to another by introducing
random effects that are assumed to follow a probability distribution ~ N(0, σ2) .237
This
has implications for the interpretation of regression coefficients, which can then be
understood as the effect of the covariate on the response variable for an individual with a
particular value of the random effect.237
The linear mixed model in its basic form can be represented as:
Yij =β0 + β1 Xij + ui + εij
where:
Yij : Outcome of the jth individual in the ith cluster
β0: Intercept common to all individuals regardless of cluster
β1 : Effect of X on Y, common to all individuals regardless of cluster
Xij : Value of independent variable for the jth individual in the ith cluster
ui : Random effect specific to the ith cluster
εij: Residual error for jth individual relative to the fitted values for the ith cluster
and:
ui are independent and follow N(0, σ2)
εij are independent and follow N(0, σ2)
ui and εij are independent of each other
In the case of the present study, the above model would be modified by the addition of
individual spline terms and an additional level of clustering k, altering the equation
specified above to the following:

45
Yijk =β0 + β1 (spline term 1)ijk + β2 (spline term 2)ijk + β3 (spline term 3)ijk + β4
(spline term 4)ijk + ui + uk + εijk
where:
Yijk: Log(Fetal Weight) at the jth ultrasound observation of the ith fetus for the kth
mother
β0: Intercept common to all fetuses regardless of cluster
β1, β2 , β3 , β4: Effect of each spline term on Y, common to all fetuses regardless of
cluster
ui: Random effect specific to each fetus
uk: Random effect specific to each mother
εijk: Log (Residual error of the EFW) at the jth ultrasound for the ith fetus born to the kth
mother relative to the EFW predicted by the model for the ith fetus born to the kth
mother.
Covariates Included in Model
As per the review of the literature, fetal sex and chorionicity are known to influence fetal
weight at any given gestational age. Therefore, the influence of sex and chorionicity on
fetal growth were assessed as per the convention in this field.
Selection of best-fit model
Models were fit including random intercepts and random slopes for each mother, and
each fetus respectively, and different combinations of these were explored.
Akaike Information Criterion (AIC) values were compared between each fitted model,
with lower values implying better fit.239
AIC takes into account both the model fit and
parsimony, penalizing models with more parameters. Moreover, residual errors were
compared between models when deciding on the models with best fit, from which to
derive the fetal growth chart. If there was no difference between any two models with
46
respect to the AIC value and the residual error value, the most parsimonious model was
selected.
Prediction of Fetal Weight
The mixed linear regression models, chosen as per the criteria specified in the above step,
were used to predict log median fetal weights for each week of gestational age between
22 and 37 weeks, as well as the 1st, 10th
, 90th
, and 99th
percentiles. Predictions were not
made past 37 weeks due to a lack of sample size.
The predicted values were on the log scale, as fetal weight was log-transformed for the
purposes of modeling fetal growth. Assuming that the predicted log fetal weight was
normally distributed, the mean predicted value of fetal weight from this scale would
equal the median predicted value of fetal weight. Since the median value of a log
transformed variable can be back-transformed to the median value on the original scale
without bias,240
the predicted median fetal weight value for each gestational age was
calculated instead of the mean on the original scale in grams. Similarly, 1st, 10
th, 90
th and
99th
percentile values were calculated on the log scale and then back-transformed to the
original scale in grams. This was done for each completed week of gestation between
weeks 22 and 37.
Sensitivity Analysis
In order to verify the results from this study, given the method used to date pregnancies,
sensitivity analysis was performed, estimating gestational age either by LNMP only, or
by ultrasound only. Predicted median fetal weights at each gestational age for the overall
study sample dated by the algorithm used at the RVH were compared with predicted
median fetal weights when dating was done by LNMP only, or by ultrasound only.
Results from this analysis are provided in Appendix 2.
4.4.2 Secondary Objective: Assessment of Estimated Fetal Weight Formulae
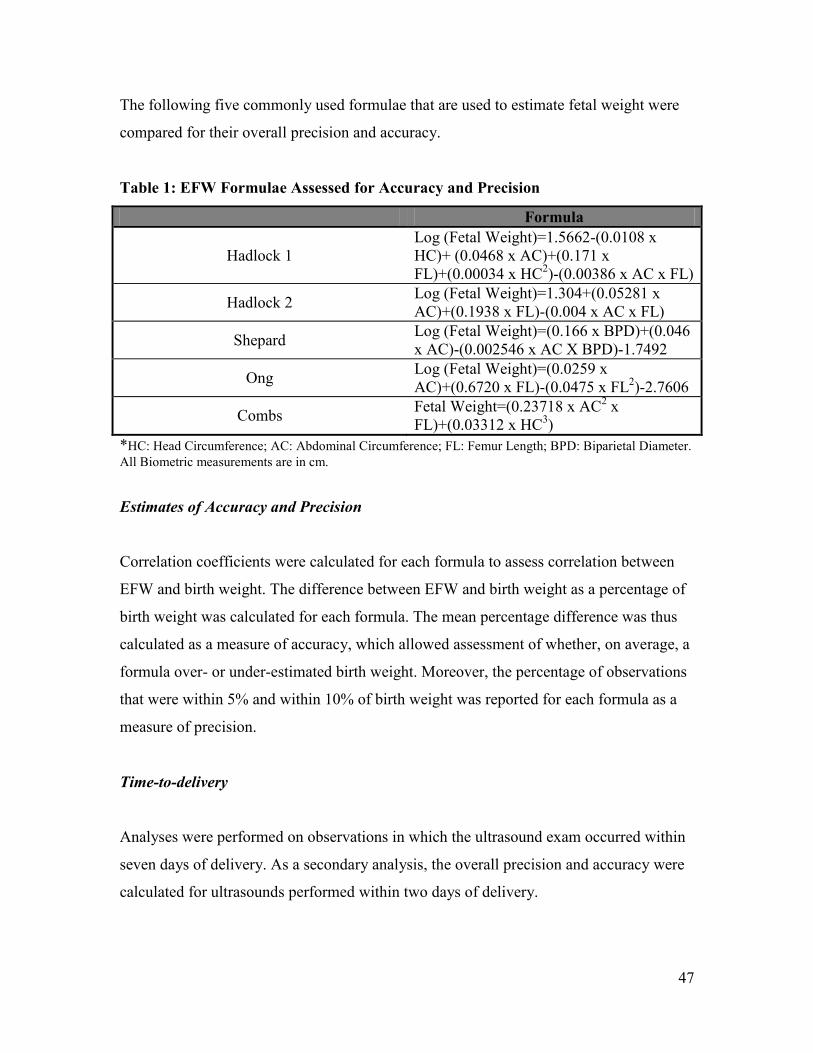
47
The following five commonly used formulae that are used to estimate fetal weight were
compared for their overall precision and accuracy.
Table 1: EFW Formulae Assessed for Accuracy and Precision
Formula
Hadlock 1
Log (Fetal Weight)=1.5662-(0.0108 x
HC)+ (0.0468 x AC)+(0.171 x
FL)+(0.00034 x HC2)-(0.00386 x AC x FL)
Hadlock 2 Log (Fetal Weight)=1.304+(0.05281 x
AC)+(0.1938 x FL)-(0.004 x AC x FL)
Shepard Log (Fetal Weight)=(0.166 x BPD)+(0.046
x AC)-(0.002546 x AC X BPD)-1.7492
Ong Log (Fetal Weight)=(0.0259 x
AC)+(0.6720 x FL)-(0.0475 x FL2)-2.7606
Combs Fetal Weight=(0.23718 x AC
2 x
FL)+(0.03312 x HC3)
*HC: Head Circumference; AC: Abdominal Circumference; FL: Femur Length; BPD: Biparietal Diameter.
All Biometric measurements are in cm.
Estimates of Accuracy and Precision
Correlation coefficients were calculated for each formula to assess correlation between
EFW and birth weight. The difference between EFW and birth weight as a percentage of
birth weight was calculated for each formula. The mean percentage difference was thus
calculated as a measure of accuracy, which allowed assessment of whether, on average, a
formula over- or under-estimated birth weight. Moreover, the percentage of observations
that were within 5% and within 10% of birth weight was reported for each formula as a
measure of precision.
Time-to-delivery
Analyses were performed on observations in which the ultrasound exam occurred within
seven days of delivery. As a secondary analysis, the overall precision and accuracy were
calculated for ultrasounds performed within two days of delivery.

48
Covariates
Stratified analyses were conducted to assess the accuracy and precision of the formulae
within strata of the following covariates: fetal sex, chorionicity, birth order, each 500g
birth weight category (<2500g, 2500-2999g, 3000-3499g,3500-3999g), two-week strata
of gestational age (<30 weeks, 30-31 weeks, 32-33 weeks, 34-35 weeks, 36-37 weeks, ≥
38 weeks), and in the case of maternal obesity, hypertension and diabetes.
The Student’s t-test was used to assess whether the mean percentage difference was
significantly different for each formula depending on the group being considered (eg.,
male vs. female; monochorionic twins vs. dichorionic twins, etc)

49
Chapter 5: Results
5.1 Preface to Manuscript 1
The results from this study are presented in the form of two manuscripts. The first
manuscript addresses the primary objective of this thesis, the construction of an
ultrasound-based fetal weight reference for twin fetuses. This includes the modeling of
fetal growth, and the subsequent prediction of the 1st, 10
th, 50
th, 90
th, and 99
th percentile
fetal weight values for each gestational week. Fetal growth was modeled using multi-
level models adjusting for clustering between fetuses, and longitudinal measurements on
each fetus, and restricted cubic splines, which accounted for non-linear growth over the
course of pregnancy. Findings from the secondary objective of this study were used to
inform the methods used to study the primary objective. Fetal growth in twins was found
to be S-shaped as expected, and growth references for each week of gestation between
weeks 22 and 37 were predicted from the model.

50
5.2 Manuscript 1: An Ultrasound-Based Fetal Weight Reference for Twins
Sushmita Shivkumar, BA. BSc.1, Robert W. Platt, PhD.
1
1 Department of Epidemiology, Biostatistics, and Occupational Health, McGill
University, 1020 Pine Avenue West, Montreal, QC, Canada H3A 1A2
Correspondence:
Dr. Robert Platt
Montreal Children’s Hospital Research Institute
2300 Tupper St.
Montreal, QC, Canada
H3H 1P3
Email: [email protected]
51
ABSTRACT
Background: Fetal weight, and growth over the course of pregnancy are known
predictors of perinatal health. Therefore, the monitoring of fetal weight, and its
comparison with weight distributions for each gestational age are important aspects of the
clinical management of pregnancies. Fetal growth trajectories of twin fetuses are known
to differ from singletons, with marked differences appearing in the early third trimester of
pregnancy. Therefore, it is necessary to compare the fetal weight of twins with a
distribution that is derived from a twin population rather than singletons.
Objective: To construct an ultrasound-based fetal weight reference for twins between the
gestational ages of weeks 22 and 37, stratified by fetal sex and chorionicity.
Methods: Live-born non-anomalous twins were included in this retrospective cohort
study. Twin pregnancies resulting from the reduction of higher-order pregnancies were
excluded. Multi-level linear regression models were used to adjust for clustering by each
twin pregnancy, and to account for serial measurements taken on each fetus. Moreover,
since fetal growth over the course of pregnancy is not linear, restricted cubic splines were
used to model fetal growth. Based on this model, predictions of fetal weight were made
for the 1st, 10
th, 50
th, 90
th, and 99
th percentiles of the fetal weight distribution. Fetal
weight references were stratified by fetal sex and chorionicity.
Results: Fetal growth was found to follow an S-shaped pattern over the course of
pregnancy, with accelerated growth in the second trimester, and a slowing of growth in
the third trimester. Female fetuses were lighter than male fetuses over the course of
pregnancy, as expected, although females showed catch-up growth closer to term.
Monochorionic twins remained lighter than dichorionic twins throughout pregnancy.
Conclusion: Fetal weights predicted for each week of gestational age from our study
agreed well with those from other studies conducted in twins. Also, as expected, fetal
weights in this population were consistently lower than those published for singletons.
52
Introduction
Since the 1980s, the rate of multiple pregnancies has been rising, specifically in Western
Europe and North America.1 For instance, in England and Wales, France, and the United
States, the rate of twin pregnancies has risen by 50-60%.1 Factors such as delayed
childbearing, increased use of ovulation induction, artificial reproductive technologies
and, more recently, increased folic acid and use of multivitamins have all been suggested
as contributing to the observed increase in the incidence of twinning and multiple
pregnancies, in general.1 Twin pregnancies are at higher risk of adverse perinatal
outcome than singleton pregnancies. For instance, twins are generally born at lower
gestational ages and have significantly higher rates of perinatal mortality and morbidity
when compared to singletons.2-9
Moreover, in twins, as in singletons, in utero growth restriction (IUGR) is associated with
increased perinatal mortality and morbidity, 10-12
although the association is likely not
causal. 13-14
Thus, the assessment of fetal growth over the course of pregnancy, and any
deviations from an “optimal” growth trajectory that is associated with the lowest risk of
adverse perinatal outcomes, are especially important in higher-risk pregnancies such as
those of twins.
Additionally, twins are known to experience different fetal growth trajectories than
singletons, as both uterine capacity and uteroplacental insufficiency influence their
growth.15-16
The median fetal weight of twins has been found to be markedly lower than
singletons beginning around week 30.2 Moreover, there is evidence that “optimal” birth
weights are lower for twins than for singletons.17
Over the years, a number of approaches and definitions have been considered to
appropriately detect when a fetus experiences IUGR. While longitudinal approaches,
which assess each fetus’ own growth trajectory, are theoretically ideal to assess fetal
growth, there is some evidence that they may not be of increased clinical value than
cross-sectional references.18
Moreover, cross-sectional fetal weight references are more
53
practical and easy-to-use in the context of general clinical care and assessment. A number
of population-based birth weight references have been generated for twins that chart birth
weight for each completed week of gestation.2, 19-22
However, there is considerable bias associated with these references, especially at lower
gestational ages. Specifically, infants born at lower gestational ages are smaller, and
presumably less healthy, than their counterparts that remain in utero.23
These factors
point to the utility of ultrasound-based fetal weight references, which chart fetal weight
distributions for each completed week of gestation. Since the routine use of ultrasound in
the clinical management of pregnancies began, a number of research groups have
integrated biometric measurements, such as head circumference (HC), abdominal
circumference (AC), biparietal diameter (BPD) and femur length (FL), in different
combinations to calculate estimated fetal weight (EFW) in utero, with varying accuracy
and precision.24-27
One group, in particular, has developed a formula specifically in a twin
population.28
Finally, although there have been a number of ultrasound-based fetal weight references
constructed for singletons, there are very few studies conducted charting fetal weight
distributions in twins.29-30
The study by Yarkoni et al. was limited by a small sample size
of only 35 healthy pregnancies,29
while the study by Min et al. only provided reference
for two-week intervals, which may not adequately characterize fetal growth, especially in
the second trimester.30
Within this context, our objective was to construct ultrasound-based fetal weight
references for twins from a tertiary care centre in Montreal, at each completed week of
gestation, stratified by sex and chorionicity, between weeks 22 and 37 of pregnancy.
Methods
This was a retrospective cohort study based on data from a tertiary-care hospital in
Montreal, Canada. The McGill Obstetrical and Neonatal Database (MOND) records
prenatal and postnatal clinical information on women delivering at the Royal Victoria
54
Hospital (RVH) and their infants. Independent of this database, ultrasound information is
recorded on all women who receive ultrasound scans at the same hospital.
Population
We included women delivering live-born twins at the RVH between 1996 and 2006, and
who had ultrasounds conducted at the RVH. Data for the periods between April 1, 1997
and March 31, 1998, and between April 1, 2000 and March 31, 2001 were missing due to
administrative reasons (Ms Danielle Vallerand, personal communication).
Pregnancies in which at least one fetus had a congenital anomaly or died, underwent
spontaneous or iatrogenic fetal reduction, or had missing information on AC or FL at
ultrasounds in both the second and third trimester were excluded from further analysis. In
cases of congenital anomaly or in utero death of at least one fetus, the entire pregnancy
had to be excluded due to the nature of the merging of the databases in which an exact
match of the MOND and ultrasound record was not possible for each fetus. This is
explained in more detail in the section “Merging of Databases”. Prematurely born infants
and those who were sick or died after birth were included in analysis as this growth
reference was meant to be of a general population, and not a growth standard of only
healthy pregnancies and infants.
For each included fetus, we selected data from the first ultrasound scan performed in the
second and third trimesters, as long as they had at least one ultrasound performed in each
trimester, and it did not have missing or implausible values.
Merging of databases
We merged the MOND and ultrasound records based on the mother`s medical record
number as a unique identifier of pregnancies. However, the identity of each twin at the
time of ultrasound could not be matched to their identity at the time of birth. Twin fetuses
are labelled as “A” or “B” at the first ultrasound, but while this identifier follows them

55
throughout pregnancy regardless of their movement within the uterus, an independent
“A” or “B’ label is assigned at the time of birth, depending on their order at birth. Thus,
while we were able to match the ultrasound and birth record for each pregnancy, we were
unable to ascertain whether there was an exact match for each fetus’ record. However,
since we only included pregnancy-specific covariates, such as chorionicity (from the
MOND) and fetus-specific covariates, such as fetal sex and EFW from the ultrasound
records, this did not affect our analysis.
Biometric Measurements
According to internal protocols, AC is measured at the skin level from a true transverse
view of the fetal abdomen at the level of the junction of the umbilical vein, portal sinus
and fetal stomach (when visible). The outline of the abdomen should be as circular as
possible. The measurement can be taken as either a direct circumference measurement or
interpolated from anteroposterior and transverse diameter measurements. The FL is
measured with the beam of insonation perpendicular to the long axis of the femoral shaft,
excluding the distal femoral epiphysis. The diaphysis is measured from the greater
trochanter above to the lateral condyle below.31
Estimated Fetal Weight
Based on a validation study of five EFW formulae in a subset of this population (results
published elsewhere), we selected the Ong formula to estimate fetal weight at each
ultrasound visit. This formula was specifically developed in a population of twins and
uses AC and FL to estimate fetal weight.28
Log (EFW) = (0.0259 x AC) + (0.6720 X FL) – (0.0475 x FL2) – 2.7606
Gestational Age
Gestational age at the time of ultrasound was calculated using the algorithm that is
routinely used at the RVH. The last normal menstrual period (LNMP) estimate is used as
56
long as it is in agreement within ten days of the ultrasound estimate of gestational age. At
the RVH, ultrasound measurements of crown-rump length are used to date the pregnancy
until 13 weeks. After the first trimester, however, BPD measurements are used. If either
the LNMP or ultrasound estimate of gestational age was missing at the time of
ultrasound, then the available estimate was used. In order to further validate this
algorithm, we conducted sensitivity analyses using only the LNMP estimate or only the
ultrasound estimate of gestational age.
Although results are provided by completed weeks of gestation, gestational age was
included in the model in days. This takes into account changes in fetal weight for each
day, instead of averaging them over the week.
Chorionicity
As per the recommendations of the Society of Obstetricians and Gynecologists of
Canada, determination of chorionicity is ideally done by ultrasound between 10-14 weeks
of gestation.32
The presence of a single placental mass in the absence of a lambda sign at
the inter-twin membrane-placental junction as seen on ultrasound is interpreted as
indicative of monochorionicity, while twins are classified as dichorionic if a single
placental mass is viewed on ultrasound, and the lambda sign is also present.33
The
determination of chorionicity was conducted according to these guidelines during the
study period.
Statistical Analysis
Our dataset was hierarchical in nature and was composed of three levels, namely, each
mother’s pregnancy, twins born to the same mother, and serial measurements of EFW for
each fetus. In the four cases where a mother gave birth to two sets of twins during the
study period, both pregnancies were analysed together, and we did not account for
clustering by each pregnancy for the same mother.
57
Twins born to the same mother are likely to be more similar than any other randomly
selected twins with respect to covariates such as birth weight, thus resulting in correlated
outcomes between twins born to the same mother.34
Failure to account for the correlation
between twins has been shown to affect the precision (variance) of effects of cluster-
constant and cluster-varying covariates.34
Moreover, serial measurements of EFW in the
same fetus tend to be correlated, and it is thus necessary to take this into account at the
analysis stage.35
Therefore, we used linear mixed models to model the relationship
between gestational age and EFW. Prior to this, we examined the intraclass correlation
coefficient to assess correlation due to clustering.
Fetal growth is known to be non-linear over the course of pregnancy, and has been
modeled using higher degree polynomials.36
Furthermore, fetal growth is not constant
over the course of pregnancy, with periods of accelerated growth in the second trimester
and slower growth in the third trimesters.37
Restricted cubic splines are piecewise
segments of cubic polynomial functions, which provide a flexible tool to model smooth
curves.38
To account for the above issues, we used restricted cubic splines with five
knots, as recommended by Harrell, to model fetal growth.38
The fetal weight variable was log-transformed to ensure that the assumptions of
homoscedasticity of residual errors, and normality of distribution of response variable
were not violated.39
The model to be used for prediction was chosen based on the Akaike
Information Criteria (AIC) value, and the residual standard errors, with lower values for
each implying better fit. The predictions of the 1st, 10th
, 50th
(median), 90th
and 99th
percentile fetal weight values were made on the log scale, and then back-transformed to
the original fetal weight scale in grams. This was done under the assumption that the
distribution of log fetal weight values were normal at each gestational age.39
We were able to predict fetal weight values only for the gestational period between 22
and 37 weeks due to a lack of sample size at gestational ages after week 37. All statistical
analyses were conducted in Stata Version 10.
58
Results
The merged databases included 557 mothers and 1,114 infants. We excluded pregnancies
in those instances where at least one infant had congenital or chromosomal abnormalities
(N=105), at least one fetus died (N=3), and where spontaneous or iatrogenic reduction of
pregnancy had occurred (N=6). Overall, 2,217 ultrasound observations were missing
information on AC or FL, primarily from ultrasounds conducted in the first trimester.
These were excluded from further analysis, and resulted in the exclusion of some
pregnancies or individual fetuses from the sample. The first ultrasound conducted for
each fetus from the second and third trimester was selected to retain for further analysis
as long as it had complete information. From this sub-sample, we used a preliminary
scatter plot of fetal weight against gestational age and excluded one observation that was
deemed implausible by visual inspection. This was for an infant who had a birth weight
of 2925g and was born at 37.28 weeks but who had been recorded as having a fetal
weight of 177.39g at 35.14 weeks. Furthermore, 17 observations were dropped because
the gestational age estimate at the time of ultrasound was higher than the gestational age
estimate at the time of birth.
The final sample size for analysis contained 424 mothers and 843 fetuses, with a total of
1,463 ultrasound observations. The imbalance in number of mothers and fetuses resulted
due to the exclusion of fetuses missing AC or FL measurements from both the second
and third trimester ultrasounds. Of these, 666 observations were from an ultrasound
conducted in the second trimester, while 797 were from a scan conducted in the third
trimester. The LNMP estimate of gestational age at the time of ultrasound was missing in
496 observations. In these cases, the ultrasound estimate was used. The ultrasound
estimate was missing for 2 observations; in these cases, the LNMP estimate was used.
Maternal and fetal characteristics are displayed in Table 1. The mean maternal age of
mothers included in our sample was 32 years, and 52.3% of the mothers were
primiparous. A total of 33.16% of the mother conceived using some form of artificial
59
reproductive technology. The median baseline body mass index of mothers in our sample
fell in the normal range at 23.09 kg/m2, while approximately 14% of the mothers
experienced diabetes of any severity during pregnancy, and 10% experienced pregnancy-
induced hypertension. Only about 4% of women included reported any smoking during
pregnancy, and about 4% reported consuming alcohol occasionally during pregnancy.
The mean birth weight of the twin infants included in our analysis was 2535g. The
median gestational age at birth was 37 weeks.
Modeling Fetal Growth
Regardless of whether we included random intercepts and slopes for pregnancy-level
clustering or for the correlation of serial measurements on each fetus, the AIC values and
residual standard errors remained the same across models. This was true also when we
stratified by sex and chorionicity. Therefore, we selected the most parsimonious model,
only allowing the intercepts to vary for each pregnancy and fetus. The predicted values
from those models for the overall sample, and by sex and chorionicity, are shown in
tables 2, 3a, 3b, 4a and 4b. As expected, the change in fetal weight was rapid over the
second trimester and early third trimester, with a slowing observed closer to term. Males
were heavier than female fetuses at each week of completed gestation, until week 34,
when females caught up with males. Monochorionic twins were consistently smaller than
dichorionic twins after week 22 of gestation until about 37 weeks.
Sensitivity analyses showed no difference in these estimates, regardless of whether dating
of pregnancies was done by LNMP only or by ultrasound only.
Overall, the standard error for each of the models run was rather low, with small
differences between the 1st percentile, 10
th percentile, 50
th percentile, 90
th percentile and
99th
percentile fetal weight values. This was observed regardless of stratification by sex
or chorionicity. However, the distance between the percentiles increased with increasing
gestational age.
60
Discussion
We constructed a reference for fetal size at each gestational age for twins. We used
ultrasound measurements to calculate EFW of fetuses using the published Ong formula.28
We additionally stratified our sample by sex and chorionicity and generated reference
values for males, females, monochorionic twins, and dichorionic twins.
The trajectory of fetal growth was found to follow an S-shape over the course of
pregnancy, with a period of rapid change in median fetal weight observed in the second
trimester and early third trimester, and a reduction in the change of median fetal weight
observed from week 31 and onward.
As expected, male fetuses were heavier than females until around week 34. However,
after this time, the predicted values from our model were similar for males and females.
This is surprising, especially as birth weight of males was significantly higher than
females in our sample. In fact, the median predicted fetal weight at week 37 was higher
than the median birth weight for both males and females, implying an upward skew in
estimated fetal weight close to term. The catch-up observed in EFW of females relative to
males may then be explained if the positive bias in EFW close to term is greater in female
fetuses than males.
Similarly, the predicted median fetal weight at week 37 in monochorionic and
dichorionic twins was higher than their respective median birth weights, with the
difference larger in monochorionic twins. Again, this implies that there is a positive bias
in EFW close to term, and that the magnitude of this bias is greater in monochorionic
twins than in dichorionic twins. This would explain the similarity in predicted fetal
weights at week 37 between monochorionic and dichorionic twins. Prior to week 37,
however, monochorionic twins were consistently lighter than dichorionic twins over the
course of pregnancy, with a marked difference observed between weeks 29 and 36. This
could be explained by the rising demands placed on the mother with increasing
gestational age. In monochorionic twins that share a placenta, this increased demand may

61
not be met as efficiently as in dichorionic twins, resulting in the weight difference
between the two groups.
Comparison with Other Studies in Twin Populations
The median fetal weight values predicted by our model compared well with those
predicted by Min et al.,30
and by Yarkoni et al.29
The predicted fetal weights from our
model were lower than those reported by Min et al. up to around week 27 and, after this
time, they were higher than Min et al.’s estimates until term. The predicted fetal weights
from this study were lower than those predicted by Yarkoni et al. up to week 30, after
which they were higher than Yarkoni et al.’s estimates. Overall, however, the predicted
fetal weights from our model were very close to those from the model by Yarkoni et al.
Comparison with Studies in Singletons
We compared the results from our study with those from Gallivan et al.,40
who also
constructed a fetal weight reference for singletons based on ultrasound measurements.
While the median fetal weights from our study were consistently lower than those from
the study by Gallivan et al., a more pronounced deviation was observed by week 32, with
weight differences further increasing until term. Specifically, the difference was 85 g at
week 32 and 422 g by week 37. These differences were slightly lower than those reported
from the study by Min et al.30
After comparing their weight reference against a number of
singleton birth weight references, these authors reported a 347g difference by week 34
and a 450 g difference by week 36. The discordance in these results may arise from the
fact that they compared a twin in utero weight reference to a number of singleton birth
weight references, while we compared a twin in utero reference with a singleton in utero
reference. Birth weight closer to term is thought to be higher than ultrasound estimates,41
which may account for the discrepancy between the two studies.
Strengths and Limitations
62
This is one of few studies to construct fetal weight references in a twin population. To the
best of our knowledge, it is the only one that has accounted for clustering by pregnancy
and for the correlation between serial ultrasound measurements on the same fetus. While,
theoretically, this is the most appropriate way to model fetal growth in twins with serial
ultrasound measurements, in reality, it may not have affected our results much. In fact,
when examining the intraclass correlation coefficient (=0), clustering did not explain the
variability in fetal weight, indicating that the twin clusters could be ignored. Moreover,
when examining the AIC values, a model that adjusted for the two levels of clustering
performed as well as one that did not adjust for any clustering, and treated twins, and
serial measurements on each fetus as independent. The use of restricted cubic splines to
model fetal growth, however, markedly improved the fit of the models.
Our sample size was substantial, as we had access to data from a tertiary-care hospital
over a 10-year period and since we included more than one ultrasound measurement per
fetus. While the fact that our sample is drawn from a tertiary care center may limit the
generalizability of our results, we do not consider this to be very likely, given that twin
pregnancies are considered high-risk, and often referred to tertiary-care centers.
Our inability to match the birth record and ultrasound record of each fetus hindered our
analysis to some degree by forcing us to exclude birth weight as another potential data
point for modeling. Including birth weight as a third data point for each fetus may have
improved the fit of the model.
A potential consequence of using multiple ultrasounds per fetus is that we may have
included ultrasounds that were not routine. This is generally a limitation of studies that
are retrospective in nature, as it is not possible to differentiate if a fetus had multiple
ultrasounds due to fetal distress, abnormal growth, or was simply highly monitored. This
may not be a major issue in a twin population, which is, in general, closely monitored.
However, it does limit our ability to differentiate between routine and indicated
ultrasounds. In order to alleviate this somewhat, we only included the first ultrasound
conducted in each trimester, as this had the highest probability of being routine. Although
63
this does not rule out the possibility of an ultrasound being conducted for medical
indication, it somewhat goes towards ensuring that only routine ultrasounds were
included in analysis.
Finally, a general concern with ultrasound is the error associated with the estimation of
fetal weight using biometric measurements. However, we had validated the Ong formula
within a subset of this same population prior to this study, and we thus have a high degree
of confidence in our estimates.
In general, the difference between the 1st, 10
th, 50
th, 90
th and 99th percentiles was quite
low at each gestational age, although there was an increase in the distance between them
observed with increasing gestational age. This may be explained by the tendency for fetal
weight values predicted by a regression model to be more closely distributed than the
original distribution. Moreover, adjusting for clustering may have accounted for much of
the variance, contributing to the narrow distribution of predicted fetal weights at each
gestational age. However, this limits the clinical applicability of this reference due to the
error inherent in ultrasound-based EFWs in general. If the difference between the 1st,
10th
, 50th
, 90th
, and 99th
percentiles is low, the use of the references in predicting
clinically relevant SGA becomes limited. Moreover, if the 1st, or 10
th percentiles are
artificially inflated due to the narrow distribution of predicted fetal weights, there may be
over-estimation of the prevalence of SGA when using this ultrasound-based fetal weight
reference for the purposes of comparison.
Conclusion
This fetal weight reference adds to literature in the field of fetal growth monitoring in
twins. This could prove to be a useful tool for monitoring of both cross-sectional EFW
and longitudinal growth, when serial ultrasounds are performed. In a high-risk population
such as twins, this could provide clinically important information on fetal growth.
However, it is necessary to assess the ability of these fetal weight references to identify
an SGA fetus, and associated clinically relevant outcomes accurately before

64
recommending the widespread use of this standard. In this regard, the small differences
between the 1st, 10
th, 50
th, 90
th, and 99
th fetal weight percentile values may be a
significant limitation.
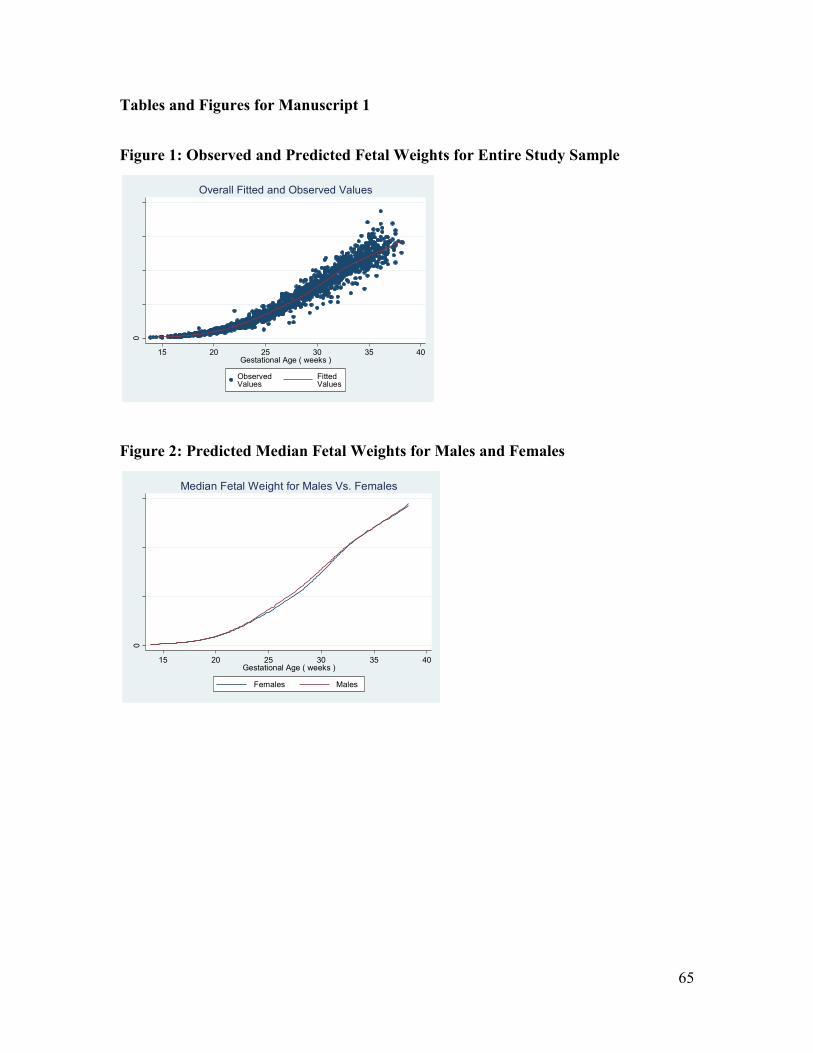
65
Tables and Figures for Manuscript 1
Figure 1: Observed and Predicted Fetal Weights for Entire Study Sample
Figure 2: Predicted Median Fetal Weights for Males and Females
0
100
02
00
03
00
04
00
0
15 20 25 30 35 40Gestational Age ( weeks )
ObservedValues
Fitted Values
Overall Fitted and Observed Values
0
100
02
00
03
00
0
15 20 25 30 35 40Gestational Age ( weeks )
Females Males
Median Fetal Weight for Males Vs. Females
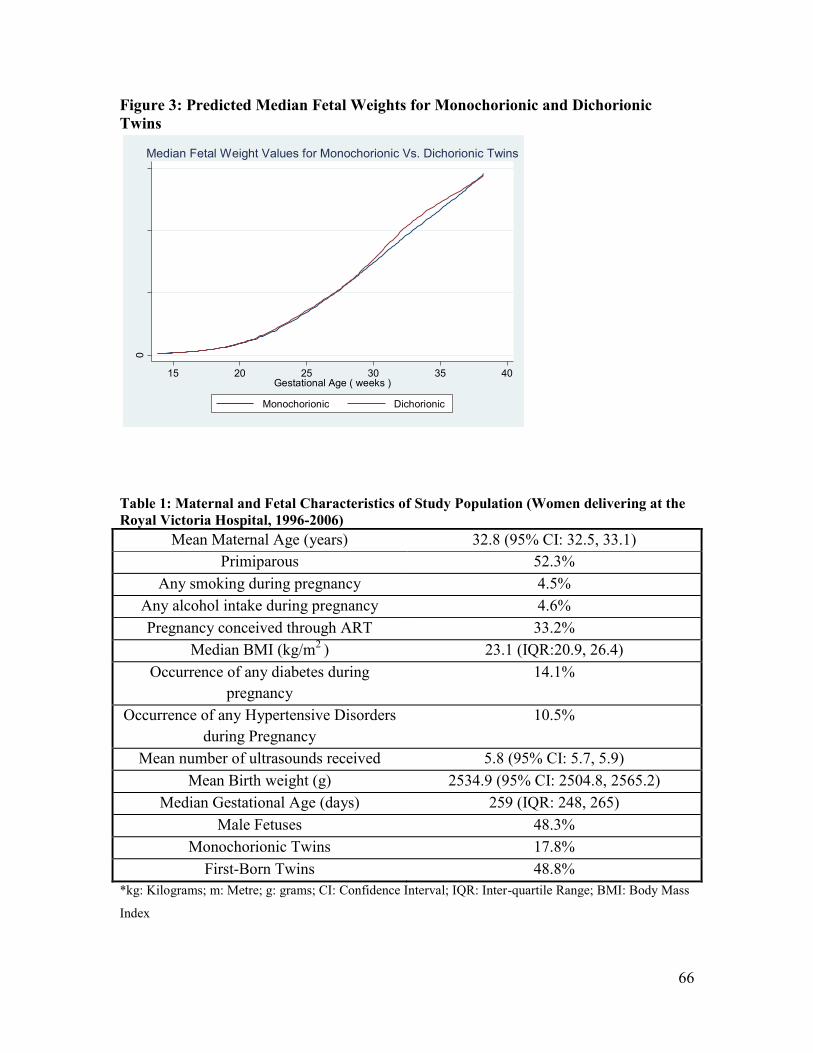
66
Figure 3: Predicted Median Fetal Weights for Monochorionic and Dichorionic
Twins
Table 1: Maternal and Fetal Characteristics of Study Population (Women delivering at the
Royal Victoria Hospital, 1996-2006)
Mean Maternal Age (years) 32.8 (95% CI: 32.5, 33.1)
Primiparous 52.3%
Any smoking during pregnancy 4.5%
Any alcohol intake during pregnancy 4.6%
Pregnancy conceived through ART 33.2%
Median BMI (kg/m2
) 23.1 (IQR:20.9, 26.4)
Occurrence of any diabetes during
pregnancy
14.1%
Occurrence of any Hypertensive Disorders
during Pregnancy
10.5%
Mean number of ultrasounds received 5.8 (95% CI: 5.7, 5.9)
Mean Birth weight (g) 2534.9 (95% CI: 2504.8, 2565.2)
Median Gestational Age (days) 259 (IQR: 248, 265)
Male Fetuses 48.3%
Monochorionic Twins 17.8%
First-Born Twins 48.8%
*kg: Kilograms; m: Metre; g: grams; CI: Confidence Interval; IQR: Inter-quartile Range; BMI: Body Mass
Index
0
100
02
00
03
00
0
15 20 25 30 35 40Gestational Age ( weeks )
Monochorionic Dichorionic
Median Fetal Weight Values for Monochorionic Vs. Dichorionic Twins
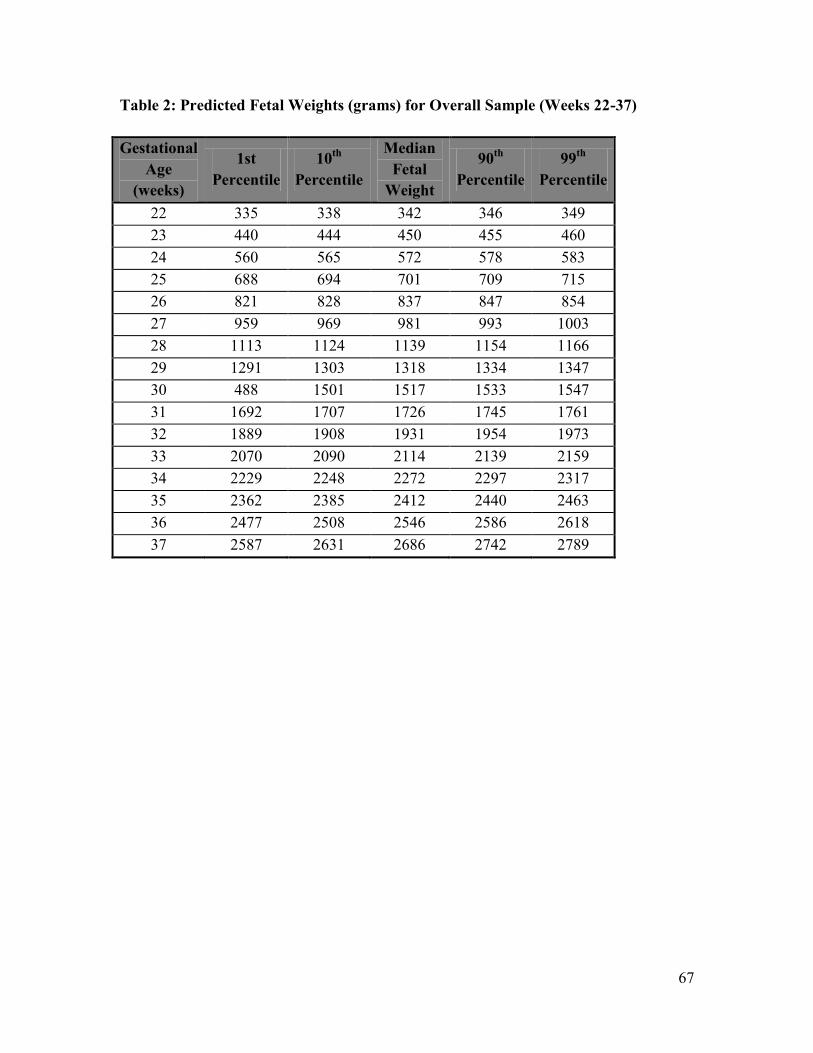
67
Table 2: Predicted Fetal Weights (grams) for Overall Sample (Weeks 22-37)
Gestational
Age
(weeks)
1st
Percentile
10th
Percentile
Median
Fetal
Weight
90th
Percentile
99th
Percentile
22 335 338 342 346 349
23 440 444 450 455 460
24 560 565 572 578 583
25 688 694 701 709 715
26 821 828 837 847 854
27 959 969 981 993 1003
28 1113 1124 1139 1154 1166
29 1291 1303 1318 1334 1347
30 488 1501 1517 1533 1547
31 1692 1707 1726 1745 1761
32 1889 1908 1931 1954 1973
33 2070 2090 2114 2139 2159
34 2229 2248 2272 2297 2317
35 2362 2385 2412 2440 2463
36 2477 2508 2546 2586 2618
37 2587 2631 2686 2742 2789
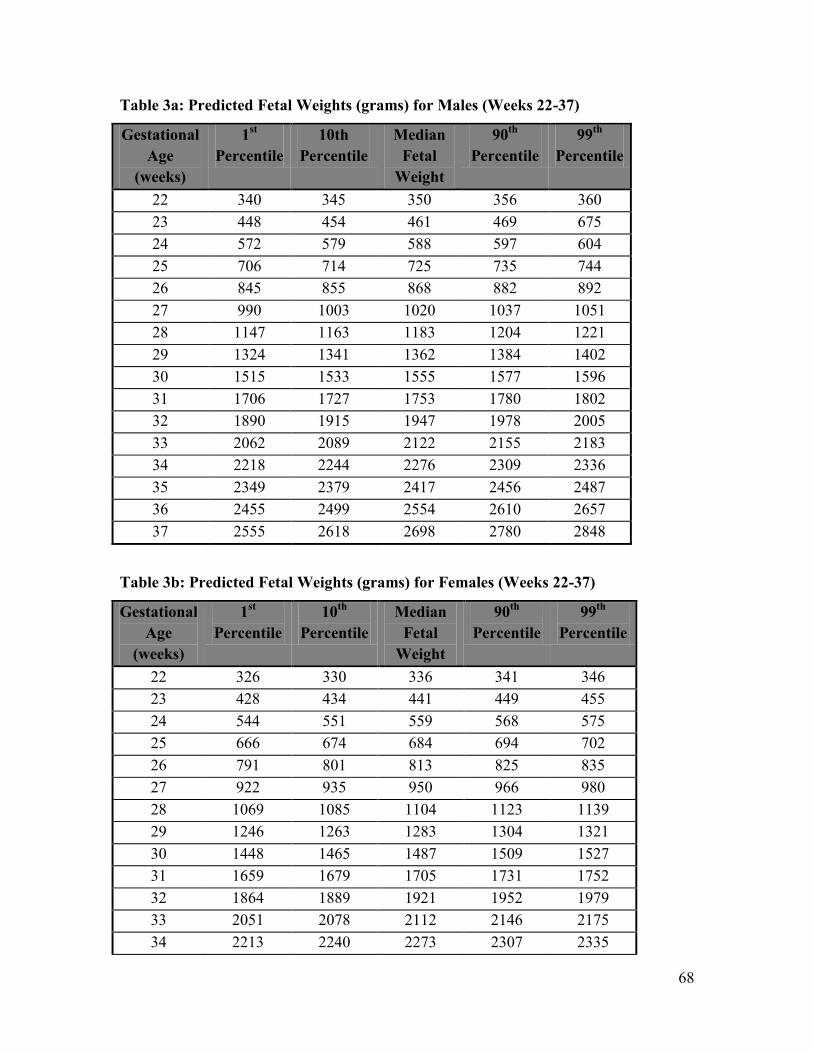
68
Table 3a: Predicted Fetal Weights (grams) for Males (Weeks 22-37)
Gestational
Age
(weeks)
1st
Percentile
10th
Percentile
Median
Fetal
Weight
90th
Percentile
99th
Percentile
22 340 345 350 356 360
23 448 454 461 469 675
24 572 579 588 597 604
25 706 714 725 735 744
26 845 855 868 882 892
27 990 1003 1020 1037 1051
28 1147 1163 1183 1204 1221
29 1324 1341 1362 1384 1402
30 1515 1533 1555 1577 1596
31 1706 1727 1753 1780 1802
32 1890 1915 1947 1978 2005
33 2062 2089 2122 2155 2183
34 2218 2244 2276 2309 2336
35 2349 2379 2417 2456 2487
36 2455 2499 2554 2610 2657
37 2555 2618 2698 2780 2848
Table 3b: Predicted Fetal Weights (grams) for Females (Weeks 22-37)
Gestational
Age
(weeks)
1st
Percentile
10th
Percentile
Median
Fetal
Weight
90th
Percentile
99th
Percentile
22 326 330 336 341 346
23 428 434 441 449 455
24 544 551 559 568 575
25 666 674 684 694 702
26 791 801 813 825 835
27 922 935 950 966 980
28 1069 1085 1104 1123 1139
29 1246 1263 1283 1304 1321
30 1448 1465 1487 1509 1527
31 1659 1679 1705 1731 1752
32 1864 1889 1921 1952 1979
33 2051 2078 2112 2146 2175
34 2213 2240 2273 2307 2335

69
35 2345 2375 2413 2451 2482
36 2451 2492 2544 2597 2642
37 2548 2607 2681 2757 2821

70
Table 4a: Predicted Fetal Weights (grams) for Monochorionic Twins (Weeks 22-37)
Gestational
Age
(weeks)
1st
Percentile
10th
Percentile
Median
Fetal
Weight
90th
Percentile
99th
Percentile
22 312 320 328 338 345
23 411 421 432 444 454
24 527 538 553 567 579
25 655 668 684 701 716
26 788 805 826 847 865
27 926 948 975 1003 1027
28 1074 1100 1133 1167 1195
29 1239 1266 1301 1337 1366
30 1411 1440 1477 1514 1546
31 1578 1612 1656 1701 1738
32 1741 1782 1834 1888 1932
33 1906 1950 2005 2061 2109
34 2070 2113 2168 2224 2271
35 2211 2263 2329 2396 2453
36 2322 2397 2493 2593 2677
37 2420 2529 2668 2815 2941
Table 4b: Predicted Fetal Weights (grams) for Dichorionic Twins (Weeks 22-37)
Gestational
Age
(weeks)
1st
Percentile
10th
Percentile
Median
Fetal
Weight
90th
Percentile
99th
Percentile
22 339 342 347 352 355
23 446 450 456 463 468
24 566 572 579 587 593
25 693 700 708 717 724
26 824 832 843 853 862
27 960 971 985 999 1010
28 1113 1126 1143 1159 1173
29 1294 1308 1325 1343 1358
30 1498 1513 1531 1550 1565
31 1710 1728 1749 1771 1789
32 1916 1937 1963 1990 2011
33 2101 2124 2152 2180 2203

71
34 2259 2281 2309 2337 2360
35 2388 2413 2444 2476 2502
36 2494 2528 2571 2615 2651
37 2594 2642 2702 2764 2816

72
References
1. Blondel B, Kaminski M. Trends in the occurrence, determinants, and
consequences of multiple births. Semin. Perinatol. 2002;26(4):239-249.
2. Alexander G, Kogan M, Martin J, Papiernik E. What are the fetal growth patterns
of singletons, twins, and triplets in the United States? Clin. Obstet Gynecol.
1998;41(1):115-125.
3. Chittacharoen A, Singhakun D, Ayudhya N. Pregnancy outcome of twin
pregnancy in Ramathibodi Hospital. J Med Assoc Thai. 2006;89(Suppl 4):S76-80.
4. Clarkson J, Buckfield P, Herbison G. The outcome of twin pregnancies in
Dunedin. Aust N Z J Obstet Gynaecol. 1982;22:127-130.
5. Fleming A, Rayburn W, Mandsager N, Hill W, Levine M, Lawler R. Perinatal
outcomes of twin pregnancies at term. J Reprod Med. 1990;35(9):881-885.
6. Kiely J. The epidemiology of perinatal mortality in multiple births. Bulletin of the
New York Academy of Medicine. 1990;66:618-637.
7. Rao A, Sairam S, Shehata H. Obstetric complications of twin pregnancies. Best
Pract Res Clin Obstet Gynecol. 2004;18(4):557-576.
8. Saacks C, Thorp Jr. J, Hendricks C. Cohort study of twinning in an academic
health center: Changes in management and outcome over forty years. Am J Obstet
Gynecol. 1995;173:432-439.
9. Udom-Rice I, Inglis S, Skupski D, Adams D, Chervenak F. Optimal gestational
age for twin delivery. Journal of Perinatology. 2000;4:231-234.
10. Boulet S, Alexander G, Salihu H, Kirby R, Carlo W. Fetal growth risk curves:
Defining levels of fetal growth restriction by neonatal death risk. Am J Obstet
Gynecol. 2006;195:1571-1577.
11. Barker DJP. Fetal origins of Coronary Heart Disease. BMJ. 1995;311:171-174.
12. Eleftheriades M, Creatsas G, Nicolaides KH. Fetal growth restriction and
postnatal development. Ann N Y Acad Sci. 2006;1092:319-330.
13. Basso O, Wilcox A, Weinberg CR. Birth weight and mortality: Causality or
confounding? Am J Epidemiol. 2006;164(4):303-311.
14. Wilcox A. On the importance-and the unimportance-of birthweight. International
Journal of Epidemiology. 2001;30:1233-1241.
15. Blickstein I. Normal and abnormal growth of multiples. Semin Neonatol. Jun
2002;7(3):177-185.
16. Blickstein I. Is it normal for multiples to be smaller than singletons? Best Pract
Res Clin Obstet Gynaecol. 2004;18(4):613-623.
17. Joseph KS, Fahey J, Platt RW, et al. An outcome-based approach for the creation
of fetal growth standards: do singletons and twins need separate standards? Am J
Epidemiol. Mar 1 2009;169(5):616-624.
18. Hutcheon J, Egeland G, Morin L, Meltzer S, Jacobsen G, Platt R. The predictive
ability of conditional fetal growth percentiles. Paediatr Perinat Epidemiol.
2010;24:131-139.
19. Naeye R, Benirshke K, Hagstrom J, Marcus C. Intrauterine growth of twins as
estimated from liveborn birth-weight data. Pediatrics. 1966;37:409-416.
20. Arbuckle TE, Sherman GJ. An analysis of birth weight by gestational age in
Canada. Can Med Assoc J. 1989;140:157-165.

73
21. Arbuckle TE, Wilkins R, Sherman GJ. Birth weight percentiles by gestational age
in Canada. Obstet Gynecol. 1993;81:39-48.
22. Ananth CV, Vintzileos AM, Shen-Schwarz S, Smulian JC, Lai Y-L. Standards of
birth weight in twin gestations stratified by placental chorionicity. Obstet
Gynecol. 1998;91:917-924.
23. Hutcheon JA, Platt RW. The missing data problem in birth weight percentiles and
thresholds for "small-for-gestational-age". Am J Epidemiol. 2008;167(7):786-792.
24. Hadlock FP, Harrist RB, Fearneyhough TC, Deter RL, Park SK, Rossavik IK. Use
of femur length/abdominal circumference ratio in detecting the macrosomic fetus.
Radiology. Feb 1985;154(2):503-505.
25. Hadlock FP, Harrist RB, Sharman R, Deter RL, Park SK. Estimation of fetal
weight with the use of head, body, and femur measurements - a prospective study.
Am J Obstet Gynecol. 1985;151:333-337.
26. Shepard M, Richards V, Berkowitz R, Warsof SL, Hobbins JC. An evaluation of
two equations for predicting fetal weight by ultrasound. Am J Obstet Gynecol.
1982;142(1):47-54.
27. Warsof SL, Gohari P, Berkowitz RL, Hobbins JC. The estimation of fetal weight
by computer-assisted analysis. Am J Obstet Gynecol. 1977;128(8):881-892.
28. Ong S, Smith A, Fitzmaurice A, Campbell D. Estimation of fetal weight in twins:
a new mathematical model. BJOG. 1999;106:924-928.
29. Yarkoni S, Reece E, Holford T, O' Connor T, Hobbins JC. Estimated fetal weight
in the evaluation of growth in twin gestations: a prospective longtitudinal study.
Obstet Gynecol. 1987;69:636-639.
30. Min SJ, Luke B, Gillespie B, et al. Birth weight references for twins. Am J Obstet
Gynecol. 2000;182:1250-1257.
31. Cohen JM, Hutcheon JA, Kramer MS, Joseph KS, Abenhaim H, Platt RW.
Influence of ultrasound-to-delivery interval and maternal-fetal characteristics on
validity of estimated fetal weight. Ultrasound Obstet Gynecol. 2010;35(4):434-
441.
32. Barrett J, Bocking AD. Management of twin pregnancies, Part I. Journal SOGC.
2000;91:5-15.
33. Sepulveda W, Sebire NJ, Hughes K, Odibo AO, Nicolaides KH. The lambda sign
at 10-14 weeks of gestation as a predictor of chorionicity in twin pregnancies.
Ultrasound Obstet Gynecol. 1996;7:421-423.
34. Ananth CV, Platt R, Savitz D. Regression models for clustered binary responses:
Implications of ignoring the intracluster correlation in an analysis of perinatal
mortality in twin gestations. Ann Epidemiol. 2005;15:293-301.
35. Diggle PJ, Heagerty P, Liang K-Y, Zeger SL. Analysis of longtitudinal data. New
York: Oxford University Press Inc.; 2002.
36. Villandre L, Hutcheon JA, Trejo EP, Abenhaim H, Jacobsen G, Platt RW.
Modeling fetal weight for gestational age: A systematic comparison of a flexible
multi-level spline-based model with other proposed approaches. IJB. In Press.
37. Owen P, Donnet ML, Ogston SA, Christie AD, Howie PW, Patel NB. Standards
for ultrasound fetal growth velocity. BJOG. Jan 1996;103(1):60-69.

74
38. Harrell FE. Regression modeling strategies with applications to linear models,
logistic regression, and survival analysis. New York: Springer-Verlag New York
, Inc.; 2001.
39. Duan N. Smearing estimate: A nonparametric retransformation method. JASA.
1983;78(383):605-610.
40. Gallivan S, Robson SC, Chang TC, Vaughan J, Spencer JA. An investigation of
fetal growth using serial ultrasound data. Ultrasound Obstet Gynecol. Mar 1
1993;3(2):109-114.
41. Bernstein IM, Mohs G, Rucquoi M, Badger GJ. Case for hybrid "fetal growth
curves": a population-based estimation of normal fetal size across gestational age.
J Matern Fetal Med. May-Jun 1996;5(3):124-127.

75
5.3 Preface to Manuscript 2
The second manuscript addresses the secondary objective of this thesis, and details the
results from the comparison of five formulae to estimate fetal weight in a subset of the
twin population from the RVH. The estimated fetal weight from the last ultrasound,
calculated by each of the five formulae, was compared with birth weight in those infants
that were born within seven days of receiving their last ultrasound in order to calculate
accuracy and precision of each of the formulae. The results from this part of the study
were used to decide which formula would be used to estimate fetal weight for the
purposes of constructing the ultrasound-based fetal weight reference in twins, the primary
objective of this thesis.

76
5.4 Manuscript 2: A Comparison of Five Commonly Used Formulae to Estimate Fetal
Weight in Twins
Sushmita Shivkumar, BA. BSc.1, Robert W. Platt, PhD.
1
1 Department of Epidemiology, Biostatistics, and Occupational Health, McGill
University, 1020 Pine Avenue West, Montreal, QC, Canada H3A 1A2
Correspondence:
Dr. Robert Platt
Montreal Children’s Hospital Research Institute
2300 Tupper St.
Montreal, QC, Canada
H3H 1 P3
Email: [email protected]
77
ABSTRACT
Background: The estimation of fetal weight during pregnancy is an important
component of the monitoring of fetal growth. This is especially true in twin pregnancies,
which are known to experience a higher incidence of fetal growth abnormalities, and
adverse perinatal outcomes than singleton pregnancies. However, of all the methods
developed to estimate fetal weight, only one has been developed specifically in a twin
population.
Objective: To compare the accuracy and precision of five commonly used formulae to
estimate fetal weight relative to birth weight in a twin population.
Methods: A population of live-born non-anomalous non-reduced twins were included in
this comparative study based in a tertiary care hospital. Only those pregnancies with
ultrasounds conducted within seven days of delivery, and with complete ultrasound
measurements of head circumference, abdominal circumference, biparietal diameter, and
femur length were included in the study. The mean percentage difference between
estimated fetal weight (EFW) and birth weight was used as a measure of accuracy, while
the percentage of EFWs falling within 5% and 10% of birth weight was used as a
measure of precision. The accuracy and precision of each formula was assessed by fetal
sex, birth order, chorionicity, birth weight, gestational age, and presence of maternal
disease or obesity.
Results: The correlation between EFW and birth weight was high for all five formulae
examined. However, the Ong formula, which has been developed in twins, exhibited the
overall highest accuracy (2.41%; 95% CI:1.03, 3.79), and highest accuracy regardless of
maternal or fetal characteristics. While the Combs formula performed with the highest
precision (74.4% of EFWs within 10% of birth weight), the Ong formula performed
comparably. Fetal sex, and birth order influenced the accuracy of estimated fetal weight
formulae, while chorionicity, presence of maternal hypertension, diabetes, or obesity
showed no significant influence when accuracy was compared using the Student’s t-test.

78
Conclusion: The Ong formula, which only incorporates abdominal circumference and
femur length performs better in twins than the four other formulae, which have been
developed in singletons. This is encouraging given that it is difficult to obtain head
measurements in twins due to uterine over-crowding and fetal presentation in twin
pregnancies. However, overall, EFW calculated by all five formulae show a high
correlation with birth weight.
79
Introduction
Twin pregnancies are known to be of higher risk for adverse perinatal outcomes, preterm
delivery and intrauterine growth restriction (IUGR) compared to singletons.1-8
Moreover,
twins are known to demonstrate fetal growth trajectories that are distinct from those of
singletons, with twin median fetal weights falling significantly below those of singletons
around week 30 of gestation.1 Thus, the estimation of fetal weight is an important
component of the clinical management of twin pregnancies.
Since the routine use of ultrasound in pregnancy began, a number of research groups
have used in utero biometric measurements, such as head circumference (HC), biparietal
diameter (BPD), abdominal circumference (AC), and femur length (FL) in different
combinations to estimate fetal weight.9-12
However, while a number of formulae have
been developed in singletons, to our knowledge, there is only one formula, the Ong
formula, that has been developed specifically in a twin population.13
Research groups have examined the performance of formulae developed in singletons in
twin populations, with variable results. The Warsof formula12
has been found to perform
comparably in singletons and twins,14
as have the Hadlock formulae (incorporating HC,
AC and FL or AC and FL or AC and BPD),15
and the Shepard formula.10, 16
In twins, just
as in singletons, the Hadlock and Shepard formulae have been observed to perform
poorly at very low birth weights.10, 16
Other factors that have been suggested to affect the accuracy of estimated fetal weight
(EFW) are inter- and intra-observer variability in obtaining measurements.17-19
Operator
experience has also been suggested to affect the accuracy of EFW measurements,20
while
there is conflicting evidence on the effect of maternal body mass index (BMI),21-22
chorionicity,23-24
and birth order.24-25
Fetal sex has been suggested to have no or minimal
influence on the accuracy of EFW.21, 24, 26
The presence of IUGR in a twin increases the
error associated with estimating its fetal weight.24
80
Within this context, and as part of a larger project involving the construction of an
ultrasound-based fetal weight reference for twins, we assessed the accuracy and precision
of five commonly used formulae to estimate fetal weight in twins using ultrasounds
conducted within seven days of delivery, and comparing EFWs with birth weights.
Methods
This was a retrospective cohort study based in a tertiary care centre, the Royal Victoria
Hospital (RVH) in Montreal, QC. Data were derived from the McGill Obstetrical and
Neonatal Database (MOND), which records antenatal and postnatal information on all
women delivering at the RVH and their infants, and hospital ultrasound records, which
contain information from all ultrasounds performed at the hospital.
Merging of the databases
We merged the MOND and ultrasound records in order to compare EFW by ultrasound
with birth weight. In twins, at the time of the earliest ultrasound, a letter assignment (“A”
or “B”) is made for each fetus. Each twin then retains this letter as an identifier in the
ultrasound database, and at any subsequent ultrasounds. At the time of birth, however, a
letter is assigned and recorded separately in the MOND based on the twin’s birth order:
first-born twins are labeled “A” and second-born twins are labeled “B”. As the ultrasound
letter assignment is made early in pregnancy and the two databases are independent, it is
impossible to ascertain whether the letter assigned at birth corresponds with the letter
assigned at the time of ultrasound.
Therefore, in order to ensure an exact match between the ultrasound and birth record of
each fetus in a twin pair, we only included discordant-sex twin pairs, in which a match
could be made based on the sex of the fetus, and those twin pairs that had a match
between a variable (the last EFW) that appeared in both the MOND and the ultrasound
database. The last estimated fetal weight is derived from the ultrasound records and
recorded in the MOND. However, in cases of inaccurate entry or in cases where the last

81
EFW was the same in both twins, it was not possible to use this variable as a unique
identifier for each twin.
Pregnancies in which at least one fetus had a congenital anomaly or died, underwent
spontaneous or iatrogenic fetal reduction, or had missing information on HC, BPD, AC or
FL were excluded from our analysis. Moreover, our sample was restricted to those
women who delivered within seven days of ultrasound, in order to allow a comparison of
EFW with birth weight.
We assessed two Hadlock formulae, the Shepard formula, the Ong formula and the
Combs formula for their accuracy and precision in this study sample. Table 1 provides
details of the formulae assessed in this study.
Statistical Analysis
We examined the correlation coefficient between EFW calculated by each formula and
birth weight, when ultrasounds were conducted within seven days of delivery.
In order to measure accuracy, the mean percentage difference, the difference between
EFW and birth weight as a percentage of birth weight, was calculated for each formula.
The mean percentage difference then allowed us to assess whether a formula, on average,
over- or under-estimated birth weight. Moreover, we estimated the percentage of
observations within 10% of birth weight as the primary measure of precision, although
the number of observations within 5% of birth weight was also considered. Measures of
accuracy and precision were compared when the interval between ultrasound and
delivery was within seven days, and within two days.
We used the Student’s t-test to compare the accuracy of each formula between groups
(eg. Male vs. Female; Monochorionic Vs. Dichorionic, etc.)
82
Covariates
We conducted analyses to assess accuracy of the formulae by stratifying on fetal sex,
birth order, chorionicity, 500g birth weight categories (<2500g, 2500-2999g, 3000-
3499g, 3500-3999g), two-week strata of gestational age (<30 weeks, 30-31 weeks, 32-33
weeks, 34-35 weeks, 36-37 weeks, ≥38 weeks) and, in the cases of maternal obesity,
hypertension or diabetes.
Maternal obesity was defined as a pre-pregnancy BMI of 30 kg/m2, calculated from pre-
pregnancy weight and height, which was either self-reported or charted at the first
antenatal visit. Those mothers missing height or weight estimates were excluded from
analysis. Gestational hypertension was defined as pregnancy-induced hypertension,
varying in severity from mild pre-eclampsia to the HELLP syndrome. Diabetes was
defined as any pre-existing or gestational diabetes developed during pregnancy,
regardless of severity.
Results
Our study sample consisted of 242 twins who had one ultrasound each within seven days
of delivery. The mean birth weight of this group was 2363 g, which was significantly
lower than the mean birth weight of the hospital-based twin population (2535g) from
which this smaller group was drawn. Of the sample, 54.5% were born weighing ≤ 2500 g
compared to 45.2% of the original twin population, and 67.8% were born preterm (≤ 37
weeks) compared with 52.6% of the original twin population.
In this sample, 49.2% of the fetuses were male and 42.9% of the sample were first-born
twins. Of all women, 92 (38.1%) were missing information on either height or pre-
pregnancy weight. Therefore, we were unable to calculate BMI for them. Of the
remaining 150 women who had complete information on height and pre-pregnancy
weight, 9.3% were obese with a BMI ≥ 30 kg/m2 compared with 11.8% of mothers from
the original hospital-based twin population. Pregnancy-induced hypertension was present
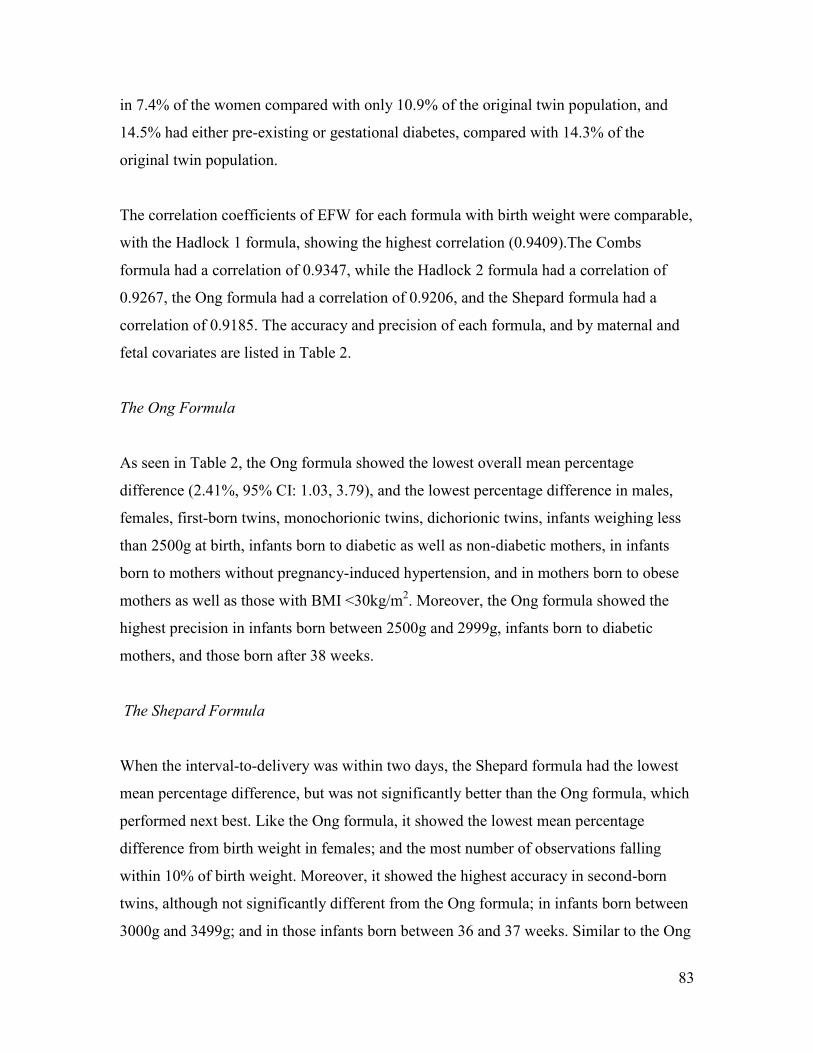
83
in 7.4% of the women compared with only 10.9% of the original twin population, and
14.5% had either pre-existing or gestational diabetes, compared with 14.3% of the
original twin population.
The correlation coefficients of EFW for each formula with birth weight were comparable,
with the Hadlock 1 formula, showing the highest correlation (0.9409).The Combs
formula had a correlation of 0.9347, while the Hadlock 2 formula had a correlation of
0.9267, the Ong formula had a correlation of 0.9206, and the Shepard formula had a
correlation of 0.9185. The accuracy and precision of each formula, and by maternal and
fetal covariates are listed in Table 2.
The Ong Formula
As seen in Table 2, the Ong formula showed the lowest overall mean percentage
difference (2.41%, 95% CI: 1.03, 3.79), and the lowest percentage difference in males,
females, first-born twins, monochorionic twins, dichorionic twins, infants weighing less
than 2500g at birth, infants born to diabetic as well as non-diabetic mothers, in infants
born to mothers without pregnancy-induced hypertension, and in mothers born to obese
mothers as well as those with BMI <30kg/m2. Moreover, the Ong formula showed the
highest precision in infants born between 2500g and 2999g, infants born to diabetic
mothers, and those born after 38 weeks.
The Shepard Formula
When the interval-to-delivery was within two days, the Shepard formula had the lowest
mean percentage difference, but was not significantly better than the Ong formula, which
performed next best. Like the Ong formula, it showed the lowest mean percentage
difference from birth weight in females; and the most number of observations falling
within 10% of birth weight. Moreover, it showed the highest accuracy in second-born
twins, although not significantly different from the Ong formula; in infants born between
3000g and 3499g; and in those infants born between 36 and 37 weeks. Similar to the Ong

84
and Combs formula, the Shepard formula showed the highest precision in second-born
twins, and additionally, was the most precise formula in infants born below 2500g, and
infants born to mothers with a normal BMI.
The Combs Formula
Overall, the Combs formula showed the highest precision when intervals-to-delivery
were within two days and seven days. The Combs formula also showed the highest
accuracy in infants born between 2500g and 2999g, those born weighing more than
3500g, those born between 34 and 35 weeks, and in infants of mothers with pregnancy-
induced hypertension. Moreover, the Combs formula had the highest precision in infants
born to obese mothers, non-diabetic mothers, infants born before 30 weeks and after 36
weeks, and in infants born weighing between 3000g and 3499g.
Hadlock1 Formula
The Hadlock1 formula under-estimated fetal weight regardless of maternal or fetal
covariate examined. Despite the fact that the accuracy of this formula was low, the
standard deviation of the mean percentage difference was consistently the lowest across
strata, implying that the Hadlock1 formula performs well with respect to precision.
Moreover, it showed the highest accuracy and precision in those infants born between 30
and 31 weeks, and the highest precision in those born between 32 and 33 weeks, when
the number of observations falling within 5% and 10% of birth weight were used to
measure precision.
Hadlock2 Formula
The Hadlock2 formula showed the highest accuracy in estimating the fetal weight of
those infants born before 30 weeks of gestation, between 32 and 33 weeks, and when
gestational age was greater than or equal to 38 weeks.
85
Accuracy by Covariates
When the study sample was stratified by fetal sex, the Hadlock1 and 2 formulae
performed significantly worse in male compared to female fetuses, while the Ong and
Combs formulae performed worse in females compared to males. When birth order was
considered, the Hadlock1 formula performed significantly worse in first-born compared
to second-born twins, while the Hadlock2, Ong and Combs formulae performed
significantly worse in second-born twins compared with first-born twins. The accuracy of
all the formulae were similar regardless of chorionicity, whether mothers were diabetic or
not, whether mothers had pregnancy-induced hypertension or not, and whether mothers
were obese or not.
Discussion
All five formulae tested in this sample showed a high correlation between the EFW and
birth weight. Moreover, they all showed fairly high accuracy, with only five instances in
which the absolute value of the mean percentage error was larger than 10%. Three of
these were for the Hadlock1 formula when birth weight was between 3000g and 3999g or
gestational age was greater than or equal to 38 weeks. The fourth case was for the Ong
formula when birth weight was greater than 3500g, and the fifth was for the Combs
formula when gestational age was between 30 and 31 weeks.
Overall, and regardless of the maternal and fetal covariates being examined, the Ong
formula had low mean percentage errors relative to the other formulae. Even in those
cases, where another formula performed the best with respect to accuracy, the Ong
formula was the next best performing formula. The Ong formula was ranked below two
or more formulae only when gestational ages were below 32 weeks. Although, as
mentioned above, the Ong formula showed a high mean percentage difference in those
infants born weighing more than 3500g, this may be of less concern in this population
due to their general tendency towards lower birth weights.

86
The Combs formula tended to have the most number of observations within 10% of birth
weight, while the Ong formula performed comparably with respect to precision. Between
21% and 80% of observations fell within 10% of birth weight, depending on the stratum
of the covariate being analyzed. The low value of 21% was in those fetuses, who were
born before 30 weeks of gestation. Similarly, the Ong formula performed poorly in the
infants born before 32 weeks, with only 50% of observations falling within 10% of birth
weight and, among those born after 38 weeks, with only 56% of observations falling
within 10% of birth weight. As is the case with birth weight, in light of the fact that most
twins are born at or before 38 weeks, this may be less of a concern in this population.
However, on the other hand, extremely preterm infants and those who are born very late
in gestation may be the very groups in which accurate estimation of fetal weight may be
important.
The tendency of the Hadlock1 formula to under-estimate fetal weight was consistent
across the entire sample. Moreover, the observed high mean percentage difference of the
Hadlock1 formula was in contradiction with results from singletons.10, 27
A previous
study by Hadlock et al. found that the Hadlock1 formula over-estimated fetal weight in
those infants born <2500g, which was also in contradiction with the results from our
study.10
Surprisingly, we found that fetal sex influenced the accuracy of the Hadlock formulae,
the Ong and Combs formulae. Previous literature has found that fetal sex does not
influence the accuracy of EFW. 21, 26
Birth order was also found to influence the accuracy
of formulae with the Hadlock1 formula performing worse in first-born twins, and the
Hadlock2, Ong and Combs formulae performing worse in second-born twins. Although
the presence of maternal disease, such as pregnancy-induced hypertension is associated
with higher risk of IUGR, and IUGR is known to affect the accuracy of EFW, the
presence of pregnancy-induced hypertension itself did not influence the accuracy of the
formulae. Also, we found that maternal BMI, chorionicity, and diabetic status of the
mother did not influence the accuracy of the formulae.
87
The comparisons conducted here were exploratory, since we were restricted by a small
sample size. Ideally, in a larger cohort, a more detailed exploration of the influence of
maternal and fetal covariates, as well as the influence of covariates such as interval
between ultrasound and delivery, would be conducted using regression analysis in order
to assess the magnitude of their effect on accuracy.
Factors that may have influenced the results of our study could include our choice of
population. Due to database limitations in the identification of fetuses, we were forced to
use a much smaller sample than originally intended. The formulae for EFW were
compared in a sample that selected for discordant-sex twin pairs and for those with
different last recorded EFWs (i.e., those twin pairs that were discordant in fetal weight);
it is thus possible that our results are not generalizable beyond this population.
Moreover, the fact that women delivered so close to receiving their last ultrasound could
introduce bias in our study, if the reason for receiving ultrasounds so late was a high-risk
pregnancy (e.g. maternal disease) or suspicion of IUGR, or if findings from the
ultrasound prompted iatrogenic intervention. This would have resulted in the inclusion of
fetuses that were less healthy than those that were not monitored so close to delivery.
However, this is a limitation of all retrospective studies that attempt to compare EFW
with birth weight. The alternative would be to carry out a prospective study, or to use an
EFW from earlier in pregnancy and adjust for average estimated daily or weekly growth
till delivery, although this approach is associated with bias as well.26
Conclusion
Although all the five formulae tested performed fairly well in this population, in this
preliminary analysis, the Ong formula, which incorporates AC and FL, appears to have
the highest accuracy regardless of maternal and fetal covariates. This finding is
encouraging as it obviates the need for head measurements, which are difficult to obtain
late in pregnancy when the fetal head is engaged, or more pertinently to this study, in
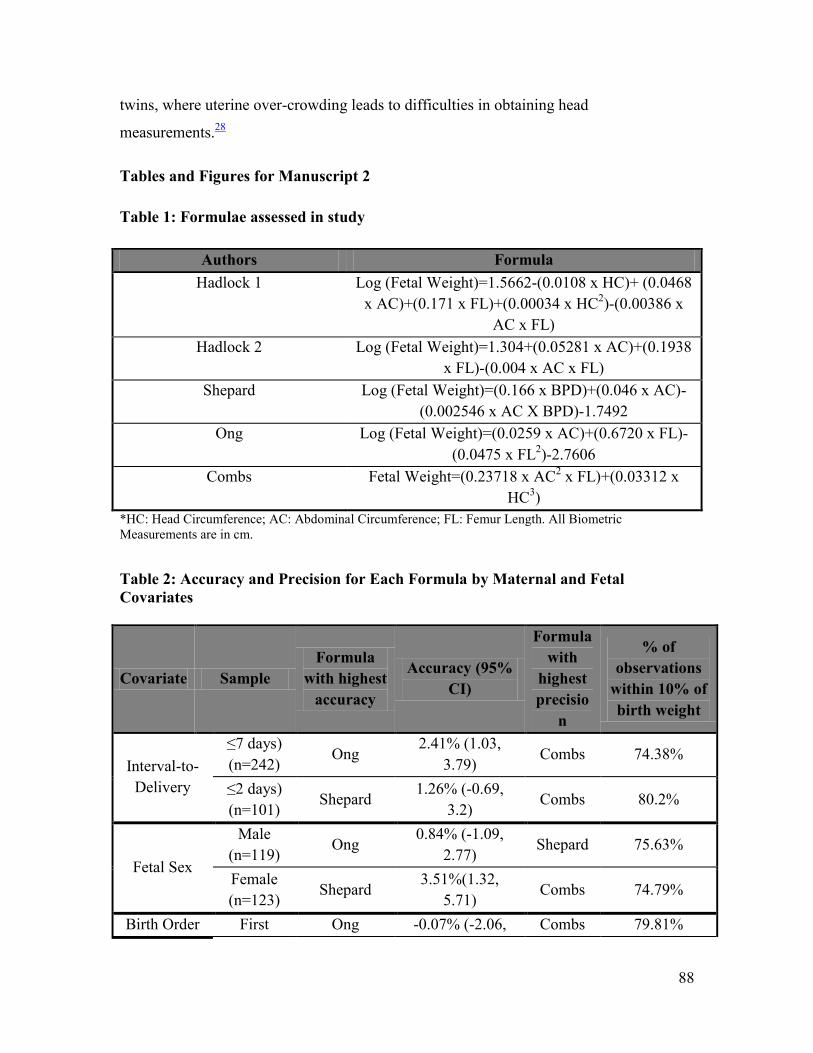
88
twins, where uterine over-crowding leads to difficulties in obtaining head
measurements.28
Tables and Figures for Manuscript 2
Table 1: Formulae assessed in study
Authors Formula
Hadlock 1 Log (Fetal Weight)=1.5662-(0.0108 x HC)+ (0.0468
x AC)+(0.171 x FL)+(0.00034 x HC2)-(0.00386 x
AC x FL)
Hadlock 2 Log (Fetal Weight)=1.304+(0.05281 x AC)+(0.1938
x FL)-(0.004 x AC x FL)
Shepard Log (Fetal Weight)=(0.166 x BPD)+(0.046 x AC)-
(0.002546 x AC X BPD)-1.7492
Ong Log (Fetal Weight)=(0.0259 x AC)+(0.6720 x FL)-
(0.0475 x FL2)-2.7606
Combs Fetal Weight=(0.23718 x AC2 x FL)+(0.03312 x
HC3)
*HC: Head Circumference; AC: Abdominal Circumference; FL: Femur Length. All Biometric
Measurements are in cm.
Table 2: Accuracy and Precision for Each Formula by Maternal and Fetal
Covariates
Covariate Sample
Formula
with highest
accuracy
Accuracy (95%
CI)
Formula
with
highest
precisio
n
% of
observations
within 10% of
birth weight
Interval-to-
Delivery
≤7 days)
(n=242) Ong
2.41% (1.03,
3.79) Combs 74.38%
≤2 days)
(n=101) Shepard
1.26% (-0.69,
3.2) Combs 80.2%
Fetal Sex
Male
(n=119) Ong
0.84% (-1.09,
2.77) Shepard 75.63%
Female
(n=123) Shepard
3.51%(1.32,
5.71) Combs 74.79%
Birth Order First Ong -0.07% (-2.06, Combs 79.81%
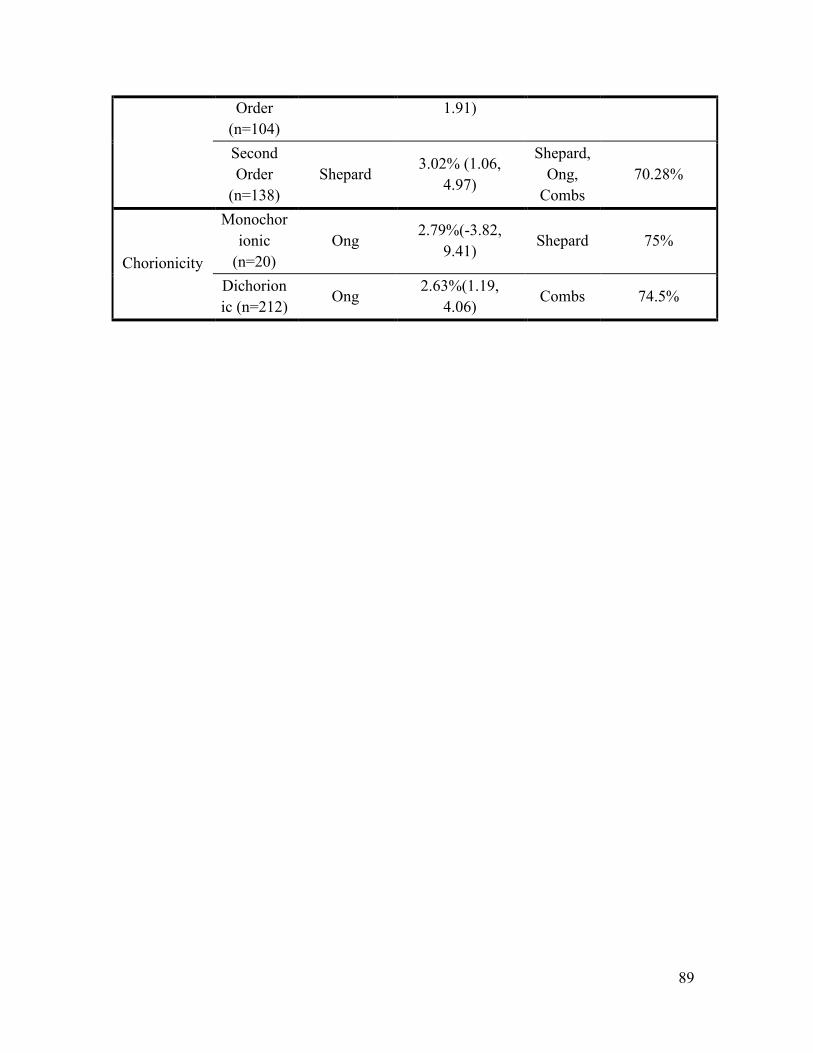
89
Order
(n=104)
1.91)
Second
Order
(n=138)
Shepard 3.02% (1.06,
4.97)
Shepard,
Ong,
Combs
70.28%
Chorionicity
Monochor
ionic
(n=20)
Ong 2.79%(-3.82,
9.41) Shepard 75%
Dichorion
ic (n=212) Ong
2.63%(1.19,
4.06) Combs 74.5%
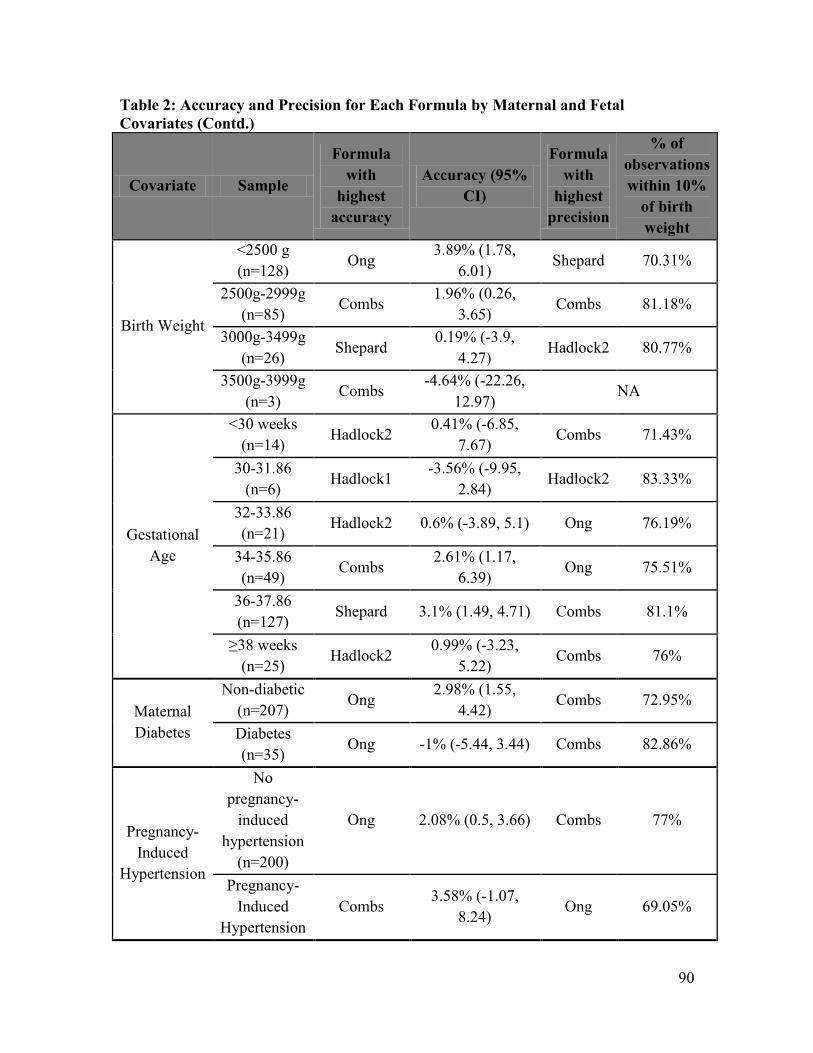
90
Table 2: Accuracy and Precision for Each Formula by Maternal and Fetal
Covariates (Contd.)
Covariate Sample
Formula
with
highest
accuracy
Accuracy (95%
CI)
Formula
with
highest
precision
% of
observations
within 10%
of birth
weight
Birth Weight
<2500 g
(n=128) Ong
3.89% (1.78,
6.01) Shepard 70.31%
2500g-2999g
(n=85) Combs
1.96% (0.26,
3.65) Combs 81.18%
3000g-3499g
(n=26) Shepard
0.19% (-3.9,
4.27) Hadlock2 80.77%
3500g-3999g
(n=3) Combs
-4.64% (-22.26,
12.97) NA
Gestational
Age
<30 weeks
(n=14) Hadlock2
0.41% (-6.85,
7.67) Combs 71.43%
30-31.86
(n=6) Hadlock1
-3.56% (-9.95,
2.84) Hadlock2 83.33%
32-33.86
(n=21) Hadlock2 0.6% (-3.89, 5.1) Ong 76.19%
34-35.86
(n=49) Combs
2.61% (1.17,
6.39) Ong 75.51%
36-37.86
(n=127) Shepard 3.1% (1.49, 4.71) Combs 81.1%
≥38 weeks
(n=25) Hadlock2
0.99% (-3.23,
5.22) Combs 76%
Maternal
Diabetes
Non-diabetic
(n=207) Ong
2.98% (1.55,
4.42) Combs 72.95%
Diabetes
(n=35) Ong -1% (-5.44, 3.44) Combs 82.86%
Pregnancy-
Induced
Hypertension
No
pregnancy-
induced
hypertension
(n=200)
Ong 2.08% (0.5, 3.66) Combs 77%
Pregnancy-
Induced
Hypertension
Combs 3.58% (-1.07,
8.24) Ong 69.05%

91
Maternal
Obesity
(BMI≥30
kg/m2)
Maternal
obesity
(n=14)
Ong 1.93%(-0.05,
3.91) Combs 92.86%
Normal BMI
(n=136) Ong
2.52% (-4.32,
9.37) Shepard 71.32%
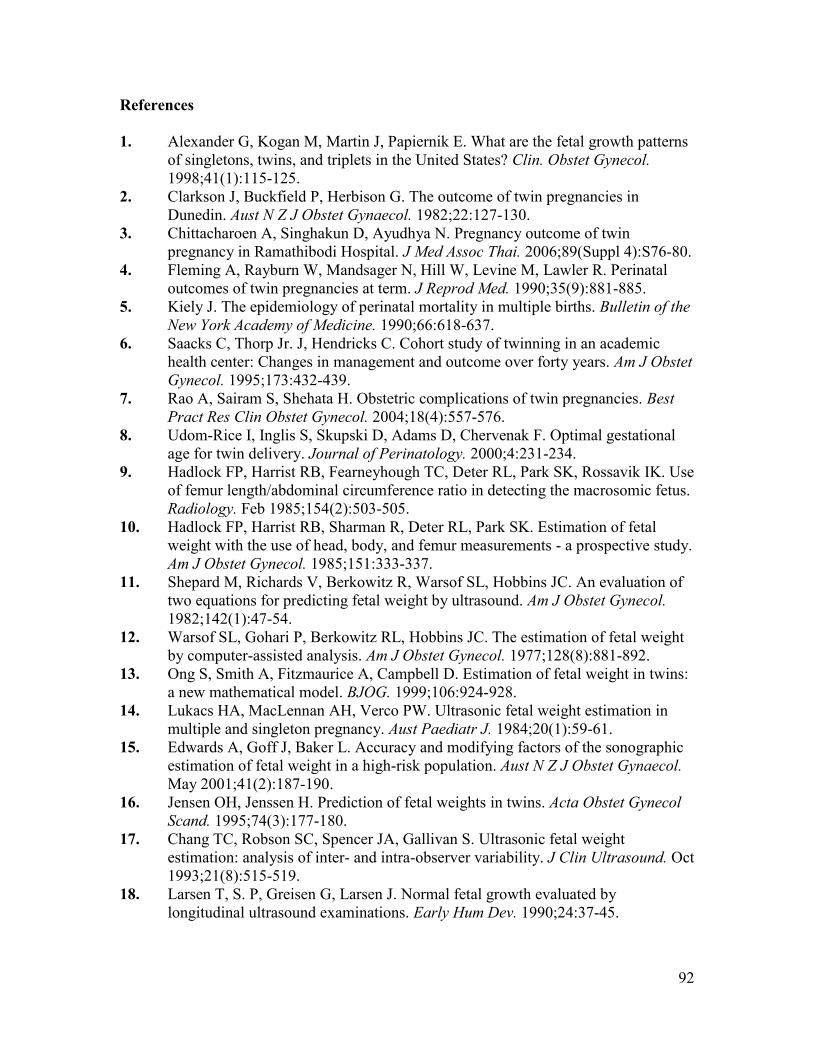
92
References
1. Alexander G, Kogan M, Martin J, Papiernik E. What are the fetal growth patterns
of singletons, twins, and triplets in the United States? Clin. Obstet Gynecol.
1998;41(1):115-125.
2. Clarkson J, Buckfield P, Herbison G. The outcome of twin pregnancies in
Dunedin. Aust N Z J Obstet Gynaecol. 1982;22:127-130.
3. Chittacharoen A, Singhakun D, Ayudhya N. Pregnancy outcome of twin
pregnancy in Ramathibodi Hospital. J Med Assoc Thai. 2006;89(Suppl 4):S76-80.
4. Fleming A, Rayburn W, Mandsager N, Hill W, Levine M, Lawler R. Perinatal
outcomes of twin pregnancies at term. J Reprod Med. 1990;35(9):881-885.
5. Kiely J. The epidemiology of perinatal mortality in multiple births. Bulletin of the
New York Academy of Medicine. 1990;66:618-637.
6. Saacks C, Thorp Jr. J, Hendricks C. Cohort study of twinning in an academic
health center: Changes in management and outcome over forty years. Am J Obstet
Gynecol. 1995;173:432-439.
7. Rao A, Sairam S, Shehata H. Obstetric complications of twin pregnancies. Best
Pract Res Clin Obstet Gynecol. 2004;18(4):557-576.
8. Udom-Rice I, Inglis S, Skupski D, Adams D, Chervenak F. Optimal gestational
age for twin delivery. Journal of Perinatology. 2000;4:231-234.
9. Hadlock FP, Harrist RB, Fearneyhough TC, Deter RL, Park SK, Rossavik IK. Use
of femur length/abdominal circumference ratio in detecting the macrosomic fetus.
Radiology. Feb 1985;154(2):503-505.
10. Hadlock FP, Harrist RB, Sharman R, Deter RL, Park SK. Estimation of fetal
weight with the use of head, body, and femur measurements - a prospective study.
Am J Obstet Gynecol. 1985;151:333-337.
11. Shepard M, Richards V, Berkowitz R, Warsof SL, Hobbins JC. An evaluation of
two equations for predicting fetal weight by ultrasound. Am J Obstet Gynecol.
1982;142(1):47-54.
12. Warsof SL, Gohari P, Berkowitz RL, Hobbins JC. The estimation of fetal weight
by computer-assisted analysis. Am J Obstet Gynecol. 1977;128(8):881-892.
13. Ong S, Smith A, Fitzmaurice A, Campbell D. Estimation of fetal weight in twins:
a new mathematical model. BJOG. 1999;106:924-928.
14. Lukacs HA, MacLennan AH, Verco PW. Ultrasonic fetal weight estimation in
multiple and singleton pregnancy. Aust Paediatr J. 1984;20(1):59-61.
15. Edwards A, Goff J, Baker L. Accuracy and modifying factors of the sonographic
estimation of fetal weight in a high-risk population. Aust N Z J Obstet Gynaecol.
May 2001;41(2):187-190.
16. Jensen OH, Jenssen H. Prediction of fetal weights in twins. Acta Obstet Gynecol
Scand. 1995;74(3):177-180.
17. Chang TC, Robson SC, Spencer JA, Gallivan S. Ultrasonic fetal weight
estimation: analysis of inter- and intra-observer variability. J Clin Ultrasound. Oct
1993;21(8):515-519.
18. Larsen T, S. P, Greisen G, Larsen J. Normal fetal growth evaluated by
longitudinal ultrasound examinations. Early Hum Dev. 1990;24:37-45.

93
19. Sarmandal P, Bailey S, Grant J. A comparison of three methods of assessing inter-
observer variation applied to ultrasonic fetal measurement in the third trimester.
BJOG. 1989;96:1261.
20. Chauhan SP, Hendrix N, Magann EF, Morrison J, Kenney S, Devoe L.
Limitations of clinical and sonographic estimates of birth weight: experience with
1034 parturients. Obstet Gynecol. 1998;91(1):72-77.
21. Cohen JM, Hutcheon JA, Kramer MS, Joseph KS, Abenhaim H, Platt RW.
Influence of ultrasound-to-delivery interval and maternal-fetal characteristics on
validity of estimated fetal weight. Ultrasound Obstet Gynecol. 2010;35(4):434-
441.
22. Farrell T, Holmes R, Stone P. The effect of body mass index on three methods of
fetal weight estimation. BJOG. 2002;109:651-657.
23. Reberdao MA, Martins L, Torgal M, et al. The source of error in the estimation of
intertwin birth weight discordance. J Perinat Med. 2010;38(6):671-674.
24. Ocer F, Aydin Y, Atis A, Kaleli S. Factors affecting the accuracy of
ultrasonographical fetal weight estimation in twin pregnancies. J Matern Fetal
Med. 2011.
25. Danon D, Melamed N, Bardin R, Meizner I. Accuracy of ultrasonographic fetal
weight estimation in twin pregnancies. Obstet Gynecol. 2008;112(4):759-764.
26. Dudley N. A systematic review of the ultrasound estimation of fetal weight.
Ultrasound in Obstetrics and Gynecology. 2005;25(1):80-89.
27. Secher N, Djursing H, Hansen PK, et al. Estimation of fetal weight in the third
trimester by ultrasound. Eur J Obstet Gynecol Reprod Biol. 1987;24(1):1-11.
28. Warsof SL, Wolf P, Coulehan J, Queenan JT. Comparison of fetal weight
estimation formulas with and without head measurements. Obstet Gynecol.
1986;67(4):569-573.

94
Chapter 6: Discussion
6.1 Interpretation of Findings
To date, to our knowledge there has not been any work comparing formulae to estimate
fetal weight in twins born at the RVH. Despite the limitations encountered when merging
the two databases, and the resulting restricted sample, there was convincing evidence
that, in the examined sample, the Ong formula performed consistently better than the
other formulae. Moreover, it is encouraging that all the formulae tested had mean
percentage errors below 15%, and most had mean percentage errors below 10%. The
ultrasound machines at the RVH currently use the Hadlock formula, which incorporates
HC, AC, FL and BPD.215
The five formulae tested, all of which use fewer biometric
measurements than the Hadlock formula in the estimation of fetal weight, performed
well. Since, in twins it is difficult to accurately measure the head due to uterine over-
crowding, it is useful to note that these formulae perform with high accuracy and
precision.
The fetal weight references that have been constructed from this twin population could be
useful for the clinical management of pregnancies. Although the cross-sectional
assessment of weight-for-gestational-age will not be sufficient to determine whether a
fetus attains its own growth potential, serial ultrasounds and the use of references for
comparison could be useful in monitoring longitudinal growth. For instance, if an infant
is physiologically small, it may rank in the 10th
percentile of fetal weight distribution in
the second trimester. If the fetus then remains at the 10th
percentile in the third trimester,
this is more likely to imply normal growth than the situation where a fetus shows a
decline in its percentile ranking, which would suggest IUGR. Therefore, although cross-
sectional in nature, the references generated in this study could be of clinical use for
monitoring fetal growth over the course of pregnancy.

95
6.2 Strengths
Although there has been extensive research conducted in singletons and a number of birth
weight references created for use in twin populations, this study is one of the few that has
constructs a fetal growth reference using in utero estimations of fetal weight.
Moreover, the high accuracy and precision of the Ong formula, which has been
specifically developed in twins and only uses AC and FL to estimate fetal weight, is an
advantage in a population in which head measurements are notoriously difficult to obtain
due to over-crowding.186
This is also potentially useful in estimating fetal weight when
mothers are in labour, and the fetal head is engaged.176
Since data were available for over ten years from a tertiary care center, the sample size
for this study was substantial. The inclusion of more than one ultrasound observation per
infant further added to the sample size. Although Altman and Chitty recommend against
the use of more than one ultrasound observation per infant, due to the correlation of serial
measurements taken on the same fetus,241
this was accounted for by using hierarchical
(mixed) models. Furthermore, this study appropriately accounts for the correlation
between twins born to the same mother.
Unlike the previous studies in twins that model fetal growth, the response variable was
log-transformed, in order to ensure that the assumptions of homoscedasticity of residual
errors and normal distribution of the response variable were not violated.223
In fact, when
the fit of the models with and without log-transformation of the fetal weight variable in
preliminary analyses were compared, there was a large difference in fit as measured by
AIC, with the model including log fetal weight showing far superior fit than the model
including the non-transformed fetal weight variable.
Most studies use an arbitrary threshold as being indicative of small-for-gestational age.12
Fetal size distributions and deviations are presumably better described along a continuum
96
and not at a threshold that is statistically defined. Therefore, the 1st, 10th
, 50th
, 90th
and
99th
percentile fetal weight values were included for reference.
6.3 Limitations
Percentile Values
The small distances between the 1st, 10
th, 50
th, 90
th, and 99
th fetal weight percentile values
are of concern. When compared with the study by Min et al.,228
for instance, which had a
larger sample size than this study (1,831 pregnancies and more than one ultrasound
observation per fetus), the 10th
and 90th
percentile values from this study are much closer
to the median fetal weight value for each gestational age.
Predicted values from a regression model, in general, will have a narrower distribution
than the original study sample distribution. Moreover, accounting for the two levels of
clustering may have captured much of the variance around the parameter estimate in the
present study. This was further evidenced by the low residual standard error observed in
the overall sample. However, the fact that the 1st and 50
th or the 50
th and 99
th percentile
values were relatively close somewhat limits the clinical applicability of these references,
especially in the light of error associated with ultrasound estimations of fetal weight, and
may lead to the over-estimation of the prevalence of SGA when used for comparison.
While, theoretically, the most appropriate way to model fetal growth in twins with serial
ultrasound measurements would be to account for the two levels of clustering, in reality,
it may not have affected our results much. In fact, when examining the intraclass
correlation coefficient (=0), clustering did not explain the variability in fetal weight,
indicating that the twin clusters could be ignored. Moreover, when examining the AIC
values, a model that adjusted for the two levels of clustering performed as well as one
that did not adjust for any clustering, and treated twins, and serial measurements on them
as independent.
97
Assessment of size rather than growth
As early as 1989, Altman described the conflation of fetal size and growth in literature
focusing on IUGR in fetuses.241
A single measure of fetal size is not an adequate marker
of fetal growth, even when compared to the distribution of fetal weights for that
gestational age. A single cross-sectional comparison of fetal size cannot distinguish
between those fetuses that may be small but healthy and growing normally, and those that
appear to be AGA at the time of measurement, but either experienced a deviation in
growth prior to this point, or will in the future. In order to appropriately assess fetal
growth, two or more longitudinal measurements are required on the same fetus, although
this approach may still miss growth restriction that may have set in at an earlier point in
pregnancy. There is, however, some evidence that suggests that the identification of an
SGA fetus is at least as good in predicting adverse perinatal outcome as the identification
of deviations from a fetus’ own growth trajectory.9, 242
These studies have, however, been
conducted using birth weight references and thus need to be corroborated using
ultrasound-based references.
The Influence of Zygosity
In this study, fetal weight references were stratified on chorionicity. However, as
information on zygosity is not available in the MOND, it was not possible to take into
account any potential impact of zygosity on the degree of correlation between fetal
weights of twins born to the same mother, or difference in fetal size.
Number of Ultrasounds Conducted
A general limitation of all studies that use serial ultrasound measurements to construct
size references is the clinical indication associated with ultrasound. When a mother has
more than one ultrasound, it is possible that this is due to fetal distress or suspected
IUGR. Inclusion of these fetuses in the construction of size references could bias the
results towards smaller predicted EFW.241
This is less of an issue with this study since

98
twins are closely monitored as a rule. However, the fact that some of these ultrasounds
were performed as a result of suspicion of fetal distress or growth restriction cannot be
ruled out.
Study Sample
Altman and Chitty recommend using as unselected a population as possible in the
creation of fetal size references, and not selecting a population based on information that
is not available at the time of ultrasound.241
The exclusion of fetuses with congenital or
structural abnormalities or cases of fetal death, even if discovered later, are the only
exceptions they allow. With this in mind, the study sample was restricted to live-born
twins without congenital and chromosomal anomalies. However, pregnancies were
excluded if iatrogenic fetal reduction occurred since the timing of reduction was
unknown, and since it was not possible to ensure that the ultrasound record of a reduced
fetus would mistakenly be matched with the birth record of a surviving one.
The exclusion of these fetuses from analysis could have resulted in a selection bias, since
this ultimately resulted in the exclusion of a sub-sample of live-born twins. For instance,
if surviving twins in the case of a multifetal pregnancy reduction are smaller than
spontaneous twins, for which there is some evidence,120-123
excluding these pregnancies
would inflate the predicted fetal weight values from this study relative to a more general
population. The exclusion of fetuses with congenital anomalies or those who died in
utero, and their co-twins may have additionally resulted in a shifting of predicted fetal
weights for each reported percentile to the right. Moreover, we excluded those ultrasound
observations that were missing information on biometric measurements. This may have
also resulted in a bias if, for instance, the reason that biometric measures were not
recorded at the time of ultrasound was that the ultrasound was conducted due to an
indication for fetal distress, or monitoring due to maternal disease. This would have,
again, resulted in the exclusion of fetuses that may have shifted the fetal weight
references to the left.
99
The inclusion criteria specified in this study resulted in a general fetal weight reference,
and did not describe fetal weight changes that could be described as “ideal” in a healthy
population ascertained retrospectively after birth. There is value in the description of
what could be termed “ideal” growth for the purposes of comparison, defined as either
fetal growth in low-risk pregnancies or associated with the lowest risk of adverse
perinatal outcome. This could be an avenue of future exploration.
Random Error Associated with Ultrasound
The random error associated with calculating fetal weight by ultrasound was a limiting
factor in this analysis as in any ultrasound-based study, mitigated somewhat by the
validation of the Ong formula in our population. If the error was 10% or greater, then the
cut-off of the 10th
percentile as representative of SGA would lose its value. This would be
exacerbated in this study due to the close values of the predicted percentile fetal weight
values.
Database Limitations
Since the MOND does not record race or ethnicity data of the mother or infant, it was not
possible to explore the influence of these factors on the fetal weight distribution at each
gestational age.
6.4 Future Research
This research project was meant to create a fetal weight reference for a general hospital-
based population of twins. Therefore, fetal weight references were only presented
specific to sex and chorionicity. However, race, parity, and the use of ART are all known
to influence fetal weight.145
Future research could examine the influence of the above
covariates on fetal weight, although, for race, additional information from census records
or based on the mother’s names recorded on birth certificates may be required.
100
The ability of this fetal weight reference to identify an SGA fetus and its association with
clinical outcomes relative to other fetal weight or birth weight references is important,
and could be explored in future studies. Such an assessment could be either cross-
sectional or longitudinal in nature. For instance, the value of the identification of an SGA
fetus from a cross-sectional comparison with different references at a particular time
point during pregnancy could be compared.
Alternatively, as outlined above, the weight of a fetus at a subsequent ultrasound or at
birth, conditional on its weight and its percentile in the weight distribution at a previous
ultrasound could be explored as a means of identifying a growth-restricted fetus. The
ability of the current method to identify an SGA fetus could be compared with other
conventional means of identifying clinically relevant SGA status, for instance, a cross-
sectional comparison with a birth weight reference. Hutcheon et al. have previously used
this approach in a singleton population.9 While a significant difference was not found
between this method, and the use of a birth weight reference, this may have been due to
the small number of ultrasounds available in singletons.9 In twins who are more highly
monitored, this method may have more value.
Conclusion
Despite the limitations faced in merging two independent databases in a twin population,
the use of the Ong formula was validated to estimate fetal weight in this particular sub-
sample from a tertiary-care hospital. Moreover, a fetal weight reference was constructed
for this population, stratifying by sex and chorionicity and adjusting for the clustering
inherent in twin pregnancies and the use of longitudinal measurements. However, it may
not have been necessary, in this study sample, to adjust for clustering by pregnancy or for
the serial correlation between ultrasound measurements on the same fetus. Finally, more
research is needed to explore the limitations outlined in the current study and to validate
these references in other populations and larger samples.
101
References
1. Blickstein I. Definition of multiple pregnancy. In: Blickstein I, Keith LG, eds.
Multiple Pregnancy: Epidemiology, Gestation and Perinatal Outcome. London:
Taylor & Francis; 2006.
2. Blondel B, Kaminski M. Trends in the occurrence, determinants, and
consequences of multiple births. Semin. Perinatol. 2002;26(4):239-249.
3. Millar WJ, Wadhera S, Nimrod C. Multiple births: Trends and patterns in
Canada, 1974-1990. Health Reports. 1992;4(3):223-249.
4. Gardner M, Goldenberg R, Cliver S, Tucker J, Nelson K, Copper R. The
origin and outcome of preterm twin pregnancies. Obstet Gynecol.
1995;85:553-557.
5. Russell R, Petrini J, Damus K, Mattison D, Schwarz R. The changing
epidemology of multiple births in the United States. Obstet Gynecol.
2003;101:129-135.
6. Ananth CV, Smulian JC. Trends in congenital malformations, chromosomal
anomalies and infant mortality among twin births. In: Blickstein I, Keith
LG, eds. Multiple Pregnancy: Epidemiology, Gestation and Perinatal Outcome.
London: Taylor & Francis; 2006.
7. Blickstein I. Normal and abnormal growth of multiples. Semin Neonatol. Jun
2002;7(3):177-185.
8. Pallotto E, Kilbride H. Perinatal outcome and later implications of
intrauterine growth restriction. Clin. Obstet Gynecol. 2006;49(2):257-269.
9. Hutcheon J, Egeland G, Morin L, Meltzer S, Jacobsen G, Platt R. The
predictive ability of conditional fetal growth percentiles. Paediatr Perinat
Epidemiol. 2010;24:131-139.
10. Bukowski R. Stillbirth and fetal growth restriction. Clin. Obstet Gynecol.
2010;53(3):673-680.
11. Barker DJP. Fetal origins of Coronary Heart Disease. BMJ. 1995;311:171-
174.
12. Altman D, Hytten F. Intrauterine growth retardation: Let's be clear about it.
BJOG. 1989;96:1127-1132.
13. Platz E, Newman R. Diagnosis of IUGR: Traditional biometry. Semin.
Perinatol. 2008;32:140-147.

102
14. Kramer MS, Platt R, Wen SW, et al. A new and improved population-based
Canadian reference for birth weight for gestational age. Pediatrics.
2001;108(2):e35.
15. Owen P, Donnet ML, Ogston SA, Christie AD, Howie PW, Patel NB.
Standards for ultrasound fetal growth velocity. BJOG. Jan 1996;103(1):60-
69.
16. Ott WJ, Doyle S. Normal ultrasonic fetal weight curve. Obstet Gynecol.
1982;59:603-606.
17. Gardosi J. The application of individualised fetal growth curves. J. Perinat.
Med. 1998;26:137-142.
18. Hutcheon J, Zhang X, Cnattingius S, Kramer MS, Platt R. Customized
birthweight percentiles: Does adjusting for maternal characteristics
matter?". BJOG. 2008;115:1397-1404.
19. Hutcheon J, Platt R. The missing data problem in birth weight percentiles
and thresholds for "small-for-gestational-age". Am J Epidemiol.
2008;167:786-792.
20. Cecatti JG, Machado MR, dos Santos FF, Marussi EF. Curve of normal fetal
weight values estimated by ultrasound according to gestation age. Cad Saude
Publica. Oct-Dec 2000;16(4):1083-1090.
21. Gallivan S, Robson SC, Chang TC, Vaughan J, Spencer JA. An investigation
of fetal growth using serial ultrasound data. Ultrasound Obstet Gynecol. Mar
1 1993;3(2):109-114.
22. Hadlock FP, Harrist RB, Martinez-Poyer J. In utero analysis of fetal growth:
a sonographic weight standard. Radiology. 1991;181(1):129-133.
23. Johnsen SL, Rasmussen S, Wilsgaard T, Sollien R, Kiserud T. Longitudinal
reference ranges for estimated fetal weight. Acta Obstet Gynecol Scand.
2006;85(3):286-297.
24. Gilstrap III L, Hankins G, Collins T, Pierson W. Serial biparietal diameter
and femur length measurements in twin gestations. Am J Perinatol.
1986;3:183-186.
25. Grennert L, Persson P-H, Gennser G. Intrauterine growth of twins judged
by BPD measurements. Acta Obstet Gynecol Scand Suppl. 1978;78:28-32.
26. Leveno KJ, Santos-Ramos R, Duenhoelter JH, Reisch JS, Whalley PJ. Sonar
cephalometry in twins: a table of biparietal diameters for normal twin

103
fetuses and a comparison with singletons. Am J Obstet Gynecol.
1979;135(6):727-730.
27. Socol ML, Tamura RK, Sabbagha RE, Chen T, Vaisrub N. Diminished
biparietal diameter and abdominal circumference growth in twins. Obstet
Gynecol. Aug 1984;64(2):235-238.
28. Schneider L, Bessis R, Tabaste J-L, et al. Echographic survey of twin fetal
growth: A plea for specific charts for twins. Prog Clin Biol Res. 1978;24(Pt
C):137-141.
29. Alexander G, Kogan M, Martin J, Papiernik E. What are the fetal growth
patterns of singletons, twins, and triplets in the United States? Clin. Obstet
Gynecol. 1998;41(1):115-125.
30. Joseph KS, Fahey J, Platt RW, et al. An outcome-based approach for the
creation of fetal growth standards: do singletons and twins need separate
standards? Am J Epidemiol. Mar 1 2009;169(5):616-624.
31. Bomsel-Helmreich O, Al Mufti W. The phenomenon of monozygosity:
Spontaneous zygotic splitting. In: Blickstein I, Keith LG, eds. Multiple
Pregnancy: Epidemiology, Gestation and Perinatal Outcome. London: Taylor
& Francis; 2006.
32. Hall J. Twinning. Lancet. 2003;362:735-743.
33. Bulmer MG. The biology of twinning in Man. London: Oxford University
Press; 1970.
34. Dunk C, Huppertz B, Kingdom JC. Development of the placenta and its
circulation. In: Rodeck CH, Whittle MJ, eds. Fetal Medicine: Basic Science
and Clinical Practice: Churchill Livingstone; 2008.
35. Larsen T, S. P, Greisen G, Larsen J. Normal fetal growth evaluated by
longitudinal ultrasound examinations. Early Hum Dev. 1990;24:37-45.
36. O'Day D. Early development: The blastocyst, implantation and
extraembryonic membranes. Human Development 2011. Accessed July 29,
2011.
37. Sfakianaki A, Han C. Ultrasound in the evaluation of twin pregnancy.
Minerva Ginecol. 2009;61:127-139.
38. Satija M, Sharma S, Soni R, Sachar R, Singh G. Twinning and its correlates:
Community-based study in a rural area of India. Hum Biol. 2008;80(6):611-
621.

104
39. Blickstein I, Keith L, eds. Multiple pregnancy: Epidemiology, gestation and
perinatal outcome 2nd Ed. London: Informa Healthcare; 2007.
40. Imaizumi Y. A comparative study of twinning and triplet rates in 17
countries, 1972-1996. Acta Genet Med Gemellol (Roma). 1998;47(2):101-114.
41. Imaizumi Y, Inouye E. Analysis of multiple birth rates in Japan: Seasonal
and social class variations in twin births. Jpn. J. Human Genet. 1980;25:299-
307.
42. Imaizumi Y. Trends of twinning rates in ten countries, 1972-1996. Acta Genet
Med Gemellol (Roma). 1997;46(4):209-218.
43. Rao P, Inbaraj S, Muthurathnam S. Twinning rates in Tamil Nadu. J
Epidemiol Community Health. 1983;37(2):117-120.
44. Razzaque A, Ahmed K, Wai L. Twinning rates in a rural area of Bangladesh.
Hum Biol. 1990;62(4):505-514.
45. Sharma K. The epidemiological characteristics of twinning in Northwest
India. Int J Anthropol. 1997;12(1):39-49.
46. Katz J, West K, Jr., Khatry S, et al. Twinning rates and survival of twins in
rural Nepal. Int J Epidemiol. 2001;30:802-807.
47. Nylander PPS. The twinning incidence in Nigeria. Acta Genet Med Gemellol
(Roma). 1979;28:261-263.
48. Igberase G, Ebeigbe P, Bock-Oruma A. Twinning rate in a rural mission
tertiary hospital in the Niger delta, Nigeria. J Obstet Gynaecol.
2008;28(6):586-589.
49. Onah H, Ugwu G. Trends in the twinning rate in Enugu, Nigeria. J Obstet
Gynaecol. 2008;28(6):590-592.
50. Hamlett G. Human twinning in the United States: Racial frequencies, sex
ratios, and geographical variations. Genetics. 1935;20:250-258.
51. Chauhan S, Scardo J, Hayes E, Abuhamad A, Berghella V. Twins:
prevalence, problems, and preterm births. Am J Obstet Gynecol.
2010;203:305-315.
52. Fellman J, Eriksson A. Variations in the maternal age effect on twinning
rates: The Nordic experience. Twin Res Hum Genet. 2005;8(5):515-523.
105
53. Beemsterboer SN, Homburg R, Gorter NA, Schats R, Hompes PGA,
Lambalk CB. The paradox of declining fertility but increasing twinning rates
with advancing maternal age. Hum Reprod. 2006;21(6):1531-1532.
54. Westergaard T, Wohlfart J, Aaby P, Melbye M. Population based study of
rates of multiple pregnancies in Denmark, 1980-1994. BMJ. 1997;314:775-
779.
55. Kallen B. Use of folic acid supplementation and risk for dizygotic twinning.
Early Hum Dev. 2004;80:143-151.
56. Bai N, Mathews E, Nair P, Sabarinathan K, Harikumar C. Perinatal
mortality rate in a South Indian population. J Indian Med Assoc.
1991;89(4):97-98.
57. Nkata M. Perinatal mortality in twin deliveries in a general hospital in
Zambia. J Trop Pediatr. 1999;45(6):365-367.
58. Kiely J. The epidemiology of perinatal mortality in multiple births. Bulletin
of the New York Academy of Medicine. 1990;66:618-637.
59. Rao A, Sairam S, Shehata H. Obstetric complications of twin pregnancies.
Best Pract Res Clin Obstet Gynecol. 2004;18(4):557-576.
60. Baker ER, Beach ML, Craigo SD, Harvey-Wilkes KB, D'Alton ME. A
comparison of neonatal outcomes of age-matched, growth-restricted twins
and growth-restricted singletons. Am J Perinatol. Sep 1997;14(8):499-502.
61. Kilpatrick SJ, Jackson R, Croughan-Minihane MS. Perinatal mortality in
twins and singletons matched for gestational age at ≥ 30 weeks. Am J Obstet
Gynecol. 1996;174:66-71.
62. Spellacy WN, Hadndler A, Ferre CD. A case-control study of 1253 twin
pregnancies from a 1982-1987 perinatal data base. Obstet Gynecol.
1990;75:168-171.
63. Saacks C, Thorp Jr. J, Hendricks C. Cohort study of twinning in an
academic health center: Changes in management and outcome over forty
years. Am J Obstet Gynecol. 1995;173:432-439.
64. Fleming A, Rayburn W, Mandsager N, Hill W, Levine M, Lawler R.
Perinatal outcomes of twin pregnancies at term. J Reprod Med.
1990;35(9):881-885.
106
65. Chittacharoen A, Singhakun D, Ayudhya N. Pregnancy outcome of twin
pregnancy in Ramathibodi Hospital. J Med Assoc Thai. 2006;89(Suppl
4):S76-80.
66. Clarkson J, Buckfield P, Herbison G. The outcome of twin pregnancies in
Dunedin. Aust N Z J Obstet Gynaecol. 1982;22:127-130.
67. Udom-Rice I, Inglis S, Skupski D, Adams D, Chervenak F. Optimal
gestational age for twin delivery. Journal of Perinatology. 2000;4:231-234.
68. Blickstein I, Goldman RD. Intertwin birth weight discordance as a potential
adaptive measure to promote gestational age. J Reprod Med. 2003;48:449-
454.
69. Blickstein I, Goldman RD, Mazkereth R. Adaptive growth restriction as a
pattern of birth weight discordance in twin gestations. Obstet Gynecol.
2000;96:986-990.
70. Blickstein I, Goldman RD, Smith-Levitin M, Greenberg M, Sherman D,
Rydhstroem H. The relation between inter-twin birth weight discordance
and total twin birth weight. Obstet Gynecol. 1999;93:113-116.
71. Ferrazzani S, Merola A, De Carolis S, Carducci B, Paradisi G, Caruso A.
Birth weight in pre-eclamptic and normotensive twin pregnancies: an
analysis of discordance and growth restriction. Hum Reprod. 2000;15(1):210-
217.
72. Demissie K, Ananth CV, Martin J, Hanley ML, MacDorman MF, Rhoads
GG. Fetal and neonatal mortality among twin gestations in the United States:
the role of intrapair birth weight discordance. Obstet Gynecol. Sep
2002;100(3):474-480.
73. Cheung VY, Bocking AD, Dasilva OP. Preterm discordant twins: what birth
weight difference is significant? Am J Obstet Gynecol. Mar 1995;172(3):955-
959.
74. Suzuki S, Kaneko K, Shin S, Araki T. Incidence of intrauterine
complications in monoamniotic twin gestation. Arch Gynecol Obstet.
2001;265:57-59.
75. Denbow M, Cox P, Taylor M, Hammal D, Fisk N. Placental
angioarchitecture in monochorionic twin pregnancies: Relationship to fetal
growth, fetofetal transfusion syndrome, and pregnancy outcome. Am J Obstet
Gynecol. 2000;182:417-426.

107
76. De Paepe ME, Shapiro S, Young L, Luks FI. Placental characteristics of
selective birth weight discordance in diamniotic-monochorionic twin
gestations. Placenta. 2010;31:380-386.
77. Fick AL, Feldstein VA, Norton ME, Wassel Fyr C, Caughey AB, Machin GA.
Unequal placental sharing and birth weight discordance in monochorionic
diamniotic twins. Am J Obstet Gynecol. Jul 2006;195(1):178-183.
78. Lewi L, Cannie M, Blickstein I, et al. Placental sharing, birthweight
discordance, and vascular anastomoses in monochorionic diamniotic twin
placentas. Am J Obstet Gynecol. 2007;197:587.e581-587.e588.
79. Lewi L, Gucciardo L, Huber A, et al. Clinical outcome and placental
characteristics of monochorionic diamniotic twin pairs with early- and late-
onset discordant growth. Am J Obstet Gynecol. 2008;199:511.e511-511.e517.
80. Audibert F, Boullier M, Boithias C, Kerbrat V, Vial M, Frydman R. Embryo
reduction and birth weight discordance in dichorionic twins. Hum Reprod.
2003;18:437-440.
81. Audibert F, Boullier M, Kerbrat V, Vial M, Boithias C, Frydman R. Growth
discordance in dichorionic twin pregnancies: risk factors, diagnosis and
management. J Gynecol Obstet Biol Reprod (Paris). 2002;31(1 Suppl.):S15-24.
82. Zadori J, Kozinsky Z, Orvos H, Katona M, Kaali S, Pal A. Birth weight
discordance in spontaneous versus induced twins: impact on perinatal
outcome. J Assist Reprod Genet. 2004;21(3):85-88.
83. Suzuki S, Murata T. The influence of assisted reproductive technology on
growth discordance in dichorionic twin pergnancies. Fetal Diagn Ther.
2007;22:372-376.
84. Silver RK, Helfand BT, Russell TL, Ragin A, Sholl JS, MacGregor SN.
Multifetal reduction increases the risk of preterm delivery and fetal growth
restriction in twins: a case-control study. Fertil Steril. 1997;67(1):30-33.
85. Belogolovkin V, Ferrara L, Moshier E, Gandhi M, Eddleman K, Stone J.
Differences in fetal growth, discordancy, and placental pathology in reduced
versus nonreduced twins. Am J Perinatol. 2007;24:575-580.
86. Torok O, Lapinski R, Salafia CM, Bernasko J, Berkowitz RL. Multifetal
pregnancy reduction is not associated with an increased risk of intrauterine
growth restriction, except for very-high-order multiples. Am J Obstet
Gynecol. 1998;179(1):221-225.

108
87. Vergani P, Locatelli A, Ratti M, et al. Preterm twins: What threshold of
birth weight discordance heralds major adverse neonatal outcome? Am J
Obstet Gynecol. 2004;191:1441-1445.
88. Machado RCA, Brizot ML, Liao AW, Krebs VLJ, Zugaib M. Early neonatal
morbidity and mortality in growth-discordant twins. Acta Obst Gynecol.
2009;88:167-171.
89. Dashe J, McIntire D, Santos-Ramos R, Leveno K. Impact of head-to-
abdominal circumference asymmetry on outcomes in growth-discordant
twins. Am J Obstet Gynecol. 2000;183:1082-1087.
90. Ananth CV, Demissie K, Hanley ML. Birth weight discordance and adverse
perinatal outcomes among twin gestations in the United States: The effect of
placental abruption. Am J Obstet Gynecol. 2003;188:954-960.
91. Sonntag J, Waltz S, Schollmeyer T, Schuppler U, Schroder H, Weisner D.
Morbidity and mortality of discordant twins up to 34 weeks of gestational
age. Eur J Pediatr. 1996;155:224-229.
92. Hollier LM, McIntire DD, Leveno KJ. Outcome of twin pregnancies
according to intrapair birth weight differences. Obstet Gynecol.
1999;94(6):1006-1010.
93. Yalcin HR, Zorlu G, Lembet A, Ozden S, Gokmen O. The significance of
birth weight difference in discordant twins: a level to standardize? Acta
Obstet Gynecol Scand. 1998;77:28-31.
94. Patterson R, Wood R. What is twin birthweight discordance? Am J Perinatol.
1990;7(3):217-219.
95. Blickstein I, Shoham-Schwartz Z, Lancet M, Borenstein R. Characterization
of the growth-discordant twin. Obstet Gynecol. 1987;70:11-15.
96. Branum AM, Schoendorf KC. The effect of birth weight discordance on twin
neonatal mortality. Obstet Gynecol. 2003;101(3):570-574.
97. Blickstein I. Is it normal for multiples to be smaller than singletons? Best
Pract Res Clin Obstet Gynaecol. 2004;18(4):613-623.
98. Machin G, Bamforth F, Innes M, McNichol K. Some perinatal characteristics
of monozygotic twins who are dichorionic. Am J Med Genet. 1995;55:71-76.
99. Lee K, Oh K, Lee S, Kim A, Jun J. The frequency and clinical significance of
twin gestations according to zygosity and chorionicity. Twin Res Hum Genet.
2010;13(6):609-619.
109
100. Dube J, Dodds L, Armson BA. Does chorionicity or zygosity predict adverse
perinatal outcomes in twins? Am J Obstet Gynecol. 2002;186(3):579-583.
101. Carroll S, Tyfield L, Reeve L, Porter H, Soothill P, Kyle P. Is zygosity or
chorionicity the main determinant of fetal outcome in twin pregnancies? Am
J Obstet Gynecol. 2005;193:757-761.
102. Acosta-Rojas R, Becker J, Munoz-Abellana B, Ruiz C, Carreras E, Gratacos
E. Twin chorionicity and the risk of adverse perinatal outcome. Int J
Gynaecol Obstet. 2007;96:98-102.
103. Hack K, Derks J, Elias S, et al. Increased perinatal mortality and morbidity
in monochorionic versus dichorionic twin pregnancies: clinical implications
of a large Dutch cohort study. BJOG. 2007;115:58-67.
104. Leduc L, Takser L, Rinfret D. Persistance of adverse obstetric and neonatal
outcomes in monochorionic twins after exclusion of disorders unique to
monochorionic placentation. Am J Obstet Gynecol. 2005;193:1670-1675.
105. Minakami H, Honma Y, Matsubara S, Uchida A, Shiraishi H, Sato I. Effects
of placental chorionicity on outcome in twin pregnancies: A cohort study. J
Reprod Med. 1999;44:595-600.
106. Shrim A, Weisz B, Gindes L, Gagnon R. Parameters associated with outcome
in third trimester monochorionic diamniotic twin pregnancies. J Obstet
Gynaecol Can. 2010;35(5):429-434.
107. Kilby M, Govind A, O'Brien P. Outcome of twin pregnancies complicated by
a single intrauterine death: A comparison with viable twin pregnancies.
Obstet Gynecol. 1994;84:107-109.
108. Nassar A, Adra A, Gomez-Marin O, O'Sullivan M. Perinatal outcome of twin
pregnancies with one structurally affected fetus: A case-control study. J
Perinat. 2000;2:82-86.
109. Malone F, Craigo S, Chelmow D, D'Alton M. Outcome of twin gestations
complicated by a single anomalous fetus. Obstet Gynecol. 1996;88(1):1-5.
110. Heydanus R, Santema J, Stewart P, Mulder P, Wladimiroff J. Preterm
delivery rate and fetal outcome in structurally affected twin pregnancies: A
retrospective matched control study. Prenatal Diagnosis. 1993;13:155-162.
111. Gul A, Cebeci A, Aslan H, Polat I, Sozen I. Perinatal outcomes of twin
pregnancies discordant for major fetal abnormalities. Fetal Diagn Ther.
2005;20:244-248.
110
112. Alexander J, Ramus R, Cox S, Gilstrap L. Outcome of twin gestations with a
single anomalous fetus. Am J Obstet Gynecol. 1997;177:849-852.
113. Fitzsimmons B, Bebbington M, Fluker M. Perinatal and neonatal outcomes
in multiple gestations: Assisted reproduction versus spontaneous conception.
Am J Obstet Gynecol. 1998;179:1162-1167.
114. Minakami H, Sayama M, Honma Y, et al. Lower risks of adverse outcome in
twins conceived by artificial reproductive rechniques compared with
spontaneously conceived twins. Hum Reprod. 1998;13(7):2005-2008.
115. Boulet S, Schieve L, Nannini A, et al. Perinatal outcomes of twin births
conceived using assisted reproduction technology: a population-based study.
Hum Reprod. 2008;23(8):1941-1948.
116. Zuppa AA, Maragliano G, Scapillati ME, Crescimbini B, Tortorolo G.
Neonatal outcome of spontaneous and assisted twin pregnancies. Eur J Obstet
Gynecol Reprod Biol. Mar 2001;95(1):68-72.
117. Putterman S, Figueroa R, Garry D, Maulik D. Comparison of obstetric
outcomes in twin pregnancies after in vitro fertilization, ovarian stimulation
and spontaneous conception. J Matern Fetal Neonat Med. 2003;14:237-240.
118. Makhseed M, Al-Sharhan M, Egbase P, Al-Essa M, Grudzinskas J. Maternal
and perinatal outcomes of multiple pregnancy following IVF-ET. Int J
Gynaecol Obstet. 1998;61:155-163.
119. Bernasko J, Lynch L, Lapinski R, Berkowitz R. Twin pregnancies conceived
by assisted reproductive technologies: Maternal and neonatal outcomes.
Obstet Gynecol. 1997;89:368-372.
120. Groutz A, Yovel I, Amit A, Yaron Y, Azem F, Lessing J. Pregnancy outcome
after multifetal pregnancy reduction to twins compared with spontaneously
conceived twins. Hum Reprod. 1996;11(6):1334-1336.
121. Hwang J-L, Pan H-S, Huang L-W, Lee C-Y. Comparison of the outcomes of
primary twin pregnancies and twin pregnancies following fetal reduction.
Arch Gynecol Obstet. 2002;267:60-63.
122. Lipitz S, Uval J, Achiron R, Schiff E, Lusky A, Reichman B. Outcome of
twin pregnancies reduced from triplets compared with nonreduced twin
gestations. Obstet Gynecol. 1996;87:511-514.
123. Melgar C, Rosenfeld D, Rawlinson K, Greenberg M. Perinatal outcome after
multifetal reduction to twins compared with nonreduced multiple gestations.
Obstet Gynecol. 1991;78:763-767.
111
124. Dias T, Arcangeli T, Bhide A, Mahsud-Dornan S, Papageorghiou A,
Thilaganathan B. Second-trimester assessment of gestational age in twins:
validation of singleton biometry charts. Ultrasound Obstet Gynecol.
2011;37(1):34-37.
125. Fliegner JR, Eggers TR. The relationship between gestational age and birth-
weight in twin pregnancy. Aust N Z J Obstet Gynaecol. Aug 1984;24(3):192-
197.
126. Garite TJ, Clark RH, Elliott JP, Thorp JA. Twins and triplets: the effect of
plurality and growth on neonatal outcome compared with singleton infants.
Am J Obstet Gynecol. Sep 2004;191(3):700-707.
127. Naeye R, Benirshke K, Hagstrom J, Marcus C. Intrauterine growth of twins
as estimated from liveborn birth-weight data. Pediatrics. 1966;37:409-416.
128. Luke B, Minogue J, Witter F, Keith L, Johnson TR. The ideal twin
pregnancy: Patterns of weight gain, discordancy, and length of gestation. Am
J Obstet Gynecol. 1993;169:588-597.
129. Luke B. Reducing fetal deaths in multiple births: Optimal birth weights and
gestational ages for infants of twin and triplet births. Acta Genet Med
Gemellol (Roma). 1996;45:333-348.
130. Elshibly EM, Schmalisch G. Differences in anthropometric measurements
between Sudanese newborn twins and singletons. Twin Res Hum Genet.
2010;13(1):88-95.
131. Blickstein I. Growth aberration in multiple pregnancy. Obstet Gynecol Clin
North Am. 2005;32(1):39-54.
132. Bauer M, Harding J, Bassett N, et al. Fetal growth and placental function.
Molecular and Cellular Endocrinology. 1998;140:115-120.
133. Bahado-Singh RO, Jodicke C. Uterine artery doppler in first-trimester
pregnancy screening. Clin Obstet Gynecol. 2010;53(4):879-887.
134. Hendrix NW, Berghella V. Non-placental causes of intrauterine growth
restriction. Semin Perinatol. 2006;32:161-165.
135. Maulik D. Fetal growth restriction: the etiology. Clin Obstet Gynecol.
2006;49:228-235.
136. Maulik D, Evans JF, Ragolia L. Fetal growth restriction: Pathogenic
mechanisms. Clin Obstet Gynecol. 2006;49(2):219-227.

112
137. Boulet S, Alexander G, Salihu H, Kirby R, Carlo W. Fetal growth risk
curves: Defining levels of fetal growth restriction by neonatal death risk. Am
J Obstet Gynecol. 2006;195:1571-1577.
138. Eleftheriades M, Creatsas G, Nicolaides KH. Fetal growth restriction and
postnatal development. Ann N Y Acad Sci. 2006;1092:319-330.
139. Wegman M. Public health, nursing and medical social work: Weight at birth
and survival of the newborn. Pediatrics. 1954;14:396-400.
140. Schlesinger E, Allaway N. The combined effect of birth weight and length of
gestation on neonatal mortality among single premature babies. Pediatrics.
1955;15:698-704.
141. Battaglia F, Lubchenco L. A practical classification of newborn infants by
weight and gestational age. Pediatrics. 1967;71(2):159-163.
142. Lubchenco L, Hansman C, Dressler M, Boyd E. Intrauterine growth as
estimated from liveborn birth-weight data at 24 to 42 weeks of gestation.
Pediatrics. 1963;32:793-800.
143. Wilcox M, Gardosi J, Mongelli M, Ray C, Johnson I. Birth weight from
pregnancies dated by ultrasonography in a multicultural British population.
BMJ. 1993;307:588-591.
144. Kallen B. A birth weight for gestational age standard based on data in the
Swedish Medical Birth Registry, 1985-1989. Eur J Epidemiol. 1995;11:601-
606.
145. Zhang J, Bowes Jr. WA. Birth-weight-for-gestational-age patterns by race,
sex, and parity in the United States population. Obstet Gynecol. 1995;86:200-
208.
146. Skjaerven R, Gjessing HK, Bakketeig LS. Birthweight by gestational age in
Norway. Acta Obstet Gynecol Scand. 2000;79:440-449.
147. Janssen P, Thiessen P, Klein MC, Whitfield MF, MacNas YC, Cullis-Kuhl
SC. Standards for the measurement of birth weight, length, and head
circumference at term in neonates of European, Chinese and South Asian
ancestry. Open Medicine. 2007;1(2):e74-e88.
148. Bonellie S, Chalmers J, Gray R, Greer I, Jarvis S, Williams C. Centiles
charts for birthweight for gestational age for Scottish singleton births. BMC
Pregnancy Childbirth. 2008;8:5-15.
113
149. Arbuckle TE, Wilkins R, Sherman GJ. Birth weight percentiles by
gestational age in Canada. Obstet Gynecol. 1993;81:39-48.
150. Amini S, Catalano P, Hirsch V, Mann L. An analysis of birth weight by
gestational age using a computerized perinatal data base, 1975-1992. Obstet
Gynecol. 1994;83:342-352.
151. Leroy B, Lefort F, Neveu P, Risse RJ, Trevise P, Jeny R. Intrauterine growth
charts for twin fetuses. Acta Genet Med Gemellol (Roma). 1982;31:199-206.
152. Arbuckle TE, Sherman GJ. An analysis of birth weight by gestational age in
Canada. Can Med Assoc J. 1989;140:157-165.
153. Ananth CV, Vintzileos AM, Shen-Schwarz S, Smulian JC, Lai Y-L.
Standards of birth weight in twin gestations stratified by placental
chorionicity. Obstet Gynecol. 1998;91:917-924.
154. McKeown T, Gibson JR. Observations on all births (23,970) in Birmingham,
1947: IV. "Premature Birth". BMJ. 1951;2(4730):513-517.
155. Fry A, Bernstein I, Badger G. Comparison of fetal growth estimates based on
birth weigth and ultrasound references. The Journal of Maternal-Fetal and
Neonatal Medicince. 2002;12:247-252.
156. Bernstein IM, Mohs G, Rucquoi M, Badger GJ. Case for hybrid "fetal
growth curves": a population-based estimation of normal fetal size across
gestational age. J Matern Fetal Med. May-Jun 1996;5(3):124-127.
157. Marsal K, Persson PH, Larsen T, Lilja H, Selbing A, Sultan BL. Intrauterine
growth curves based on ultrasonically estimated foetal weights. Acta
Paediatr. 1996;85:843-848.
158. Secher NJ, Hansen PK, Thomsen B, Keiding N. Growth retardation in
preterm infants. BJOG. 1987;94:115-120.
159. Zeitlin J, Ancel P-Y, Saurel-Cubizolles MJ, Papiernik E. The relationship
between intrauterine growth restriction and preterm delivery: an empirical
approach using data from a European case-control study. BJOG.
2000;1007:750-758.
160. Weiner CP, Sabbagha R, Vaisrub N, Depp R. A hypothetical model
suggesting suboptimal intrauterine growth in infants delivered preterm.
Obstet Gynecol. 1985;65:323-326.
161. Hediger ML, Scholl TO, Schall JI, Miller LW, Fischer RL. Fetal growth and
the etiology of preterm delivery. Obstet Gynecol. 1995;85:175-182.
114
162. Morken N-H, Kallen K, Jacobssen B. Fetal growth and onset of delivery: A
nationwide population-based study of preterm infants. Am J Obstet Gynecol.
2006;195:154-161.
163. Rode ME, Jackson M. Sonographic considerations with multiple gestation.
Semin Roentgenol. 1999;34(1):29-34.
164. Hubinont C, Santolaya-Forgas J. A systematic approach to first-trimester
ultrasound assessment of twins. Am J Perinatol. 2010;27(8):595-598.
165. Geirsson RT. Ultrasound instead of last menstrual period as the basis of
gestational age assignment. Ultrasound Obstet Gynecol. 1991;1:212-219.
166. Ananth CV, Platt RW. Errors in gestational age: Implications in studies of
perinatal epidemiology. In: Blickstein I, Keith LG, eds. Multiple Pregnancy:
Epidemiology, Gestation and Perinatal Outcome. London: Taylor & Francis;
2006.
167. Joseph KS, Huang L, Liu S, et al. Reconciling the high rates of preterm and
postterm birth in the United States. Obstet Gynecol. 2007;109(4):813-822.
168. Gardosi J, Geirsson RT. Routine ultrasound is the method of choice for
dating pregnancy. BJOG. 1998;105:933-936.
169. Rowlands S, Royston P. Estimated date of delivery from last menstrual
period and ultrasound scan:which is more accurate? Br J Gen Pract.
1993;43:322-325.
170. Yang H, Kramer M, Platt RW, et al. How does early ultrasound scan
estimation of gestational age lead to higher rates of preterm birth? Am J
Obstet Gynecol. 2002;186:433-437.
171. Campbell S, Wilkin D. Ultrasonic measurement of fetal abdomen
circumference in the estimation of fetal weight. BJOG. 1975;82(9):689-697.
172. Higginbottom J, Slater J, Porter G. Estimation of fetal weight from
ultrasonic measurement of trunk circumference. BJOG. 1975;82:698-701.
173. Warsof SL, Gohari P, Berkowitz RL, Hobbins JC. The estimation of fetal
weight by computer-assisted analysis. Am J Obstet Gynecol. 1977;128(8):881-
892.
174. Hadlock FP, Harrist RB, Carpenter R, Deter RL, Park SK. Sonographic
estimation of fetal weight. Radiology. 1984;150:535-540.
115
175. Jordaan H. Estimation of fetal weight by ultrasound. J Clin Ultrasound.
1983;11:59-66.
176. Warsof SL, Wolf P, Coulehan J, Queenan JT. Comparison of fetal weight
estimation formulas with and without head measurements. Obstet Gynecol.
1986;67(4):569-573.
177. Hadlock FP, Harrist RB, Fearneyhough TC, Deter RL, Park SK, Rossavik
IK. Use of femur length/abdominal circumference ratio in detecting the
macrosomic fetus. Radiology. Feb 1985;154(2):503-505.
178. Woo JS, Wan MC. An evaluation of fetal weight prediction using a simple
equation containing the fetal femur length. J Ultrasound Med. Aug
1986;5(8):453-457.
179. Roberts A, Lee A, James A. Ultrasonic estimation of fetal weight: A new
predictive model incorporating femur length for the low-birth-weight fetus. J
Clin Ultrasound. 1985;13:555-559.
180. Shepard M, Richards V, Berkowitz R, Warsof SL, Hobbins JC. An
evaluation of two equations for predicting fetal weight by ultrasound. Am J
Obstet Gynecol. 1982;142(1):47-54.
181. Secher N, Djursing H, Hansen PK, et al. Estimation of fetal weight in the
third trimester by ultrasound. Eur J Obstet Gynecol Reprod Biol.
1987;24(1):1-11.
182. Hadlock FP, Harrist RB, Sharman R, Deter RL, Park SK. Estimation of fetal
weight with the use of head, body, and femur measurements - a prospective
study. Am J Obstet Gynecol. 1985;151:333-337.
183. Siemer J, Hilbert A, Hart N, Meurer B, Goecke T, Schild R. A new
sonographic weight formula for fetuses ≤ 2500 g. Ultraschall in Med.
2009;30:47-51.
184. Rose B, McCallum W. A simplified method for estimating fetal weight using
ultrasound measurements. Obstet Gynecol. 1987;69:671-675.
185. Combs A, Jaekle R, Rosenn B, Pope M, Miodovnik M, Siddiqi T.
Sonographic estimation of fetal weight Based on a model of fetal volume.
Obstet Gynecol. 1993;82:365-370.
186. Ong S, Smith A, Fitzmaurice A, Campbell D. Estimation of fetal weight in
twins: a new mathematical model. BJOG. 1999;106:924-928.

116
187. Farrell T, Holmes R, Stone P. The effect of body mass index on three
methods of fetal weight estimation. BJOG. 2002;109:651-657.
188. Hirata GI, Medearis AL, Horenstein J, Bear MB, Platt LD. Ultrasonographic
estimation of fetal weight in the clinically macrosomic fetus. Am J Obstet
Gynecol. 1990;162(1):238-242.
189. Patterson R. Estimation of fetal weight during labor. Obstet Gynecol.
1985;65:330-332.
190. Chauhan SP, Sullivan C, Magann E, Perry K, Roberts W, Morrison J.
Estimate of birthweight among post-term pregnancy: Clinical versus
sonographic. J Matern Fetal Med. 1994;3:208-211.
191. Chauhan SP, Cowan B, Magann EF, Bradford T, Roberts W, Morrison J.
Intrapartum detection of a macrosomic fetus: Clinical versus eight
sonographic models. Aust N Z J Obstet Gynaecol. 1995;35:266-270.
192. Chauhan SP, West DJ, Scardo JA, Boyd JM, Joiner J, Hendrix NW.
Antepartum detection of macrosomic fetus: clinical versus sonographic,
including soft-tissue measurements. Obstet Gynecol. May 2000;95(5):639-642.
193. Watson WJ, Soisson A, Harlass F. Estimated weight of the term fetus:
Accuracy of ultrasound vs. clinical examination. J Reprod Med. 1988;33(369-
371).
194. Sherman DJ, Arieli S, Tovbin J, Siegel G, Caspi E, Bukovsky I. A
comparison of clinical and ultrasonic estimation of fetal weight. Obstet
Gynecol. 1998;91(2):212-217.
195. Chauhan SP, Hendrix N, Magann EF, Morrison J, Kenney S, Devoe L.
Limitations of clinical and sonographic estimates of birth weight: experience
with 1034 parturients. Obstet Gynecol. 1998;91(1):72-77.
196. Nahum G, Stanislaw H. Ultrasonographic prediction of term birth weight:
how accurate is it? Am J Obstet Gynecol. 2003;188(2):566-574.
197. Hendrix N, Grady C, Chauhan SP. Clinical vs. sonographic estimate of birth
weight in term parturients. A randomized clinical trial. J Reprod Med.
2000;45(4):317-322.
198. Anderson N, Jolley I, Wells J. Sonographic estimation of fetal weight:
comparison of bias, precision and consistency using 12 different formulae.
Ultrasound Obstet Gynecol. 2007;30:173-179.
117
199. Deter R, Hadlock F, Harrist R, Carpenter R. Evaluation of three methods for
obtaining fetal weight estimates using dynamic image ultrasound. J Clin
Ultrasound. 1981;9:421-425.
200. Melamed N, Yogev Y, Meizner I, Mashiach R, Bardin R, Ben-Haroush A.
Sonographic fetal weight estimation. Which model should be used? J
Ultrasound Med. 2009;28(617-629).
201. Ratanasiri T, Jirapornkul S, Somboonporn W, Seejorn K, Patumnakul P.
Comparison of the accuracy of ultrasonic fetal weight estimation by using the
various equations. J Med Assoc Thai. Sep 2002;85(9):962-967.
202. Hasenoehrl G, Pohlhammer A, Gruber R, Staudach A, Steiner H. Fetal
weight estimation by 2D and 3D ultrasound: Comparison of six formulas.
Ultraschall Med. 2009;30:585-590.
203. Danon D, Melamed N, Bardin R, Meizner I. Accuracy of ultrasonographic
fetal weight estimation in twin pregnancies. Obstet Gynecol. 2008;112(4):759-
764.
204. Ott W. Clinical application of fetal weight determination by real-time
ultrasound measurements. Obstet Gynecol. 1981;57:758-762.
205. Lukacs HA, MacLennan AH, Verco PW. Ultrasonic fetal weight estimation
in multiple and singleton pregnancy. Aust Paediatr J. 1984;20(1):59-61.
206. Lynch L, Lapinski R, Alvarez M, Lockwood CJ. Accuracy of ultrasound
estimation of fetal weight in multiple pregnancies. Ultrasound Obstet Gynecol.
1995;6(5):349-352.
207. Edwards A, Goff J, Baker L. Accuracy and modifying factors of the
sonographic estimation of fetal weight in a high-risk population. Aust N Z J
Obstet Gynaecol. May 2001;41(2):187-190.
208. Jensen OH, Jenssen H. Prediction of fetal weights in twins. Acta Obstet
Gynecol Scand. 1995;74(3):177-180.
209. Diaz-Garcia C, Bernard JP, Ville Y, Salomon LJ. Validity of sonographic
prediction of fetal weight and weight discordance in twin pregnancies.
Prenatal Diagnosis. 2010;30:361-367.
210. Secher NJ, Tottrup A, Djursing H, Weber T. Fetal weight estimation in twin
pregnancies. Eur J Obstet Gynecol Reprod Biol. 1989;32(3):181-186.
211. Henriksen T, Villadsen GE, Hedegaard M, Secher NJ. Prediction of light-for-
gestational age at delivery in twin pregnancies: an evaluation of fetal weight
118
deviation and growth discordance measured by ultrasound. Eur J Obstet
Gynecol Reprod Biol. 1992;47(3):195-200.
212. Chauhan SP, Shields D, Parker D, Sanderson M, Scardo JA, Magann EF.
Detecting fetal growth restriction or discordant growth in twin gestations
stratified by placental chorionicity. J Reprod Med. 2004;49(4):279-284.
213. Reberdao MA, Martins L, Torgal M, et al. The source of error in the
estimation of intertwin birth weight discordance. J Perinat Med.
2010;38(6):671-674.
214. Dudley N. A systematic review of the ultrasound estimation of fetal weight.
Ultrasound in Obstetrics and Gynecology. 2005;25(1):80-89.
215. Cohen JM, Hutcheon JA, Kramer MS, Joseph KS, Abenhaim H, Platt RW.
Influence of ultrasound-to-delivery interval and maternal-fetal
characteristics on validity of estimated fetal weight. Ultrasound Obstet
Gynecol. 2010;35(4):434-441.
216. Chang TC, Robson SC, Spencer JA, Gallivan S. Ultrasonic fetal weight
estimation: analysis of inter- and intra-observer variability. J Clin
Ultrasound. Oct 1993;21(8):515-519.
217. Sarmandal P, Bailey S, Grant J. A comparison of three methods of assessing
inter-observer variation applied to ultrasonic fetal measurement in the third
trimester. BJOG. 1989;96:1261.
218. Ocer F, Aydin Y, Atis A, Kaleli S. Factors affecting the accuracy of
ultrasonographical fetal weight estimation in twin pregnancies. J Matern
Fetal Med. 2011.
219. Berry M, Coyaji KJ, Gogoi MP, et al. Foetal growth parameters--clinical
versus ultrasonographic. Indian J Pediatr. 1992;59(1):91-101.
220. Deter RL, Rossavik IK, Hill RM, Cortissoz C, Hadlock FP. Longitudinal
studies of femur growth in normal fetuses. J Clin Ultrasound. 1987;15(5):299-
305.
221. Elejalde BR, de Elejalde MM. The prenatal growth of the human body
determined by the measurement of bones and organs by ultrasonography.
Am J Med Genet. 1986;24(4):575-598.
222. Persson PH, Weldner BM. Intra-uterine weight curves obtained by
ultrasound. Acta Obstet Gynecol Scand. 1986;65(2):169-173.
119
223. Villandre L, Hutcheon JA, Trejo EP, Abenhaim H, Jacobsen G, Platt RW.
Modeling fetal weight for gestational age: A systematic comparison of a
flexible multi-level spline-based model with other proposed approaches. IJB.
In Press.
224. Crane J, Tomich P, Kopta M. Ultrasonic growth patterns in normal and
discordant twins. Obstet Gynecol. 1980;55(6):678-683.
225. Taylor GM, Owen P, Mires GJ. Foetal growth velocities in twin pregnancies.
Twin Res. 1998;1(1):9-14.
226. Ong S, Lim M-N, Fitzmaurice A, Campbell D, Smith AP, Smith N. The
creation of twin centile curves for size. BJOG. 2002;109:753-758.
227. Yarkoni S, Reece E, Holford T, O' Connor T, Hobbins JC. Estimated fetal
weight in the evaluation of growth in twin gestations: a prospective
longtitudinal study. Obstet Gynecol. 1987;69:636-639.
228. Min SJ, Luke B, Gillespie B, et al. Birth weight references for twins. Am J
Obstet Gynecol. 2000;182:1250-1257.
229. Mongelli M, Biswas A. A fetal growth standard derived from multiple
modalities. Early Hum Dev. 2001;60(3):171-177.
230. Smith LP, DeLeon A, Funnell WR, Lalonde AB, Mclean FH, Usher RH. A
research-oriented system for McGill Obstetrical and Neonatal Data
(MOND). Acta Obstet Gynecol Scand. 1982;61(Suppl. 109):49-50.
231. Doubilet PM, Greenes RA. Improved prediction of gestational age from fetal
head measurements. Am J Roentgenol. 1984;142:797-800.
232. Kramer M, Mclean FH, Boyd ME, Usher R. The validity of gestational age
estimation by menstrual dating in term, preterm, and postterm gestations.
JAMA. 1988;260:3306-3308.
233. Barrett J, Bocking AD. Management of twin pregnancies, Part I. Journal
SOGC. 2000;91:5-15.
234. Sepulveda W, Sebire NJ, Hughes K, Odibo AO, Nicolaides KH. The lambda
sign at 10-14 weeks of gestation as a predictor of chorionicity in twin
pregnancies. Ultrasound Obstet Gynecol. 1996;7:421-423.
235. Harrell FE. Regression modeling strategies with applications to linear models,
logistic regression, and survival analysis. New York: Springer-Verlag New
York , Inc.; 2001.
120
236. Ananth CV, Platt R, Savitz D. Regression models for clustered binary
responses: Implications of ignoring the intracluster correlation in an analysis
of perinatal mortality in twin gestations. Ann Epidemiol. 2005;15:293-301.
237. Diggle PJ, Heagerty P, Liang K-Y, Zeger SL. Analysis of longtitudinal data.
New York: Oxford University Press Inc.; 2002.
238. Heagerty P, Zeger S. Marginalized multilevel models and likelihood
inference. Statistical Science. 2000;15(1):1-19.
239. Akaike H. Likelihood of a model and information criteria. Journal of
Econometrics. 1981;16:3-14.
240. Duan N. Smearing estimate: A nonparametric retransformation method.
JASA. 1983;78(383):605-610.
241. Altman D, Chitty LS. Charts of fetal size: 1. Methodology. BJOG.
1994;101:29-34.
242. Danelian P, Allman A, Steer P. Is obstetric and neonatal outcome worse in
fetuses who fail to reach their own growth potential? BJOG. 1992;99:452-
454.
APPENDIX 1: Procedure for merging the MOND and Ultrasound Records
Preparation of Datasets Prior to Merge
Preparation of the McGill Obstetric and Neonatal Database (MOND)
There are two versions of the MOND dataset, one for the period up to 2000, and the other
for the period between 2001 and 2006. Using coding manuals for both periods, variables
were re-coded and renamed in order to ensure that both versions were consistent. Then,
the two versions were appended to include birth records for all infants born between 1996
and 2006. Data between April 1, 1997 and March 31, 1998, and between April 1, 2000
and March 31, 2001 was missing due to administrative reasons (Ms Danielle Vallerand,
personal communication)
Preparation of Ultrasound Records

121
Since the recording of information in the ultrasound database has remained consistent
over time, it was ready to be merged with the MOND database. Pertinent variable were
renamed to be consistent with naming of variables in the MOND.
Merging of Ultrasound Records and MOND for Construction of the Fetal Weight
Reference (Primary Objective)
The mother’s MRN, and the birth order of the twin are unique identifiers of the twin in
the MOND dataset. Conventionally, the twin that presents first at the time of delivery is
labeled the “A” twin and the one that presents second is labeled the “B” twin. This would
correspond with the first order and second order twins respectively. This would
potentially have been a straightforward method upon which to exactly link the MOND
and ultrasound record for each baby, since the ultrasound records also identify each twin
based on the mother’s MRN and an assigned twin letter which is related to presentation at
the time of the earliest ultrasound
However, in the ultrasound records, the twin letter that is assigned at the earliest
ultrasound follows each fetus as a unique identifier, regardless of its position as viewed
on subsequent ultrasounds. Therefore, a twin that is labeled “A” initially may become the
non-leading twin over time and be labeled the “B” twin when it presents second at birth.
Since this twin letter assignment is made at the earliest ultrasound visit, the likelihood of
a change in position is quite high.
The merge between the MOND and ultrasound records was therefore done using the
mother’s MRN and infant’s birth order as unique identifiers. This resulted in a merged
database in which it was not possible to ascertain whether the ultrasound record of a
particular fetus, in fact, matched its own birth record in the MOND. However, since the
only covariates that were used in analysis were either pregnancy-specific and derived
from the MOND (eg. Chorionicity), or were assigned at the time of each ultrasound in the
ultrasound database (eg. Sex), an exact match between the ultrasound and MOND records
for each baby was unnecessary for the purposes of this analysis.

122
Merging of Ultrasound Records and MOND for the Validation of Formulae to
Estimate Fetal Weight (Secondary Objective)
For the section of the project in which we validated the accuracy of estimated fetal
weight, an exact match was required between the ultrasound and MOND records of each
infant. Since it was not possible to do this for the entire sample, a smaller dataset was
created of those infants for which an exact match was possible based on the following
criteria:
Last estimated fetal weight (EFW)
A last EFW derived from the ultrasound records is also entered in the MOND dataset.
Therefore, a match is presumably possible based on the mother’s MRN and last EFW as a
unique identifier of each infant. However, although the last EFW recorded in the MOND
is derived from the ultrasound records, it is not necessarily derived from the last
conducted ultrasound. Therefore, an algorithm was used that checked the last EFW from
the MOND against the fetal weight estimate from each of the ultrasound visits for each
fetus. The probability that an infant’s last EFW from the MOND incorrectly matched one
of its co-twin’s fetal weight estimates was low. However, in cases where the last EFW
recorded in the MOND was the same for both twins, or where there were data entry
errors in recording the last EFW, this strategy was untenable.
Discordant sex
Additionally, sex was used to match the MOND record of each twin with its ultrasound
record in twin pairs of discordant sex. However, there were fetuses for which there were
entry errors in fetal sex at the time of ultrasound. When these errors were easily
identifiable, they were manually corrected and a match could then be verified.
For this part of the project, infants, for whom we were unable to match the last EFW with
a fetal weight estimate from one of the ultrasounds, and who were either not part of a
discordant sex twin pair, or had either no entry of sex in the ultrasound database or errors
that could not be corrected, were excluded.

123
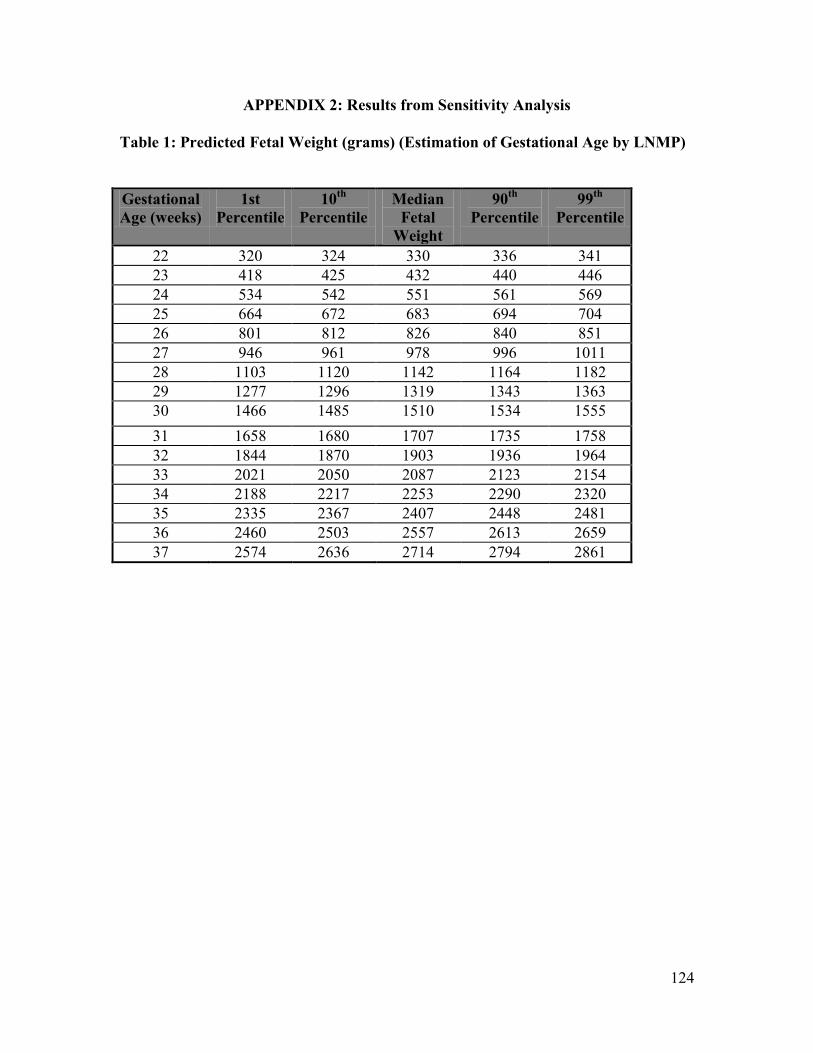
124
APPENDIX 2: Results from Sensitivity Analysis
Table 1: Predicted Fetal Weight (grams) (Estimation of Gestational Age by LNMP)
Gestational
Age (weeks)
1st
Percentile
10th
Percentile
Median
Fetal
Weight
90th
Percentile
99th
Percentile
22 320 324 330 336 341
23 418 425 432 440 446
24 534 542 551 561 569
25 664 672 683 694 704
26 801 812 826 840 851
27 946 961 978 996 1011
28 1103 1120 1142 1164 1182
29 1277 1296 1319 1343 1363
30 1466 1485 1510 1534 1555
31 1658 1680 1707 1735 1758
32 1844 1870 1903 1936 1964
33 2021 2050 2087 2123 2154
34 2188 2217 2253 2290 2320
35 2335 2367 2407 2448 2481
36 2460 2503 2557 2613 2659
37 2574 2636 2714 2794 2861
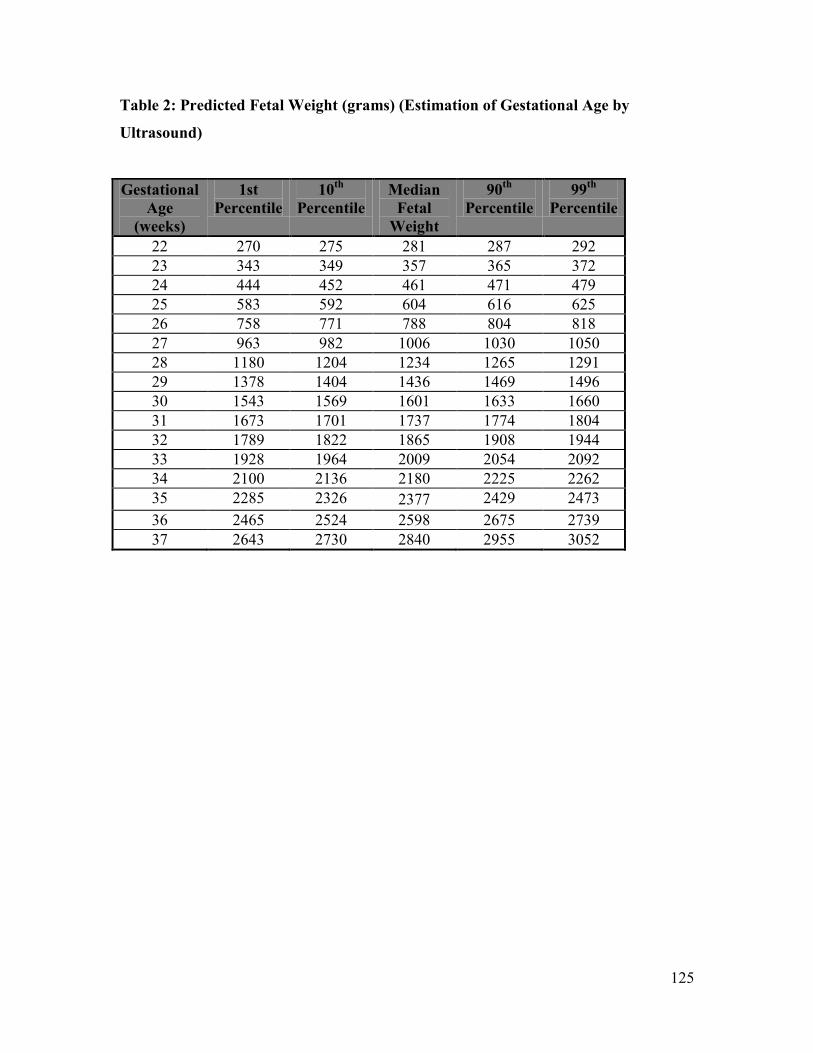
125
Table 2: Predicted Fetal Weight (grams) (Estimation of Gestational Age by
Ultrasound)
Gestational
Age
(weeks)
1st
Percentile
10th
Percentile
Median
Fetal
Weight
90th
Percentile
99th
Percentile
22 270 275 281 287 292
23 343 349 357 365 372
24 444 452 461 471 479
25 583 592 604 616 625
26 758 771 788 804 818
27 963 982 1006 1030 1050
28 1180 1204 1234 1265 1291
29 1378 1404 1436 1469 1496
30 1543 1569 1601 1633 1660
31 1673 1701 1737 1774 1804
32 1789 1822 1865 1908 1944
33 1928 1964 2009 2054 2092
34 2100 2136 2180 2225 2262
35 2285 2326 2377 2429 2473
36 2465 2524 2598 2675 2739
37 2643 2730 2840 2955 3052
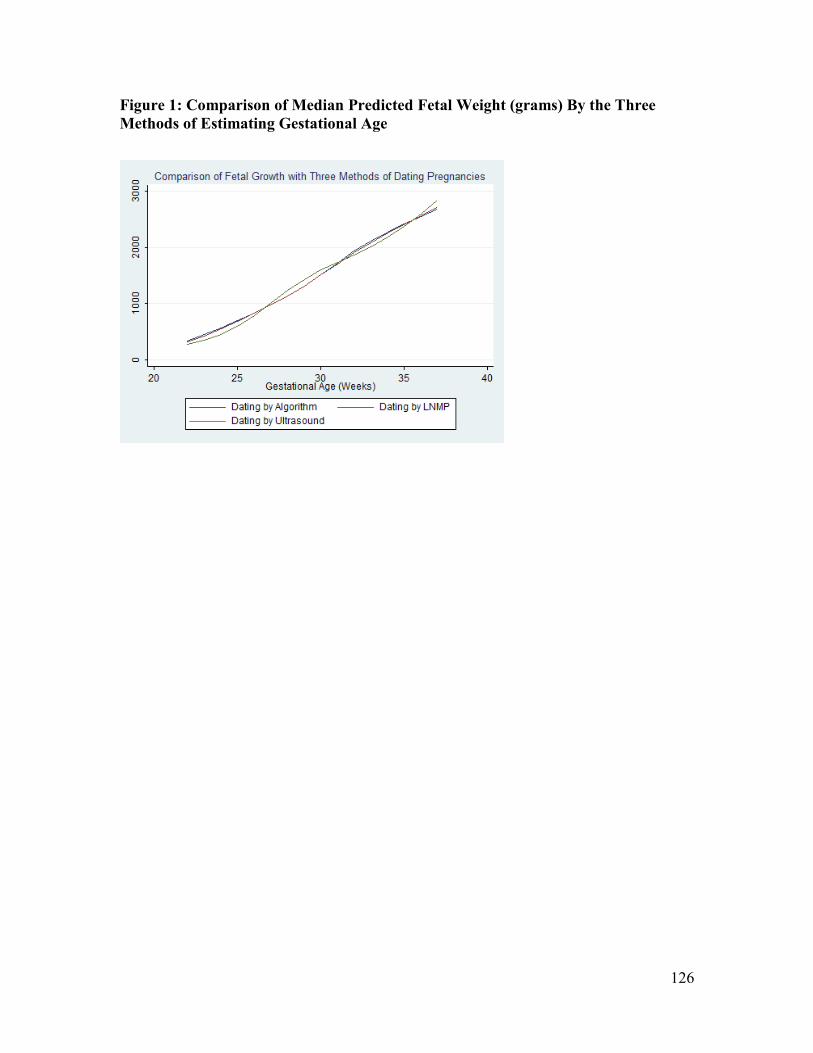
126
Figure 1: Comparison of Median Predicted Fetal Weight (grams) By the Three
Methods of Estimating Gestational Age