a framework for developing early warning score models · for peer review only introduction...
TRANSCRIPT

For peer review only
A Framework for Developing Early Warning Score Models from Vital Signs Data in Hospitals using Ensembles of
Decision Trees (Protocol)
Journal: BMJ Open
Manuscript ID: bmjopen-2015-008699
Article Type: Protocol
Date Submitted by the Author: 05-Jun-2015
Complete List of Authors: Xu, Michael; McMaster University, Bachelor of Health Science Program Tam, Benjamin; McMaster University, Medicine Thabane, Lehana; McMaster University, Department of Clinical
Epidemiology & Biostatistics Fox-Robichaud, Alison; McMaster University, Medicine
<b>Primary Subject Heading</b>:
Health informatics
Secondary Subject Heading: Intensive care, Research methods
Keywords:
Health informatics < BIOTECHNOLOGY & BIOINFORMATICS, Risk management < HEALTH SERVICES ADMINISTRATION & MANAGEMENT, Adult intensive & critical care < INTENSIVE & CRITICAL CARE, Adverse events < THERAPEUTICS
For peer review only - http://bmjopen.bmj.com/site/about/guidelines.xhtml
BMJ Open on A
pril 15, 2020 by guest. Protected by copyright.
http://bmjopen.bm
j.com/
BM
J Open: first published as 10.1136/bm
jopen-2015-008699 on 9 Septem
ber 2015. Dow
nloaded from

For peer review only
A Framework for Developing Early Warning Score Models from Vital Signs Data in Hospitals
using Ensembles of Decision Trees (protocol).
Michael Xu BHSc1,
Benjamin Tam MD2,
Lehana Thabane PhD 3
,
*Alison Fox-Robichaud MSc MD FRCPC2
from the 1Bachelor of Health Sciences Program,
2Department of Medicine and
3Department of
Epidemiology and Biostatistics, McMaster University, Hamilton ON CANADA
*Corresponding Author: DRBI C5-106
237 Barton St East
Hamilton ON, L8L 2X2
Canada
Phone: 1-905-521-2100 X40742
Page 1 of 15
For peer review only - http://bmjopen.bmj.com/site/about/guidelines.xhtml
BMJ Open
123456789101112131415161718192021222324252627282930313233343536373839404142434445464748495051525354555657585960
on April 15, 2020 by guest. P
rotected by copyright.http://bm
jopen.bmj.com
/B
MJ O
pen: first published as 10.1136/bmjopen-2015-008699 on 9 S
eptember 2015. D
ownloaded from

For peer review only
ABSTRACT
Background: Multiple early warning scores have been developed and implemented. The validation of
these scores is usually a comparison of AUROC scores, but there are attempts to validate using
algorithmically generated models with no prior clinical knowledge. We aim to present a framework for
the validation and comparison of the Hamilton early warning score (HEWS) with that generated using
decision tree (DT) methods.
Methods and Analysis: A database of vital signs from two hospitals will be used to generate decision tree
EWS (DT-HEWS). A third early warning score will be generated as well using ensemble based methods.
Missing data will be multiple imputed. Using a composite outcome of code blue, unanticipated Intensive
Care Unit (ICU) admission, and unanticipated death, within a 72-hour period, the performance of NEWS,
DT-HEWS, and the ensemble EWS will be compared using area under the receiver operating
characteristic curve. A sample size was determined from cardiac arrest rates in 2012.
Discussion: The implication of such modelling to generate early warning scores extends beyond
validation of currently existing scores, and into the generation of new scores customized to a hospital’s
needs. At present, the development of a new score requires significant involvement from clinicians to
generate and continually evaluate the efficacy of a score. Use of a computer generated algorithms can
be the most effective score at classifying patients, reducing costs associated with early warning score
maintenance and generation.
Ethics and dissemination:
Ethics approval was received from the Hamilton Integrated Research Ethics Board. Results from this
validation will be published when complete, this protocol has been presented in abstract form at an
international conference.
Page 2 of 15
For peer review only - http://bmjopen.bmj.com/site/about/guidelines.xhtml
BMJ Open
123456789101112131415161718192021222324252627282930313233343536373839404142434445464748495051525354555657585960
on April 15, 2020 by guest. P
rotected by copyright.http://bm
jopen.bmj.com
/B
MJ O
pen: first published as 10.1136/bmjopen-2015-008699 on 9 S
eptember 2015. D
ownloaded from

For peer review only
STRENGTHS:
1. Novel approach with the use of ‘big data’.
2. Validation of a new warning score in comparison to previous published scores
LIMITATIONS:
1. The need to impute data for missing vital signs
2. The relatively low event rate for the composite endpoint, particularly in the setting of a mature
rapid response system.
Page 3 of 15
For peer review only - http://bmjopen.bmj.com/site/about/guidelines.xhtml
BMJ Open
123456789101112131415161718192021222324252627282930313233343536373839404142434445464748495051525354555657585960
on April 15, 2020 by guest. P
rotected by copyright.http://bm
jopen.bmj.com
/B
MJ O
pen: first published as 10.1136/bmjopen-2015-008699 on 9 S
eptember 2015. D
ownloaded from

For peer review only
INTRODUCTION
Deterioration of patients’ condition in hospitals is frequently preceded by abnormal vitals or other
physiological signs.(1) The failure of the clinicians and staff responsible for the care of the patient to
recognize and intervene in the deterioration of a patient can result in increased risk of death or
cardiopulmonary arrest. The failure to recognize deterioration of a patient can also result in avoidable
and unwanted admissions to intensive care units. Hospitals are constrained by their resources with
regards to how they can manage patient care; with few ICU beds available, it is preferable that
avoidable admissions to the unit are intervened and treated appropriately prior to severe deterioration
of condition.
Early warning scores (EWS) vary in the design and inclusion of which physiological parameters are
assessed. At the most simplistic level, they can be thought of as models that assess the risk of mortality
following a given set of vitals. EWS usage has been on the rise, and have been widely implemented in
different forms with Subbe’s Modified EWS(2), VitalPac EWS(3), the NHS’ National EWS(4), and most
recently the Bedside Paediatric EWS(5). This was accomplished through the assignment of a score to the
patient’s physiological parameters to evaluate how ill a patient is. The rational for such a score is earlier
evaluation of patient prior to deterioration. Categorization of the deviation of a patient’s physiological
parameters may help to guide care and intervention.
The Hamilton Early Warning Score (Figure 1) uses a combination of systolic blood pressure, pulse rate,
respiratory rate, temperature, and AVPU score in combination with the Confusion Assessment Method
to assess delirium. The score was developed based on review of published scores and consensus from an
interprofessional group of health experts in acute care medicine. Like other scores, HEWS was
developed using clinical judgements and a trial and error process to find an optimal threshold.
Page 4 of 15
For peer review only - http://bmjopen.bmj.com/site/about/guidelines.xhtml
BMJ Open
123456789101112131415161718192021222324252627282930313233343536373839404142434445464748495051525354555657585960
on April 15, 2020 by guest. P
rotected by copyright.http://bm
jopen.bmj.com
/B
MJ O
pen: first published as 10.1136/bmjopen-2015-008699 on 9 S
eptember 2015. D
ownloaded from

For peer review only
Using clinical judgement and trial and error methods may miss subtle trends or patterns in a patient’s
parameters that indicate deterioration. These trends or patterns can be noticed or detected through the
use of computer algorithms. Without appropriate involvement from clinical judgement however, a
computer model may develop a score that is either too complex to be used or lacks clinical relevance to
patient care. In this protocol we adopt the notion that a model needs to be guided by clinical
judgement, but at the same time clinical judgement may not evolve fast enough to detect certain cases
that would otherwise be undetected by a conventional EWS. Patient populations change, and the
demands of healthcare from a community may change as well, so it is sensible that an EWS should
evolve with the patient population.
OBJECTIVES
The primary objective of this study will be validate the current Hamilton Early Warning Score (HEWS)
through the development of a EWS using decision tree methods. The secondary objective will be to
compare the existing HEWS, which evaluates each vital independently, with a second decision tree
generated score that tracks all vitals and evaluates them in relation to each other. This secondary
objective will allow us to compare the predictive performance of the decision tree model with that of
the current existing HEWS, and determine, if the decision tree model has superior predictive ability,
which vitals take priority when determining patient deterioration.
DECISION TREES
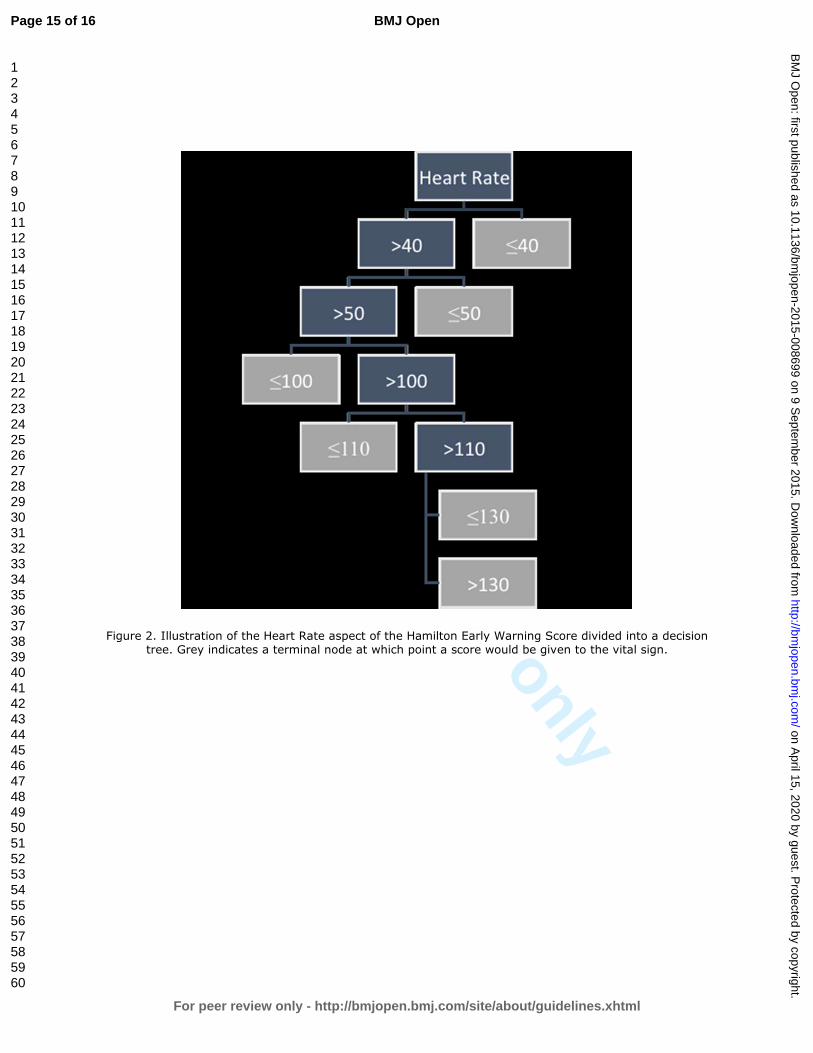
A decision tree attempts to classify data items by recursively posing a series of questions about
parameters and features that describe the items.(6) A graphic example of this can be seen in Figure 2
where a series of yes/no questions are used to sort data into nodes. The advantage to such a model is
that it is more interpretable and understandable than other classifiers such as neural networks or
support vector machines, as simple questions are asked and answered. Decision trees have been
Page 5 of 15
For peer review only - http://bmjopen.bmj.com/site/about/guidelines.xhtml
BMJ Open
123456789101112131415161718192021222324252627282930313233343536373839404142434445464748495051525354555657585960
on April 15, 2020 by guest. P
rotected by copyright.http://bm
jopen.bmj.com
/B
MJ O
pen: first published as 10.1136/bmjopen-2015-008699 on 9 S
eptember 2015. D
ownloaded from

For peer review only
successfully used to shape guidelines regarding decision making processes.(7) They also possess
flexibility with regards to the types of data they can handle, and once constructed can classify new items
quickly.
Building trees
Decision trees are a compilation of questions that seek to classify events with rules. A series of good
questions will separate the dataset into subsets that are nearly homogenous, which can then be
separated again into classes. The goal is to have as little variance as possible between each class either
through reduction of entropy or Gini index, and thus increase in information gain.(8)
Decision trees work from a top down approach, where questions are continually selected recursively to
form and smaller subsets. A crucial step in the building of a decision tree is determining where and how
to limit the complexity of the learned trees. This is necessary to avoid the decision tree over fitting to its
training data.(9)
Boosting, bagging, and random forests
A collection of decision trees can improve on the accuracy of a single decision tree by combining the
results of the collection. These collections are sometimes among the best performing at classification
tasks.(10)
Boosting creates multiple decision trees that have different questions regarding the same dataset and
same features. Upon generation of a tree that misclassifies an event, a new tree is generated that
weighs the relative importance of that event more heavily. This is repeated multiple times until trees are
combined and evaluated.
Bagging involves bootstrapping the data to decrease variance in the population by producing multisets
of the original data. Using these multisets, trees are generated and through a process of voting there
Page 6 of 15
For peer review only - http://bmjopen.bmj.com/site/about/guidelines.xhtml
BMJ Open
123456789101112131415161718192021222324252627282930313233343536373839404142434445464748495051525354555657585960
on April 15, 2020 by guest. P
rotected by copyright.http://bm
jopen.bmj.com
/B
MJ O
pen: first published as 10.1136/bmjopen-2015-008699 on 9 S
eptember 2015. D
ownloaded from

For peer review only
classification rules are generated. Predictive value of the rules may not increase through this method,
but a reduction in variance of predictions can occur (10).
METHODS
The dataset for both the development and testing of the decision tree score will be retrospectively
acquired from a continuous set of electronic vitals and patient notes, of all patients who had a stay on
medical or surgical wards between the dates of January 1, 2014 to September 30, 2014, at two teaching
hospitals that form part of Hamilton Health Sciences in Hamilton, Ontario. One of the sites was in the
process of implementing an EWS, and the other has an established EWS with a rapid response team. The
sample size calculation was based on our analysis for code blue rates in 2012. To determine a relative
risk reduction of 50% with a power of 80% the sample size needed is 17151 patient days. This
approximates to 6 months of consecutive patient enrolment. The dataset will be further subdivided into
two sections, the first six months of data will be used to train the decision tree and the latter three
months will isolated as a testing set. The decision trees will be generated using the sci-kit package in
Python, documentation regarding specific usage can be found at http://scikit-
learn.org/stable/documentation.html.
The outcome predicted by the decision tree model will be a composite outcome containing
unanticipated ICU transfer, code blue, and unanticipated patient death. The predictor vitals to be
measured and extracted from the electronic charting system are Heart Rate, Respiratory Rate, Systolic
Blood Pressure, Level of Consciousness, Confusion according to CAM, and Temperature. These vitals
were chosen as they’re the most commonly tracked vitals when nurses assess patients, as well these are
the most common vitals included in other early warning scores.(3)(11)
The difficulty of a computer model lies in being able to translate it back into a robust and simple tool
that clinicians can both understand and want to use to support their judgement, while at the same time
Page 7 of 15
For peer review only - http://bmjopen.bmj.com/site/about/guidelines.xhtml
BMJ Open
123456789101112131415161718192021222324252627282930313233343536373839404142434445464748495051525354555657585960
on April 15, 2020 by guest. P
rotected by copyright.http://bm
jopen.bmj.com
/B
MJ O
pen: first published as 10.1136/bmjopen-2015-008699 on 9 S
eptember 2015. D
ownloaded from

For peer review only
maintaining a high degree of accuracy. Selection of the ideal form of analysis is therefore crucial; too
simple a model and the accuracy of the model suffers, too complex and it will be too complicated to
implement in a clinical environment. In addition robustness and accuracy must also be tested through
the external validation of the model. This can be achieved through either more patient data being
collected or the process of bootstrapping, the former providing more data and the latter generating
simulated datasets from the initial set of observations. In the context of this protocol, boosting will be
used as the approach to increasing the value of decision trees as it combines clinical judgement through
the use of pre-selected features, and is more easily interpreted in the form of one final decision tree
rather than a voting system.(12)
Planned statistical analysis
Both HEWS and the decision tree scores will be evaluated to determine their ability to discriminate
patients that are at risk of the above outcomes within a 72hr period following observation of an
abnormal vital sign. The ability for both to do this will be evaluated using the area under the receiver
operating curve characteristic (AUROC) curve. AUROC values for the generated decision tree will be
compared to that of the AUROC for HEWS. An efficiency curve will then be plotted comparing the
percentage of observations that experienced the composite outcome with the percentage of
observations that exceeded or were at a given score. External validation will be determined through the
application of the model to the testing data, and internal validation through comparison to the original
training data.
Missing data will be dealt with using multiple imputation when possible, specifically the MICE
method.(13)
Page 8 of 15
For peer review only - http://bmjopen.bmj.com/site/about/guidelines.xhtml
BMJ Open
123456789101112131415161718192021222324252627282930313233343536373839404142434445464748495051525354555657585960
on April 15, 2020 by guest. P
rotected by copyright.http://bm
jopen.bmj.com
/B
MJ O
pen: first published as 10.1136/bmjopen-2015-008699 on 9 S
eptember 2015. D
ownloaded from

For peer review only
DISCUSSION
Currently most EWSs, including HEWS, were developed using a trial and error approach through
roundtable discussions such as described by the National Early Warning Score Development and
Implementation Group responsible for the development of NEWS.(11) Decision trees have been used by
Badriyah et al. to validate NEWS, though a key difference between the proposed method and the one
conducted by Badriyah will be the generation of a decision tree that encompasses all vitals rather than a
separate tree per vital.(14) The use of decision trees was a choice made based on the relatively
robustness of its classification ability as well as the clarity and ease of translation between model and a
rule set that can be interpreted by clinical staff. Other more complex models, such as support vector
machining, may be more accurate but generated rule sets that are difficult to translate and interpret.
The second decision tree to be generated using ensemble based methods and which accounts for all
vitals in one tree can help to determine if priority or precedence needs to be given to certain vitals over
others, at the moment all vitals in all EWSs are weighed equally. One limitation of the current study will
be the missing values for vitals at the site where EWS implementation was ongoing, as vitals were poorly
charted prior to score introduction.
We anticipate having the HEWS score to be very similar in performance and structure to the first
decision tree which evaluates all vitals independently, given that both use the same predictors. Given
that prior studies comparing the performance of a single decision tree to ensemble based decision trees
have favoured the predictive ability of the latter, we believe that the ensemble based trees will provide
a more accurate predictive ability.(15) The potential clinical use for either method used to generated
decision tree EWSs, would be providing a relatively low cost and quick method of developing an EWS or
for the evaluation of a currently in place EWS.
Page 9 of 15
For peer review only - http://bmjopen.bmj.com/site/about/guidelines.xhtml
BMJ Open
123456789101112131415161718192021222324252627282930313233343536373839404142434445464748495051525354555657585960
on April 15, 2020 by guest. P
rotected by copyright.http://bm
jopen.bmj.com
/B
MJ O
pen: first published as 10.1136/bmjopen-2015-008699 on 9 S
eptember 2015. D
ownloaded from

For peer review only
CONTRIBUTORSHIP STATEMENT:
Michael Xu, designed the database for vital signs collection, wrote the statistical analysis plan,
developed the methodology, drafted and revised the paper, and developed the idea behind the
framework. Benjamin Tam, filed for ethics and funding, revised the paper and contributed to the
development of the methodology of the framework. Lehana Thabane, provided statistical oversight and
guidance, and revised the paper. Alison Fox-Robichaud, revised and drafted the draft paper, as well as
filing for ethics and funding.
COMPETING INTERESTS:
No conflicts of interest to declare.
FUNDING:
This project was funded by a residency safety grants from Hamilton Health Sciences and the Department
of Medicine, McMaster University.
DATA SHARING STATEMENT:
At this moment no plans are in place to share data from the proposed collection, current ethics approval
does not include plans for sharing, though this may be amended.
Page 10 of 15
For peer review only - http://bmjopen.bmj.com/site/about/guidelines.xhtml
BMJ Open
123456789101112131415161718192021222324252627282930313233343536373839404142434445464748495051525354555657585960
on April 15, 2020 by guest. P
rotected by copyright.http://bm
jopen.bmj.com
/B
MJ O
pen: first published as 10.1136/bmjopen-2015-008699 on 9 S
eptember 2015. D
ownloaded from

For peer review only
REFERENCES:
1 Goldhill DR, McNarry AF, Mandersloot G, et al. A physiologically-based early warning score for ward
patients: the association between score and outcome. Anaesthesia. 2005;60:547–53.
2 Subbe CP, Kruger M, Rutherford P, et al. Validation of a modified Early Warning Score in medical
admissions. QJM Int J Med. 2001;94:521–6.
3 Prytherch DR, Smith GB, Schmidt PE, et al. ViEWS—Towards a national early warning score for
detecting adult inpatient deterioration. Resuscitation. 2010;81:932–7.
4 McGinley A, Pearse RM. A national early warning score for acutely ill patients. BMJ. 2012;345:e5310.
5 Parshuram CS, Hutchison J, Middaugh K. Development and initial validation of the Bedside Paediatric
Early Warning System score. Crit Care. 2009;13:1–10.
6 Breiman L. Random Forests. Mach Learn. 2001;45:5–32.
7 Quinlan JR. Generating Production Rules From Decision Trees. Proceedings of the 10th
International
Joint Conference on Artificial Intelligence 1987;1:304-307
8 Quinlan JR. Induction of Decision Trees. Mach Learn. 1986;1:81–106.
9 Esposito F, Malerba D, Semeraro G, et al. A comparative analysis of methods for pruning decision
trees. IEEE Trans Pattern Anal Mach Intell. 1997;19:476–91.
10 Caruana R, Niculescu-Mizil A. An Empirical Comparison of Supervised Learning Algorithms.
Proceedings of the 23rd International Conference on Machine Learning [Internet]. New York, NY, USA:
ACM; 2006 [cited 2014 Nov 9]. p. 161–8. Available from: http://doi.acm.org/10.1145/1143844.1143865
11 Smith GB, Prytherch DR, Meredith P, et al. The ability of the National Early Warning Score (NEWS) to
discriminate patients at risk of early cardiac arrest, unanticipated intensive care unit admission, and
death. Resuscitation. 2013; 84:465–70.
12 Schapire RE, Singer Y. Improved Boosting Algorithms Using Confidence-rated Predictions. Mach
Learn. 1999;37:297–336.
13 White IR, Royston P, Wood AM. Multiple imputation using chained equations: Issues and guidance
for practice. Stat Med. 2011;30:377–99.
14 Badriyah T, Briggs JS, Meredith P, et al. Decision-tree early warning score (DTEWS) validates the
design of the National Early Warning Score (NEWS). Resuscitation. 2014;85:418–23.
15 Banfield RE, Hall LO, Bowyer KW, et al. A Comparison of Decision Tree Ensemble Creation
Techniques. IEEE Trans Pattern Anal Mach Intell. 2007;29:173–80.
Page 11 of 15
For peer review only - http://bmjopen.bmj.com/site/about/guidelines.xhtml
BMJ Open
123456789101112131415161718192021222324252627282930313233343536373839404142434445464748495051525354555657585960
on April 15, 2020 by guest. P
rotected by copyright.http://bm
jopen.bmj.com
/B
MJ O
pen: first published as 10.1136/bmjopen-2015-008699 on 9 S
eptember 2015. D
ownloaded from

For peer review only
FIGURE LEGENDS:
Figure 1. Hamilton Early Warning Score (HEWS) limits and vitals used to assess patient condition
Figure 2. Illustration of the Heart Rate aspect of the Hamilton Early Warning Score divided into a
decision tree. Grey indicates a terminal node at which point a score would be given to the vital sign.
Page 12 of 15
For peer review only - http://bmjopen.bmj.com/site/about/guidelines.xhtml
BMJ Open
123456789101112131415161718192021222324252627282930313233343536373839404142434445464748495051525354555657585960
on April 15, 2020 by guest. P
rotected by copyright.http://bm
jopen.bmj.com
/B
MJ O
pen: first published as 10.1136/bmjopen-2015-008699 on 9 S
eptember 2015. D
ownloaded from

For peer review only
Figure 1. Hamilton Early Warning Score (HEWS) limits and vitals used to assess patient condition
Page 13 of 15
For peer review only - http://bmjopen.bmj.com/site/about/guidelines.xhtml
BMJ Open
123456789101112131415161718192021222324252627282930313233343536373839404142434445464748495051525354555657585960
on April 15, 2020 by guest. P
rotected by copyright.http://bm
jopen.bmj.com
/B
MJ O
pen: first published as 10.1136/bmjopen-2015-008699 on 9 S
eptember 2015. D
ownloaded from

For peer review only
Figure 2. Illustration of the Heart Rate aspect of the Hamilton Early Warning Score divided into a decision tree. Grey indicates a terminal node at which point a score would be given to the vital sign.
Page 14 of 15
For peer review only - http://bmjopen.bmj.com/site/about/guidelines.xhtml
BMJ Open
123456789101112131415161718192021222324252627282930313233343536373839404142434445464748495051525354555657585960
on April 15, 2020 by guest. P
rotected by copyright.http://bm
jopen.bmj.com
/B
MJ O
pen: first published as 10.1136/bmjopen-2015-008699 on 9 S
eptember 2015. D
ownloaded from
For peer review only
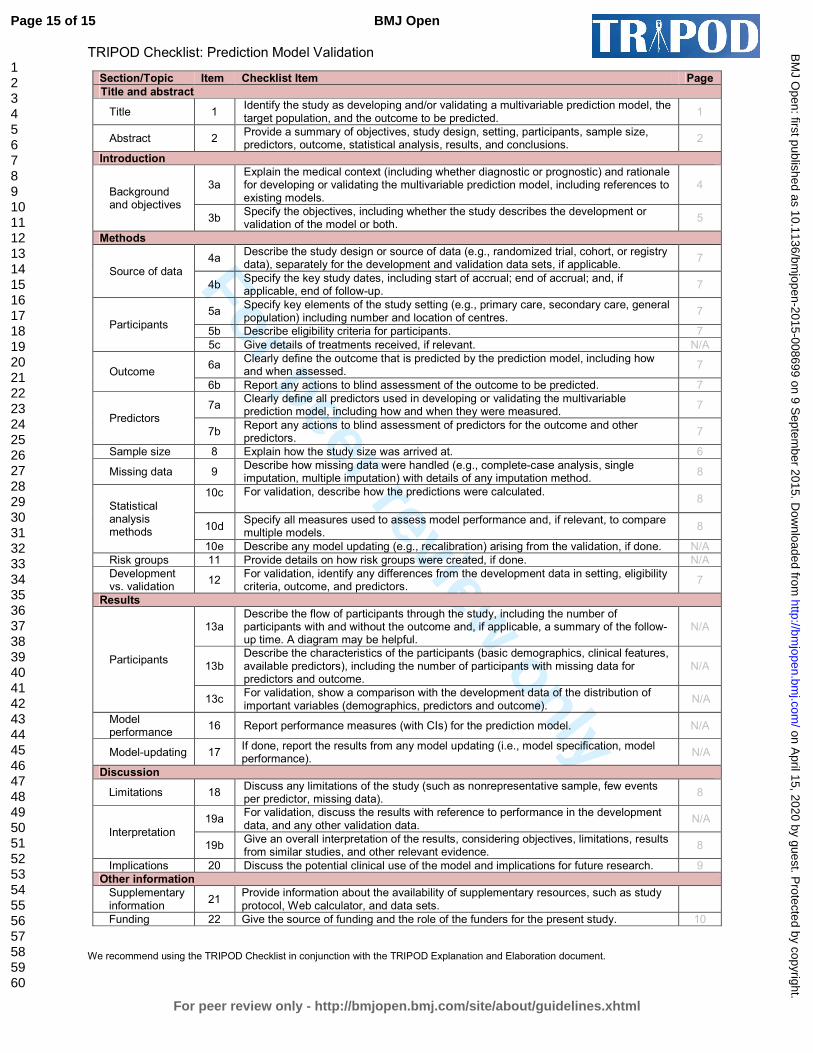
TRIPOD Checklist: Prediction Model Validation
Section/Topic Item Checklist Item Page
Title and abstract
Title 1 Identify the study as developing and/or validating a multivariable prediction model, the target population, and the outcome to be predicted.
1
Abstract 2 Provide a summary of objectives, study design, setting, participants, sample size, predictors, outcome, statistical analysis, results, and conclusions.
2
Introduction
Background and objectives
3a Explain the medical context (including whether diagnostic or prognostic) and rationale for developing or validating the multivariable prediction model, including references to existing models.
4
3b Specify the objectives, including whether the study describes the development or validation of the model or both.
5
Methods
Source of data
4a Describe the study design or source of data (e.g., randomized trial, cohort, or registry data), separately for the development and validation data sets, if applicable.
7
4b Specify the key study dates, including start of accrual; end of accrual; and, if applicable, end of follow-up.
7
Participants
5a Specify key elements of the study setting (e.g., primary care, secondary care, general population) including number and location of centres.
7
5b Describe eligibility criteria for participants. 7
5c Give details of treatments received, if relevant. N/A
Outcome 6a
Clearly define the outcome that is predicted by the prediction model, including how and when assessed.
7
6b Report any actions to blind assessment of the outcome to be predicted. 7
Predictors
7a Clearly define all predictors used in developing or validating the multivariable prediction model, including how and when they were measured.
7
7b Report any actions to blind assessment of predictors for the outcome and other predictors.
7
Sample size 8 Explain how the study size was arrived at. 6
Missing data 9 Describe how missing data were handled (e.g., complete-case analysis, single imputation, multiple imputation) with details of any imputation method.
8
Statistical analysis methods
10c For validation, describe how the predictions were calculated. 8
10d Specify all measures used to assess model performance and, if relevant, to compare multiple models.
8
10e Describe any model updating (e.g., recalibration) arising from the validation, if done. N/A
Risk groups 11 Provide details on how risk groups were created, if done. N/A
Development vs. validation
12 For validation, identify any differences from the development data in setting, eligibility criteria, outcome, and predictors.
7
Results
Participants
13a Describe the flow of participants through the study, including the number of participants with and without the outcome and, if applicable, a summary of the follow-up time. A diagram may be helpful.
N/A
13b Describe the characteristics of the participants (basic demographics, clinical features, available predictors), including the number of participants with missing data for predictors and outcome.
N/A
13c For validation, show a comparison with the development data of the distribution of important variables (demographics, predictors and outcome).
N/A
Model performance
16 Report performance measures (with CIs) for the prediction model. N/A
Model-updating 17 If done, report the results from any model updating (i.e., model specification, model performance).
N/A
Discussion
Limitations 18 Discuss any limitations of the study (such as nonrepresentative sample, few events per predictor, missing data).
8
Interpretation
19a For validation, discuss the results with reference to performance in the development data, and any other validation data.
N/A
19b Give an overall interpretation of the results, considering objectives, limitations, results from similar studies, and other relevant evidence.
8
Implications 20 Discuss the potential clinical use of the model and implications for future research. 9
Other information
Supplementary information
21 Provide information about the availability of supplementary resources, such as study protocol, Web calculator, and data sets.
Funding 22 Give the source of funding and the role of the funders for the present study. 10
We recommend using the TRIPOD Checklist in conjunction with the TRIPOD Explanation and Elaboration document.
Page 15 of 15
For peer review only - http://bmjopen.bmj.com/site/about/guidelines.xhtml
BMJ Open
123456789101112131415161718192021222324252627282930313233343536373839404142434445464748495051525354555657585960
on April 15, 2020 by guest. P
rotected by copyright.http://bm
jopen.bmj.com
/B
MJ O
pen: first published as 10.1136/bmjopen-2015-008699 on 9 S
eptember 2015. D
ownloaded from

For peer review only
A Protocol for Developing Early Warning Score Models from Vital Signs Data in Hospitals using Ensembles of Decision
Trees.
Journal: BMJ Open
Manuscript ID: bmjopen-2015-008699.R1
Article Type: Protocol
Date Submitted by the Author: 12-Aug-2015
Complete List of Authors: Xu, Michael; McMaster University, Bachelor of Health Science Program Tam, Benjamin; McMaster University, Medicine Thabane, Lehana; McMaster University, Department of Clinical
Epidemiology & Biostatistics Fox-Robichaud, Alison; McMaster University, Medicine
<b>Primary Subject Heading</b>:
Health informatics
Secondary Subject Heading: Intensive care, Research methods
Keywords:
Health informatics < BIOTECHNOLOGY & BIOINFORMATICS, Risk management < HEALTH SERVICES ADMINISTRATION & MANAGEMENT, Adult intensive & critical care < INTENSIVE & CRITICAL CARE, Adverse events < THERAPEUTICS
For peer review only - http://bmjopen.bmj.com/site/about/guidelines.xhtml
BMJ Open on A
pril 15, 2020 by guest. Protected by copyright.
http://bmjopen.bm
j.com/
BM
J Open: first published as 10.1136/bm
jopen-2015-008699 on 9 Septem
ber 2015. Dow
nloaded from

For peer review only
A Protocol for Developing Early Warning Score Models from Vital Signs Data in Hospitals
using Ensembles of Decision Trees.
Michael Xu BHSc1,
Benjamin Tam MD2,
Lehana Thabane PhD 3
,
*Alison Fox-Robichaud MSc MD FRCPC2
from the 1Bachelor of Health Sciences Program,
2Department of Medicine and
3Department of
Epidemiology and Biostatistics, McMaster University, Hamilton ON CANADA
*Corresponding Author: DRBI C5-106
237 Barton St East
Hamilton ON, L8L 2X2
Canada
Phone: 1-905-521-2100 X40742
Page 1 of 16
For peer review only - http://bmjopen.bmj.com/site/about/guidelines.xhtml
BMJ Open
123456789101112131415161718192021222324252627282930313233343536373839404142434445464748495051525354555657585960
on April 15, 2020 by guest. P
rotected by copyright.http://bm
jopen.bmj.com
/B
MJ O
pen: first published as 10.1136/bmjopen-2015-008699 on 9 S
eptember 2015. D
ownloaded from

For peer review only
ABSTRACT
Introduction: Multiple early warning scores (EWS) have been developed and implemented to reduce
cardiac arrests on hospital wards. Case control observational studies that generate an area under the
receiver operator curve (AUROC) are the usual validation method, but investigators have also generated
EWS with algorithms with no prior clinical knowledge. We present a protocol for the validation and
comparison of our local Hamilton early warning score (HEWS) with that generated using decision tree
(DT) methods.
Methods and Analysis: A database of electronically recorded vital signs from 4 medical and 4 surgical
wards will be used to generate decision tree EWS (DT-HEWS). A third early warning score will be
generated using ensemble-based methods. Missing data will be multiple imputed. For a relative risk
reduction of 50% in our composite outcome (cardiac or respiratory arrest, unanticipated Intensive Care
Unit (ICU) admission, or hospital death) with a power of 80%, we calculated a sample size of 17151
patient days based on our cardiac arrest rates in 2012. The performance of the National EWS (NEWS),
DT-HEWS, and the ensemble EWS will be compared using AUROC.
Ethics and dissemination: Ethics approval was received from the Hamilton Integrated Research Ethics
Board (#13-724-C). The vital signs and associated outcomes are stored in a database on our secure
hospital server. Preliminary dissemination of this protocol was presented in abstract form at an
international critical care meeting. Final results of this analysis will be used to improve on the existing
HEWS and will be shared through publication and presentation at critical care meetings.
Page 2 of 16
For peer review only - http://bmjopen.bmj.com/site/about/guidelines.xhtml
BMJ Open
123456789101112131415161718192021222324252627282930313233343536373839404142434445464748495051525354555657585960
on April 15, 2020 by guest. P
rotected by copyright.http://bm
jopen.bmj.com
/B
MJ O
pen: first published as 10.1136/bmjopen-2015-008699 on 9 S
eptember 2015. D
ownloaded from

For peer review only
STRENGTHS:
1. Novel approach with the use of ‘big data’.
2. Validation of a new warning score in comparison to previous published scores.
LIMITATIONS:
1. The need to impute data for missing vital signs
2. The relatively low event rate for the composite endpoint, particularly in the setting of a mature
rapid response system.
Page 3 of 16
For peer review only - http://bmjopen.bmj.com/site/about/guidelines.xhtml
BMJ Open
123456789101112131415161718192021222324252627282930313233343536373839404142434445464748495051525354555657585960
on April 15, 2020 by guest. P
rotected by copyright.http://bm
jopen.bmj.com
/B
MJ O
pen: first published as 10.1136/bmjopen-2015-008699 on 9 S
eptember 2015. D
ownloaded from

For peer review only
INTRODUCTION
Deterioration of patients’ condition in hospitals is frequently preceded by abnormal vitals or other
physiological signs.(1) The failure of clinicians and staff responsible for the care of the patient to
recognize and intervene in the deterioration of a patient can result in increased risk of death or
cardiopulmonary arrest. The failure to recognize deterioration of a patient can also result in avoidable
and unwanted admissions to ICUs. Hospitals are constrained by their resources with regards to how they
can manage patient care; with few ICU beds available, it is preferable that avoidable admissions to the
unit are intervened and treated appropriately prior to severe deterioration of condition.
Early warning scores (EWS) vary in the design and inclusion of which physiological parameters are
assessed. At the most simplistic level, they can be thought of as models that assess the risk of mortality
following a given set of vitals. EWS usage has been on the rise, and have been widely implemented in
different forms with Subbe’s Modified EWS(2), VitalPac EWS(3), the NHS’ National EWS(4), and most
recently the Bedside(5) Paediatric EWS. This was accomplished through the assignment of a score to the
patient’s physiological parameters to evaluate how ill a patient is. The rationale for such a score is
earlier evaluation of the patient prior to deterioration. Categorization of the deviation of a patient’s
physiological parameters may help to guide care and intervention.
The Hamilton Early Warning Score (Figure 1) uses a combination of systolic blood pressure, heart rate,
respiratory rate, temperature, and Alert-Voice-Pain-Unresponsive (AVPU) scale in combination with
Confusion Assessment Method (CAM) delirium. The score was developed based on review of published
scores and consensus from an interprofessional group of health experts in acute care medicine. Like
other scores, HEWS was developed based off of clinical judgements and a trial and error process to find
an optimal threshold.
Page 4 of 16
For peer review only - http://bmjopen.bmj.com/site/about/guidelines.xhtml
BMJ Open
123456789101112131415161718192021222324252627282930313233343536373839404142434445464748495051525354555657585960
on April 15, 2020 by guest. P
rotected by copyright.http://bm
jopen.bmj.com
/B
MJ O
pen: first published as 10.1136/bmjopen-2015-008699 on 9 S
eptember 2015. D
ownloaded from

For peer review only
The limitation to this is that clinical judgement and trial and error methods may miss subtle trends or
patterns in a patient’s parameters that indicate deterioration. These trends or patterns can be noticed
or detected through the use of computer algorithms. Without appropriate involvement from clinical
judgement though, a computer model may develop a score that is either too complex to be used or
lacks clinical relevance to patient care. In this protocol we adopt the notion that a model needs to be
guided by clinical judgement, but at the same time clinical judgement may not evolve fast enough to
detect certain cases that would otherwise be undetected by a conventional EWS. Patient populations
change, and the demands of healthcare from a community may change as well, so it is sensible that a
EWS should evolve with the patient population.
OBJECTIVES
The primary objective of this study will be to validate the current Hamilton Early Warning Score (HEWS)
through the development of an EWS using decision tree methods. The secondary objective will be to
compare the existing HEWS, which evaluates each vital sign independently, with a second decision tree
generated score that tracks all vitals and evaluates them in relation to each other. This secondary
objective will allow us to compare the predictive performance of the decision tree model with that of
the current existing HEWS, and determine, if the decision tree model has superior predictive ability,
which vitals take priority when determining patient deterioration.
DECISION TREES
A decision tree attempts to classify data items by recursively posing a series of questions about
parameters and features that describe the items.(6) A graphic example of this can be seen in Figure 2
where a series of yes/no questions are used to sort data into nodes. The advantage to such a model is
that it is more interpretable and understandable than other classifiers such as neural networks or
support vector machines, as simple questions are asked and answered. Decision trees have been
Page 5 of 16
For peer review only - http://bmjopen.bmj.com/site/about/guidelines.xhtml
BMJ Open
123456789101112131415161718192021222324252627282930313233343536373839404142434445464748495051525354555657585960
on April 15, 2020 by guest. P
rotected by copyright.http://bm
jopen.bmj.com
/B
MJ O
pen: first published as 10.1136/bmjopen-2015-008699 on 9 S
eptember 2015. D
ownloaded from

For peer review only
successfully used to shape guidelines regarding decision making processes.(7) They also possess
flexibility with regards to the types of data they can handle, and once constructed can classify new items
quickly.
Building trees
Decision trees are a compilation of questions that seek to classify events with rules. A series of good
questions will separate the dataset into subsets that are nearly homogenous, which can then be
separated again into classes. The goal is to have as little variance as possible between each class either
through reduction of entropy or Gini index, and thus increase in information gain.(8)
Decision trees work from a top down approach, where questions are continually selected recursively to
form smaller subsets. A crucial step in the building of a decision tree is determining where and how to
limit the complexity of the learned trees. This is necessary to avoid the decision tree over fitting to its
training data.(9)
Boosting, bagging, and random forests
A collection of decision trees can improve on the accuracy of a single decision tree by combining the
results of the collection. These collections are sometimes among the best performing at classification
tasks.(10)
Boosting creates multiple decision trees that have different questions regarding the same dataset and
same features. Upon generation of a tree that misclassifies an event, a new tree is generated that
weighs the relative importance of that event more heavily. This is repeated multiple times until trees are
combined and evaluated.
Bagging involves bootstrapping the data to decrease variance in the population by producing multisets
of the original data. Using these multisets, trees are generated and through a process of voting their
Page 6 of 16
For peer review only - http://bmjopen.bmj.com/site/about/guidelines.xhtml
BMJ Open
123456789101112131415161718192021222324252627282930313233343536373839404142434445464748495051525354555657585960
on April 15, 2020 by guest. P
rotected by copyright.http://bm
jopen.bmj.com
/B
MJ O
pen: first published as 10.1136/bmjopen-2015-008699 on 9 S
eptember 2015. D
ownloaded from

For peer review only
classification rules are generated. Predictive value of the rules may not increase through this method,
but a reduction in variance of predictions can occur (10).
METHODS
The dataset for both the development and testing of the decision tree score will be retrospectively
acquired from a continuous set of electronic vitals and patient notes, of all patients who had a stay on
medical or surgical wards between the dates of January 1, 2014 to September 30, 2014, at two sites in
Hamilton, Ontario. Ethics approval was received from the Hamilton Integrated Research Ethics Board
(#13-724-C).
One of the sites was in the process of implementing an EWS, and the other has an established EWS with
rapid response team. The sample size calculation was based on our analysis for code blue rates in 2012.
We found the code rate to be 1.57/1000 patient days at the first site and 2.41/1000 patient days at the
second site. To determine a relative risk reduction of 50% with a power of 80% the sample size needed
is 17151 patient days, assuming 200 beds are filled on a daily basis. This approximates to 3 months of
consecutive patient enrolment, our timeline was extended to ensure appropriate power for
comparisons. The dataset will be further subdivided into two sections, the first six months of data will be
used to train the decision tree and the latter three months will isolated as a testing set. The decision
trees will be generated using the sci-kit package in Python, documentation regarding specific usage can
be found at http://scikit-learn.org/stable/documentation.html.
The outcome predicted by the decision tree model will be a composite outcome containing
unanticipated ICU transfer, code blue, and unanticipated patient death. The predictor vitals to be
measured and extracted from the electronic charting system are Heart Rate, Respiratory Rate, Systolic
Blood Pressure, AVPU, Confusion according to CAM, and Temperature. These vitals were chosen as
Page 7 of 16
For peer review only - http://bmjopen.bmj.com/site/about/guidelines.xhtml
BMJ Open
123456789101112131415161718192021222324252627282930313233343536373839404142434445464748495051525354555657585960
on April 15, 2020 by guest. P
rotected by copyright.http://bm
jopen.bmj.com
/B
MJ O
pen: first published as 10.1136/bmjopen-2015-008699 on 9 S
eptember 2015. D
ownloaded from

For peer review only
they’re the most commonly tracked vitals when nurses assess patients, as well these are the most
common vitals included in other early warning scores.(3)(11)
The difficulty of a computer model lies in being able to translate it back into a robust and simple tool
that clinicians can both understand and want to use to support their judgement, while at the same time
maintaining a high degree of accuracy.(12) Selection of the ideal form of analysis is therefore crucial; too
simple a model and the accuracy of the model suffers, too complex and it will be too complicated to
implement in a clinical environment. In addition robustness and accuracy must also be tested through
the external validation of the model.(13) This can be achieved through either more patient data being
collected or the process of bootstrapping, the former providing more data and the latter generating
simulated datasets from the initial set of observations. In the context of this protocol, boosting as an
ensemble method will be used as the approach to increasing the value of decision trees as it combines
clinical judgment through the use of pre-selected features, and is more easily interpreted in the form of
one final decision tree rather than a voting system.(13)
Planned statistical analysis
Both HEWS and the decision tree scores will be evaluated to determine their ability to discriminate
patients that are at risk of the above outcomes within a 72hr period following observation of an
abnormal vital sign. The ability for both to do this will be evaluated using AUROC. AUROC values for the
generated decision tree will be compared to that of the AUROC for HEWS. An efficiency curve will then
be plotted comparing the percentage of observations that experienced the composite outcome with the
percentage of observations that exceeded or were at a given score. External validation will be
determined through the application of the model to the testing data, and internal validation through
comparison to the original training data. A secondary analysis will be conducted examining the trend of
Page 8 of 16
For peer review only - http://bmjopen.bmj.com/site/about/guidelines.xhtml
BMJ Open
123456789101112131415161718192021222324252627282930313233343536373839404142434445464748495051525354555657585960
on April 15, 2020 by guest. P
rotected by copyright.http://bm
jopen.bmj.com
/B
MJ O
pen: first published as 10.1136/bmjopen-2015-008699 on 9 S
eptember 2015. D
ownloaded from

For peer review only
a patient’s HEWS, and whether this may also be predictive of a patient’s outcomes in addition to HEWS
values at a given point in time.
Missing data will be dealt with using multiple imputation when possible, specifically using the MICE
method.(15)
DISCUSSION
Currently most EWSs, including HEWS, were developed using a trial and error approach through
roundtable discussions such as described by the National Early Warning Score Development and
Implementation Group responsible for the development of NEWS and MEWS.(11, 16, 17) Decision trees
have been used by Badriyah et al. (2014) to validate NEWS, though a key difference between the
proposed method and the one conducted by Badriyah will be the generation of a decision tree that
encompasses all vitals rather than a separate tree per vital sign.(18) The use of decision trees was a
choice made based on the relatively robustness of its classification ability as well as the clarity and ease
of translation between model and a rule set that can be interpreted by clinical staff. Other more
complex models, such as support vector machining, may be more accurate but generated rule sets that
are difficult to translate and interpret. The second decision tree to be generated using ensemble based
methods and which accounts for all vitals in one tree can help to determine if priority or precedence
needs to be given to certain vitals over others, at the moment all vitals in all EWSs are weighed equally.
One limitation of the current study will be the missing values for vitals at the site where EWS
implementation was ongoing, as vitals were poorly charted prior to score introduction.
We anticipate having the HEWS score to be very similar in performance and structure to the first
decision tree which evaluates all vitals independently, given that both use the same predictors. Given
that prior studies comparing the performance of a single decision tree to ensemble based decision trees
have favoured the predictive ability of the latter, we believe that the ensemble based trees will provide
Page 9 of 16
For peer review only - http://bmjopen.bmj.com/site/about/guidelines.xhtml
BMJ Open
123456789101112131415161718192021222324252627282930313233343536373839404142434445464748495051525354555657585960
on April 15, 2020 by guest. P
rotected by copyright.http://bm
jopen.bmj.com
/B
MJ O
pen: first published as 10.1136/bmjopen-2015-008699 on 9 S
eptember 2015. D
ownloaded from

For peer review only
a more accurate predictive ability.(19) The potential clinical use for either method used to generate
decision tree EWSs, would be providing a relatively low cost and quick method of developing an EWS or
for the evaluation of a currently in place EWS.
CONTRIBUTORSHIP STATEMENT:
Michael Xu designed the database for vital signs collection, wrote the statistical analysis plan, developed
the methodology, drafted and revised the paper, and developed the idea behind the framework.
Benjamin Tam filed for ethics and funding, revised the paper and contributed to the development of the
methodology of the framework. Lehana Thabane provided statistical oversight and guidance, and
revised the paper. Alison Fox-Robichaud revised and drafted the draft paper, as well as filing for ethics
and funding.
COMPETING INTERESTS:
No conflicts of interest to declare.
FUNDING:
This project was funded by residency safety grants from Hamilton Health Sciences and the Department
of Medicine, McMaster University.
DATA SHARING STATEMENT:
At this moment no plans are in place to share data from the proposed collection, current ethics approval
does not include plans for sharing, though this may be amended.
Page 10 of 16
For peer review only - http://bmjopen.bmj.com/site/about/guidelines.xhtml
BMJ Open
123456789101112131415161718192021222324252627282930313233343536373839404142434445464748495051525354555657585960
on April 15, 2020 by guest. P
rotected by copyright.http://bm
jopen.bmj.com
/B
MJ O
pen: first published as 10.1136/bmjopen-2015-008699 on 9 S
eptember 2015. D
ownloaded from

For peer review only
References:
1. Goldhill DR, McNarry AF, Mandersloot G, et al. A physiologically-based early warning score for ward
patients: the association between score and outcome. Anaesthesia. 2005;60:547–53.
2. Subbe CP, Kruger M, Rutherford P, et al. Validation of a modified Early Warning Score in medical
admissions. QJM Int J Med. 2001;94:521–6.
3. Prytherch DR, Smith GB, Schmidt PE, et al. ViEWS—Towards a national early warning score for
detecting adult inpatient deterioration. Resuscitation. 2010;81:932–7.
4. McGinley A, Pearse RM. A national early warning score for acutely ill patients. BMJ.
2012;345:e5310.
5. Parshuram CS, Hutchison J, Middaugh K. Development and initial validation of the Bedside
Paediatric Early Warning System score. Crit Care. 2009;13:1–10.
6. Breiman L. Random Forests. Mach Learn. 2001;45:5–32.
7. Quinlan JR. Generating Production Rules From Decision Trees. Proceedings of the 10th
International
Joint Conference on Artificial Intelligence 1987;1:304-307.
8. Quinlan JR. Induction of Decision Trees. Mach Learn. 1986;1:81–106.
9. Esposito F, Malerba D, Semeraro G, et al. A comparative analysis of methods for pruning decision
trees. IEEE Trans Pattern Anal Mach Intell. 1997;19:476–91.
10. Caruana R, Niculescu-Mizil A. An Empirical Comparison of Supervised Learning Algorithms.
Proceedings of the 23rd International Conference on Machine Learning [Internet]. New York, NY,
USA: ACM; 2006 [cited 2014 Nov 9]. p. 161–8. Available from:
http://doi.acm.org/10.1145/1143844.1143865
11. Smith GB, Prytherch DR, Meredith P, et al. The ability of the National Early Warning Score (NEWS) to
discriminate patients at risk of early cardiac arrest, unanticipated intensive care unit admission, and
death. Resuscitation. 2013;84:465–70.
Page 11 of 16
For peer review only - http://bmjopen.bmj.com/site/about/guidelines.xhtml
BMJ Open
123456789101112131415161718192021222324252627282930313233343536373839404142434445464748495051525354555657585960
on April 15, 2020 by guest. P
rotected by copyright.http://bm
jopen.bmj.com
/B
MJ O
pen: first published as 10.1136/bmjopen-2015-008699 on 9 S
eptember 2015. D
ownloaded from

For peer review only
12. Kannampallil TG, Schauer GF, Cohen T, et al. Considering complexity in healthcare systems. J
Biomed Inform. 2011;44:943–7.
13. Collins GS, Groot JA de, Dutton S, et al. External validation of multivariable prediction models: a
systematic review of methodological conduct and reporting. BMC Med Res Methodol. 2014;14:40.
14. Schapire RE, Singer Y. Improved Boosting Algorithms Using Confidence-rated Predictions. Mach
Learn. 1999;37:297–336.
15. White IR, Royston P, Wood AM. Multiple imputation using chained equations: Issues and guidance
for practice. Stat Med. 2011;30:377–99.
16. Kyriacos U, Jelsma J, James M, Jordan S. Monitoring Vital Signs: Development of a Modified Early
Warning Scoring (Mews) System for General Wards in a Developing Country. PLoS ONE.
2014;9:e87073.
17. Kyriacos U, Jelsma J. Early warning scoring systems versus standard observations charts for wards in
South Africa: a cluster randomized controlled trial. Trials. 2015;16:103.
18. Badriyah T, Briggs JS, Meredith P, Jarvis SW, Schmidt PE, Featherstone PI, et al. Decision-tree early
warning score (DTEWS) validates the design of the National Early Warning Score (NEWS).
Resuscitation. 2014;85:418–23.
19. Banfield RE, Hall LO, Bowyer KW, Kegelmeyer WP. A Comparison of Decision Tree Ensemble
Creation Techniques. IEEE Trans Pattern Anal Mach Intell. 2007;29:173–80.
Page 12 of 16
For peer review only - http://bmjopen.bmj.com/site/about/guidelines.xhtml
BMJ Open
123456789101112131415161718192021222324252627282930313233343536373839404142434445464748495051525354555657585960
on April 15, 2020 by guest. P
rotected by copyright.http://bm
jopen.bmj.com
/B
MJ O
pen: first published as 10.1136/bmjopen-2015-008699 on 9 S
eptember 2015. D
ownloaded from

For peer review only
FIGURE LEGENDS:
Figure 1. Hamilton Early Warning Score (HEWS) limits and vitals used to assess patient condition
Figure 2. Illustration of the Heart Rate aspect of the Hamilton Early Warning Score divided into a
decision tree. Grey indicates a terminal node at which point a score would be given to the vital sign.
Page 13 of 16
For peer review only - http://bmjopen.bmj.com/site/about/guidelines.xhtml
BMJ Open
123456789101112131415161718192021222324252627282930313233343536373839404142434445464748495051525354555657585960
on April 15, 2020 by guest. P
rotected by copyright.http://bm
jopen.bmj.com
/B
MJ O
pen: first published as 10.1136/bmjopen-2015-008699 on 9 S
eptember 2015. D
ownloaded from

For peer review only
Figure 1. Hamilton Early Warning Score (HEWS) limits and vitals used to assess patient condition
Page 14 of 16
For peer review only - http://bmjopen.bmj.com/site/about/guidelines.xhtml
BMJ Open
123456789101112131415161718192021222324252627282930313233343536373839404142434445464748495051525354555657585960
on April 15, 2020 by guest. P
rotected by copyright.http://bm
jopen.bmj.com
/B
MJ O
pen: first published as 10.1136/bmjopen-2015-008699 on 9 S
eptember 2015. D
ownloaded from
For peer review only
Figure 2. Illustration of the Heart Rate aspect of the Hamilton Early Warning Score divided into a decision tree. Grey indicates a terminal node at which point a score would be given to the vital sign.
Page 15 of 16
For peer review only - http://bmjopen.bmj.com/site/about/guidelines.xhtml
BMJ Open
123456789101112131415161718192021222324252627282930313233343536373839404142434445464748495051525354555657585960
on April 15, 2020 by guest. P
rotected by copyright.http://bm
jopen.bmj.com
/B
MJ O
pen: first published as 10.1136/bmjopen-2015-008699 on 9 S
eptember 2015. D
ownloaded from

For peer review only
TRIPOD Checklist: Prediction Model Validation
Section/Topic Item Checklist Item Page
Title and abstract
Title 1 Identify the study as developing and/or validating a multivariable prediction model, the target population, and the outcome to be predicted.
1
Abstract 2 Provide a summary of objectives, study design, setting, participants, sample size, predictors, outcome, statistical analysis, results, and conclusions.
2
Introduction
Background and objectives
3a Explain the medical context (including whether diagnostic or prognostic) and rationale for developing or validating the multivariable prediction model, including references to existing models.
4
3b Specify the objectives, including whether the study describes the development or validation of the model or both.
5
Methods
Source of data 4a
Describe the study design or source of data (e.g., randomized trial, cohort, or registry data), separately for the development and validation data sets, if applicable.
7
4b Specify the key study dates, including start of accrual; end of accrual; and, if applicable, end of follow-up.
7
Participants
5a Specify key elements of the study setting (e.g., primary care, secondary care, general population) including number and location of centres.
7
5b Describe eligibility criteria for participants. 7
5c Give details of treatments received, if relevant. N/A
Outcome 6a
Clearly define the outcome that is predicted by the prediction model, including how and when assessed.
7
6b Report any actions to blind assessment of the outcome to be predicted. 7
Predictors 7a
Clearly define all predictors used in developing or validating the multivariable prediction model, including how and when they were measured.
7
7b Report any actions to blind assessment of predictors for the outcome and other predictors.
7
Sample size 8 Explain how the study size was arrived at. 7
Missing data 9 Describe how missing data were handled (e.g., complete-case analysis, single imputation, multiple imputation) with details of any imputation method.
8
Statistical analysis methods
10c For validation, describe how the predictions were calculated. 8
10d Specify all measures used to assess model performance and, if relevant, to compare multiple models.
8
10e Describe any model updating (e.g., recalibration) arising from the validation, if done. N/A
Risk groups 11 Provide details on how risk groups were created, if done. N/A
Development vs. validation
12 For validation, identify any differences from the development data in setting, eligibility criteria, outcome, and predictors.
7
Results
Participants
13a Describe the flow of participants through the study, including the number of participants with and without the outcome and, if applicable, a summary of the follow-up time. A diagram may be helpful.
N/A
13b Describe the characteristics of the participants (basic demographics, clinical features, available predictors), including the number of participants with missing data for predictors and outcome.
N/A
13c For validation, show a comparison with the development data of the distribution of important variables (demographics, predictors and outcome).
N/A
Model performance
16 Report performance measures (with CIs) for the prediction model. N/A
Model-updating 17 If done, report the results from any model updating (i.e., model specification, model performance).
N/A
Discussion
Limitations 18 Discuss any limitations of the study (such as nonrepresentative sample, few events per predictor, missing data).
8
Interpretation 19a
For validation, discuss the results with reference to performance in the development data, and any other validation data.
N/A
19b Give an overall interpretation of the results, considering objectives, limitations, results from similar studies, and other relevant evidence.
8
Implications 20 Discuss the potential clinical use of the model and implications for future research. 9 Other information
Supplementary information
21 Provide information about the availability of supplementary resources, such as study protocol, Web calculator, and data sets.
N/A
Funding 22 Give the source of funding and the role of the funders for the present study. 10
We recommend using the TRIPOD Checklist in conjunction with the TRIPOD Explanation and Elaboration document.
Page 16 of 16
For peer review only - http://bmjopen.bmj.com/site/about/guidelines.xhtml
BMJ Open
123456789101112131415161718192021222324252627282930313233343536373839404142434445464748495051525354555657585960
on April 15, 2020 by guest. P
rotected by copyright.http://bm
jopen.bmj.com
/B
MJ O
pen: first published as 10.1136/bmjopen-2015-008699 on 9 S
eptember 2015. D
ownloaded from