a framework for quality of service provision to delay sensitive
TRANSCRIPT

A Framework for Quality of ServiceProvision to Delay Sensitive
Applications in IEEE 802.11 DenseCellular Networks
A thesis submitted for the degree of
Doctor of Philosophy
by
Steve Woon
Department of Electrical and Computer Systems EngineeringMonash University
Australia
August 2010

Abstract
The use of fully packet based wireless communications has increased rapidly since theintroduction of the IEEE 802.11 standard. In parallel with this trend, demand for using802.11 networks for real-time applications such as voice and video has also increased.These applications, unlike best-effort data, are delay sensitive and require the provision-ing of service differentiation and prioritized access to wireless channels. The researchpresented in this thesis aims to focus on this requirement, and creates a framework forenhancing real-time application support for mobile users over 802.11 networks.
The first problem tackled by the framework is that of traffic interruptions experiencedby a mobile terminal during a handover. Due to the limited radio coverage of 802.11environments (especially indoors), connection disruptions because of the handoversmay occur frequently for a highly mobile user. These disruptions can cause noticeabledegradation in performance of real-time applications. Our framework eliminates thisby achieving seamless handovers through the use of two 802.11 interfaces co-ordinatedin a self contained link layer. The second interface performs the handover process whilethe active one maintains uninterrupted communications. Both interfaces operate trans-parently to upper layers and conform with the 802.11 standard.
When considering the use of two interfaces on a mobile terminal with limited batterylife, the issue of power consumption has to be addressed. Although the idling interfaceonly passively scans for surrounding access points, it still consumes valuable energyand reduces the device’s power storage. To minimize power consumption, the idlinginterface stays in a power saving state until a handover is anticipated. The estimatedhandover instant needs to be sufficiently early to maintain a seamless handover experi-ence: this is an issue which we investigate with the help of analytical models of signalpath loss.
The second problem is the dependence of the quality of service on the unpredictablychanging shared wireless links which inherently have constrained capacities. In a net-work offering overlapping coverage, a mobile terminal should ideally handover to anaccess point capable of supporting and meeting the required quality of service of itsapplication(s). Our framework solves this problem by applying IEEE 802.21 concepts,
i
allowing handover triggers based on various end-to-end performance measures in ad-dition to the commonly used signal strength trigger.
As part of the handover process, the call admission decision determined by the targetaccess point is critically important. In addition to ensuring the incoming mobile termi-nal’s service requirements are met, it is also important to minimize the impact on activeusers in the cell. To preserve the quality of service within the cell, the total data raterequirements of the application must not exceed the maximum achievable utilization,which is defined as the upper limit of the total real-time data rate beyond which qualityof service requirements of ongoing flows cannot be met. Determining the maximumachievable utilization of a contention based medium depends on factors such as thetype of real-time traffic, the number of low priority traffic sources, and interference. Ourframework includes a lookup method we created for predicting the maximum achiev-able utilization on an access point dynamically. Together with a heuristic we propose foraccurately estimating the collision bandwidth inherent to a contention based medium,the access point can determine a call admission decision based on its ability to meetthe required quality of service requirements. The proposed call admission scheme wasshown to overcome the limitations imposed by measurement based schemes using asingle threshold.
The effectiveness of our proposed framework and mechanism is clearly demonstratedby maintaining quality of service of real-time applications in a cellular 802.11 network.The integration with 802.21 also allows the same principles to be applied to mobile ter-minals equipped with different radio access technologies operating seamlessly in het-erogeneous networks.
ii

Acknowledgments
I would like to especially thank my supervisor Y. Ahmet Sekercioglu for his guidance,support and encouragement throughout the course of the entire research. His orga-nized and logical approach has been valuable in ensuring progression in the project. Iwould also like to thank my co-supervisors NallasamyMani and Terry Cornall for theirvaluable advise and thoughts, particularly at the early stages of my research program.Special thanks also goes out to Milosh Ivanovich for his always insightful commentsand thought provoking discussions.
I have also been extremely fortunate to have shared offices with talented colleagueswho have since become close friends: Eric Wu, Jack Foo, Johnny Lai, Leon Liang, GregDaley and Gopi Kurup. Not only have they made the whole experience enjoyable, butthey were always encouraging and more than willing to help. I would specifically liketo thank Andras Varga, Eric Wu and Johnny Lai, who patiently got me started withOMNeT++ simulation modelling, acted as code reviewers, and shared ideas on pro-gramming, Unix and research. I was also lucky to have had the opportunity to workwith some of the brightest minds at NIST, including Nada Golmie, Richard Rouil andNicolas Chevrollier. I would like to thank them for the fruitful collaborative work onboth handover triggers and related NS-2 simulation models. Thank you all for the stim-ulating discussions and introducing me to the world of standardization.
I am forever indebted to my family for their constant unconditional love, support andencouragement when it was most required. Mum and Dad for never giving up andbeing my inspiration. I owe everything to them and could not have come this far if itwas not for their enthusiastic support and love, my brothers and sisters, Sean, Anita,Sam and Warren, for always being there and supporting me in any way they could.
My final and most heartfelt acknowledgement goes to my beautiful and lovely wifeMarcia. Her continual love, patience, support and encouragement offered is more thananyone could ask for. I am extraordinarily lucky to have her as my eternal love.
iii

Declaration
I declare that, to the best of my knowledge, the research described herein is originalexcept where the work of others is indicated and acknowledged, and that the thesishas not, in whole or in part, been submitted for any other degree at this or any otheruniversity.
Steve WoonMelbourneAugust 2010
iv

Contents
1 Introduction 11.1 Motivation . . . . . . . . . . . . . . . . . . . . . . . . . . . . . . . . . . . . . 11.2 Towards IEEE 802.11 Based Dense Cellular Networks . . . . . . . . . . . . 81.3 Thesis Contributions . . . . . . . . . . . . . . . . . . . . . . . . . . . . . . . 9
1.3.1 Improving Existing Mechanisms . . . . . . . . . . . . . . . . . . . . 101.3.2 Dual Interface Smooth Handover . . . . . . . . . . . . . . . . . . . . 101.3.3 Power Level Thresholds For Smooth Handover . . . . . . . . . . . 111.3.4 QoS Based Handover Triggers . . . . . . . . . . . . . . . . . . . . . 111.3.5 Channel Utilization Estimation And QoS Provisioning . . . . . . . 11
1.4 Organization . . . . . . . . . . . . . . . . . . . . . . . . . . . . . . . . . . . . 12
2 Mobility Management For Wireless Networks 152.1 Introduction . . . . . . . . . . . . . . . . . . . . . . . . . . . . . . . . . . . . 152.2 IEEE 802.11 . . . . . . . . . . . . . . . . . . . . . . . . . . . . . . . . . . . . . 18
2.2.1 Medium Sharing . . . . . . . . . . . . . . . . . . . . . . . . . . . . . 182.3 IEEE 802.11e . . . . . . . . . . . . . . . . . . . . . . . . . . . . . . . . . . . . 21
2.3.1 Traffic categories . . . . . . . . . . . . . . . . . . . . . . . . . . . . . 212.3.2 Medium Sharing . . . . . . . . . . . . . . . . . . . . . . . . . . . . . 222.3.3 Admission Control . . . . . . . . . . . . . . . . . . . . . . . . . . . . 27
2.4 Load Management in IEEE 802.11 Networks . . . . . . . . . . . . . . . . . 282.4.1 Client Controlled . . . . . . . . . . . . . . . . . . . . . . . . . . . . . 292.4.2 Network Controlled . . . . . . . . . . . . . . . . . . . . . . . . . . . 332.4.3 Handling Lower Priority Best-effort Traffic . . . . . . . . . . . . . . 43
2.5 Handovers in IEEE 802.11 Networks . . . . . . . . . . . . . . . . . . . . . . 452.5.1 Scanning . . . . . . . . . . . . . . . . . . . . . . . . . . . . . . . . . . 472.5.2 Authentication . . . . . . . . . . . . . . . . . . . . . . . . . . . . . . 562.5.3 Association . . . . . . . . . . . . . . . . . . . . . . . . . . . . . . . . 562.5.4 External Authentication . . . . . . . . . . . . . . . . . . . . . . . . . 582.5.5 Multiple Interface Support . . . . . . . . . . . . . . . . . . . . . . . 632.5.6 QoS Handover Triggers and Criteria . . . . . . . . . . . . . . . . . . 652.5.7 Additional IEEE 802.11 Standards To Support Mobility . . . . . . . 66
v

2.6 Performance Requirements for VoIP . . . . . . . . . . . . . . . . . . . . . . 682.7 Research Scope . . . . . . . . . . . . . . . . . . . . . . . . . . . . . . . . . . 70
3 Handover Analysis Of IEEE 802.11b Interfaces 743.1 Introduction . . . . . . . . . . . . . . . . . . . . . . . . . . . . . . . . . . . . 743.2 Experimental Testbed . . . . . . . . . . . . . . . . . . . . . . . . . . . . . . . 75
3.2.1 Mobile Station . . . . . . . . . . . . . . . . . . . . . . . . . . . . . . . 753.2.2 Data Collection . . . . . . . . . . . . . . . . . . . . . . . . . . . . . . 763.2.3 Infrastructure Network Testing . . . . . . . . . . . . . . . . . . . . . 763.2.4 Ad-hoc Network Testing . . . . . . . . . . . . . . . . . . . . . . . . . 79
3.3 Performance Analysis . . . . . . . . . . . . . . . . . . . . . . . . . . . . . . 813.3.1 Infrastructure Network . . . . . . . . . . . . . . . . . . . . . . . . . 813.3.2 Ad-hoc Network . . . . . . . . . . . . . . . . . . . . . . . . . . . . . 883.3.3 Handover In Pseudo Ad-hoc Mode . . . . . . . . . . . . . . . . . . 88
3.4 Conclusion . . . . . . . . . . . . . . . . . . . . . . . . . . . . . . . . . . . . . 90
4 Dual Interface Handover 934.1 Introduction . . . . . . . . . . . . . . . . . . . . . . . . . . . . . . . . . . . . 934.2 Link Layer Handovers Using Two Interfaces . . . . . . . . . . . . . . . . . 94
4.2.1 Transparent 802.11 Handover . . . . . . . . . . . . . . . . . . . . . . 944.2.2 Managing A Single MAC Address Between Two Interfaces . . . . . 954.2.3 Handover Trigger . . . . . . . . . . . . . . . . . . . . . . . . . . . . . 984.2.4 AP Discovery . . . . . . . . . . . . . . . . . . . . . . . . . . . . . . . 99
4.3 Dual Interface Architecture . . . . . . . . . . . . . . . . . . . . . . . . . . . 1014.4 Energy Consumption Costs . . . . . . . . . . . . . . . . . . . . . . . . . . . 1034.5 Performance Analysis . . . . . . . . . . . . . . . . . . . . . . . . . . . . . . 106
4.5.1 Simulation Configuration . . . . . . . . . . . . . . . . . . . . . . . . 1064.5.2 Handover Performance . . . . . . . . . . . . . . . . . . . . . . . . . 1084.5.3 Performance Of AP Discovery Methods . . . . . . . . . . . . . . . . 111
4.6 Conclusion . . . . . . . . . . . . . . . . . . . . . . . . . . . . . . . . . . . . . 117
5 Effective Link Triggers To Improve Handover 1185.1 Introduction . . . . . . . . . . . . . . . . . . . . . . . . . . . . . . . . . . . . 1185.2 Using Link Layer Triggers For Handovers . . . . . . . . . . . . . . . . . . . 1195.3 Setting Link Trigger Threshold . . . . . . . . . . . . . . . . . . . . . . . . . 1225.4 Performance Analysis . . . . . . . . . . . . . . . . . . . . . . . . . . . . . . 124
5.4.1 Simulation Configuration . . . . . . . . . . . . . . . . . . . . . . . . 1245.4.2 Validation Of The Handover Loss Equation . . . . . . . . . . . . . . 1265.4.3 Effects Of Shadowing . . . . . . . . . . . . . . . . . . . . . . . . . . 1275.4.4 Weighted Averaging Of Signal Strength . . . . . . . . . . . . . . . . 1295.4.5 Video Traffic Patterns . . . . . . . . . . . . . . . . . . . . . . . . . . 134
5.5 Conclusion . . . . . . . . . . . . . . . . . . . . . . . . . . . . . . . . . . . . . 136
vi

6 Maintaining QoS Using Link Triggers 1386.1 Introduction . . . . . . . . . . . . . . . . . . . . . . . . . . . . . . . . . . . . 1386.2 QoS Based Triggers . . . . . . . . . . . . . . . . . . . . . . . . . . . . . . . . 139
6.2.1 QoS Decision Engine (QDE) . . . . . . . . . . . . . . . . . . . . . . . 1396.2.2 Cross Layer QoS Mapping . . . . . . . . . . . . . . . . . . . . . . . . 1406.2.3 Performance Information Exchange . . . . . . . . . . . . . . . . . . 1446.2.4 Setting Handover Thresholds . . . . . . . . . . . . . . . . . . . . . . 1456.2.5 QDE Operation . . . . . . . . . . . . . . . . . . . . . . . . . . . . . . 1466.2.6 Monitoring Parameters On An IEEE 802.11 Interface . . . . . . . . 146
6.3 Performance Analysis . . . . . . . . . . . . . . . . . . . . . . . . . . . . . . 1496.3.1 Simulation Configuration . . . . . . . . . . . . . . . . . . . . . . . . 1496.3.2 Performance Results . . . . . . . . . . . . . . . . . . . . . . . . . . . 150
6.4 Conclusion . . . . . . . . . . . . . . . . . . . . . . . . . . . . . . . . . . . . . 154
7 Utilization Estimation For Call Admission Control In IEEE 802.11e 1577.1 Introduction . . . . . . . . . . . . . . . . . . . . . . . . . . . . . . . . . . . . 1577.2 Maximum Utilization Lookup Matrix . . . . . . . . . . . . . . . . . . . . . 158
7.2.1 Traffic Profiles . . . . . . . . . . . . . . . . . . . . . . . . . . . . . . . 1607.2.2 Simulation Configuration . . . . . . . . . . . . . . . . . . . . . . . . 1627.2.3 Measured Parameters . . . . . . . . . . . . . . . . . . . . . . . . . . 1627.2.4 Analysis Of Maximum Utilization Values . . . . . . . . . . . . . . . 1657.2.5 Performing Lookup At The AP . . . . . . . . . . . . . . . . . . . . . 168
7.3 Call Admission Control . . . . . . . . . . . . . . . . . . . . . . . . . . . . . 1697.4 Performance Analysis . . . . . . . . . . . . . . . . . . . . . . . . . . . . . . 171
7.4.1 Scenario 1: Incoming Voice Connections . . . . . . . . . . . . . . . . 1747.4.2 Scenario 2: Incoming Video Connections . . . . . . . . . . . . . . . 1777.4.3 Scenario 3: Incoming Voice And Best-Effort Connections . . . . . . 1807.4.4 Scenario 4: Incoming Video And Best-Effort Connections . . . . . . 1837.4.5 Scenario 5: Incoming Voice, Video And Best-Effort Connections . . 185
7.5 Conclusion . . . . . . . . . . . . . . . . . . . . . . . . . . . . . . . . . . . . . 187
8 Conclusion 1908.1 Conclusions . . . . . . . . . . . . . . . . . . . . . . . . . . . . . . . . . . . . 1908.2 Future Work . . . . . . . . . . . . . . . . . . . . . . . . . . . . . . . . . . . . 193
vii
List of Figures
1.1 Upgrade path from 2G to 3G systems. . . . . . . . . . . . . . . . . . . . . . 31.2 Range of wireless technologies. . . . . . . . . . . . . . . . . . . . . . . . . . 61.3 Future 4G networks supporting a range of technologies. . . . . . . . . . . 81.4 Complete system diagram of research contributions. . . . . . . . . . . . . . 13
2.1 Modes supported by IEEE 802.11. . . . . . . . . . . . . . . . . . . . . . . . . 162.2 Medium sharing using DCF basic access. . . . . . . . . . . . . . . . . . . . 202.3 Prioritized medium sharing in IEEE 802.11e DCF. . . . . . . . . . . . . . . 242.4 Throughout of AC VO and AC BE access categories in IEEE 802.11e with
and without differentiation. . . . . . . . . . . . . . . . . . . . . . . . . . . . 262.5 Client controlled handover. . . . . . . . . . . . . . . . . . . . . . . . . . . . 292.6 Network controlled handover. . . . . . . . . . . . . . . . . . . . . . . . . . . 332.7 Congestion control through cell breathing. . . . . . . . . . . . . . . . . . . 352.8 Admission decision based on parameter δ. . . . . . . . . . . . . . . . . . . 362.9 Guard-band to avoid starving best-effort traffic. . . . . . . . . . . . . . . . 442.10 Active scanning in IEEE 802.11. . . . . . . . . . . . . . . . . . . . . . . . . . 472.11 Passive scanning in IEEE 802.11. . . . . . . . . . . . . . . . . . . . . . . . . 482.12 Neighbor graphs for reducing handover scanning delay. . . . . . . . . . . 522.13 Interleaving active scanning with normal data exchange. . . . . . . . . . . 542.14 Synchronized interleaved scanning using SyncScan. . . . . . . . . . . . . . 552.15 IEEE 802.1d signaling for updating location. . . . . . . . . . . . . . . . . . 572.16 Possible authentication options. . . . . . . . . . . . . . . . . . . . . . . . . . 592.17 Neighbor graphs for pre-authentication. . . . . . . . . . . . . . . . . . . . . 612.18 Buffering and frame forwarding. . . . . . . . . . . . . . . . . . . . . . . . . 62
3.1 Testbed configuration for testing handover delays. . . . . . . . . . . . . . . 773.2 Cisco Aironet 350 handover between APs on channel 1 and 6. . . . . . . . 803.3 Cisco Aironet 350 handover between APs on channel 1 and 11. . . . . . . . 803.4 D-Link DWL-650 handover between APs on channel 1 and 6. . . . . . . . . 823.5 Samsung SWL-2100E handover between APs on channel 1 and 6. . . . . . 823.6 Aironet PC4800 handover between APs on channel 1 and 6. . . . . . . . . 833.7 Cisco Aironet 350 handover between APs using the “ap” option. . . . . . . 84
viii

3.8 Aironet PC4800 handover between APs using the “ap” option. . . . . . . . 843.9 Cisco Aironet 350 handover between APs with MinChannelTime = 1 ms
andMaxChannelTime = 5 ms. . . . . . . . . . . . . . . . . . . . . . . . . . . . 863.10 Aironet PC4800 handover between APs withMinChannelTime = 1 ms and
MaxChannelTime = 5 ms. . . . . . . . . . . . . . . . . . . . . . . . . . . . . . 873.11 D-Link DWL-650 switching between two Samsung SWL-2100E during
pseudo ad hoc operation. . . . . . . . . . . . . . . . . . . . . . . . . . . . . 893.12 Average handover delays and 95% confidence interval plotted for com-
paring handover performance of various interfaces. . . . . . . . . . . . . . 91
4.1 Seamless link layer handover using two interfaces. . . . . . . . . . . . . . . 964.2 Single and dual interface structures. . . . . . . . . . . . . . . . . . . . . . . 1024.3 Dual interface manager. . . . . . . . . . . . . . . . . . . . . . . . . . . . . . 1024.4 Dual interface energy consumption comparison. . . . . . . . . . . . . . . . 1064.5 Simulation scenario . . . . . . . . . . . . . . . . . . . . . . . . . . . . . . . . 1074.6 Sequence received at the MS during a two-way CBR call at the point of
handover . . . . . . . . . . . . . . . . . . . . . . . . . . . . . . . . . . . . . . 1094.7 Sequence received at the CN during a two-way CBR call at the point of
handover . . . . . . . . . . . . . . . . . . . . . . . . . . . . . . . . . . . . . . 1104.8 Frame size received at the MS during a two-way CBR call at the point of
handover . . . . . . . . . . . . . . . . . . . . . . . . . . . . . . . . . . . . . . 1124.9 Handover disruption for various overlapping cell coverage andMS speed
of 1 m/s . . . . . . . . . . . . . . . . . . . . . . . . . . . . . . . . . . . . . . 1134.10 Handover disruption for various overlapping cell coverage andMS speed
of 2 m/s . . . . . . . . . . . . . . . . . . . . . . . . . . . . . . . . . . . . . . 1134.11 Handover disruption for various overlapping cell coverage andMS speed
of 4 m/s . . . . . . . . . . . . . . . . . . . . . . . . . . . . . . . . . . . . . . 114
5.1 Multi-interface MS is disconnected for a time equal to the handover la-tency without LGD trigger. . . . . . . . . . . . . . . . . . . . . . . . . . . . 120
5.2 Multi-interface MS maintains its connection and experiences no disrup-tions in traffic flow when using LGD trigger. . . . . . . . . . . . . . . . . . 121
5.3 Simulation scenario . . . . . . . . . . . . . . . . . . . . . . . . . . . . . . . . 1255.4 Ratio of packet lost during WLAN-UMTS handover for CBR traffic with
σ = 0 and δ = 1 . . . . . . . . . . . . . . . . . . . . . . . . . . . . . . . . . . 1275.5 Ratio of packet lost during WLAN-UMTS handover for CBR traffic with
σ = 1 and δ = 1 . . . . . . . . . . . . . . . . . . . . . . . . . . . . . . . . . . 1285.6 Ratio of packet lost during WLAN-UMTS handover for CBR traffic with
σ = 4 and δ = 1 . . . . . . . . . . . . . . . . . . . . . . . . . . . . . . . . . . 1295.7 Ratio of packet lost during WLAN-UMTS handover for CBR traffic with
σ = 4 and δ = 1, with interpolation based on 10 m/s MS. . . . . . . . . . . 1305.8 Ratio of packet lost during WLAN-UMTS handover for CBR traffic with
σ = 0 and δ = 0.25, with interpolation based on 10 m/s MS. . . . . . . . . 131
ix

5.9 Average signal strength (for δ values of 0.05, 0.25 and 1) as the MS movesaway from the AP for different δ values . . . . . . . . . . . . . . . . . . . . 132
5.10 Average signal strength and FFT decay detection value as the MS movesaway from the AP with δ = 0.05 . . . . . . . . . . . . . . . . . . . . . . . . . 133
5.11 Ratio of packet lost during WLAN-UMTS handover for CBR traffic withσ = 4 and δ = 0.05, with interpolation based on 10 m/s MS. . . . . . . . . 134
5.12 Ratio of packet lost duringWLAN-UMTS handover for Video traffic withσ = 0 and δ = 1, with interpolation based on 10 m/s MS. . . . . . . . . . . 135
5.13 Ratio of packet lost duringWLAN-UMTS handover for Video traffic withσ = 4 and δ = 0.05, with interpolation based on 5 m/s MS. . . . . . . . . . 136
6.1 Possible QDE location [GOHR+06]. . . . . . . . . . . . . . . . . . . . . . . . 1416.2 Network segment measurements [GOHR+06] . . . . . . . . . . . . . . . . . 1436.3 Message exchange process from obtaining core network measurements
to triggering a handover. . . . . . . . . . . . . . . . . . . . . . . . . . . . . . 1486.4 Network topology . . . . . . . . . . . . . . . . . . . . . . . . . . . . . . . . . 1506.5 Graph of throughput measurements. . . . . . . . . . . . . . . . . . . . . . . 1516.6 Graph of delay measurements. . . . . . . . . . . . . . . . . . . . . . . . . . 1536.7 Graph of jitter measurements. . . . . . . . . . . . . . . . . . . . . . . . . . . 155
7.1 Determining utilization with the help of cubic spline interpolation. . . . . 1617.2 Simulation scenario. . . . . . . . . . . . . . . . . . . . . . . . . . . . . . . . 1637.3 Graph of the maximum real-time traffic utilization. . . . . . . . . . . . . . 1657.4 Graph of the successful traffic component of the maximum real-time traf-
fic utilization. . . . . . . . . . . . . . . . . . . . . . . . . . . . . . . . . . . . 1667.5 Graph of the collision traffic component of the maximum real-time traffic
utilization. . . . . . . . . . . . . . . . . . . . . . . . . . . . . . . . . . . . . . 1677.6 The average retransmissions per sent frame (r) at the AP as MSs enter the
cell, for various packet loss probabilities due to external interference (l). . 1697.7 Achievable throughput using ACR and ROB CAC mechanisms. . . . . . . 1737.8 Average access delay using ACR and ROB CAC mechanisms. . . . . . . . 1737.9 Average blocking probability of incoming voice connections. . . . . . . . . 1757.10 Average access delay for voice traffic at the AP. . . . . . . . . . . . . . . . . 1757.11 Average real-time voice traffic throughput. . . . . . . . . . . . . . . . . . . 1767.12 Average blocking probability of incoming video connections. . . . . . . . . 1787.13 Average access delay for video traffic at the AP. . . . . . . . . . . . . . . . . 1787.14 Average real-time video traffic throughput. . . . . . . . . . . . . . . . . . . 1797.15 Real-time voice traffic throughput in the presence of competing best-effort
traffic. . . . . . . . . . . . . . . . . . . . . . . . . . . . . . . . . . . . . . . . . 1817.16 Best effort traffic throughput in the presence of competing real-time voice
traffic. . . . . . . . . . . . . . . . . . . . . . . . . . . . . . . . . . . . . . . . . 1817.17 Access delay and blocking probability for voice calls in the presence of
competing best-effort traffic . . . . . . . . . . . . . . . . . . . . . . . . . . . 182
x

7.18 Real-time video traffic throughput in the presence of competing best-effort traffic. . . . . . . . . . . . . . . . . . . . . . . . . . . . . . . . . . . . . 183
7.19 Best effort traffic throughput in the presence of competing real-time videotraffic. . . . . . . . . . . . . . . . . . . . . . . . . . . . . . . . . . . . . . . . . 184
7.20 Access delay and blocking probability for video calls in the presence ofcompeting best-effort traffic. . . . . . . . . . . . . . . . . . . . . . . . . . . . 184
7.21 Achievable throughput using ACR and ROB CAC mechanisms. . . . . . . 1867.22 Average access delay using ACR and ROB CAC mechanisms. . . . . . . . 186
xi

List of Tables
2.1 IEEE 802.11e access category mappings. . . . . . . . . . . . . . . . . . . . . 222.2 Overhead timing for transmitting a frame successfully and during a col-
lision, for both 802.11 DCF and 802.11 EDCA . . . . . . . . . . . . . . . . . 272.3 Major VoIP coding options. . . . . . . . . . . . . . . . . . . . . . . . . . . . 69
4.1 Parameters used for dual interface energy consumption evaluation. . . . . 1054.2 Simulation parameters used for dual interface handover evaluation. . . . 1074.3 Calculated scanning time and overlap required. . . . . . . . . . . . . . . . 111
5.1 Simulation parameters used for signal based anticipation evaluation. . . . 126
6.1 Simulation parameters used for QoS based triggering evaluation. . . . . . 152
7.1 Simulation parameters used when determining the lookup matrix. . . . . 164
xii
List of Acronyms
0G Zero Generation1G First Generation2G Second Generation2.5G 2.5 Generation3G Third Generation3GPP 3rd Generation Partnership Project4G Fourth GenerationAC Access CategoryACK AcknowledgmentACR Average Collision RatioAIFS Arbitration Inter Frame SpaceAIFSN Arbitration Inter Frame Space NumberAMPS Advanced Mobile Phone SystemAP Access PointAR Access RouterARP Address Resolution ProtocolBA Binding AcknowledgmentBE Best EffortBS Base StationBSS Basic Service SetBSSID Basic Service Set IdentificationCA Collision AvoidanceCAC Call Admission ControlCBR Constant Bit RateCCP Controlled Contention PeriodCD Collision DetectionCDF Cumulative Distribution FunctionCDMA Code Division Multiple AccessCFP Contention Free PeriodCN Correspondent NodeCP Contention Period
xiii

CTS Clear To SendCW Contention WindowDCF Distributed Co-ordination FunctionDIFS Distributed Co-ordination Function Inter Frame SpaceDS Distribution SystemDSL Digital Subscriber LineEC European CommissionEDCA Enhanced Distributed Channel AccessEDGE Enhanced Data rates for GSM EvolutionFFT Fast Fourier TransformFHR Frequent Handoff RegionESS Extended Service SetESSID Extended Service Set IdentificationGPRS General Packet Radio ServiceGPS Global Positioning SystemGSM Global System for Mobile CommunicationsHA Home AgentHIPERLAN High Performance Radio Local Area NetworkIAPP Inter Access Point ProtocolICMP Internet Control Message ProtocolID IdentificationIEEE Institute of Electrical and Electronics EngineersIETF Internet Engineering Task ForceIMT-2000 International Mobile Telecommunications-2000IP Internet ProtocolIPv4 Internet Protocol Version 4IPv6 Internet Protocol Version 6IS Information ServerIS-136 Interim Standard 136IS-95A Interim Standard 95AISM Industrial, Scientific and MedicalIT Information TechnologyITU International Telecommunication UnionL2 Layer 2L3 Layer 3LD Link DownLGD Link Going DownLR Link RollbackLU Link UpLAN Local Area NetworkMAC Medium Access ControlMIH Media Independent HandoverMIHF Media Independent Handover Function
xiv

MIIS Media Independent Information ServiceMIMO Multiple-Input Multiple-OutputMIP Mobile Internet ProtocolMIPv6 Mobile Internet Protocol Version 6MIRAI Multimedia Integrated Network by Radio Access InnovationMMI MIPv6 for Multiple InterfaceMS Mobile StationNAV Network Allocation VectorNIC Network Interface CardPC Personal ComputerPD Probe DelayPDA Personal Digital AssistantPDC Personal Digital CellularPDF Probability Density FunctionPET Probe Energy TimeoutPRT Probe Response TimeoutPHY Physical LayerPoA Point of AttachmentPSTN Public Switched Telephone NetworkQDE Quality of Service Decision EngineQoS Quality of ServiceRADIUS Remote Authentication Dial In User ServiceRAM Random Access MemoryROB Relative Occupied Bandwidth (ROB) methodRSSI Received Signal Strength IndicationRTP Real-time Transport ProtocolRTS Request To SendSIFS Short Inter Frame SpaceSINR Signal to Interference and Noise RatioSMS Short Message ServiceST Slot TimeTACS Total Access Communications SystemTCP Transmission Control ProtocolTD-SCDMA Time Division Synchronous Code Division Multiple AccessTDMA Time Division Multiple AccessTXOP Transmission OpportunityUDP User Datagram ProtocolUMTS Universal Mobile Telecommunications SystemUSB Universal Serial BusVBR Variable Bit RateVI VideoVIP Video over Internet ProtocolVoIP Voice over Internet Protocol
xv

VO VoiceWEP Wired Equivalent PrivacyW-CDMA Wideband Code Division Multiple AccessWiMAX Worldwide Interoperability for Microwave AccessWLAN Wireless Local Area NetworkWPAN Wireless Personal Area NetworkWWAN Wireless Wide Area Network
xvi

List of Symbols
α Power level threshold coefficientβ Path loss exponentδ Weighting factor for new readingλ Signal wavelengthσ Standard deviationACi Access category for a given priority iAIFS[i] AIFS for a given priority iAIFSN[i] AIFS number for a given priority iBMS Data rate for communications with MSCavg Average collision ratio used by Average Collision Ratio CAC methodClo Lower collision ratio threshold used by Average Collision Ratio
CAC methodCup Upper collision ratio threshold used by Average Collision Ratio
CAC methodCWmax[i] Maximum contention window for a given priority iCWmin[i] Minimum contention window for a given priority id Distance between the receiver and transmitterd0 Close-in reference distanceDVO Maximum tolerable access delay threshold for voiceDVI Maximum tolerable access delay threshold for videoDx Maximum delay tolerance for segment xfL2 Layer 2 frame sizeFavg Average frame sizeGrx Receiver gainGtx Transmitter gainJx Maximum jitter tolerance for segment xl Percentage loss due to interferenceLho Ratio of time during handover with no connectionLx Maximum loss ratio for segment xnBE Number of best-effort connectionsnVI Number of video calls
xvii
NC Number of channelsPhothresh Handover power level thresholdPld Link down power level thresholdPlgd Link going down power level thresholdPrx Received signal power levelPrxthresh Receive power level thresholdPt Transmit powerQd Maximum end-to-end delay toleranceQj Maximum end-to-end jitter toleranceQl Maximum packet loss toleranceQt Required data rate for supporting end-to-end trafficr Average number of retransmissions per sent frameRavg Average frame rateSC Time to scan a channelSR Remaining time to complete scanning cycleST Total scanning cycle timet Timetd Time difference from reaching Plgd to Prxthreshtinterval Time interval between framestnew Time to establish the new interface connectiontoccupied Time occupied transmitting or receiving an IEEE 802.11e frametseg (goodput) Time to send IEEE 802.11 frame successfullytseg (successful) Time to send frame IEEE 802.11 successfully including medium access
overheadsTACK Time to transmit ACK frameTCTS Time to transmit CTS frameTRTS Time to transmit RTS frameTO Frame access overhead timeTseamless Time required for seamless handoverTx Required data rate for segment xTXOPLimit[AC]Transmission opportunity limit for a given access categoryUadmitted Total utilization of all currently admitted real-time connectionsUc Collision traffic utilizationUin s Successful utilization of incoming real-time connectionUin t Total utilization of incoming real-time connectionUlo Lower utilization threshold value used by Relative Occupied Bandwidth
CAC methodUlookup t Total real-time traffic utilization determined from lookup matrixUlookup c Collision real-time traffic utilization determined from lookup matrixUs Successful traffic utilizationUt Total traffic utilizationUup Upper utilization threshold value used by Relative Occupied Bandwidth
CAC method
xviii

x Overlapping region between two cellsXσ Random variable drawn from a Gaussian distribution with a standard
deviation σXavg New calculated averageXnew reading New reading sampleXold avg Old calculated averagev Mobile station speed
xix

Chapter 1
Introduction
1.1 Motivation
As early as in the 1940s, wireless cellular communications that were capable of connect-
ing to the Public Switched Telephone Network (PSTN) were introduced. The very first
group of wireless technologies, known as Zero Generation (0G) networks, was mainly
used in commercial applications, such as in commercial vehicles. In this group, a num-
ber of variations existed across the globe, where some competed against one another
within the same country. As a result, 0G was not well standardized and serviced when
users roamed between systems of the same technology.
The inadequacy of 0G systems have lead to the development of a more advanced and
standardized family of wireless services, known as First Generation (1G) networks.
Popular examples include the AdvancedMobile Phone System (AMPS) [You79] and To-
tal Access Communication System (TACS) [Gar97]. AMPS was used primarily in coun-
tries such as United States, South America, and Australia. The latter system was popu-
lar in countries such as the United Kingdom, Hong Kong, and Japan. There were also
various other standards used throughout the world, but they were not as widespread
1

as TACS or AMPS. All 1G technologies were based on analog signals specifically for
transmitting voice.
Wireless digital communications technology was only introduced in Second Generation
(2G) networks, which eventually replaced all existing 1G systems. The newer digital
systems offered less power consumption, improved spectral efficiency, better security
and error checking. Examples of popular systems include the Interim Standard 95A (IS-
95A) [TJ99] and IS-136 [SSC99] that were popular predominantly in the United States.
IS-95A was the first Code Division Multiple Access (CDMA) digital cellular standard
and was also known as CDMAone [TJ99]. The other less successful IS-136 standard was
a Time Division Multiple Access (TDMA) based system, which was not interoperable
with IS-95A.
Rather than offer competing systems, a more unified approach was adopted in the Eu-
ropean market by introducing a TDMA based system known as the Global System for
Mobile communications (GSM) [Rap01]. It was the most successful standard within the
2G family, capturing 82% [GSM] of the mobile communications market across the globe.
Its roaming capabilities were well supported, allowing users to obtain service as they
moved to different GSM networks around the world. One of the highlights about the
2G family was the ability to support digital data services, such as Short Message Service
(SMS) and electronic mail. However, the data rates were limited to 9.6 kbps [HRM03],
restricting its capabilities of supporting modern data services. These data rates could
be increased by the use of multiple channels, however at the expense of consuming
valuable resources for minimal gains.
With the increasing demand of data based services through the Internet, there has been
a growing need for wireless systems capable of supporting these services. Furthermore,
packet based systems improves infrastructure efficiency by using resources only when
2

data needs to be exchanged, instead of a circuit switched system that reserves a set
amount of resources for a time duration, irrespective of the usage. The 2G systems were
inadequate, thus requiring a new Third Generation (3G) system that offers a traditional
circuit switched system in parallel with strong packet switching capabilities. However,
due to the considerable developmental and monetary effort required to replace 2G net-
works with 3G networks, a group of overlay systems were introduced to bridge the
migration, known as 2.5 Generation (2.5G) systems. This interim change involved the
implementation and administration of packet switched systems over a circuit switched
system. Figure 1.1 illustrates the possible upgrade paths when transitioning from 2G to
3G systems.
���� �����
���� � ������
���������������
��
����
��
Figure 1.1: Upgrade path from 2G to 3G systems.
General Packet Radio Service (GPRS) was a popular overlay for GSM systems, capable
3

of achieving average data rates of 40-60 kbps [HRM03]. A more advanced overlay for
GSM, known as Enhanced Data rates for GSM Evolution (EDGE) was capable of achiev-
ing an average of 100 kbps and a maximum of 384 kbps [HRM03]. It also provided an
upgrade path for IS-136 systems. On the other hand, IS-95B was the popular 2.5G up-
grade for IS-95A systems, which supported data rates of 70-80 kbps and a maximum of
144 kbps [Kor03].
Migration to a full 3G based network occurred later than originally expected due to
the huge expenses involved in purchasing spectrum licenses and upgrading to the nec-
essary network components. One of the aims towards a 3G system was to consoli-
date existing incompatible wireless networks from 2G into a global seamless network.
The International Telecommunication Union (ITU) sought to produce a global standard
known as the International Mobile Telecommunications-2000 (IMT-2000) [Sam98] to sat-
isfy this. However, unifying all of the existing standards were concluded to be too
challenging. Instead, the IMT-2000 standard supports a range of different access tech-
nologies, allowing regulators and network providers to select a suitable system while
taking into account its existing 2G system and the migration path offered. The three
most prominent access technologies in the 3G family were Wideband Code Division
Multiple Access (W-CDMA), CDMA2000 and Time Division Synchronous CDMA (TD-
SCDMA), as described in [Kor03].
A collaborating group was formed, known as the 3rd Generation Partnership Project
(3GPP) [Kor03], which aims at specifying a mobile system that satisfies the IMT-2000
standard. This 3G system is known as the Universal Mobile Telecommunications Sys-
tem (UMTS). It encompasses the W-CDMA and TD-SCDMA access technologies that
can be upgraded from GSM and its related 2.5G systems (GPRS and EDGE). Using W-
CDMA access technology can achieve theoretical transfer rates of 5 Mbps uplink and 14
4

Mbps downlink, but in practice typical rates are 200 kbps uplink and 1-2 Mbps down-
link [Kor03]. For TD-SCDMA on the other hand, transfer rates of 16 Mbps for both up-
link and downlink are theoretically possible. The main competing standard of UMTS
was CDMA2000, which is being standardized by a separate group known as 3GPP2. It
provides the 3G upgrade option for IS-95B 2.5G systems, and can achieve theoretical
transfer rates of 1.8 Mbps uplink and 3.1 Mbps downlink [Kor03].
The packet based systems discussed so far mainly apply to Wireless Wide Area Net-
works (WWANs) [Tan02] with cell ranges of up to 30 km. Throughout the evolution
of such systems, other wireless packet based technologies have been introduced in par-
allel. These were primarily developed for IT terminal (e.g. PCs and laptops) based
communications and networking. The typical coverage and range of such technologies
are smaller compared to 2.5G and 3G WWANs.
A group of wireless communications that offer limited coverage range in the order of
only a few meters is classed as a Wireless Personal Area Network (WPAN). These are
usually utilized for communications between peripherals within a small area, such as
on a desk or person. The main purpose is to eliminate the clutter and inconvenience
associated with the use of wired connections, such as USB [USB00] and IEEE 1394
(Firewire) [IEE96], between interconnecting devices. As such, they need to be low in
cost and power consumption. These low bandwidth (typically less than 1 Mbps) sys-
tems were not intended to support high bandwidth networking topologies. Examples
of popular technologies include Bluetooth [Gro99] and ZigBee [ZIG].
The next set of systems offering a larger coverage area is known as Wireless Local Area
Networks (WLANs) [Tan02]. Coverage typically spans hundreds of meters and is suit-
able for providing network services within rooms and buildings. The purpose is to pro-
vide a wireless equivalent to widespread wired networking technologies, such as IEEE
5

802.3 (Ethernet) [IEE85]. It is a popular type of wireless network, which offers high
bandwidth (ranging up to 54 Mbps) network access for mobile computers. Through the
wireless connection, the mobile computers may access networks and nodes connected
through the infrastructure. A number of coverage areas can be interconnected to the
wired infrastructure, offering an extended coverage. The family includes technologies,
such as IEEE 802.11 [IEE99] and HIPERLAN/2 [HIP01].
A set of technologies that offers a larger coverage area compared toWLANs, but smaller
than WWANs, are known as Wireless Metropolitan Area Networks (WMANs) [Tan02].
They provide high bandwidth broadband access and offer coverage ranging in kilome-
ters. It is a wireless alternative to cable and DSL [SSCS02], providing a solution for areas
where wired broadband service was not viable. The dominant standard in this family
is known as IEEE 802.16 [IEE04b] (i.e. WiMAX), which has a significant amendment
known as IEEE 802.16e [IEE05c] that enables mobility support.
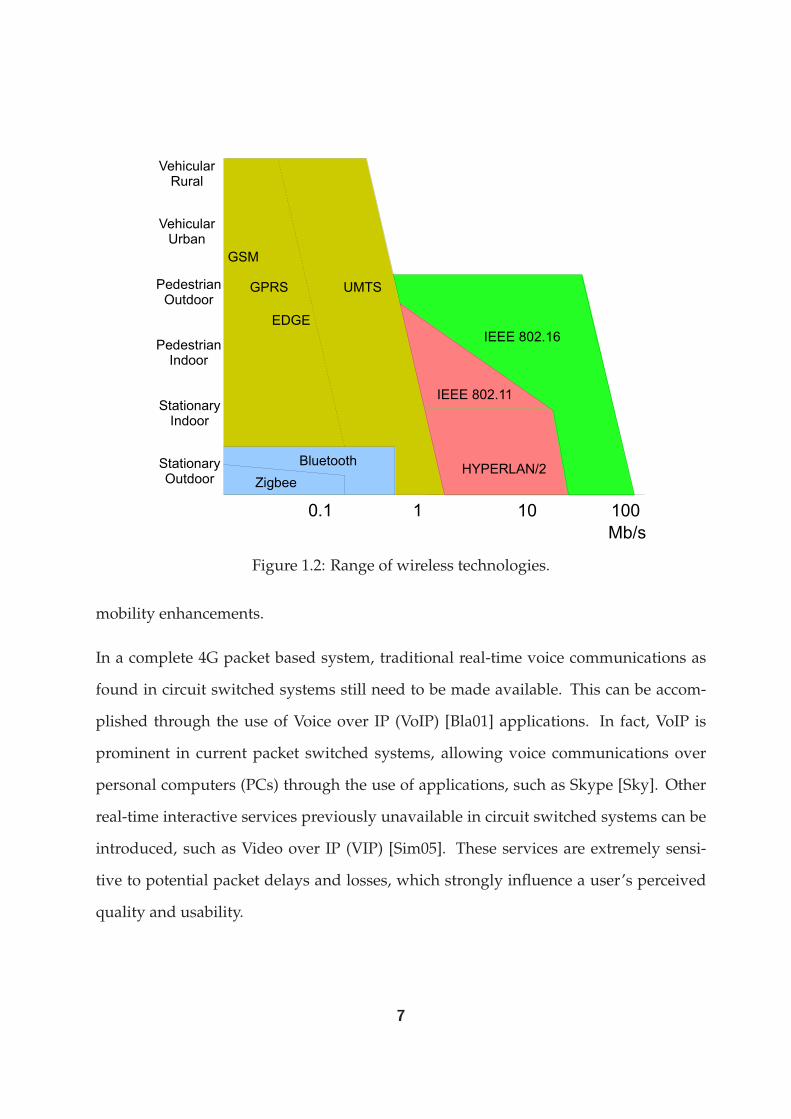
A complete view and summary of the range of wireless services discussed is illustrated
in Figure 1.2. With the broad range of different popular wireless packet based tech-
nologies that are available, there is a need to unify the range of systems and provide a
common platform where existing and new technologies can be integrated. This is the
primary aim of a Fourth Generation (4G) system [Lu02], which achieves this by utiliz-
ing a complete packet based infrastructure. It allows multi-technology capable mobile
terminals to perform vertical handovers (i.e. handovers across different technologies)
while maintaining services as it would for horizontal handovers (i.e. handovers within
the same technology). So far, the preference for 4G systems has been towards an all
Internet Protocol (IP) solution. It is capable of operating over almost any link layer and
allows upper layers (applications and services) to be easily integrated. Furthermore,
it has a number of developments favorable to wireless networks, such as security and
6
��� � �� ���
������� ��
������������
����������������
����������������
����������������
���������������� ������
�������
���
�� �
� ��
��!�
����"#�$���
%&�� '()*$
����"#�$��+
��*�
Figure 1.2: Range of wireless technologies.
mobility enhancements.
In a complete 4G packet based system, traditional real-time voice communications as
found in circuit switched systems still need to be made available. This can be accom-
plished through the use of Voice over IP (VoIP) [Bla01] applications. In fact, VoIP is
prominent in current packet switched systems, allowing voice communications over
personal computers (PCs) through the use of applications, such as Skype [Sky]. Other
real-time interactive services previously unavailable in circuit switched systems can be
introduced, such as Video over IP (VIP) [Sim05]. These services are extremely sensi-
tive to potential packet delays and losses, which strongly influence a user’s perceived
quality and usability.
7

1.2 Towards IEEE 802.11 Based Dense Cellular Networks
Circuit switched systems found in wireless 2G and 3G services, and the wired PSTNs
were designed to handle interactive voice calls effectively and efficiently with short
fixed delays and no losses. The reserved resources allocated throughout the lifetime of a
call, call admission control, and minimal interruptions during handovers, all contribute
to the system’s success. Users have evolved to expect the same, if not a higher level of
service as we move to a packet based 4G system.
IEEE 802.16(WiMAX)
UMTS
Multi-technologyterminals
Vertical handovers
WiMAX to UMTS handover
WLAN to WiMAX handover
IEEE 802.11Mesh Network
Figure 1.3: Future 4G networks supporting a range of technologies.
8

With the popularity and low provisioning cost of IEEE 802.11 systems, they are likely to
be a significant part of 4G networks as illustrated in Figure 1.3. There are pockets within
this system providing IEEE 802.11 access through cells arranged in a mesh topology.
The mesh structure, consisting of overlapping coverage areas, is used to support a high
number of users, provide redundancy and seamless connectivity.
However, IEEE 802.11 as it currently stands, suffers from a number of limitations caus-
ing it to be unsuitable for supporting real-time services to its full potential for a roaming
user over the described mesh environment. Mobile users within this system suffer from
handover disruptions as they move from one cell to another. Furthermore, since the
most popular medium sharing mechanism used in IEEE 802.11 is a distributed con-
tention based method [LLCF03], there is no reservation mechanism in place to protect
and manage the resources required by real-time applications. This problem still exists,
despite an amendment introduced in the form of IEEE 802.11e [IEE05a] to prioritize
traffic appropriately. In this thesis, as described in the next section and summarized
in Figure 1.4, we propose and investigate several strategies to overcome the described
limitations in order to successfully support real-time applications over an IEEE 802.11
mesh network.
1.3 Thesis Contributions
This thesis addresses the task of supporting time sensitive real-time applications over
IEEE 802.11 wireless networks. It focuses on the handover mechanism where data flow
interruptions can occur and admission decisions that affect the quality of existing con-
nections in the cell. Several novel contributions were made and are described below.
9

1.3.1 Improving Existing Mechanisms
Using popular IEEE 802.11 hardware available, we investigate the ability to optimize
handover parameters on commercially available implementations to achieve fast han-
dovers. The active scanning mechanism was primarily used, where probe exchange
timeouts were varied and specific AP identifiers were tried. A proprietary ad-hoc based
connection was also tested as a method that can be suitably used for fast handovers.
This work was useful in identifying components of handover delay and interim meth-
ods that can be utilized to minimize delays for benchmark and investigation purposes.
It also demonstrated that an adequately fast handover implementation to eliminate dis-
ruptions did not exists.
1.3.2 Dual Interface Smooth Handover
With the inability of a regular IEEE 802.11 interface to offer a robust and effective smooth
handover solution, we proposed a dual interface solution. As part of the proposal,
we describe a management driver that controls both interfaces to achieve smooth han-
dover, while not violating the current IEEE 802.11 operational standards and consider-
ing power consumption aspects. It differs from most previous approaches by: a) pro-
viding seamless handover, which was previously not possible with only a single inter-
face b) using a purely link layer solution without relying on upper layer (IP or 802.21)
mobility support.
10

1.3.3 Power Level Thresholds For Smooth Handover
For the dual interface to achieve smooth handover, it requires adequate time to setup
a new connection before the old disconnects. A suitable signal level threshold for trig-
gering the new connection must be set accordingly to meet this timing constraint. With
appropriate path loss models, we developed and investigated relationships that corre-
lated the signal level threshold required and MS’s speeds. Based on these relationships,
we demonstrate novel methods to calculate the thresholds required to minimize han-
dover packet loss for both constant and bursty traffic. This study is not restricted to
only dual IEEE 802.11 interface devices, but can also be applied to the general case of
multi-technology wireless devices.
1.3.4 QoS Based Handover Triggers
In the past, handover triggers has been primarily based on received signal levels. With
the increasing need of supporting users with required QoS levels, we proposed trig-
gers based on common QoS measures. This new approach is achieved by decomposing
end-to-end QoS requirements (e.g. delay or jitter) to give trigger thresholds on a given
link, based on the performance of the remaining network segments. Devices surpassing
these thresholds, triggers a handover to locate for an alternate point of access offering
the required QoS. The use of 802.21 facilitates the signaling and performance gathering
required across various technologies.
1.3.5 Channel Utilization Estimation And QoS Provisioning
As an MS supporting real-time traffic moves from one access point to another, in addi-
tion to ensuring the required resources are available from the new location, measures
11

must also be in place to protect the QoS of currently connected users. There are a num-
ber of studies on call admission control for IEEE 802.11e, but none have explored the
use of utilization thresholds for a mix of different traffic profiles in a given cell. Where
utilization is defined as the fraction of time the channel is being used. We studied the
empirical derivation of lookup matrices that can be used to estimate the maximum real-
time traffic utilization at a given state. The maximum utilization corresponds to the uti-
lization point where the performance of real-time flows exceeds its maximum tolerable
requirements. Together with a proposed call admission control strategy, we analyzed
its effectiveness compared to other similar measurement threshold based methods.
1.4 Organization
The remaining chapters of this thesis are organized as described below. Figure 1.4 il-
lustrates the contributions made in thesis and how individual components connect to-
gether creating a complete IEEE 802.11 wireless system supporting real-time applica-
tions.
Chapter 2 describes the relevant wireless protocol components used in this study. It also
presents and compares previous studies in handover improvement and load manage-
ment.
Chapter 3 presents and discusses the handover performance results for a range of com-
mercial IEEE 802.11 implementations and the various mechanisms available for perfor-
mance improvements.
Chapter 4 describes the proposed dual interface handover mechanism to achieve seam-
less handover. The mechanisms used to manage both interfaces and experimental re-
sults demonstrating smooth handover were detailed.
12

LLC
Dual Interface Manager
PHYPHY
802.11 MAC
802.11 MAC
Higher Layers
MS
Chapter 7Maximum real-time utilization availability and call admission control for protecting existing connections
Chapter 6Handover
triggers based on QoS
parameters
Chapter 5Set signal strength threshold for seamless handover and power saving
Chapter 4Manage dual interfaces for
seamless handover
Scanning for otherAccess Points
ActiveConnection
AP
Figure 1.4: Complete system diagram of research contributions.
Chapter 5 addresses the issue of selecting a suitable handover signal level trigger to
achieve smooth handover for multi-interface devices. The equations derived based on
signal path loss models were described, along with their application in more realistic
signal environments and different traffic types.
Chapter 6 describes a method of including QoS performance measurements as han-
dover triggers. It demonstrates how QoS requirements can be decomposed into trigger
thresholds for individual network segments in the connection path. Examples and per-
formance results were presented to highlight the possible benefits.
13

Chapter 7 details a call admission control methodology that is based on a set of maxi-
mum real-time traffic utilization lookupmatrices. The chapter describes how the lookup
matrices were obtained empirically and its use in a proposed measurement based call
admission mechanism. Its strengths were highlighted when comparing its performance
against other measurement based call admission schemes.
Chapter 8 concludes the thesis and offers a number of possible areas for future research.
14

Chapter 2
Mobility Management For WirelessNetworks
2.1 Introduction
The IEEE 802.11 Wireless Local Area Network (WLAN) working standard [IEE99] was
released in 1997 as a specification to provide local area communications between de-
vices over the industrial, scientific and medical (ISM) band. It has been widely adopted,
with many manufacturers marketing a range of wireless network interface cards (NIC)
and APs. It is a popular add-on to portable units, such as laptops and personal digital
assistants (PDA), providing connectivity and high data rate wireless access to an infras-
tructure network. Furthermore, it provides a cheap and convenient means of extending
a network.
It offers two modes of operation, namely infrastructure and ad hoc mode, catering for
different local communication needs. Both are illustrated in Figure 2.1. An ad hoc net-
work is typically made up of at least two IEEE 802.11 nodes to form an independent ba-
sic service set (IBSS). It is useful for forming a temporary network spontaneously among
15

IBSS
MS
MS
MS
(a) Ad hoc mode
BSS 1 BSS 2
ESS
DS
AP 1 AP 2MS
(b) Infrastructure mode
Figure 2.1: There are two network modes supported by IEEE 802.11. Ad-hoc (a) modeprovides temporary peer to peer communications between nodes within range of eachother, which is similar to Bluetooth. Infrastructure (b) mode is geared towards offeringconnectivity across the infrastructure of a larger wired network.
16

a group of nodes, where devices communicate directly in a peer-to-peer manner. This
is useful in situations where information only needs to be shared among a small group
of users. For example, in a corporate meeting where data needs to be shared among
associates with their laptops.
Infrastructure mode, on the other hand, comprises of APs interconnected to a wired
distribution system (DS) (e.g. Ethernet). The coverage area each AP provides is known
as a basic service set (BSS), which can be combined together through the DS to form an
extended service set (ESS). MSs connect to the network via the APs, allowing communi-
cations with other nodes through the DS. It is useful for situations where wireless users
need access to servers, wired stations, or other networks via a gateway. For example, in
a university or corporate wide network. It is the most popular mode, providing users
access to a broader network including connectivity to the Internet. The challenges faced
for supporting real-time applications on IEEE 802.11 in this study, will primarily use the
infrastructure mode as its main operational mode.
With the increasing use of VoIP [Bla01, Goo02], VIP [Sim05] and live video streaming,
there is added pressure for IEEE 802.11 to support these traffic types successfully. They
have strict QoS delay and loss requirements that can translate to poor usability if they
are not adhered to. This chapter presents a review on the state of the art and current re-
search activities on improving the performance of IEEE 802.11 for supporting real-time
applications. The focus is primarily on load management and handover performance,
both of which have not been adequately addressed when the original standard was re-
leased. The review looks at the research progression in both areas, highlighting the
different techniques used and the improvements gained.
The chapter is structured in the following manner. Firstly, a brief description of the
17
IEEE 802.11 protocol is provided, focusing particularly on the medium sharing mech-
anism in order to give the reader an understanding of the standard and appreciate the
research work presented in later sections. This is followed by a description of the IEEE
802.11e amendment including the additional mechanisms introduced to offer priori-
tized medium access to better support real-time traffic.
Following this, a comprehensive overview on load management and call admission
control studies in IEEE 802.11 is covered to demonstrate the control of quality of service
for real-time traffic flows in a congested cell and the short comings of each method.
An extensive review on prior work to improve handover performance in IEEE 802.11
to minimize roaming disruptions on real-time applications is then provided, covering
the techniques used and performance gains achieved. Next, to gain an appreciation
of the performance gains and targets required, the common codecs for VoIP and their
associated tolerances are presented. Finally, the chapter concludes with a summary of
outstanding issues on supporting real-time applications that need to be investigated
and how they are addressed in this thesis.
2.2 IEEE 802.11
2.2.1 Medium Sharing
The distributed co-ordination function (DCF) is the basic medium access scheme used
in IEEE 802.11. It allows users to share the wireless medium by using the carrier sense
multiple access with collision avoidance (CSMA/CA) algorithm and random backoff.
The carrier sense mechanism, used to determine a busy medium, can be provided by a
carrier sense signal generated by the physical layer or a virtual carrier sense determined
from the Network Allocation Vector (NAV) [IEE99].
18

A transmitting node on the shared medium waits for the medium to be idle for a DCF
inter frame space (DIFS) period before attempting to transmit. Otherwise, it defers the
transmission to a later time when the medium is free again.
In order to resolve contention between other transmitting nodes, it executes an expo-
nential backoff algorithm if a frame has already been sent (successfully or unsuccess-
ful), or if the medium was busy for the first transmission attempt. The backoff method
requires each node to select a random number between 0 and the Contention Window
(CW) value as the backoff counter. The CW number has values that are integer powers
of 2, minus 1 (i.e. n2 − 1 (n = 1, 2, 3, . . . )). It starts at a minimum value of CWmin and
increases at each retransmission attempt to a maximum of CWmax. The backoff counter
corresponds to the number of Slot Time (ST) the medium has to remain idle for be-
fore a node can transmit. If the medium is busy, the node defers the transmission until
the medium is idle again for a DIFS period before resuming to decrement the backoff
counter.
A transmitting node sending an individually addressed frame needs to receive an ACK
frame to confirm successful reception. The ACK frame is scheduled to be sent after the
medium has been idle for a short inter-frame space (SIFS) period by the recipient of the
frame. SIFS has a smaller value compared to DIFS, giving ACK frames priority over all
others.
If the transmitting node does not receive an ACK frame after a given time period, it
assumes a collision has occurred. It increases its CW value, extending the range of
random backoff times and repeats the backoff procedurewhen retransmitting the frame.
Figure 2.2 illustrates this process. For an in-depth description, please refer to the IEEE
802.11 standard [IEE99].
19

����
����
������ ���
���
�������� �������������
���� ������ ��� ���
����� ��
������������������������������������� ��� �� ���
� !"�#
�#������� �
�����$��%��&
�����$���������&
� ����'��
Figure 2.2: As for Ethernet, a random backoff mechanism is utilized in DCF. However, the backoff is done prior totransmitting a frame rather than only upon collisions [IEE99].
20

Anothermethod to share themedium is through the use of request to send/clear to send
(RTS/CTS) exchanges. This process requires a node to broadcast an RTS frame and re-
ceive a corresponding broadcast CTS reply from the destination before being allowed
to send data. This visible exchange across the network allows all nodes to determine
the future use of the medium via the Network Allocation Vector (NAV). The RTS/CTS
method has the advantage of reducing the likelihood of collisions and avoiding the hid-
den terminal problem [FGLA97]. The additional overhead required may be acceptable
compared to overheads incurred from frequent collisions. It is an acceptable trade off in
noisy networks where frequent collisions occur.
Overall, the DCF mechanism works effectively for sharing the medium fairly among a
group of nodes. However, it does not account for the traffic type that is being trans-
mitted on the medium. This leaves nodes supporting real-time traffic susceptible to
unnecessary degradation due to contention from surrounding nodes hosting non time
critical applications. The IEEE 802.11e [IEE05a] amendment addresses this by offering
differentiated access, which is discussed in the following section.
2.3 IEEE 802.11e
2.3.1 Traffic categories
In order to prioritize and offer differentiated access, four sets of Access Categories (ACs)
were defined in IEEE 802.11e, as summarized in Table 2.1. In order from the lowest to
the highest priority, they are AC BK, AC BE, AC VI andAC VO.Note that the table also
illustrates, a set of User Priorities (UPs) that are the same as that in IEEE 802.1D [IEE04c]
and how they are mapped to the appropriate AC in IEEE 802.11e. The relationship
with IEEE 802.1D enables compatibility with switching and bridging devices across an
21

Priority User Priority 802.1D AC DescriptionSame as 802.1D Designation
Lowest 1 BK AC BK Background2 - AC BK Background0 BE AC BE Best Effort3 EE AC BE Best Effort4 CL AC VI Video5 VI AC VI Video6 VO AC VO Voice
Highest 7 NC AC VO Voice
Table 2.1: IEEE 802.11e access category mappings [IEE05a].
Ethernet network supporting QoS.
The required user priorities and QoS are typically communicated by the application di-
rectly or via the operating system. There are a number of studies and methodologies on
facilitating the required communication and mapping, however it is outside the scope
of this thesis.
2.3.2 Medium Sharing
The need for prioritizing different traffic classes to effectively support real-time appli-
cations has lead to the development of IEEE 802.11e Enhanced Distributed Channel
Access (EDCA) [IEE99]. In contrast to IEEE 802.11 that only has a single queue and set
of access parameters to support all outgoing frames, IEEE 802.11e has a set for each AC.
Frames at the front of each AC queue have differentiated access to the medium using
contention parameters assigned specifically for the AC’s priority level.
Each AC has their own Arbitration Inter Frame Space (AIFS[AC]) instead of DIFS (used
in IEEE 802.11), minimum andmaximumbackoff window sizes (CWmin[AC] andCWmax[AC]),
and a backoff counter. The value of AIFS[AC] is determined through the assigned AIFS
22

Number (AIFSN[AC]) as
AIFS[AC] = AIFSN[AC] × Slot time+ SIFS. (2.3.1)
Note that when AIFSN[AC] is set to 1, AIFS[AC] is equal to the value of DIFS in 802.11
DCF. By selecting the appropriate set of contention parameter values for each AC, the
channel contention can be prioritized probabilistically. The higher the AC priority, the
lower the values of AIFS[AC], CWmin[AC] and CWmax[AC], in order to gain more fre-
quent access to the channel.
The EDCA mechanism improves certainty on the use of the channel through the trans-
mission opportunity (TXOP) facility. During a TXOP period for a particular AC, an MS
may be allowed to transmit multiple data frames from the same AC, as long as the time
to do so including overheads does not exceed the maximum transmission opportunity
time (TXOPLimit[AC]). The facility provides another means of controlling the use of the
channel to different priorities, in addition to the DCF based mechanisms.
Each AC queue maintains their own backoff counter when competing for the medium.
If there are multiple AC queues within the MS whose backoff counter expire at the
same time, the frame with the highest priority AC will be chosen by the virtual collision
handler. The AC queues in effect are not only competing with other MSs, but also each
other within the same MS. Note that the retransmission counter only increments when
a real collision occurs between other competing MSs, and not when a virtual collision
occurs between ACs within the same MS.
Each queue is primarily in place for buffering frames when the inter-arrival time of out-
going frames is smaller than the channel access time. For example, when a burst of
23

����
������� ���
���
�����������
�������������
���� �� �� ��� ��� ���
���������
������������� ��������� ������� ������������������
� !"�#
�#������� �
"�������
����$�%
����$&%
"�������'����������
(��)����*������+
,������*������+
Figure 2.3: Prioritizing in IEEE 802.11e DCF is accomplished by varying the AIFS period and contention window size.The larger the AIFS period and contention window size, the less probability it has of winning the medium, and hencehas a lower priority.
24

frames arrive or the channel is momentarily congested. For high priority ACs support-
ing real-time traffic, the queues should never reach a saturated state where the inter-
arrival time is always smaller than the channel access time, leading to excessive frame
delays and losses [EV05, CZTF06].
The importance of differentiated access offered by IEEE 802.11e was demonstrated in
[GN02]. It showed that using the regular IEEE 802.11 DCF mechanism, the lack of pri-
oritizing quickly pushed the average access delay for a single G.729A VoIP flow above
70 ms, due to the additional contention from six best-effort flows. However, the dif-
ferentiated access in IEEE 802.11e was able to maintain the VoIP average access delay
below 2.6 mswith the same number of best-effort flows. The study in [CPSM03] demon-
strates a similar scenario, where a lack of differentiation in IEEE 802.11 DCF reduces the
throughput and increases the delays of both video and voice flows, upon arriving best-
effort flows. Under IEEE 802.11e EDCA, the differentiation restricts the throughput of
best-effort connections instead, allowing voice and video connections to achieve their
required levels.
Results obtained using the NS-2 IEEE 802.11e simulationmodel [ns-b] illustrate the ben-
efits of differentiation in Figure 2.4. It can be seen that without differentiation (i.e. all
AC have the same contention parameters), the throughput of AC VO flows are pushed
lower as AC BE flows join the BSS. However, with differentiation (with parameters:
CWmax[AC VO] = 7, CWmax[AC VO] = 15, AIFSN[AC VO] = 2, CWmin[AC BE] = 31,
CWmax[AC BE] = 1023 and AIFS[AC BE] = 7), the entering AC BE flows have no visible
impact on the throughput of AC VO flows.
To understand the utilized capacity in IEEE 802.11e EDCA, it is useful to look at the time
the channel is occupied for, in the event of either a successful or collided frame. This
not only includes the time to send the relevant frame, but also the overheads that are
25

0
1
2
3
4
5
6
7
8
9
10
11
0 200 400 600 800 1000 1200
Thr
ough
put (
Mbp
s)
Time (s)
AC_VOAC_BE
(a) No differentiation
0
1
2
3
4
5
6
7
8
9
10
11
0 200 400 600 800 1000 1200
Thr
ough
put (
Mbp
s)
Time (s)
AC_VOAC_BE
(b) Differentiation
Figure 2.4: Throughout of AC VO and AC BE access categories in IEEE 802.11e withand without differentiation.
26

Access Scheme Success Overhead Collision Overhead802.11 DCF Basic DIFS+ SIFS+ TACK DIFS802.11 DCF RTS/CTS DIFS+ 3 × SIFS+ TRTS + DIFS+ TRTS
TCTS + TACK802.11e EDCA Basic AIFS[AC] + SIFS+ TACK AIFS[AC]802.11e EDCA RTS/CTS AIFS[AC] + 3 × SIFS+ TRTS + AIFS[AC] + TRTS
TCTS + TACK802.11e EDCA TXOP AIFS[AC] + 2 × SIFS+ TRTS + AIFS[AC] + TRTS
TCTS + TXOPLimit[AC]
Table 2.2: Overhead timing for transmitting a frame successfully and during a collision,for both 802.11 DCF and 802.11 EDCA [PM03].
part of the access scheme, which is summarized in Table 2.2. Note that TRTS is the time
to transmit an RTS frame, TCTS is the time to transmit a CTS frame, and TACK is the time
to transmit an ACK frame. These overheads are in addition to the time a frame occupies
the wireless medium at the operating transmission rate. The overheads for 802.11 DCF
have also been included for comparison purposes. Note that the overheads account for
ACK frames sent, and therefore, are not applicable to broadcast frames where acknowl-
edgments are omitted. The listed overheads will be referred to later in Chapter 7 when
determining the channel utilization.
2.3.3 Admission Control
In order to implement call admission control, the IEEE 802.11e amendment introduces
a set of frames to facilitate the required information exchange and allow an AP to en-
force an admission decision. It adds an additional level of request/response exchanges
similar to the authentication and association process. However, rather than being done
when an MS is connecting, it is done on a per flow basis.
The add traffic stream (ADDTS) request frame allows a MS to send a request to the AP
to add a new traffic flow. The request contains a traffic specification (TSPEC) of the
27

new flow to be added. The AP may use the TSPEC to determine if it has the required
resources to admit the new flow and sends an ADDTS response frame indicating if the
flow is to be admitted or not. Additionally, a delete traffic stream (DELTS) frame is
available for deleting a traffic flow. It may be sent by either an AP or MS, to which no
response is required from the recipient.
Only the facilities to support call admission control have been specified by the IEEE
802.11e amendment. The call admission control decision process, including the param-
eters and measurements it relies on is left open for manufacturers. They will most likely
draw upon various studies on call admission and load management strategies in IEEE
802.11 that will be reviewed in the following section.
2.4 Load Management in IEEE 802.11 Networks
There have been extensive studies on load management [RLR94, Zan97, Sal99, HZ00,
WMC00, KKK+01, SPRAC03, TBGH03], including the field of Call Admission Control
(CAC), but they were primarily applied to wireless cellular systems supporting voice
calls. In these studies, they face the same issue of managing limited radio resources
among a large number of users whom are gaining access from a multitude of locations.
However, they only deal with voice calls alone, where there is usually a direct relation-
ship between the available capacity and the number of connections in the cell. Most
of the principals do not apply to environments with contention based shared mediums
and highly variable traffic user types, as found in 802.11 networks.
In this section, various resourcemanagement schemes for 802.11 networks are analyzed.
Both client and network decision based mechanisms are covered. Particular attention
28

(i) Discover APs within range
(ii) Handover decision at the MS based on collected
AP informationMS
AP 1 AP 3
AP 2
Figure 2.5: Client controlled handover leaves the target AP selection to the MS (client).
will be given to the decision criteria and parameters used, investigating their effec-
tiveness for improving network performance and preserving MSs’ QoS requirements.
Methods for both the IEEE 802.11 and IEEE 802.11e amendment will be reviewed and
discussed.
2.4.1 Client Controlled
A client controlled decision is one where AP selection is made at the MS, as seen in
Figure 2.5. The common method implemented where the MS discovers surrounding
APs and selects the one offering the best signal quality and strength, is a good example
of a client controlled approach.
The work in [PL01] shows an MS selecting an AP not only based on its signal strength,
but also on a call level criterion. In this case, it is the number of MSs associated to the
AP, aiming to spread MSs evenly across APs to avoid congestion points. The results
29

demonstrate a balanced distribution and improvement in network performance com-
pared to a scenario using only signal strength as its criterion. However, this method
is only effective for call based networks where each MS incur the same traffic load. In
an 802.11 network, where the load contribution from one MS to another may be signifi-
cantly different, this method could still result in an unbalanced network.
A more effective approach is through packet level criteria, as highlighted in [BT02].
The study introduces two packet level metrics, which are measured at the AP. The first,
known as “Gross Load”, estimates the average number of slots required by MSs con-
nected to the AP to successfully transmit a packet in the cell. This metric depends on
the transmission error probability of each MS, which in turn determined by its trans-
mission characteristics, such as fading and signal to noise ratio. Next, is the “Packet
Loss” metric, obtained by measuring the average packet loss in a cell. As for the “Gross
Load” metric, it also reflects on the transmission error probability of each MS. Both met-
rics were shown to be good indicators on the busyness and performance of each cell,
making ideal parameters for admission control and load balancing. The study demon-
strated that the use of these parameters when choosing an AP, improved the packet
loss and blocking probability by a factor of ten compared to a distance based selection
method. The calculation of each metric was simplified by the assumption that all MSs in
the cell share the same traffic pattern and load, which is rarely the case in real networks.
Another similar approach of estimating the load at an AP from the MS can be seen in
[VPD+05]. It estimates the achievable downlink bandwidth by observing the beacon
delay time, which is the time when a beacon frame is scheduled for transmission to
the actual time of transmission. This delay was shown to be a good indicator of the
current contention on the medium and the load in the cell. The achievable uplink band-
width can be estimated in a similar fashion by observing the delay time of outgoing
30

data frames at the MS instead. Using commercially available IEEE 802.11 implementa-
tions, the study demonstrated that the estimation was accurate by up to approximately
7% of the actual bandwidth supported on the AP. Although it serves as a useful met-
ric when selecting an AP, it does increase the time and complexity of choosing an AP
during a handover. Furthermore, the downlink estimation relies on knowing the sched-
uled time for transmitting a beacon frame, which may be inaccurate depending on the
implementation and clock skew.
The work in [CCZvdB06] also measures the load on each AP during the handover scan-
ning process. Typically, as utilization and the number of MSs increase, contention on the
operating channel escalates, increasing the average backoff delay when sending frame.
It uses this fact by measuring the round trip delay between the scanning MS and sur-
rounding APs to indirectly gauge the utilization on each AP. For increased reliability, an
average measurement is obtained through multiple probe exchanges. However, as for
[VPD+05], this has a side effect of increasing the overall handover delay. To remedy this,
they instead measure the average round trip delay of data frames exchanged between
the AP and currently connected MSs separately at the AP, which is then advertised to
scanning MSs. By selecting an AP using this measurement improves the throughout by
up to 25% and reduces frame delay by 15% compared to a signal based approach. The
difficulty with relying on such small delay measurements is that it is influenced by a
range of factors, such as the transmission rate and time varying channel interference,
which can lead to unreliable measurements and poor decisions.
Another study where APs advertise load based metrics to surrounding MSs can be seen
in [SP06]. It proposes an “expected throughput” metric that is calculated for each AP
at the MS based on the received signal strength and measurements advertised through
31

beacon frames. These measurements include the AP’s capacity and average transmis-
sion delay spent serving it’s current clients. Through a range of different scenarios, the
study demonstrated that the “expected throughput” metric acts as an effective indicator
for selecting the appropriate AP. The ability to draw upon multiple metrics allows an
MS to make the right decision under a broad range of scenarios compared to using only
a single metric. However, it was tested under the assumption that the APs are always
saturated with a fixed frame size. This is unrealistic for networks that typically support
a range of traffic types or operate in an unsaturated state. The latter occurs if the load is
low or a call admission control mechanism is in place.
A similar method where APs periodically advertise its usage status can be seen in
[XL04a, XL04b, XLC04], however, it is targeted for 802.11e systems. It was proposed
for a client based admission control mechanism, where APs advertise its channel usage,
allowingMSs to control its utilization in order to maintain the QoS of existing flows. An
AP determines the amount of time available for each AC, also known as the transmis-
sion budget, bymeasuring the channel time usage and subtracting it from themaximum
time available. It does this for every beacon interval and advertises it to surrounding
MSs along with the beacon frame. From this, MSs receiving the beacons can determine
if additional flows can be added or if existing flows can increase its time usage. The
study demonstrated that using the proposed client based admission control, stable de-
lays under 10mswere obtained, compared to having no admission control where delays
frequently went above 30 ms. As mentioned, the determination of an AC’s transmission
budget, depends on the maximum time available for the AC. The sum of the maximum
time available for each AC should reflect the maximum channel capacity required for a
stable unsaturated state. Unfortunately, this optimal level is difficult to determine in a
contention based medium and was not addressed in the investigation.
32

(i) Admission request(can include surrounding APs
scanned)
(ii) Admission decision can be made on AP or sent to access server
Access Server
(iii) Admission response(accept/reject MS or may direct to a different AP)
EthernetSwitch
Movement
AP 1 AP 2 AP 3
MS
Figure 2.6: Network controlled handover leaves the handover target selection and ad-mission control decision on the network side, either through an AP or a dedicatedserver.
2.4.2 Network Controlled
In a network controlled decision, an entity on the network (e.g. an AP, or access server)
is responsible for admission decisions for incoming MSs or traffic flows, as illustrated
in Figure 2.6. It may specify which AP to connect with in addition to a call admission
decision.
The study in [BBV02] illustrates a good example of a network controlled solution. In
the proposed mechanism, when an MS first enters a network, it scans for surrounding
APs and connects to the one offering the best signal quality. This initial connection may
33

not offer the best load balanced solution, but allows communications with a centralized
network access server. The MS provides its required bandwidth tolerances and a list
of surrounding APs. From this, the access server selects an AP with the bandwidth
availability that best meets the MS’s requirements. The MS is then directed to switch to
the chosen AP if its different from the current serving AP. Compared with no admission
control, the proposed mechanism was able to balance the load across APs more evenly
and reduce the average frame delay by half. A very similar access server decision based
approach was proposed in [BMSFR05], except it was defined more generally to support
heterogeneous wireless access.
Other studies based on a centralized server approach were seen in [BRP05, TN06]. They
proposed a method where the centralized server controls congestion status on an AP
by varying its transmission range, as illustrated in Figure 2.7. The basic idea, is when
the AP’s utilization raises above a specified threshold, it reduces its transmission range.
This eliminates MSs near the cell boundary, which typically consume more channel
time by operating at a lower transmission rate and suffering from channel errors. When
the utilization level drops below a specified threshold, the AP increases its transmis-
sion range, expanding it’s coverage to support more MSs. The utilization level between
the upper and lower threshold represents an optimal level where an AP’s transmission
range remains constant. This method of utilization control is known as cell breath-
ing, due to the contracting and expanding nature of the AP’s transmission range. Both
studies demonstrate how this method can successfully spread throughput between two
cells evenly, increasing the overall supportable network throughput and greatly reduc-
ing the number of collisions. Video traffic sessions in [BRP05] were shown to have a
50% reduction in lost frames using this approach. In the presence of heavy users, a po-
tentially problem is the cells may contract too aggressively, leading to large dead-spot
34

UnderloadedExpand coverage to
accommodate more MSs
BalancedCoverage remains
the same
OverloadedContract coverage
to reject MSs
AP
Figure 2.7: The AP extends or reduces its range in order to accept more connectionswhen underloaded or reject existing connections when overloaded, respectively.
areas and leaving a number of users with no service.
Another network decision approach was studied in [VAK04]. However, it was done in
a distributed manner, where APs exchanged reports to reveal its utilization with neigh-
boring APs. From these reports, each AP is able to determine the average utilization
among neighboring APs, which can be subsequently used as a criterion to make an
admission decision, as illustrated in Figure 2.8. APs with utilization below the average
value by a specified nominal amount δ are classified as underloaded and able to support
more traffic. If the utilization is between the average and δ above average, the AP is con-
sidered balanced and takes no action. Finally, if the utilization exceeds δ or more above
35

Figure 2.8: Admission decision based on how far above or below (δ) the average utiliza-tion lie on the current AP [VAK04].
the average utilization, the AP is considered overloaded and terminates an existing con-
nection. The idea is MSs with their connection terminated will hopefully associate with
an adjacent underloaded AP. It was shown that using this scheme, an MS was able to
connect with another AP to reduce the overall frame delay from approximately 450 ms
to 8 ms and distribute the load evenly. Note that any attempts to associate with a bal-
anced or overloaded AP are denied. For this reason, there is the disadvantage of an MS
potentially taking a long time to connect with a new AP. Other disadvantages include
the additional functionality required to send reports between APs and choosing a suit-
able value for δ. The latter was not addressed in the investigation and left as part of the
future work.
The approach described in [BCV01, VCBS01] investigates the use of a virtual MAC al-
gorithm in 802.11e to determine an admission decision at the AP. Decision criteria, such
as packet delay and loss, to determine if the requirements of a new flow can be met,
are obtained through the use of the virtual MAC algorithms. The algorithm operates
36

concurrently with the real applications and MAC, mimicking their behavior. It emu-
lates packets in the form of virtual packets generated by a virtual application, which
goes through a virtual buffer and MAC. It even mimics collisions, since it knows when
multiple emulated MAC sources are sending at the same time. However, unlike the
real MAC, the virtual packets are not transmitted. It is merely in place to emulate the
real MAC to provide predictable performance measures. New flows requested on the
AP are only admitted if they satisfy the required decision criteria, as indicated by the
virtual MAC algorithm with the additional flows. The authors choose to have the ad-
mission control mechanism located on the AP to achieve a globally stable state in the
network. Performance results demonstrated that voice packet delays were maintained
at an average of 10 ms even in the presence of best-effort flows. However, this method
has the disadvantage of requiring additional computation cost at both theMS and AP to
operate the virtual algorithms. Furthermore, the real MAC may be influenced by exter-
nal interfering sources and channel errors, which is unaware by the virtual algorithms.
This may result in inconsistencies from the estimated performance compared to the real
performance.
Similar to the previous study, [GZ03] makes its call admission decisions and dependent
criteria measurement at the AP. The study proposes an 802.11e based admission con-
trol based on two metrics that act as an indicator of the current channel utilization. If
the metric is below a lower threshold, the highest priority inactive flow is admitted.
However, if the metric is above an upper threshold, the lowest priority active flow is
stopped. This method of accepting and rejecting a connection based on two thresholds,
is very similar to [VAK04]. The AP is considered in a stable ideal state when the metric
is between the lower and upper thresholds, where no admittance action is taken. One
of the metrics used, is known as the relative occupied bandwidth, which measures the
37

time the channel is busy exchanging data frames (successfully or not) over a set period.
Another metric, known as the average collision ratio, measures the number of collisions
over the total number of transmissions. Both metrics were shown to be effective for
call admission by improving the average medium access delay by more than 50% com-
pared to a system without admission control. The relative occupied bandwidth metric
exhibited the best performance, with the lowest access delay and highest throughput.
Although it is easy to monitor both metrics, the difficulty is choosing appropriate lower
and upper threshold values. The study defines a set of thresholds to demonstrate the
proposed admission control mechanism, however further investigations for choosing
appropriate thresholds were left as part of the future work. The measurement based
approach in [GZ03] is used as a benchmark to our proposed mechanism presented in
Chapter 7.
The investigation in [ZCF04] and its extension for 802.11e [CZTF06], use a channel busy-
ness ratio as an indicator of the current utilization similar to the relative occupied band-
width measurement metric presented in [GZ03]. In this study, the AP limits MS access
to ensure the channel busyness ratio is below the threshold that would push the channel
into a saturated (congested) state. The utilization level just before saturation is referred
to as the maximum achievable utilization. The maximum achievable utilization level
used in this study was predetermined empirically through simulations. Together with
the current measured utilization (busyness ratio), the AP can determine the remaining
available utilization on the channel. This estimation is the key metric used by the AP
for determining an admission decision. The study also incorporates an additional delay
based admission criterion, where the estimated delay is determined by introducing a
queuing model as part of the analytical model. Furthermore, they propose a rate con-
trol mechanism that operates in tandem with the call admission control scheme to limit
38

the transmission rates allowed by best effort flows. Using the proposed mechanism,
they were able to achieve approximately 90% channel utilization while maintaining an
average frame delay of 6.5 ms and 12.3 ms for voice and video traffic, respectively.
A similar channel utilization measurement was used in [CCC+05], however, the mea-
surement is done for each AC rather than a combined overall measure seen in [GZ03,
ZCF04, CZTF06]. Having measurements for each AC allows the flexibility of restrict-
ing a particular AC over others by setting separate utilization limits for each. The study
suggested that the channel utilizationmeasurements can be done through busy and idle
histogram measurements made available in the IEEE 802.11k amendment (described
further in Section 6.2.6). Furthermore, the study accounts for the additional bandwidth
introduced by the new requesting flow, caused by channel errors and collisions, through
the surplus bandwidth allowance. This allowance for each AC is estimated through the
measured average error probability over the channel and the average collision proba-
bility for the relevant AC. The admission control scheme was tested using a single AC,
where the mean frame delay was maintained below 200 ms for a utilization of 90%,
compared to 1.2 s without admission control.
As for earlier studies in 802.11e call admission control, the mechanism proposed in
[CSS05] ensures there is sufficient available utilization to accommodate the new flow
before admitting it. However, in this study, the AP negotiates a minimum transmis-
sion rate with the MS at the time of admittance. This is important due to the change of
transmission rate that can occur according to link conditions. Furthermore, the study
introduces a mechanism to enforce the allocated channel time for an admitted flow by
setting the TXOP limits and access frequency via the EDCA parameters. By having a
constant allocated channel time, the QoS requirements for a flow can only be met if the
transmission rate is equal to or higher than the agreed rate at the time of admission.
39

The study showed that by using the proposed mechanism, despite a flow lowering its
transmission rate, the QoS of other connected flows remain unaffected. Only the QoS of
the flow that changed its transmission rate is impacted.
The main decision criterion used in [CZTF06, CCC+05, CSS05] to determine if a new
flow is accepted, is if the combined utilization is less than the maximum achievable
utilization possible on the channel. Although, [CCC+05, CSS05] did not specify what
the maximum achievable utilization values should be, [CCZvdB06] presented a set of
simulation results suggesting appropriate values. It extends the work in [ZCF04] by
investigating the maximum achievable utilization at saturation for different frame sizes
and number of flows. The study identified that the maximum achievable utilization is
typically in the range of 0.90 to 0.95 of the total capacity of the channel. However, with
the different access category parameters and combination of traffic types available in
802.11e, the maximum utilization value may vary drastically, suggesting further inves-
tigations are required.
Analytical Model Based
Another commonly studied approach on capacity analysis and call admission control
was through the use of analytical models. These were based on a Markov Chain model
for the backoff window size of the 802.11 DCF process and are used to study its theo-
retical performance [Bia00, CCG00]. The studies derived relationships for computing
saturation throughputs, and demonstrated the accuracy of the obtained values. Fur-
thermore, they showed that DCF performance depended strongly on the channel access
parameters (e.g. contention window sizing, frame size, number of users), which in turn
directed how the parameters can be tuned dynamically to enhance throughput.
40

The study in [DCB05] shows a method to use the analytical model presented in [Bia00]
to identify a decision criterion. From the model, they derived a distribution of the MAC
delay experienced by each frame. Using the relationships and setting the probability
of having the access delay below a specified value, the number of MSs that should be
admitted can be determined. Additional MSs seeking admission once the determined
quota has been reached are ignored by the AP. It relies on sharing the medium using the
RTS/CTS handshake mechanism in order to enforce the admission decisions. Admitted
MSs are able to communicate with the AP using the RTS/CTS mechanism as normal.
However, an AP will not respond with a CTS to a non admitted MS, effectively pushing
it to the highest backoff level after successive failures to send, which in turn reduces
its probability of accessing the channel. The study demonstrated that the proposed
approach was able to maintain the probability of a specified access delay above the
configured level. Unfortunately, this approach restricts the network to the RTS/CTS
mechanism for sharing the medium.
An analytical model based admission control for IEEE 802.11ewas introduced in [PM03],
which utilizes the transmission probability equation derived in [Bia00]. The equation
can be used to determine the transmission probability of each flow, which in turn allows
the achievable throughput to be determined for all flows combined. A new incoming
flow is assigned the parameters of the closest matching flow already admitted in the
cell. The new flow is accepted only if the predicted achievable throughput, determined
with the new flow and its adopted parameters, is less than the total combined required
bandwidth of all flows admitted in the cell, including the new flow requirements. In
this case, the predicted achievable throughput is used as the decision criteria for the ad-
mission control mechanism. The study showed that saturation of the cell was avoided
by using this approach, allowing all flows to have access delays less than 100 ms.
41

A problem regarding the analytical based methods discussed so far, is that the mod-
els used were derived under saturated conditions. The saturation of a cell means the
maximum available utilization does not adequately support the combined bandwidth
required by the MSs. Effectively MSs in this situation would be queuing data frames
faster than it can send. This rapidly fills and overflows the queue, resulting in large
packet delays and losses [CZTF06]. A better approach is to develop analysis and deci-
sion criteria based onmodels prior to saturation, which applymore closely to a properly
managed cell.
The study in [EV05] overcomes this by formulating an analytical model for the case be-
fore saturation is reached. It introduces an additional state in the Markov Chain model
where a station remains in an idle state waiting for a frame to send. A geometric pa-
rameter λ is used to control the transition probability of having a frame to send. Using
the equation for throughput, which was derived from the model, an admission control
strategy was proposed. It aims to avoid congestion while maintaining a high through-
put and fairness among MSs. It was shown to double the overall throughput used
compared to without an admission control scheme, while fairness is maintained. One
problem with this unsaturated model is choosing an appropriate value for λ. Choosing
a specific value to match up with a given application frame rate can be difficult and re-
quires further investigation. Furthermore, the values may vary across MSs significantly
due to the variety of applications available.
The work in [KTB04] also developed an analytical model based on the study in [Bia00],
but geared it towards conditions on the channel prior to saturation. Based on the Pois-
son traffic arrival process and anM/G/1 queuing system, an expression of the through-
put for each MS was obtained. To apply this model to an 802.11e EDCA system, the
equivalent number of competing entities approximation was introduced. This allows
42

the unsaturated throughput equations for 802.11 DCF to apply to a particular 802.11e
AC using the associated AC parameters. Similar to [PM03], the achievable throughput
was used as the decision criterion for an admission control mechanism. The achievable
throughput is determined for each AC upon an incoming flow request. This flow is
only admitted when the maximum bandwidth required for each AC is satisfied. The
investigation demonstrated that the admission control mechanism was able to limit the
number of flows admitted to satisfy the throughput requirements for all ACs.
The various analytical models proposed for IEEE 802.11e can be effectively implemented
at the AP for deciding if a new flow should be admitted. However, they fail to produce
a metric that indicates the maximum utilization available in a cell, which can be used as
a maximum limit in measurement based admission control and load balancing systems.
Furthermore, the analytical models were derived with the assumption that all flows
have the same traffic model which is unrealistic. In practice, a network can support a
mix of both bursty and constant bit rate traffic.
2.4.3 Handling Lower Priority Best-effort Traffic
The admission of best-effort traffic flows is usually handled differently to real-time
flows, as demonstrated in [XLC04]. Even though their performance will be poor, best-
effort flows can be admitted to a fully utilized cell, since there are no QoS requirements
on these flows. Although their contention parameters are set to provide lower priority
access (as discussed in Section 2.3.2), they still have a probabilistic chance of accessing
the channel using EDCA, which may affect currently connected real-time flows as the
number of flows increase. To minimize such effects, the work in [XLC04] introduces
the option of dynamically adjusting the contention parameters of the best-effort AC,
43

Saturation Bandwidth(Maximum Bandwidth without effecting QoS)
Bandwidth
Guard-band
Available forReal-time traffic
Channel Bandwidth
Maximum allowable Real-time Bandwidth
0
Figure 2.9: A guard-band is used to limit real-time flows to avoid starving best-efforttraffic and absorbing traffic spikes on existing connections.
lowering its priority to access the channel, which in turn reduces its load on the chan-
nel. Another approach is to dynamically adjust the data rate of best-effort flows at the
link layer by limiting its frame rate according to the busyness of the channel, as seen
in [CZTF06]. Alternatively, the data rate can be adjusted directly on the application.
However, this relies on the application having rate limiting capabilities and supporting
communications directly with the link layer.
With contention parameters set to maximize real-time traffic access over best-effort traf-
fic, it is possible to starve best-effort flows excessively. Studies in [ZZ04, XLL07] in-
troduce the concept of a guard band to reserve a portion of the channel for best-effort
flows. This guard band, as seen in Figure 2.9, also acts as a safe guard for absorbing
over admission and bandwidth spikes that can occur from bursty real-time flows.
For schemes utilizing a guard band, a new real-time flow is only admitted if it does
not push the total best-effort bandwidth below the set minimum value. The best-effort
44

traffic displaced due to an incoming real-time flow is not as simple as subtracting the
contribution by the incoming flow, as it is a contention based probabilistic displacement.
In [ZZ04], the displaced amount is estimated by multiplying the incoming real-time
traffic amount by a factor determined by the ratio of the average best-effort frame length
over the average frame length of the incoming flow.
In this section, an overview of various IEEE 802.11 loadmanagement and call admission
control studies was provided, focusing primarily on the measurements and conditions
used for making a decision. The studies reiterated the importance of admission con-
trol in order to maintain the QoS of current admitted flows and avoid pushing a cell
into saturation, which can quickly deteriorate performance. Following this section, a
discussion on handover disruptions caused by an MS transitioning from one AP to an-
other is provided. This is another factor that can cause disruptions in real-time traffic
flows and need to be addressed accordingly.
2.5 Handovers in IEEE 802.11 Networks
Variousmodern cellular networking technologies, such as GSM andW-CDMAdescribed
in [Rap01], have been designed with a strong emphasis on supporting real-time voice
communications. Furthermore, these technologies are typically aimed toward service
provider based networks, which are carefully planned and tightly managed. As a re-
sult, handovers required by roaming users are generally handled on a timely manner
with unnoticeable interruptions.
Later in this section, it can be seen that the 802.11 handover process is long and po-
tentially disruptive. The performance is only acceptable for traffic with no real-time
requirements, which was originally thought to be the bulk of the traffic handled by the
45

protocol. However, the rise of real-time packet based communications meant that the
802.11 protocol had to be capable of meeting the QoS demands. The poor handover
performances is no longer acceptable, generating an interest for its improvement. Vari-
ous studies and strategies to improve the 802.11 handover process are surveyed in the
remaining section.
Earlier, it was described that an IEEE 802.11 infrastructure network configuration can
consist of multiple APs interconnected via a DS. As an MS traverses through the net-
work away from it’s currently connected AP, the signal quality between both degrades.
Eventually, to maintain the connection with the network, the MS has to locate and con-
nect with a new AP offering better signal quality. The process of an MS switching be-
tween APs is known as a handover. If the handover occurs between two APs within the
same subnet, it is known as an intra-network handover, requiring only a link-layer han-
dover. On the other hand, a handover between two APs in different subnets is known
as an inter-network handover. This requires not only a link-layer handover, but also
a network-layer handover. Throughout this study, focus will be placed exclusively on
improving 802.11 link-layer handovers.
The link-layer handover in IEEE 802.11 involves steps similar to the initial process of
connecting to the network when the MS first activates, as outlined in [IEE99]. The first
step is a discovery process for locating surrounding APs within range. Next, is the
authentication step that provides a form of security to access the network. This is nec-
essary for wireless systems, such as 802.11, due to the physically open nature of the
medium offering little access restrictions. Finally, an association step needs to be com-
pleted to map the MS to an AP, allowing the DS to successfully deliver messages to the
MS via its associated AP.
46

Probe Request
Probe Response
Probe Request
Probe Request
Probe Request
Probe Response
Channel 140 ms
Channel 440 ms
20 ms
20 ms
Channel 2
Channel 3No AP
No AP
MS AP 1 AP 2
Figure 2.10: Active scanning offers a direct and quicker approach for discovering sur-rounding APs compared to passive scanning.
2.5.1 Scanning
Two methods are available for the discovery process, as defined in [IEE99], known as
passive and active scanning. Passive scanning involves theMS sequentially listening on
each channel for advertised beacon frames generated byAPs. The default beacon period
is typically 100 ms, so it is recommended that the scanning period for each channel is
not much smaller, in order to prevent missed beacons. Active scanning is a more direct
approach of discovering APs. As outlined in [IEE99], it follows the following steps for
each scanned channel:
47

Beacon
Beacon
Channel 1
Channel 4
Channel 2
Channel 3
20 ms
20 ms
20 ms
20 ms
MS AP 1 AP 2
Figure 2.11: Passive scanning not as quick as active scanning, but does not incur addi-tional traffic overheads on the medium.
1. Wait for ProbeDelay time to expire for clear channel assessment or
PHYRxStart.indication to be received.
2. Perform the Basic Access procedure to gain access of the channel.
3. Send a probe response.
4. Reset and start a ProbeTimer.
5. If there is no traffic detected on the medium when the ProbeTimer reaches Min-
ChannelTime, then skip to the next step (6). However, if the ProbeTimer reaches
48

MaxChannelTime, then process all received probe responses.
6. Clear NAV and scan the next channel
The more direct approach of active scanning typically results in a more timely response
from an AP compared to waiting for a beacon frame in passive scanning. This reduces
the time spent on each channel, resulting in a quicker overall discovery process. As
analyzed in [MSA03, VK04, GBC07], the time to scan each channel using active scanning
is smaller compared to passive scanning, with a typicalMinChannelTime of about 20 ms,
andMaxChannelTime of about 40ms. However, active scanning has the disadvantage of
adding additional traffic and contention on the medium. Figure 2.10 and 2.11 illustrate
the differences between both scanning methods.
A detailed study on the IEEE 802.11 handover procedure in various commonly avail-
able network interface cards (NICs) was done in [MSA03]. The study confirmed the
handover delay consisted of three components: active/passive scanning, authentication
and association/re-association, which is consistent with the standard. Furthermore, it
was established that probe exchanges were required during an active scan in order to
discover surrounding APs and found to contribute to more than 90% of the overall han-
dover delay. This assumes an open or shared key WEP authentication method was
utilized as specified in the standard. However, in a more secure external authentica-
tion system offered through IEEE 802.11i (described in Section 2.5.4), depending on the
mechanism used and the distance of the authentication server, it may incur a delay
comparable to the scanning delay. This was demonstrated through empirical studies in
[MZBS07], which obtained IEEE 802.11i based authentication delays of up to 330 ms,
which is comparable to active scanning delays seen in [MSA03]. Regardless, to support
real-time applications with minimal disruption, it is necessary to reduce the scanning
delay.
49

One may suggest to reduce the time spent scanning each channel in order to shorten
the overall scanning process. This means trimming the beacon scanning time for pas-
sive scanning, or MinChannelTime and MaxChannelTime for active scanning. However,
reducing these parameters comes at a cost of increasing the chance of missing adver-
tised probe responses or beacon frames. In particular, for high traffic BSSs where the
APs may not gain use of the medium quick enough to send a probe response, or where
multiple APs are operating over the same channel and there is insufficient time for the
MS to capture all responses. This may result in a poor selection of an AP as a handover
target and/or lead to an increase in the number of times the scanning procedure needs
to be repeated before a suitable AP target is discovered.
The overall handover delay with active scanning in [MSA03] was found to depend sig-
nificantly on the combination of NIC and AP used, ranging from 59 to 397 ms. Deeper
analysis of the probe exchanges found that the ProbeTimer depended on the number of
probe responses received and network card implementation, which attributed to the
large variation in handover delay across manufacturers. From the findings, the authors
proposed a set of suggestions to reduce the handover latency. These include, having the
network provide hints about surrounding APs, interleaving the active scanning proce-
dure with normal data connectivity and minimizing probe responses by limiting the
number of APs responsible for processing probe requests.
The work in [GBC07] extends the investigations in [MSA03] by analyzing the active
scanning procedure in further detail for each wireless NIC implementation. It analyzes
the order of channels scanned, the number of probe request frames sent per channel
and the time spent on each channel. The results indicate that the scanning behavior
varies depending on the combination of wireless NIC and software used. This can in
turn be used to optimize the scanning algorithm and network configuration tominimize
50

scanning delay.
Further study on the active scanning procedure, conducted in [VK04], found that the
resulting latency depended on a number of factors. The first is the number of used
channels within range, which causes the ProbeTimer to extend (to MaxChannelTime) for
each occupied channel. The load and number ofMSs operating on a channel are the next
two factors, increasing the access time when sending probe messages due to contention
with regular traffic. Based on empirical results from the investigation, the authors sug-
gested aMaxChannelTime of approximately 10 ms to minimize the active scanning delay.
They also suggested minimizing the number of channels scanned as an optimization for
reducing the handover delay even further.
A method of reducing the number of scanned channels was presented in [KPP+04]
through the use of neighbor graphs. Each individual AP generates a neighbor graph
over time bymonitoring handovers through re-association and IAPPmessages received.
Topological and channel information about each neighbor can be stored and sent to con-
nected MSs. An MS knowing its neighboring APs and the channels they operate on,
can selectively scan those channels when it performs the discovery process during han-
dovers, as illustrated in Figure 2.12. This method is also used in the handover procedure
presented in [HTT06] to minimize delays and losses.
Some of the factors resulting in long handover delays mentioned in [VK04] can be mini-
mized through simple enhancements to the standard. The proposal in [LZA03] achieves
this by prioritizing management (signaling) traffic over regular data traffic, and reserv-
ing a set time for the AP to respond after a probe request is received. All other nodes
within the cell receiving the probe request are not allowed to transmit during this time,
which reduces the number collisions. Furthermore, as long as traffic is detected during
MinChannelTime, the probe response is considered successful and listening for further
51

Selective scan channels 1 and 6,
due to neighbor graph information.
AP 2(Channel=6)
AP 1(Channel=1)
AP 3(Channel=11)
Neighbor GraphAP 1 ± Channel 1AP 2 ± Channel 6
EthernetSwitch
MovementMS
Figure 2.12: Neighbor graphs provides hints to the MS in order to reduce the number ofchannels scanned during a handover.
retransmissions is unnecessary. Increased handover reliability was demonstrated in a
noisy environment, along with a decrease in handover delay. However, it has the dis-
advantage of missing probe responses sent by other APs on the same channel.
Earlier, the investigation in [MSA03] suggested interleaving the active scanning proce-
dure with normal data exchanges to reduce handover delays. The study in [MMN05]
achieves this through periodic discovery phases during normal data connectivity with
an AP, as illustrated in Figure 2.13. A different channel is scanned during each phase,
building up a list of surrounding APs. The frequency of scans accelerate as the signal
level drops below a certain level, corresponding to the urgency of a required handover.
Another proposal as part of the study allows the MS to discover its neighboring APs
through its current AP as part of the (Re)Association Response frame. This potentially
eliminates the need for scanning, resulting in faster handovers. However, if it is unable
52

to associate with any of the APs listed, it falls back to the regular scanning approach.
Both methods produce better handover delays compared to the standard approach, re-
sulting in average delays ranging from 2 to 58 ms using interleaved scanning and 2 to
123 ms using the adjacent AP list scheme, depending on the network scenario.
The work in [MN05a] uses a similar method as [MMN05] to scan for surrounding APs
during data exchanges. However, it suggests the use of a signal trigger to start the in-
terleaved scanning procedure and network layer handover (if required). The trigger
allows sufficient time to complete the link layer scanning procedure and network layer
handover (if required) before the current connection with an AP is lost, assuming a fixed
MS speed. A second trigger was used to include network layer IPv6 prefix informa-
tion in probe response frames, allowing the MS to organize a new Care-of-Address early,
should a change in subnet be required during the handover. This proposal also takes
advantage of network layer bi-casting mechanisms, allowing the MS to receive from
both its old and new Care-of-Address during the network layer handover to minimize
packet loss. Significant benefit from this method was shown only when a handover to
the anticipated target AP was successful, lowering the link layer handover to 2 ms and
42 ms overall when the network layer delay was included.
Another approach to combine the scanning and data exchange process was presented
in [LG06], except they introduce an optimization to reduce the number of scan cycles
required. The number of channels scanned was limited, for example, by restricting
it to scan only the non-overlapping channels 1, 6 and 11. This has the advantage of
dedicating more bandwidth for data exchanges rather than scanning and reduces the
anticipation required to trigger the scanning routine. However, it has the downfall of
potentially missing APs operating on channels that are not part of their optimized list.
53

AP 2 (Channel = 6)
AP 1 (Channel = 1)
Regular data exchange on
channel 1
Probe exchange on different channels
Interleave period
MS
Figure 2.13: Interleaving active scanning with normal data exchange.
The discovery method used during interleaved scanning is not restricted to active scan-
ning, as demonstrated in [RS05]. Rather than switching channels periodically to un-
dergo probe exchanges, it captures advertised beacons if an AP is present. However,
performing this quickly to minimize disruptions during normal data exchange can be a
challenge, particularly with the long listening times required to capture beacon frames.
As a result, the study proposes the synchronization of advertised beacon frames known
as SyncScan, shown in Figure 2.14. Each AP operating on a dedicated channel adver-
tises its beacon frames at a known time difference relative to another AP on the previous
channel. From this, anMS knows when to switch to the next channel for scanning based
54

Regular data exchange on
channel 1
Beacon received on channel 6
Set time differencefrom current beacon
Synchronized
Beacon received on current channel
EthernetSwitch
AP 2 (Channel = 6)
AP 1 (Channel = 1)
MS
Figure 2.14: Synchronized interleaved scanning using SyncScan.
on the set time difference from the received beacon frame of its currently connected AP.
This method allows theMS tomaintain measurements from neighboring APs over time,
thus reducing the handover delay. However, it requires strict synchronization andman-
agement between APs.
55

2.5.2 Authentication
There are a number of options available for the authentication process. The simplest
method is described in the original standard known as the open system authentication.
This method basically requires no authentication, where an AP (set to open system au-
thentication) replies with a “successful” authentication frame upon receiving a request
from an MS.
Another method of authentication stated in the IEEE 802.11 standard, is known as
shared key authentication. By having an MS and an AP sharing a wired equivalent
privacy (WEP) encryption key, an MS is authenticated by demonstrating knowledge of
this key with the AP. An MS without the key or using the wrong key fails the authen-
tication and is refused communication rights with the AP. This authentication method
involves exchanging four frames between the MS and AP to prove they have the same
shared key, as seen in Figure 2.16 (a). Unfortunately, the WEP system has proved to be
quite insecure, as studied in [Wal00]. It is vulnerable to attacks where the shared key
can be deduced, jeopardizing access security to the network. The IEEE 802.11i [IEE04a]
amendment addresses this issue by introducing new security protocols that do not suf-
fer from WEP’s numerous flaws, improving the pre-shared key confidentiality. As the
description of the improved specification is beyond the scope of this thesis, please refer
to the amendment for more details.
2.5.3 Association
Association is the final stage to complete the connection between the MS and AP. The
purpose is to start an association service that informs the DS of the MS’s mapping to
an AP. The method used to manage the association service is not specified by the IEEE
56

Movement
(i) AssociationExchange
(ii) Update switchmapping
(iii) Old path terminated
(iv) New path created
EthernetSwitch
CN
MS
Old AP New AP
Figure 2.15: The signaling done using IEEE 802.1d propagates through the network treeto update the MS’s new location.
802.11 standard.
Typically, an AP is bridged to a DS with interconnecting Ethernet switches. In this case,
the DS learns about the newly connected MS through a mechanism such as the IEEE
802.1d spanning tree protocol [IEE04c], as illustrated in Figure 2.15. This protocol is
also used to update mappings in switches as an MS roams, connecting from one AP
to another. A number of vendors have implemented their own alternative proprietary
solution to inform the MS’s previous AP of the change in AP and updating Ethernet
switches to reflect the change [RL00].
57

Earlier, the work in [LZA03] demonstrated how reserving a set time period for probe re-
sponses can be used to reduce the search phase latency during handovers. The method
presented in [GW99] uses a similar approach, but applied to the association messages
exchanged. It achieves this by handling the association exchanges during the contention
free period (CFP), restricting contention to only MSs arriving at the AP and undergoing
the same association process. This is in contrast to the regular method specified by the
standard where the association messages must compete with other management and
data frames.
Prioritizing handover signaling frames, as studied in [LZA03] and [GW99], to achieve a
lower handover delay is also equally important in IEEE 802.11e networks, as shown in
[CC07]. This is particularly important in a cell loaded with the highest priority AC VO
(interactive voice) type traffic. It involves the reservation of periodic time windows,
through the use of controlled contention period (CCP), where only handover signaling
frames are allowed. A fuzzy adjustment method was also introduced in the study to
adaptively adjust the CCP period for achieving a good balance of prioritizing handover
frames and system utilization.
2.5.4 External Authentication
In large enterprise networks consisting of many users, having a pre-shared key is un-
practical and leaves the network in a compromising situation. A method proposed to
handle such networks, fully supported by the IEEE 802.11i [IEE04a] amendment, was
by using IEEE 802.1X’s key distribution system [IEE01]. This authentication process
takes place after the MS associates with an AP, where it is able to communicate with
the authentication server. For this reason, the AP needs to use an open system authen-
tication, allowing an MS to establish a connection without the need for a pre-shared
58

(i) Authentication (Request)
(ii) Authentication (Challenge)
(iii) Authentication(Encrypted Challenge)
(iv) Authentication (Response)[Success or Failure]
Ethernet
APMS
(a) Local
(i) Association (Request)
(ii) Association (Response)
(iv) 802.1x Authentication with
Server
(v) Controlled (Approved)port access
(iii) Uncontrolled (Limited) port access
Ethernet
AuthenticationServer
(RADIUS)MS
AP
(b) External
Figure 2.16: Two possible authentication options available to gain network access.Method (a) offers less security compared to the network enterprise approach in (b).
key. However, this connection between the MS and AP is limited and known as the
uncontrolled port, only allowing authentication exchanges between the MS and an au-
thentication server via the AP. The protocol between the AP and authentication server
is not specified by IEEE 802.11i, although RADIUS is typically chosen [BHE+04]. If the
authentication exchanges with the MS are successful, the AP allows the MS to access
the controlled port where it can exchange data traffic with the network. This process is
illustrated in Figure 2.16 (b).
59

Using the IEEE 802.1X authentication methods as specified in the IEEE 802.11i amend-
ment, can involve long handover delays due to lengthy exchanges with the authenti-
cation server. A method used to reduce this latency was demonstrated in [PC02a] and
[PC02b]. The aim is to reduce the need for communicating with the authentication
server as the MS moves from one AP to another. They proposed a centralized neighbor
selection algorithm, known as Frequent Handoff Region (FHR), which selects a set of
APs based on their location and the MS’s mobility pattern. The number of neighbor-
ing APs selected depends on the MS’s application service requirements and movement
frequency. More neighboring APs are selected if the application cannot tolerate service
delays and/or the MS expects frequent handovers due to mobility. The security key
information and context are distributed to neighboring APs, as shown in Figure 2.17.
This reduces authentication server communications when the MS selects the neighbor-
ing AP as the next target. Simulation results presented in the investigation demonstrate
a reduction in handover delay and AP buffering requirements. However, the preemp-
tive caching comes at a cost of incurring additional signaling traffic on the backbone
network. The investigation in [PJKC05] considers this trade-of, aiming to balance be-
tween the signaling traffic from distributing the MS’s context and the handover latency
reduction gained from storing the MS’s context in neighboring APs. A good balance be-
tween the two conflicting variables was achieved by choosing an appropriate handover
probability threshold. The MS’s context is only transfered to a neighboring AP, if the
handover probability from the current AP to the neighboring AP is above the chosen
threshold.
Further work on identifying neighboring APs as future handover targets was demon-
strated in [MSA04] and [TCHC05]. As mentioned earlier, the work in [MSA04] gen-
erates a neighbor graph for each individual AP over time by monitoring handovers
60

AP 2(Channel=6)
AP 1(Channel=1)
AP 3(Channel=11)
Neighbor GraphAP 1 ± Channel 1AP 2 ± Channel 6
EthernetSwitch
Movement
Receiving security context information for MS
Transferring security context information for MS
MS
Figure 2.17: Neighbor graphs can also be used to pre-authenticate neighboring APs toreduce the handover time.
through re-association and IAPP messages. This can then be used to narrow down
neighboring APs to transfer the MS’s context. On the other hand, [TCHC05] equips
MSs with a positioning system to determine its location and estimate its movement vec-
tor. Together with a server to store location information about each AP, the potential
target APs can be determined.
Another idea to reduce the impact of handovers was demonstrated in [PZCC03], where
a method was proposed to recover frames that were normally lost during a handover.
As illustrated in Figure 2.18, it achieves this by buffering failed frames at the MS’s cur-
rent AP when consecutive transmission failure occurs (possibly indicating a handover).
If the MS does complete a handover, its new AP sends an update frame to the DS prop-
agating to the old AP. At this point, the old AP forwards the buffered frames to the DS,
61

where it is re-routed to the newAP and delivered to theMS. Outgoing packets at theMS
are also buffered during handover, which are later transmitted once the new connection
establishes. Although this method prevents excessive frame losses during handover, it
does not eliminate the delay caused by buffered frames. Therefore, this feature is only
useful for traffic with no timing constraints.
The study in [CS05] proposes a similar idea of frame buffering and forwarding between
APs to prevent handover losses. It has been directed specifically as an IAPP enhance-
ment, therefore, not only does the mechanism apply to intra-network (link layer), but
also to inter-network (IP layer) handovers. This is possible since IAPP is an IP based
protocol, where forwarded frames can be transmitted using TCP/IP. The handover la-
tency for an inter-network change is the same as that of the intra-network change, since
frames can be forwarded as soon as the link layer handover is complete. This IAPP
frame buffering and forwarding scheme was also utilized in the handover scheme pro-
posed in [HTT06].
2.5.5 Multiple Interface Support
One of the first to study the use of two IEEE 802.11 interfaces to provide seamless han-
dovers is [Oht02]. The proposal uses a proprietary mode known as “pseudo ad hoc”
available in legacy Prism 2/2.5/3 chipsets using the HostAP driver [Hos], which al-
lows communications between interfaces operating in the same mode. All interfaces
in this mode has the same BSS ID (zero ID) and support only data frame exchanges.
Interfaces within range and operating on the same channel are able to exchange data
frames with one another through broadcast frames. It does not handle or support any
IEEE 802.11 management frames (e.g. beacon, probes, authentication, association, etc.)
and the contents of data frames are forwarded to be processed by upper layers. The
62

(i) Connection terminated for
handover
(ii) Buffer unsuccessful
frames
(iii) New connection established
(iv) Update DS(v) Update
propagates to old AP
(vi) Forward buffered frames
to new AP
Movement
New AP Old AP
MS
Figure 2.18: Frames can be forwarded from the old AP to reduce frame losses during ahandover. However, these frames arrives at the cost of being delayed by approximatelythe length of the handover delay.
handover performance using this mode is further investigated in Section 3.3.3.
By using “pseudo ad hoc” mode, the study in [Oht02] effectively eliminates the link
layer, relying solely on the network layer (in this case MIPv6 [JPA04]) for mobility sup-
port. An MS discovers APs through advertised IP layer router advertisements. Having
two NICs allows normal communications with the network to continue with one, while
the other monitors router advertisements to look for the best AP. When a better AP is
found, the scanning card establishes the new connection. Once registration (obtaining
a new care-of-address) completes, the old connection disconnects. This soft-handover
(make-before-break) approach allows for a smooth handover with no packet losses or
delays. The proposed solution also has a positive side-effect of reducing overhead by
eliminating link layer management traffic resulting in less contention on the wireless
63

network.
A similar solution employing soft-handover using two IEEE 802.11 interfaces can be
seen in [IN05], except it utilizes regular link layer infrastructure operation. It relies on
MIPv6 for the soft-handover process, requiring each AP to be synonymous to an access
router (AR), operating on a different subnet. As the second interface registers a new
care-of-address with the MS’s home agent (HA), it sets the bi-casting option to send
packets destined for the MS’s home address to be forward to both the care-of-address
of each interface. Sending to both interfaces result in duplicate frames, which are re-
quired to reduce packet losses during handovers and are managed appropriately. The
bi-casting option can be deactivated after the second interface has received a binding
acknowledgment (BA) from the HA. The study also considers the additional power
consumption caused by having a second interface. The additional consumption was
negligible when only enabling both interfaces at the same time to complete the han-
dover process (approximately 2 seconds).
Rather than rely on the network layer (MIPv6) to handle handovers between two inter-
faces, the solution presented in [RRL06] supports purely link layer handovers between
two APs. When one interface on the MS completes the handover on the new AP, the MS
updates its routing table to map its IP address to the new MAC address. Furthermore,
the new interface sends a gratuitous ARP to update the ARP cache on thewired network
so frames can be correctly routed back to the new interface. This study follows closely
to the dual interface solution presented in Chapter 4, however, there are a number of
key differences. The approach presented in this thesis conducts the investigation using
simulation models through the OMNeT++ [OMN] simulator. Whereas [RRL06] imple-
ments a prototype based on two commercially available 802.11b interfaces. The latter
allows real world performance results to be captured, however, lacks the flexibility to
64

explore different scenarios.
Another significant difference is our proposal manage both interfaces to share a single
MAC address and appear as a single interface. It is more transferable to commercial
applications where a single card can share two radio interfaces, which will be increas-
ingly more common as the IEEE 802.11n[IEE09] amendment gains traction. Further-
more, compared to the solution in [RRL06], which continuously probes for surrounding
APs at set intervals, the proposed method in this thesis operates the inactive interface
only when a handover is triggered in order to conserve energy. The results presented
in this thesis also explore the limitations of providing seamless handover depending on
the scanning method used to discover surrounding APs and the coverage area overlap
required between adjacent APs.
2.5.6 QoS Handover Triggers and Criteria
With the handover studies reviewed so far, the initiation of handovers and AP selection
have primarily been based on signal strength (e.g. RSSI) measurements. This may lead
to congestion as users tend to localize in certain areas of the network. Earlier it was seen
how various studies were able to mitigate congestion through load management and
call admission strategies. If a cell exceeds the capacity allocation, the AP responsible for
call admission often forced a handover on lower priority flows or MSs until the capacity
resumes to an acceptable level. An alternative to this approach is to have handover
triggers based on parameters relating to QoS.
There are a number of possible handover criteria that can be used as suggested in
[MZ04, Abo05]. Some of these include link reliability (e.g. channel errors and signal
to interference and noise ratio) and resource availability (e.g. available bandwidth and
65

access delays). The study in [ZJD03] triggers a handover based on the available band-
width advertised as part of the beacon frames. This is similar to the study in [VPD+05]
discussed earlier in Section 2.4.1 that can also make handover decisions based on the
available bandwidth. However, instead of being advertised in beacon frames, it uses the
beacon delay time described to gauge the bandwidth. The study in [FV08] combines the
available bandwidth along with packet error rates into a metric known as the “residual
throughput” to be used as a handover trigger parameter. All studies demonstrated sce-
narios that manage to avoid congestion, improving the overall network throughput. In
this thesis, the similar use of QoS handover triggers is presented in Chapter 6. However,
it focuses on a strategy to set trigger thresholds based on the required end to end QoS.
2.5.7 Additional IEEE 802.11 Standards To Support Mobility
An IEEE 802.11f [IEE03] recommendation, also known as inter-access point protocol
(IAPP), was approved in June 2003. Its primary purpose was recommending suitable
DS capabilities that allow multi-vendor AP interoperability interconnected via IEEE 802
LAN components. In terms of handover support, it provides functionality to maintain
the MS’s unique association as it roams through the DS and allows a MS’s context infor-
mation to be exchanged between APs. As an MS moves to a new AP, any link layer de-
vice within the DS, such as a switch or a bridge, is updated to forward the MS’s frames
to the new AP. The transfer of a MS’s context information between APs facilitates faster
handover. For example, transferring security information from the old AP to the new
AP can shorten or even eliminate the required re-authentication exchanges between the
MS and authentication server. Although the IEEE 802.11f recommendation defined a
number of useful mobility mechanisms, the lack of interest in deploying such a system
led to it expiring past its trial use recommended practice period and was withdrawn in
66

early 2006.
In order to provide a comprehensive report to a roaming MS enabling better decisions
when selecting an appropriate AP to connect with, the IEEE 802.11k [IEE07] amendment
was created. First published in 2008, the amendment introduces a set of requests and
responses on additional pre-handoff information, includingmeasured physical and link
layer statistics. They include:
• Channel load
• Noise histogram
• Station statistics (e.g. average access delay, no. of associated MS, channel utiliza-
tion)
• Location
• Neighbor report
• Link measurements (i.e. RF characteristics of link)
These reports may be used by MSs and APs to better manage the network and improve
roaming decisions. It is complementary to most of the ideas and proposals put for-
ward in this thesis. Being able to disseminate information on neighboring APs and link
measurements from the current AP can minimize the need for scanning and improve
the handover delay. However, this requires communications between APs through the
backbone DS which is difficult to achieve across BSSs that are managed independently
from each other. The neighbor list report also presents the proposed dual interface so-
lution (Chapter 4) a simpler method for discovering suitable handover targets and im-
prove its ability to provide seamless handover.
67

The additional QoS dependent measurements offered, such as the channel load and ac-
cess delay can be utilized in the proposed QoS based handovers (Chapter 6) to trigger
handovers based on measurements at the AP. The same QoS measurements from sur-
rounding APs can also be used to consider the ability to support the MS’s required QoS
when selecting a new AP.
Another amendment introduced in 2008 to the IEEE 802.11 family to enhance handover
support and performance, is IEEE 802.11r [IEE05b]. Typically, if an MS accesses a net-
work requiring external pre-shared key authentication (e.g. IEEE 802.1X’s key distribu-
tion system) and admission control, after (re)associating with a new target AP, it needs
to undertake further frame exchanges to re-establish the authentication and be granted
admission before resuming its communications. These additional steps lead to a greater
handover latency that can be disruptive to real-time traffic flows. The amendment ad-
dresses this by provisioning additional services allowing these steps to be completed
before or during the (re)association process. The configurations can be done through
the current serving AP, avoiding the need to interrupt the active connection. However,
it does not eliminate the need for the discovery process of surrounding APs, which still
results in a disruptive handover.
2.6 Performance Requirements for VoIP
Throughout this chapter, we have looked at various strategies to improve handover
delays, and the use of call admission control and load balancing to achieve performance
levels suitable for real-time applications. In order to determine whether improvements
from the reviewed studies and proposed in this thesis (outlined earlier in Section 1.3) are
adequate, it is important to recognize the tolerance levels of these applications. In this
68

section, we will review the limitations and tolerances of relevant real-time applications,
in particular VoIP, to give an understanding of the performance required and identify
suitable goals.
It is worth noting that users of applications categorized as best-effort traffic, such as file
transfers andWeb services, are highly tolerant to delays and jitter. In fact, the short term
handover latency of approximately one second or less, and the temporary increase in
medium access delays observed earlier, would rarely be noticed or bother a user. Best-
effort traffic typically operates over the transmission control protocol (TCP) [Tan02] that
provides flow control, ordered delivery and guaranteed delivery. By using TCP any
lost frames due to handovers, interference or congestion can be recovered, but at a cost
of adding additional delays to the delivery of recovered frames. However, as for the
discussed short term delays, it does not affect usability.
VoIP on the other hand, does not share the same level of tolerance exhibited by best-
effort traffic. Due to the interactive and time sensitive nature of voice conversations,
users are highly sensitive to any delays and changes in audio quality. Many different
codecs exist for VoIP, influencing the voice quality, error correction ability and tolerances
to packet loss, delay and jitter. Table 2.3 provides a summary of some of the popular
VoIP codecs available. Due to the low bandwidth requirements of G.729, it is typically
the popular codec over WLANs [Fin07].
According to [Goo02], ITU-T G.114 recommends that for acceptable use, the one-way
end-to-end delay should be 0 to 150 ms for local user voice applications and 150 to
400 ms for international connections. With a typical delay budget for G.729 of approx-
imately 100 ms [Goo02], which includes packetizing, encoding and jitter buffer delays,
50 to 300ms remains to accommodate for delays through the wireless and backbone net-
work. With average end-to-end latencies through the backbone network in the range of
69
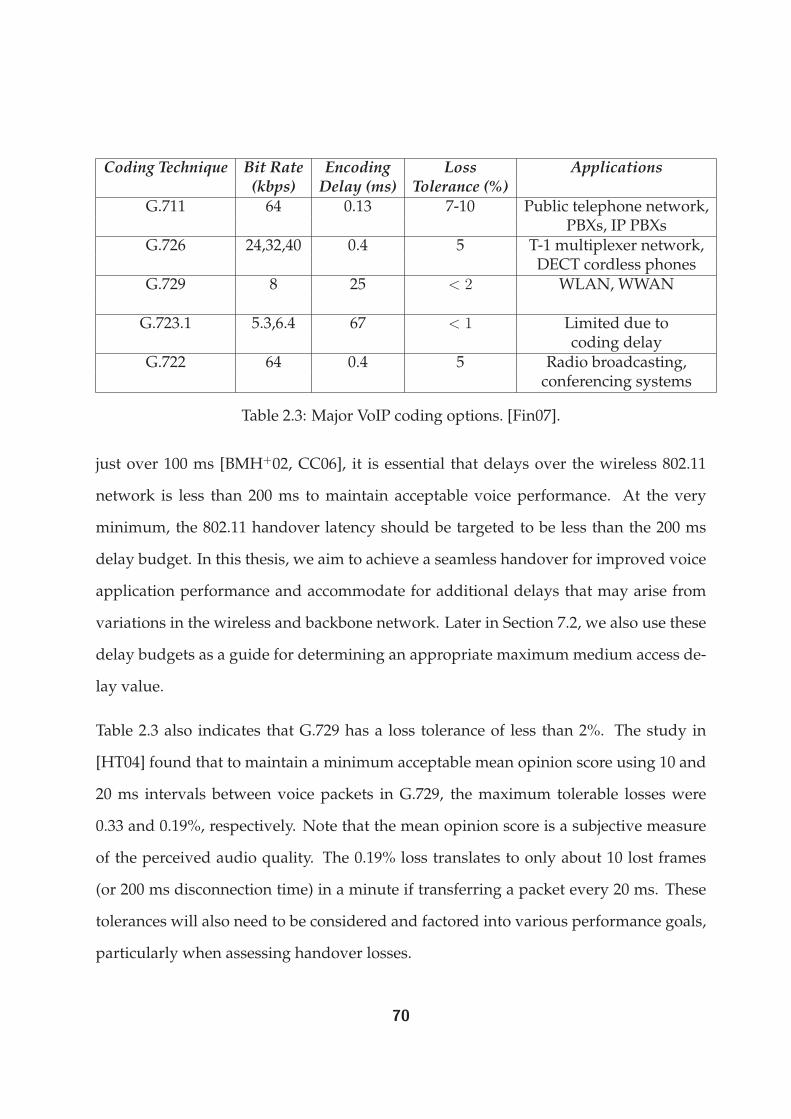
Coding Technique Bit Rate Encoding Loss Applications(kbps) Delay (ms) Tolerance (%)
G.711 64 0.13 7-10 Public telephone network,PBXs, IP PBXs
G.726 24,32,40 0.4 5 T-1 multiplexer network,DECT cordless phones
G.729 8 25 < 2 WLAN, WWAN
G.723.1 5.3,6.4 67 < 1 Limited due tocoding delay
G.722 64 0.4 5 Radio broadcasting,conferencing systems
Table 2.3: Major VoIP coding options. [Fin07].
just over 100 ms [BMH+02, CC06], it is essential that delays over the wireless 802.11
network is less than 200 ms to maintain acceptable voice performance. At the very
minimum, the 802.11 handover latency should be targeted to be less than the 200 ms
delay budget. In this thesis, we aim to achieve a seamless handover for improved voice
application performance and accommodate for additional delays that may arise from
variations in the wireless and backbone network. Later in Section 7.2, we also use these
delay budgets as a guide for determining an appropriate maximummedium access de-
lay value.
Table 2.3 also indicates that G.729 has a loss tolerance of less than 2%. The study in
[HT04] found that to maintain a minimum acceptable mean opinion score using 10 and
20 ms intervals between voice packets in G.729, the maximum tolerable losses were
0.33 and 0.19%, respectively. Note that the mean opinion score is a subjective measure
of the perceived audio quality. The 0.19% loss translates to only about 10 lost frames
(or 200 ms disconnection time) in a minute if transferring a packet every 20 ms. These
tolerances will also need to be considered and factored into various performance goals,
particularly when assessing handover losses.
70

2.7 Research Scope
In this chapter, a thorough survey was presented to discuss various leading handover
improvement and load management strategies for 802.11. Handovers can incur notice-
able disruptions for time sensitive real-time applications, resulting in extensive research
to minimize the interruption. Load management proposals on the other hand, aim to
utilize the wireless network efficiently and protect the QoS of real-time traffic that can
degrade from congestion. The survey not only provided an extensive review on the
strategies used to mitigate the identified issues, but also revealed areas requiring fur-
ther investigations to be addressed.
Based on our survey on handover improvement research, scanning delay has been iden-
tified as the significant portion of handover disruption. This is confirmed in our studies
on enhancing the handover performance of various commercially available 802.11 in-
terfaces in Chapter 3. The observed poor scanning performance has lead to a number
of studies on minimizing that component. One approach was to limit the total num-
ber of channels scanned by only considering non-overlapping channels (1, 6 and 11) or
through information provided by the current AP regarding its neighboring APs’ operat-
ing channels. However, in the presence of a number of APs co-located in the same area,
significant reduction in the overall scanning time may not be possible using this strat-
egy. An increase in scanning time for a given channel is required if there are a number of
APs operating on the same channel. On the other hand, the number of channels scanned
increases if there are APs operating on different channels. Furthermore, the exchange
of neighboring AP details require additional network mechanisms and management to
support the communications needed, increasing the complexity.
Another proposed strategy was to interleave the periodic scanning of each channel with
the normal data exchange process. However, there are concerns on choosing sufficient
71

scanning periods to discover surrounding APs without interrupting the current data
flow. This is challenging for MSs which are moving quickly through the network or
supporting time sensitive flows with a high frame rate.
The potential pitfalls of the reviewed methods have lead to the proposal of using dual
802.11 interfaces for seamless handovers in this thesis, as presented in Chapter 4. This
eliminates handover delays to support sensitive VoIP codecs such as G.729 discussed in
Section . It offers a solution with no restrictions on the number of channels scanned and
avoids interruptions on the current data flow during the scanning procedure. Although
there have been a number of multiple interface handover proposals, they have relied
on network layer (e.g. MIPv6) mobility mechanisms and managed as two distinctively
separate interfaces. In this study, a purely link layer solution is proposed that achieves
seamless handover, while sharing a single MAC address.
Furthermore, this thesis investigates the required cell overlap and signal power level
required to trigger a handover early enough for a seamless handover in a dual inter-
face device. Chapter 5 focuses on the latter, presenting equations allowing appropriate
trigger thresholds to be estimated. It is an aspect that is also applicable to studies in
heterogeneous multiple interface handovers and were not adequately addressed previ-
ously. As part of maintaining the QoS of real-time traffic flows, handover triggers based
on QoS parameters were also studied in Chapter 6.
Maintaining the QoS of real-time traffic flows following a handover has lead to the
consideration of load management as part of the handover process. When supporting
real-time applications in 802.11, it is important to consider the 802.11e enhancement
for providing the necessary prioritizing mechanisms. As a result, load management
strategies for both 802.11 and 802.11e were considered through the literature review.
72
The survey showed a number of network controlled solutions, where the decision pro-
cess were made on the network side, either through the AP or a connected access server.
Majority of decisions were made upon receiving a connection request, where the deci-
sion was based on the total combined usage and a threshold value. A suitable threshold
value that maximizes utilization while preventing congestion can be difficult to identify.
A number of decision mechanisms based on analytical models were also reviewed.
These were typically based on Markov chain models of the 802.11 and 802.11e back-
off mechanism. The relationships derived through these models could indicate if the
maximum achievable utilization has been reached based on measurements at the AP.
This can then be used by the AP for determining an admission decision. These models
often have assumptions about the state of the network or traffic patterns used, which
can lead to different maximum achievable utilization values compared to in practice.
From the survey, it is apparent there was a lack of investigations on estimating the max-
imum achievable utilization values in 802.11e under typical network settings support-
ing real-time traffic. It is addressed in Chapter 7 of this thesis through the construction
of a maximum utilization lookup matrix derived empirically through simulations. As
part of the study, a simple measurement based admission control scheme is proposed,
using the lookup matrix. We aim to demonstrate that the proposed lookup based ap-
proach successfully controls admission while maximizing the available utilization. An
additional goal is to show that it accounts for best effort traffic and noisy environments
successfully.
Overall, through the extensive survey presented in this chapter, a number of outstand-
ing issues were identified relating to client based handover systems and utilization es-
timations when supporting time sensitive applications. These issues have helped guide
proposals for improving handover and admission control performance throughout this
73

thesis. Each contribution can be applied individually to improve the respective areas or
combined as a complete 802.11e solution for supporting real-time traffic. Detail of the
proposed enhancements are presented in the chapters following.
74
Chapter 3
Handover Analysis Of IEEE 802.11bInterfaces
3.1 Introduction
Handover as described in Section 2.5 is the process of a Mobile Station (MS) transferring
its connection from one AP to another. This usually occurs due to signal strength degra-
dation and increased error rates with the current AP as the MS moves out of range.
To prevent the loss of connectivity, an alternate AP providing sufficient signal quality
must be located to maintain the ongoing connection. The handover delay is defined
as the length of time the MS is disconnected from the network during the transfer of
connection. Clearly, this should be as small as possible when supporting time sensitive
applications.
There were numerous Mobile IP related published work that aim to reduce the net-
work handover delay, however as long as the IEEE 802.11 (Layer 2) delay is significant,
the overall delay is always unacceptable. Suggested improvements justified with sim-
ulation results were outlined in Section 2.5. We reviewed analysis that were done in
75

[MSA03, VK04, GBC07], exposing the sources of delay at Layer 2 and variations in han-
dover delay that can occur.
In this chapter, we investigate and focus our efforts to enhance the handover perfor-
mance of commercially available IEEE 802.11 implementations. This is done with the
help of Linux Wireless Tools [lin], since it offers the most flexibility in configuring the
interfaces. Parameters controlling the handover are identified and varied to achieve the
optimum handover performance. The method that yields the smallest handover delay
for current IEEE 802.11b implementations is highlighted.
The chapter is structured as follows. In Section 3.2, we describe the network testbed,
namely the network components and 802.11 interface settings used. Next, in Section
3.3, we analyze the 802.11 interface handover performance using a number of ways to
initiate handovers, allowing us to identify the best methods. Section 3.4, concludes with
a summary of our findings.
3.2 Experimental Testbed
3.2.1 Mobile Station
The MS is a Compaq Armada E500 consisting of a Pentium III 800MHz processor and
128MB of RAM. It runs Red Hat Linux 7.3 with kernel 2.4.19 along with drivers for var-
ious WLAN Network Interface Cards (NICs). The following NICs and the appropriate
drivers were chosen:
• Cisco Aironet 350, Aironet PC4800 (older version of 350) - Airo-linux driver avail-
able from Sourceforge [air].
• Orinoco Silver - Orinoco-0.11b driver [ori].
76

• Samsung SWL-2100E and D-Link DWL-650 WLAN - Driver from latest release of
hostap [Hos].
At that point in time, it was felt that the listed 802.11 NIC implementations would pro-
vide a good coverage of chipsets available on the market.
3.2.2 Data Collection
An additional Cisco Aironet 350 card was used in monitor mode together with Ethe-
real (Version 0.9.3) [Eth] to capture traffic on various channels, similar to the setup in
[MSA03]. Ethereal uses a packet capture library known as libpcap (Version 0.9.3) [lib]
to interpret the 802.11 packets captured. Using this on the same channel as the han-
dover target AP allows packets exchanged during the handover process to be viewed.
Note that during monitor mode, the NIC captures packets up to three channels from the
current channel. This was discovered by switching the channels progressively, starting
from a channel which an AP was operating at, until beacons were not received from
that AP. For example, when an AP operates on channel 6, its advertised beacons can be
received from channel 3 to channel 9.
3.2.3 Infrastructure Network Testing
Three D-Link DWL-1000AP access points were integrated into an existing wired LAN,
as pictured in Figure 3.1, to obtain results typical to a normal network. The APs use
three channels within the allowed channel range to achieve the greatest separation and
hence, minimal crosstalk between each BSS. This means that there is an AP operating in
each of the channels 1, 6 and 11.
77

AP(Channel = 1)
AP(Channel = 11)
AP(Channel = 6)
EthernetSwitch
CN
MS
Figure 3.1: Testbed configuration for testing handover delays.
The first group of tests measures the handover delay of each card between APs oper-
ating on channels 1 and 6, and channels 1 and 11. This provides a good set of mea-
surements to compare handover performance between cards and observe any affect on
channel separation of APs. Handovers are initiated using the “essid” and “ap” option
from iwconfig (part ofWireless Tools open source project [wir]) and differences between
both methods are analyzed. The “channel” option was also used in an attempt to con-
nect with an AP operating on the specified channel directly, rather than going through
the entire scanning process.
According to [MSA03, VK04], the probe exchanges account for over 90% of the over-
all handover delay. It is therefore intuitive to minimize it. This may be achieved by
shortening the probe exchange period via the ProbeDelay, MinChannelTime, and Max-
ChannelTime active scanning parameters that were described in Chapter 2.5.1. These
parameters were configurable for Cisco and Aironet NICs through the following device
driver parameters:
78

ProbeDelay [Default: 3 ms] - Represents the active scanning ProbeDelay parameter.
ProbeEnergyTimeout [Default: 3 ms] - Represents the active scanning MinChannelTime
parameter.
ProbeResponseTimeout [Default: 20ms] - Represents the active scanningMaxChannelTime
parameter.
Unfortunately, these options were unavailable for other (non Cisco or Aironet) NIC
implementations.
The handover delay is the time between a handover initiation (through iwconfig com-
mand) and receiving an association response. This can be obtained through modifica-
tion of the drivers to include timestamps (accurate to 10 ms) at when these events occur.
Only the airo-linux [air] and hostap [Hos] drivers have these events handled within the
driver, allowing the timestamps to be placed. A Perl script is used to initiate a handover
at set intervals for five hundred times. Through trial and error we determined that this
sample number was optimal for demonstrating a good spread of handover latencies
and capturing outliers that can occur. The delays recorded in a file generated by the
driver can then be easily used for analysis.
It is worth noting that we are analyzing the performance based on forced handovers
where the signal strength on the current AP is still acceptable. Typically handovers are
initiated when the measured signal strength and quality degrades below a threshold
level. The primary difference is the MS could suffer greater frame losses compared
to forcing a handover as it spends more time in this volatile reception range before a
handover is initiated.
79

3.2.4 Ad-hoc Network Testing
Handovers are initiated using the same options as used in infrastructure testing. Three
NICs of the same type are used where two forms separate IBSSs and the other han-
dovers between them. A Prism proprietary method for ad hoc mode known as pseudo
ad hoc is also tested. From the available NICs for this investigation, only D-link and
Samsung supports this mode. The aim is to identify whether any ad hoc cell changing
methods provides low delays. If so, it can possibly be integrated with existing LANs to
serve handovers as a temporary solution for delays acceptable for real time applications.
During pseudo ad hoc operation, no interrupt is generated to inform of the re-established
connection. As a result, a method other than modifying the driver must be used. The
two nodes located on different IBSS uses ping to send a constant stream of packets to
the MS, while it switches between both, via a Perl script. Ethereal is used on the MS to
capture packets received. The time stamp of the first packet received on the new node
and the last packet received on the old node can be used to determine the handover
time. This can be done off-line using a script to process the captured packets produced
from the test. Since ping can only send Internet Control Message Protocol (ICMP) re-
quests at a maximum of 10 millisecond intervals, this method of measuring the delay is
accurate to that value.
80

0
100
200
300
400
500
600
700
0 50 100 150 200
Han
dove
r D
elay
(m
s)
Sample Number
Channel 1 to 6Channel 6 to 1
Figure 3.2: Cisco Aironet 350 handover between APs on channel 1 and 6.
0
100
200
300
400
500
600
700
0 50 100 150 200
Han
dove
r D
elay
(m
s)
Sample Number
Channel 1 to 11Channel 11 to 1
Figure 3.3: Cisco Aironet 350 handover between APs on channel 1 and 11.
81

3.3 Performance Analysis
3.3.1 Infrastructure Network
Handover Using “essid” Option
Using the “essid” option allows an MS to specify the target SSID it wants to connect
with. It can be seen from Figure 3.2 and 3.3 that Cisco Aironet 350 cards produce a
handover time of between 200 to 400 ms on average. Monitoring each channel during
the handover process, we noticed probe frames being exchanged implying that active
scanning was used. It also revealed that probing starts from channel 1 and progres-
sively moves up until all channels are probed. Therefore, the same handover latency is
expected regardless of which channel the AP operates on. With the MS able to specify
the SSID as part of the probe request frame using this option, only APs with the match-
ing SSID will respond. Note that if there were more than one AP with the same SSID
located on different channels, the handover takes longer due to the increased number
of probe responses to be captured and processed.
Long handover spikes are clearly evident on the graphs. These appear when the card
cannot locate an AP with the specified SSID, which may be due to collisions or noise
affecting the probe responses. It continually probes all channels until the SSID is found
or a timeout occurs. The behavior exhibited for the D-link and Samsung cards utilizing
the hostap [Hos] driver was the same as for the Cisco cards, except the handover delay
was greater ranging from 500 to 800 ms on average, as evident in Figure 3.4 and 3.5.
The fastest infrastructure mode handover in our setup was achieved using Aironet
PC4800 card (seen in Figure 3.6), revealing an average handover time ranging from
80 to 180 ms, half that of Cisco Aironet 350 cards. Packet captures revealed that these
82

0
100
200
300
400
500
600
700
800
900
0 50 100 150 200
Han
dove
r D
elay
(m
s)
Sample Number
Channel 1 to 6Channel 6 to 1
Figure 3.4: D-Link DWL-650 handover between APs on channel 1 and 6.
0
100
200
300
400
500
600
700
800
900
0 50 100 150 200
Han
dove
r D
elay
(m
s)
Sample Number
Channel 1 to 6Channel 6 to 1
Figure 3.5: Samsung SWL-2100E handover between APs on channel 1 and 6.
83

0
100
200
300
400
500
600
700
0 50 100 150 200
Han
dove
r D
elay
(m
s)
Sample Number
Channel 1 to 6Channel 6 to 1
Figure 3.6: Aironet PC4800 handover between APs on channel 1 and 6.
cards have shorter probing intervals, therefore it can collect channel information much
quicker, halving the scanning time. This may cause problems for APs supporting high
amounts of traffic during the contention period, resulting in frequent collisions, thus
lengthening packet delivery times.
Handover Using “ap” Option
In this option, the MS specifies the target AP’s MAC address instead. The handover
latency using this option ranged from about 350 to 450 ms for the Cisco Aironet 350 in-
terface. This seem consistent with results obtained from [MSA03] indicating a range of
250 to 400 and 350 to 450 ms, using Lucent and Cisco APs respectively. Comparing Fig-
ure 3.2 to Figure 3.7 and Figure 3.6 to Figure 3.8, it is obvious that using the “ap” option
results in a greater handover time compared to specifying the SSID. A packet capture
84

0
100
200
300
400
500
600
700
0 50 100 150 200
Han
dove
r D
elay
(m
s)
Sample Number
Channel 1 to 6Channel 6 to 1
Figure 3.7: Cisco Aironet 350 handover between APs using the “ap” option.
0
100
200
300
400
500
600
700
0 50 100 150 200
Han
dove
r D
elay
(m
s)
Sample Number
Channel 1 to 6Channel 6 to 1
Figure 3.8: Aironet PC4800 handover between APs using the “ap” option.
85

reveals that when using this option, the MS sends a broadcast probe request without
specifying a specific SSID. As a result, every AP receiving the request sends back an
appropriate response. This requires the host to capture and process all responses and
look for one that matches the requested AP MAC address. Clearly, this demand is the
cause of the additional delay. Large handover spikes seem to occur more frequently.
The increased number of responses creates a high contention in channels, causing re-
sponses from the requested AP to be missed. This is highly likely since there are APs
operating on the same channels and overlaps caused by an AP not operating more than
three channels apart.
Handover Using “channel” Option
In infrastructure mode, the host’s channel cannot be changed at all. Executing the
“channel” command causes it to send a general probe request to all APs. The firmware
decides which AP it associates with, based on signal strength and quality, therefore re-
sulting in a handover delay similar to the one obtained using the “ap” option. It does
not actually connect to an AP found on the specified channel.
Handover Using Modified Cisco/Aironet Settings
In reducing the handover time using the parameters available in Cisco/Aironet cards,
it’s important to find out how they affect the active scanning process. Each parameter
was varied individually while observing the packet captures. The default setting of the
parameters using Cisco Aironet 350 reveals that probe requests are sent at a minimum of
16ms intervals. These commonly occurred for probe requests that received no response.
When probe responses were received, the probe exchange period can reach a maximum
86

0
100
200
300
400
500
600
700
0 50 100 150 200
Han
dove
r D
elay
(m
s)
Sample Number
Channel 1 to 6Channel 6 to 1
Figure 3.9: Cisco Aironet 350 handover between APs withMinChannelTime = 1 ms andMaxChannelTime = 5 ms.
of 38 ms. This maximum can be reduced to 25 ms by adjusting the MaxChannelTime
from 20 to 5 ms. Further reduction can be achieved by lowering the MinChannelTime
from 3 to 1 ms to result in a 2 ms reduction in the probe exchange period. Reducing
ProbeDelay provided no improvements. In the case of Aironet PC4800, it was found that
probe requests are sent at a minimum of 4 ms intervals and a maximum of 26 ms. By ad-
justing MaxChannelTime and MinChannelTime as described above, the maximum probe
exchange period can be reduced to 10 ms and as low as 2 ms. The shortened probe
exchange period may seem trivial, however since there are probe exchanges in one ac-
tive scan usually, and possibly multiple APs responding on a single channel, significant
savings can be gained. There is still uncertainty as to why there is a difference in probe
exchange period between Cisco Aironet 350 and Aironet PC4800.
87

0
100
200
300
400
500
600
700
0 50 100 150 200
Han
dove
r D
elay
(m
s)
Sample Number
Channel 1 to 6Channel 6 to 1
Figure 3.10: Aironet PC4800 handover between APs with MinChannelTime = 1 ms andMaxChannelTime = 5 ms.
Knowing the above,MinChannelTime was adjusted to 1 millisecond whileMaxChannel-
Timewas adjusted to 5 ms, to observe the handover improvement that can be achieved.
It’s clear from Figure 3.9 and Figure 3.10 that the handover delay has certainly been
shortened as expected, since the probe exchange period on each channel was reduced.
As mentioned in Section 2.5.1, there is a cost associated with keeping the MinChannel-
Time andMaxChannelTime small. One of which is that APs may have insufficient time to
send a probe response, particularly when the channel is busy. The result is to repeat the
full scanning procedure again in order to locate the AP, which significantly increases the
handover time. This may explain the increased number of long handover spikes when
comparing Figure 3.10 to Figure 3.6, or Figure 3.9 to Figure 3.2. Note that significant re-
duction in handover delays using the “ap” option was also expected due to the higher
number of probe exchanges with all APs in range that takes place using this option.
88

3.3.2 Ad-hoc Network
The “essid” and “ap” options were used during ad hoc mode to switch between two
separate IBSSs. However, the cell ID is specified rather than the AP MAC address. The
handover process was found to behave exactly the same as for infrastructure mode. If
there were more than one node in the IBSS, the handover delay increases due to the
greater number of responses received.
The “channel” command used during Ad-hoc mode offers little control on the channel
selection as well. If no SSID is specified for the cell initially, it does nothing and ignores
the command. However, if one has been specified, it sends probe requests for the partic-
ular SSID, resulting in a handover time similar to that obtained from using the “essid”
option. If there is no response for a set period of time, it forms its own ad hoc network
with that SSID. When there is an existing ad hoc network with the same SSID, it at-
tempts to join it and the channel they decide to operate on is beyond the user’s control.
This behavior was found to be consistent for all cards and drivers.
3.3.3 Handover In Pseudo Ad-hoc Mode
As discussed in Section 2.5.5, any host using pseudo ad hoc mode can communicate
with each other as long as they are within range and operating on the same channel.
This allows a MS to handover between two nodes operating on different channels by
simply changing its operating channel.
We saw earlier that the handover delay between two IBSSs in normal ad hoc mode
is similar to infrastructure handover. Whereas a handover in pseudo ad hoc mode,
requiring only a change in channel, averages around 30 ms according to Figure 3.11. If
the nodes can be bridged to thewired network, they can act as APs supporting relatively
89

0
10
20
30
40
50
60
0 50 100 150 200
Han
dove
r D
elay
(m
s)
Sample Number
Channel 1 to 11Channel 11 to 1
Figure 3.11: D-Link DWL-650 switching between two Samsung SWL-2100E duringpseudo ad hoc operation.
fast handover. However, this implementation of an AP is clearly limited due to the
absence of IEEE 802.11 management frames. There is a problem of not being able to
discover surrounding APs due to the absence of beacon and probe response frames.
As a result, handover targets have to be known first, which is unrealistic in practice.
Due to the open nature of this mode, where all frames are broadcasted, security would
be a major concern. Another major problem is since pseudo ad hoc is a proprietary
method, there is a lack of information specifying how it operates and users are restricted
only to devices supporting this mode. Attempts were made to capture frames for the
proprietary method in order to gain an understanding of it and to compare against the
IEEE 802.11 standard. However, without any documentation on the frame formats, it
was not possible to do so.
90

With the limitations mentioned, pseudo ad hoc mode only offers a fast handover solu-
tion for testing and research purposes. One example of this was seen in [Oht02], which
used this mode tominimize link layer handover latency and focus primarily on network
layer handover. It found it useful for reducing traffic by eliminating link layer manage-
ment frames and rely solely on network layer router advertisements for discovering
connection points.
3.4 Conclusion
In this chapter, the handover performance of various IEEE 802.11b commercial imple-
mentations were tested and investigated. Figure 3.12 provides a good visual summary
of our findings. Overall, the Aironet PC4800 exhibited the shortest handover delay com-
pared to other. This was attributed to the shorter probe exchange periods it employs as
observed during the investigation. When specifying the SSID to initiate a handover, the
Aironet PC4800 achieves an average handover delay of 116 ms. The worst performer is
the Samsung SWL-2100E with an average handover delay of 665 ms.
It was found that specifying the SSID over the AP’s MAC address to change from one
AP to another results in a smaller handover delay. This was done using the Cisco 350
and Aironet PC4800 interface. With specifying the SSID, only APs with the matching
SSID generate probe responses, rather than all APs, as observed when specifying the
AP’s MAC address for handover. The resulting decrease in the average probe exchange
period for each channel leads to a lower overall handover delay. Furthermore, it re-
duces probe traffic, which otherwise may result in frequent long handover delays due
to missed probe exchanges, and temporary traffic degradation in the network. Being
91

0
100
200
300
400
500
600
700
PseudoAd-hoc
Aironet PC4800probe
Cisco 350probe
Aironet PC4800ap
Cisco 350ap
Aironet PC4800essid
Samsung SWL-2100Eessid
D-Link DWL-650essid
Cisco 350essid
Han
dove
r D
elay
(m
s)
Figure 3.12: Average handover delays and 95% confidence interval plotted for comparing handover performance ofvarious interfaces.
92

able to specify the SSID is not always possible, as an MS may move into regions un-
aware of the surrounding APs. In this case, it needs to scan for all surrounding APs and
producing a handover delay similar to specifying the AP’s MAC address. If there are a
number of APs within range, a long handover delay is unavoidable.
It was discovered that a few interfaces, namely the Cisco 350 and Aironet PC4800, had
configurable parameters to reduce the probe exchange period, shortening the overall
active scanning time. Delays as low as 50 ms can be achieved using the Aironet PC4800
card when specifying the SSID. However, the delay seems to vary significantly and
large values (over 1 second) are obtained regularly making it unsuitable for real time
applications. Also, the higher probe exchange rate leads to increased contention on the
channels.
Handovers in pseudo and standard ad hocmodewas investigated to determinewhether
they can offer a temporary fast handover solution. The proprietary pseudo ad hocmode
was found to have the most potential due to the possibility of handing over between
nodes by switching operating channels, which can be done in approximately 30 ms.
Therefore, if these nodes can be bridged to the wired network, they can act as APs pro-
viding fast Layer 2 handover. Unfortunately, there are major limitations with this mode,
making it useful only for testing and research purposes.
At the time when this investigation was conducted, the existing 802.11 interfaces had
firmware and drivers that provided limited customization. As a result, it prevented the
ability to try different scanning algorithms and schemes to improve handover perfor-
mance. To do so, simulation models needed to be utilized instead, providing freedom
to modify functionalities as required. This has lead to the extensive use of 802.11 simu-
lation models in the following chapters.
93

Chapter 4
Dual Interface Handover
4.1 Introduction
Traditionally, a mobile device using a single IEEE 802.11 interface suffer disruptive han-
dovers when roaming across a network. The disruption seen in Chapter 3 typically
averaged between 100-800ms for active scanning. However, this can exceed one second
due to the possibility of missing probe exchange messages. Passive scanning described
in Section 2.5 performs worse compared to active scanning due to the larger channel
periods required to capture advertised beacons. In addition, if a network layer han-
dover is required, the resulting disruption worsens the situation further. It was seen in
Section 2.7 that handover delays for the G.729 VoIP codec should be less than 200 ms
for an acceptable, user non-perceivable performance. Furthermore, with a frame rate of
50 frames/s, the codec can only tolerate a maximum of 10 lost frames a minute before
the mean opinion score becomes unacceptable. It is clear that the handover delays of a
single IEEE 802.11 interface fail to meet these demands.
In this chapter, we propose a mobile device with two IEEE 802.11 interfaces to facilitate
seamless link layer handover. Having an additional 802.11 interface allows for current
94

communications and the discovery of surrounding APs to occur simultaneously. The
proposed multiple interface implementation provides seamless handover for link layer
only. It is transparent to upper layers and does not rely on network layer mobility (e.g.
MIPv6) or an application to support seamless link layer handovers. The ever decreasing
prices of 802.11 chipsets makes this a cost effective option.
This chapter is organized as follows. In Section 4.2 the management of events to achieve
smooth link layer handover using dual interfaces are described. Section 4.3 presents the
architecture of a dual interface device, highlighting the changes required on existing
single interface architectures. The handover performance is then analyzed in Section
4.5. Finally, Section 4.6 summarizes the findings.
4.2 Link Layer Handovers Using Two Interfaces
4.2.1 Transparent 802.11 Handover
Unlike previous work in [Oht02, IN05, RRL06] that relied on network layer mobility
(e.g. MIPv6) or modifications of local routing tables to facilitate seamless link layer
handovers, the dual interface proposal in this thesis was designed to be transparent
to upper layers for a self contained link layer operation. This allows existing network
layer protocols (e.g. IPv4, IPv6) to operate without additional modifications or mobility
support necessary to accommodate the additional link layer interface. As long as the
dual interface station roams within the same subnet (i.e. WLAN) seamless handover
would be supported. Note that if a handover occurs between APs on different subnets,
a network layer (e.g. Mobile IP) that supports mobility is still required to manage the
network layer handover.
95

There are upper layer protocols, such as MIPv6 for Multiple Interface (MMI) [MN05b]
that could potentially take advantage of the additional link layer interface to incorporate
or improve its own network layer handover process. To facilitate this, our proposed
dual interface link layer could incorporate the 802.21 Media Independent Handover
(MIH) [IEE05d] framework to support the communications required between the layers.
However, the necessary functionality is not discussed as part of this investigation and
left as part of the future work.
4.2.2 Managing A Single MAC Address Between Two Interfaces
In this thesis, we propose a dual interface device where both interfaces share a common
MAC address. We believe this approach is more transferable to commercial implemen-
tations where a single cardwith oneMAC address assigned, shares two radio interfaces.
It aligns well with IEEE 802.11n devices, which already use multiple radios to achieve
higher bandwidths, opening up potential future work to integrate the two. Note that
this approach does not rely on the Address Resolution Protocol (ARP) to update IP-to-
MAC address cache mappings each time it switches between the interfaces.
According to the IEEE 802.11 standard, only one device with a unique MAC address
can be associated to the DS via an AP at a time, allowing traffic to be unambiguously
directed to the correct AP. If this is disobeyed, the supporting DS infrastructure cannot
guarantee the successful delivery of frames to the correct destination. A soft handover
approach, where both interfaces sharing the same MAC address are simultaneously
connected to two different AP could confuse the DS and should be avoided.
A strategy has been devised to avoid this dilemma while still providing seamless han-
dover. As long as one interface has an association with an AP, the other remains in an
96

Data Frame
Authentication Request
Association Request
Association Response
InterfaceManager Interface 1 Interface 2
Authentication Response
RXlevel
Connect to new AP
Handover complete
Set to Passive
ScanningData
Exchange
DataExchange
Monitoringor
Shut-off
PassiveScanning
MS
New AP Old AP
Need to perform scanning if previously in `Shut-off` mode or suitable AP have not been found
Figure 4.1: Seamless link layer handover using two interfaces.
inactive state. This is a state where the interface is not required or allowed to send a
frame, except for AP discovery purposes (e.g. Probe Requests). As such, the inactive
interface have two modes of operation, namely:
Shut-off - Interface is completely turned off to conserve energy. It turns on only when
a handover is required to discover surrounding APs and establish the new con-
nection.
Monitoring - Interface sequentially listens on each channel for beacon frames to build
97

up a list of neighboring APs. Alternatively, it may actively send probe requests
and receive probe responses.
At this stage, it is important stress that while the inactive interface is either in “Monitor-
ing” or “Shut-off” mode, the other active interface is currently associated and support-
ing the application data flow.
Whenever a handover is required, if the inactive interface is in “Shut-off” mode, it
switches on and performs the AP scanning procedure. On the other hand, if the inactive
interface is in “Monitoring” mode, it should have already discovered neighboring APs
and be in a position to choose one to connect with. If it fails to locate any neighboring
APs during “Monitoring” mode, it completes the full AP scanning procedure.
Preferably passive scanning procedures should be used when discovering surrounding
APs, where the inactive interface passively listens for advertised beacons. It has the
advantage of not introducing additional traffic contention. However, has the disadvan-
tage of requiring more time to complete the discovery process, which means a greater
overlapping coverage area is required for a seamless handover, as we will see in Section
4.5.2.
At the completion of the scanning procedure, when a suitable AP has been discovered,
the inactive interface activates and begins the handover frame exchange procedure. As
soon as it receives an association response frame from the new AP, indicating a success-
ful association, the other interface switches into an inactive state and the queued output
data is directed to the new connected interface. This interface management method
never allows both interfaces to be associated at the same time, avoiding the risk of con-
fusing the DS. As mentioned earlier, the dual interface handover is transparent to the
network layer, and is handled in the same manner as for a single interface. Figure 4.1
98

illustrates the seamless link layer handover.
4.2.3 Handover Trigger
There are a number of parameters mentioned in Chapter 2.5.6 that can bemonitored and
used as handover decision criteria. For the study in this chapter, the common and pop-
ular signal strength based decision criterion is used. This allows for easy comparisons
with currently available single interface handover solutions.
In order to account for signal variations and maintain a reliable trigger, we apply a
weighted average for each signal reading as
Xavg = δXnew reading + (1 − δ)Xold avg (4.2.1)
Xnew reading is the new reading sample,Xold avg is the old calculated average (value of 0 if
there is no previous average),Xavg is the new calculated average, and δ is the weighting
value given to the new reading. Note that a δ equal to one, is the same as using an
instantaneous reading with no averaging applied.
A handover is triggered by the active interface when the measured signal is decreasing
and reaches below a Handover Power Level Threshold Phothresh. During this time, while
the active interface continues to support the data traffic flow, the inactive interface is
triggered to either start connecting to the next best AP available it has discovered or
switch from “Shut-off” mode to begin the AP scanning process. Note that this threshold
value needs to be greater than the Receive Power Level Threshold Prxthresh, which is
defined as the minimum signal power for a frame to be received successfully.
99

4.2.4 AP Discovery
A number of scanning routines exist that can be employed by the second interface to
locate a new AP. Below is a description of the range of routines to be used.
Always Scanning
This involves the interface scanning for surrounding APs as soon as it switches into
“Monitoring”mode. It periodically scans each channel andmaintains a list of surround-
ing APs, sorted according to signal strength. The full channel spectrum is scanned con-
tinuously until the active interface triggers a handover. When this occurs, the AP with
the highest signal strength is selected as the handover target from the list of surround-
ing APs scanned. If a suitable AP is not found, the scanning routine continues until it
does. Both active and passive scanning methods can be used in this mode. However,
as discussed earlier in Section 4.2.2, active scanning incurs additional traffic and con-
tention on the channel. As such, passive scanning is the preferred method and will be
used throughout the investigation.
A major disadvantage with this approach is that the scanning interface always remains
in an operational state, constantly consuming valuable battery life. Even if passive scan-
ning is chosen, where the additional interface never transmits and only listens, it still
consumes energy, as will be demonstrated in Section 4.4.
Passive Scanning
Passive scanning described in Section 2.5, operates in a similar fashion to “Always Scan-
ning”, where it listens for advertised beacon frames. When all channels have been
100

scanned, the AP with the highest signal strength is selected as the next handover target.
If a suitable AP is not found, the scanning routine will keep repeating until it does.
Unlike the “Always Scanning” scheme, the passive scanning routine only begins when
a handover is triggered. This has the advantage of conserving energy on the device by
leaving the inactive interface disabled or in “Shut-off” mode until the handover trigger
occurs.
Active Scanning
Active scanning as described in Section 2.5 involves the interface actively sending probe
frames to discover neighboring APs on each channel. When all the channels have been
scanned, the AP with the highest signal strength is selected as the next handover target.
The scanning routine repeats until it finds a suitable AP. It has the advantage of short-
ening the overall scanning time considerably compared to passive approaches, at the
expense of causing additional contention through probe request frames.
Similar to the “Passive Scanning” scheme, it is activated based on a handover trigger.
The shorter time spent scanning means the additional contention and traffic through
probing is not as significant as if probingwas applied to the “Always Scanning” scheme.
It also shares the same energy conservation advantages as the “Passive Scanning” scheme.
Selective Scanning
Access points in an IEEE 802.11 network typically utilize the non-overlapping chan-
nels 1, 6 and 11. Studies such as [LG06, MMN05] exploited this fact by prioritizing the
scanning routine on these select channels to reduce the overall scanning time. This op-
timization can be applied to the scanning schemes discussed earlier to further enhance
101

the dual interface seamless handover capability.
It is worth noting that the cost of utilizing this optimization is of course potentially
missing APs that is not operating on channel 1, 6 or 11. As a consequence, the MS
may not effectively discover APs that are not operating on the selected channels. This
may lead to APs not being discovered at all or the best available AP being overlooked.
To mitigate the former vulnerability, any scanning routine applying this optimization
should default to scanning the remaining channels if an appropriate AP is not found.
4.3 Dual Interface Architecture
Figure 4.2 highlights the structural difference between a single and dual interface de-
vice. The latter contains an additional 802.11 interface and a dual interface module to
manage and co-ordinate both interfaces. As can be seen for the single interface de-
vice, the network layer connects directly to the link layer device. For the dual interface
device, the network layer connects to a separate dual interface manager, which commu-
nicates to both interfaces.
The dual interface manager is the main mechanism that manages buffered outgoing
frames at the link layer, controls the state of both interfaces and co-ordinates the han-
dover process. Figure 4.3 illustrates the architecture of the dual interface manager. The
contents of the outgoing data buffer are directed to the appropriate interface support-
ing the active data exchange. For incoming data from the link layer, frames from the
active interface are forwarded to the upper (usually network) layer, while frames from
the scanning interface are forwarded to the handover decision mechanism. The frames
collected at the decision mechanism are captured beacon frames and probe responses
from surrounding APs. These are used to build up a list of surrounding APs, which are
102

�����������
����� ������
��������
���������
(a) Single interface
����������� ����
��������������
��������������
�������������������������������
������������ ������������
��� ����
!�"# ����
(b) Dual interface
Figure 4.2: Single and dual interface structures.
��������������
�������
�� �� ���� �� ��
�����������
������
��������������
��������������
�������� �������������������
��� �����������������������
��!"����!#�$��
%���"����!#�$��
��!��������!�
%���!��������!�
%���!��������!�
����������!�
���!��������! ������
Figure 4.3: Dual interface manager.
103

sorted according to a parameter to aid in the next handover target.
The channel that the scanning interface operates on can be controlled by the handover
decision mechanism. It communicates the change of channel through the 802.11 inter-
face control signal connections. These connections are also used to initiate a connection
to a target AP and for switching an interface into “Shut-off” or “Monitoring” mode. The
interface manager’s control signal connections are used by the interface to communicate
specific events to the handover decision mechanism, such as the need for a handover
due to the signal strength dropping below a threshold level or the completion of an
association. This informs the handover decision mechanism when it needs to select a
new AP target or when it needs to toggle the operation of both interfaces, respectively.
The handover timing is managed to ensure a connection is always maintained and both
interfaces are not connected (i.e. associated) at the same time.
As the roles of both interfaces are swapped after a handover, the handover decision
mechanism toggles the incoming and outgoing data flow for each interface to deliver
frames to the appropriate path. This ensures that data to and from the upper layer goes
through the active interface with an established connection, while scanned beacon or
probe response frames are directed to the handover decision mechanism.
4.4 Energy Consumption Costs
An IEEE 802.11 interface is commonly included as part of a mobile device with limited
battery life. For this reason, it is important to consider the increased energy consump-
tion cost of having an additional interface to support seamless handover.
In this section, we investigate the additional energy consumption of the scanning in-
terface using different scanning algorithms discussed earlier in Section 4.2.4: “Always
104
Scanning” (AS), “Passive Scanning” (P) and “Active Scanning” (A). The algorithmswith
the selective channel scanning optimization, denoted by AS-S, P-S and A-S, are also con-
sidered as part of the evaluation.
As a basis for comparison, we consider a single interface device generating a constant
bit rate (CBR) traffic flow of 56 kbps (140 bytes for every 20 ms) to simulate a VoIP
connection using the G.711 codec. The raw traffic rate equates to 110 kbps with the in-
clusion of packet and frame headers (20 (bytes, IP), 8 (bytes, UDP), 12 (bytes, RTP), and
28 (bytes, 802.11) headers). We compare this to a dual interface device that has the same
CBR traffic flow on one interface while the other performs the scanning algorithm. The
parameters and frame sizes assumed for calculating the energy consumption are sum-
marized in Table 4.1. Note that the frame sizes include the physical layer header and
preamble. Also included in the table are the energy consumption ratings as measured
for a 11 Mbps Wavelan interface in [SGHK96]. From these parameters, we can deter-
mine the energy consumption of the CBR traffic flow.
We assume there are three APs, each operating on different channels (1, 6, and 11). They
are all within range of the dual interface device and will be detected by the scanning in-
terface. Knowing the active and passive scanning procedure (described in Section 2.5.1)
and that responses will be received on three channels, we can determine the energy
consumption for each scanning process using the parameters in Table4.1.
The energy consumption is calculated for 300 seconds (5 minutes) for varying handover
rates and normalized against the energy consumption for a single interface device. Fig-
ure 4.4 illustrates the energy consumption comparison for different scanning method-
ologies. It can be seen that the “Always Scanning” approach should be avoided, as it
doubles the energy consumption compared to a single interface device. The “Passive
Scanning” method is acceptable when the handover rate is low. It can be controlled to
105

IEEE 802.11 Configuration
Data and basic rate 11MbpsBeacon interval 0.1sNumber of operating channels 14Beacon scanning interval 0.1sMinChannelTime 0.01sMaxChannelTime 0.035sChannels with APs 1, 6and11
Frame Size (octet)
ACK 38Probe request 76Probe response 91Beacon 91Data 208
Interface energy ratings (mW)
Idle 1318Receive 1385Transmit 1939
Table 4.1: Parameters used for dual interface energy consumption evaluation.
less than 10% additional energy consumption as long as the handover rate remains less
than 5 handovers per minute. This needs to be considered when implementing the han-
dover triggering mechanism, as a very sensitive trigger threshold resulting in frequent
scans can quickly drain battery life. Using “Active scanning” or the selective scanning
optimization, the energy consumption can be controlled to less than 10% even with a
high handover rate of 20 handovers per minute.
4.5 Performance Analysis
4.5.1 Simulation Configuration
In order to evaluate the dual interface mechanism discussed previously, we use the
OMNeT++ [OMN] simulator with the scenario illustrated in Figure 4.5 and parameters
106

0
10
20
30
40
50
60
70
80
90
100
0 2 4 6 8 10 12 14 16 18 20
Add
ition
al e
nerg
y co
nsum
ptio
n (%
)
Handover rate (handover/min)
ASAS-S
PP-S
AA-S
Figure 4.4: Dual interface energy consumption comparison.
summarized in Table 4.2. The values of Phothresh and Prxthresh have been set to give
a handover range of 20 meters and a receiving range of 25 meters, respectively. The
scenario consists of an AP operating on channel 1, while another operates on channel
6. They both share an overlapping coverage region x. Initially the MS starts within
the non-overlapping region of the first cell, where the first interface on the MS detects
the AP (through a chosen scanning routine) and performs the association handshake
process. Once this is completed, the MS generates a CBR traffic flow to simulate a voice
application and receive packets from its CN at the same rate. It utilizes the same 56 kbps
VoIP G.711 codec as used in Section 4.4, which equates to 110 kbps in each directionwith
the inclusion of packet and frame headers. Shortly after, the MS starts moving away
from the AP at a constant speed towards the other AP’s coverage area. As the signal
level on the first interface falls below Phothresh (i.e. 20 meters away from the current AP),
the second interface is triggered to locate and associate with a new AP target.
107

AP (Channel = 1)
AP(Channel = 6)
MS
Rx range = 25 m
Handover range = 20 m
Overlap x
EthernetSwitchCN
Figure 4.5: Simulation scenario
IEEE 802.11 Configuration
Data and basic rate 11MbpsBeacon interval 0.1sNumber of operating channels 14Beacon scanning interval 0.1sMinChannelTime 0.01sMaxChannelTime 0.035s
Path Loss Configuration
Transmit Power 0.025WWavelength 0.124mPath loss exponent 2.0Receive Power Threshold (Prxthresh) 4 × 10⁻⁹WHandover Power Threshold (Phothresh) 6.25 × 10⁻⁹W
Table 4.2: Simulation parameters used for dual interface handover evaluation.
108
4.5.2 Handover Performance
To demonstrate the dual interface smooth handover, an overlapping coverage of 5 me-
ters and MS speed of 1 m/s for the scenario described earlier are used. The dual inter-
face has been configured to use the “Always Scanning” scheme for discovering neigh-
boring APs.
The plot in Figure 4.6 shows the frame sequence received at the MS from the CBR flow
sent from the CN. Part (a) demonstrates the frames lost when active and passive scan-
ning were used on a single interface. We can see that the observed losses are propor-
tional to the corresponding handover time. The losses are due to the previously con-
nected AP’s unsuccessful attempts at sending frames to the MS during the handover
and discarding each frame when the maximum retry count was reached. Such losses
could have been avoided if the previous AP was able to forward frames to the new AP,
as discussed in [PZCC03, CS05, HTT06]. However, this forwarding strategy results in
delayed frames that are only useful for applications without strict timing constraints.
For VoIP applications, these excessively delayed frames are normally discarded by the
application.
The frame sequence received at the CN for the CBR flow in the opposite direction can be
seen in Figure 4.7. We observe that the MS buffers the outgoing frames for the length of
the handover, before sending them through in quick succession once the handover com-
pletes. No loss occur in this case, but the frames are delayed proportionately with the
handover time. As mentioned previously, the introduced delays are typically discarded
by VoIP applications as they do not meet the required timing constraints.
Both Figures 4.6 and 4.7 demonstrate the seamless handover achieved using the pro-
posed dual interface device, where the CBR flow in both directions is unaffected. The
109

3400
3420
3440
3460
3480
3500
3520
3540
3560
89 89.5 90 90.5 91 91.5 92
Seq
uenc
e N
umbe
r
Time (s)
ActivePassive
(a) Single interface
2970
2980
2990
3000
3010
3020
3030
3040
3050
3060
3070
79 79.5 80 80.5 81
Seq
uenc
e N
umbe
r
Time (s)
Dual
(b) Dual interface
Figure 4.6: Sequence received at the MS during a two-way CBR call at the point ofhandover
110

3420
3440
3460
3480
3500
3520
3540
3560
3580
89 89.5 90 90.5 91 91.5 92
Seq
uenc
e N
umbe
r
Time (s)
ActivePassive
(a) Single interface
3000
3010
3020
3030
3040
3050
3060
3070
3080
3090
79 79.5 80 80.5 81
Seq
uenc
e N
umbe
r
Time (s)
Dual
(b) Dual interface
Figure 4.7: Sequence received at the CN during a two-way CBR call at the point ofhandover
111

205.5
206
206.5
207
207.5
208
208.5
209
209.5
210
210.5
89 89.5 90 90.5 91 91.5 92
Fra
me
Siz
e (b
ytes
)
Time (s)
PassiveActive
(a) Single interface
205.5
206
206.5
207
207.5
208
208.5
209
209.5
210
210.5
79 79.2 79.4 79.6 79.8 80
Fra
me
Siz
e (b
ytes
)
Time (s)
Dual (Int 1)Dual (Int 2)
(b) Dual interface
Figure 4.8: Frame size received at the MS during a two-way CBR call at the point ofhandover
112

0
0.5
1
1.5
2
2.5
3
0 1 2 3 4 5
Dis
conn
ecte
d (s
)
Overlap (m)
ASAS-S
PP-S
AA-S
Figure 4.9: Handover disruption for various overlapping cell coverage andMS speed of1 m/s
plot in Figure 4.8 provides a different view of the seamless handover, showing the
frames received by each individual interface.
4.5.3 Performance Of AP Discovery Methods
Although the dual interface device has been designed to enable seamless handover,
there are limitations where it is unable to do so. The overlapping coverage area and MS
speed are important factors to consider. An insufficient overlap or a fast moving MS
could result in the current AP getting out of reception range before the new connection
is established, causing a disruption in the current traffic flow.
This section observes the performance under various overlapping coverage distance
and MS speed. The different scanning algorithms discussed earlier in Section 4.2.4,
namely, “Always Scanning” (AS), “Passive Scanning” (P), and “Active Scanning” (A)
113

0
0.5
1
1.5
2
2.5
3
0 1 2 3 4 5
Dis
conn
ecte
d (s
)
Overlap (m)
ASAS-S
PP-S
AA-S
Figure 4.10: Handover disruption for various overlapping cell coverage and MS speedof 2 m/s
0
0.5
1
1.5
2
2.5
3
0 1 2 3 4 5
Dis
conn
ecte
d (s
)
Overlap (m)
ASAS-S
PP-S
AA-S
Figure 4.11: Handover disruption for various overlapping cell coverage and MS speedof 4 m/s
114

ScanningAlgo-rithm
ChannelScanTime (SC)(s)
Numberof Chan-nels(NC)
ScanningCycleTime (ST )(s)
Time forSeamless(Tseamless)(s)
Overlap Required (m)
1 m/s 2 m/s 4 m/sAS 0.1 14 1.4 2.2 2.2 4.4 8.8AS-S 0.1 3 0.3 0.5 0.5 1 2P 0.1 14 1.4 2.2 2.2 4.4 8.8P-S 0.1 3 0.3 0.5 0.5 1 2A 0.01-
0.03514 0.17-0.49 0.24-0.59 0.24-0.59 0.48-1.18 0.96-2.36
A-S 0.01-0.035
3 0.06-0.11 0.08-0.17 0.08-0.17 0.16-0.34 0.32-0.68
Table 4.3: Calculated scanning time and overlap required.
are investigated. Furthermore, the algorithms with the selective channel scanning op-
timization, denoted by AS-S, P-S, and A-S, are also included. The same simulation
scenario described earlier is used with different x and MS speed v values. MS speeds
higher than 4 m/s were not investigated, as they are unlikely to occur in an indoor
environment.
The measured handover disruption time for varying configurations can be seen in Fig-
ure 4.9 to Figure 4.11. As expected, the higher the MS speed, the greater overlap re-
quired to ensure a smooth handover. Due to the shorter scanning delays using active
or selective channel scanning approaches, smooth handover can be achieved for a rela-
tively small overlap compared to passive or “Always Scanning” methods covering the
full spectrum of channels.
For a seamless handover, the second interface needs sufficient time to locate and con-
nect with a newAP before the first interface drops the connection with the current AP. A
scanning routine only starts when the signal level reaches below Phothresh. The scanning
interface continually repeats a scanning cycle as the MS moves away from the current
115

AP until a new AP is located. A scanning cycle is defined as the scanning of all chan-
nels in the entire channel range. The total scanning cycle time (ST ) can be determined
knowing the time to scan each channel (SC) and the number of channels (NC)
ST = NC × SC . (4.5.1)
By the time the MS is within the new AP’s range, it may be partly through a scanning
cycle. To ensure the new AP is discovered, irrespective of which channel it operates
on, the minimum time required for a seamless handover (Tseamless) needs to cover the
remaining time required to complete the current scanning cycle (SR) as well as a full
scanning cycle time
Tseamless = SR + ST . (4.5.2)
where SR < ST .
Using an appropriate path loss model, such as the log-distance path loss model [Rap01]
used in the simulation model, we can determine the distance going from Phothresh to
Prxthresh. Knowing this distance and the MS’s speed, we can determine the time differ-
ence from reaching Phothresh to Prxthresh. The remainder obtained by dividing this time
by ST gives us a value for SR. Using both ST and SR, we can determine Tseamless. From
Tseamless and the MS’s speed, we can determine the overlap required for a seamless han-
dover. Table 4.3 shows the calculated overlap required using this methodology.
The simulation results seen in Figure 4.9 to Figure 4.11 correspond well to the overlap
requirements stated in Table 4.3. As long as the overlap requirements are adhered to for
the respectiveMSmovement speed and scanningmethod, a smooth lossless handover is
achieved. However, this can be thwarted in the event of lost beacon or probe exchanges,
116

which can occur from corrupted (or collided) frames or insufficient channel scanning
time. For a speed of 4 m/s, the overlap required to cover the passive scanning latency
is greater than the distance between the handover and reception range of 5 m. This
means seamless handover cannot be achieved under this setting no matter the amount
of overlap, as demonstrated in Figure 4.11. To achieve a seamless handover, we either
choose a shorter scanning scheme or increase Phothresh adequately to achieve a greater
distance between the handover and reception range. The latter option is investigated
in Chapter 5. In practice, this is less likely a problem as users are typically in an indoor
environment (e.g. airport or office) where walking speed is less than 2 m/s.
An MS using the “Always Scanning” method, starts its scanning as soon as the MS is
operational. For this reason, it is difficult to determine the overlap required accurately.
Instead, the values for the passive scanning method have been used as estimates. For
the specific scenario used in this investigation, as observed in Figure 4.10 and Figure
4.11, the estimated values in Table 4.3 overestimate the required overlap.
4.6 Conclusion
Time sensitive applications, such as real-time voice or video over IP, have strict delay
and jitter tolerances. Previously, in Chapter 3, it was demonstrated that the handover
performance of currently available 802.11 interfaces struggled to meet such require-
ments. To address this, a method utilizing two 802.11 interfaces to support seamless
handover was introduced in this chapter. It is purely a link layer solution, providing
seamless handover between APs within the same subnet.
Investigations demonstrated that a seamless handover was achievable using the pro-
posed strategy. However, for this to occur there needs to be sufficient overlap between
117

the coverage area of the current AP and the future target AP. The required overlap de-
pends on a number of factors, namely, the scanning scheme used and theMS speed. The
scanning scheme dictates the amount of time the second interface requires to locate and
connect with a new AP. Results obtained through simulations confirms this, demon-
strating short scanning routines, such as active scanning and selective scanning opti-
mizations, achieved smooth handover with small overlap requirements. These faster
scanning schemes can help to mitigate the overlap required to accommodate for higher
MS speeds.
Attention must also be given for setting an appropriate value for the handover sig-
nal threshold. For the case when an MS moving at 4 m/s using the passive scanning
routine, the handover signal threshold was not set high enough to allow a smooth han-
dover. The problem of setting an appropriate handover signal threshold requires further
investigation and is addressed in the following chapter.
118

Chapter 5
Effective Link Triggers To ImproveHandover
5.1 Introduction
In the previous chapter, the use of two 802.11 interfaces on an MS to achieve smooth
handover was investigated. When a scanning scheme such as the “Always Scanning”
method is utilized, both interfaces are constantly active, reducing the valuable battery
life on the MS. With an MS typically spending most of its time within a cell rather than
transitioning between cells, it is unnecessary to have the scanning interface active for
most of this time. Amore efficient approachwould be to use the other scanning schemes
(i.e. active or passive scanning) that activates the scanning interface only when a han-
dover is anticipated.
As we studied in the previous chapter, the anticipation can be provided through the use
of aHandover Power Level Threshold Phothresh. We saw that setting an appropriate value
to ensure a smooth handover was critical for long scanning schemes, such as passive
scanning. The device requires sufficient anticipation on the occurrence of a handover to
119

setup the connection on the new interface, before the old interface disconnects. In this
chapter, we investigate how this anticipation can be estimated based on signal path loss
models.
The remainder of this chapter is structured as follows. In Section 5.2, we describe the
link layer triggers used for handovers. In Section 5.3, we present an analytical model for
setting the link going down threshold. Section 5.4 presents numerical results to evaluate
the model. Finally, Section 5.5 offers a summary and concluding remarks.
5.2 Using Link Layer Triggers For Handovers
Handovers generally occur when a MS moves away from its current cell coverage.
When the signal level or error rate becomes unacceptable, the handover is performed
where the MS connects to another point of access. Link triggers can be used within the
Internet Architecture to provide performance benefits as presented in [Abo05]. In the
case where multiple interfaces are available on the MS, the 802.21 Media Independent
Handover (MIH) [IEE05d] framework currently being developed can be used to facili-
tate both vertical and horizontal handover. The framework defines triggers which are
used between layers to communicate specific events. Here, only the layer 2 triggers that
are relevant to this study are discussed. They are as follows:
• Link Up (LU) - Generated when an MS interface is accepted in the cell.
• Link Down (LD) - Generated when an MS interface is disconnected from the cell.
There are a number of link layer measurements that can be used in order to gener-
ate an LD including signal strength, frame error rate, number of missed beacons,
etc. In this study we focus on the signal level. Thus, we assume that when the
received signal level is decreasing and below the Receive Power Level Threshold
120

MobilityManager Interface 1 Interface 2
Handover andRe-direct
Re-direct
Re-direct ACK
MIH
LD
LD
Decision to re-direct to Interface 2
Signal Lossand
Disconnected
Re-direct datato Interface 2
MS
CN
Handover Latencyand
Traffic DisruptionLayer 2Scanning and
connecting
Figure 5.1: Multi-interface MS is disconnected for a time equal to the handover latencywithout LGD trigger.
Prxthresh, an LD trigger is generated.
• Link Going Down (LGD) - Used to anticipate the LD event. Here again, many link
layer measurements can be used in order to trigger this event. In this study, it is
triggered when the received signal level is decreasing and below the Link Going
Down Power Level Threshold Plgd that normally has a higher value than Prxthresh.
• Link Rollback (LR) - Its primary purpose is to cancel the LGD event when the re-
ceived signal level immediately following the LGD event is increasing and higher
than Prxthresh.
121

MobilityManager Interface 1 Interface 2
Handover andRe-direct
Re-direct
Re-direct ACK
MIH
LGD
LGD
Decision to re-direct to Interface 2
Signal belowLGD threshold
Re-direct datato Interface 2
Handover Latency
LD
LD
Signal LossAnd
Disconnected
CN
MS
Layer 2Scanning and
connecting
Figure 5.2: Multi-interface MS maintains its connection and experiences no disruptionsin traffic flow when using LGD trigger.
As mentioned earlier, the main motivation of this study is to minimize the packet lost
while a handover is performed. This can be achieved with the use of the LGD trigger.
Without it, the Mobility Manager residing on the MS and in charge of the decision to
switch interfaces does not begin to configure the connection on the new interface until
the current connection is lost. This interrupts the traffic flow for the whole duration of
the layer 2 and layer 3 handover, as illustrated in Figure 5.1. The LGD trigger allows
the Mobility Manager to be informed in advance about the imminent loss of connection
over the current interface. It is then able to configure the connection on a new interface
122

before the disconnection takes place as seen in Figure 5.2. The required anticipation can
be achieved by adjusting the difference between Prxthresh and Plgd appropriately as
Plgd = αPrxthresh α ≥ 1 (5.2.1)
where α is the Power Level Threshold Coefficient. In this equation, α is the key com-
ponent being studied to determine a suitable value for a minimal handover packet loss.
The speed of the MS also needs to be considered as part of the anticipation, since it
affects the time it takes the signal to vary from Plgd to Prxthresh.
5.3 Setting Link Trigger Threshold
In this section we propose an analytical method for effectively setting the LGD trigger
threshold. Given a path loss model, our analysis relates the fraction of time the MS is
disconnected during a handover (Lho) to α, and the speed of the MS (v). Observe that a
suitable path loss model that accurately characterizes the operation environment is key
to obtaining an effective threshold value. As an example, let’s assume the log-distance
path loss model [Rap01]
[
Prx (d)
Prx (d0)
]
dB
= −10β log
(
d
d0
)
(5.3.1)
where Prx is the Received Signal Power Level in Watts, β is the path loss exponent, and
d is the distance between the receiver and the transmitter expressed in meters. Also
note that Prx (d0) is the received power at the close-in reference distance, d0, and can be
123

determined using the Friis free space path loss model [Rap01] 5.3.2.
Prx (d0) =PtxGtxGrxλ
2
(4π)2 d20
(5.3.2)
where Ptx is the transmitted power inWatts,Gtx is the transmitter gain,Grx is the receiver
gain, and λ is the signal wavelength in meters.
It is assumed that the MS monitors its received signal strength through data sent from
the Access Point (AP). Hence, in the context of these equations, the MS and AP are the
receiver and transmitter respectively. Assuming the MS starts at the AP and moves at
a constant velocity v radially from the AP at time t equal to zero. Equation 5.3.1 can be
expressed as
t =d0
v
(
Prx (d0)
Prx (t)
)1
β
(5.3.3)
This equation shows the time when the MS has a given Prx. Packet losses during a
handover occurs when Prx at the MS is below Prxthresh and the new interface connection
has yet to be completed. To account for the loss, the time difference from reaching Plgd
to Prxthresh must be considered, denoted as td. Using Equation 5.2.1 and 5.3.3, we obtain
td =d0
v
(
Prx (d0)
Prxthresh
)1
β[
1 −1
α1
β
]
(5.3.4)
If the time to establish a connection on the new interface is tnew, the time spent discon-
nected during a handover is tnew − td. The ratio of time during a handover with no
124

connection Lho can now be computed as
Lho =tnew − td
tnew
= 1 −d0
vtnew
(
Prx(d0)Prxthresh
)1
β
[
1 −1
α1β
]
(5.3.5)
The received power level threshold value Prxthresh depends on the capabilities of the
receiving interface and is a defined quantity. Knowing the handover heuristics used, the
time to establish a connection tnew can be approximated. The speed of the MS v is not a
fixed value as it depends on the user’s mobility pattern, but can be estimated if the MS
is equipped with GPS [ER06] technology. Knowing Prxthresh, tnew and v, Equation 5.3.5
allows one to estimate the proportion of packets lost during a handover for a given
α. This calculation assumes traffic sent at a constant rate. In Section 5.4.5 a numerical
fitting method is presented and evaluated in order to address the case for bursty traffic.
5.4 Performance Analysis
In this section we evaluate the model described previously for effectively setting the
LGD trigger threshold. We start by describing the simulation configuration, and present
results under ideal path loss conditions. Following this, we show how the model can be
extended to address shadowing effects and bursty traffic.
5.4.1 Simulation Configuration
The scenario illustrated in Figure 5.3 was simulated using the NS-2 [ns-a] network simu-
lator. We are using a modified release that supports 802.21 and heterogeneous networks
(available from [ns-c]) in order to verify and evaluate the model discussed previously.
125

Dual InterfaceMS
Router CN
Core Network
AP (Channel = 1)
AP (Channel = 6)
10 m
Figure 5.3: Simulation scenario
In particular, the simulation results were used in order to identify suitable parameter
values for setting the LGD threshold.
The scenario consists of two IEEE 802.11 cells, where one operates on channel 1, while
the other operates on channel 6. They both share an overlapping coverage area of 10
meters. Initially the MS starts within the first WLAN cell 2 meters away from the AP. It
then detects the AP (through active or passive scanning) and performs the association
handshake process. Once this is completed, the Correspondent Node (CN) starts send-
ing a Constant Bit Rate (CBR) traffic stream with a packet size of 604 bytes (including
UDP, IP, and MAC header) at 0.02 second intervals. The MS begins moving away from
the first AP towards the second AP at a constant speed while receiving packets from the
CN. Eventually, it reaches a point where the signal level is below Prxthresh and it needs
126

Path Loss Model Configuration
Transmit Power (Pt) 0.025WWavelength (λ) 0.124mPath Loss Exponent (β) 4Standard Deviation (σ) 0dB to 4dBReceive Power (Prx) 3.162 × 10⁻¹¹W
Table 5.1: Simulation parameters used for signal based anticipation evaluation.
to perform a handover to the second WLAN cell. By triggering an LGD event when
the signal level reaches Plgd, assuming sufficient anticipation is provided, the number
of packets lost during a handover is minimized. In this scenario, it is assumed that each
AP operate on a different subnet. Therefore, both a layer 2 and layer 3 handover is re-
quired when switching to the new interface. The MS then updates the CN to redirect
the traffic flow to its new interface.
5.4.2 Validation Of The Handover Loss Equation
In order to validate Equation 5.3.5 for calculating the handover loss, we compare com-
puted values to that obtained from our simulated scenario. Figure 5.4 shows the ratio of
packet lost for varying power level threshold coefficient α and MS speed. No weighted
averaging was applied for the signal readings measured at the MS (i.e. δ = 1). Note that
the ratio of packet lost is calculated by dividing the measured (or calculated) packet loss
by the packet loss obtained if α = 1 (i.e. Plgd = Prx). It can be seen from Figure 5.4 that
the expected handover packet loss obtained by using Equation 5.3.5 corresponds well
to the one obtained by simulation. MSs with a speed of 10 m/s and under move slowly
enough that the active scanning procedure at the link layer and the binding update at
the network layer can be completed without any loss with a Plgd less than 3 times Prx.
This works out to be approximately 0.6 times the cell distance. More significant antici-
pation is required at higher speeds that exceed 20 m/s.
127

0
0.2
0.4
0.6
0.8
1
1 1.5 2 2.5 3 3.5 4 4.5
Rat
io o
f pac
ket l
ost
Power level threshold coefficient
1m/s2m/s5m/s
10m/s20m/s40m/s
1m/s (calc)2m/s (calc)5m/s (calc)
10m/s (calc)20m/s (calc)40m/s (calc)
Figure 5.4: Ratio of packet lost during WLAN-UMTS handover for CBR traffic withσ = 0 and δ = 1
5.4.3 Effects Of Shadowing
After studying the packet lost during a handover for an ideal decaying signal, we now
investigate shadowing effects which may affect the propagation model. These shad-
owing effects can be modeled by introducing an additional component Xσ, to the log-
distance path loss model shown in Equation 5.3.1.
[
Prx (d)
Prx (d0)
]
dB
= −10β log
(
d
d0
)
+ Xσ (5.4.1)
Xσ is a random variable drawn from a Gaussian distribution with a standard deviation
of σ [Rap01]. Note that, a 0 value for σ indicates the absence of any shadowing effects
as was discussed earlier.
Using a σ value of 1 and 4, we obtain the ratio of packet lost relationships in Figure 5.5
128
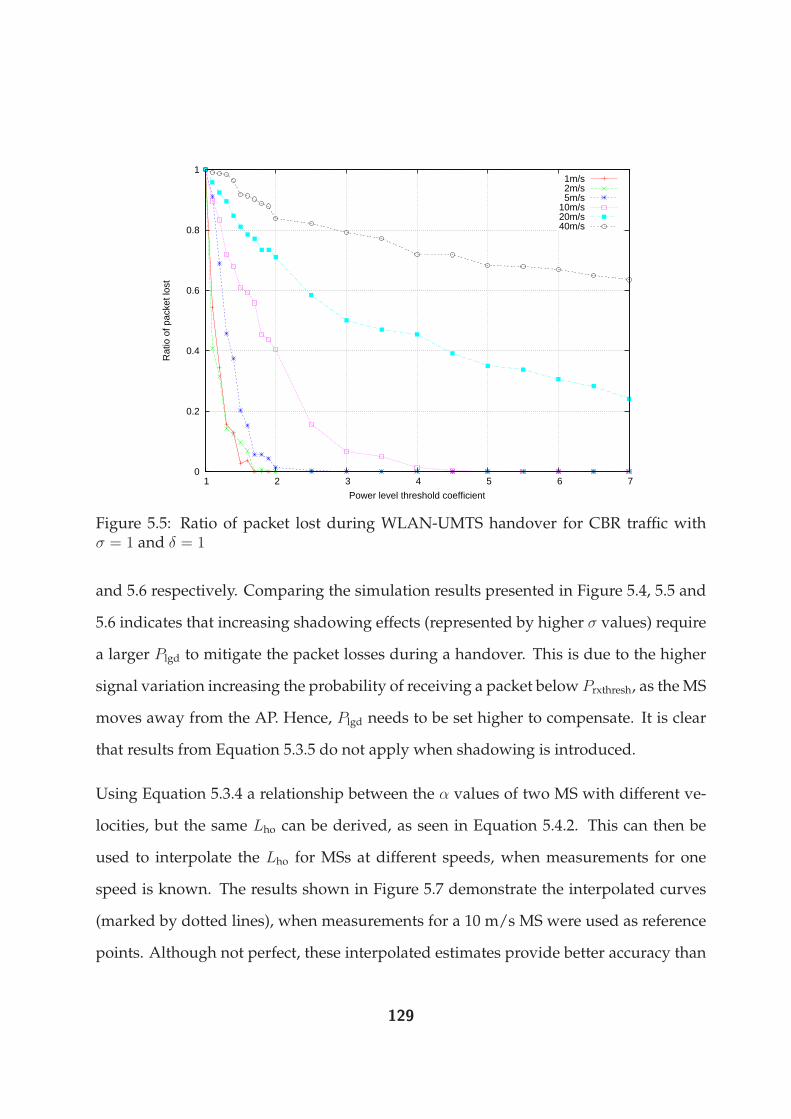
0
0.2
0.4
0.6
0.8
1
1 2 3 4 5 6 7
Rat
io o
f pac
ket l
ost
Power level threshold coefficient
1m/s2m/s5m/s
10m/s20m/s40m/s
Figure 5.5: Ratio of packet lost during WLAN-UMTS handover for CBR traffic withσ = 1 and δ = 1
and 5.6 respectively. Comparing the simulation results presented in Figure 5.4, 5.5 and
5.6 indicates that increasing shadowing effects (represented by higher σ values) require
a larger Plgd to mitigate the packet losses during a handover. This is due to the higher
signal variation increasing the probability of receiving a packet below Prxthresh, as theMS
moves away from the AP. Hence, Plgd needs to be set higher to compensate. It is clear
that results from Equation 5.3.5 do not apply when shadowing is introduced.
Using Equation 5.3.4 a relationship between the α values of two MS with different ve-
locities, but the same Lho can be derived, as seen in Equation 5.4.2. This can then be
used to interpolate the Lho for MSs at different speeds, when measurements for one
speed is known. The results shown in Figure 5.7 demonstrate the interpolated curves
(marked by dotted lines), when measurements for a 10 m/s MS were used as reference
points. Although not perfect, these interpolated estimates provide better accuracy than
129

0
0.2
0.4
0.6
0.8
1
1 2 3 4 5 6 7
Rat
io o
f pac
ket l
ost
Power level threshold coefficient
1m/s2m/s5m/s
10m/s20m/s40m/s
Figure 5.6: Ratio of packet lost during WLAN-UMTS handover for CBR traffic withσ = 4 and δ = 1
Equation 5.3.5 in approximating the signal level decay.
td1 = td2
α2 = 12
6
6
4
1+v2v1
0
B
B
@
1−α
1β1
α
1β1
1
C
C
A
3
7
7
5
β(5.4.2)
5.4.4 Weighted Averaging Of Signal Strength
By introducing the shadowing effects to achieve a more realistic path loss model, it
is important to include a weighted averaging mechanism to produce a stable signal
strength reading. It is particularly important when the shadowing component becomes
significant. To achieve this, a simple weighted average (Equation 4.2.1) is maintained,
as used for signal readings in Chapter 4.
130

0
0.2
0.4
0.6
0.8
1
1 2 3 4 5 6 7
Rat
io o
f pac
ket l
ost
Power level threshold coefficient
1m/s2m/s5m/s
10m/s (ref)20m/s40m/s
1m/s (calc)2m/s (calc)5m/s (calc)
20m/s (calc)40m/s (calc)
Figure 5.7: Ratio of packet lost during WLAN-UMTS handover for CBR traffic withσ = 4 and δ = 1, with interpolation based on 10 m/s MS.
First, we apply the weighted averaging to signal strength samples without shadowing
(σ = 0) in order to investigate the effects of averaging independent of shadowing. Fig-
ure 5.8 shows the ratio of packet lost obtained with no shadowing applied but a δ of
0.25 for the weighted averaging mechanism. Comparing Figure 5.8 to Figure 5.4, it can
be seen that as more averaging is applied (lower δ) the system becomes less responsive
to rapid changes. Hence, a higher α value is required in order to achieve the same level
of anticipation and the same ratio of packet lost. From this, it is clear that Equation
5.3.5 does not apply when averaging is used. However, it can be seen in Figure 5.8 that
it is possible to use Equation 5.4.2 to approximate the curves reasonably accurately, as
long as one curve for a given speed is known. The plots obtained through simulations
seem to correspond well with the interpolated plots. As for the previous section, the
measurements for a MS moving at 10 m/s were used as a reference points to produce
the interpolated curves.
131

0
0.2
0.4
0.6
0.8
1
1 2 3 4 5 6 7
Rat
io o
f pac
ket l
ost
Power level threshold coefficient
1m/s2m/s5m/s
10m/s (ref)20m/s40m/s
1m/s (calc)2m/s (calc)5m/s (calc)
20m/s (calc)40m/s (calc)
Figure 5.8: Ratio of packet lost during WLAN-UMTS handover for CBR traffic withσ = 0 and δ = 0.25, with interpolation based on 10 m/s MS.
An appropriate value for δ largely depends on the amount of signal variation (i.e., value
of σ), and it is currently chosen experimentally. Other techniques may be applied, how-
ever, this is left as part of the future work. Figure 5.9 shows the possible signal strength
variations for different δ values, when σ is set to 4. The variation swing can be seen to
be quite large without any averaging applied, while 0.25 or 0.05 stabilizes the readings
quite acceptably. It is important to obtain stability to reduce the likelihood of a ping
pong effect, in our case oscillating between Link Going Down and Link Rollback.
Next we compare the decaying signal produced using a δ of 0.05 to a Fast Fourier Trans-
form (FFT) based decay detection method described in [GGZZ04]. This method offers
an alternative for detecting a decaying signal and is based on the fundamental term
of the FFT (i.e. k = 1 for a FFT sequence X (k)) of the signal sequence as shown in
Equation 5.4.3. Note that x (n) is the signal level for the sequence n, and N is the total
132

0
5e-10
1e-09
1.5e-09
2e-09
2.5e-09
3e-09
3.5e-09
16 16.1 16.2 16.3 16.4 16.5
Sig
nal S
tren
gth
(W)
Time (s)
10.250.05
Figure 5.9: Average signal strength (for δ values of 0.05, 0.25 and 1) as the MS movesaway from the AP for different δ values
sequence length. Since the fundamental term of the FFT acts as a linear filter with the
least high-frequency components, it produces values with minimal variations despite
large variations in the signal sequence.
X (1) =N−1∑
n=0
x (n) sin
(
−2πn
N
)
(5.4.3)
As recommended by the authors of [GGZZ04], we use a sampling interval of 100 ms
(i.e. sample n is produced every 100 ms), and an FFT threshold X (1) /N equal to -0.6,
which means the signal is considered to be decaying when the FFT method is below
this value. Figure 5.10 shows the readings obtain using the FFT decay detection method
compared to using the weighted average with a δ of 0.05. It demonstrates that both the
weighted averaging and FFT-based decay detection method lead to comparable results.
As suggested by the authors of [GGZZ04], both methods may be used in combination
133

1e-11
1e-10
1e-09
1e-08
1e-07
1e-06
5 10 15 20 25 30 35 40
-4
-3.5
-3
-2.5
-2
-1.5
-1
-0.5
0
0.5
1S
igna
l Str
engt
h (W
)
X(1
)/N
Time (s)
Paverage with δ=0.05FFT Decay Detection
Figure 5.10: Average signal strength and FFT decay detection value as the MS movesaway from the AP with δ = 0.05
to determine a decaying signal.
The amount of averaging applied should be chosen to adequately stabilize the signal
strength samples. However, as more averaging is applied, further anticipation is re-
quired to compensate the slower response by increasing the value of α.
Figure 5.11 illustrates the ratio of packet lost relationships for both simulated and in-
terpolated results with a shadowing σ of 4 and averaging δ of 0.05. It can be seen that
when the weighted averaging is applied to a shadowing signal, the consistency of han-
dover loss seems to improve, resulting in better interpolated curves. However, it is still
only good enough to be used as a rough guide for estimating appropriate thresholds,
especially for fast moving MSs.
134

0
0.2
0.4
0.6
0.8
1
1 2 3 4 5 6 7
Rat
io o
f pac
ket l
ost
Power level threshold coefficient
1m/s2m/s5m/s
10m/s (ref)20m/s40m/s
1m/s (calc)2m/s (calc)5m/s (calc)
20m/s (calc)40m/s (calc)
Figure 5.11: Ratio of packet lost during WLAN-UMTS handover for CBR traffic withσ = 4 and δ = 0.05, with interpolation based on 10 m/s MS.
5.4.5 Video Traffic Patterns
In the previous section, we developed a method based on interpolation to estimate ap-
propriate thresholds. Now we see how well this technique can be applied to bursty
traffic, similar to video traffic streams. The traffic pattern is quite different compared
to CBR traffic. Generally it sends a burst of a few packets at intervals, rather than one
packet at a time at fixed intervals. To simulate bursty video traffic, a burst of three 1000
byte packets are sent at 0.07 second intervals. This equates to a rate of 0.023 seconds
per packet, which is used to calculate the expected packets during the handover period
with Equation 5.3.5.
Figure 5.12 shows the ratio of packet lost using bursty video traffic for both simulated
and interpolated results in the case of no shadowing effects being applied (i.e. σ = 0)
and weighted averaging turned off (i.e. δ = 1). Whereas Figure 5.13 illustrates the ratio
135

0
0.2
0.4
0.6
0.8
1
1 2 3 4 5 6 7
Rat
io o
f pac
ket l
ost
Power level threshold coefficient
1m/s2m/s5m/s
10m/s (ref)20m/s40m/s
1m/s (calc)2m/s (calc)5m/s (calc)
20m/s (calc)40m/s (calc)
Figure 5.12: Ratio of packet lost during WLAN-UMTS handover for Video traffic withσ = 0 and δ = 1, with interpolation based on 10 m/s MS.
of packet lost when there is significant shadowing with a σ of 4 and averaging applied
to stabilize the values with a δ of 0.05. Since the number of send attempts during the
handover period andweighted averaging update process depends on the traffic pattern,
a different ratio of packet lost trend results compared to the case using CBR traffic. This
can be seen by comparing Figure 5.12 with Figure 5.4, and Figure 5.13 with Figure 5.11.
As for the case of using CBR traffic, a sufficient δ need to be chosen to handle the amount
of shadowing. The figures also show that interpolation estimates, as done for CBR traffic
with shadowing and weighted averaging, can be used for Variable Bit rate (VBR) traffic
as well. The interpolated estimates for both traffic types exhibit a similar behavior and
decreases in accuracy for MS with higher speeds.
136

0
0.2
0.4
0.6
0.8
1
1 2 3 4 5 6 7
Rat
io o
f pac
ket l
ost
Power level threshold coefficient
1m/s2m/s
5m/s (ref)10m/s20m/s40m/s
1m/s (calc)2m/s (calc)
10m/s (calc)20m/s (calc)40m/s (calc)
Figure 5.13: Ratio of packet lost during WLAN-UMTS handover for Video traffic withσ = 4 and δ = 0.05, with interpolation based on 5 m/s MS.
5.5 Conclusion
In this chapter, the handover performance of an MS equipped with multiple interfaces
switching from one interface to another was investigated. By using link triggers, specif-
ically the LGD trigger based on signal strength readings, the MS was able to establish a
new connection on another interface before the current interface disconnects. An equa-
tion based on the Fritz path loss model was developed to relate the ratio of packet lost
during handover to the threshold coefficient α. This equation helps determine a suit-
able α value to provide sufficient anticipation to minimize handover packet loss for
MSs moving at different speeds. In order to address realistic scenarios where the signal
level fluctuates due to shadowing effects or bursty traffic, additional methods including
averaging and interpolation were presented and evaluated. In particular, a numerical
method was developed to interpolate the threshold coefficient relationships at various
137
MS speeds, given some knowledge of the signal decay patterns for a specific speed. It
was shown that this can be used effectively in order to set the LGD threshold.
The LGD trigger threshold andHandover Power Level Threshold Phothresh (seen in Chap-
ter 4) both share the same function of determining when to initiate a handover on the
second interface. As a result, the numerical method developed in this chapter based on
setting an LGD trigger threshold can be similarly applied to setting Phothresh. It is also
worth noting that the handover anticipation can be applied more generally to a mobile
device performing vertical handover between two interfaces using different technolo-
gies.
138

Chapter 6
Maintaining QoS Using Link Triggers
6.1 Introduction
In earlier chapters, we have only considered handover triggers based on a degrading
received signal strength as an MS moves away from an AP. For an MS hosting appli-
cations with strict QoS requirements, a signal based trigger is insufficient for reflecting
the suitability of the current link to support the MS. There are parameters affecting the
supported QoS that may have long degraded to unacceptable levels to support the MS’s
application irrespective of the received signal power. In this chapter, QoS related trig-
gers based on link layer parameters are introduced, with an assessment of how well
they meet the application’s QoS requirements. This concept can be applied to devices
with single or multiple interfaces.
As for previous chapters, we will apply it to a device equipped with dual IEEE 802.11
interfaces. We will show how an IEEE 802.11 interface can be used to determine QoS
performance based triggers and initiating handovers. Note that in this chapter, we fo-
cus primarily on the mechanism used for determining and setting QoS based triggers.
The facilities offered by IEEE 802.21 MIH framework to support this is covered briefly.
139

More specific details on IEEE 802.21 MIH is outside the scope of this chapter, but can be
referred to in [GOHR+06, IEE05d].
This chapter is organized as follows. In Section 6.2 the mechanism for managing and
determining appropriate QoS based triggers at the wireless link layer is presented. This
is followed by Section 6.3, which presents performance results, highlighting the benefits
of QoS based triggers. Finally, Section 6.4 concludes and summarizes the findings.
6.2 QoS Based Triggers
6.2.1 QoS Decision Engine (QDE)
A keymechanism presented in this study to manage QoS based triggers is known as the
QoS Decision Engine (QDE). One of the QDE’s main task is to perform the mapping be-
tween lower layer metrics to the applications’ QoS requirements. Having this mapping,
the QDE is able to determine if the end-to-end QoS is still satisfied, as lower wireless
link layer characteristics change. When the QDE detects that the QoS requirement can’t
be met, it performs a handover to utilize an alternate interface. Note that changes are
not restricted to the wireless link layer, but can occur at any point in the connection.
However, in this investigation, we assume that the wireless link is the most dominant
dynamic component.
The QDE is an MIH user, as such interacts with facilities proposed as part of the IEEE
802.21 MIH framework, to obtain the performance information it relies on and man-
age performance changes at the link layer. As illustrated in Figure 6.1, the QDE can
either be co-located at the MS or the AP to give a mobile or network centric handover
decision, respectively. In this investigation we focus primarily on the mobile centric
140

approach that has been used consistently throughout the thesis so far. It fits well with
IEEE 802.11 networks, which are typically unmanaged or have adjacent coverage areas
that are controlled independently from each other. The client controlled approach also
offers a convenient standalone method that can easily highlight the QDE mechanism.
6.2.2 Cross Layer QoS Mapping
The QoS of an end-to-end connection between the MS and CN depends on the capabil-
ities and state of each network segment along the connection path. Each network seg-
ment is defined as the connection between two networked devices that is supporting
end-to-end traffic flow, denoted as Sn in Figure 6.2. Together, all the segments form the
connection path between the end-to-end connection. Variations in any of the segments
will affect the entire end-to-end QoS. Therefore, the mapping of the required end-to-end
QoS requirements to the network segments involved in the connection is important for
determining the tolerable variations on a particular segment.
Firstly, before the mapping is defined, the set of important end-to-end QoS character-
istics need to be identified. As stated in [JH02, ITU01], the characteristics that assist in
QoS guarantees include delay, jitter, error rate and throughput. It is important to mea-
sure and control these characteristics throughout the end-to-end connection, as they can
greatly affect the quality of both the reconstructed audio and video at the receiver. For
this particular investigation, we have adopted a subset of the requirements specified in
ITU-T Y.1540 [ITU01]. They include:
Packet Transfer Delay (Qd) - maximum end-to-end delay tolerance (s).
Packet Delay Variation (Qj) - maximum end-to-end jitter tolerance (s).
Throughput (Qt) - required data rate for successful packets (bits/s).
141

��������������
����
������������
�����������������
���
���
���
������� ����������
����������
�������
�������
��������
������� �����
���������
�������
��������
������� �����
���������
������
(a) QDE at MS
��������������
����
���
��
����������
�������
�������
��������
���������������������
��������
�������
��������
���������������������
��������
(b) QDE at AP
Figure 6.1: Possible QDE location [GOHR+06].
142

The required end-to-end QoS connection requirements (i.e. Qd, Qj , and Qt) are typi-
cally communicated to the QDE from the application or operating system. Throughout
this study we assume that the end-to-end QoS requirements are always available to the
QDE. The relevant mechanisms to facilitate this are outside the scope of this study.
The end-to-end QoS connection is defined into two distinct networks, namely an access
network and a core network, as illustrated in Figure 6.2. The access network is rep-
resented by the wireless access connection between the MS and AP at the edge of the
end-to-end QoS connection. Whereas the core network covers the remaining connection
from the AP through the wired network to the CN. Each network is characterized by
the same QoS requirements listed earlier for the end-to-end specifications [GOHR+06],
as follows:
Maximum packet delay (Dx)- maximum segment delay tolerance (s).
Maximum packet jitter (Jx)- maximum segment jitter tolerance (s).
Maximum throughput (Tx) - maximum supportable throughput on segment (bits/s).
Valid values for x can be either a for the access network or c for the core network.
In this investigation, the access network is the IEEE 802.11 wireless connection between
the MS and AP. Due to the highly dynamic nature and typically lower bandwidth capa-
bilities of the access network compared to the wired core network, the access network is
assumed to be the main bottleneck of the end-to-end performance. Therefore, using the
performance measurements for the core network and the end-to-end QoS requirements,
143

Access network measurements:
Da, Ja, Ta
Core network measurements: Dc, Jc, Tc
S1 Sn-1 Sn
End to end QoS: Qd, Qj, Qt
RouterRouter
CN
Application
Network
Compute targetnetwork performance
and map to link layer
parameter thresholds
MSAP
Core Network Access Network
Figure 6.2: Network segment measurements [GOHR+06]
144
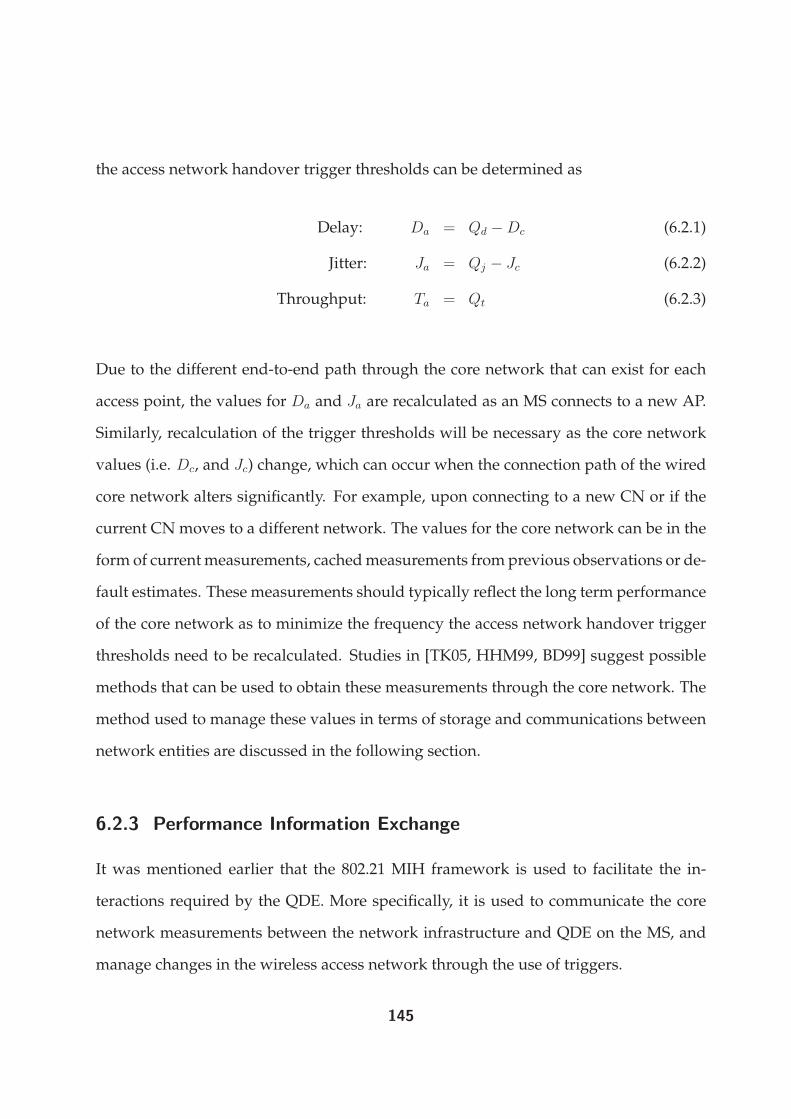
the access network handover trigger thresholds can be determined as
Delay: Da = Qd − Dc (6.2.1)
Jitter: Ja = Qj − Jc (6.2.2)
Throughput: Ta = Qt (6.2.3)
Due to the different end-to-end path through the core network that can exist for each
access point, the values for Da and Ja are recalculated as an MS connects to a new AP.
Similarly, recalculation of the trigger thresholds will be necessary as the core network
values (i.e. Dc, and Jc) change, which can occur when the connection path of the wired
core network alters significantly. For example, upon connecting to a new CN or if the
current CN moves to a different network. The values for the core network can be in the
form of currentmeasurements, cachedmeasurements from previous observations or de-
fault estimates. These measurements should typically reflect the long term performance
of the core network as to minimize the frequency the access network handover trigger
thresholds need to be recalculated. Studies in [TK05, HHM99, BD99] suggest possible
methods that can be used to obtain these measurements through the core network. The
method used to manage these values in terms of storage and communications between
network entities are discussed in the following section.
6.2.3 Performance Information Exchange
It was mentioned earlier that the 802.21 MIH framework is used to facilitate the in-
teractions required by the QDE. More specifically, it is used to communicate the core
network measurements between the network infrastructure and QDE on the MS, and
manage changes in the wireless access network through the use of triggers.
145

Performance measurements for the core network can be obtained by the QDE through
the Media Independent Handover Function (MIHF), specifically the Media Indepen-
dent Information Service (MIIS). The MIIS specifies a common method to represent the
information exchanged and mechanisms for initiating and replying information trans-
fers. The performance information may be stored directly within the MS, AP or at an
Information Server (IS) where it can be queried in the future. A specification for the
exact nature of managing and distributing this information is outside the scope of this
chapter. It is currently part of the ongoing standardization project for IEEE 802.21 MIH
and is left as part of the future work. For the purposes of this investigation, we assume
the core network measurements are available at the MS.
6.2.4 Setting Handover Thresholds
As anMS establishes a connection through one of its wireless interface, if it does not con-
tain core network performance values, the QDE will obtain them using the connected
interface through the MIHF. The QDE uses these core network performance values to
determine the access network trigger threshold values using Equations 6.2.1 to 6.2.3 de-
scribed earlier in Section 6.2.2. These values are then used to set the LGD triggers on
the interface. The setting of an LGD trigger was visited earlier in Section 5.2.
The LGD triggers should correspond to the degradation of the access network perfor-
mance beyond the identified threshold values. Below is a list indicating the variations
required by each measured parameter to cause an LGD trigger.
• Delay - Increasing and above Da.
• Jitter - Increasing and above Ja.
• Throughput - Decreasing and below Ta.
146

A simple weighted average (Equation 4.2.1), the same as the one used in Section 4.2.3 is
applied to the wireless access network measurements.
6.2.5 QDE Operation
The complete QDE procedure when an MS first establishes a wireless connection is
described in Algorithm 1. Initially when the device first enters the network, it needs to
establish a connection on one of its interface. Sincewe only consider a device supporting
dual IEEE 802.11 interfaces in this study, a set method of choosing the initial interface is
not necessary or defined. Either interface can be arbitrarily chosenwhen first connecting
to the network. However, for a device equipped with multi-technology interfaces, the
initial selection can make a difference. A number of strategies can be used, for example,
choosing the interface offering the lowest connectivity cost or the highest bandwidth.
Once the chosen interface is connected, it facilitates the exchange of the relevant core
network performance (if required) for each of its available interface. Together with the
access network performance values on each interface, the QDE can determine the best
interface to use that satisfies the application’s end-to-end QoS. Finally, it determines
the link layer LGD thresholds based on the core network measurements and end-to-
end QoS requirements, using Equations 6.2.1 to 6.2.3. A complete illustration of the
messages exchanged during this process can be seen in Figure 6.3.
6.2.6 Monitoring Parameters On An IEEE 802.11 Interface
In order to monitor the delay and jitter measurements on an IEEE 802.11 interface, mea-
surements of the access delay can be used. Note that the access delay is defined as the
time when the data frame first arrives in the IEEE 802.11 queue to the time it is sent
147

Algorithm 1 Choosing interface to support application QoS
if No L2 connection thenEstablish L2 connection over preferred interfaceend iffor Each interface doObtain end-to-end core network performance valuesObtain L2 performance valuesMark interface which satisfy application’s QoSend forEstablish L2 connection over the best interfaceSet L2 trigger thresholds
out on the medium successfully. The access delay can be monitored through a weighted
averaging mechanism defined in Equation 4.2.1 to assess if the delay threshold has been
exceeded. The same method can be applied for monitoring the jitter, except the differ-
ence between access delays in consecutive frames are considered instead. The through-
out on the IEEE 802.11 interface can be monitored by keeping track of the link layer
frame size (fL2) in bits, and dividing it by the time interval between frames (tinterval), as
Throughput =fL2tinterval
(6.2.4)
As for the delay and jitter measurements, the throughput can also be monitored using
a weighted averaging mechanism.
Rather thanmonitor the discussed performancemeasurements (delay, jitter and through-
put) directly at the MS, an alternative would be to receive these measurements directly
from the AP through reporting capabilities offered by IEEE 802.11k. As discussed in
Section , it allows anMS to request an assessment of the radio environment from the AP
and offers potentially a better view of the overall wireless network performance.
Note that since IEEE 802.11k is also capable of providing reports about neighboring
APs, it can be used to indicate the potential QoS offered by these APs. This monitoring
148

Application MIH802.11
Interface 1 MIH 802.11
MIIS Reply
LU
App.QoS
Association Request
QDE
Association Response
802.11Interface 2
LU
MIIS Query
Set LGD
SetLGD
LGDLGD
Initiate handover to find alternative AP
Query for corenetwork segment
measurements if not available locally
Decision to re-direct to
802.11 interface 2
Store end-to-end QoS
requirements
Calculate tolerable access
network parameters
Obtain core network
measurements locally or from IS
Parameter belowLGD threshold
MSAP
Figure 6.3: Message exchange process from obtaining core network measurements totriggering a handover.
can be done by either the second 802.11 interface, or the current interface if another is
not available. In the event of a QoS trigger, the MS is in a position to know if a suitable
alternative is available before proceeding with the handover procedure. If no suitable
alternative has been discovered, it may choose to remain on the current connection,
while continuing to monitor for another.
149

6.3 Performance Analysis
To demonstrate the benefits of using the QDE module, we use the NS-2 [ns-a] network
simulator. We are using a modified release that supports 802.11 and 802.21 as an in-
tegrated unit (available from [ns-c]) to successfully support and demonstrate the QDE
mechanism. The remainder of this section describes the network scenario and parame-
ter values used in further detail, followed by performance results.
6.3.1 Simulation Configuration
Figure 6.4 illustrates the topology used for the simulation and Table 6.1 summarizes
the configuration values. In this scenario, an MS equipped with the QDE mechanism
and two IEEE 802.11 interface is initially activated within the overlapping region of two
WLAN cell. It is positioned closer to the AP operating on channel 1 and hence associates
with it since it offers the strongest signal strength. The MS’s QDE then sets link layer
thresholds on the connecting interface based on the required end-to-end QoS and core
network measurements.
Following this, a VoIP connection using the G.711 codec with a bi-directional 64 kbps
Constant Bit Rate (CBR) traffic stream between the MS and CN begins, which equates
to a raw traffic rate of 86 kbps in each direction with the inclusion of packet and frame
headers (20 (bytes, IP), 8 (bytes, UDP), and 28 (bytes, 802.11) headers). A new IEEE
802.11 MS with a single interface is then added to the cell at every second with the same
bi-directional CBR traffic pattern. The effectiveness of the QDE is demonstrated as the
WLAN cell on channel 1 becomes increasingly congested.
The deteriorating connection at the interface eventually prompts a link layer trigger to
the QDE. This triggers a handover prompting the second interface to establish a new
150
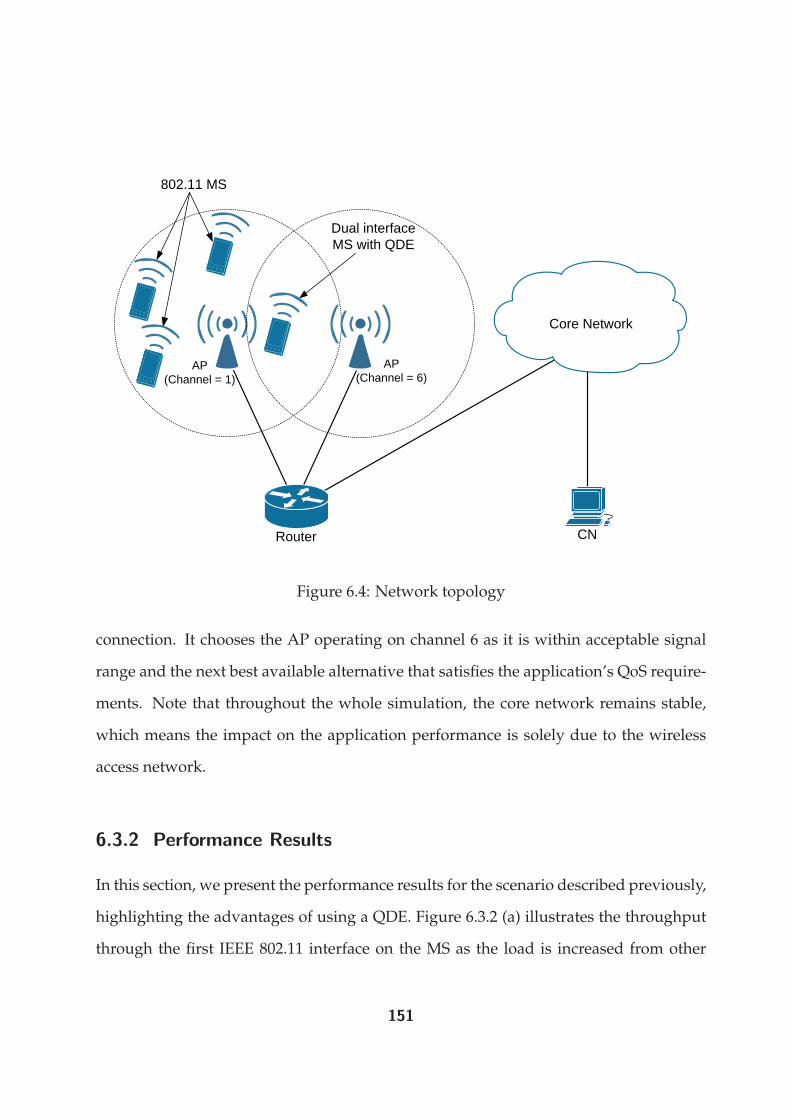
Dual interfaceMS with QDE
CNRouter
802.11 MS
Core Network
AP (Channel = 6)
AP (Channel = 1)
Figure 6.4: Network topology
connection. It chooses the AP operating on channel 6 as it is within acceptable signal
range and the next best available alternative that satisfies the application’s QoS require-
ments. Note that throughout the whole simulation, the core network remains stable,
which means the impact on the application performance is solely due to the wireless
access network.
6.3.2 Performance Results
In this section, we present the performance results for the scenario described previously,
highlighting the advantages of using a QDE. Figure 6.3.2 (a) illustrates the throughput
through the first IEEE 802.11 interface on the MS as the load is increased from other
151

0
20
40
60
80
100
5 10 15 20 25 30
0.2
0.4
0.6
0.8
1
1.2
1.4
1.6
1.8
2
2.2
2.4
2.6
Thr
ough
put (
kbps
)
Offe
red
load
Time (s)
No QoS trigger (Downlink)QoS trigger (Downlink)
Offered load
(a) Frame throughput between MS and AP
0
10
20
30
40
50
60
70
80
90
5 10 15 20 25 30
Dat
a ra
te (
kbps
)
Time (s)
No QoS trigger (Downlink)QoS trigger (Downlink)
No QoS trigger (Uplink)QoS trigger (Uplink)
(b) End-to-End throughput
Figure 6.5: Graph of throughput measurements.
152

Application Parameters
Directionality Bi-directionalPacket size 160bytesPacket interval 0.02s
Network Parameters
IEEE 802.11 data rate 11MbpsIEEE 802.16 data rate 12MbpsCore network data rate 100MbpsCore network delay 0.8sBuffer size 50frames
IEEE 802.11 triggers
Throughput trigger (Ta) 85kbpsWeighting factor (δ) 0.05
Table 6.1: Simulation parameters used for QoS based triggering evaluation.
arriving MSs. It can be seen that the interface’s downlink throughput settles at approx-
imately 87 kbps, consistent with the throughput expected using the G.711 codec. As
more MSs arrive, the contention and frame collisions between MSs in the BSS increases,
eventually saturating the cell and forcing a decrease in throughput on each MS. With-
out no QoS trigger, we can see in Figure 6.3.2 (a) that the throughput is forced below
its required 87 kbps throughput level. However when a QDE is used, a QoS trigger is
generated when the link throughput is pushed below 85 kbps, forcing a handover to
the second interface where it continues the traffic flow. Note that the throughput drops
drastically at the first interface after the 16 second mark, as the MS redirects traffic to
the second interface after the handover.
The corresponding throughput measured at the end-to-end application layer can be
seen in Figure 6.3.2 (b). Observe that with the QDE in place, the throughput is inter-
rupted for a very short period due to the handover from one IEEE 802.11 interface to
another. Without QDE, the throughput can be seen to degrade significantly as the MS
remains in the congested cell. Note that the downlink traffic from the AP degrades sig-
nificantly more than the uplink traffic since it is supporting a greater amount of traffic.
153

0
20
40
60
80
100
120
5 10 15 20 25 30
0.2
0.4
0.6
0.8
1
1.2
1.4
1.6
1.8
2
2.2
2.4
2.6
Fra
me
dela
y (m
s)
Offe
red
load
Time (s)
No QoS triggerQoS trigger
Offered load
(a) Frame delay between MS and AP
0
200
400
600
800
1000
1200
1400
1600
5 10 15 20 25 30
Pac
ket d
elay
(m
s)
Time (s)
No QoS triggerQoS trigger
(b) End-to-End delay
Figure 6.6: Graph of delay measurements.
154

Figure 6.3.2 (a) and Figure 6.3.2 (b) represents the frame delay at the link layer and ap-
plication layer, respectively. The absence of the QDE results in unstable and increasing
delays. It can reach as high as 115ms for the link layer and approximately 1.5 s for the
end-to-end delay. This enormous increase is primarily due to queuing delay resulting
from the congestion on the access network. Eventually, the growing load may cause the
queue to overflow, leading to packet loss. The MS equipped with QDE is able to avoid
congestion and the associated delays.
Jitter measurements shown in Figure 6.3.2 (a) and Figure 6.3.2 (b) exhibits the same
behavior as for delay measurements. The frame jitter increases with the load on the
cell, reaching values of 18ms at the link layer and almost 800ms at the application layer.
As before, this was due to congestion and queue overflow, and is successfully avoided
using the QDE.
Although the scenario only demonstrates the use of a throughput based trigger, we can
see from Figure 6.3.2 (a) and Figure 6.3.2 (b), how similar results can be achieved with
the use of a delay and jitter based trigger, respectively.
6.4 Conclusion
For an MS needing to maintain a level of QoS for its hosted applications, there are in-
stances where it should handover to a different AP when its requirements are not ade-
quately served by the current AP. Handover decisions based on received signal strength
is inadequate since the QoS may degrade due to other unrelated factors. Alternative pa-
rameters that reflect the QoS, such as delay, jitter and achievable throughput, should be
considered as well.
In this chapter, a QoS Decision Engine was introduced that allows handover decisions
155

0
2
4
6
8
10
12
14
16
18
5 10 15 20 25 30
0.2
0.4
0.6
0.8
1
1.2
1.4
1.6
1.8
2
2.2
2.4
2.6
Jitte
r (m
s)
Offe
red
load
Time (s)
No QoS triggerQoS trigger
Offered load
(a) Frame jitter between MS and AP
0
100
200
300
400
500
600
700
800
5 10 15 20 25 30
Jitte
r (m
s)
Time (s)
No QoS triggerQoS trigger
(b) End-to-End jitter
Figure 6.7: Graph of jitter measurements.
156

to be made based on various QoS parameters. This mechanism located at either the MS
or AP, can be used to pre-determine the tolerable link layer parameter measurements,
given the end-to-end QoS requirements and core network measurements. As parameter
measurements at the link layer degrades past the pre-determined tolerable values, a
handover is triggered. It was demonstrated that using this mechanism, it was possible
to avoid excessive QoS degradation as long as there is an alternative point of access
offering suitable performance characteristics.
157

Chapter 7
Utilization Estimation For CallAdmission Control In IEEE 802.11e
7.1 Introduction
In previous chapters, we mainly studied the ability of supporting and improving han-
dovers over IEEE 802.11 networks for seamless operation of interactive real-time voice
or video applications. In this chapter, we study the provisioning of these applications
over the same wireless link layer protocol. We focus particularly on using the IEEE
802.11e amendment, that defines a set of Quality of Service enhancements more suit-
able for the interactive applications mentioned. The provisioning of voice over an IEEE
802.11e network similar to that observed inmobile cellular networks (e.g. 2G) will be re-
ferred to as an IEEE 802.11e cellular mesh network. Successful management of real-time
applications over an IEEE 802.11e cellular mesh network requires a suitable call admis-
sion control mechanism in place. This mechanism relies on an accurate estimation of
the maximum allowable utilization under dynamically changing traffic conditions.
158

In this chapter, through detailed simulations, we empirically construct a maximum uti-
lization lookup matrix. This lookup matrix can in turn be used by an IEEE 802.11e
access point to assist in CAC decisions. We outline such a CAC mechanism, which has
the advantage of being computationally lightweight, and considers the following influ-
ential and dynamic parameters: overhead traffic, collisions and external interference.
The lookup parameters are based on existing metrics, such as the retry count and num-
ber of connected mobile stations, that are easily measured and eliminates the need for
any major changes to the existing IEEE 802.11e standard. We demonstrate the benefits
of the proposed algorithm by comparing the performance of our CAC scheme against a
number of proposed measurement threshold based schemes.
The remaining chapter is structured as follows. In Section 7.2 we describe the conditions
at which the real-time utilization lookup matrices were generated, including the traffic
profiles chosen, and the simulation configuration used. We also analyze and describe
the measurements obtained for the lookup matrices, and how the lookup process can
function in an AP. Section 7.3 describes a CAC mechanism utilizing the lookup matri-
ces. This is followed by Section 7.4 which analyzes how well the proposed CAC mech-
anism performs against other threshold based admission mechanisms. Finally, Section
7.5 summarizes the key points and findings.
7.2 Maximum Utilization Lookup Matrix
One of the biggest challenge when managing CAC in an IEEE 802.11e cell is identifying
the maximum utilization allowed without compromising the strict QoS requirements
for admitted connections. A number of studies discussed in Section 2.5.6 describe the
use of such maximum utilization thresholds for CAC and load balancing. While some
159

did not explore the identification of these thresholds, others did not consider the mix of
different traffic types that can exist within the same cell. There were a number of studies
that used the Markov Chain analytical model for the IEEE 802.11 backoff mechanism or
variations of it to identify the admission limit. However, these Markov Chain models
were arrived assuming all nodes on the network were operating in a saturated state and
transmitting the same traffic pattern, which is typically unrealistic in practice.
In this section, we establish a lookup matrix empirically that accurately identifies the
maximum real-time traffic utilization, which can be used by a suitable CAC system.
It offers a quick and accurate method to determine utilization thresholds for making
admission decisions. Each entry in the table represents the maximum real-time traf-
fic utilization for the combination of percentage loss due to interference (l), number of
video calls (nVI) and number of best effort connections (nBE). In this study, the inter-
ference level is represented as the percentage of frames on the medium being corrupted
due to the interfering source. The maximum real-time traffic utilization is defined as the
combined utilization of both voice and video traffic, at which point either the voice or
video traffic have exceeded their specified maximum tolerable access delay threshold.
Note that the access delay is defined as the time when the data frame first arrives in the
link layer queue to the time it is sent out on the medium successfully. Due to different
delay requirements, voice and video have separate access delay thresholds, denoted as
DVO and DVI, respectively. It was seen earlier in Section 2.7 that an acceptable one-way
end-to-end delay for local and international connections range from 0 to 400ms. For this
investigation, we choose a DVO of 50 ms, which leaves 0 to 250 ms for delays through
the backbone network for the call to remain within the acceptable range.
In previous studies, the most common assumption made was that every connection
within a cell are injecting the same traffic volume. Since bi-directional interactive voice
160

and video applications are used in this study, the AP needs to transmit a larger traffic
volume in AC VO and AC VI compared to MSs. The traffic it supports is proportional
to the number of bi-directional conversations it is supporting. This means, the bottle-
neck of tolerable access delays and packet loss is at the AP. For this reason, the measure-
ment and assessment of voice and video traffic exceeding their corresponding access
delay thresholds are done at the AP.
To determine the maximum utilization for each (l, nVI, nBE) combination, we activate
a new connection into a cell every 30 seconds, recording the traffic statistics at the AP
every time a connection successfully connects. We start by adding the best effort con-
nections, followed by video connections, and finally, voice connections. By measuring
the real-time traffic utilization and access delay as each connection is added, we obtain a
relationship for utilization and access delay as a function of the number of connections,
respectively. Using cubic spline interpolation, we can determine the number of connec-
tions when the access delay exceeds the specified threshold. The number of connections
determined from the interpolation is a decimal number, which we round down to the
nearest whole integer. This integer is then used to determine the maximum real-time
utilization from the utilization relationship. The whole process described is illustrated
in Figure 7.1.
7.2.1 Traffic Profiles
The traffic profiles selected for each traffic class were chosen due to their popularity in
realistic networks. They are as follows:
Two-way voice traffic - Highest priority traffic, utilizing the AC VO traffic category. Each
MS generates a constant bit rate (CBR) traffic connection of 8 kbps (20 bytes for
161

DelayUtilization
Measuredutilization
Measureddelay
Cubic splineinterpolation
DVO (for voice)or
DVI (for video)
Number of voice connections at delay threshold
Roundeddown to
whole number
Utilization value to be inserted into lookup matrix
Number of voice connections
n n+1 n+2 n+3 n+4 n+5 n+6
Figure 7.1: Determining utilization with the help of cubic spline interpolation.
every 20 ms) simulating a typical VoIP connection using the compressed G.729
codec. The same rate is replicated for the downlink from the CN. This equates to a
raw traffic rate of 35 kbps in each direction with the inclusion of packet and frame
headers (20 (bytes, IP), 8 (bytes, UDP), 12 (bytes, RTP), and 28 (bytes, 802.11e)).
Two-way video traffic - Medium priority traffic, utilizing the AC VI traffic category. Each
MS generates a traffic rate of approximately 250 kbps (burst of 3×750 = 2250 bytes
every 70 ms) simulating bursty video traffic flow. The same rate is replicated for
the downlink from the CN. This equates to a raw traffic rate of 280 kbps in each
direction with the inclusion of packet and frame headers (20 (bytes, IP), 8 (bytes,
UDP), 12 (bytes, RTP), and 28 (bytes, 802.11e)).
162

Best-effort download traffic - Best effort low priority traffic, utilizing the AC BE traffic
category. Each MS receives a greedy downlink stream from a CN, simulating a
typical FTP/HTTP download. The CN always has a 2000 byte packet to transmit,
which equates to a total frame size of 2068 bytes with the inclusion of headers (20
(bytes, IP), 8 (bytes, UDP), 12 (bytes, RTP), and 28 (bytes, 802.11e)).
7.2.2 Simulation Configuration
The simulation layout used for determining the maximum utilization consists of an
AP connected to a CN via a switch. As MSs are activated within the AP’s coverage
range, each MS establishes a connection (upon successful association) between the CN
to support the relevant traffic profile. This allows us to load the AP incrementally in
order to determine the maximum utilization. Figure 7.2 illustrates the scenario.
An accurate NS-2 IEEE 802.11e model [ns-b] was used with the configuration parame-
ters specified in Table 7.1. A wireless transmission rate of 11 Mbps was utilized, while a
rate of 100Mbpswas used for thewired links connecting the AP, switch and CN.Having
a larger wired rate ensures there are no competing bottlenecks when determining the
maximum utilization on the wireless link. The IEEE 802.11e medium access parameters
were selected based on suggestions in [MCK+02, WEHW06].
To achieve suitable confidence levels for each measurement, each (l, nVI, nBE) combina-
tion were executed with different random seeds 30 times.
7.2.3 Measured Parameters
The maximum real-time utilization measured for the lookup matrix consists of the uti-
lization by real-time connections, which for this study includes interactive voice and
163

AP
MS(Best effort)
EthernetSwitch
CNMS
(Voice)
MS(Video)
MS(Voice)
MS(Voice)
Figure 7.2: Simulation scenario.
video. This utilization can be broken down into two main components, namely, suc-
cessful and collision utilization. They are summarized as follows:
Successful utilization (Us) - Accounts for successfully sent and received IEEE 802.11e
data frames including the access overheads for a successful frame, as listed in
Table 2.2.
Collision utilization (Uc) - Accounts for IEEE 802.11e data frames unsuccessfully sent
and received (due to collisions or interference). It includes the access overheads
for a collided frame, as listed in Table 2.2.
Total utilization (Ut) - Sum of both successful and collision utilization, represented as
Ut = Us + Uc (7.2.1)
164

IEEE 802.11e Configuration
Interference loss (l) 0, 10, 20%Data and basic rate 11MbpsClient lifetime 10sAP buffer size 500framesWeighting factor (δ) 0.05Voice delay threshold (DVO) 50msVideo delay threshold (DVI) 80ms
Access Category CWmin CWmax AIFSN
AC VO 7 15 2AC VI 15 31 2AC BE 31 1023 7
Table 7.1: Simulation parameters used when determining the lookup matrix.
Note that for this study, we focus on the basic IEEE 802.11e medium access scheme,
omitting the use of the RTS/CTS or TXOP features. Therefore, the overheads mentioned
that are part of the successful and collision utilization described above corresponds to
the ”802.11e EDCA Basic” column in Table 2.2.
The utilization values are measured as a fraction of the channel bandwidth, with values
ranging from 0.0 to 1.0 (i.e. 0% to 100%). It is calculated at the AP bymeasuring the time
occupied transmitting or receiving an IEEE 802.11e frame toccupied (including overheads
as listed in Table 2.2), and dividing by the time interval between frames tinterval, as
U =toccupied
tinterval(7.2.2)
The measured utilization obtained from Equation 7.2.2 can be extremely volatile due
to the large variation of tinterval in a shared access medium. To maintain more stable
readings through time, we apply a weighted average (Equation 4.2.1) as seen in Sec-
tion 4.2.3. There are a number of alternatives that can be used for averaging, such as
averaging over a set time interval (e.g. beacon interval) which is computationally less
165

0
20
40
60
80
100
Cap
acity
(%
)
0 1 2 3 4 5 6 7 8 9 10 11 12 13 14 15 16
0 2
4 6
8 10
12 14
16 18
20
0 2 4 6 8
10 12 14 16 18 20
Interference loss (%)
Best effort
Video
Interference loss (%)
Figure 7.3: Graph of the maximum real-time traffic utilization.
expensive. However, the weighted averaging approach allows us to easily tune the
responsiveness and stability of the readings by adjusting the δ value.
7.2.4 Analysis Of Maximum Utilization Values
From Figures 7.3 and 7.4, it is clear that as the number of video sources decreases, al-
lowing voice traffic to dominate, so does the real-time traffic utilization. The lower
bandwidth consumption per voice connection compared to video, allows for a greater
number of connections to reach maximum utilization, resulting in higher contention
and less efficient use of the cell. This is consistent with studies in [Bia00, EV05], which
demonstrates the decrease in saturation throughput as the number of competing MSs
166

0
20
40
60
80
100
Cap
acity
(%
)
0 1 2 3 4 5 6 7 8 9 10 11 12 13 14 15 16
0 2
4 6
8 10
12 14
16 18
20
0 2 4 6 8
10 12 14 16 18 20
Interference loss (%)
Best effort
Video
Interference loss (%)
Figure 7.4: Graph of the successful traffic component of the maximum real-time trafficutilization.
increase.
This is of course exacerbated as more best effort connections were added. Although
best effort connections have the lowest priority and should concede its channel usage
to both real-time voice and video traffic, it can be seen that it does in fact influence their
achieved utilization. Regardless of the lower priority medium access parameters stated
in Table 7.1, the best effort connections still have a probabilistic chance of accessing the
medium and are not starved entirely.
The interference level present can also be seen to effect real-time traffic utilization. An
increase in interference leads to an elevated number of collisions, as evident in Figure
167

0
20
40
60
80
100
Cap
acity
(%
)
0 1 2 3 4 5 6 7 8 9 10 11 12 13 14 15 16
0 2
4 6
8 10
12 14
16 18
20
0 2 4 6 8
10 12 14 16 18 20
Interference loss (%)
Best effort
Video
Interference loss (%)
Figure 7.5: Graph of the collision traffic component of the maximum real-time trafficutilization.
7.5. This causes higher access delays due to the increased number of retransmissions
required before a frame is sent successfully. Hence, the utilization level reached is lower
before either DVO or DVI were exceeded.
In summary, there are two primary effects leading to decreased real-time traffic utiliza-
tion levels. The first is the fact that a higher number of sources decrease the throughput
near saturation point. The final being an increased number of retransmissions, due to
interference or collisions, leading to higher access delays that cause DVO or DVI to be
exceeded much sooner.
168

7.2.5 Performing Lookup At The AP
The maximum real-time utilization lookup matrix can be used by an AP to determine
the current maximum achievable utilization. To do this, it needs the current status of
the three lookup parameters l, nVI, and nBE. The latter two parameters can be easily
monitored through a counter at an AP keeping track of the number of active connections
in each AC. On the other hand, l cannot be easily measured directly and requires further
analysis, which follows.
A number of parameters, such as the average backoff time and access delay were ex-
plored with the aim of finding a relationship to assist in inferring a value for l. These
parameters were chosen as they typically grew with frame loss. However, they were
found to be also highly dependent on the traffic category and proportions of each cate-
gory exchanged. Upon further study the average number of retransmissions per frame
r was found to have the strongest relationship with l, which was non linear but sta-
tistically deterministic, as seen in Figure 7.6. Only the points prior to the maximum
real-time utilization point were investigated, since it is the utilization range we intend
to maintain at the cell. It also corresponds to the range where the collision levels are
low, allowing a clear relationship between r and l to be demonstrated. The plot in Fig-
ure 7.6 shows a distinct range of r values, for both voice and video connections, that can
be mapped to a particular l value. It is this mapping that allows an AP to approximate
the value of l based on the measured value of r for either voice or video access cate-
gories. Note that the relationship in Figure 7.6 applies both in the presence or absence
of best-effort sources.
Nowwith all three lookup parameters l, nVI, and nBE, capable of being monitored by the
AP, we are in a position to use the maximum real-time utilization lookup matrix. Note
that these parameters can also be used to resolve values from the collision or successful
169

0
0.1
0.2
0.3
0.4
0.5
0.6
0.7
0 10 20 30 40 50
Ave
rage
Ret
rans
mis
sion
per
Fra
me
Number of Connections
Voice l=0%Voice l=2%Voice l=4%Voice l=6%Voice l=8%
Voice l=10%Voice l=12%Voice l=14%Voice l=16%Voice l=18%Voice l=20%Video l=0%Video l=2%Video l=4%Video l=6%Video l=8%
Video l=10%Video l=12%Video l=14%Video l=16%Video l=18%Video l=20%
Figure 7.6: The average retransmissions per sent frame (r) at the AP as MSs enter thecell, for various packet loss probabilities due to external interference (l).
utilization lookup matrix in a similar manner.
7.3 Call Admission Control
In this section, we propose a network controlled CACmechanism that uses the real-time
utilization lookup tables obtained empirically in the previous section. Being network
controlled and located at the AP, it is able tomonitor the necessarymeasured parameters
on the cell and control the admission of incoming connections.
Before making an admission decision, a key step is to estimate the total real-time traffic
utilization required, including that of the incoming real-time connection. To do this,
the AP must maintain a measurement of the aggregate traffic utilization of all currently
admitted real-time connections, which we denote as Uadmitted. The same method used
170

for measuring Utwill be applied to Uadmitted and expressed as a percentage of the channel
capacity ranging from 0.0 to 1.0.
Our proposed scheme requires any real-time admission requests to declare its utiliza-
tion requirements by providing its required average frame size (Favg), and average
frame rate (Ravg). This can be done by including the requirements within a TSPEC
when requesting to add a new flow using an ADDTS request. The AP knows the access
scheme that has been agreed upon, allowing it to determine the overhead time for each
frame (TO), as listed in Table 2.2. Together with the data rate agreed between the MS
BMS, it is able to estimate the successful utilization for the incoming real-time connec-
tion Uin s using
Uin s = Ravg
(
Favg
BMS+ TO
)
(7.3.1)
Using Uin s we can estimate the total utilization for the incoming real-time connection
Uin t with
Uin t = Uin s
(
Ulookup t
Ulookup t − Ulookup c
)
(7.3.2)
Meanwhile, the values Ulookup t and Ulookup c are determined through the total and col-
lision real-time utilization lookup matrix respectively. Note that if the incoming con-
nection’s AC suggests its a video connection, we add this additional connection to nVI
when performing the lookup.
The sum of Uadmitted and Uin t, can now be compared to Ulookup t to make an admission
decision. The incoming connection is only admitted if the sum is less than Ulookup t. If the
incoming connection is a BE connection (i.e. non real-time), we add this additional con-
nection to nBE when looking up the value Ulookup t. The incoming BE connection is only
171

admitted, if Uadmitted is less than Ulookup t. The admission decision is communicated back
to the MS through an ADDTS response frame. Algorithm 2 details the full admission
procedure.
7.4 Performance Analysis
This section assesses the proposed call admission scheme in combination with the con-
structed utilization lookup matrix. Five scenarios with high inter-arrival rate for incom-
ing flows are used to assess how well the admission scheme maximizes the utilization
while maintaining access delays at acceptable levels. The first scenario (Section 7.4.1)
highlights its effectiveness with incoming voice flows both with and without loss due
to interference. We then perform the same analysis but for arriving video calls instead
in the second scenario (Section 7.4.2). The third and fourth (Section 7.4.3 and 7.4.4, re-
spectively) scenarios assess how well the admission control continues to perform in the
presence of best-effort connections. Finally, the fifth scenario demonstrates the concur-
rent control and behavior of all three (voice, video and best-effort) traffic types using
our proposed admission scheme. For the first four scenarios, we compare our proposed
approach against two other AP controlled measurement based schemes that were pre-
sented in [GZ03].
The first, is known as the Relative Occupied Bandwidth (ROB) method. As described in
[GZ03], it uses the measured total utilization Ut in order to make an admission decision.
It admits an incoming call if Ut is below a lower threshold level Ulo, rejects the current
lowest priority connection ifUt is above an upper threshold levelUup and takes no action
(stable state) if Ut is between Ulo and Uup.
The second, is the Average Collision Ratio (ACR)method, which is based on the average
172

collision ratio Cavg. This ratio is defined as the number of collisions divided by the total
number of transmissions. Similar to the ROB method, the admission decision is based
on two threshold values Clo and Cup. A connection is admitted when Cavg is lower than
Clo, the lowest priority existing connection is rejected when Cavg is higher than Cup and
no action is taken when Cavg is between Clo and Cup.
Both Ut and Cavgmeasurements at the AP were updated at every beacon interval, as rec-
ommended in [GZ03]. Appropriate threshold values Ulo, Uhi, Clo, and Chi were chosen
empirically by incrementally loading a cell with voice connections and noting the levels
of Ut and Cavg when the voice access delay threshold DVO was exceeded. The simula-
tion configuration parameters used to determine the thresholds were the same as those
specified in Section 7.2.2.
In order to verify our implementation of both the ROB and ACR mechanisms, we con-
figure a scenario similar to that presented in [GZ03] and compare the results obtained.
Although we use a bi-directional 8 kbps G.729 codec as part of the simulations through-
out this chapter, to be consistent with [GZ03], MSs in this scenario uses a one-way 64
kbps codec. A new MS enters the cell every 10 seconds to assess how well the imple-
mented mechanisms control the use of the medium.
Figures 7.7 and 7.8 illustrate the maintained throughput and medium access delay, re-
spectively, throughout the simulation. It can be seen that both the implemented ACR
and ROB CAC mechanism perform well to control the use of the medium, achieving
stable throughput and medium access delays, which is consistent with [GZ03]. The ac-
cess delays were maintained at approximately 2 ms using ACR and 1 ms using ROB.
This compares well to [GZ03], which obtained averages of 2 and 1.4 ms for ACR and
ROB, respectively. Although the throughputs obtained were slightly higher by about
0.5 Mbps in our simulations, it is still within the same acceptable 4 to 5 Mbps range.
173

0
1
2
3
4
5
6
7
8
9
10
11
0 200 400 600 800 1000 1200 1400 1600 1800 2000
Thr
ough
put (
Mbp
s)
Time (s)
ROBACR
Figure 7.7: Achievable throughput using ACR and ROB CAC mechanisms.
0
0.5
1
1.5
2
2.5
3
3.5
4
0 200 400 600 800 1000 1200 1400 1600 1800 2000
Del
ay (
ms)
Time (s)
ROBACR
Figure 7.8: Average access delay using ACR and ROB CAC mechanisms.
174

For the remainder of this section, we assess our proposed lookup based CAC scheme
against the ROB and ACR methods. The comparisons are made using four scenarios
described earlier, showing their ability to maximize the use of a cell while avoiding
over-provisioning.
7.4.1 Scenario 1: Incoming Voice Connections
This is a scenario where only bi-directional real-time voice connections (same param-
eters as specified in Section 7.2.1) periodically enter the cell. A new connection enters
the cell every 10 seconds and has a random holding time of between 500 to 540 seconds
before deactivating. We run this scenario for at least 1500 seconds, allowing adequate
time for measurements to stabilize and sufficient data points to be accumulated. This
is repeated for a range of operating data rates (1, 5.5 and 11 Mbps) and losses due to
interference (0, and 10%).
Figures 7.9 to 7.11 compare the performances of all three CAC schemes for scenario 1.
Observing the results for voice connections in Figures 7.9 to 7.11, it can be seen that
at the maximum operating data rate of 11 Mbps and 0 % interference level, all three
measurement based CAC methods perform well. The loaded cell maintains an accept-
able access delay, while maximizing the utilization. A saturated state where fluctuating
access delays and utilization occur were avoided in for all three methods. This was
expected since the admission thresholds were determined under these conditions.
With the addition of a 10% loss due to interference, we can see in Figure 7.9 the ACR
method was close to blocking all incoming flows with a blocking probability of 0.98
across all operating data rates. As a result, the cell was grossly under utilized as illus-
trated in Figure 7.11. Earlier, we mentioned that the threshold value Clo for the ACR
175

0
0.2
0.4
0.6
0.8
1
115.51
Blo
ckin
g pr
obab
ility
Data rate (Mbps)
Lookup l=0%Lookup l=10%
ROB l=0%ROB l=10%
ACR l=0%ACR l=10%
Figure 7.9: Average blocking probability of incoming voice connections.
0
0.05
0.1
0.15
0.2
115.51
Acc
ess
dela
y (s
)
Data rate (Mbps)
Lookup l=0%Lookup l=10%
ROB l=0%ROB l=10%
ACR l=0%ACR l=10%
Figure 7.10: Average access delay for voice traffic at the AP.
176

0
0.1
0.2
0.3
0.4
0.5
115.51
Thr
ough
put
Data rate (Mbps)
Lookup l=0%Lookup l=10%
ROB l=0%ROB l=10%
ACR l=0%ACR l=10%
Figure 7.11: Average real-time voice traffic throughput.
method was determined at the point when the access delay exceeded DVO for a 0% in-
terference level. This occurs before a saturation state was reached, resulting in a very
low collision rate for the threshold. The same threshold does not apply well in a lossy
environment caused by interference, since the additional collisions have pushed Cavg
past the threshold prematurely, causing the observed under utilization.
Figure 7.9 indicates the ROB method has a lower blocking probability compared to our
proposed CAC method at an l of 10% and data rate of 11 Mbps. However, we can see
from Figure 7.10 that under these conditions, the ROB method has over provisioned the
cell, leading to an unacceptably high (above 20 ms) and unstable access delay. The ROB
method failed to account for the reduced utilization of a cell in a lossy environment.
Apart from the observations discussed above, we can see that the CAC methods apply
177

adequately for the remaining data rates (i.e. 1 and 5.5 Mbps) and interference combi-
nations. In general, the blocking probability increases as the data rate decreases, which
was expected due to the reduced capacity to support incoming flows. An increase in
throughput was also exhibited as the data rate reduced. This is due to the improved
efficiency as a result of the greater channel occupancy time of each frame when using a
lower data rate.
7.4.2 Scenario 2: Incoming Video Connections
This scenario is the same as described in scenario 1 (Section 7.4.1), except bi-directional
real-time video connections (same parameters as specified in Section 7.2.1) were used in
place of voice connections. A new connection enters the cell every 20 seconds and has
a random holding time of between 230 to 270 seconds before deactivating. Note that it
was adjusted to have a lower holding time compared to a voice call, due to its greater
bandwidth capacity. This scenario allows us to isolate the performance of video calls
under the different CAC schemes.
Figures 7.12 to 7.14 compare the performances of all three CAC schemes for scenario
2. We observe from Figure 7.12 that at a data rate of 11 Mbps the ROB method has a
distinctly higher blocking probability compared to our proposed scheme. The very low
access delays in Figure 7.13 for both schemes indicate the ROB method is under provi-
sioning and not fully utilizing the cell. A cell with video traffic has a smaller number of
flows compared to voice traffic, due to its higher bandwidth requirements per flow. Ad-
ditionally, video traffic has larger frame sizes and lower frame rates compared to voice
traffic. These factors result in lower contention levels and greater utilization in the cell
than otherwise reflected from the Ulo value established using voice connections, hence,
does not optimize the use of the cell.
178

0
0.2
0.4
0.6
0.8
1
115.51
Blo
ckin
g pr
obab
ility
Data rate (Mbps)
Lookup l=0%Lookup l=10%
ROB l=0%ROB l=10%
ACR l=0%ACR l=10%
Figure 7.12: Average blocking probability of incoming video connections.
0
0.05
0.1
0.15
0.2
115.51
Acc
ess
dela
y (s
)
Data rate (Mbps)
Lookup l=0%Lookup l=10%
ROB l=0%ROB l=10%
ACR l=0%ACR l=10%
Figure 7.13: Average access delay for video traffic at the AP.
179

0
0.2
0.4
0.6
0.8
1
115.51
Util
isat
ion
Data rate (Mbps)
Lookup l=0%Lookup l=10%
ROB l=0%ROB l=10%
ACR l=0%ACR l=10%
Figure 7.14: Average real-time video traffic throughput.
With the lowered contention levels from the use of video traffic, it follows that the colli-
sion rate would be correspondingly lowered. This results in the ACRmethod admitting
video connections more aggressively compared to the other CAC methods, which is
evident from the lowered blocking probability in Figure 7.12. It proved to be far too ag-
gressive at lower operating data rates of 5 and 1 Mbps, pushing the cell into saturation
and reaching unacceptable access delay levels, as seen in Figure 7.13. With a 10% loss
due to interference, the ACR method still suffers under utilization across all operating
data rates, as observed in scenario 1 using voice traffic.
Apart from the observations above, we can see that the blocking probability behavior
was the same as that for scenario 1, where it increased as the data rate decreased. In
general, the throughput was greater compared to voice flows, due to the improved effi-
ciency from using larger frame sizes. The larger frame size also resulted in less disparity
in throughput across all operating data rates.
180

7.4.3 Scenario 3: Incoming Voice And Best-Effort Connections
This scenario is the same as described in scenario 1 (Section 7.4.1), except we now add
four greedy best-effort sources (same parameters as specified in Section 7.2.1) in the cell
for the full lifetime of the simulation. Four sources were chosen as it is within the range
of having an impact on real-time flows and a good representative of the average sources
analyzed in Section 7.2.4. The cell has an operating data rate of 11 Mbps and a 0% loss
due to interference level. This scenario enables us to assess how well incoming voice
calls continue to be administered in the presence of best-effort sources.
Before proceeding with this investigation, the Ut measurement used in the ROBmethod
was modified to only keep track of real-time traffic utilization and ignoring the uti-
lization contributed by best-effort sources. This modification was required to prevent
greedy best-effort sources from starving higher priority voice and video sources. A sim-
ilar modification for the Cavg measurement in the ACR method cannot be done, since in
reality there is no guaranteed way of determining which AC a collided frame belongs
to.
Figures 7.15 and 7.16 show the throughput of voice and best-effort traffic, respectively.
From this, it is evident that the higher priority voice traffic displaces the best-effort traf-
fic, as expected. It can be seen that our proposed lookup based CAC was the most
conservative out of all three schemes, admitting the lowest amount of voice calls. On
the other hand, it can be seen that the ROB method admitted voice flows with com-
plete disregard for best-effort traffic and pushing it close to starvation. A comparison
of all three CAC methods in Figure 7.17 illustrates that the ROB method was the most
aggressive. Note that the error bars for the access delay using the ROB method were
not included, since they were far greater than the average value (in the order of 1 s).
This demonstrates that the access delay was very high and volatile, which is typically
181

0
0.1
0.2
0.3
0.4
0.5
0 200 400 600 800 1000 1200 1400
Thr
ough
put
Time (s)
LookupROBACR
Figure 7.15: Real-time voice traffic throughput in the presence of competing best-efforttraffic.
0
0.2
0.4
0.6
0.8
1
0 200 400 600 800 1000 1200 1400
Thr
ough
put
Time (s)
LookupROBACR
Figure 7.16: Best effort traffic throughput in the presence of competing real-time voicetraffic.
182

0
0.04
0.08
0.12
0.16
0.2
0.24
0.28
0.32
0.36
0.4
ACRROBLookup 0
0.02
0.04
0.06
0.08
0.1
0.12
0.14
0.16
0.18
0.2B
lock
ing
Pro
babi
lity
Acc
ess
Del
ay (
s)
Access delayBlocking probability
Figure 7.17: Access delay and blocking probability for voice calls in the presence ofcompeting best-effort traffic
observed in saturated networks. The results highlight that despite best-effort traffic
having medium access parameters giving it the lowest priority, it still has a probabilis-
tic chance of accessing the medium that can affect real-time traffic. Failure to account
for this additional contention can be detrimental for the performance of real-time appli-
cations, as seen using the ROB method.
In contrast, our proposed CACwere able to account for the additional contention through
the lookup matrix and the ACR method was able to detect the additional contention
through its collision rate measurements. From the plots, we can also observe that al-
though our proposed scheme maintained a suitable access delay, it was the most con-
servative out of all. The ACR method managed to achieve the best real-time traffic
throughput while maintaining acceptable access delays.
183

0
0.2
0.4
0.6
0.8
1
0 200 400 600 800 1000 1200 1400
Thr
ough
put
Time (s)
LookupROBACR
Figure 7.18: Real-time video traffic throughput in the presence of competing best-efforttraffic.
7.4.4 Scenario 4: Incoming Video And Best-Effort Connections
The same scenario as described in scenario 2 (Section 7.4.2) is used, except we now add
4 greedy best-effort sources (same parameters as specified in Section 7.2.1) in the cell
for the full lifetime of the simulation. As for scenario 3 (Section 7.4.3) an operating data
rate of 11 Mbps and a 0% loss due to interference level are used. This scenario allows
us to assess how well incoming video calls continue to be administered in the presence
of best-effort sources.
As observed in scenario 3 (Section 7.4.3), Figures 7.15 and 7.16 show the higher pri-
ority flows displacing the best-effort flows accordingly. However, this time the ACR
method proves to be the most aggressive of all three CAC schemes, admitting the great-
est amount of video traffic. This stems from the fact that video traffic lowered contention
levels compared to voice traffic, as observed in scenario 2 (Section 7.4.2).
184

0
0.2
0.4
0.6
0.8
1
0 200 400 600 800 1000 1200 1400
Thr
ough
put
Time (s)
LookupROBACR
Figure 7.19: Best effort traffic throughput in the presence of competing real-time videotraffic.
0
0.04
0.08
0.12
0.16
0.2
0.24
0.28
0.32
0.36
0.4
ACRROBLookup 0
0.02
0.04
0.06
0.08
0.1
0.12
0.14
0.16
0.18
0.2
Blo
ckin
g P
roba
bilit
y
Acc
ess
Del
ay (
s)
Access delayBlocking probability
Figure 7.20: Access delay and blocking probability for video calls in the presence ofcompeting best-effort traffic.
185

A comparison of all three CACmethods in Figure 7.20 demonstrates that the aggressive
ACR method has the worst performing access delays. Note that the error bars for the
access delay using the ACR method were not included, since they were far greater than
the average value (in the order of 0.5 s). The aggressiveness of the ACR method comes
at a cost of unacceptable access delays, by pushing the channel usage into a saturated
state. In this scenario, our proposed lookup based CAC scheme manages to achieve the
highest utilization while maintaining an acceptable access delay range for video traffic.
7.4.5 Scenario 5: Incoming Voice, Video And Best-Effort Connections
In this scenario, we assess the effectiveness of our proposed lookup based CAC mech-
anism in the presence of all three traffic flows. The characteristics of each traffic type
are the same as were used in Section 7.2.1. At 10 s, four greedy best-effort flows join
and start communications through the cell. Shortly after at 45 s, eight video calls begin
entering the cell one at a time in 10 s intervals. Following this, a voice call enters the cell
every 10 s for the remainder of the simulation. An operating data rate of 11 Mbps and a
0 % interference level were used throughout the simulation.
Figure 7.21 shows the throughput allocation among all three traffic flow categories
throughout the lifetime of the simulation. We can see that initially the greedy sources
utilize as much capacity as the channel can offer to support their traffic flow. As higher
priority video flows enter the cell, the utilization of best-effort flows are displaced ac-
cordingly. The following voice flows also displace the best effort flows, while the video
flows remain unaffected. Our proposed lookup based CACmechanism determines that
maximum utilization has been reached at approximately 240 s. Any subsequent flows
(voice, video or best-effort) requesting a connection were rejected, as visible from the
stabilized throughput levels. It is important to note that at this maximum utilization
186

0
1
2
3
4
5
6
7
8
9
10
11
50 100 150 200 250 300 350 400 450 500
Thr
ough
put (
Mbp
s)
Time (s)
VoiceVideo
Best-effort
Figure 7.21: Achievable throughput using ACR and ROB CAC mechanisms.
0
20
40
60
80
100
120
140
50 100 150 200 250 300 350 400 450 500
Del
ay (
ms)
Time (s)
VoiceVideo
Figure 7.22: Average access delay using ACR and ROB CAC mechanisms.
187

stage, best-effort flows are not starved entirely.
The access delays observed in Figure 7.22 confirm that the performance of both voice
and video flows were stable and within an acceptable range. Although not illustrated
in the plots, our simulation showed that if just another video or voice flow was added,
the cell reached a saturated state and the access delays increased dramatically to un-
acceptable levels. This scenario demonstrated that our proposed lookup based CAC
approach was able to maintain the performance level required by real-time flows in a
cell supporting all traffic types.
7.5 Conclusion
In this chapter we proposed and investigated a lookup based CAC mechanism that is
used to administer and manage real-time application users in an 802.11e network. The
key component is a lookup matrix for determining the maximum achievable utilization
based on the current state. Each maximum achievable utilization value was determined
empirically, taking into account the number of best-effort connections, number of real-
time video connections and the interference level. We based the traffic models on real-
istic and popular traffic types, and identified the maximum utilization points through
relevant real-time traffic delay tolerances. This was an area lacking in previousmeasure-
ment based CAC schemes that often omitted the study on identifying suitable threshold
values. While previous mathematical model based schemes assumed all nodes trans-
mitted the same traffic pattern or operated in a saturated state, in order to derive the
appropriate models.
188

We assessed the performance of our proposed CAC scheme against two other mea-
surement based schemes, namely, the Relative Occupied Bandwidth (ROB) and Av-
erage Collision Ratio (ACR) methods. Through performance results collected from a
number of scenarios we demonstrated the deficiencies exhibited by both CAC scheme
using only a single threshold admission criteria could be eliminated by our proposed
lookup based approach. This includes the over provisioning observed using the ROB
method under noisy environments or in the presence of best-effort connections, and
ACRmethod when serving video connections. It also eliminates inefficient resource uti-
lization as found with the ROBmethod supporting video connections and ACRmethod
under noisy environments. Finally, we showed that the proposed lookup based ap-
proach was able to maintain the performance of real-time flows in the presence of all
three (voice, video and best-effort) traffic types.
189

Algorithm 2 Call admission control at the AP
if Incoming connection exists thenDetermine interference level (l) based on current average number of transmissionsper frame (r).Note the average utilization of currently admitted real-time connections (Uadmitted)Note the current number of video connections (nVI).Note the current number of best-effort connections (nBE).if Incoming connection is AC VO thenUsing l, nVI, and nBE, lookup Ulookup t and Ulookup celse if Incoming connection is AC VI thenUsing l, (nVI + 1), and nBE, lookup Ulookup t and Ulookup celse if Incoming connection is AC BE thenUsing l, nVI, and (nBE + 1), lookup Ulookup t and Ulookup cend ifUin s = Ravg
(
Favg
BMS+ TO
)
Uin t = Uin s
(
Ulookup t
Ulookup t−Ulookup c
)
if Incoming connection is AC VO or AC VI thenif (Uin t + Uadmitted) <= Ulookup t thenADMIT connectionif Incoming connection is AC VI then
nVI = nVI + 1end ifelseREJECT connectionend ifelseif Uadmitted <= Ulookup t thenADMIT connectionnBE = nBE + 1elseREJECT connectionend ifend ifend if
190

Chapter 8
Conclusion
8.1 Conclusions
The growing popularity of interactive real-time packet based applications, such as VoIP
and VIP, have mounted pressure on many popular communications protocols to pro-
vide quality of service to these applications. IEEE 802.11, being one of the most popu-
lar offering wireless high bandwidth access across homes and corporate environments,
would be expected to handle large volumes of real-time traffic. A QoS enhancement
known as IEEE 802.11e was introduced to allow traffic differentiation and prioritiza-
tion, but the protocol still faced outstanding issues to be able to support real-time traffic
in a wireless mesh environment. One issue that was addressed in this thesis was to
improve the management and performance of handovers, in order to minimize disrup-
tions for the supported traffic types. We achieved this through amobile device equipped
with dual interfaces. The second issue of protecting the QoS of existing connections in
a WLAN cell was also addressed in this thesis through admission control of arriving
MSs. This was achieved through our proposed method of accurately estimating the
maximum utilization using a lookup matrix.
191

Before considering the use of two interfaces for seamless handover, we evaluated the
possibility of improving the handover performance on commercially available inter-
faces. Overall the average active scanning handover delay ranges from 100 to 800 ms
depending on the commercial interface used. Performance of Aironet PC 4800 interface
was better than the others tested (it has achieved an average of 116 ms) due to its shorter
probe period. It was found that the delay can be pushed to as low as 50 ms by lowering
its probe response timeout to 5 ms and probe energy timeout to 1 ms. However, due
to the reduced time for allowing an AP to respond, large delay spikes where the inter-
face could not locate an AP occurred frequently. The lowest handover achieved was an
average of 30 ms using a proprietary ad hoc mode. However, it was deemed not to be
a scalable solution since it does not conform to the IEEE 802.11 standard and does not
support probe or beacon messages which makes discovery of APs impossible.
With the intolerable handover performance we observed in commercially available in-
terfaces and the lack of a seamless handover solution, we proposed a dual interface
solution. The additional interface allows for the current connection to continue, while
the other discovers and establishes the new connection. Unlike other multiple interface
proposals published in the literature, ours is a purely link layer solution that is trans-
parent to upper layers and shares a single MAC address. It can be used to facilitate
smooth handover between IEEE 802.11 BSSs within a subnet without mobility support
in upper layers. We demonstrate that to achieve a seamless handover, there needs to
be sufficient overlap between adjacent cells. The amount of overlap required depends
on the speed of the user and the scanning algorithm used to locate the next target cell.
Considering typical walking speed is under 2 m/s, the only concern would be when
full channel spectrum “Passive scanning” or “Always scanning” discovery algorithms
are used, where an overlap of at least 4.4 m was required between adjacent cells for
192

seamless handover.
We have seen that during dual interface handovers, if the difference between the han-
dover power level threshold (Phothresh) and receive power level threshold (Prxthresh) was
not sufficient for a given speed and handover time, the handover ceases to be seamless.
The same principles can be applied for the generalized case of a multi-interface han-
dover using the IEEE 802.21 MIH framework. Using a log-distance path loss model, we
derived an analytical model that was used to assist in finding the difference in threshold
level required for a given packet loss when the MS’s speed was known. Although the
model no longer applies when shadowing was introduced into the path loss model, we
developed an equation that could approximate the threshold level to packet loss rela-
tionship for a given speed, whenmeasurements for another speed were known. We also
confirmed the models still applied successfully with VBR traffic, where the signal mea-
surements were sampled according to the frame arrival patterns in bursty sequences.
There has been extensive work in the past where handovers were mainly based on
degrading signal strengths or excessive noise levels. Through the potential commu-
nications and signaling offered by MIH between layers, we proposed a strategy that
triggers handovers based on QoS parameters, including delay, jitter and throughput.
A QoS decision engine was outlined, which determined appropriate handover trigger
thresholds on the wireless access network for each QoS parameter. This was done by
subtracting the individual network segment performance for the intended traffic path
obtained through the MIH function, from the required end-to-end application perfor-
mance. Through simulations, we presented results that demonstrated the use of this
mechanism to maintain the QoS required.
Before an MS completes its handover to an AP, appropriate management is required
to ensure the new link can support the MS’s QoS requirements and maintain the QoS
193

of existing connections on that link. The maximum achievable real-time traffic utiliza-
tion that satisfies the required QoS of all connections in the cell, is a key parameter
required for an admission decision to be made. This is difficult to predict analytically
in an 802.11e contention based medium. Through extensive simulations, we studied
and determined the maximum real-time traffic utilization for different combinations
of traffic parameters, including bi-directional voice, bi-directional video, greedy best-
effort traffic, and loss due to interference level. The utilization values obtained were
expressed in a multi-dimensional lookup matrix for a quick and convenient method
for estimating the maximum real-time traffic utilization for a given state. We proposed
a measurement based call admission control strategy that used the utilization lookup
matrix, and demonstrated its advantages over other single threshold based schemes.
Where the single threshold based schemes failed to protect existing connections due to
the limitations of using a single threshold value under varying traffic conditions, the
proposed lookup based admission control succeeded.
Overall, this thesis proposed and investigated both handover and load management
strategies to address performance limitations in IEEE 802.11. The contributions can be
assembled together for moving toward fulfilling the goal of a complete IEEE 802.11
mesh network capable of supporting time sensitive real-time applications.
8.2 Future Work
During our investigations on handover performance of commercially available IEEE
802.11 devices, one of the biggest difficulties faced was the lack of flexibility to config-
ure scanning parameters. The availability or modification of a device to allow full flexi-
bility on the handover routine and measured parameters would open up opportunities
194

for further investigations. Not only does it enable the implementation of customized
handover scanning algorithms and triggering mechanisms, but it also offers the ability
to test these customizations under different real world environments that would have
otherwise been difficult to simulate.
One of the aims of the dual interface link layer proposal was the flexibility of operating
over any existing upper layer protocols. This meant that the second interface included
is invisible to upper layers. With the number of popular network layers (e.g. MIPv6)
that can take advantage of the second interface to add its own handover optimizations,
the additional signaling required to communicate with upper layers is an area worth ex-
panding. Specifically the integration of notifications and commands offered by 802.21
MIH. This also allows the exploration of using the second interface for implementing
more sophisticated handover decisions based on potential information that can be col-
lected using the MIH functions. The handover decisions may consider other criteria,
such as load, delay measurements or even monetary costs.
The investigation on packet loss as a function of the difference between the handover
power level threshold (”Link Going Down”) and receive power level threshold (”Link
Down”), including the related analytical models were done assuming the MS was mov-
ing radially outwards in line with the AP. The research presented in this thesis can be
further expanded to apply in more practical scenarios where the MS’s path may not be
centered over the coverage area. An additional component would need to be introduced
as part of the analytical model that would generalize it to account for the different possi-
ble paths used. The use of another indoor propagationmodel, such as the ITUmodel for
indoor attenuation [Sey05] could be another possible avenue for further investigation.
To determine the handover trigger threshold for each link layer metric used in the QoS
based triggers, we assumed the performance of each network segment was provided
195
by the MIH function. The provision of performance measurements for improving han-
dover decisions through the MIH function, in particular the information service, offers
many potential aspects for further work. Research in this field could be beneficial for
the continued IEEE standardization efforts in 802.21.
The maximum real-time traffic utilization lookup matrix determined in this thesis were
based on a set traffic profiles and medium access parameters, which represented typical
settings in a real network. However, throughout the life of the network, these settings
particularly the traffic profiles would possibly change. An extension would be to in-
troduce an adaptive framework which would fine tune the utilization values based on
these changes. For example, a system where measurements such as average frame sizes
and rate for each traffic class determined dynamically could be transferred into the feed-
back loop of an adaptive algorithm to modify the lookup values in real-time.
196

Bibliography
[Abo05] B. Aboba. Architectural Implications of Link Indications. Technical Report
draft-iab-link-indications-04.txt, IETF, December 2005.
[air] Linux 802.11 Aironet driver. URL reference: http://sourceforge.net/
projects/airo-linux.
[BBV02] A. Balachandran, P. Bahl, and G. M. Voelker. Hot-Spot Congestion Relief
in Public-area Wireless Networks. In Proceedings of the 4th IEEE Work-
shop on Mobile Computing Systems and Applications WMCSA’02, pages 70–
80, New York, June 2002. IEEE Communications Society.
[BCV01] M. Barry, A.T. Campbell, and A. Veres. Distributed control algorithms for
service differentiation in wireless packet networks. In Proceedings of the
20th Annual Join Conference of the IEEE Computer and Communications Soci-
eties INFOCOM’2001, pages 582–590, Anchorage, April 2001. IEEE Com-
munications Society.
[BD99] G. Banga and P. Druschel. Measuring the capacity of a web server under
realistic loads. World Wide Web, 2:69–83, 1999.
[BHE+04] M. Bargh, R. Hulsebosch, E. Eertink, A. Prasad, H. Wang, and P. Schoo.
Fast authentication methods for handovers between IEEE 802.11 wireless
197

LANs. In Proceedings of the 2nd ACM International Workshop onWireless Mo-
bile Applications and Services on WLANHotspots, pages 51–60, Philadelphia,
2004. ACM.
[Bia00] G. Bianchi. PerformanceAnalysis of the IEEE802.11 Distributed Coordina-
tion Function. IEEE Journal on Selected Areas in Communications, 18(3):535–
547, March 2000.
[Bla01] U. Black. Voice Over IP. Prentice Hall, 2 edition, 2001.
[BMH+02] C. J. Bovy, H. T. Mertodimedjo, G. Hooghiemstra, H. Uijterwaal, and
P. Van. Analysis of End-to-End Delay Measurements in Internet. In Pro-
ceedings of the Passive and Active Measurement Workshop PAM’2002, Fort
Collins, USA, March 2002.
[BMSFR05] N. Blefari-Melazzi, D. D. Sorte, M. Femminella, and G. Reali. Toward
an autonomic control of wireless access networks. In Proceedings of the
IEEE Global Telecommunications Conference GLOBECOM’05, pages 954–959,
St. Louis, November 2005. IEEE Communications Society.
[BRP05] O. Brickley, S. Rea, and D. Pesch. Load balancing for QoS optimisation in
wireless LANs utilising advanced cell breathing techniques. In Proceedings
of the 61st IEEE Vehicular Technology Conference VTC’05, pages 2105–2109,
Stockholm, May 2005. IEEE Communications Society.
[BT02] G. Bianchi and I. Tinnirello. Improving load balancing mechanisms in
wireless packet networks. In Proceedings of the IEEE International Confer-
ence on Communications ICC’02, pages 891–895, New York, May 2002. IEEE
Communications Society.
198

[CC06] Mark Claypool and Kajal Claypool. Latency and player actions in online
games. Communications of the ACM, 49:40–45, November 2006.
[CC07] Y-H. Chen and C-J. Chang. A Fast Handoff Protocol for Cellular IEEE
802.11e WLAN Systems. IEEE Communication Letters, 11(2):140–142,
February 2007.
[CCC+05] C. Casetti, C.-F. Chiasserini, A. Conte, P. Dauchy, and M. Veglio. A call
admission control algorithm for 802.11e EDCA-enhanced WLANs. In
Proceedings of the 62nd IEEE Vehicular Technology Conference VTC’05, pages
2518–2521, Dallas, September 2005. IEEE Communications Society.
[CCG00] F. Cali, M. Conti, and E. Gregori. Dynamic tuning of the IEEE 802.11 pro-
tocol to achieve a theoretical throughput limit. IEEE Transactions on Net-
working, 8(6):785–799, December 2000.
[CCZvdB06] J-C. Chen, T-C. Chen, T. Zhang, and E. van den Berg. Effective AP Selec-
tion and Load Balancing in IEEE 802.11 Wireless LANs. In Proceedings of
the IEEE Global Telecommunications Conference GLOBECOM’06, pages 1–6,
San Francisco, November 2006. IEEE Communications Society.
[CPSM03] S. Choi, J. Prado, S. Shankar, and S. Mangold. IEEE 802.11e Contention-
Based Channel Access (EDCF) Performance Evaluation. In Proceedings
of the IEEE International Conference on Communications ICC’03, volume 2,
pages 1151–1156, Anchorage, USA, May 2003.
[CS05] C-T. Chou and K.G. Shin. An enhanced inter-access point protocol for
uniform intra and intersubnet handoffs. IEEE Transactions on Mobile Com-
puting, 4(4):321–334, July 2005.
199

[CSS05] C-T. Chou, S. Shankar, and K. G. Shin. Achieving per-streamQoSwith dis-
tributed airtime allocation and admission control in IEEE 802.11e wireless
LANs. In ProcINFOCOM05 [Pro05], pages 1584–1595.
[CZTF06] X. Chen, H. Zhai, X. Tian, and Y. Fang. Supporting QoS in IEEE 802.11e
Wireless LANs. IEEE Transactions on Wireless Communications, 5(8):2217–
2227, August 2006.
[DCB05] M. R. Dehkordi, K. Chandrashekar, and J. S. Baras. Analysis of delay
properties and admission control in 802.11 networks. In Proceedings of
the International Conference on Wireless Networks, Communications and Mo-
bile Computing WIRELESSCOM’05, pages 674–679, Maui, June 2005. IEEE
Communications Society.
[ER06] A. El-Rabbany. Introduction to GPS: The Global Positioning System. Artech
House Publishers, 2 edition, August 2006.
[Eth] Ethereal: A Network Protocol Analyzer. URL reference: http://www.
ethereal.com.
[EV05] M. Ergen and P. Varaiya. Throughput Analysis and Admission Control
for IEEE 802.11a. Mobile Networks and Applications, 10(5):705–716, October
2005.
[FGLA97] C. L. Fullmer and J. J. Garcia-Luna-Aceves. Complete single-channel solu-
tions to hidden terminal problems in wireless LANs. In Proceedings of the
IEEE International Conference on Communications ICC’97, volume 2, pages
575–579, June 1997.
[Fin07] M. Finneran. Voice Over WLANS: The Complete Guide. Newnes, 1 edition,
2007.
200

[FV08] R. Fracchia and G. Vivier. An Efficient Trigger to Improve Intra-WiFi Han-
dover Performance. Home Networking, 256:29–38, 2008.
[Gar97] G. A. Garrard. Cellular Communications: Worldwide Market Development.
Artech House, 1 edition, September 1997.
[GBC07] V. Gupta, R. Beyah, and C. Corbett. A Characterization of Wireless NIC
Active Scanning Algorithms. In Proceedings of the Wireless Communications
and Networking Conference WCNC’07, pages 2385–2390, Kowloon, March
2007. IEEE Communications Society.
[GGZZ04] C. Guo, Z. Guo, Q. Zhang, andW. Zhu. A Seamless and Proactive End-to-
End Mobility Solution for Roaming Across Heterogeneous Wireless Net-
works. IEEE Journal on Selected Areas in Communications, 22(5):834–848,
June 2004.
[GN02] A. Grilo and M. Nunes. Performance Evaluations of IEEE 802.11e. In Pro-
ceedings of the IEEE Symposium on Personal, Indoor, andMobile Radio Commu-
nications PIMRC’02, volume 1, pages 511–517, Lisbon, Portugal, Septem-
ber 2002.
[GOHR+06] N. Golmie, U. Olvera-Hernandez, R. Rouil, R. Salminen, and S. Woon.
IEEE 802.21 Media Independant Handover, DCN: 21-06-0687-01-000. Im-
plementing Quality of Service Based Handovers Using the IEEE 802.21
Framework, 2006.
[Goo02] B. Goode. Voice over Internet Protocol (VoIP). Proceedings of the IEEE,
90(9):1495–1517, December 2002.
[Gro99] Bluetooth Special Interest Group. Specifications of the Bluetooth System.
Vol 1. v.1.0B ’Core’ and Vol 2. v.1.0B ’Profiles’, December 1999.
201

[GSM] GSMAMarket Data. URL reference: http://www.gsmworld.com/newsroom/
market-data/market data summary.htm.
[GW99] A. Ganz and K. Wongthavarawat. IEEE 802.11 wireless LAN association
procedure for multimedia applications. In Proceedings of the IEEE Military
Communications Conference MILCOM’99, pages 1287–1291, Atlantic City,
October 1999. IEEE Communications Society.
[GZ03] D. Gu and J. Zhang. A New Measurement-based Admission Control
Method for IEEE802.11 Wireless Local Area Networks. In ProcPIMRC03
[Pro03], pages 2009–2013.
[HHM99] O. Hagsand, K. Hanson, and I. Marsh. Measuring internet telephony qual-
ity: Where are we today? In Proceedings of the IEEE Global Telecommuni-
cations Conference GLOBECOM’99, volume 3, pages 1838–1842, December
1999.
[HIP01] Broadband Radio Access Networks (BRAN): HIPERLAN Type 2, 2001.
[Hos] Host AP driver for Intersil Prism2/2.5/3. URL reference: http://hostap.
epitest.fi.
[HRM03] T. Halonen, R. G. Romero, and J. Melero. GSM, GPRS and EDGE perfor-
mance: evolution towards 3G/UMTS. John Wiley and Sons, 2 edition, 2003.
[HT04] D. P. Hole and F. A. Tobagi. Capacity of an IEEE 802.11b wireless LAN
supporting VoIP. In Proceedings of the IEEE International Conference on Com-
munications ICC’04, volume 7, pages 196–201, June 2004.
[HTT06] P-J. Huang, Y-C. Tseng, and K-C. Tsai. A Fast Handoff Mechanism for
IEEE 802.11 and IAPP Networks. In Proceedings of the 63rd IEEE Vehicular
202

Technology Conference VTC’06, pages 966–970, Melbourne, May 2006. IEEE
Communications Society.
[HZ00] P. L Hiew and M. Zukerman. Efficiency comparison of channel allocation
schemes for digital mobile communication networks. IEEE Transactions on
Vehicular Technology, 49(3):724–733, May 2000.
[IEE85] IEEE Standard for Local and Metropolitan Area Networks: Carrier Sense
Multiple Access with Collision Detection (CSMA/CD) Access Method
and Physical Layer Specifications. ANSI/IEEE Std 802.3: 1985, 1985.
[IEE96] IEEE Standard for a High Performance Serial Bus. ANSI/IEEE Std 1394:
1995, 1996.
[IEE99] IEEE Standard for Wireless LAN Medium Access Control (MAC) and
Physical Layer (PHY) Specifications. ANSI/IEEE Std 802.11: 1999, 1999.
[IEE01] IEEE Standard for Local and Metropolitan Area Networks. ANSI/IEEE
Std 802.1X: 2001, 2001.
[IEE03] IEEE Trial-Use Recommended Practice for Multi-Vendor Access Point In-
teroperability via an Inter-Access Point Protocol Across Distribution Sys-
tems Supporting IEEE 802.11 Operation. ANSI/IEEE Std 802.11f: 2003,
2003.
[IEE04a] IEEE Standard for Wireless LAN Medium Access Control (MAC) and
Physical Layer (PHY) specifications. ANSI/IEEE Std 802.11i: 2004
(Amendment 6: Medium Access Control (MAC) Security Enhancements),
2004.
203

[IEE04b] IEEE Standard for Local and Metropolitan Area Networks. ANSI/IEEE
Std 802.16: 2004, 2004.
[IEE04c] IEEE Standard for Local and Metropolitan Area Networks: Media Access
Control (MAC) Bridges. ANSI/IEEE Std 802.1d: 2004, 2004.
[IEE05a] IEEE Standard for Wireless LAN Medium Access Control (MAC) and
Physical Layer (PHY) specifications. ANSI/IEEE Std 802.11e: 2005
(Amendment 8: Medium Access Control (MAC) Quality of Service En-
hancements), 2005.
[IEE05b] IEEE Standard for Wireless LAN Medium Access Control (MAC) and
Physical Layer (PHY) specifications. ANSI/IEEE Std 802.11r/D01.0: 2005
(Draft Amendment 2: Fast BSS Transition), 2005.
[IEE05c] IEEE Standard for Local and Metropolitan Area Networks. ANSI/IEEE
Std 802.16e: 2005 (Amendment 2: Physical and Medium Access Control
Layers for Combined Fixed and Mobile Operation in Licensed Bands),
2005.
[IEE05d] IEEE Standard for Local and Metropolitan Area Networks: Media In-
dependent Handover Services. ANSI/IEEE Std P802.21/D00.02: 2005
(Draft), 2005.
[IEE07] IEEE Standard for Wireless LAN Medium Access Control (MAC) and
Physical Layer (PHY) specifications. ANSI/IEEE Std 802.11k/D03.0: 2007
(Draft Amendment 9: Radio Resource Measurement), 2007.
[IEE09] IEEE Standard for Wireless LAN Medium Access Control (MAC) and
Physical Layer (PHY) specifications. ANSI/IEEE Std 802.11n: 2009
(Amendment 5: Enhancements for Higher Throughput), 2009.
204

[IN05] E. Ivov and T. Noel. Soft Handovers over 802.1lb with Multiple Interfaces.
In Proceedings of the 2nd IEEE International Symposium on Wireless Commu-
nication Systems ISWCS’05, pages 549–554, Siena, September 2005. IEEE
Communications Society.
[ITU01] ITU-T Recommendation Y.1540 - IP packet transfer and availability per-
formance parameters, 2001.
[JH02] S. Jha and M. Hassan. Engineering Internet QoS. Artech House Publishers,
1 edition, August 2002.
[JPA04] D. Johnson, C. Perkins, and J. Arkko. Mobility Support in IPv6. Technical
Report rfc3775.txt, IETF, June 2004.
[KKK+01] Y. Kim, D. K. Kim, J. H. Kim, S. M. Shin, and D. K. Sung. Radio resource
management in multiple-chip-rate DS/CDMA systems supporting mul-
ticlass services. IEEE Transactions on Vehicular Technology, 50(3):723–736,
May 2001.
[Kor03] J. Korhonen. Introduction to 3G mobile communications. Artech House, 2
edition, 2003.
[KPP+04] H. S. Kim, S. H. Park, C. S. Park, J. W. Kim, and S. J. Ko. Selective Chan-
nel Scanning for Fast Handoff in Wireless LAN Using Neighbor Graph.
Personal Wireless Communications, 3260:194–203, September 2004.
[KTB04] Z-N. Kong, D. H. K. Tsang, and B. Bensaou. Measurement-assisted
model-based call admission control for IEEE 802.11e WLAN contention-
based channel access. In Proceedings of the 13th IEEE Workshop on Local
and Metropolitan Area Networks LANMAN’04, pages 55–60, San Francisco,
April 2004. IEEE Communications Society.
205

[LG06] Y. Liao and L. Gao. Practical Schemes for Smooth MAC Layer Handoff
in 802.11 Wireless Networks. In Proceedings of the IEEE International Sym-
posium on a World of Wireless, Mobile and Multimedia WoWMoM’06, pages
10–20, Buffalo, June 2006. IEEE Communications Society.
[lib] The libpcap Project. URL reference: http://sourceforge.net/projects/libpcap.
[lin] Wireless Tools for Linux. URL reference: http://www.hpl.hp.com/personal/
Jean Tourrilhes/Linux/Tools.html.
[LLCF03] W. Liu, W. Lou, X. Chen, and Y. Fang. A QoS-enabled MAC archi-
tecture for prioritized service in IEEE 802.11 WLANs. In Proceedings of
the IEEE Global Telecommunications Conference GLOBECOM’03, volume 7,
pages 3802–3807, December 2003.
[Lu02] W. Lu. Broadband Wireless Mobile: 3G and Beyond. Wiley, 1 edition, 2002.
[LZA03] W. L. Li, Q-A. Zeng, and D. P. Agrawal. A reliable active scanning scheme
for the IEEE 802.11 MAC layer handoff. In Proceedings of the IEEE Radio
and Wireless Conference RAWCON’03, pages 71–74, Boston, August 2003.
IEEE Communications Society.
[MCK+02] S. Mangold, S. Choi, O. Klein, G. Hiertz, and L. Stibor. IEEE 802.11e Wire-
less LAN for Quality of Service (invited paper). In Proceedings of the Euro-
pean Wireless, volume 1, pages 32–39, Florence, Italy, February 2002.
[MMN05] J. Montavont, N. Montavont, and T. Noel. Enhanced schemes for L2 han-
dover in IEEE 802.11 networks and their evaluations. In Proceedings of
the 16th IEEE International Symposium on Personal, Indoor and Mobile Ra-
dio Communications PIMRC’05, pages 1429–1434, Berlin, September 2005.
IEEE Communications Society.
206

[MN05a] N. Montavont and T. Noel. Anticipated Handover over IEEE 802.11 Net-
works. In Proceedings of the IEEE International Conference on Wireless and
Mobile Computing, Networking and Communications WiMob’05, pages 64–71,
Montreal, August 2005. IEEE Communications Society.
[MN05b] N. Montavont and T. Noel. Mobile IPv6 for multiple interfaces (MMI).
Technical Report draft-montavont-mip6-mmi-02.txt, IETF, July 2005.
[MSA03] A. Mishra, M. Shin, and W. Arbaugh. An Empirical Analysis of the IEEE
802.11 MAC Layer Handoff Process. ACM SIGCOMM Computer Commu-
nications Review (CCR), 33(2):93–102, April 2003.
[MSA04] A. Mishra, M. Shin, and W. Arbaugh. Context caching using neigh-
bor graphs for fast handoffs in a wireless network. In ProcINFOCOM04
[Pro04a], pages 361–364.
[MZ04] J. McNair and F. Zhu. A comparison of load balancing techniques for
scalable Web servers. IEEEWireless Communications, 11(3):8–15, June 2004.
[MZBS07] I. Martinovic, F. A. Zdarsky, A. Bachorek, and J.B . Schmitt. Measurement
and Analysis of Handover Latencies in IEEE 802.11i Secured Networks. In
Proceedings of the 13th European Wireless Conference EW’2007, Paris, France,
April 2007.
[ns-a] NS-2 the network simulator. URL reference: http://www.isi.edu/nsnam/ns/.
[ns-b] An ieee 802.11e edca and cfb simulation model for ns-2. URL reference:
http://www.tkn.tu-berlin.de/research/802.11e ns2/.
207

[ns-c] Modifications to ns-2 simulator by nist to support heterogeneous environ-
ments. URL reference: http://w3.antd.nist.gov/seamlessandsecure/pubtool.
shtml#tools.
[Oht02] M. Ohta. Smooth Handover over IEEE 802.11 Wireless LAN. Technical
Report draft-ohta-smooth-handover-wlan-00.txt, IETF, June 2002.
[OMN] OMNeT++ discrete event simulation system. URL reference: http://www.
omnetpp.org.
[ori] Orinoco driver. URL reference: http://www.ozlabs.com/people/dgibson.
[PC02a] S. Pack and Y. Choi. Fast Inter-AP Handoff using Predictive-
Authentication Scheme in a Public Wireless LAN. In Proceedings of Net-
works 2002 (Joint ICN’02 and ICWLHN’02), Atlanta, August 2002. IEEE
Communications Society.
[PC02b] S. Pack and Y. Choi. Pre-Authenticated Fast Handoff in a Public Wireless
LAN based on IEEE 802.1x Model. In Proceedings of the Mobile and Wireless
Communications, IFIP TC6/WG6.8 Working Conference on Personal Wireless
Communications PWC’02, volume 234, pages 175–182, Singapore, October
2002. International Federation for Information Processing, Kluwer.
[PJKC05] S. Pack, K. Jung, T. Kwon, and Y. Choi. A selective neighbor caching
scheme for fast handoff in IEEE 802.11 wireless networks. In Proceedings
of the IEEE International Conference on Communications ICC’05, pages 3599–
3603, Seoul, May 2005. IEEE Communications Society.
208

[PL01] I. Papanikos and M. Logothetis. A Study on Dynamic Load Balance for
IEEE 802.11b Wireless LAN. In Proceedings of the 8th International Confer-
ence on Advances in Communication and Control COMCON’01, Crete, June
2001. Optimization Software.
[PM03] D. Pong and T.Moors. Call Admission Control for IEEE 802.11 Contention
Access Mechanism. In Proceedings of the IEEE Global Telecommunications
Conference GLOBECOM’03, pages 174–178, San Francisco, December 2003.
IEEE Communications Society.
[Pro03] IEEE Communications Society. Proceedings of the 14th IEEE International
Symposium on Personal, Indoor and Mobile Radio Communications PIMRC’03,
Barcelona, 2003.
[Pro04a] IEEE Communications Society. Proceedings of the 23rd Annual Join Con-
ference of the IEEE Computer and Communications Societies INFOCOM’2004,
Hong Kong, 2004.
[Pro04b] IEEE Communications Society. Proceedings of the IEEE International Confer-
ence on Communications ICC’04, Paris, 2004.
[Pro05] IEEE Communications Society. Proceedings of the 24th Annual Join Con-
ference of the IEEE Computer and Communications Societies INFOCOM’2005,
Miami, 2005.
[PZCC03] M. Portoles, Z. Zhong, S. Choi, and C-T. Chou. IEEE 802.11 link-layer
forwarding for smooth handoff. In ProcPIMRC03 [Pro03], pages 1420–
1424.
[Rap01] T. Rappaport. Wireless Communications: Principles and Practice. Prentice
Hall PTR, 2 edition, December 2001.
209

[RL00] P. Roshan and J. Leary. 802.11 Wireless LAN Fundamentals, chapter Chapter
5: Mobility, pages 149–153. Cisco Press, 1 edition, December 2000.
[RLR94] S. S Rappaport and H. Lon-Rong. Microcellular communication sys-
temswith hierarchical macrocell overlays: traffic performancemodels and
analysis. Proceedings of the IEEE, 82(9):1383–1397, September 1994.
[RRL06] K. Ramachandran, S. Rangarajan, and J.C. Lin. Make-Before-Break MAC
Layer Handoff in 802.11 Wireless Networks. In Proceedings of the IEEE
International Conference on Communications ICC’06, pages 4818–4823, Istan-
bul, June 2006. IEEE Communications Society.
[RS05] I. Ramani and S. Savage. SyncScan: practical fast handoff for 802.11 in-
frastructure networks. In ProcINFOCOM05 [Pro05], pages 675–684.
[Sal99] A. K. Salkintzis. Radio resource management in cellular digital packet
data networks. IEEE Personal Communications, 6(6):28–36, December 1999.
[Sam98] A. Samukic. UMTSUniversal Mobile Telecommunications System: Devel-
opment of Standards for the Third Generation. In Proceedings of the IEEE
Global Telecommunications Conference GLOBECOM’98, volume 4, pages
1976–1983, November 1998.
[Sey05] J. Seybold. Introduction to RF Propagation. Wiley-Interscience, 1 edition,
September 2005.
[SGHK96] M. Stemm, P. Gauthier, D. Harada, and R. H. Katz. Reducing Power
Consumption of Network Interfaces in Hand-Held Devices. In Proceed-
ings of the 3rd International Workshop on Mobile Multimedia Communications
(MoMuc-3), 1996.
210

[Sim05] W. Simpson. Video Over IP: A Practical Guide to Technology and Applications.
Focal Press, 1 edition, 2005.
[Sky] Skype. URL reference: http://www.skype.com.
[SP06] K. Sundaresan and K. Papagiannaki. The need for cross-layer information
in access point selection algorithms. In Proceedings of the 6th ACM SIG-
COMM conference on Internet measurement, IMC ’06, pages 257–262, New
York, NY, USA, 2006. ACM.
[SPRAC03] O. Sallent, J. Perez-Romero, R. Augusti, and F. Casadevall. Provisioning
multimedia wireless networks for better QoS: RRM strategies for 3G W-
CDMA. IEEE Communications Magazine, 41(2):100–106, February 2003.
[SSC99] N. R. Sollenberger, N. Seshadri, and R. Cox. The Evolution of IS-136
TDMA for Third-generation Wireless Services. IEEE Personal Communi-
cations, 6(3):8–18, June 1999.
[SSCS02] T. Starr, M. Sorbara, J. M. Cioffi, and P. J. Silverman. DSL Advances. Pren-
tice Hall, 1 edition, December 2002.
[Tan02] A. S. Tanenbaum. Computer Networks. Prentice Hall PTR, 4 edition, August
2002.
[TBGH03] A. Tolli, I. Barbancho, J. Gomez, and P. Hakalin. Intra-system load bal-
ancing between adjacent GSM cells. In The 57th IEEE Vehicular Technology
Conference VTC’03, volume 1, pages 393–397, April 2003.
[TCHC05] C-C. Tseng, K-H. Chi, M-D. Hsieh, and H-H. Chang. Location-based Fast
Handoff for 802.11 Networks. IEEE Communication Letters, 9(4):304–306,
April 2005.
211
[TJ99] D. Terasawa and E. G. Tiedemann Jr. cdmaOne(R) (IS-95) Technology
Overview and Evolution. In Proceedings of the IEEE Radio Frequency In-
tegrated Circuits (RFIC) Symposium 1999, pages 213–216. IEEE Press, June
1999.
[TK05] N. Thio and S. Karunasekera. Automatic measurement of a qos metric for
web service recommendation. Software Engineering Conference, Australian,
0:202–211, 2005.
[TN06] S. Tartarelli and G. Nunzi. QoS Management and Congestion Control in
Wireless Hotspots. In Proceedings of the 10th IEEE/IFIP Network Operations
and Management Symposium NOMS’06, pages 95–105, Vancouver, April
2006. IEEE Communications Society.
[USB00] Universal Serial Bus Specification. Revision 2.0. URL reference: http://
www.usb.org, 2000.
[VAK04] H. Velayos, V. Aleo, and G. Karlsson. Load Balancing in Overlapping
Wireless LAN Cells. In ProcICC04 [Pro04b], pages 3833–3836.
[VCBS01] A. Veres, A.T. Campbell, M. Barry, and L-H. Sun. Supporting service dif-
ferentiation in wireless packet networks using distributed control. IEEE
Journal on Selected Areas in Communications, 19(10):2081–2093, October
2001.
[VK04] H. Velayos and G. Karlsson. Techniques to reduce the IEEE 802.11b hand-
off time. In ProcICC04 [Pro04b], pages 3844–3848.
212

[VPD+05] S. Vasudevan, K. Papagiannaki, C. Diot, J. Kurose, and D. Towsley. Facil-
itating Access Point Selection in IEEE 802.11 Wireless Networks. In Pro-
ceedings of the 5th ACM SIGCOMM conference on Internet Measurement, IMC
’05, pages 26–26, Berkeley, CA, USA, 2005. USENIX Association.
[Wal00] J. Walker. Unsafe at Any Keysize: An Analysis of the WEP Encapsu-
lation. ACM SIGCOMM Computer Communications Review (CCR), IEEE
802.11-00/362, October 2000.
[WEHW06] S. Wiethoelter, M. Emmelmann, C. Hoene, and A. Wolisz. TKN EDCA
Model for ns-2. TKN-Technical Report TKN-06-003, Telecommunication
Networks Group, Technical University Berlin, Berlin, June 2006.
[wir] Wireless Tools for Linux. URL reference: http://www.hpl.hp.com/personal/
Jean Tourrilhes/Linux/Tools.html.
[WMC00] X. Wu, B. Mukherjee, and S. H. G. Chan. MACA-an efficient channel
allocation scheme in cellular networks. In Proceedings of the IEEE Global
Telecommunications Conference GLOBECOM’00, volume 3, pages 1385–
1389, November 2000.
[XL04a] Y. Xiao andH. Li. Evaluation of distributed admission control for the IEEE
802.11e EDCA. IEEE Communications Magazine, 42(9):s20–s24, September
2004.
[XL04b] Y. Xiao and H. Li. Voice and video transmissions with global data param-
eter control for the IEEE 802.11e enhance distributed channel access. IEEE
Transactions on Parallel and Distributed Systems, 15(11):1041–1053, Novem-
ber 2004.
213

[XLC04] Y. Xiao, H. Li, and S. Choi. Protection and guarantee for voice and video
traffic in IEEE 802.11e wireless LANs. In ProcINFOCOM04 [Pro04a],
pages 2152–2162.
[XLL07] Y. Xiao, F. H. Li, and B. Li. Bandwidth Sharing Schemes for Multimedia
Traffic in the IEEE 802.11e Contention-Based WLANs. IEEE Transactions
on Mobile Computing, 6(7):815–831, July 2007.
[You79] W. R. Young. AdvancedMobile Phone Service: Introduction, Background,
and Objectives. Bell System Technical Journal, 58(1):1–14, January 1979.
[Zan97] J. Zander. Radio resource management in future wireless networks: re-
quirements and limitations. IEEE Communications Magazine, 35(8):30–36,
August 1997.
[ZCF04] H. Zhai, X. Chen, and Y. Fang. A call admission and rate control scheme
for multimedia support over IEEE 802.11 wireless LANs. In Proceedings
of the First International Conference on Quality of Service in Heterogeneous
Wired/Wireless Networks QSHINE’2004, pages 76–83, Dallas, October 2004.
IEEE Communications Society.
[ZIG] ZigBee Alliance. URL reference: http://zigbee.org.
[ZJD03] W. Zhang, J. Jaehnert, and K. Dolzer. Design and Evaluation of a Han-
dover Decision Strategy for 4th Generation Mobile Networks. In Proceed-
ings of the 57th Semiannual IEEE Vehicular Technology Conference VTC’03,
volume 3, pages 1969–1973, 2003.
[ZZ04] L. Zhang and S. Zeadally. HARMONICA: Enhanced QoS Support with
Admission Control for IEEE 802.11 Contention-based Access. In Proceed-
ings of the 10th IEEE Real-Time and Embedded Technology and Applications
214

Symposium RTAS’04, pages 64–71, Toronto, May 2004. IEEE Communica-
tions Society.
215