a framework methodology for performance-based earthquake ... · pdf file13th world conference...
TRANSCRIPT

13th World Conference on Earthquake Engineering Vancouver, B.C., Canada
August 1-6, 2004 Paper No. 679
A FRAMEWORK METHODOLOGY FOR PERFORMANCE-BASED
EARTHQUAKE ENGINEERING
Jack MOEHLE 1 and Gregory G. DEIERLEIN 2
SUMMARY
The Pacific Earthquake Engineering Research Center (PEER) aims to develop a robust methodology for performance-based earthquake engineering. To accomplish this objective, the performance assessment and design process has been broken into logical elements that can be studied and resolved in a rigorous and consistent manner. Elements of the process include description, definition, and quantification of earthquake intensity measures, engineering demand parameters, damage measures, and decision variables. A consistent probabilistic framework underpins the methodology so that the inherent uncertainties in earthquake performance assessment can be represented. The methodology can be implemented directly for performance assessment, or can be used as the basis for establishing simpler performance metrics and criteria for performance-based design.
INTRODUCTION
Performance-based earthquake engineering seeks to improve seismic risk decision-making through assessment and design methods that have a strong scientific basis and that express options in terms that enable stakeholders to make informed decisions. A key feature is the definition of performance metrics that are relevant to decision making for seismic risk mitigation. The methodology needs to be underpinned by a consistent procedure that characterizes the important seismic hazard and engineering aspects of the problem, and that relates these quantitatively to the defined performance metrics.
The first generation of performance-based earthquake engineering assessment and design procedures for buildings in the United States [1, 2] made important steps toward the realization of performance-based earthquake engineering. These procedures conceptualized the problem as shown in Figure 1. Here, the building is visualized as being loaded by earthquake-induced lateral forces that result in nonlinear
1 Professor and Director, Pacific Earthquake Engineering Research Center, University of California, Berkeley, CA,
e-mail: [email protected] 2 Professor, Dept. of Civil & Environmental Engineering, Stanford University, Stanford, CA, e-mail:

response and resulting damage. Relations are then established between structural response indices (interstory drifts, inelastic member deformations, and member forces) and performance-oriented descriptions such as Immediate Occupancy, Life Safety and Collapse Prevention. Without minimizing the remarkable accomplishments of these first-generation procedures, several shortcomings can be identified:
• Engineering demands are based on simplified analysis techniques, including static and linear analysis methods; where dynamic or nonlinear methods are used, calibrations between calculated demands and component performance are largely lacking.
• The defined relations between engineering demands and component performance are based somewhat inconsistently on relations measured in laboratory tests, calculated by analytical models, or assumed on the basis of engineering judgment; consistent approaches based on relevant data are needed to produce reliable outcomes.
• Structural performance is defined on the basis of component performance states, where the overall system performance is assumed to be equal to the worst performance calculated for any component in the building.
Although the shortcomings of the first-generation procedures were widely recognized by the developers, limitations in available technologies and supporting research did not permit further development at that time. Since then, the Pacific Earthquake Engineering Research Center (PEER) has embarked on a research program aimed at developing a more robust methodology for performance-based earthquake engineering. Recognizing the complex, multi-disciplinary nature of the problem, PEER has broken the process into logical elements that can be studied and resolved in a rigorous and consistent manner. The process begins with definition of a ground motion Intensity Measure, which defines in a probabilistic sense the salient features of the ground motion hazard that affect structural response. The next step is to determine Engineering Demand Parameters, which describe structural response in terms of deformations,
Bas
e S
hear
For
c e
Displacement
273 Performance LevelsIO LS CP
$, % replacement0 25% 50% 100%
Downtime, days0
1 7 30 180
Elastic Limit Collapse
Casualty rate0.0
0.0001 0.001 0.01 0.25
O
P
E
N
O
P
E
N
O
P
E
N
Bas
e S
hear
For
c e
Displacement
273 Performance LevelsIO LS CP
$, % replacement0 25% 50% 100% $, % replacement0 25% 50% 100%
Downtime, days0
1 7 30 180 Downtime, days0
1 7 30 180
Elastic LimitElastic Limit Collapse
Casualty rate0.0
0.0001 0.001 0.01 0.25
O
P
E
N
O
P
E
N
O
P
E
N
O
P
E
N
O
P
E
N
O
P
E
N
Figure 1 – A visualization of performance-based earthquake engineering (after Holmes).

accelerations, or other response quantities calculated by simulation of the building to the input ground motions. Engineering Demand Parameters are next related to Damage Measures, which describe the condition of the structure and its components. Finally, given a detailed probabilistic description of damage, the process culminates with calculations of Decision Variables, which translate the damage into quantities that enter into risk management decisions. Consistent with current understanding of the needs of decision-makers, the decision variables have been defined in terms of quantities such as repair costs, downtime, and casualty rates (Figure 1). Underlying the methodology is a consistent framework for representing the inherent uncertainties in earthquake performance assessment.
While full realization of the methodology in professional practice is still years away, important advances are being made through research in PEER. Some specific highlights are presented in the following text.
FORMALIZATION OF THE FRAMEWORK
Given the inherent uncertainty and variability in seismic response, it follows that a performance-based methodology should be formalized within a probabilistic basis. Referring to Figure 2, PEER’s probabilistic assessment framework is described in terms of four main analysis steps (hazard analysis, structural/nonstructural analysis, damage analysis, and loss analysis). The outcome of each step is mathematically characterized by one of four generalized variables: Intensity Measure (IM), Engineering Demand Parameter (EDP), Damage Measure (DM), and Decision Variable (DV). Recognizing the inherent uncertainties involved, these variables are expressed in a probabilistic sense as conditional probabilities of exceedance, i.e., p[AB]. Underlying the approach in Figure 2 is the assumption that the performance assessment components can be treated as a discrete Markov process, where the conditional probabilities between parameters are independent.
The first assessment step entails a hazard analysis, through which one evaluates one or more ground motion Intensity Measures (IM). For standard earthquake intensity measures (such as peak ground acceleration or spectral acceleration) IM is obtained through conventional probabilistic seismic hazard analyses. Typically, IM is described as a mean annual probability of exceedance, p[IM], which is specific to the location (O) and design characteristics (D) of the facility. The design characteristics might be described by the fundamental period of vibration, foundation type, simulation models, etc. In addition to determining IM, the hazard analysis involves characterization of appropriate ground motion input records for response history analyses. PEER’s research on hazard analysis involves close coordination with the earth science and engineering seismology communities both to improve the accuracy of determining conventional scalar IMs and to investigate alternative seismic intensity measures that best correlate with earthquake-induced damage. These alternative measures may include vector representations of multiple
p[IM|O,D ]
p [IM]
IM : intensitymeasure
O, DSelectO, D
Hazard analysis Struct'l analysis
p[EDP |IM ]
p[EDP ]
EDP : engineeringdemand param.
O: LocationD: Design
Damage analysis
p[DM|EDP ]
p[DM]
DM : damagemeasure
Loss analysis
p[DV|DM ]
p[DV]
DV : decisionvariable
Decision-making
Facilityinfo
p[IM|O,D ]
p [IM]
IM : intensitymeasure
O, DSelectO, D
Hazard analysis Struct'l analysis
p[EDP |IM ]
p[EDP ]
EDP : engineeringdemand param.
O: LocationD: Design
Damage analysis
p[DM|EDP ]
p[DM]
DM : damagemeasure
Loss analysis
p[DV|DM ]
p[DV]
DV : decisionvariable
Decision-making
Facilityinfo
Figure 2 – Underlying probabilistic framework (after Cornell, Porter)

intensity measures, such as multiple representations of spectral acceleration, spectral shape, and duration.
Given IM and input ground motions, the next step is to perform structural simulations to calculate Engineering Demand Parameters (EDP), which characterize the response in terms of deformations, accelerations, induced forces, or other appropriate quantities. For buildings, the most common EDPs are interstory drift ratios, inelastic component deformations and strains, and floor acceleration spectra. Relationships between EDP and IM are typically obtained through inelastic simulations, which rely on models and simulation tools under development by PEER in areas of structural engineering, geotechnical engineering, SSFI (soil-structure-foundation-interaction), and non-structural component and system response. PEER has developed various approaches, such as the incremented dynamic analysis technique [3], to systematize procedures for characterizing the conditional probability, p(EDP|IM), which can then be integrated with the p[IM] to calculate mean annual probabilities of exceeding the EDPs.
The next step in the process is to perform a damage analysis, which relates the EDPs to Damage Measures, DM, which in turn describe the physical damage to a facility. The DMs include descriptions of damage to structural elements, non-structural elements, and contents, in order to quantify the necessary repairs along with functional or life safety implications of the damage (e.g., falling hazards, release of hazardous substances, etc.). PEER is developing conditional damage probability relationships, p(DM|EDP), for a number of common and representative components, based on published test data, post earthquake reconnaissance reports, and tests of a few select components. These conditional probability relationships, p(DM|EDP), can then be integrated with the EDP probability, p(EDP), to give the mean annual probability of exceedance for the DM, i.e., p(DM).
The final step in the assessment is to calculate Decision Variables, DV, in terms that are meaningful for decision makers. Generally speaking, the DVs relate to one of the three decision metrics discussed above with regard to Figure 1, i.e., direct dollar losses, downtime (or restoration time), and casualties. In a similar manner as done for the other variables, the DVs are determined by integrating the conditional probabilities of DV given DM, p(DV|DM), with the mean annual DM probability of exceedance, p(DM). PEER’s previous research has served to, first, establish the choice of appropriate DVs and ways of presenting these performance metrics to stakeholders and, second, develop loss functions describing p(DV|DM) relationships.
The methodology just described and shown in Figure 2 is an effective integrating construct for both the performance-based earthquake engineering methodology itself and the PEER research program. The methodology can be expressed in terms of a triple integral based on the total probability theorem, as stated in Equation 1.
(1)
Though this equation form of the methodology might be construed as a minimalist representation of a very complex problem, it nonetheless serves a useful function by providing researchers with a clear illustration of where their discipline-specific contribution fits into the broader scheme of performance-based earthquake engineering and how their individual research results need to be presented. The equation also emphasizes the inherent uncertainties in all phases of the problem and provides a consistent format for sharing and integrating data and models developed by researchers in the various disciplines.
Hazard Intensity Measure
The first assessment step in the methodology is a seismic hazard analysis. PEER currently is working with relatively conventional earthquake intensity measures such as peak ground acceleration or spectral acceleration, as well as some alternative measures. In the former case, the IM is obtained through
( ) ∫∫∫= )(||| IMdIMEDPdGEDPDMdGDMDVGDVv λ
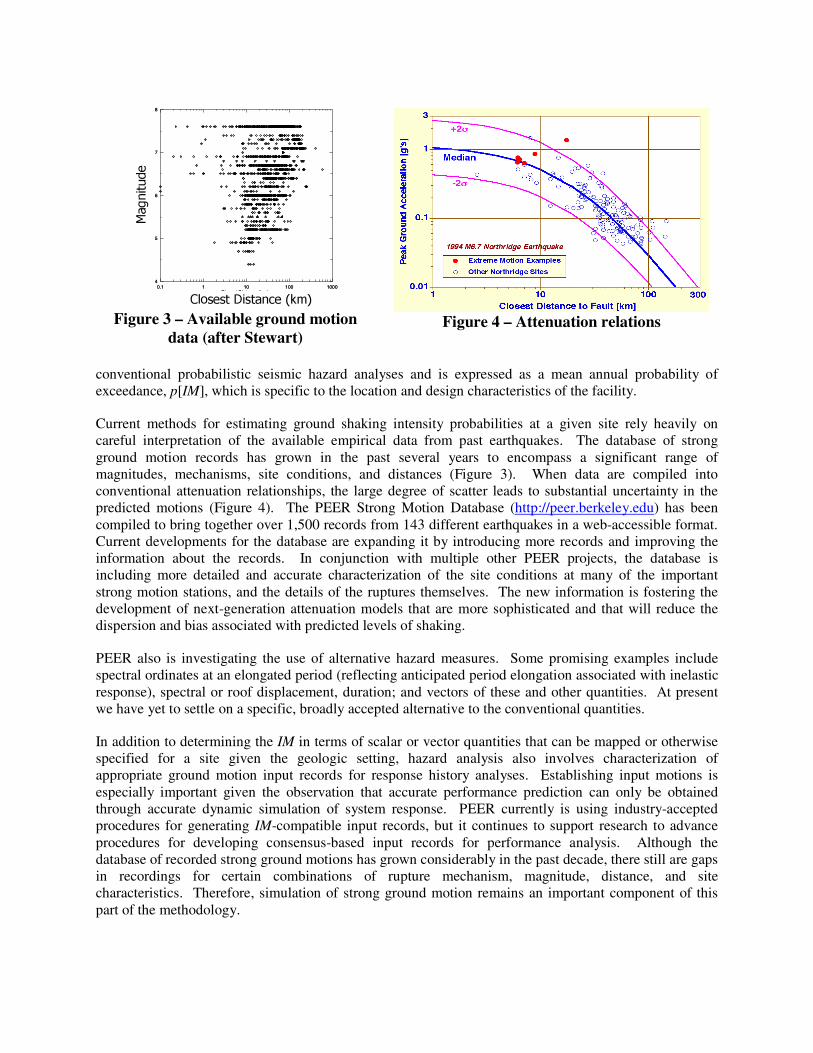
conventional probabilistic seismic hazard analyses and is expressed as a mean annual probability of exceedance, p[IM], which is specific to the location and design characteristics of the facility.
Current methods for estimating ground shaking intensity probabilities at a given site rely heavily on careful interpretation of the available empirical data from past earthquakes. The database of strong ground motion records has grown in the past several years to encompass a significant range of magnitudes, mechanisms, site conditions, and distances (Figure 3). When data are compiled into conventional attenuation relationships, the large degree of scatter leads to substantial uncertainty in the predicted motions (Figure 4). The PEER Strong Motion Database (http://peer.berkeley.edu) has been compiled to bring together over 1,500 records from 143 different earthquakes in a web-accessible format. Current developments for the database are expanding it by introducing more records and improving the information about the records. In conjunction with multiple other PEER projects, the database is including more detailed and accurate characterization of the site conditions at many of the important strong motion stations, and the details of the ruptures themselves. The new information is fostering the development of next-generation attenuation models that are more sophisticated and that will reduce the dispersion and bias associated with predicted levels of shaking.
PEER also is investigating the use of alternative hazard measures. Some promising examples include spectral ordinates at an elongated period (reflecting anticipated period elongation associated with inelastic response), spectral or roof displacement, duration; and vectors of these and other quantities. At present we have yet to settle on a specific, broadly accepted alternative to the conventional quantities.
In addition to determining the IM in terms of scalar or vector quantities that can be mapped or otherwise specified for a site given the geologic setting, hazard analysis also involves characterization of appropriate ground motion input records for response history analyses. Establishing input motions is especially important given the observation that accurate performance prediction can only be obtained through accurate dynamic simulation of system response. PEER currently is using industry-accepted procedures for generating IM-compatible input records, but it continues to support research to advance procedures for developing consensus-based input records for performance analysis. Although the database of recorded strong ground motions has grown considerably in the past decade, there still are gaps in recordings for certain combinations of rupture mechanism, magnitude, distance, and site characteristics. Therefore, simulation of strong ground motion remains an important component of this part of the methodology.
0.1 1 10 100 1000Closest Distance (km)
4
5
6
7
8
Ma
gni
tude
Closest Distance (km)
Magnitude
0.1 1 10 100 1000Closest Distance (km)
4
5
6
7
8
Ma
gni
tude
Closest Distance (km)
Magnitude
Figure 3 – Available ground motion
data (after Stewart)
Figure 4 – Attenuation relations

ENGINEERING DEMAND PARAMETERS
Given the IM and input ground motions, the next step is to perform structural simulations to calculate Engineering Demand Parameters (EDP), which characterize the response in terms of deformations, accelerations, induced forces, or other appropriate quantities. For buildings, the most common EDPs for the structural components and system are interstory drift ratios and inelastic component deformations and associated forces. For nonstructural components and contents, the most common EDPs are interstory drift ratios, floor accelerations, and floor velocities.
Relationships between EDP and IM are typically obtained through inelastic simulations, which are supported by PEER’s research on simulation models and computational methods to assess the performance of structural and geotechnical systems. Breaking the barriers of traditional methods and software development protocols, PEER has embarked on a completely new approach in the earthquake engineering community by developing an open-source, object-oriented software framework. OpenSees (Open System for Earthquake Engineering Simulation; http://opensees.berkeley.edu) is a collection of modules to facilitate the implementation of models and simulation procedures for structural and geotechnical earthquake engineering. By shared development using well-designed software interfaces, the open-source approach has effected collaboration among a substantial community of developers and users within and outside of PEER. Unique among software for earthquake engineering, OpenSees allows integration of models of structures and soils to investigate challenging problems in soil-structure-foundation interaction. In addition to improved models for reinforced concrete structures, shallow and deep foundations, and liquefiable soils, OpenSees is designed to take advantage of the latest developments in databases, reliability methods, scientific visualization, and high-end computing.
PEER researchers have developed the incremented dynamic analysis procedure as a means of integrating structural simulations and ground motions to establish a relation between EDPs and IMs. The procedure is illustrated in Figure 5. According to the procedure, a numerical simulation is carried out in which a building structure is subjected to an input ground motion having specified amplitude of the IM for which
EDP (e.g., max. interstory drift)
IM (
e.g.
, Sa(
T1)
)
IM Hazard curve(annual freq. of exceedance)
Individual recordsMedian84%
gu&&
λIM(Sa)
EDP (e.g., max. interstory drift)
IM (
e.g.
, Sa(
T1)
)
EDP (e.g., max. interstory drift)
IM (
e.g.
, Sa(
T1)
)
IM Hazard curve(annual freq. of exceedance)
Individual recordsMedian84%
Individual recordsMedian84%
gu&&
λIM(Sa)
Figure 5 – IM hazard curve and incremented dynamic analysis results for an example
structure (after Krawinkler)

the response EDP is calculated. The process is repeated for increasing values of the IM by scaling the ground motion record, resulting in a continuous relation between the input IM and the resulting EDP. This process is repeated for a series of input ground motion records that have characteristics consistent with the site conditions, resulting in a series of relations between IM and EDP. One can calculate relevant statistical relations between IM and EDP, and establish the probability that the EDP will exceed a set value given IM. Given a seismic hazard analysis that establishes the probabilities of exceeding IM, one can integrate to obtain a hazard relation for EDP, which states the mean annual probability of exceeding EDP (see Figure 6).
Prospects for accurate computation of the EDP relations vary with the target EDP. For example, procedures for calculation of nonlinear dynamic response of ductile frames are becoming increasingly routine with analytical models and computational procedures that have fairly comprehensive validations. Simulation of structural collapse, especially for less ductile systems, remains problematic because of the paucity of analytical models and the challenges of validating simulation procedures for softening systems with large deformations. PEER has made considerable progress in this area, but the challenges here remain large.
DAMAGE MEASURES
The next step in the process is to perform a damage analysis, which relates the EDPs to Damage Measures, DM. The DMs include quantitative descriptions of damage to structural elements, non-structural elements, and contents. This quantification must be relevant and in sufficient detail to enable subsequent quantification of the necessary repairs, disruption of function, and safety hazards.
PEER is developing conditional damage probability relationships, p(DM|EDP), for a number of common and representative components, based on published test data, post earthquake reconnaissance reports, and tests of a few select components. Some characteristic examples include the following:
• Damage models for structural collapse – Collapse of older existing reinforced concrete buildings commonly results from the loss of vertical load-carrying capacity of columns. Research on shear-critical columns has established relations between drift ratio at axial load failure and relevant parameters including column details and axial load (Figure 7). These models are useful not only for establishing the DM given a set of EDPs, but also for informing the structural simulation model so that it can compute the appropriate EDP - onset of axial load failure (a DM) in this case results in a significant change in the dynamic response characteristics of the building and therefore changes the EDP.
• To be useful within the probabilistic context of the PBEE framework, the DMs must be defined in terms of fragility relations. Figure 8 shows fragility relations for nonstructural partition walls, identifying probability of being in a given damage state as a function of the interstory drift ratio, and for various damage states. Note that the choice of damage states is predicated on the consequences of the damage, in this case described by the nature of the repairs to restore the wall to
0.0001
0.001
0.01
0.1
1
10
0 0.005 0.010 0.015 0.020 0.025
Average maximum story drift
Annualprobability
0.0001
0.001
0.01
0.1
1
10
0 0.005 0.010 0.015 0.020 0.025
Average maximum story drift
Annualprobability
Figure 6 – Hazard curve for an EDP for an example
structure (after Krawinkler)

its undamaged state. Also note that the fragility relation is defined in terms of the most relevant EDP, in this case the interstory drift ratio. This is a departure from some approaches where fragilities are expressed as a probability of being in a certain damage state given an input ground motion parameter.
There exists a tremendous gap in knowledge to characterize all the necessary DMs and EDP-DM relations for buildings, for several reasons:
• Much prior testing emphasized strength and ductility capacity, with insufficient attention to damage measures such as residual crack width, spalling, permanent displacement, etc.
• There is a significant gap in research that relates EDPs as calculated by computer simulations and EDPs as measured in the laboratory and used as a basis for establishing EDP-DM relations (for example, strain is commonly used in experimental research as the EDP to define various damage states yet existing codes and simulation packages for nonlinear dynamic analysis of buildings are unable to provide accurate information on component strains).
• Nonstructural components and contents damage are the primary source of loss in most buildings during earthquakes, yet there is a paucity of experimental data on these.
Increased awareness of the needs of PBEE methods may increase attention of researchers to these shortcomings. Furthermore, the availability of databases and database standards as part of the George E. Brown Network for Earthquake Engineering Simulation (NEES) also holds promise for needed advancements.
DECISION VARIABLES
The final step in the methodology is to calculate Decision Variables, DV, in terms that are useful to decision makers. Initial work within PEER aimed to express DVs in terms of mean annual probabilities of exceedance, p[DV]. However, work with various stakeholder groups indicated that this approach probably would not be of sufficient (or any) interest to many interest groups. Therefore, PEER has begun to think more broadly about the problem and to seek alternative ways of expressing losses. Examples include:
• Likely losses in the event of a single scenario (Figure 9a).
0.00 0.02 0.04 0.06 0.080
10
20
30
40
Drift Ratio at Axial Failure
P/(
Ast
f ytd c/s
)model+/− σtest data
0.00 0.02 0.04 0.06 0.080
10
20
30
40
Drift Ratio at Axial Failure
P/(
Ast
f ytd c/s
)model+/− σtest data
Figure 7 – DM for a column susceptible
to axial failure (after Elwood and Moehle)
0.0
0.2
0.4
0.6
0.8
1.0
0 0.005 0.01 0.015 0.02 0.025
EPD (IDR)
P(DM|EPD) 5/8" Gypsum partition wall with 3-5/8" Wall Frame
0.0
0.2
0.4
0.6
0.8
1.0
0 0.005 0.01 0.015 0.02
EPD (IDR)
P(DM|EPD)
Small cracks only
0.0
0.2
0.4
0.6
0.8
1.0
0 0.005 0.01 0.015 0.02 0.025
EPD (IDR)
P(DM|EPD) 5/8" Gypsum partition wall with 3-5/8" Wall
Wide cracks in gypsumboards
Severe damage to gypsumboard and distorsion of metal frame
(Replace partition)
(Replace gypsum boards)
(Paste,Tape, Repaste and Paint)0.0
0.2
0.4
0.6
0.8
1.0
0 0.005 0.01 0.015 0.02 0.025
EPD (IDR)
P(DM|EPD) 5/8" Gypsum partition wall with 3-5/8" Wall Frame
0.0
0.2
0.4
0.6
0.8
1.0
0 0.005 0.01 0.015 0.02
EPD (IDR)
P(DM|EPD)
Small cracks onlySmall cracks only
0.0
0.2
0.4
0.6
0.8
1.0
0 0.005 0.01 0.015 0.02 0.025
EPD (IDR)
P(DM|EPD) 5/8" Gypsum partition wall with 3-5/8" Wall
Wide cracks in gypsumboardsWide cracks in gypsumboards
Severe damage to gypsumboard and distorsion of metal frame
(Replace partition)
(Replace gypsum boards)
(Paste,Tape, Repaste and Paint)
Figure 8 – Fragility relation for nonstructural
component (after Miranda)

• Loss with a particular probability of exceedance (Figure 9b).
• Losses associated with a continuum of scenarios (Figure 9c)
• Probability of exceeding a given level of losses in a set period of time (Figure 9d).
While some of the distinction may seem mere semantics, getting the right language (e.g., “risk of ruin”) may be essential for getting PBEE on the agenda of a decision maker, let alone influencing their decisions.
These ways of expressing losses can all be accomplished within the general PBEE framework that is proposed. In a similar manner as done for the other variables, the DVs are determined by integrating the conditional probabilities of DV given DM, p(DV|DM), with the mean annual DM probability of exceedance, p(DM), for the selected seismic hazard, and then converting the results by appropriate analytics to the form that is required.
Addressing decisions in performance-based earthquake engineering involves more than calculation of DVs. It becomes important also to understand how these DVs relate to the different stakeholders that have potential interest in performance-based earthquake engineering, as illustrated in Figure 10. Business characteristics such as business size, occupancy tenure, and sector determine the vulnerability dimensions of greatest importance, including financial condition, location of customers, type of competition, and the location of competition. Other loss factors related to the vulnerability dimensions determine how the various DVs relate to losses. For example, the loss of 90 percent of the air conditioning in a facility may represent a fixed cost of replacement for a range of occupancies, but the impact on functionality will vary greatly depending on the occupancy (a hospital would be completely nonfunctional while an office building may be able to continue operations). The methodology needs, therefore, to include a loss-modeling procedure that can represent the impacts of various DVs on different stakeholders.
(a) Based on a single scenarioSd = 8
IM [in]
10 %
$ 0.8 E 6 USD
L Bldg. [$]
(c) Continuum of scenarios
PNE = 10 %
IM [in]
L Bldg. [$]
L Bldg.[ $ ]$ 1.2 E 6 USD
P [ L Bldg.]
4751
(b) Loss with a particular probability of exceedance
IM [in]
P [L Bldg. ] [$]
(d) Probability of exceeding different levels of losses
(a) Based on a single scenarioSd = 8
IM [in]
10 %
$ 0.8 E 6 USD
L Bldg. [$]
Sd = 8IM [in]
10 %
$ 0.8 E 6 USD
L Bldg. [$]
(c) Continuum of scenarios
PNE = 10 %
IM [in]
L Bldg. [$]PNE = 10 %
IM [in]
L Bldg. [$]
L Bldg.[ $ ]$ 1.2 E 6 USD
P [ L Bldg.]
4751
L Bldg.[ $ ]$ 1.2 E 6 USD
P [ L Bldg.]
4751
(b) Loss with a particular probability of exceedance
IM [in]
P [L Bldg. ] [$]
IM [in]
P [L Bldg. ] [$]
(d) Probability of exceeding different levels of losses Figure 9 – Alternative ways to express losses (after Miranda)

METHODOLOGY APPLICATION
The proposed methodology is intended to serve two related purposes. The first of these is as a performance engine to be applied in full detail to the seismic performance assessment of a facility. As illustrated in Figure 1, the application would result in a comprehensive statement of the probabilities of various losses (in terms of dollars, downtime, and casualties) for events or timeframes of interest to the owner or decision maker for that facility. Though illustrated in an apparent static loading domain in Figure 1, this is for illustrative purposes only; the intent is to apply the methodology using a fully nonlinear dynamc analysis. Subsequent simplifications to a static or linear analysis domain awaits further study.
This leads to the second intended purpose of the methodology. Presuming it can be used to provide reliable results for a complete facility analysis, the methodology then can be used as a means of calibrating simplified procedures that might be used for advancement of future building codes. It is in this application that the methodology is likely to have its largest potential impact.
APPLICATION TO BRIDGES AND TRANSPORTATION SYSTEMS The discussion thus far has focused on examples related to the performance assessment of buildings. The same concepts can be applied to bridges and, even more broadly, to the transportation systems of which the bridges are a part. Shown in Figure 11 is an example study of a fragility assessment of a bridge which is representative of viaducts common in California. This example demonstrates how evaluation of alternative performance metrics (DVs) dictates the choice of DMs and EDPs. In this case, the EDP and DM relates to losses in the gravity load capacity of the damaged bridge. Unlike buildings where collapse hazard to occupants, repair costs, and loss of functionality are all significant considerations, the
Extent of business loss & recovery
Loss Determinants Outcome
Vulnerability Index
Influence
1. Speed of reopening
2. Survival of market
3. Change in competitiveness
Physical damage
Loss FactorsBusiness Characteristics
Mitigation & preparedness
Location of customers
Type of competition
Location of competitors
Sector
Business size
Occupancy tenure
Vulnerability Dimensions
Access to resources
Market diversification
Market stability
Financial condition
Other char-acteristics
Measured variables
Figure 10 – Relating decision variables to various stakeholders (after Meszaros)

overriding performance metric for bridges is post-earthquake functionality, i.e., the reduced capacity of a bridge coupled with the required time to restore the bridge to full functionality. Here there detailed performance based methodology is applied to create fragility relationships, such as shown in Figure 11, which relate the ground motion IM to the probability of the bridge being in a specified functional limit state. Bridge fragility relationships, such as shown in Figure 11, are useful in their own right to describe the performance of an individual bridge. However, the bridge fragility relationships take on more significant functions as key components to the performance assessment of the overall highway network. A schematic flowchart of the seismic performance assessment process for of a distributed transportation network is shown in Figure 12, where bridge fragilities and their implication on bridge performance are critical links to relate ground hazards to bridge damage and performance, and ultimately to the performance (measured in terms of traffic capacity) of the highway network. The point here is to show that just as the performance-based engineering framework relates the performance of structural or nonstructural components to the overall performance of the building or bridge, so do the similar concepts relate the bridge performance to the highway network. This has implications not only for assessing the highway network performance, but also for using information on the network performance to establish appropriate performance targets for the bridge.
Conclusion
A methodology has been proposed by which to assess the expected performance of a facility subjected to earthquake hazard. The methodology breaks the assessment process into logical elements that can be studied and resolved in a rigorous and consistent manner. The process begins with definition of a ground
Residual Load Capacity
Drift Ratio
Load Capacity Loss
Component Damage
Traffic Capacity
Repair Cost
IM EDP DM DV
Seismic Hazard
Figure 11 – Application of PBEE framework to develop bridge fragility relationship (after Stojadinovic)

motion Intensity Measure, uses advanced simulation procedures to establish Engineering Demand Parameters, relates these to Damage Measures, and finally calculates Decision Variables that can be used in risk management decisions. Importantly, the methodology addresses the shortcomings of the first generation PBEE methods in that it does away with simplified analysis techniques, tracks the overall problem in a consistent manner, and defines system performance on the basis of system measures rather than component measures. The methodology can be used for comprehensive performance assessment of an individual facility, and therefore is useful in assisting decision-makers who wish to target enhanced performance objectives. Alternatively, it can be used as a means of calibrating existing building code provisions, reducing dispersion and bias in results, and thereby achieving conventional performance targets in a more reliable and efficient way. It is in this latter capacity that the methodology holds the greatest potential for reducing losses in future earthquakes.
ACKNOWLEDGMENT
This work was supported primarily by the Pacific Earthquake Engineering Research Center through the Earthquake Engineering Research Centers Program of the National Science Foundation under Award number EEC-9701568. Key elements of the work were carried out by researchers funded and coordinated by PEER. Specific materials for this paper were derived from various works of PEER researchers, notably including Allin Cornell, Helmut Krawinkler, and Eduardo Miranda (Stanford); Keith Porter (Caltech); Mary Comerio, Gregory Fenves, Stephen Mahin, and Michael Riemer (UC Berkeley); Jonathan Stewart (UCLA); Ahmed Elgamal (UC San Diego), and Peter May and Jacqueline Meszaros (U.Washington). Any opinions, findings, and conclusions or recommendations expressed in this material are those of the author and do not necessarily reflect those of the National Science Foundation or these other individuals.
INDIRECT ECONOMIC LOSSES Final Demand Losses
Lost Production and Wages due to Highway Closures
Surface Fault Rupture
Strong Ground Shaking
Liquefaction Ground Failure
Landslide Effects
SEISMIC HAZARD
Non-Retrofit Conditions
Retrofit Conditions
BRIDGE FRAGILITY
Bridge Capacities
Performance States
BRIDGE PERFORMANCE
Bridge Repair Costs
Bridge Repair Times
REPAIR
Highway / Rail Network Model
Regional O-D Data
NETWORK FLOW
DIRECT ECONOMIC LOSSES Bridge Repair Costs Travel Time Delays Value of
Time by Travel Time
Delay
TRAVEL DELAY
Figure 12 - Comprehensive Framework for Performance Assessment of Transportation Systems
Highway Network O-D Data
TRANSPORTATION DATA
Rail Network Bridge
Building Inventory Data
Business Loss of Function
REGIONAL ECONOMIC
Regional I-O Model
Socio-Economic Data
SOFTWARE
Input / Output Visualization
GUI / DB management
TRAVEL DEMAND
Variable Demand Model
Region Freight OD Model

REFERENCES
1. ATC, 1996, Methodology for Evaluation and Upgrade of Reinforced Concrete Buildings, Report No. ATC-40, California Seismic Safety Commission, Sacramento, California
2. FEMA, 1997, NEHRP Guidelines for Seismic Rehabilitation of Buildings, Report No. FEMA-273, Federal Emergency Management Agency, Washington, D.C.
3. Vamvatsikos, D. and C.A. Cornell, Incremental Dynamic Analysis. Earthquake Engineering and Structural Dynamics, 2002. 31(3): p. 491-514.