a general model of synaptic transmission and short … article a general model of synaptic...
TRANSCRIPT

Neuron
Article
A General Model of Synaptic Transmissionand Short-Term PlasticityBin Pan1 and Robert S. Zucker1,*1Department of Molecular and Cell Biology and Neuroscience Institute, University of California, Berkeley, Berkeley, CA 94720-3200, USA
*Correspondence: [email protected]
DOI 10.1016/j.neuron.2009.03.025
SUMMARY
Some synapses transmit strongly to action potentials(APs), but weaken with repeated activation; otherstransmit feebly at first, but strengthen with sustainedactivity. We measured synchronous and asynchro-nous transmitter release at ‘‘phasic’’ crayfish neuro-muscular junctions (NMJs) showing depression andat facilitating ‘‘tonic’’ junctions, and define the kineticsof depression and facilitation. We offer a comprehen-sive model of presynaptic processes, encompassingmobilization of reserve vesicles, priming of dockedvesicles, their association with Ca2+ channels, andrefractoriness of release sites, while accounting fordata on presynaptic buffers governing Ca2+ diffusion.Model simulations reproduce many experimentallydefined aspects of transmission and plasticity atthese synapses. Their similarity to vertebrate centralsynapses suggests that the model might be of generalrelevance to synaptic transmission.
INTRODUCTION
Information processing and control capabilities of nervous
systems depend on a diversity of transmitter release properties.
Synapses can be strong but depress rapidly, or facilitate power-
fully from near silence, with important consequences for circuit
function. Presynaptic terminals of crustacean NMJs are well
suited for electrophysiological recording, biochemical manipula-
tion, and fluorescent tracking of chemical mediators. ‘‘Phasic’’
and ‘‘tonic’’ motor neuron junctions at crayfish leg extensor
muscles differ 1000-fold in initial efficacy—phasic synapses
depress while transmission at tonic synapses can grow 1000-
fold during normal activity. These fast glutamatergic junctions
span the range of short-term synaptic plasticity observed at
vertebrate central synapses (Atwood and Karunanithi, 2002).
Differences in size, number, or density of active zones (Bradacs
et al., 1997; King et al., 1996; Msghina et al., 1998), metabolic
activity (Nguyen et al., 1997), Ca2+ entry or local Ca2+ concentra-
tion ([Ca2+]i) during an AP (Msghina et al., 1999), and in the size of
the readily releasable pool (RRP) (Millar et al., 2002) cannot explain
functional differences between phasic and tonic synapses. In
contrast, transmitter release to step rises in [Ca2+]i imposed by
photolysis of photosensitive chelators differs considerably (Millar
et al., 2002, 2005), reflecting a difference in a Ca2+-sensitive
priming step—rendering docked vesicles immediately available
for release only at phasic synapses.
Previous analysis was limited by the paucity of quantitative
data on plasticity at these junctions. Here we characterize phasic
depression and tonic facilitation and the time courses of
synchronous and asynchronous transmitter release. We offer
a comprehensive model simulating these characteristics. Calcu-
lations of AP-evoked release were refined by considering diffu-
sion of Ca2+ from Ca2+ channel arrays (Matveev et al., 2002,
2004, 2006; Tang et al., 2000; Yamada and Zucker, 1992) toward
secretory and priming targets in the presence of recently defined
endogenous buffers (V. Matveev and J.-W. Lin, personal
communication; Vyshedskiy and Lin, 2000). With uniform synap-
totagmin and buffer parameters but distinct priming parameters
in phasic and tonic synapses we could reproduce kinetics of
transmitter release and synaptic plasticity.
Our model can also explain effects of presynaptically injected
or photolytically produced exogenous buffers on short-term
plasticity (Kamiya and Zucker, 1994; Tang et al., 2000) and the
recovery of transmission following RRP depletion by broadened
APs (Lin and Fu, 2005). We address limitations of previous
models, attempt to harmonize them with each other and exper-
imental results, indicate how processes combine to produce
a strongly accelerating facilitation at tonic synapses, and ques-
tion the interpretation of the RRP at depressing synapses.
RESULTS
Part I. Experimental FindingsRelease Rate and Depression at Phasic Synapses
Release in Normal Medium. In normal van Harreveld’s (NVH) solu-
tion, focal extracellular recordings from a presynaptic bouton
(Figure 1) show strong transmission with no failures but a drop
in quantal content in successive responses (Bradacs et al.,
1997; Msghina et al., 1998; Wojtowicz et al., 1994). Average
quantal amplitudes, recorded as miniature excitatory junctional
currents (mEJCs), remain constant. Depression to five impulses
at 100 Hz was modest, with quantal content falling 34% ± 30%
(mean ± standard deviation [SD], n = 14).
An increased mEJC frequency follows synchronous multi-
quantal releases. We measured release rate during the synchro-
nous release period (Figure 1D and Figure S1 [available online])
by deconvolution of averaged EJCs (Figure 1B) with averaged
mEJCs. Asynchronous release was evaluated by counting single
quanta (Figures 1E and S2). Figure 2A1 shows release rates esti-
mated by both methods; Figure 2B magnifies asynchronous
Neuron 62, 539–554, May 28, 2009 ª2009 Elsevier Inc. 539

Neuron
Model of Transmitter Release and Plasticity
release and also plots ±1 SD. The methods agree where the
measurements overlap. As synchronous release drops, asyn-
chronous release grows in a train.
Quantal contents were calculated (Figure 2A3) by integrating
release rate during the synchronous release period (defined in
Experimental Procedures) and confirmed by dividing successive
average EJC areas by average mEJC area. Quantal contents
drop less (to 74.5% ± 26.9% of the first quantal content of 8.06 ±
6.80; Figure 2A3) than peak release rates (to 71.4% in Figure 2A1)
because the half-widthofsynchronous release in the first response
(Figure 2A2) is a bit less than for the fifth response (Figure 2A4).
Depression in Cs+-Ringer. To characterize depression, we
enhanced it by prolonging APs in a bathing medium with Cs+
substituted for K+ (Millar et al., 2002). Responses to ten stimuli at
100 Hz were quite variable (Figure 3A), even if normalized to the
first response (Figures S3A and S3B). Depression was negatively
correlated with initial quantal content (p < 0.01, Spearman
Figure 1. Evoked Release at Phasic Synapses
Responses toa five-spike 100 Hz train, recorded as focal
extracellular potentials reporting postsynaptic current, in NVH.
(A) Sample traces from one preparation; #, synchronous
release; *, asynchronous release.
(B) Average of 100 trials in the same preparation.
(C) Averaged responses from 14 preparations (thin colored
lines), with global average ± SD (thick gray line), predictions
from a simple model of depletion from a single pool (thick
blue line), or from two independent pools (thick green line),
and simulations from our full model (dashed line).
(D) Synchronous release rates during EJCs from one prepara-
tion, estimated by deconvolution of EJC with average mEJC;
0.1 ms bins (full dataset in Figure S1).
(E) Asynchronous release rates from the same preparation,
estimated by counting mEJCs between EJCs ; 0.5 ms bins
(full dataset in Figure S2).
(F and G) Composite synchronous and asynchronous release
rates from 11 synapses.
r = �0.83 for second and fifth EJCs, n = 9),
as expected if it arises from vesicle depletion.
Weaker synapses showed a net facilitation on the
second response, whereas stronger synapses
depressed the most. Restricting attention to four
synapses of intermediate strength, depression was
more uniform and uncorrelated with first EJC (block
in Figure 3A). Average data from these synapses
(solid gray lines in Figure S3v, A and B) had smaller
SDs (Figure S3C), especially if normalized to the first
response (Figure S3D). We regard these intermediate
synapses as ‘‘typical’’ phasic synapses (Figure 3B).
We studied recovery from depression in
synapses in which the fifth response was between
32% and 40% of the first EJC, resembling our
‘‘typical’’ synapses. Conditioning trains were fol-
lowed by stimuli at intervals from 5 ms to 4 s after
the train (Figure 3C); recovery followed a double-
exponential time course.
Synaptic depression is usually attributed to
depletion of one or more pools of vesicles available
for release (collectively called the RRP). RRP is estimated by plot-
ting cumulative quantal content in a train versus stimulus number
and extrapolating to the ordinate the final slope when release has
reached steady state (Schneggenburger et al., 1999). Pool-
depletion models of depression require an estimate of RRP
size. Our measurements of phasic RRP size fell between 10
and 75 (41 ± 23), similar to results of Millar et al. (2002).
Figure 3D shows a sample RRP determination.
Release Rate and Facilitation at Tonic Synapses
Tonic synapses are the opposite of phasic synapses—they start
out nearly silent but facilitate tremendously. Focal recordings in
NVH reveal occasional single-quantal responses to the first stim-
ulus (quantal content 0.015 ± 0.011, corresponding to a proba-
bility of release per active zone of 0.00075 if there are 20 per
bouton; Msghina et al., 1998), whereas asynchronous release
is virtually nonexistent (Figures 4A1 and 4A2); synchronous and
asynchronous release grow strongly in subsequent responses.
540 Neuron 62, 539–554, May 28, 2009 ª2009 Elsevier Inc.

Neuron
Model of Transmitter Release and Plasticity
Overlapping quanta are extremely rare, so release rate may be
estimated from histograms of synaptic delays to all quantal
responses (Figures 4A3 and S4). Figure 4B1 shows average
release time course (±SD). Quantal contents (Figure 4B3) were
estimated by counting quanta in the synchronous release period
and confirmed by dividing average EJC area by average mEJC
area. Facilitation was defined as the fractional increase of the
quantal content of a subsequent response, mn, compared with
that of the first, m1, using Fn = mn/m1 � 1. Facilitation of quantal
content (28.4 ± 14.4 for the fifth response, with a quantal content
of 0.15 ± 0.11 for the first EJC) exceeded that of peak release
rate (22.4 ± 13.4), due to broadening of the release period
(Figures 4B2 and 4B4).
Excitatory junctional potentials (EJPs) were also recorded
intracellularly from the muscle fiber used for focal recording.
Quantal contents were estimated by counting uniquantal
responses for early stimuli (Figure S5B), while, for later stimuli,
Figure 2. Measured and Simulated Release
from Phasic Synapses in NVH
Responses tofive stimuli at 100 Hz.
(A1) Release rates averaged from 11 preparations
estimated by deconvolution (black line) or by
counting mEJPs (green line ± SD shown as light
green area). Simulation 1 (dashed blue line, ‘‘fast
buffer’’ diffusion constant [Df] of 0) and simulation
2 (solid red line, Df = 0.002 mm2/ms) rescaled to
overlay peak rates (16.4 and 12.3 quanta/ms) on
measured peak release rate (8.7/ms).
(A2 and A4) Magnified synchronous release
periods (gray regions in all panels) for first and fifth
responses from (A1), showing measurements and
simulation 2: the fifth response is broader (wider
half width, horizontal dashed lines) and begins
earlier than the first response.
(B) Expansion of (A1) showing asynchronous
release.
(A3) Quantal contents (green bars, ±SD) and simu-
lations (in blue for Df = 0 and red for Df = 0.002 mm2/
ms); first quantal contents: 8.06 (experimental),
7.91 (simulation 1), and 9.21 (simulation 2).
EJP amplitude (Figure S5A) was divided
by average mEJP amplitude; when both
methods could be used, they agreed
closely. Facilitation derived from this
data (Figure S5C) was similar to that
from extracellular recordings.
Figure 5A illustrates an accelerating
accumulation of facilitation and its post-
tetanic biexponential decay in individual
experiments; Figure 5B plots average
behavior.
Part II. A Comprehensive Modelof Transmitter ReleaseThe Release Scheme
Our model of synaptic transmission
began with the scheme proposed by
Millar et al. (2002), shown as grayed
portions of Figure 6; they added a Ca2+-dependent priming
process to the binding of five Ca2+ ions to synaptotagmin
(Bollmann et al., 2000; Schneggenburger and Neher, 2000) to
account for strong facilitation. This scheme had six parameters:
on and off rates (kon and koff) for synaptotagmin binding, a coop-
erativity factor b, a fusion rate g, and on and off rates for the
priming process, kprime and kupr. Ca2+ binding to C2A and C2B
domains occurs independently but with identical kinetics
(Chapman, 2008).
We modified this scheme to encompass features of depres-
sion. We allowed for refilling pool U of docked but unprimed vesi-
cles from a reserve pool, R. Mobilization of vesicles from R to U
was made Ca dependent, as suggested for other preparations
(Gomis et al., 1999; Schneggenburger et al., 2002). This added
two parameters, kmob and kdemob. Finally, instead of the number
of unprimed (U) and primed (V) vesicles being fixed at average
RRP sizes (Millar et al., 2002, 2005), only the initial total number
Neuron 62, 539–554, May 28, 2009 ª2009 Elsevier Inc. 541

Neuron
Model of Transmitter Release and Plasticity
of vesicles in all pools (R + U + V + W) was fixed. We recorded
from larger phasic boutons, similar in size to average tonic bou-
tons, so we assumed 20 active zones per bouton (Msghina et al.,
1998); 600 vesicles per active zone (Wojtowicz et al., 1994) gives
12,000 vesicles per bouton.
The dual-component nature of depression (Figures 3B and 3C)
resembles that of vertebrate glutamatergic synapses (Neher and
Sakaba, 2008). There, depression initially develops faster and
then slower than a single exponential, as if two vesicle pools
are depleted at different rates, due to different release probabil-
ities, and depression also recovers with two time constants.
After a short train depleting only the first pool, recovery proceeds
at the slower rate, as if the willingly released pool recovers more
slowly than the reluctantly released pool.
Phasic junctions behave similarly, as shown by fits to single-
and dual-pool models used for vertebrate synapses (Wolfel
et al., 2007; Zucker et al., 1999). These simple models have no
provision for facilitation, priming, or mobilization. Each pool is
characterized by a resting size S (dependent on filling and
reverse rates k+ and k� from a fixed reserve pool), and a constant
fraction F of that pool is released by each AP. Following stimula-
tion, each pool recovers at rate k�. S, F, and k� of the one-pool
model were derived by fitting an exponential to recovery and
from quantal contents of the first two responses, m1 and m2
(see Supplemental Experimental Procedures). The six parame-
ters of the dual-pool model required estimation of the steady
state of depression as well as m1 and m2, two time constants
of recovery, and the resting sizes of the two pools, SA and SB.
Their sum was set to 58, the average RRP of phasic synapses
(Millar et al., 2002). Dual-pool models provided better fits to
data from individual synapses (data not shown), as well as to
composite data (Figures S3 and 3B). As at vertebrate synapses,
the rapidly depleted pool was the slowest to recover.
Rather than propose independent pools, we adopted the
suggestion of Neher and Sakaba (2008) that puts the pools in
series (Figure 6). The idea is that the first pool (V) consists of
molecularly primed and releasable vesicles uncoupled from
a Ca2+ channel, so that release probability to an AP is low. Vesi-
cles in the second pool (W) are attached to a Ca2+ channel, where
their exposure to higher [Ca2+]i increases release probability. If
priming is faster than transit between pools V and W, which Neher
and Sakaba (2008) call ‘‘positional priming,’’ the relationship
between release probability and recovery rate follows. This
adds two more parameters, kattach and kdetach, to the model. A final
modification, release site refractoriness, will be introduced later.
Release by APs
We simulate AP-evoked release by calculating the different
magnitudes and time courses of [Ca2+]i at the targets governing
Figure 3. Depression at Phasic Synapses
in Cesium Ringer
Growth of, and recovery from, depression at nine
phasic synapses stimulated ten times at 100 Hz.
(A) Correlation between depression of the second
(squares, left ordinate) or fifth responses (triangles,
right ordinate) and initial quantal content. Four
synapses with intermediate depression uncorre-
lated (p > 0.05) with initial amplitude (symbols
within box) were used for analysis.
(B) Responses averaged from 20 trials for indi-
vidual boutons (gray lines), means ± SDs for all
synapses (black symbols), simple single-pool
(blue line) and two-pool (green line) depletion
models, and simulations of our model (solid red
line); the latter is separated into release from will-
ingly (W, dashed line) and reluctantly released (V,
dotted line) pools.
(C) Recovery from depression in five boutons
(colored symbols, averages of 20 trials), showing
double exponentials (r2 R 0.97) fitted to each
(colored lines). The global average (thick gray
line) is a double exponential using parameters
averaged from these fits (boxed values). Simulated
recovery (black line) is separated into vesicle pools
W (dashed line) and V (dotted line). For double-
exponential fits, the amplitude and time constant
of each exponential is indicated (±SDs for data;
±SEs for simulation parameters).
(D) Cumulative quantal content from simulations
(red symbols) used to estimate RRP (red line)
from 20-AP 100 Hz train, and an example of exper-
imental data (green symbols and line). Dashed line
shows larger RRP estimated from simulation of
total cumulative release, including asynchronous
release.
542 Neuron 62, 539–554, May 28, 2009 ª2009 Elsevier Inc.

Neuron
Model of Transmitter Release and Plasticity
mobilization, priming, and triggering secretion of V and W vesi-
cles. Symmetry (Matveev et al., 2002, 2006; Tang et al., 2000;
Yamada and Zucker, 1992) permits representation of a bouton
as a rectilinear volume with x,y dimensions of a quarter active
zone on its synaptic face and the surrounding region halfway
to the next active zone, and a z depth to the back of the bouton,
based on ultrastructural data (details in Supplemental Experi-
mental Procedures).
Calcium Channels. APs admit Ca2+ with a time course depen-
dent on channel kinetics and AP waveform. We use a Ca2+ current
time course, ICa(t), derived from a Hodgkin-Huxley model of inver-
tebrate P/Q-type Ca2+ channels (Llinas et al., 1981, 1982; Llinas,
1999) driven by an AP recorded presynaptically (Beaumont et al.,
2002; Millar et al., 2005); channel kinetics were adjusted for
18�C.The resulting timecourse resembledaGaussian, soaclosely
fitting Gaussian (with SD = 0.25 ms) was used for ICa(t). We
assumed a single-channelconductanceof2.7pS, basedonrecent
vertebrate measurements (Li et al., 2007) and earlier invertebrate
Figure 4. Measured and Simulated Release
at Tonic Synapses
Measured and simulated release from tonic
synapses stimulated five times at 100 Hz in NVH.
(A1) Sample focal extracellular EJCs; #, synchro-
nous release; y, second element of a rare two-
quantum synchronous response; *, asynchronous
release; _, nerve terminal potential.
(A2) Superimposed traces (500) from another
preparation, showing synchronous and asynchro-
nous release.
(A3) Histogram of release rates from the prepara-
tion of (A1); full dataset in Figure S3.
(B1) Release rates (green line ±SD shown as light
green area) averaged from 13 synapses. Gray
regions mark synchronous release periods. Lines
are model simulations with Df = 0 (simulation 1,
dashed blue line) or 0.002 mm2/ms (simulation 2,
dotted pink line) without refractoriness, and Df =
0.002 mm2/ms with refractoriness (simulation 3,
solid red line), scaled so peak rates (0.365 [simula-
tion 1] and 0.45 [simulations 2 and 3] quanta/ms)
overlap measured peak release rate (0.22
quanta/ms) in the fifth response.
(B2 and B4) Enlarged first and fifth responses,
respectively, from (B1).
(B3) Measured (means ± SDs) and predicted facil-
itation; measured m1 = 0.015 ± 0.011 (n = 13);
simulated m1 = 0.012–0.013.
data (Llinas, 1999). Single-channel current
peaked at 0.35 pA and admitted 0.35 fcoul
(or 1.8 3 10�21 mol) of Ca2+ per AP. This is
about half the estimate used in previous
simulations (Matveev et al., 2002; Tang
et al., 2000), so the number of channels
per active zone was increased from four
to nine per quarter active zone and ar-
ranged in a square array (Figure 6).
Buffers and Pumps. The profile of Ca2+
concentration, Ca2+(x,y,z,t) (or simply
Ca2+), is governed by Ca2+ influx into boutons, its diffusion with
binding to fixed and mobile endogenous (and sometimes exog-
enous) buffers, and its active removal. Analysis of presynaptic
Ca2+ transients reveals a slowly binding buffer, Bs, and a fast
equilibrating buffer, Bf (Lin et al., 2005; V. Matveev and J.-W.
Lin, personal communication). Our simulations used values for
total amounts (Bstotal and Bf
total), on rates (kson and kf
on), and affin-
ities (KD,s and KD,f) that are in the middle of ranges inferred exper-
imentally (Table 1). For the fast buffer, kfon and KD,f were similar to
those of a poorly mobile buffer from chromaffin cells (Xu et al.,
1997) after adjustment for crayfish ionic strength, and the overall
buffer ratio (Bstotal/KD,s + Bf
total/KD,f) agreed with data from Tank
et al. (1995).
Diffusion constants of endogenous buffers cannot be deter-
mined from volume-averaged Ca2+ indicator measurements.
Because the slow buffer kinetics resembled those of parvalbu-
min in the presence of the �3 mM [Mg2+]i in crayfish cytoplasm
(Gunzel and Galler, 1991), we assumed a diffusion constant of
Neuron 62, 539–554, May 28, 2009 ª2009 Elsevier Inc. 543

Neuron
Model of Transmitter Release and Plasticity
0.043 mm2/s as measured for parvalbumin in neurons (Schmidt
et al., 2003a); mobile parvalbumin is also present at the calyx
of Held (Muller et al., 2007). If all endogenous buffers were highly
mobile, Ca2+ would be rapidly shuttled from active zones, blunt-
ing synaptic facilitation arising from any mechanism (Matveev
et al., 2002, 2004, 2006). Because relatively immobile buffers
are ubiquitous in neurons (see Matveev et al., 2004), we initially
set Df = 0, but later modified it to Df = 0.002 mm2/s to account
for data on asynchronous release.
Previous simulations (Fogelson and Zucker, 1985; Matveev
et al., 2002, 2004, 2006; Tang et al., 2000; Yamada and Zucker,
1992) removed Ca2+ by a surface pump. However, as [Ca2+]i
Figure 5. Facilitation at Tonic Synapses
Growth of, and recovery from, facilitation at tonic synapses stimulated five times at 100 Hz.
(A) Data from 13 focal extracellular recordings (symbols, and thin colored lines, which for decay are two-exponential fits), compared with simulation (thick red lines).
(B) Averaged results ±SDs (purple lines and symbols) and simulation (red lines); dashed lines show initial growth rates of facilitation, illustrating acceleration.
(C1 and C2) Predicted release from the rapidly and slowly released vesicle pools (dashed blue and dotted green lines, respectively) and total release (solid red
lines); (C2) expands foot of (C1) to reveal the rapidly released pool.
(D and E) Fast and slow phases of facilitation decay at two timescales showing measured averages (purple diamonds with SDs), double-exponential fit (solid
purple line, parameters averaged from fits in [A]), and fast and slow components of this fit (dotted and dashed purple lines, respectively). Simulated results (small
black circles) are shown with a double-exponential fit (solid red line) and fast and slow components (dotted and dashed red lines, respectively). The components
of fits are unrelated to vesicle pools in model simulations.
544 Neuron 62, 539–554, May 28, 2009 ª2009 Elsevier Inc.

Neuron
Model of Transmitter Release and Plasticity
approaches its resting level, pumps become diffusion limited by
the reverse gradient they establish (Stockbridge and Moore,
1984), retarding removal so that resting [Ca2+]i is not reached
for a very long time. This property has no effect on brief simula-
tions but caused trouble for simulations of long trains or recovery
times. A linear uptake process more accurately reproduced
recovery of [Ca2+]i at crayfish motor terminals (Vyshedskiy and
Lin, 2000). Figure 7A1 compares simulated and measured effects
of a 0.2 s 100 Hz AP train on Ca2+ indicator fluorescence. We
included 200 mM of an indicator with kon = 0.5 mM�1ms�1 and
KD = 6 mM to match the magnesium green (Mg-green) used in
the experiments. With an uptake rate of 1.0 ms�1, simulations
decayed with time constants of 86 and 310 ms, close to exper-
imental time constants of 84 ± 30 and 390 ± 153 ms. The fast
decay arises from Ca2+ binding to the slow buffer; the slower
component is due to uptake.
The amplitude of Mg-green fluorescence change (DF)
depends on the amount of [Ca2+]i increase and also on resting
[Ca2+]i, and especially [Mg2+]i, which alters the effective Ca2+
affinity of Mg-green. Without precise knowledge of [Mg2+]i, it is
impossible to predict DF. The ratiometric indicator fura-2 has
been used to estimate that an AP elevates presynaptic [Ca2+]iby 9 ± 6 nM (Tang et al., 2000) at crayfish motor terminals. We
simulated this measurement by including a buffer with measured
KD = 0.36 mM and kon = 0.27 mM�1ms�1 (based on koff of Naraghi,
1997) at a concentration of 80 mM, which mimicked fura-2 effects
on facilitation (see below and Figure 7B). The predicted rise in
global [Ca2+]i (Figure 7A2) was 11 nM (excluding the sharp
‘‘spike’’ in [Ca2+]i, which fura-2 is unable to detect due to its
slow kon and koff). The agreement with experiment supports our
choice of number of Ca2+ channels per active zone.
Locations of Targets of Ca2+ Action. We now could predict the
spatiotemporal profile of Ca2+ to neural activity. Effects on trans-
mission depend on positions of the Ca2+ sensors governing
release, which were varied within narrow ranges that seemed
functionally defensible.
CaW. Because vesicles are docked in a circle surrounding the
perimeter of the active zone (Cooper et al., 1996), Ca2+ was
assumed to trigger secretion at an attached vesicle at position
CaW(x,y,z) located 12–20 nm away in all x,y,z directions, or a diffu-
sion distance of 20–35 nm, from a corner Ca2+ channel (Figure 6).
This is a point partway up the vesicle surface: 66�–90� up from its
contact with the plasma membrane, at a putative synaptotagmin
bound to synaptobrevin in an imagined circle of docked SNAREs,
with a lateral distance of 17–28 nm separating the center of the
SNARE ring from the channel through its attachment to a syntaxin
in the SNARE circle, and recognizing that Ca2+ must diffuse
around many SNARE-associated proteins.
CaV and CaP. The locus of the secretory target for unattached
vesicles, CaV(x,y,z), was made more distant, 34–55 nm in x and y
directions from the corner channel and 20 nm beneath the
membrane, or 52–80 nm from the channel mouth. This would
correspond to where a vesicle first docks at the membrane; it
was also taken as the priming site, CaP(x,y,z).
CaM. Mobilization from the reserve pool should occur further
away, CaM(x,y,z), at vesicles near the plasma membrane but
not yet docked. This point was 50–65 nm away in all dimensions
(87–112 nm distant) from a corner Ca2+ channel.
We now describe our attempts to explain the behavior of
phasic and tonic synapses.
Simulations of Phasic Synapses
Release in NVH . We aim to explain all aspects of phasic synapse
behavior with a single set of parameters. We initially supposed
that the fast buffer, Bf, was fixed (Df = 0). The parameters in
Table 1 and under Sim 1 in Table 2, selected as described in
Supplemental Experimental Procedures, produced reasonable
fits to synchronous release time course and depression of
quantal content in NVH (Figure 2A1, simulation 1), as well as
depression and its recovery in Cs+-Ringer and responses to
[Ca2+]i steps from the photolysis experiments of Millar et al.
(2005) (Figure S6). However, simulations using these parameters
overpredicted asynchronous release in a train (Figure 2B).
Secretory cells, neurons, and nerve terminals often contain
a poorly diffusible Ca2+ buffer (Helmchen et al., 1996, 1997;
Lee et al., 2000; Ohana and Sakmann, 1998; Schmidt et al.,
2003b). There is no evidence that this buffer is completely
immobile—results are consistent with a mobility between
0 and 0.005 mm2/ms. Proteins should move at this rate, and
although they might interact with internal membranes and struc-
tural proteins, they should not be absolutely fixed. Allowing Bf to
diffuse slowly, with Df = 0.002 mm2/ms, dramatically improved
the fit of simulations to synchronous and asynchronous phasic
release (simulation 2 in Figures 2A1 and 2B and Table 2). Simu-
lated peak release rates (right-hand ordinates) were somewhat
higher than experimental peaks (left ordinate), which are blunted
by histogram binning. Simulations also predicted an observed
broadening and decreased minimal delay in release with succes-
sive APs (Figures 2A2 and 2A4). A slight overprediction of broad-
ening compensated an underprediction of depression in peak
release rate; hence, simulated depression of quantal contents
matched observations (Figure 2A3).
Asynchronous release simulations were also within experi-
mental variation (light green regions of Figure 2B). A realistic Bf
mobility allowed Ca2+ to diffuse from primed vesicles quickly
enough to fit the decay of synchronous release and the low asyn-
chronous release rate. As synchronous release depressed, asyn-
chronous release accumulated. This ‘‘anomalous property’’ of
depression is often seen (Zucker and Regehr, 2002). It arises
from accumulation of ‘‘residual calcium’’ at sites affecting release
from pool V (CaR, CaU/CaV), which is almost entirely responsible
for asynchronous release. The refinement of parameters needed
to optimally fit AP-evoked release with nonzero Df (column 2 of
Table 2 and Figure 2) also improved the fit (Figure S6) of simulated
photolysis responses to results (Millar et al., 2005).
Depression in Cs+-Ringer. We simulated responses in Cs+-
Ringer by increasing duration of Ca2+ influx, ICa(t), to match the
measured increase in quantal content from 8 to 12. Simulated
depression and recovery fell within experimental observations
(Figures 3B and 3C). Experimentally, depression decayed with
a fast component of amplitude 29% ± 15% and time constant
131 ± 19 ms; and a slow component of 71% ± 9% at 2.05 ± 0.87
s (means ± SDs of fits to each experiment). Simulations recovered
similarly (22% ± 0.9% at 129 ± 7.3 ms, and 78% ± 0.6% at 1.08 ±
0.065 s, means ± standard errors [SEs] of the estimates).
These kinetics imply two pools of immediately releasable vesi-
cles (V and W). Simulations placed synaptotagmin in the
Neuron 62, 539–554, May 28, 2009 ª2009 Elsevier Inc. 545

Neuron
Model of Transmitter Release and Plasticity
Figure 6. Reaction and Geometrical Schemes Used for Simulations
The complete release scheme includes mobilization of vesicles from a reserve pool (R) to a docked, unprimed pool (U), molecular priming to vesicles unattached
to a Ca2+ channel (V), and conversion to vesicles coupled to a Ca2+ channel (W). Primed vesicle pools are released by only one isoform of synaptotagmin binding
three Ca2+ ions to C2A domains and two Ca2+ ions to C2B domains with positive cooperativity (reducing off-rates). Upon full binding, exocytosis occurs at rate g.
All transitions except exocytosis are reversible, and mobilization and priming are Ca dependent. A vesicle cannot be released from a vacated site for a time deter-
mined by refractoriness, implemented by reducing the priming or conversion rate in proportion to the fractional loss of vesicles in the pool from which exocytosis
546 Neuron 62, 539–554, May 28, 2009 ª2009 Elsevier Inc.

Neuron
Model of Transmitter Release and Plasticity
Table 1. Parameters Common to All Simulations
Geometrical Factors and Vesicle Number
Simulation volume 800 3 800 3 1000 nm
Ca channel locations (x,y) (20,20) (20,50) (20,80) (50,20) (50,50) (50,80) (80,20) (80,50) (80,80)
Vesicles in all pools 12,000 per bouton
Endogenous Buffers and Uptake
Bstotal 3 mM
KD,s 10 mM
kson 0.00025 mM�1ms�1
Ds 0.043 mm2/ms
Bftotal 3 mM
KD,f 10 mM
kfon 0.05 mM�1ms�1
Df 0.002 mm2/ms
Uptake rate 1 ms�1
Secretory Trigger
kon 0.18 mm�1ms�1
koff 0.5 ms�1
b 0.4
Secretory Trigger
Calcium Influx and Uptake
Gaussian areaa 1.8 3 10�21 mol/channel
Gaussian SDb 0.25 ms
Channels/active zone 36
Uptake ratec 1 ms�1
a Increased 18% in cesium; 9-fold in TEA.b Increased 18% in cesium; 30% in opener; 9-fold in TEA.c 0.2 ms�1 in diazo-2 experiments.
channel-detached V pool (as well as the unprimed U pool) 52 nm
away from the nearest Ca2+ channel (Table 2); for the channel-
attached pool (W), this distance was 36 nm. Figures 3B and 3C
show contributions of pools V and W to depression and its
recovery. Attached vesicles are exhausted rapidly but recover
slowly, due to slow rates of vesicle-channel attachment/detach-
ment. Detached vesicles undergo an early facilitation and then
depress gradually, but recover quickly, due to rapid repriming.
In simulations of modest depression in NVH, pool V also evinced
facilitation early in the train. This would explain why some
synapses showed a small early facilitation, both in NVH (Fig-
ure 1C) and in Cs+-Ringer (Figures 3A and S3A).
We reproduced experiments for RRP estimation by stimulating
20 times at 100 Hz and plotting either quantal content of succes-
sive EJCs versus EJC number, or total release including asyn-
chronous release versus time (Figure 3D). The quantal content
simulation extrapolated to 19, within our measured range
(10–75). Plotting total cumulative release produced a higher esti-
mate of 26; Stevens and Williams (2007) showed a similar effect
on RRP estimates when asynchronous release is included.
Simulations of Tonic Synapses
Tonic synapses behave very differently from phasic synapses,
but we could simulate results with the same model by adjusting
mobilization, priming, and attachment rates (Table 2). As with
phasic synapses, simulated time course of release to APs using
a fixed fast buffer (Df = 0) met with failure—asynchronous release
was much too high (simulation 1 in Figure 4B1). Allowing Bf to
diffuse slowly (Df = 0.002 mm2/ms, simulation 2) improved the
fit to results. If release site refractoriness was included (simula-
tion 3; see section at end of Results), asynchronous release
came almost entirely from pool V and fell almost entirely within
1 SD of average measurements.
Like phasic synapses, simulated release rates of the largest
response were higher than measured peaks, which are seriously
underestimated by the 0.5 ms bins needed to measure the low
release rates of tonic synapses. Synchronous release durations
were narrower than those estimated experimentally (which are
artifactually broadened by binning; Figures 4B2 and 4B4); this
compensated for the higher peaks, so simulated and measured
quantal contents were close (0.012–0.013 versus 0.015 ± 0.011
occurred. New model provisions are in black; those in Millar et al. (2005) are in gray. The conventional synaptotagmin model (Bollmann et al., 2000; Schneggen-
burger and Neher, 2000) is shown for comparison. The sketch indicates dimensions and locations of Ca2+ channels and vesicles in pools R, U, V, and W, the sites
of Ca2+ action on those pools (small dots), and properties of endogenous buffers and uptake.
Neuron 62, 539–554, May 28, 2009 ª2009 Elsevier Inc. 547

Neuron
Model of Transmitter Release and Plasticity
Figure 7. Simulating Results from Opener Synapses
(A1) Mg-green fluorescence (in black) from Vyshedskiy and Lin (2000) to a train of 20 APs at 100 Hz compared with our simulation (scaled and overlaid as red
trace). The ordinate applies to the simulation; the scale bar applies to data.
(A2) Predicted volume-averaged [Ca2+]i elevation to a single AP in a bouton.
548 Neuron 62, 539–554, May 28, 2009 ª2009 Elsevier Inc.

Neuron
Model of Transmitter Release and Plasticity
Table 2. Parameters Particular to Individual Simulations
Phasic Synapses Tonic Synapses Opener Neuromuscular Junctions
Parameter
Sim
1 Fixed
Bf (Df = 0)
Sim 2
(±R) Mobile
Bf (Df = 0.002)
Sim 1,
NR Fixed
Bf (Df = 0)
Sim 2,
NR Mobile
Bf (Df = 0.002)
Sim
3 Mobile
Bf (Df = 0.002)
After
Injecting
Fura-2
Before
Photolysing
Diazo-2
After
Photolysing
Diazo-2 Plus TEA
Ca2+ Targets (Relative to Ca2+ Channel at [80,80])
CaM(x,y,z) (nm) (65,65,65) (50,50,50) (50,50,50) (50,50,50) (50,50,50) (50,50,50) (50,50,50) (50,50,50) (50,50,50)
CaP(x,y,z) (nm) (40,40,20) (34,34,20) (51,51,20) (47,47,20) (48,48,20) (55,55,20) (55,55,20) (55,55,20) (55,55,20)
CaV(x,y,z) (nm) (40,40,20) (34,34,20) (51,51,20) (47,47,20) (48,48,20) (55,55,20) (55,55,20) (55,55,20) (55,55,20)
CaW(x,y,z) (nm) (15,15,15) (15,15,15) (15,15,14) (16,16,16) (18,18,18) (12,12,12) (15,15,15) (15,15,15) (12,12,12)
Resting Vesicle Pool Sizesa
R (Reserve) 11,938 11,936 11,999 11,991 11,997 11,930 11,912 11,912 11,988
U (Unprimed but docked) 35 27 0.48 9 3.1 67 83 83 9.0
V (Primed, unattached) 18 29 0.03 0.054 0.12 3 5.1 5.1 3.2
W (Primed and attached) 9 8 0.013 0.006 0.012 0.095 0.082 0.082 0.10
Exogenous Buffer
Bitotal (mM) 80 500 100
KD,i (mM) 0.36 4.4 0.15
kion (mM�1ms�1) 0.27 0.017 0.5
Di (mm2/ms) 0.036 0.025 0.025
Mobilization, Priming, Attachment, and Refractoriness
kmob (mM�1ms�1) 7.2 3 10�5 5.0 3 10�5 2.19 3 10�4 6.8 3 10�6 3.0 3 10�5 8.45 3 10�4 7.0 3 10�4 7.0 3 10�4 3.0 3 10�4
kdemob (ms�1) 0.0025 0.0022 0.0024 0.0009 0.012 0.015 0.010 0.010 0.040
kprime (mM�1ms�1) 0.023 0.028 0.00074 0.022 0.018 0.006 0.0045 0.0045 0.015
kupr (ms�1) 0.0054 0.0032 0.039 0.45 0.048 0.016 0.0088 0.0088 0.0050
kattach (ms�1) 0.00043 0.00015 0.0002 0.00013 0.00091 0.00030 0.00012 0.00012 0.000304
kdetach (ms�1) 0.00082 0.00051 0.001 0.0011 0.0091 0.0097 0.0099 0.0099 0.0097
kRf (ms�1) 0.10 0.10 — — 0.010 0.010 0.010 0.010 0.010a Pool sizes refer to the entire bouton (20 active zones); NR, no refractoriness; ±R, with or without refractoriness; Sim n, simulation #n in Figures 2
(phasic) and 4 (tonic).
for the first response). Simulations also reproduced the decrease
in minimal synaptic delay and increase in synchronous release
duration seen in response to later stimuli. The amount of simu-
lated facilitation (22.4, 27, and 25.6 for simulations 1, 2, and 3)
was also close to results (28.4 ± 14.4, Figure 4B3). Finally, simu-
lated responses to step [Ca2+]i elevations (Figure S7)—using
parameters optimized to fit AP-evoked release with non-zero
Df and refractoriness—fit results of photolysis experiments as
well as, or in some aspects better than, the simulations of Millar
et al. (2005). The need for refractoriness is explained at the end of
Results.
Simulations also matched the growth of facilitation in a train
and its subsequent decay (Figure 5A). Although we obtained
satisfactory fits with all three simulations (Df = 0 or 0.002 mm2/
ms, and with refractoriness), we only illustrate simulations with
non-zero Df and refractoriness that were needed to fit other
results. Acceleration of facilitation (Figure 5B) arose from pool
V (Figure 5C1), due to mobilization and priming (see Discussion).
The early loss of pool W (Figure 5C2) depresses the initial growth
of facilitation, contributing to accelerated growth.
Facilitation decayed with two components (Figure 5D); we
fitted a double-exponential to data from each synapse (the thin
(B) Growth of facilitation (B1) in a train of five APs at 100 Hz, and its subsequent decay (B2), from Tang et al. (2000) (in black) with simulations (in red). Circles and
solid lines, control experiments; squares and dashed lines, after injection of fura-2 as an exogenous buffer. Quantal content of first simulated response is 0.12. In
(B1), error bars represent SDs.
(C1) Rapid production of exogenous buffer by flash photolysis of diazo-2 reduces facilitation after a 50 Hz train of ten APs; inset shows data from Kamiya and
Zucker (1994). Left plot: facilitation of EJPs in the train (data, squares; simulation, dashed red line). Right plot: late decay of facilitation; controls without photolysis
(open circles with exemplar SDs, and simulation as solid red line) versus responses after photolysis (filled circles with exemplar thicker SDs, and simulation as
dashed red line).
(C2) Decay of augmentation following 200 APs at 50 Hz, tested at 0.5 Hz (from Kamiya and Zucker, 1994). Only augmentation remains 2 s after train; its reduction
by diazo-2 photolysis 50 ms before the fourth test peaks after a 0.5 s delay. Open circles with SDs represent controls (no photolysis), whereas filled circles with
thick SDs represent responses after photolysis. The solid red line represents simulated control responses, whereas the dashed red line represents simulated
responses after photolysis. Inset: measurements (circles) and simulations (lines).
(D) Recovery of a releasable pool measured by paired stimulation with APs prolonged 9-fold by TEA; data (filled circles) and simulations (in red) with (solid line) and
without (dashed line) refractoriness. Time is plotted logarithmically, as in the inset illustrating junctional currents from Lin and Fu (2005).
Neuron 62, 539–554, May 28, 2009 ª2009 Elsevier Inc. 549

Neuron
Model of Transmitter Release and Plasticity
lines of Figure 5A) and formed a composite from averages of the
amplitudes and time constants. Experimentally, facilitation de-
cayed with a rapid component of 124 ± 50 magnitude and 15 ±
6.1 ms time constant and a slow component of 8.3 ± 5.6 ampli-
tude and 452 ± 245 ms time constant (means ± SDs of fits to
each experiment). Simulations decayed with similar time
constants (14.6 ± 1.2 and 353 ± 25 ms, estimates ±SEs of two
components). The amplitudes (65 ± 4.6 and 2.3 ± 0.23) were
similar to the data, less than the means but nearly within the
SDs. The difference (not significant) is due to the somewhat
larger acceleration of experimental facilitation. Figure 5A
confirms that simulated decay falls within the range of experi-
mental data.
The two phases of facilitation decay arise from the recovery
times of the two pools (Figure 5C). The recovery of pool V is
determined by the interaction of mobilization and especially
priming with the diffusion of Ca2+ away from these targets,
whereas the recovery of pool W mainly reflects the time required
for vesicle attachment to Ca2+ channels and the rate of Ca2+
removal.
Extending the Model to Fit Other Results
The utility of modeling in explaining both phasic and tonic trans-
mission prompted us to examine its potential for simulating other
results. Synaptic plasticity has been studied extensively at cray-
fish opener NMJs (Bittner, 1989); we therefore attempted to
reproduce properties of this preparation.
Exogenous Buffers and Facilitation. Effects of exogenous
buffers constrain possible mechanisms underlying facilitation
(Matveev et al., 2002, 2004, 2006). Opener and tonic facilitation
are similar (cf. Figures 5 to 7B), but quantal content is higher at
opener boutons, e.g., 0.13 (Bittner and Kennedy, 1970) rather
than 0.015. For opener simulations (Figure 7B), we adjusted tonic
synapse parameters to increase unprimed (U), detached (V), and
channel-attached (W) vesicle pools (Table 2). The duration of
Ca2+ influx, ICa(t), was increased 30%, while total influx remained
unchanged, reflecting cooler experimental conditions (15�C). On
adding 80 mM of a buffer Bi with kion = 0.27 mM�1ms�1 and KD,i =
0.36 mM to match the properties of fura-2 (Tang et al., 2000), and
using the measured fura-2 diffusion rate of Di = 0.036 mm2/ms
(Baylor and Hollingworth, 1988), simulations replicated experi-
mental results (Tang et al., 2000): facilitation was reduced (to
39% in simulations versus 40% experimentally), the fast compo-
nent of decay was accelerated (16.8 to 9.2 ms in simulations
versus 19 ± 5 ms to 12 ± 3 ms experimentally), while slow decay
was essentially unchanged (243 to 291 ms in simulations versus
536 ± 222 ms to 365 ± 222 ms experimentally).
Diazo-2 Photolysis, Facilitation, and Augmentation. We simu-
lated effects on facilitation and augmentation of photolyzing
the presynaptically injected caged buffer diazo-2 (Kamiya and
Zucker, 1994). These experiments were performed on an opener
muscle region with less facilitation, so we adjusted parameters
to fit the growth of facilitation and its decay, while including
500 mM unphotolyzed diazo-2 with kion = 0.017 mM�1ms�1 and
KD,i = 4.4 mM (Adams et al., 1989; adjusted for crayfish ionic
strength), which reduced transmission by the amount observed
experimentally. Uptake was reduced to 0.2 s�1 in accord with
the temperature used (cf. Tank et al., 1995) and the slower decay
of facilitation observed in these experiments. We simulated
550 Neuron 62, 539–554, May 28, 2009 ª2009 Elsevier Inc.
diazo-2 photolysis by producing 100 mM high-affinity photo-
product (kion = 0.5 mM�1ms�1 and KD,i = 0.15 mM) 10 ms before
the first posttetanic test stimulus. Simulated facilitation dropped
by a percentage similar to experimental result (60% and 59%,
respectively, Figure 7C1). Unfacilitated release (at late recovery
times) was also reduced, but by less (42% reduction from first
conditioning response). Augmentation is a slower form of plas-
ticity seen after a longer conditioning train, which was probed
by photolysis 50 ms before a fourth posttetanic stimulus at
0.5 Hz after facilitation had subsided. Photolysis reduced
augmentation in simulations and experiments (Figure 7C2), but
only after a delay reflecting augmentation’s slow reaction to
[Ca2+]i. In our model, this comes from the kinetics of mobilization,
which underlie this form of plasticity. Mobilization parameters
were adjusted to match facilitation in the train, but were not
altered to fit effects of diazo-2 photolysis.
Recovery of Transmission with TEA-Broadened APs Suggests
Release Site Refractoriness. Lin and Fu (2005) prolonged APs
with tetraethylammonium (TEA), causing massive transmitter
release from the opener inhibitor. A subsequent stimulus
released almost nothing, suggesting that the RRP had been
emptied; recovery occurred quickly, within 50 ms. These
synapses facilitate like excitatory ones (Atwood and Bittner,
1971), so we adapted our tonic model to simulate these experi-
ments, prolonging ICa(t) and total influx 9-fold to duplicate
observed increases in presynaptic [Ca2+]i transients and trans-
mission (Vyshedskiy and Lin, 2000), while ICa(t) duration in the
test pulse was reduced to half (as seen experimentally), recov-
ering with a 50 ms time constant. We were unable to replicate
the results with any combination of release parameters; instead,
the continuing priming required for facilitation resulted in
enhanced release to a closely following test stimulus (Figure 7D).
To simulate experimental results, we had to invoke a refractory
process, as suggested for several other synapses (Zucker and
Regehr, 2002), in which sites from which either Ca-attached
(W) or detached (V) vesicles had been released remained unable
to accept a new primed vesicle for some time (Figure 6), deter-
mined by rate constant kRf = 10 s�1. Identical refractoriness
was included in all simulations of opener and tonic synapses
(Figures 4, 5, 7, and S7), whereas phasic synapse simulations
(Figures 2, 3, and S6) included a briefer refractoriness (kRf =
100 s�1), similar to that observed at hippocampal synapses
whose behavior resembles phasic NMJs (Dobrunz et al., 1997).
DISCUSSION
A Comprehensive ModelCrayfish NMJs behave much like other synapses. APs evoke
synchronized release followed by a dribble of vesicle fusions.
At phasic synapses, strong release undergoes two-component
depression, deepened by increasing release and recovering
with two time constants, while asynchronous release grows
during a train. At weak synapses, facilitation is the rule, rising
and falling with two kinetic components, with similar changes
in asynchronous release; tonic NMJs are unusual only in the
depth of their initial weakness and the robustness of subsequent
facilitation. Our experimental results document, in some detail,
Neuron
Model of Transmitter Release and Plasticity
these properties, that otherwise resemble those of other prepa-
rations (Zucker and Regehr, 2002).
Our main accomplishment was to develop a unified model of
synaptic transmission that accounts quantitatively for release
kinetics to step rises in [Ca2+]i by caged Ca2+ photolysis, kinetics
of synchronous and asynchronous transmitter release, changes
in synaptic delay and synchronous release duration in a train, the
kinetics of two components of tetanic depression and postte-
tanic recovery when depression dominates, behavior to long
trains used to estimate RRP size, the effect of including asyn-
chronous release on RRP estimates, recovery from rapid
emptying of the RRP by prolonged APs, facilitation in a train
and its two-component recovery when facilitation dominates,
the appearance of augmentation following longer trains, and
the effects on facilitation and augmentation of exogenous
buffers preinjected or produced by photolysis. A relatively simple
model reproduces a wealth of synaptic phenomenology.
Previous ModelsMost models focus on one type of synapse and one property of
transmission and try to explain it by a single mechanism. For
example, facilitation, which at crayfish NMJ is clearly not due to
increased Ca2+ entry in successive APs (Tank et al., 1995), was
initially attributed to Ca2+ acting nonlinearly at the secretory
trigger (synaptotagmin), where a small residual [Ca2+]i would
augment asynchronous release and facilitate evoked release by
summating with [Ca2+]i increments in APs to produce elevated
[Ca2+]i peaks. Early simulations (data not shown) confirmed
conclusions that this mechanism alone cannot achieve large facil-
itation with a small increase in asynchronous release (Zucker and
Regehr, 2002). Saturation of endogenous buffers underlies part of
facilitation at some (Blatow et al., 2003), but not all (Rozov et al.,
2001), mammalian central synapses. However, our simulations
(data not shown) confirmed previous findings (Matveev et al.,
2004) that if this buffer is mobile, exogenous buffers strongly
accelerate the early decay but greatly prolong the late component
of facilitation, contradicting observations (Figure 5B2); and if this
buffer is immobile, unrealistically high buffer concentrations and
separation of Ca2+ channels from secretory targets are required,
and the growth of facilitation fails to accelerate.
Models of Ca2+ adducing facilitation to a separate target have
also been proposed. In one, Ca2+ acts on two targets down-
stream of synaptotagmin with kinetics that generate fast and
slow facilitation (Matveev et al., 2006). This model was as
good as ours in describing the growth and decay of facilitation
and effects of exogenous buffers, but simulations of diazo-2
photolysis reduced unfacilitated release as much as facilitated
release, unlike experimental results. Moreover, this model intro-
duced additional processes that have no physiological correlate
and could not account for depression at all. In another model
(Matveev et al., 2002), we allowed Ca2+ to act on one target to
facilitate release with two components that arose from Ca2+
diffusion characteristics. But this model required immobile
buffers with fast kinetics that are inconsistent with data on
presynaptic buffer properties (Lin et al., 2005; V. Matveev and
J.-W. Lin, personal communication) and required a high local
tortuosity severely restricting Ca2+ diffusion and an unrealistic
fura-2 immobilization.
Most models of facilitation and depression at vertebrate
synapses (Zucker and Regehr, 2002) have been descriptive
rather than mechanistic in nature (e.g., Dittman et al., 2000)
and are therefore of an entirely different class of model from
ours, which attempts to derive synaptic behavior from underlying
physiological mechanisms interacting with measured physical
processes. The vertebrate literature is rich with quantitative
explorations of processes that could underlie facilitation or
depression (see Neher and Sakaba, 2008, for a recent review).
Our notions of depression arising from sequential two-pool
depletion, with Ca2+-dependent mobilization from a reserve
pool and ‘‘positional priming’’ reflecting association of primed
vesicles with Ca2+ channels, as well as release site refractori-
ness, which Neher and Sakaba call ‘‘site clearing,’’ and our basic
formulation of the exocytic process, are all borrowed from this
literature. For this reason we think it likely that our explanations
of transmitter release and short-term plasticity are as applicable
to vertebrate neuronal synapses as to crustacean NMJs.
In contrast to approaches in which model parameters were rela-
tively unconstrained, we began with extensive data that impose
stringent constraints on endogenous buffers and pumps (Lin
et al., 2005; V. Matveev and J.-W. Lin, personal communication)
and choseunvarying parametersconsistentwith those constraints.
We used a realistic model of synaptotagmin, separating Ca2+
binding to C2A and C2B domains and choosing parameters similar
to those used by others and agreeing with kinetic biochemical data
(Bollmann et al., 2000; Chapman, 2008; Schneggenburger and
Neher, 2000). We avoided more complex allosteric models or
multiple synaptotagmin isoforms (Lou et al., 2005; Sun et al.,
2007), because our data do not require them and there is no
evidence for them at crustacean synapses, but we cannot exclude
them either. We included Ca2+-dependent priming as in Millar et al.
(2005), consistent with accumulating molecular evidence (Neher
and Sakaba, 2008), because we found no other way to produce
massive facilitation of initially silent synapses. Priming is rapid in
tonic synapses, slow at phasic synapses, and intermediate at
openersynapses (Table2).To thiswe add aCa2+-dependent mobi-
lization process, a little slower at phasic than at tonic and opener
synapses, which both contributes to facilitation and replenishes
vesicles from a reserve pool to restore transmission after depres-
sion. We allowed for two releasable vesicle pools to account for
the two-component nature of depression. Finally, release site
refractoriness was included to fit responses to long APs at facili-
tating synapses and was incorporated into all simulations, albeit
with a faster rate at phasic synapses.
To activate these processes, we calculated the Ca2+ concentra-
tion profile in a space defined by ultrastructural measurements,
entering through Ca2+ channels with experimentally determined
properties and diffusing past buffers whose properties were
experimentally delimited. This is quite different from models that
‘‘back-calculate’’ from a release scheme the local magnitude
and time course of Ca2+ concentration that would be necessary
to account for release to APs or that assume that local Ca2+ time
course is identical to that of Ca2+ influx (e.g., Bollmann et al.,
2000; Bollmann and Sakmann, 2005; Schneggenburger and
Neher, 2000). We chose distinct locations for Ca2+ targets in mobi-
lization, priming, and secretion of primed vesicles that were within
narrow, realistic ranges but that necessarily result in differences in
Neuron 62, 539–554, May 28, 2009 ª2009 Elsevier Inc. 551

Neuron
Model of Transmitter Release and Plasticity
the local magnitudes and temporal profiles of Ca2+ at their loca-
tions. Exogenous buffer kinetics and mobilities were also experi-
mentally grounded. All simulations of one synapse (tonic, phasic,
different opener populations used in fura-2 and diazo-2 studies,
and inhibitor synapses used in the TEA study) used one set of
parameter values and Ca2+ target locations. Only with such severe
constraints was such extensive modeling possible; yet despite
them, it was successful, and because of them, it is meaningful.
We do not claim that the model is complete, perfect, or unique
in being able to account for properties of synaptic transmission.
The model is not stochastic—it ignores spatial heterogeneity
and temporal fluctuations, diffusional barriers, and nonuniform
tortuosity, as well as effects of interactions between neighboring
active zones (Cooper et al., 1996). It does not constrain release to
a single vesicle at a time in an active zone, as has been proposed
at both crayfish NMJs (Zucker, 1973) and vertebrate central
synapses (Korn et al., 1982; Stevens and Wang, 1995), nor
does it limit the number of dockable vesicles that can be accom-
modated by an active zone (Stevens and Wesseling, 1999). Thus,
it cannot be used to simulate the binomial nature of transmitter
release statistics. Although we could not explain depression by
depletion of a single uniform pool of releasable vesicles, there
is no evidence that there are only two discrete pools rather than
a continuum of states of vesicle priming. Like others, we respect
the value of parsimony in our formulation. It has been suggested
that at mammalian synapses, ‘‘positional priming’’ or attachment
of molecularly primed vesicles to Ca2+ channels, is also Ca2+
dependent (Neher and Sakaba, 2008), and that might be true
for crayfish synapses. At the calyx of Held, this process is thought
to be chiefly responsible for the replacement of secreted vesicles,
and the latest models include no separate mobilization process.
Our simulations with Ca2+-dependent vesicle-channel associa-
tion without mobilization of reserve vesicles did not produce facil-
itation and recovery with the properties of tonic synapses, so we
rejected this alternative. A combination of the two models might
work better than either alone, but we presented the simplest
model that accounts for all the results we considered. Our goal
was a comprehensive but simple framework integrating
processes proposed to underlie the full diversity of common
forms of short-term synaptic plasticity, to facilitate further exper-
imental exploration of synaptic mechanisms and their regulation.
Meaning of the RRPOne question arising from our study is: which of our vesicle pools
represents the RRP? Although we reproduced experiments used
to estimate RRP (Figure 3D), the RRP derived from extrapolating
cumulative release versus response number or time (19) did not
correspond to any (combination) of the underlying pools, which
were U = 27, V = 29, and W = 8. Because W is rapidly exhausted,
the RRP estimate reflects mainly pool V, and to some extent pool
U if it replenishes pool V quickly enough, but it clearly underesti-
mates either or both of them. It may well be that RRP is a fuzzy
concept, extractable from data but not rigorously corresponding
to any physical vesicle pool.
Regulation of Synaptic PropertiesPerhaps the most interesting aspect of opener synapses is that the
propertiesof boutons from thissingle motor neuron vary across the
552 Neuron 62, 539–554, May 28, 2009 ª2009 Elsevier Inc.
muscle from beingnearlysilent withenormous facilitation, like tonic
extensor synapses, to transmitting strongly with only moderate
facilitation, midway toward phasic synapses (Bittner, 1968; Parnas
et al., 1982). This fascinating feature of neural development implies
graded posttranscriptional regulation of the proteins responsible
for mobilization of reserve vesicles, vesicle attachment, or posi-
tional priming, and especially molecular priming of newly docked
vesicles at different boutons of a single neuron.
EXPERIMENTAL PROCEDURES
Animals and Preparation
Freshwater crayfish (Procambarus clarkii; 5–6 cm) from Atchafalaya Biological
Supply (Raceland, LA) or Niles Biological (Sacramento, CA) were kept in an
approved poikilotherm facility. We used the carpopodite extensor preparation,
innervated by tonic and one phasic excitatory motor axons. Anatomical and
physiological features of this muscle have been described (Bradacs et al.,
1997; Msghina et al., 1998). It was dissected and pinned on a Sylgard disc
in a 4 ml chamber and superfused at 1 ml/min with NVH at 18�C–20�C contain-
ing (in mM) 195 NaCl, 5.4 KCl, 13.5 CaCl2, 2.6 MgCl2, and 10 Na-HEPES buffer
(pH 7.4).
Electrophysiology
EJPs were recorded by impaling extensor fibers with a sharp microelectrode
(10–20 MU, filled with 3 M KCl). EJP amplitudes in a tetanus were measured
by subtracting peak amplitude from the falling phase of the previous EJPs
(Figure S5A).
Loose macro-patch recordings (Cooper et al., 1995; Dudel, 1981; Wojtowicz
et al., 1994) of EJCs were obtained from single boutons made visible by expo-
sure for 3 min to 3 mM 4-(4-diethylaminostyryl)-N-methylpyridinium iodide
(4-Di-2-Asp; Molecular Probes, Eugene, OR) (Cooper et al., 1995). Patch
pipettes were beveled at 30� to a 6 3 10 mm opening, fire-polished, filled
with saline, and placed over a well-defined tonic or phasic bouton.
Motor axons were stimulated with an electrode of 10–15 mm opening placed
on an axon on the muscle surface. 4-Di-2-Asp stains the larger tonic axon
more brightly (Bradacs et al., 1997). We averaged 20 sweeps at phasic
synapses and at least 50 sweeps at tonic synapses. Successive five-pulse
trains were separated by at least 10 s, and longer trains by at least 30 s.
EJCs were recorded in voltage clamp mode with an SEC-05LX amplifier (NPI
Electronic GmbH, Tamm, Germany) modified for macro-patch applications,
low-pass filtered at 5 kHz, and digitized at 10 kHz using pClamp (Axon Instru-
ments, Foster City, CA). Data reduction was performed with Excel (Microsoft,
Redmond, WA).
Data Analysis
Calculating Quantal Content and Rates of Synchronous
and Asynchronous Release
At phasic synapses, release rate was estimated by deconvolution (Millar et al.,
2005; Van der Kloot, 1988) of averaged evoked responses (Figure 1B) with
quantal waveforms derived by averaging isolated mEJCs from the same prepa-
ration, using F[n(t)] = F[EJC]/F[mEJC], with F representing Fourier transforms of
release rate n(t) at time t, EJCs, and mEJCs, respectively. Igor Pro (WaveMetrics,
Lake Oswego, OR) produced the inverse Fourier transform of F[n(t)] to get n(t).
This procedure yielded positive release rates for 3–5 ms, beginning 0.6 ms
after the presynaptic AP (the minimal synaptic delay), measured from the
negative peak of the presynaptic nerve terminal potential (NTP) (Katz and
Miledi, 1965). Over 90% of release occurred between 0.6 and 1.8 ms after
the NTP (Figure S1); this was taken as the synchronous release period, corre-
sponding to release contributing to the amplitude of intracellularly recorded
EJPs (Lando and Zucker, 1994). Release rate integrated over this period
yielded quantal contents, which were estimated independently by dividing
averaged EJC areas by averaged mEJC area from each preparation; the esti-
mates agreed within 10%. Deconvolution results were divided into 0.1 ms bins,
and a composite histogram of release rate from all phasic synapses within
each time bin was produced.

Neuron
Model of Transmitter Release and Plasticity
Asynchronous releases occurring >3–5 ms after the NTP were undetectable by
deconvolution. Single quanta were discernable in individual traces,usually begin-
ning 2.5 ms after the NTP until the next stimulus. Release rate in this period was
calculated by counting quanta in each time bin and dividing by number of traces
times the bin width (Figure S2), then forming a composite histogram from all
synapses. Early asynchronous release was measurable by both methods, and
close agreement at individual synapses (Figures S1 and S2) and the composite
results (Figures 2A1 and 2B) provided a consistency check of the two methods.
Tonic release rate was estimated by counting mEJCs (Figures 4A1 and 4A2) and
forminghistogramsbinnedat0.5msof theirsynapticdelays fromtheNTP (Figures
4A3 and S3). Over 90% of release occurred within 0.6–2.3 ms (Figure S4), and this
was taken as the quantal content of evoked synchronous release in Figures 4B3
and 5. Larger quantal contents were calculated from ratios of EJC area to aver-
aged mEJC area. When both methods could be used they agreed within 10%.
For quantal analysis of intracellular recordings (Figure S5), larger EJP amplitudes
were divided by average mEJP amplitude in electrotonically compact fibers,
where mEJP histograms fell well above noise level. Average EJPs for small
responses were below the noise level, but multiple releases were so rare that
quantal content could be estimated from the fraction of traces with failures. The
two methods gave comparable results for intermediate EJPs. Phasic EJPs were
unsuitable for quantal content estimation because of contamination by local
active responses (partial APs), and their short duration and large size precluded
accurate correction for nonlinear summation (Jack et al., 1975; Martin, 1976).
Calculating Phasic RRP Size
We estimated RRP content by the rapid depletion technique (Millar et al., 2002;
Schneggenburger et al., 1999) in which a 100 Hz train of 20 stimuli produced
depression reaching steady state in Ringer with Cs+ substituted for K+. Cumu-
lative EJC quantal content was plotted versus stimulus number, and a line
fitted to the last five events extrapolated to the ordinate to estimate the number
of quanta in the RRP.
Analysis and Simulations
Extensive details are included in Supplemental Experimental Procedures. We
outline equations for one- and two-pool depletion models and our implemen-
tation of transmitter release reactions, describe the publicly available ‘‘calcium
calculator’’ (CalC) software used to implement partial differential equations for
diffusion and reaction of Ca2+ and buffers, and describe procedures followed
for parameter selection.
SUPPLEMENTAL DATA
The Supplemental Data include seven figures, one table, and Supplemental
Experimental Procedures and can be found with this article online at http://
www.neuron.org/supplemental/S0896-6273(09)00285-2.
ACKNOWLEDGMENTS
We are grateful to Victor Matveev for valuable discussion and help with
programming and for updating CalC to include additional provisions that we
requested, and to him and Jen-Wei Lin for sharing unpublished results. Russell
English provided valuable technical assistance. This work was supported by
NSF grants 0413936 and 0533533.
Accepted: March 29, 2009
Published: May 27, 2009
REFERENCES
Adams, S.R., Kao, J.P.Y., and Tsien, R.Y. (1989). Biologically useful chelators
that take up Ca2+ upon illumination. J. Am. Chem. Soc. 111, 7957–7968.
Atwood, H.L., and Bittner, G.D. (1971). Matching of excitatory and inhibitory
inputs to crustacean muscle fibers. J. Neurophysiol. 34, 157–170.
Atwood, H.L., and Karunanithi, S. (2002). Diversification of synaptic strength:
presynaptic elements. Nat. Rev. Neurosci. 3, 497–516.
Baylor, S.M., and Hollingworth, S. (1988). Fura-2 calcium transients in frog
skeletal muscle fibres. J. Physiol. 403, 151–192.
Beaumont, V., Zhong, N., Froemke, R.C., Ball, R.W., and Zucker, R.S. (2002).
Temporal synaptic tagging by Ih activation and actin: involvement in long-term
facilitation and cAMP-induced synaptic enhancement. Neuron 33, 601–613.
Bittner, G.D. (1968). Differentiation of nerve terminals in the crayfish opener
muscle and its functional significance. J. Gen. Physiol. 51, 731–758.
Bittner, G.D. (1989). Synaptic plasticity at the crayfish opener neuromuscular
preparation. J. Neurobiol. 20, 386–408.
Bittner, G.D., and Kennedy, D. (1970). Quantitative aspects of transmitter
release. J. Cell Biol. 47, 585–592.
Blatow, M., Caputi, A., Burnashev, N., Monyer, H., and Rozov, A. (2003). Ca2+
buffer saturation underlies paired pulse facilitation in calbindin-D28k-contain-
ing terminals. Neuron 38, 79–88.
Bollmann, J.H., and Sakmann, B. (2005). Control of synaptic strength and
timing by the release-site Ca2+ signal. Nat. Neurosci. 8, 426–434.
Bollmann, J.H., Sakmann, B., and Borst, J.G. (2000). Calcium sensitivity of
glutamate release in a calyx-type terminal. Science 289, 953–957.
Bradacs, H., Cooper, R.L., Msghina, M., and Atwood, H.L. (1997). Differential
physiology and morphology of phasic and tonic motor axons in a crayfish limb
extensor muscle. J. Exp. Biol. 200, 677–691.
Chapman, E.R. (2008). How does synaptotagmin trigger neurotransmitter
release? Annu. Rev. Biochem. 77, 615–641.
Cooper, R.L., Stewart, B.A., Wojtowicz, J.M., Wang, S., and Atwood, H.L.
(1995). Quantal measurement and analysis methods compared for crayfish
and Drosophila neuromuscular junctions, and rat hippocampus. J. Neurosci.
Methods 61, 67–78.
Cooper, R.L., Winslow, J.L., Govind, C.K., and Atwood, H.L. (1996). Synaptic
structural complexity as a factor enhancing probability of calcium-mediated
transmitter release. J. Neurophysiol. 75, 2451–2466.
Dittman, J.S., Kreitzer, A.C., and Regehr, W.G. (2000). Interplay between facil-
itation, depression, and residual calcium at three presynaptic terminals.
J. Neurosci. 20, 1374–1385.
Dobrunz, L.E., Huang, E.P., and Stevens, C.F. (1997). Very short-term plas-
ticity in hippocampal synapses. Proc. Natl. Acad. Sci. USA 94, 14843–14847.
Dudel, J. (1981). The effect of reduced calcium on quantal unit current and
release at the crayfish neuromuscular junction. Pflugers Arch. 391, 35–40.
Fogelson, A.L., and Zucker, R.S. (1985). Presynaptic calcium diffusion from
various arrays of single channels. Implications for transmitter release and
synaptic facilitation. Biophys. J. 48, 1003–1017.
Gomis, A., Burrone, J., and Lagnado, L. (1999). Two actions of calcium regu-
late the supply of releasable vesicles at the ribbon synapse of retinal bipolar
cells. J. Neurosci. 19, 6309–6317.
Gunzel, D., and Galler, S. (1991). Intracellular free Mg2+ concentration in skel-
etal muscle fibres of frog and crayfish. Pflugers Arch. 417, 446–453.
Helmchen, F., Imoto, K., and Sakmann, B. (1996). Ca2+ buffering and action
potential-evoked Ca2+ signaling in dendrites of pyramidal neurons. Biophys.
J. 70, 1069–1081.
Helmchen, F., Borst, J.G., and Sakmann, B. (1997). Calcium dynamics associ-
ated with a single action potential in a CNS presynaptic terminal. Biophys. J.
72, 1458–1471.
Jack, J.J.B., Noble, D., and Tsien, R.W. (1975). Electric Current Flow in Excit-
able Cells (Oxford: Clarendon Press)., pp 55–66.
Kamiya, H., and Zucker, R.S. (1994). Residual Ca2+ and short-term synaptic
plasticity. Nature 371, 603–606.
Katz, B., and Miledi, R. (1965). The measurement of synaptic delay, and the
time course of acetylcholine release at the neuromuscular junction. Proc. R.
Soc. Lond. B. Biol. Sci. 161, 483–495.
King, M.J., Atwood, H.L., and Govind, C.K. (1996). Structural features of cray-
fish phasic and tonic neuromuscular terminals. J. Comp. Neurol. 372, 618–626.
Korn, H., Mallet, A., Triller, A., and Faber, D.S. (1982). Transmission at a central
inhibitory synapse. II. Quantal description of release, with a physical correlate
for binomial n. J. Neurophysiol. 48, 679–707.
Neuron 62, 539–554, May 28, 2009 ª2009 Elsevier Inc. 553

Neuron
Model of Transmitter Release and Plasticity
Lando, L., and Zucker, R.S. (1994). Ca2+ cooperativity in neurosecretion
measured using photolabile Ca2+ chelators. J. Neurophysiol. 72, 825–830.
Lee, S.H., Rosenmund, C., Schwaller, B., and Neher, E. (2000). Differences in
Ca2+ buffering properties between excitatory and inhibitory hippocampal
neurons from the rat. J. Physiol. 525, 405–418.
Li, L., Bischofberger, J., and Jonas, P. (2007). Differential gating and recruit-
ment of P/Q-, N-, and R-type Ca2+ channels in hippocampal mossy fiber bou-
tons. J. Neurosci. 27, 13420–13429.
Lin, J.W., and Fu, Q. (2005). Modulation of available vesicles and release
kinetics at the inhibitor of the crayfish neuromuscular junction. Neuroscience
130, 889–895.
Lin, J.W., Fu, Q., and Allana, T. (2005). Probing the endogenous Ca2+ buffers at
the presynaptic terminals of the crayfish neuromuscular junction. J. Neurophy-
siol. 94, 377–386.
Llinas, R. (1999). The Squid Giant Synapse. A Model for Chemical Transmis-
sion (Oxford: Oxford University Press).
Llinas, R., Steinberg, I.Z., and Walton, K. (1981). Presynaptic calcium currents
in squid giant synapse. Biophys. J. 33, 289–321.
Llinas, R., Sugimori, M., and Simon, S.M. (1982). Transmission by presynaptic
spike-like depolarization in the squid giant synapse. Proc. Natl. Acad. Sci. USA
79, 2415–2419.
Lou, X., Scheuss, V., and Schneggenburger, R. (2005). Allosteric modulation of
the presynaptic Ca2+ sensor for vesicle fusion. Nature 435, 497–501.
Martin, A.R. (1976). The effect of membrane capacitance on non-linear
summation of synaptic potentials. J. Theor. Biol. 59, 179–187.
Matveev, V., Sherman, A., and Zucker, R.S. (2002). New and corrected simu-
lations of synaptic facilitation. Biophys. J. 83, 1368–1373.
Matveev, V., Zucker, R.S., and Sherman, A. (2004). Facilitation through buffer
saturation: constraints on endogenous buffering properties. Biophys. J. 86,
2691–2709.
Matveev, V., Bertram, R., and Sherman, A. (2006). Residual bound Ca2+ can
account for the effects of Ca2+ buffers on synaptic facilitation. J. Neurophysiol.
96, 3389–3397.
Millar, A.G., Bradacs, H., Charlton, M.P., and Atwood, H.L. (2002). Inverse rela-
tionship between release probability and readily releasable vesicles in
depressing and facilitating synapses. J. Neurosci. 22, 9661–9667.
Millar, A.G., Zucker, R.S., Ellis-Davies, G.C., Charlton, M.P., and Atwood, H.L.
(2005). Calcium sensitivity of neurotransmitter release differs at phasic and
tonic synapses. J. Neurosci. 25, 3113–3125.
Msghina, M., Govind, C.K., and Atwood, H.L. (1998). Synaptic structure and
transmitter release in crustacean phasic and tonic motor neurons. J. Neurosci.
18, 1374–1382.
Msghina, M., Millar, A.G., Charlton, M.P., Govind, C.K., and Atwood, H.L.
(1999). Calcium entry related to active zones and differences in transmitter
release at phasic and tonic synapses. J. Neurosci. 19, 8419–8434.
Muller, M., Felmy, F., Schwaller, B., and Schneggenburger, R. (2007). Parval-
bumin is a mobile presynaptic Ca2+ buffer in the calyx of held that accelerates
the decay of Ca2+ and short-term facilitation. J. Neurosci. 27, 2261–2271.
Naraghi, M. (1997). T-jump study of calcium binding kinetics of calcium chela-
tors. Cell Calcium 22, 255–268.
Neher, E., and Sakaba, T. (2008). Multiple roles of calcium ions in the regulation
of neurotransmitter release. Neuron 59, 861–872.
Nguyen, P.V., Marin, L., and Atwood, H.L. (1997). Synaptic physiology and
mitochondrial function in crayfish tonic and phasic motor neurons. J. Neuro-
physiol. 78, 281–294.
Ohana, O., and Sakmann, B. (1998). Transmitter release modulation in nerve
terminals of rat neocortical pyramidal cells by intracellular calcium buffers.
J. Physiol. 513, 135–148.
Parnas, I., Parnas, H., and Dudel, J. (1982). Neurotransmitter release and its
facilitation in crayfish muscle. V. Basis for synapse differentiation of the fast
and slow type in one axon. Pflugers Arch. 395, 261–270.
554 Neuron 62, 539–554, May 28, 2009 ª2009 Elsevier Inc.
Rozov, A., Burnashev,N., Sakmann, B., and Neher, E. (2001). Transmitter release
modulationby intracellular Ca2+ buffers in facilitatingand depressingnerve termi-
nals of pyramidal cells in layer 2/3 of the rat neocortex indicates a target cell-
specific difference in presynaptic calcium dynamics. J. Physiol. 531, 807–826.
Schmidt, H., Brown, E.B., Schwaller, B., and Eilers, J. (2003a). Diffusional
mobility of parvalbumin in spiny dendrites of cerebellar Purkinje neurons quanti-
fied by fluorescence recovery after photobleaching. Biophys. J. 84, 2599–2608.
Schmidt, H., Stiefel, K.M., Racay, P., Schwaller, B., and Eilers, J. (2003b).
Mutational analysis of dendritic Ca2+ kinetics in rodent Purkinje cells: role of
parvalbumin and calbindin D28k. J. Physiol. 551, 13–32.
Schneggenburger, R., and Neher, E. (2000). Intracellular calcium dependence
of transmitter release rates at a fast central synapse. Nature 406, 889–893.
Schneggenburger, R., Meyer, A.C., and Neher, E. (1999). Released fraction
and total size of a pool of immediately available transmitter quanta at a calyx
synapse. Neuron 23, 399–409.
Schneggenburger, R., Sakaba, T., and Neher, E. (2002). Vesicle pools and
short-term synaptic depression: lessons from a large synapse. Trends Neuro-
sci. 25, 206–212.
Stevens, C.F., and Wang, Y. (1995). Facilitation and depression at single
central synapses. Neuron 14, 795–802.
Stevens, C.F., and Wesseling, J.F. (1999). Identification of a novel process
limiting the rate of synaptic vesicle cycling at hippocampal synapses. Neuron
24, 1017–1028.
Stevens, C.F., and Williams, J.H. (2007). Discharge of the readily releasable pool
withactionpotentials athippocampal synapses.J.Neurophysiol. 98, 3221–3229.
Stockbridge, N., and Moore, J.W. (1984). Dynamics of intracellular calcium
and its possible relationship to phasic transmitter release and facilitation at
the frog neuromuscular junction. J. Neurosci. 4, 803–811.
Sun, J., Pang, Z.P., Qin, D., Fahim, A.T., Adachi, R., and Sudhof, T.C. (2007). A
dual-Ca2+-sensor model for neurotransmitter release in a central synapse.
Nature 450, 676–682.
Tang, Y., Schlumpberger, T., Kim, T., Lueker, M., and Zucker, R.S. (2000).
Effects of mobile buffers on facilitation: experimental and computational
studies. Biophys. J. 78, 2735–2751.
Tank, D.W., Regehr, W.G., and Delaney, K.R. (1995). A quantitative analysis of
presynaptic calcium dynamics that contribute to short-term enhancement.
J. Neurosci. 15, 7940–7952.
Van der Kloot, W. (1988). Estimating the timing of quantal releases during end-
plate currents at the frog neuromuscular junction. J. Physiol. 402, 595–603.
Vyshedskiy, A., and Lin, J.W. (2000). Presynaptic Ca2+ influx at the inhibitor of
the crayfish neuromuscular junction: a photometric study at a high time reso-
lution. J. Neurophysiol. 83, 552–562.
Wojtowicz, J.M., Marin, L., and Atwood, H.L. (1994). Activity-induced changes
in synaptic release sites at the crayfish neuromuscular junction. J. Neurosci.
14, 3688–3703.
Wolfel, M., Lou, X., and Schneggenburger, R. (2007). A mechanism intrinsic to
the vesicle fusion machinery determines fast and slow transmitter release at
a large CNS synapse. J. Neurosci. 27, 3198–3210.
Xu, T., Naraghi, M., Kang, H., and Neher, E. (1997). Kinetic studies of Ca2+
binding and Ca2+ clearance in the cytosol of adrenal chromaffin cells. Biophys.
J. 73, 532–545.
Yamada,W.M., andZucker, R.S. (1992).Timecourseof transmitter releasecalcu-
lated from simulations of a calcium diffusion model. Biophys. J. 61, 671–682.
Zucker, R.S. (1973). Changes in the statistics of transmitter release during
facilitation. J. Physiol. 229, 787–810.
Zucker, R.S., and Regehr, W.G. (2002). Short-term synaptic plasticity. Annu.
Rev. Physiol. 64, 355–405.
Zucker, R.S., Kullmann, D.M., and Bennett, M. (1999). Release of neurotrans-
mitters. In Fundamental Neuroscience, M.J. Zigmond, F.L. Bloom, S.C. Landis,
J.L. Roberts, and L.R. Squire, eds. (San Diego: Academic Press), pp. 155–192.

Neuron, Volume 62 SUPPLEMENTAL DATA A GENERAL MODEL OF SYNAPTIC TRANSMISSION AND SHORT-TERM PLASTICITY Bin Pan, Robert S. Zucker SUPPLEMENTAL EXPERIMENTAL PROCEDURES Theoretical Analysis and Model Simulations
Algebra and Ordinary Differential Equations
Most data analysis was done, and single-pool depletion models were solved, using Excel
(Microsoft, Redmond, WA). Igor Pro (WaveMetrics, Lake Oswego, OR) was used for Fourier
analysis. Curve fitting was performed with Prism (GraphPad Software, La Jolla, CA). Figures
were prepared using Prism, Grapher (Golden Software, Golden, CO), or Designer (Corel, Ottowa,
Ont.). Calculations of the time-course of Ca2+ influx through P/Q-type Ca2+ channels was done
using the SynTrans 1.5 program for simulating synaptic transmission at squid giant synapses,
distributed with Llinás (1999). Double-pool depletion models required solution of simultaneous
nonlinear equations, for which Matlab (Mathworks., Natick, MA) was used. Synaptic responses
to step rises in [Ca2+]i required solving simultaneous linear first-order ordinary differential
equations (ODEs). Initially, Igor was used for this purpose, but we encountered difficulties with
Igor on addition of refractoriness equations, probably because of interactions between variables
in Equations (9) and (10). We switched to CalC (see below) for these solutions.
- Page 1 -

Single-Pool Model of Depression
Conventional depletion models attribute depression to exhaustion of a store (S) of vesicles
(Zucker and Regehr, 2002). In a train of n APs of frequency f and duration T, a fixed fraction F
of the remaining S quanta are assumed to be released by each AP, and releases m1, m2, …, mn to
successive APs are replaced by a continuous function in time m(t). If store S recovers simply
from a fixed reserve R, with forward rate constant k+ and backward constant k–, then discrete
drops in S (by FS) at each AP and the exponential recoveries between APs may be approximated
by the equation dS/dt = k+R – k–S – fFS, whose solution is
S(t) = Ss – (Sr – Ss) e–(fF + k-) t , (1)
where Sr = k+R/k– is the initial size of S, Ss = k+R/(fF + k–) is the steady state level of S in a train,
and m(t) = FS(t) where t is measured from the start of stimulation. At the end of a train, recovery
of release to a test stimulus follows the exponential recovery of S from its level when stimulation
stopped (S(T) using equation (1)),
m(t) = FSr – F (S(T) – Sr) e–k-t , (2)
where now t is measured from the end of the train. Depression is governed by three parameters –
F, Sr, and k–. k– may be estimated from the time constant of recovery. Between the first two
stimuli, S recovers from its level just after the first stimulus, Sr - FSr, to its level at the second
stimulus, S2, at time 1/f, according to
S2 = Sr – (Sr (1 – F) – Sr) e–k-/f = Sr (1 + F e–k-/f) , (3)
and multiplying by F gives m2 = m1 (1 + F e–k-/f) to yield an estimate of F from
ln(F) = ln(m2/m1 – 1) + k–/f . (4)
Finally, from m1 = FSr comes an estimate of Sr,
Sr = m1/F . (5)
- Page 2 -

Thus, from the first two responses and the time constant of recovery, the entire time course of
depression may be predicted.
Two-Pool Model of Depression
Release is imagined to occur from two independent pools A and B, each with its own resting
store size and fraction released by APs, and each recovering with its own rate constant k–. This
model is characterized by six parameters, which we will designate SA and SB for the two initial
store sizes, FA and FB for the release fractions, and τA and τB for the recovery time constants
(=1/k–) for each pool, where depression in a train follows
m(t) = FASA/(fFAτΑ + 1) – FASA (fFAτΑ/( fFAτΑ + 1)) e– (fFA + 1/τΑ) t
+ FBSB/(fFBτΒ + 1) – FBSB (fFBτΒ/( fFBτΒ + 1)) e– (fFB + 1/τΒ) t , (6)
and recovers with
m(t) = FASA – FA (SA(T) – SA) e–t/τΑ + FASA – FA (SA(T) – SA) e–t/τΑ . (7)
τA and τB may be estimated from a dual-exponential fit to the recovery time course. From
measurements of m1, m2, and the steady-state level of depression ms, and by assigning a number
to the total RRP = SA + SB, usually 58, the mean estimate for phasic synapses from Millar et al.
(2002), the remaining four parameters were determined by solution of the following equations:
RRP = SA + SB
m1 = FASA + FBSB
m2 = FASA (1 – FA e–1/fτA ) + FBSB (1 – FB e–1/fτB )
ms = FASA / (fFτA + 1) + FBSB / (fFτB + 1) . (8)
- Page 3 -
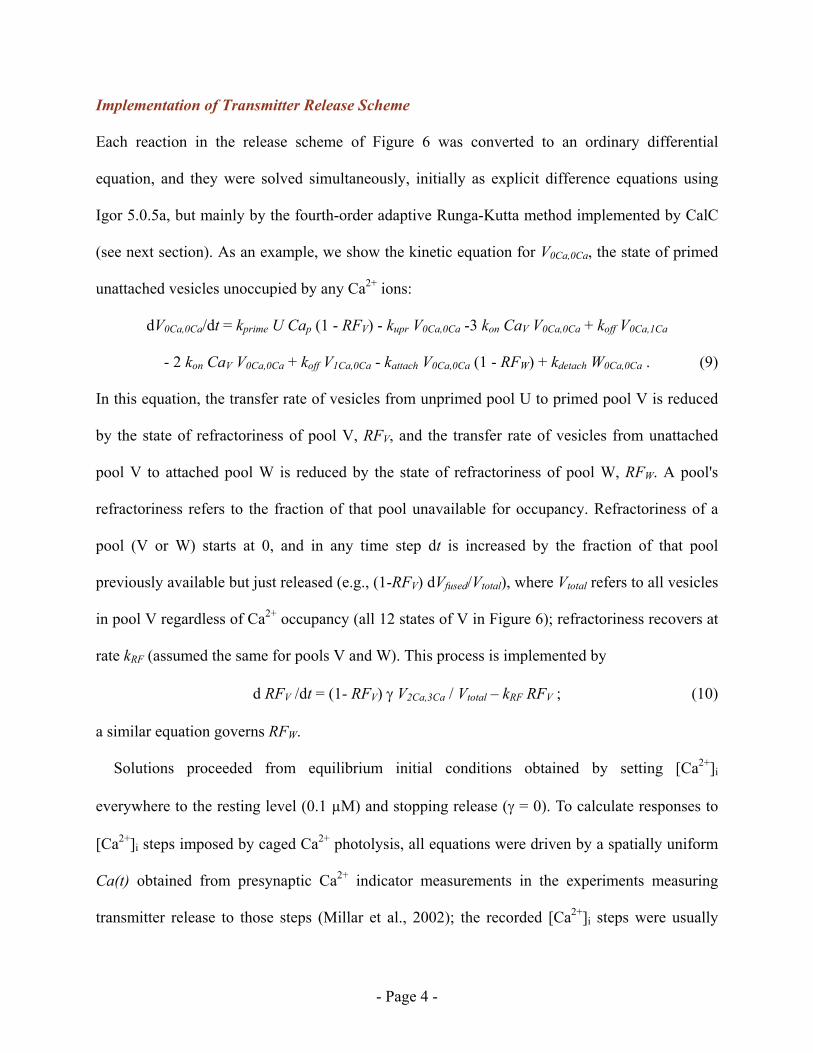
Implementation of Transmitter Release Scheme
Each reaction in the release scheme of Figure 6 was converted to an ordinary differential
equation, and they were solved simultaneously, initially as explicit difference equations using
Igor 5.0.5a, but mainly by the fourth-order adaptive Runga-Kutta method implemented by CalC
(see next section). As an example, we show the kinetic equation for V0Ca,0Ca, the state of primed
unattached vesicles unoccupied by any Ca2+ ions:
dV0Ca,0Ca/dt = kprime U Cap (1 - RFV) - kupr V0Ca,0Ca -3 kon CaV V0Ca,0Ca + koff V0Ca,1Ca
- 2 kon CaV V0Ca,0Ca + koff V1Ca,0Ca - kattach V0Ca,0Ca (1 - RFW) + kdetach W0Ca,0Ca . (9)
In this equation, the transfer rate of vesicles from unprimed pool U to primed pool V is reduced
by the state of refractoriness of pool V, RFV, and the transfer rate of vesicles from unattached
pool V to attached pool W is reduced by the state of refractoriness of pool W, RFW. A pool's
refractoriness refers to the fraction of that pool unavailable for occupancy. Refractoriness of a
pool (V or W) starts at 0, and in any time step dt is increased by the fraction of that pool
previously available but just released (e.g., (1-RFV) dVfused/Vtotal), where Vtotal refers to all vesicles
in pool V regardless of Ca2+ occupancy (all 12 states of V in Figure 6); refractoriness recovers at
rate kRF (assumed the same for pools V and W). This process is implemented by
d RFV /dt = (1- RFV) γ V2Ca,3Ca / Vtotal – kRF RFV ; (10)
a similar equation governs RFW.
Solutions proceeded from equilibrium initial conditions obtained by setting [Ca2+]i
everywhere to the resting level (0.1 µM) and stopping release (γ = 0). To calculate responses to
[Ca2+]i steps imposed by caged Ca2+ photolysis, all equations were driven by a spatially uniform
Ca(t) obtained from presynaptic Ca2+ indicator measurements in the experiments measuring
transmitter release to those steps (Millar et al., 2002); the recorded [Ca2+]i steps were usually
- Page 4 -
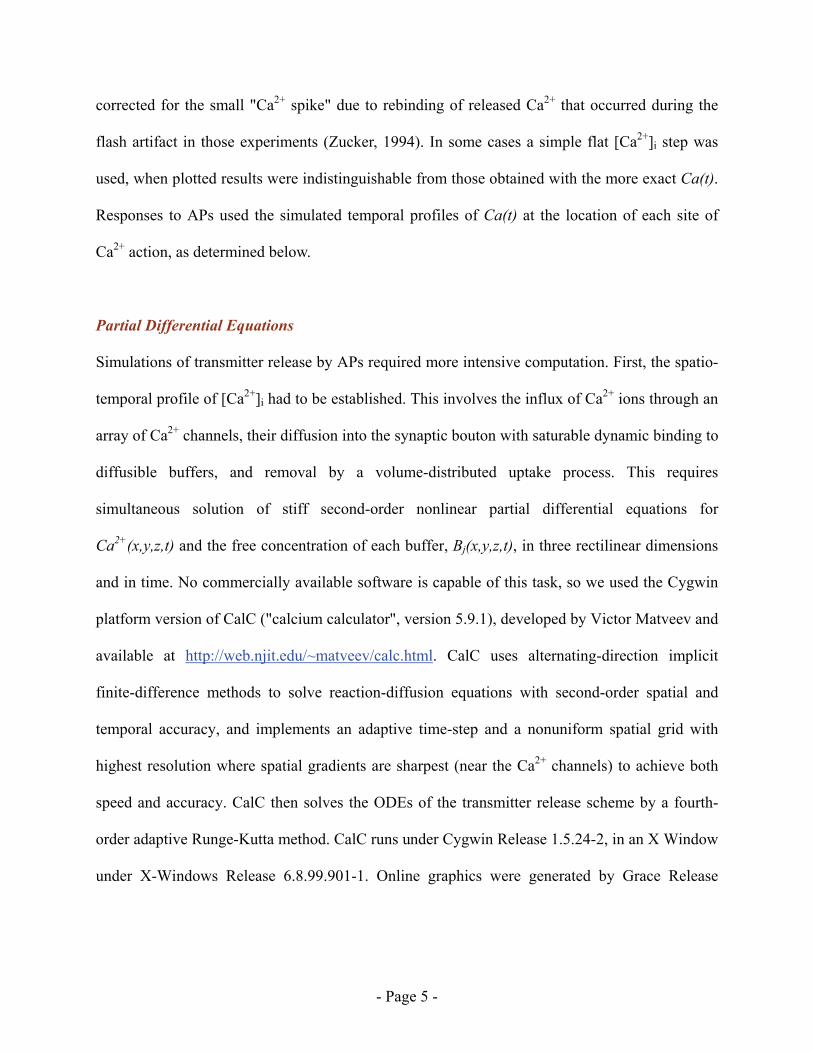
corrected for the small "Ca2+ spike" due to rebinding of released Ca2+ that occurred during the
flash artifact in those experiments (Zucker, 1994). In some cases a simple flat [Ca2+]i step was
used, when plotted results were indistinguishable from those obtained with the more exact Ca(t).
Responses to APs used the simulated temporal profiles of Ca(t) at the location of each site of
Ca2+ action, as determined below.
Partial Differential Equations
Simulations of transmitter release by APs required more intensive computation. First, the spatio-
temporal profile of [Ca2+]i had to be established. This involves the influx of Ca2+ ions through an
array of Ca2+ channels, their diffusion into the synaptic bouton with saturable dynamic binding to
diffusible buffers, and removal by a volume-distributed uptake process. This requires
simultaneous solution of stiff second-order nonlinear partial differential equations for
Ca2+(x,y,z,t) and the free concentration of each buffer, Bj(x,y,z,t), in three rectilinear dimensions
and in time. No commercially available software is capable of this task, so we used the Cygwin
platform version of CalC ("calcium calculator", version 5.9.1), developed by Victor Matveev and
available at http://web.njit.edu/~matveev/calc.html. CalC uses alternating-direction implicit
finite-difference methods to solve reaction-diffusion equations with second-order spatial and
temporal accuracy, and implements an adaptive time-step and a nonuniform spatial grid with
highest resolution where spatial gradients are sharpest (near the Ca2+ channels) to achieve both
speed and accuracy. CalC then solves the ODEs of the transmitter release scheme by a fourth-
order adaptive Runge-Kutta method. CalC runs under Cygwin Release 1.5.24-2, in an X Window
under X-Windows Release 6.8.99.901-1. Online graphics were generated by Grace Release
- Page 5 -

5.1.19. Programs were obtained from http://www.cygwin.com/, and run under Windows XP Pro
on a Dell Optiplex 745 computer with an Intel 2.4 GHz Core2 processor.
Implementation of Buffered Diffusion
Procedures for calculating the spatio-temporal [Ca2+]i profile in a presynaptic bouton were
similar to those described elsewhere (Matveev et al., 2002; 2004; 2006; Tang et al., 2000).
Briefly, we solved simultaneous diffusion-reaction equations for Ca2+ and each endogenous or
exogenous buffer species, Bj. Ca2+ was allowed to bind with first order stoichiometry at on- and
off- rates kjon and kj
off to each buffer according to
Ca2+ + Bj ↽─⇀ CaBj , (11) kj
on
kjoff
and the buffers diffused with diffusion constants Dj. Representing Bj(x,y,z,t) as Bj and Ca2+(x,y,z,t)
as Ca2+, and assuming identical diffusion of bound and unbound buffers and an initially uniform
total buffer distribution, Bjtotal, for each species, Bj
total remains uniform and CaBj = Bjtotal
– Bj at
all points, resulting in diffusion equations for each buffer of the form
jonjj
totalj
offjjj
j BCakBBkBDt
B +−−+∇=∂
∂ 22 )( . (12)
A similar equation for Ca2+ includes terms for Ca2+ influx as single channel currents ICa(t)
entering as point sources at the presynaptic membrane at loci xi,yi of the Ca2+ channels defined by
Dirac delta functions, δ(x – xi, y – yi), and for cytoplasmic uptake at rate p proportional to the
deviation from resting [Ca2+]i, Ca02+:
)(),()(21))(( 2
02
11
2222
++
==
+++
−−−−+−−+∇=∂
∂ ∑∑ CaCapyyxxtIF
BCakBBkCaDt
Cai
N
iiCa
N
jj
onjj
totalj
offjCa
channelsbuffers
δ , (13)
- Page 6 -

where F is Faraday's constant. We solved Equations 12 and 13 in a box representing ¼ of an
active zone (assuming symmetry about its center) and the area surrounding it extending 800 nm
to midway between neighboring zones, and extending to the back of the bouton. Calcium
channels were spaced evenly in a square array within the active zone region of 80 × 80 nm2 on
one face of the box. These dimensions are based on ultrastructural studies of crayfish NMJs
(Cooper et al., 1996), but since active zones cover about half the bouton surface, rather than only
1/6th, the bouton volume was reduced in most simulations to 1/3 by reducing the distance to the
back surface to 1 µm from the 3 µm typical of boutons studied to allow for more accurate
accumulation of total Ca2+ during activity.
Conditioning Trains and Recovery
For simulating responses to conditioning trains, CalC was used to solve Equations (12) and (13),
driven by ICa(t) in a train of APs, producing spatio-temporal profiles of both Ca2+(x,y,z,t) and the
endogenous buffers, and transmitter release was determined by the equations for the release
scheme and the locations of release targets. Simulation took 30 s to 2 min, depending on the
accuracy desired. Final figures used simulations with 5% accuracy or better, based on
convergence to unchanging results as time and space steps were reduced and CalC's accuracy
parameters were increased. Simulating recovery of depression or facilitation from trains required
that the conditioning train be followed at various intervals by a single test AP. Rather than repeat
the entire sequence for each test, the Ca2+ and buffer diffusion profiles from a short test interval
were saved at the moment preceding the test, and calculations for the next longer interval
proceeded from this point. This kept the time required for these simulations to between 15 and
200 min, depending on the accuracy required.
- Page 7 -

Procedures for Parameter Selection
We first chose parameters for the release scheme to fit responses to [Ca2+]i steps imposed by
photolysis of DM-nitrophen-4 (Millar et al., 2005). We began with the values of secretory trigger
parameters kon, koff, b, and γ used in that paper. The priming parameters kprime and kupr were
chosen to have similar kinetics as those in Millar et al (2005), while mobilization (kmob and kdemob)
was assumed to be slower, and the mobilization and priming rates were constrained so that the
sum of docked but unprimed vesicles (U) and primed vesicles (V) was equal to their levels in the
earlier study. At this point, all primed vesicles were assumed to be in one pool, so V and W were
made rapidly interchangeable (fast kattach and kdetach). Parameters were then modified to give the
best fit to the results of the photolysis experiments. Fit was assessed as in our previous and other
studies (Bollmann et al., 2000; Millar et al., 2005; Schneggenburger and Neher, 2000), by
plotting predicted maximum release rate, time to peak release rate from photolysis flash,
cumulative release within 30 ms of photolysis, and delay from photolysis to first quantal release,
and comparing these to plots of experimental results, for [Ca2+]i steps of varying magnitude. We
also compared the simulated time course of release to the brightest flash to the experimental
histogram of responses to that flash. Since photolysis imposes a spatially uniform rise in [Ca2+]i,
the locations of the Ca2+ sensors for mobilization, priming, and triggering release play no role in
these calculations. Figure S6 presents comparisons of such simulated responses to [Ca2+]i steps
and experimental results, but these particular simulations are not shown in that figure, because
they soon underwent further refinement.
The preliminary parameter choices for mobilization, priming, and secretion were then used in
simulations of responses to a train of APs. The first step of this calculation was to generate the
[Ca2+]i spatio-temporal profile, Ca2+(x,y,z,t), for the desired train of APs, using the geometry of a
- Page 8 -

bouton, array of Ca2+ channels, single channel current magnitude and time course, and properties
of endogenous buffers and Ca2+ uptake, that were determined as outlined in Results (Release by
APs). Sites of Ca2+ action in mobilization, priming, and release were chosen in the middle of the
ranges outlined in Results, and then these plus all release scheme parameters were subjected to
fine tuning to fit the responses to an AP train. At this point, there was still only one pool of
primed vesicles, since depression was modest and distinctions between 1-pool and 2-pool models
were insignificant. It was from such simulations that we recognized the need to make the fast
buffer not completely immobile, but rather slowly diffusible, in order to fit the behavior of
asynchronous release.
Next, Ca2+ influx was modified to represent the effects of AP broadening by Cs+, and release
and Ca2+ target location parameters were refined further to attempt to fit the depression seen in
such trains. It was at this point that the immediately releasable vesicle pool was divided into V
and W pools (comprising V vesicles detached from Ca2+ channels and therefore reluctantly
released, but recovering rapidly due to priming, and W vesicles attached to Ca2+ channels and
therefore willingly released, but recovering slowly), as determined by the initial settings of kattach
and kdetach. Finally, we simulated recovery of depression from the conditioning train. This
provided the most stringent constraints on the kinetics of mobilization, priming, and V/W
interconversion.
Once all parameter values had been selected to fit recovery from AP trains, responses to
photolysis flashes and to the successive responses in the conditioning AP train were retested, to
check that simulations with the new parameters still fit these results. Then Ca2+ influx parameters
were set back to the values appropriate for normal medium, to check that these simulations also
remained consistent with results. This led to further refinement of parameter choices, and after
- Page 9 -

several iterations of parameter refinement in simulations of responses in normal medium, to
trains and post-tetanic recovery in Cs+-Ringer, and to Ca2+ steps in photolysis experiments, we
arrived at the uniform parameter choices used for all of the simulations presented in Figures 2, 3,
and S6 for phasic synapses. These parameters gave the most satisfactory fit to the full range of
experiments, but not the best fit to any single experimental test.
The properties of the secretory trigger, endogenous buffers and uptake, and bouton geometry
from phasic synapses were used without alteration for all simulations of tonic and opener
synapses. Tonic synapses required different priming and mobilization characteristics, such that
most releasable vesicles were unprimed and not immediately available for release but could be
made available quickly in a train, and slight adjustments in locations of Ca2+ targets and V/W
conversion rates were made to get the best fits. Opener synapse parameters were generally
similar to those for tonic synapses, deviating in the direction of phasic synapses, as expected for
their intermediate behavior more similar to that of tonic synapses. Tonic and opener parameters
underwent similar rounds of refinement, so that the maximum amount of data could be explained
by a single set of parameter choices.
The need for release site refractoriness was discovered on attempting to simulate the recovery
from massive release by a prolonged AP in TEA. Once this process was adjusted to fit this data
in opener synapses, all previous opener simulations were repeated with refractoriness included,
and parameters adjusted to again explain results with a uniform set of values for all simulations
from a single class of opener synapse. When properties like facilitation in a train differed in
experiments from different studies (in particular, the slightly different facilitation seen at the
opener synapses used for fura-2 and for diazo-2 experiments), parameters were adjusted to fit
facilitation, then fixed for simulations of subsequent experimental manipulations with exogenous
- Page 10 -

buffers. A single refractoriness rate was assumed for all opener and tonic simulations, requiring
that tonic parameters again be refined to produce a uniform set including refractoriness for all
tonic simulations. Finally, a briefer refractoriness was added to phasic synapses, and all
parameters adjusted again until a single set could be used to account for all the data on phasic
synapses.
REFERENCES
Bollmann, J.H., Sakmann, B., and Borst, J.G. (2000). Calcium sensitivity of glutamate release in
a calyx-type terminal. Science 289, 953-957.
Cooper, R.L., Winslow, J.L., Govind, C.K., and Atwood, H.L. (1996). Synaptic structural
complexity as a factor enhancing probability of calcium-mediated transmitter release. J.
Neurophysiol. 75, 2451-2466.
Llinás, R. (1999). The Squid Giant Synapse. A Model for Chemical Transmission. (Oxford:
Oxford University Press).
Matveev, V., Sherman, A., and Zucker, R.S. (2002). New and corrected simulations of synaptic
facilitation. Biophys. J. 83, 1368-1373.
Matveev, V., Zucker, R.S., and Sherman, A. (2004). Facilitation through buffer saturation:
constraints on endogenous buffering properties. Biophys. J. 86, 2691-2709.
Matveev, V., Bertram, R., and Sherman, A. (2006). Residual bound Ca2+ can account for the
effects of Ca2+ buffers on synaptic facilitation. J. Neurophysiol. 96, 3389-3397.
Millar, A.G., Bradacs, H., Charlton, M.P., and Atwood, H.L. (2002). Inverse relationship
between release probability and readily releasable vesicles in depressing and facilitating
synapses. J. Neurosci. 22, 9661-9667.
- Page 11 -

- Page 12 -
Millar, A.G., Zucker, R.S., Ellis-Davies, G.C., Charlton, M.P., and Atwood, H.L. (2005).
Calcium sensitivity of neurotransmitter release differs at phasic and tonic synapses. J. Neurosci.
25, 3113-3125.
Schneggenburger, R., and Neher, E. (2000). Intracellular calcium dependence of transmitter
release rates at a fast central synapse. Nature 406, 889-893.
Tang, Y., Schlumpberger, T., Kim, T., Lueker, M., and Zucker, R.S. (2000). Effects of mobile
buffers on facilitation: experimental and computational studies. Biophys. J. 78, 2735-2751.
Zucker, R. (1994). Photorelease techniques for raising or lowering intracellular Ca2+. Meths. Cell
Biol. 40, 31-63.
Zucker, R.S., and Regehr, W.G. (2002). Short-term synaptic plasticity. Annu. Rev. Physiol. 64,
355-405.

Supplemental Figures, Tables, and Legends
Figure S1. Synchronous Evoked Release Rates at Phasic Synapses Estimated by
Deconvolution
Averaged responses to a 5-spike 100-Hz train from 100 focal extracellular recordings were
deconvolved with the averaged waveform of at least 10 isolated mEJCs at 11 synapses; 0.1 ms
bins. Time is measured from the arrival of the presynaptic AP (the negative peak of the nerve
terminal potential). A composite histogram formed from responses at all phasic synapses is also
shown (lower right).
Figure S2. Asynchronous Evoked Release Rates at Phasic Synapses
Histograms of synaptic delays to individual mEJCs in focal extracellular responses to a 5-spike
100-Hz train; 0.5 ms bins. Each panel shows number of traces used for counting quanta. Gray
bars mark periods when individual quanta are obscured by stimulus artifacts or when release is
too synchronous to discern individual quanta. A composite histogram formed from responses at
all phasic synapses is on the lower right.
Figure S3. Different Ways of Selecting and Representing Depression in Phasic Synapses
(A) Depression to 10 APs at 100 Hz in cesium Ringer from 9 synapses, showing averages of 20
trials from individual preparations in gray, with solid lines from synapses with depression
correlated with first EJC and dashed lines from synapses with no such correlation; black symbols
show means ± SDs. Blue and green lines plot 1-pool and 2-pool depletion models derived from
averaged responses of all synapses during trains and all synapses used for measuring recovery at
various times after a train.
- Page 13 -

(B) The same data as in (A), but responses for each synapse have been normalized to the first
EJP. The normalized responses were averaged and used with averages of normalized recovery
curves to generate 1-pool and 2-pool depletion models.
(C) Data from 4 synapses showing depression uncorrelated with first EJC were analyzed as in
(A), and fitted with 1- and 2-pool models based on depression of the average responses and
recovery from averaged recovery data.
(D) Data selected as in (C), but averaging normalized responses during the train, and fitting 1-
and 2-pool models to these using recovery rates derived from averaged normalized recovery
curves. In all cases, 2-pool models provide a better fit to the data.
Figure S4. Evoked Release Rates at Tonic Synapses
Histograms from 13 synapses of synaptic delays to individual mEJCs in focal extracellular
responses from 50 to 500 trials to a 5-spike 100-Hz train; 0.5 ms bins. Gray bars mark periods
obscured by stimulus artifacts. A composite histogram formed from responses at all tonic
synapses is shown on lower right.
Figure S5. Tonic Facilitation from Intracellularly Recorded EJPs
(A) Superimposed responses to one to five stimuli at 100 Hz; averages of 100 traces; line with
arrows shows measurement of 5th EJP amplitude.
(B) Four traces to a single stimulus from the same experiment, used for counting quantal
responses.
(C) Average facilitation ± SDs from 14 intracellular and 13 focal extracellular measurements.
- Page 14 -
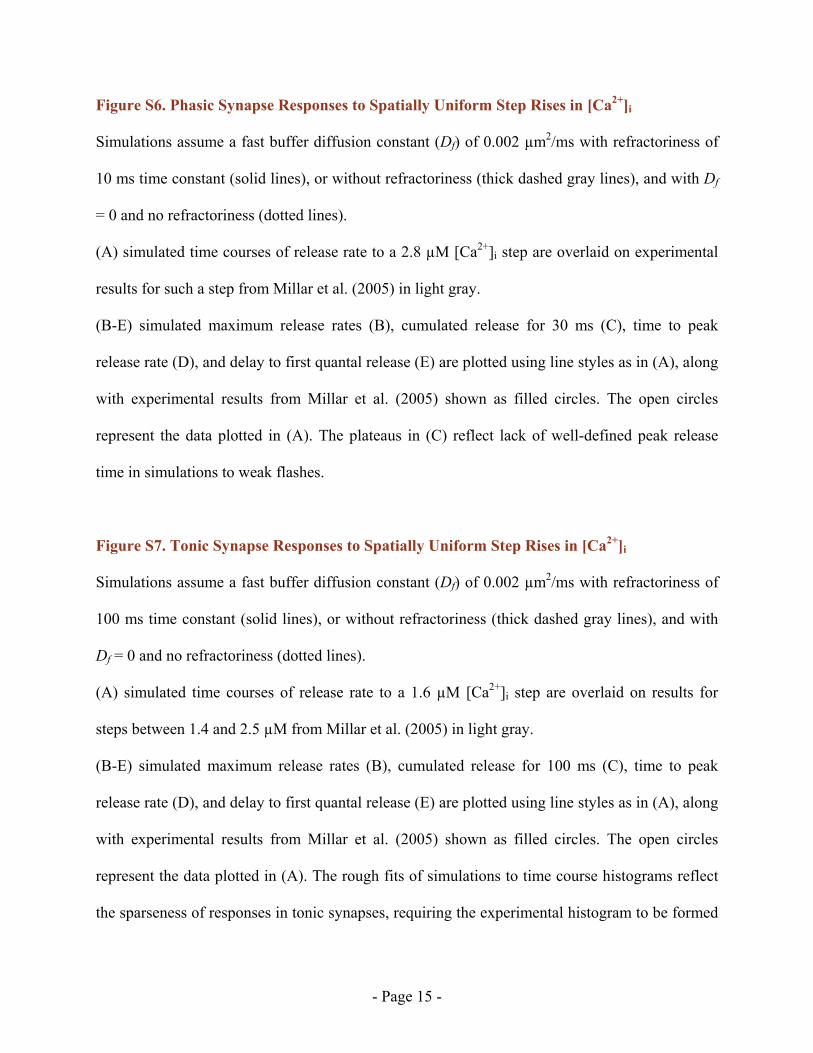
Figure S6. Phasic Synapse Responses to Spatially Uniform Step Rises in [Ca2+]i
Simulations assume a fast buffer diffusion constant (Df) of 0.002 µm2/ms with refractoriness of
10 ms time constant (solid lines), or without refractoriness (thick dashed gray lines), and with Df
= 0 and no refractoriness (dotted lines).
(A) simulated time courses of release rate to a 2.8 µM [Ca2+]i step are overlaid on experimental
results for such a step from Millar et al. (2005) in light gray.
(B-E) simulated maximum release rates (B), cumulated release for 30 ms (C), time to peak
release rate (D), and delay to first quantal release (E) are plotted using line styles as in (A), along
with experimental results from Millar et al. (2005) shown as filled circles. The open circles
represent the data plotted in (A). The plateaus in (C) reflect lack of well-defined peak release
time in simulations to weak flashes.
Figure S7. Tonic Synapse Responses to Spatially Uniform Step Rises in [Ca2+]i
Simulations assume a fast buffer diffusion constant (Df) of 0.002 µm2/ms with refractoriness of
100 ms time constant (solid lines), or without refractoriness (thick dashed gray lines), and with
Df = 0 and no refractoriness (dotted lines).
(A) simulated time courses of release rate to a 1.6 µM [Ca2+]i step are overlaid on results for
steps between 1.4 and 2.5 µM from Millar et al. (2005) in light gray.
(B-E) simulated maximum release rates (B), cumulated release for 100 ms (C), time to peak
release rate (D), and delay to first quantal release (E) are plotted using line styles as in (A), along
with experimental results from Millar et al. (2005) shown as filled circles. The open circles
represent the data plotted in (A). The rough fits of simulations to time course histograms reflect
the sparseness of responses in tonic synapses, requiring the experimental histogram to be formed
- Page 15 -

- Page 16 -
from all our data to [Ca2+]i steps above 1.4 µM. Simulated times to peak are not well defined for
weak flashes.

0 10 20 30 40 500
5
10
15
20
25
Time (ms)
Rel
ease
rate
(qua
nta/
ms)
0 10 20 30 40 500
5
10
15
20
25
Time (ms)
Rel
ease
rate
(qua
nta/
ms)
0 10 20 30 40 500
5
10
15
20
25
Time (ms)
Rel
ease
rate
(qua
nta/
ms)
0 10 20 30 40 500
5
10
15
20
25
Time (ms)
Rel
ease
rate
(qua
nta/
ms)
0 10 20 30 40 500
5
10
15
20
25
Time (ms)
Rel
ease
rate
(qua
nta/
ms)
0 10 20 30 40 500
5
10
15
20
25
Time (ms)
Rel
ease
rate
(qua
nta/
ms)
0 10 20 30 40 500
5
10
15
20
25
Time (ms)
Rel
ease
rate
(qua
nta/
ms)
0 10 20 30 40 500
5
10
15
20
25
Time (ms)
Rel
ease
rate
(qua
nta/
ms)
0 10 20 30 40 500
5
10
15
20
25
Time (ms)
Rel
ease
rate
(qua
nta/
ms)
0 10 20 30 40 500
5
10
15
20
25
Time (ms)
Rel
ease
rate
(qua
nta/
ms)
0 10 20 30 40 500
5
10
15
20
25
Time (ms)
Rel
ease
rate
(qua
nta/
ms)
0 10 20 30 40 500123456789
10
Time (ms)
Rel
ease
Rat
e (q
uant
a/m
s)
Composite
Figure S1
- Page 17 -

0 10 20 30 40 500.0
0.5
1.0
1.5
2.0
2.5
3.0
Time (ms)
mE
JP ra
te (q
uant
a/m
s)
0 10 20 30 40 500.0
0.5
1.0
1.5
2.0
2.5
3.0
Time (ms)
mE
JP ra
te (q
uant
a/m
s)
0 10 20 30 40 500.0
0.5
1.0
1.5
2.0
2.5
3.0
Time (ms)
mE
JP ra
te (q
uant
a/m
s)
0 10 20 30 40 500.0
0.5
1.0
1.5
2.0
2.5
3.0
Time (ms)
mE
JP ra
te (q
uant
a/m
s)
0 10 20 30 40 500.0
0.5
1.0
1.5
2.0
2.5
3.0
Time (ms)
mE
JP ra
te (q
uant
a/m
s)
0 10 20 30 40 500.0
0.5
1.0
1.5
2.0
2.5
3.0
Time (ms)
mE
JP ra
te (q
uant
a/m
s)
0 10 20 30 40 500.0
0.5
1.0
1.5
2.0
2.5
3.0
Time (ms)
mE
JP ra
te (q
uant
a/m
s)
0 10 20 30 40 500.0
0.5
1.0
1.5
2.0
2.5
3.0
Time (ms)
mE
JP ra
te (q
uant
a/m
s)
0 10 20 30 40 500.0
0.5
1.0
1.5
2.0
2.5
3.0
Time (ms)
mE
JP ra
te (q
uant
a/m
s)
0 10 20 30 40 500.0
0.5
1.0
1.5
2.0
2.5
3.0
Time (ms)
mE
JP ra
te (q
uant
a/m
s)
0 10 20 30 40 500.0
0.5
1.0
1.5
2.0
2.5
3.0
Time (ms)
mE
JP ra
te (q
uant
a/m
s)
0 10 20 30 40 500.00
0.25
0.50
0.75
1.00
1.25
1.50
Time (ms)
mE
JP ra
te (q
uant
a/m
s)
Composite
400 sweeps 150 sweeps 50 sweeps
190 sweeps 120 sweeps 62 sweeps
126 sweeps 104 sweeps 126 sweeps
96 sweeps 190 sweeps
Figure S2
- Page 18 -

Phasic depression(averaged responses)
0 2 4 6 8 100
5
10
15
20
25
30
Mean ± S.D. of 9 experimentsIndividual synapses:
Depression correlated with m 1Depression uncorrelated with m 1
2-pool model1-pool model
EJC number
Qua
ntal
con
tent
Phasic depression(normalized responses)
0 2 4 6 8 100.00
0.25
0.50
0.75
1.00
1.25
1.50
1.75
2.00Mean ± S.D. of 9 experimentsS.D. of EJC #1
Depression correlated with m 1Depression uncorrelated with m 1
Individual synapses:
2-pool model1-pool model
EJC numberQ
uant
al c
onte
nt
Data with depressionuncorrelated with EJC #1
0 2 4 6 8 100
4
8
12
16
20
2-pool model1-pool model
Individual synapsesMean ± S.D. (n = 4)
Simulation
Slowly released poolRapidly released pool
EJC number
Qua
ntal
con
tent
Normalized data with depressionuncorrelated with EJC #1
0 2 4 6 8 100.0
0.2
0.4
0.6
0.8
1.0
1.2
1.4
1.6
S.D. of EJC #1
2-pool model1-pool model
Mean ± S.D. (n = 4)
Simulation of total release:
Individual synapses
Detached vesiclesAttached vesicles
EJC number
Nor
mal
ized
qua
ntal
con
tent
A B
C D
Figure S3
- Page 19 -

0 10 20 30 40 500.0
0.1
0.2
0.3
0.4
0.5
0.6
0.7
0.8
Time (ms)
Rel
ease
rate
(qua
nta/
ms)
0 10 20 30 40 500.0
0.1
0.2
0.3
0.4
0.5
0.6
0.7
0.8
Time (ms)R
elea
se ra
te (q
uant
a/m
s)0 10 20 30 40 50
0.0
0.1
0.2
0.3
0.4
0.5
0.6
0.7
0.8
Time (ms)
Rel
ease
rate
(qua
nta/
ms)
0 10 20 30 40 500.0
0.1
0.2
0.3
0.4
0.5
0.6
0.7
0.8
Time (ms)
Rel
ease
rate
(qua
nta/
ms)
0 10 20 30 40 500.0
0.1
0.2
0.3
0.4
0.5
0.6
0.7
0.8
Time (ms)
Rel
ease
rate
(qua
nta/
ms)
0 10 20 30 40 500.0
0.1
0.2
0.3
0.4
0.5
0.6
0.7
0.8
Time (ms)
Rel
ease
rate
(qua
nta/
ms)
0 10 20 30 40 500.0
0.1
0.2
0.3
0.4
0.5
0.6
0.7
0.8
Time (ms)
Rel
ease
rate
(qua
nta/
ms)
0 10 20 30 40 500.0
0.1
0.2
0.3
0.4
0.5
0.6
0.7
0.8
Time (ms)
Rel
ease
rate
(qua
nta/
ms)
0 10 20 30 40 500.0
0.1
0.2
0.3
0.4
0.5
0.6
0.7
0.8
Time (ms)
Rel
ease
rate
(qua
nta/
ms)
0 10 20 30 40 500.0
0.1
0.2
0.3
0.4
0.5
0.6
0.7
0.8
Time (ms)
Rel
ease
rate
(qua
nta/
ms)
0 10 20 30 40 500.0
0.1
0.2
0.3
0.4
0.5
0.6
0.7
0.8
Time (ms)
Rel
ease
rate
(qua
nta/
ms)
0 10 20 30 40 500.0
0.1
0.2
0.3
0.4
0.5
0.6
0.7
0.8
Time (ms)
Rel
ease
rate
(qua
nta/
ms)
0 10 20 30 40 500.00
0.05
0.10
0.15
0.20
0.25
Time (ms)
Rel
ease
rate
(qua
nta/
ms)
0 10 20 30 40 500.0
0.1
0.2
0.3
0.4
0.5
0.6
0.7
0.8
Time (ms)
Rel
ease
rate
(qua
nta/
ms)
Composite
Figure S4
- Page 20 -

Figure S5
- Page 21 -

0 0.6 1.2 1.8 2.4 3[Ca] (µM)
0
5
10
15
20
25
Del
ay (m
s)
120.80.60.4
[Ca] (µM)
0.1
1
10
100
Cum
ulat
ive
rele
ase
at 3
0 m
s
0 0.6 1.2 1.8 2.4 3[Ca] (µM)
0
5
10
15
20
25
30
35
Tim
e to
pea
kre
leas
e ra
te (m
s)
120.80.60.4
[Ca] (µM)
0.01
0.1
1
10
Max
. rel
ease
rate
(qua
nta/
ms)
From Millar et al. (2005)With refractoriness DFB = 0.002 µm2/msNo refractoriness DFB = 0.002 µm2/msNo refractoriness DFB = 0
0 10 20 30 4Time (ms)
0
0
4
8
12
Rel
ease
rate
(/m
s)
[Ca2+]i step to 2.8 µM,
A
B C
D E
Figure S6
- Page 22 -

0 0.6 1.2 1.8 2.4 3[Ca] (µM)
0
15
30
45
60
75
Del
ay (m
s)
1 20.80.60.4
[Ca] (µM)
0
4
8
12
16
20
24
Cum
ulat
ive
rele
ase
at 1
00 m
s
0 0.6 1.2 1.8 2.4 3[Ca] (µM)
0
40
80
120
160
Tim
e to
pea
kre
leas
e ra
te (m
s)
1 20.80.60.4
[Ca] (µM)
1E-005
0.0001
0.001
0.01
0.1
1
Max
. rel
ease
rate
(qua
nta/
ms)
From Millar et al. (2005)Millar et al. (2005) schemeWith refractoriness DFB = 0.002 µm2/msNo refractoriness DFB = 0.002 µm2/msNo refractoriness DFB = 0
0
0.04
0.08
0.12
0.16
0.2
Rel
ease
rate
(/m
s)
0 50 100 150 200 250Time (ms)
[Ca2+]i step to 1.6 µMA
B C
D E
,
Figure S7
- Page 23 -

- Page 24 -
Table S1. Parameters Used in 1- and 2-Pool Models of Depression (Figure S3). Parameter Figure S3A Figure S3B Figure S3 C and D
(and Figure 3) 1-pool S (vesicles) 58 77 58 F 0.281 0.212 0.281 τ (ms) ( = 1/k-1) 637 637 637 2-pool SA (vesicles) 36.9 53.2 35.5 FA 0.116 0.149 0.127 τA (ms) ( = 1/kA
-1) 132 132 132 SB (vesicles) 21.1 23.8 22.5 FB 0.57 0.353 0.337 τB (s) ( = 1/kB
-1) 2.06 2.06 2.06