auditory thalamocortical synaptic transmission in vitro
TRANSCRIPT

Auditory Thalamocortical Synaptic Transmission In Vitro
SCOTT J. CRUIKSHANK, HEATHER J. ROSE, AND RAJU METHERATEDepartment of Neurobiology and Behavior, University of California, Irvine, California 92697
Received 3 July 2001; accepted in final form 5 September 2001
Cruikshank, Scott J., Heather J. Rose, and Raju Metherate.Auditory thalamocortical synaptic transmission in vitro. J Neuro-physiol 87: 361–384, 2002; 10.1152/jn.00549.2001. To facilitate anunderstanding of auditory thalamocortical mechanisms, we have de-veloped a mouse brain-slice preparation with a functional connectionbetween the ventral division of the medial geniculate (MGv) and theprimary auditory cortex (ACx). Here we present the basic character-istics of the slice in terms of physiology (intracellular and extracel-lular recordings, including current source density analysis), pharma-cology (including glutamate receptor involvement), and anatomy(gross anatomy, Nissl, parvalbumin immunocytochemistry, and tracttracing with 1,1�-dioctadecyl-3,3,3�,3�-tetramethylindocarbocyanineperchlorate). Thalamocortical transmission in this preparation (the“primary” slice) involves both �-amino-3-hydroxy-5-methylisox-azole-4-proprionic acid/kainate and N-methyl-D-aspartate-type gluta-mate receptors that appear to mediate monosynaptic inputs to layers3-4 of ACx. MGv stimulation also initiates disynaptic inhibitorypostsynaptic potentials and longer-duration intracortical, polysynapticactivity. Important differences between responses elicited by MGvversus conventional columnar (“on-beam”) stimulation emphasize thenecessity of thalamic activation to infer thalamocortical mechanisms.We also introduce a second slice preparation, the “shell” slice, ob-tained from the brain region immediately ventral to the primary slice,that may contain a nonprimary thalamocortical pathway to temporalcortex. In the shell slice, stimulation of the thalamus or the regionimmediately ventral to it appears to produce fast activation of syn-apses in cortical layer 1 followed by robust intracortical polysynapticactivity. The layer 1 responses may result from orthodromic activationof nonprimary thalamocortical pathways; however, a plausible alter-native could involve antidromic activation of corticotectal neuronsand their layer 1 collaterals. The primary and shell slices will provideuseful tools to investigate mechanisms of information processing inthe ACx.
I N T R O D U C T I O N
The auditory cortex (ACx) integrates and processes infor-mation carried along thalamocortical pathways to perform itsmajor functions (for reviews, see de Ribaupierre 1997; Ehret1997; Phillips 1995). Much is known about auditory thalamo-cortical pathways from anatomical and physiological studies.The main input to ACx is the primary thalamocortical pathway(often referred to as the lemniscal pathway) that projects fromthe ventral division of the medial geniculate (MGv) to themiddle layers of primary ACx (Caviness and Frost 1980;Romanski and LeDoux 1993; Willard and Ryugo 1983; re-viewed in Winer 1992). Physiological recordings from MGvand ACx indicate that this pathway mediates short-latency
responses to acoustic stimuli and carries precise informationabout stimulus frequency, intensity, and timing (thalamus:Bordi and LeDoux 1994; Calford 1983; Edeline et al. 1999;Lennartz and Weinberger 1992; ACx reviewed in: de Ribaupi-erre 1997; Eggermont 1998; Ehret 1997). There are also non-primary thalamocortical pathways (referred to as nonlemniscalor adjunct), including projections from the dorsal and medialdivisions of the MG (MGd, MGm), the peripeduncular nu-cleus, and other nonprimary thalamic nuclei (Arnault andRoger 1990; Clerici and Coleman 1990; Herkenham 1980;LeDoux et al. 1985; Linke and Schwegler 2000; Ryugo andKillackey 1974). Typically these projections target superficiallayers of temporal cortex. Responses of nonprimary thalamiccells tend to be weaker, have longer latencies, and more vari-ability than MGv (Allon et al. 1981; Bordi and LeDoux 1994;Calford 1983; Edeline et al. 1999; Lennartz and Weinberger1992), so their influence on cortex is expected to be moresubtle (discussed in McGee et al. 1992; Sukov and Barth 2001;Weinberger 1995). Thus ACx function depends on the integra-tion of both primary and nonprimary inputs.
Despite a large number of anatomical and physiologicalstudies, very little is known about the cellular and synapticmechanisms by which thalamic inputs are transmitted to, andprocessed in, ACx. Some progress has been made using in vivointracellular recordings (e.g., Metherate and Ashe 1993; Mitaniand Shimokouchi 1985; Sukov and Barth 2001), but suchstudies are hampered by the difficulty of making precise elec-trophysiological and pharmacological measurements in vivo.Yet detailed intracellular information must be obtained toaddress even seemingly simple questions such as how synapticintegration produces neuronal receptive fields. Brain-slicepreparations offer an ideal environment to make precise intra-cellular and pharmacological manipulations, and considerableinformation has been obtained from ACx slices (Buonomanoand Merzenich 1998; Hefti and Smith 2000; Kudoh and Shi-buki 1997; Metherate and Ashe 1994). Nonetheless, the issueof thalamocortical processing has not been addressed directlybecause thalamocortical axons are severed during the prepara-tion of conventional (coronal) slices and thus cannot be stim-ulated selectively.
To address similar problems in the somatosensory system,Agmon and Connors (1991) developed a slice preparation thatmaintained connections from the ventrobasal complex to barrelcortex. Since its development, that preparation has been ap-plied to numerous issues fundamental to the understanding ofthalamocortical processing in the somatosensory system. Theseinclude determining which cortical cells, as defined by posi-tion, morphology, and intrinsic properties, receive direct tha-lamic input (Agmon and Connors 1992; Gibson et al. 1999;
Address for reprint requests: R. Metherate, Dept. of Neurobiology andBehavior, University of California, 2205 Biological Sciences II, Irvine, CA92697-4550 (E-mail: [email protected]).
J Neurophysiol87: 361–384, 2002; 10.1152/jn.00549.2001.
3610022-3077/02 $5.00 Copyright © 2002 The American Physiological Societywww.jn.org

Porter et al. 2001); what transmitters mediate thalamocorticaltransmission (Gil and Amitai 1996a); functional differencesbetween intracortical and thalamocortical synapses (Gil andAmitai 1996b; Gil et al. 1997, 1999); and mechanisms ofsynaptic plasticity (reviewed in Castro-Alamancos and Con-nors 1997; Feldman et al. 1999).
To facilitate similar progress in the understanding of audi-tory forebrain mechanisms, we have developed a brain-slicepreparation that maintains an intact auditory thalamocorticalpathway. In initial studies using slices from rat and mouse, wedemonstrated the likely feasibility of such a preparation byshowing that stimulation within the thalamus or thalamocorti-cal pathway could elicit cortical responses (Metherate andCruikshank 1999). More recently, we have focused on themouse brain because its smaller size permits more intact con-nections within a slice and for future transgenic studies. Wehave substantially refined the preparation to the point that wecan reliably identify and study the primary auditory thalamo-cortical pathway in vitro. The present study represents anextensive anatomical and physiological characterization of thismore refined preparation. We also introduce a second slicepreparation, obtained from the area immediately ventral to theprimary preparation, that may contain a nonprimary pathway.Several features of this second preparation are characterizedand contrasted with those of the primary preparation. Portionsof this study have appeared in abstract form (Cruikshank et al.1999).
M E T H O D S
Preparation of slices
All procedures followed the University of California, Irvine, ani-mal-use regulations. Slices were taken from postnatal day (P)13–P19FVB mice and maintained in vitro. Slice planes were nearly horizon-tal, but with the lateral end typically raised 15°, as illustrated in Fig.1A. This plane was chosen so that thalamocortical axons, and parts ofthe MGv and ACx, could all be obtained within a single slice (Fig. 1).
Following decapitation under halothane anesthesia, brains wererapidly removed and placed in 0–4°C artificial cerebrospinal fluid(ACSF; in mM: 125 NaCl, 2.5 KCl, 1.25 KH2PO4, 25 NaHCO3, 1.2MgSO4, 2 CaCl2, and 10 dextrose; bubbled with 95% O2-5% CO2).Before slicing, the brains were blocked by making three cuts with ahandheld razor blade while submerged in cold ACSF. First the ante-rior 25% of the brain was removed with a coronal cut. The remainingbrain block was then propped forward to rest on its cut surface, and asecond cut was made in a nearly horizontal plane (but �15° medial/lateral slant), which split the brain into dorsal and ventral portions.The dorsal portion was discarded, then the ventral portion was liftedfrom the ACSF and glued to the stage of a Vibroslice with its freshlycut surface facing down (i.e., dorsal surface down; Vibroslice fromCampden, WPI; glue was Superglue, WPI). The glued brain block wasimmediately re-immersed in cold ACSF, and a third blocking cut wasmade, this time midsagitally, thus separating the left and right hemi-spheres.
The 15° slant on the second cut caused a greater portion of one ofthe hemispheres to remain intact (usually the left); it was this moreintact hemisphere that was set to face the Vibroslice blade and fromwhich slices were taken for recording. However, the “unused” hemi-sphere was also kept glued in place for support during slicing. Sliceswere cut in 400–600 �m sections starting near the ventral surface ofthe brain. As the region below the MG and ACx became visible, sliceswere retained, and placed either in the recording chamber or a holdingchamber filled with ACSF at room temperature. Generally two to four
slices were examined under a dissecting microscope (in recordingchamber) to determine if they were in appropriate planes. If correctlyblocked and sectioned, there would ultimately be two useful slices perbrain (the “primary slice” and the “shell slice:” Fig. 1), each of whichhad distinct physiology and anatomy as presented in RESULTS.
In initial experiments (n � 29 slices), slices were cut at 600 �M, toensure a high probability of intact thalamocortical connections. How-ever, in later experiments, after learning more about the pathwaytrajectory, slice thickness was successfully reduced to 500 �M (n �
FIG. 1. Anatomical positions of the primary and shell slices. A: drawing onright shows schematic of coronal mouse brain section at level of medialgeniculate (MG) and auditory cortex (adapted from Franklin and Paxinos1997). The ventral MG (MGv, black) is surrounded by a shell of nonprimaryauditory nuclei (gray). Likewise, primary auditory cortex (ACx, black—alsoindicated by asterisk) is bordered dorsally and ventrally by nonprimary audi-tory cortical areas (gray). The dotted line shows the approximate 15° angle thatallows both MGv and ACx to be obtained within a slice. A, left: the lefthemisphere of an actual mouse brain, viewed from the front, illustrating theplanes of the primary and shell slices; they are 600 �M thick, and cut at aboutthe angle indicated in the adjacent drawing. Orientation: lateral toward right,dorsal toward top. B: same hemisphere as in A but viewed from lateral side.Orientation: anterior toward left, dorsal toward top. C: same as B except thecortex was dissected away, revealing midbrain and thalamic structures (SC,superior colliculus; IC, inferior colliculus). MG is visible, and its bottom30–50% appears to be within the primary slice. Shell slice is below MG. Thestructure immediately anterior to MG is the lateral geniculate (LG). D and E:the primary and shell slices are laid down flat and viewed from the dorsal side(as in recording chamber). Orientation: anterior is toward left, lateral is towardbottom. Typical recording sites in the middle layers of temporal cortex areindicated by asterisks. The MGv (in primary slice) and a typical position forshell stimulation (in shell slice) are indicated by arrows. Dashed rectanglesindicate approximate areas of the fluorescent images in Figs. 8, A1 and B1(primary), and 10, A1 and B1 (shell).
362 S. J. CRUIKSHANK, H. J. ROSE, AND R. METHERATE
J Neurophysiol • VOL 87 • JANUARY 2002 • www.jn.org

38; also n � 2 @ 400 �M), thus improving chances of maintaininghealthy preparations.
Electrophysiology
Recordings took place in an interface chamber (Haas model, MedSystems) maintained at 34°C, with a liberal flow of warmed humid-ified gas (95% O2-5% CO2) and ACSF passing over the slices. Aninitial incubation period of 1–2 h preceded data acquisition.
Sharp intracellular recording microelectrodes were pulled fromfilamented glass (1.0 mm OD; A-M Systems) on a horizontal puller(p97, Sutter Instruments) and had resistances of 60–140 M� whenfilled with 3 M K-acetate (�10 mM HEPES buffer, pH 7.3). Extra-cellular recording microelectrodes were also pulled from filamentedglass (1.5 mm OD; A-M Systems), on the same puller, and hadresistances of 0.5–5.0 M� when filled with ACSF. Neural signalswere amplified (CyberAmp AT-401 and Axoclamp 2B, Axon Instru-ments), monitored on oscilloscope (Tektronix), then digitized (5–20kHz) and stored on computer (PowerMac, Apple Computer). Extra-cellular electrical stimuli (0.1–0.2 ms, 1–325 �A) were delivered viaconcentric bipolar electrodes (Ultrasmall, 25 �M inner core, 200 �Moverall diameter, F. Haer) and a constant current isolation unit (AxonInstruments). Control of experiments and off-line analysis were donewith computers (AxoData and AxoGraph, Axon Instruments; Power-Mac, Apple Computer).
Stimulation and recording sites were visualized with a dissectingmicroscope (Fig. 1, D and E). Stimuli were delivered to the MG(primary slice, Fig. 1D) or the region ventral to the MG (shell slice,Fig. 1E, indicated by arrow). Responses were recorded in temporalcortex, from the cortical column with the largest extracellular re-sponse in layer 4 (i.e., the “focus”—see Laminar response profile ofprimary slice is dominated by middle layer CSD sink). Intracellularrecordings were mainly in layers 3–4 (30–50% of the distance fromthe pia to the white matter; asterisks in Fig. 1, D and E), andsimultaneous extracellular recordings were usually in layers 3–4 forthe primary slice, and layer 1 for the shell slice (�250 �M lateraldistance between intra- and extracellular sites in layers 3–4). Todetermine the laminar locations of current sinks and sources, one-dimensional current source density (CSD) analysis was performed(Agmon and Connors 1991; Johnston and Wu 1995; Mitzdorf 1985).First, extracellular responses were recorded at evenly spaced locations(either 125 or 150 �M spacing) beginning two positions above the piaand ending either in the deep cortical layers or below layer 6. TheCSD value for a given location (at a given time point) was thencalculated by subtracting twice the voltage at that location from thesum of the voltages at the two nearest locations and dividing the resultby the square of the distance separating recording sites.
To test for the roles of glutamate receptors in evoked responses, theN-methyl-D-aspartate (NMDA) receptor antagonist DL-2-amino-5-phosphonopentanoic acid (APV; 50 �M) and the �-amino-3-hydroxy-5-methylisoxazole-4-proprionic acid/kainate (AMPA/KA) receptorantagonist 6-cyano-7-nitroquinoxaline-2, 3-dione (CNQX, 20 �M)were applied to the bath (both drugs from Research BiochemicalsInternational). CNQX stock solution included dimethyl sulfoxide(DMSO; final concentration 0.4%). In experiments designed to blocksynaptic transmission, Ca2� concentration in the ACSF was reducedand replaced with Mg2� (“low calcium,” in mM: 0.2 CaCl2 and 3.0MgSO4, all other salts the same as normal ACSF). In experimentsdesigned to selectively suppress polysynaptic responses (see INTRA-CELLULAR RECORDINGS IN LAYERS 3–4 OF THE PRIMARY SLICE REVEAL
CONSISTENT EARLY RESPONSE AND MORE IRREGULAR LATE POLYSYNAPTIC
RESPONSE), ACSF with high concentrations of divalent cations wasused (“high divalent ACSF”; in mM: 115 NaCl, 2.5 KCl, 25 NaHCO3,4.2 MgCl2, 7 CaCl2, and 10 dextrose). Besides the adjustments inCa2� and Mg2� concentrations (which were 3.5 times normal values),sulfates and phosphates were also left out to prevent Ca2� precipita-
tion (Crepel and Ben-Ari 1996; Luhmann and Prince 1990), and NaClwas reduced to maintain osmolarity (see preceding text).
AnatomyFIXATION AND SECTIONING OF RECORDED SLICES. To examine theexact planes of section, some slices were processed for either Nisslstaining or parvalbumin (PV) immunohistochemistry after electro-physiological recording (described in RESULTS). For both types oflabeling, whole slices were first fixed by immersion in 4% parafor-maldehyde (in 0.1 M Na-phosphate buffer: PB, pH 7.2) for �12 h,then sectioned on a vibratome at 50 �M.
PV IMMUNOHISTOCHEMISTRY. PV procedures were carried out withfree-floating sections at room temperature with agitation, exceptwhere specified. Sections were pretreated for 30 min in 0.5% H2O2,rinsed in phosphate-buffered saline (PBS; pH 7.15; 0.1 M PB, 0.5 MNaCl) containing 0.1% Tween 20, then incubated for 2 h in PBScontaining 0.3% Triton X-100. Next, nonspecific sites were blockedusing an Avidin/Biotin Blocking Kit (Vector Labs), followed byimmersion in 10% horse normal serum for 2 h (HNS, Vector Labs).Sections were then incubated at 4°C for 12–48 h in a combinedantibody solution (to reduce background staining) (Hierck et al. 1994)containing a 1:500 dilution of monoclonal PV antibodies (pa-235,Sigma), a 1:500 dilution of biotinylated anti-mouse IgG (VectorLabs), 0.1 M PB, 0.5 M NaCl, 0.3% Triton X-100, 2% HNS, and 0.1%mouse normal serum (MNS, Sigma). Standard peroxidase visualiza-tion followed. Briefly, sections were rinsed in PBS containing 0.1%Tween-20, incubated in Avidin/Biotin complex for 2 h (VectastainElite ABC-Peroxidase Kit, Vector Labs), rinsed again in PBS, then in0.05 M Tris buffer (TB; pH 8.0). Next they were preincubated innickel/DAB solution (0.3% nickel ammonium sulfate, 0.033% diami-nobenzidine, TB), then reacted for 2–5 min by adding H2O2 (0.01%).Following rinses in TB and 0.1 M PB, sections were mounted ongelatin-coated slides, air dried, dehydrated with increasing concentra-tions of alcohol, cleared with Histo-Clear (National Diagnostics), andcoverslipped using Permount (Fisher).
NISSL STAINING. In the Nissl material, after sectioning at 50 �M(see preceding text), tissue was rinsed in 0.05 M PB, mounted ongelatin-coated slides, then air dried for 12–36 h. Next, the slide-boundsections were immersed for 2–24 h in a solution of 50% chloroformand 50% alcohol, rehydrated in descending concentrations of alcoholin H2O, then immersed in 0.06% cresyl violet stain (0.6 mg/ml cresylviolet acetate, 0.72 mg/ml Na-acetate, 4.9 �l/ml 1 N acetic acid,H2O—usually 300 ml) for �5 min, followed by 30 s of rinsing inH2O. After that, the tissue was dehydrated, cleared, and coverslippedas described for the immunoreacted tissue (see preceding text), exceptthat acetic acid was added to the 95% alcohol dehydration step toaccelerate differentiation of the cresyl violet stain (0.5 ml glacialacetic per 200 ml alcohol solution).
FIXATION AND SECTIONING OF WHOLE BRAINS. To compare Nissland PV patterns in the coronal plane, sections were cut from wholefixed brains. Under deep anesthesia [50–100 mg/kg pentobarbitalsodium (Nembutal)], mice were transcardially perfused with 0.9%saline until most visible blood was flushed from the animal, then with4% paraformaldehyde (see preceding text) for �10 min. Solutionswere 4–8°C and perfused at 10–15 ml/minute using a peristalticpump (Fisher). The brains were postfixed overnight at 4°C (samefixative), embedded in 3% agarose (to increase stability during sec-tioning), then sectioned on a vibratome at 50 �M in the coronal plane.Every third section was Nissl stained (see preceding text), and adja-cent sections were immunoreacted for PV (see preceding text) andcalbindin (not shown).
TRACT TRACING WITH Di-I. The fluorescent lipophilic tracer 1,1�-dioctadecyl-3,3,3�,3�-tetramethylindocarbocyanine perchlorate (Di-I;D-282, Molecular Probes) was used to examine fiber pathways inpreviously recorded primary and shell slices and in some whole
363AUDITORY THALAMOCORTICAL SYNAPTIC TRANSMISSION IN VITRO
J Neurophysiol • VOL 87 • JANUARY 2002 • www.jn.org

364 S. J. CRUIKSHANK, H. J. ROSE, AND R. METHERATE
J Neurophysiol • VOL 87 • JANUARY 2002 • www.jn.org

brains. First the slices and brains were fixed by immersion andperfusion respectively (described in the preceding text), then allowedto postfix �2 days. Next, 25- to 100-�M-diam particles of Di-I wereinserted into targets in the still intact slices and brains under adissecting microscope, using a broken micropipette to manipulate theDi-I (targets indicated in RESULTS). The slices or brains were thenplaced in small plastic cups and covered in warm liquid agarose (3%)that was made with PB containing 0.1% sodium azide. After theagarose hardened, the cups were filled to the top with PB (including0.1% sodium azide), sealed with parafilm, and placed in the dark at30–38°C for 1–4 mo to permit Di-I diffusion. The slices or brainswere subsequently sectioned on a vibratome at 50 �M (for wholebrains, sectioning was in horizontal plane), rinsed in PB, thenmounted on gelatin-coated slides, and coverslipped with Vectashieldmounting medium (Vector Laboratories).
SLICE PLANE EXAMINATION IN UNSTAINED WHOLE BRAINS. Tocompare the slice planes to the positions of the MG and othermacroscopic features, six brains were fixed by perfusion (see preced-ing text) and cut on a vibratome in the planes normally used forphysiological experiments. For clarity, no blocking was done so thatthe slice planes could be seen in the context of the whole brains. Forthe same reason, only three cuts were made on the vibratome: one cutseparated the dorsal part of the brain from the primary slice, a secondseparated the primary and shell slices, and a third separated the shellslice and the ventral part of the brain (Fig. 1). The slice thicknesseswere 600 �M and were in the approximate planes of physiologicallyrecorded primary and shell slices, based on positions and appearancesof structures contained within them (Fig. 1, D and E).
MICROSCOPY AND IMAGE ACQUISITION. The Nissl and PV labelingpatterns were examined using standard bright-field microscopy at avariety of magnifications (�25–1,000), and images were capturedwith a digital camera (SPOT, Diagnostic Instruments) attached to anOlympus microscope. Di-I labeling was examined using epifluores-cence microscopes, again at a variety of magnifications, and imageswere captured with digital cameras (Zeiss and Olympus). Photographsof the unstained tissue (Fig. 1) were taken using a Polaroid camera(MicroCam) fitted to a dissecting microscope (WPI), then the photoprints were digitized with a scanner (Color OneScanner, Apple Com-puter).
For the most part, we adopted the auditory forebrain divisions of theFranklin and Paxinos (1997) mouse atlas. These divisions are ingeneral agreement with others (mouse: Caviness 1975; Willard andRyugo 1983; Wree et al. 1983; rat: LeDoux et al. 1987; Winer et al.1999) and our own anatomical studies in the mouse (Cruikshank et al.2001).
R E S U L T S
As indicated in METHODS, when the mouse brain was cutalong the near horizontal plane illustrated in Fig. 1, A and B,
two distinct slice preparations could be obtained, each withunique physiological properties. The dorsal-most of these willbe referred to as the “primary slice,” and the more ventral willbe called the “shell slice” (Fig. 1). Initially, the two prepara-tions were distinguished based on gross anatomical featuresand by relating these features to the effective stimulation lociand cortical responses profiles. For example, in the unstainedprimary slice, the MG can be seen directly, and the lateralgeniculate (LG), hippocampus, striatum, and other structureshave characteristic shapes (Fig. 1D). When the MG is stimu-lated in a living primary slice, it results in a strong middle layerresponse in auditory cortex (described in the following text).The shell slice, and the structures contained within it, also havecharacteristic shapes. For example, the hippocampus is widerin the medial-lateral direction, giving it a more rounded ap-pearance (Fig. 1E). More importantly, the shell slice is locatedin a sufficiently ventral plane that it contains no obvious MGnucleus. Thus in the shell slice, the region just medial to thehippocampus (indicated by an arrow in Fig. 1E) corresponds tothe area ventral to the MG nucleus. Stimulation of this regionconsistently results in an upper layer current sink in temporalcortex (described in the following text), contrasting with themiddle layer sink produced by MG stimulation in the primaryslice.
Primary slice
ANATOMICAL FEATURES: PRIMARY SLICE CONTAINS MGV AND
ACX. Figure 1C provides a lateral view of the mouse brainwith part of the neocortex and hippocampus dissected away tofacilitate comparison between the positions of the slices andthe MG as a whole. The MG appears as a rounded protuber-ance posterior to the LG and ventral to the superior colliculus(SC). Notice that the primary slice contains the bottom 30–50% of the visible portion of the MG, which mostly consists ofthe core ventral division of the MG (MGv). Given that theslicing angle was chosen to obtain both the MGv and ACxwithin the same plane (Fig. 1A, right; see METHODS), it wouldseem logical that primary slices that contain the MGv wouldalso contain primary ACx. These observed and inferred fea-tures of the primary slice, combined with its distinct middlelayer response profile, are consistent with the known projectionof the MGv to middle layers of primary auditory cortex (Cavi-ness and Frost 1980; Romanski and LeDoux 1993; Willard andRyugo 1983; reviewed in Winer 1992).
Further direct anatomical information was also determined
FIG. 2. Parvalbumin (PV) immunohistochemistry facilitates localization of auditory forebrain structures in thalamocorticalslices. A: Nissl-stained coronal section (50 �M thick). Many structures within and surrounding the auditory thalamus can bedifferentiated in coronal plane using cytoarchitecture. The label “auditory cortex” is centered on approximate position of primaryACx. It is bordered dorsally and ventrally by nonprimary (“belt”) areas (as indicated in Fig. 1A) (Franklin and Paxinos 1997).Besides position, primary ACx was identified by its more laminated cytoarchitecture (dense cell packing in layers 2–4 and 6, sparsein layer 5) than adjacent nonprimary areas, and the PV pattern (following text) (Cruikshank et al. 2001). Orientation: lateral towardleft, dorsal toward top. B: PV pattern in section adjacent to A. Notice the dense PV labeling in MGv and sharp boundary along itsventral border (e.g., PP is virtually white). There is also dense and laminated PV labeling at the apparent position of primary ACx.The adjacent cortical areas have weaker PV labeling (e.g., region ventral to primary ACx but dorsal to rf has only lightly labeledsomata). More ventrally, the perirhinal cortex (surrounding rf) has virtually no PV labeling. White lines in B (labeled 1–3) indicatethe approximate planes of sections in C, 1–3. C: a primary thalamocortical slice was sectioned into 50-�M segments and PVimmunolabeled. Orientation: anterior is toward left, lateral is toward bottom. The section in 1 was 100 �M from dorsal surface ofslice, section 3 was the most ventral section of slice, section 2 was 50 �M above section 3. PV-immunopositive MGv is presentin sections 1 and 2 but not 3. ACx expressed dense and laminated PV labeling in all 3 sections. Further described in RESULTS. APT,anterior pretectal nucleus; cp, cerebral peduncle; LG, lateral geniculate; MGd, dorsal division of MG; MGm, medial division ofMG; PIN, posterior intralaminar nucleus; PP peripeduncular nucleus; rf, rhinal fissure; RT, reticular thalamic nucleus; SN,substantia nigra; str, superior thalamic radiation; VB, ventrobasal complex.
365AUDITORY THALAMOCORTICAL SYNAPTIC TRANSMISSION IN VITRO
J Neurophysiol • VOL 87 • JANUARY 2002 • www.jn.org

histologically. After physiological recording and classification,the tissue was processed for Nissl staining or parvalbumin (PV)immunohistochemistry (see METHODS), and attempts were madeto determine the locations of the tops and bottoms of each slicewith respect to thalamic and cortical boundaries. Prior to usingthe immunohistochemical methods on the near-horizontalslices required for the recordings, the PV pattern was firstexamined in the more conventional coronal plane to determinethe relationship between regional boundaries and the PV pat-tern (n � 3). Adjacent sections processed for PV and Nisslwere directly compared. This is illustrated in Fig. 2, A and B,for a P16 mouse brain. It is obvious that PV labeling is verydense in the MGv and substantially lighter in surroundingsubdivisions. Especially noteworthy is the sharp boundary onthe ventral border of the MGv. Figure 2B also shows a distinctcortical pattern; there is a relatively strong and laminatedpattern of PV labeling in the primary auditory cortex, weakerlabeling dorsally and ventrally in the adjacent nonprimaryareas, and virtually no labeling more ventrally, in the cortexsurrounding the rhinal fissure (Fig. 2B). A detailed descriptionof the PV expression pattern within the auditory forebrain ofthe adult mouse has recently been presented (Cruikshank et al.2001). The juvenile pattern is generally similar except there is lessoverall expression throughout most parts of the brain, and agreater contrast between primary and nonprimary areas thatemerges from an earlier development of PV expression in theprimary areas (del Rio et al. 1994; Frassoni et al. 1991; reviewedin Hof et al. 1999). The latter makes the PV pattern especiallyuseful for localization in the recorded juvenile slices.
Figure 2C provides an example of a 600-�m-thick recordedprimary slice that was resectioned at 50 �M and processed forPV immunohistochemistry. The arrangement of the sections inrelation to the original recorded slice is as follows: section 1was 100 �M from the top of the slice (dorsal side up inrecording chamber), section 3 was the bottom section of theslice, and section 2 was 50 �M above section 3. The approx-imate planes of the sections are depicted by the white lines(labeled 1–3) in Fig. 2B. Note that there is an intensely immu-nopositive MGv in section 1 but no labeled MGv in section 3.Importantly, section 2, which was just 50 �M from section 3,clearly contains an immunopositive MGv. Thus the PV stain-ing provides for precise localization of the ventral border of theMGv within the recorded slices. Another important feature isthe relatively intense and laminated labeling in the auditorycortex for all three sections of Fig. 2C, indicating that thisparticular slice likely contained primary ACx throughout itsthickness. In more ventral sections from other slices, the cor-tical PV labeling was both less intense and less laminated,presumably reflecting a position in the ventral belt region ofauditory cortex, between the primary area and rhinal fissure(Fig. 2B).
Although the PV labeling provided greater precision than theNissl staining, the overall findings using the two methods wereconsistent and are presented together (primary slices: n � 13PV, n � 3 Nissl). The top of the primary slice always containedat least part of the MGv (16/16), and the bottom of the primaryslice nearly always reached below the MGv (14/16). Thebottom usually ended in the PPD region but sometimes went aslow as the substantia nigra (4/16). In terms of the cortex, thetops of the primary slices were always well laminated (16/16)with clear cellular PV labeling (13/13), consistent with a loca-
tion in primary auditory cortex. For the majority of cases, thecortical PV labeling became weaker and less laminated in theventral sections (9/13), suggesting that the bottom of the slicesmight contain nonprimary ACx. Nonetheless, there was alwayssome clear cellular labeling in the PV material even in the mostventral sections of the primary slice, indicating a locationabove the perirhinal area (Fig. 2B). The cortical findings fromthe three Nissl slices are consistent with this conclusion.
LAMINAR RESPONSE PROFILE OF PRIMARY SLICE IS DOMINATED
BY MIDDLE LAYER CSD SINK. The dominant feature of thecortical response to MG stimulation in the primary slice is arobust negative field potential and associated CSD sink inlayers 3–4. The example in Fig. 3A illustrates this and othertypical features of the laminar response. In an initial procedure,the cortex was “mapped,” by moving the electrode horizontallywithin layer 4, until finding the anterior-posterior position withthe largest fast negative field potential evoked by MG stimu-lation (i.e., the “focus” of the response). The laminar profilewas then determined for the cortical column corresponding tothat focus by recording extracellular responses in evenlyspaced intervals. Figure 3A1 shows the field potentials andCSD traces resulting from that procedure, conducted in normalACSF. Following a 100-�A MG stimulus, the largest negativefield potential and CSD sink (upward deflection) were recordedat 450 �M from the pia surface (total cortical thickness was1,275 �M; Fig. 3A). Besides the large middle layer sink, theslice also displayed clear supragranular and infragranular CSDsources (downward deflections) at 150–300 and 750 �M,respectively. In addition, there was a small sink on the corticalsurface.
The gray-scale plot in Fig. 3A1 is a representation of the fastportion of the laminar CSD data. The areas under the “raw”CSD traces on the left were measured (initial 20 ms afterstimulation), converted to gray values, then plotted at theappropriate cortical depths. Notice that the darkest valuescorrespond with the largest sinks, and lightest values corre-spond with largest sources (scale in Fig. 3B). This example isreplotted in Fig. 3B (arrow), along with 21 other gray-scaleplots prepared in the same manner. Each represents the CSDprofile from a single slice. They are arranged according torecording date and include all of the primary slices for whichlaminar analysis was carried out. The length of the bars arenormalized to the total cortical thickness (mean thickness was1,295 12 �M; range �1,205–1,400). Notice that the positionof the major sinks are relatively consistent, with the centersfalling between 24 and 50% of the distance from pia to whitematter (mean � 38.8 1.4%; Fig. 3B). The main sinksspanned one to three consecutive recording positions (mean �2.0 0.2 positions; spacing 125–150 �M), which is reflectedin the different thicknesses of the dark bands (Fig. 3B).
Thus Fig. 3B shows that all 22 slices had a dominant sink inlayers 3–4. More subtle features of the CSD results may not beapparent in the plot and will be briefly mentioned. First, for anumber of slices there were clear secondary sinks locatedeither on the cortical surface (6/22) or in infragranular layers(10/22) that were spatially separate from the main middle layersink (mean infragranular sink location � 72.8 2.0% ofdistance between pia and white matter). Second, nearly allslices (21/22) had both supragranular and infragranularsources, which generally abutted directly against the main
366 S. J. CRUIKSHANK, H. J. ROSE, AND R. METHERATE
J Neurophysiol • VOL 87 • JANUARY 2002 • www.jn.org

middle layer sink. Third, in 7/22 cases there was a deepinfragranular source, clearly separate from the main infra-granular source, located 84.8 1.9% of distance from pia towhite matter.
The mean onset latency for the main CSD sink was 4.1 0.3 ms, whereas the mean infragranular sink latency wasslightly shorter (3.9 0.4 ms), while the mean supragranularlatency was slightly longer (4.7 0.4 ms). These latencydifferences are roughly proportional to the differences in theircorresponding depths and might simply relate to the conduc-tion time required for afferent inputs to reach them; infragranu-lar was closest to the cortical border, supragranular was fur-thest, and granular was between. Thus the three sinks might allrepresent direct monosynaptic responses despite the supra-granular latency being significantly longer than that of the main
sink (P � 0.02, paired t-test). At any rate, the observation ofthe infragranular sink latency being no longer that the mainsink latency (P � 0.93, paired t-test) indicates that the infra-granular response is unlikely to be secondary to the mainmiddle layer response.
PRIMARY SLICE RESPONSES REQUIRE SYNAPTIC TRANSMISSION:
CALCIUM SENSITIVITY. Blocking synaptic transmission, bylowering Ca2� concentrations in the ACSF (replaced withMg2�; see METHODS), profoundly suppressed the MG-evokedresponses across all cortical laminae. Figure 3A2 illustrates thiseffect. After confirming the typical middle layer profile innormal ACSF (Fig. 3A1), low calcium ACSF was perfusedover the slice for �1 h (until reductions in layer 4 fieldpotentials had become asymptotic), then the laminar profilewas re-determined. Figure 3A2 shows that the MG-evokedfield potential, and CSD traces are almost flat under lowcalcium conditions, with only extremely weak responses in thelower layers remaining (600–1,200 �M deep). Four otherprimary slices were tested in this way. All had a virtuallycomplete (and reversible—in normal ACSF) blockade of mid-dle layer responses during low calcium perfusion. For two ofthose slices, a short latency (3–4.5 ms) spike-like field poten-tial remained (i.e., small and narrow) but only in the lowerlayers. These results suggest that the majority of the MG-evoked extracellular responses in the primary slice are synap-tically mediated. The residual responses that sometimes remainin the lower layers likely result from direct activation of eitherafferent fibers or antidromically activated cells.
INTRACELLULAR RECORDINGS IN LAYERS 3–4 OF THE PRIMARY
SLICE REVEAL CONSISTENT EARLY RESPONSE AND MORE
IRREGULAR LATE POLYSYNAPTIC RESPONSE. Given the predom-inant middle layer CSD sinks and the known projection to thissame region from the MGv, it seemed likely that major mono-synaptic thalamocortical responses in the primary slice occur atthe foci of the fast sinks in the middle cortical layers. Thus asa first step in the intracellular investigation of the thalamocor-tical responses, it seemed reasonable to direct recordings nearthose sinks. To do this, the auditory cortex was first mappedwith an extracellular electrode to find the “focus” of the MG-evoked response in layers 3–4 (as described for the laminarrecordings), then the intracellular recordings were conducted at
FIG. 3. Laminar profiles and low-Ca2� sensitivity of thalamocortical re-sponses in the primary slice. A1: laminar field potentials and associated currentsource densities (CSDs) for example slice in normal artificial cerebrospinalfluid (ACSF). One-hundred-fifty-micrometer separation between recordings;numbers on left indicate depth of recording sites within ACx (gray back-ground). “Pia” indicates surface of layer 1, “WM” indicates border betweenwhite matter and layer 6. MG stimulus intensity � 100 �A. Traces representaverages of 8–10 responses (gray-scale plot described in the following text).Notice large fast field potentials and CSD sinks around layers 3–4. Associatedsources are immediately above and below. Also note small sink on surface; thiswas the smallest of the CSD responses classified as “surface sinks” (n � 6; seemain text). A2: responses of same slice during perfusion of low-Ca2� ACSF.Note the near absence of any evoked field potentials or CSDs. Responsesrecovered after return to normal ACSF (not shown). B: gray-scale CSD profilesof all primary slices, arranged by recording date. Areas under the raw traceswere first measured (initial 20 ms after artifact), then gray-scale plots weregenerated using DeltaGraph (DeltaPoint). Values were normalized to themaximum sink for a given slice (max sink � �1), and plotted from �1 (black)to 1 (white), with 20 linear gray steps between (scale in B). Plot heightsnormalized to total cortical thickness. Some slices were not recorded to thewhite matter, so they don’t reach 100%. Note generally consistent sink posi-tions (dark bands) in layers 3–4. For further explanation, see RESULTS.
367AUDITORY THALAMOCORTICAL SYNAPTIC TRANSMISSION IN VITRO
J Neurophysiol • VOL 87 • JANUARY 2002 • www.jn.org

or near that focus (within �250 �M). Sixty-six cells, locatedbetween 30 and 50% of the distance from the pia to whitematter, were recorded from 24 primary slices. Mean values ofpassive membrane properties (SE) were as follows: restingpotential � 69.3 0.9 mV, input resistance � 46.8 2.1M�, spike threshold (current) � 0.39 0.03 nA, spike thresh-old (membrane potential) � 48.7 0.5 mV, spike height �64.1 0.7 mV, spike width (at half-amplitude) � 0.87 0.03ms. Three cells had categorically narrower spikes (range:0.28–0.44 ms) than the other 63 (range 0.64–2.21 ms). Theyalso fired at high rates (�100 Hz for hundreds of millisecondsduring depolarizing current injection) and had deep/fast after-hyperpolarizations (AHPs), consistent with the fast spiking celltype (Connors and Gutnick 1990; McCormick et al. 1985;Porter et al. 2001). The majority of cells with wider spikesdisplayed strong spike frequency adaptation and had moreshallow/gradually developing AHPs, consistent with the regu-lar spiking cell type (Connors and Gutnick 1990; McCormicket al. 1985; Porter et al. 2001). We observed no obviousdifferences in synaptic responses between cell types and willreport the data together.
Intracellular responses to MG stimulation typically beganwith a short-latency depolarizing potential that will be referredto as the “early response.” This response was predominantlyproduced by glutamate-mediated excitatory postsynaptic po-tentials (EPSPs) but could also contain a fast inhibitorypostsynaptic potential (IPSP; see following text). The onsetlatencies of the early responses averaged 4.0 0.1 ms (n � 58cells with measurable latencies), which generally matched thesimultaneously recorded layer 3–4 field potentials and mainCSD sink latencies (mean sink � 4.1 0.3 ms; P � 0.81,unpaired t-test, intracellular vs. sink onset latencies). Theseearly intracellular responses usually peaked, or at least reacheda point of inflection (described in the following text), within 20ms of the stimulus. As stimulus intensities were adjusted fromthreshold to higher values (mean threshold � 39.3 5.5 �A,n � 42), initial slopes and peak amplitudes generally increasedsharply at first, then often approached asymptote at higherintensities. Figure 4A illustrates a typical stimulus versus re-sponse function for an individual cell, and B plots the averageamplitudes of the early responses across all cells, for a broadrange of MG stimulus intensities (peak amplitudes measuredwithin 20 ms of stimulation). Although the maximum groupvalue was 4.0 0.5 mV, responses of some individual cellswere larger (e.g., Fig. 4A), ranging �9.5 mV. When such cellswere depolarized (with steady intracellular current) to a fewmillivolts below spike threshold, the MG-evoked early re-sponses could usually trigger action potentials, indicating thepresence of EPSPs; however, these early EPSPs did not gen-erally elicit spikes from the resting potential.
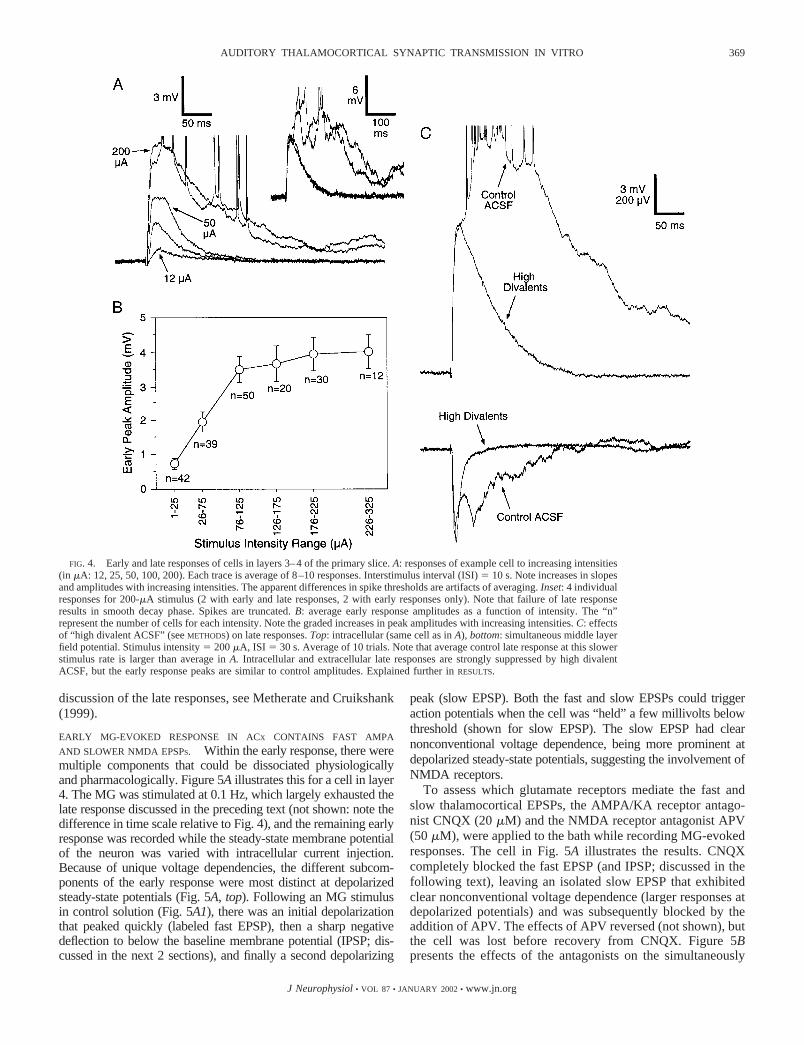
Notice in Fig. 4A that at low stimulus intensities (12–25�A), the responses had smooth rising and decay phases, con-sistent with those expected for monosynaptic EPSPs. In con-trast, at the higher stimulus intensities, late depolarizing com-ponents (with irregular inflections and spiking) began toemerge (Fig. 4A). Unlike the early response, which generallyhad consistent onsets and shapes from trial to trial, the latecomponents were not precisely time-locked to the stimulus andwere not always present on every trial (see Fig. 4A, inset).However, when the late response components were present ona given trial in a layer 3–4 intracellular recording, they were
also nearly always present in adjacent extracellular recordings(not shown), consistent with them being multineuron phenom-ena. These responses generally lasted for 300–900 ms butcould sometimes continue over a second. In contrast, most ofthe isolated early responses decayed close to baseline levelswithin �150 ms (Fig. 4A). Virtually identical late responseshave been the focus of previous studies, and it was concludedthat they reflect polysynaptic intracortical activity (Bai et al.2000; Hsieh et al. 2000; Metherate and Cruikshank 1999; alsosee Agmon et al. 1996; Luhmann and Prince 1990 for similarresponses in younger animals); further support for this conclu-sion is presented in the following text. These long duration,presumed polysynaptic responses, will hereafter be referred toas the “late responses.”
Consistent with a polysynaptic nature, the late responseswere very sensitive to stimulus rate and were often weak,and/or had a low probability of occurring, with the 0.1-to0.2-Hz stimulation rate routinely employed in the presentstudy. This sensitivity is evident in Fig. 4, when comparing theresponse to 0.1- versus 0.033-Hz stimulation (Fig. 4A “200�A” was @ 0.1 Hz, while Fig. 4C “control ACSF” was @0.033 Hz; all conditions except stimulus rate were identical).Notice how the slower rate (Fig. 4C) produced a much strongeraverage late response, which was largely a reflection of highertrial-to-trial probability; late responses occurred in 10/10 trialsat the slow stimulus rate, but in only 3/10 trials at the fast rate(the Fig. 4A, inset, shows 2 of the late responses producedduring fast stimulation). Frequency sensitivity was tested forseven cells and eight field potentials that expressed clear lateresponses at 0.05 Hz. It was found that 0.2-Hz stimulationstrongly suppressed the late responses for 5/7 cells and 5/8 fieldpotentials (nearly a complete blockade), and 1-Hz stimulationstrongly suppressed the others. In contrast, mean amplitudes ofearly responses remained 80 and 60% of control values with0.2- and 1-Hz stimulation, respectively.
To further test the nature of the early and late responses, weperfused slices with ACSF containing high concentrations ofdivalent cations (“high divalents”; see METHODS). High divalentshave traditionally been used to selectively suppress polysyn-aptic activity by raising spike thresholds (e.g., Crepel andBen-Ari 1996; Luhmann and Prince 1990; Sah and Nicoll1991; reviewed in Berry and Pentreath 1976). The rationale isthat as spike thresholds are raised, intercalated neurons locatedin a synaptic chain between the stimulus and recording siteswill fail; consequently, synaptic responses recorded downstreamfrom the intercalated cells (i.e., “polysynaptic responses”)would also fail. The example in Fig. 4C (top) shows an effectof high divalents on a layer 4 cell. Note how the high divalentACSF suppresses the late portion of the response, leaving theearly peak approximately at control levels. The bottom of Fig.4C illustrates the simultaneously recorded layer 3–4 field po-tentials with similar results. The effects of high-divalent ACSFwas tested on five field potential and two intracellular re-sponses in primary slices. In all cases, the late responses werealmost completely blocked. In contrast, most of the earlyresponses were left at approximately control levels. Togetherwith the effects of stimulus intensity and rate, these resultssuggest that the early responses were more “secure” than thelate responses, consistent with fewer intercalated synapses atwhich failure could occur. The remainder of the primary slicedata will focus on the early responses. For a more extensive
368 S. J. CRUIKSHANK, H. J. ROSE, AND R. METHERATE
J Neurophysiol • VOL 87 • JANUARY 2002 • www.jn.org
discussion of the late responses, see Metherate and Cruikshank(1999).
EARLY MG-EVOKED RESPONSE IN ACX CONTAINS FAST AMPA
AND SLOWER NMDA EPSPS. Within the early response, there weremultiple components that could be dissociated physiologicallyand pharmacologically. Figure 5A illustrates this for a cell in layer4. The MG was stimulated at 0.1 Hz, which largely exhausted thelate response discussed in the preceding text (not shown: note thedifference in time scale relative to Fig. 4), and the remaining earlyresponse was recorded while the steady-state membrane potentialof the neuron was varied with intracellular current injection.Because of unique voltage dependencies, the different subcom-ponents of the early response were most distinct at depolarizedsteady-state potentials (Fig. 5A, top). Following an MG stimulusin control solution (Fig. 5A1), there was an initial depolarizationthat peaked quickly (labeled fast EPSP), then a sharp negativedeflection to below the baseline membrane potential (IPSP; dis-cussed in the next 2 sections), and finally a second depolarizing
peak (slow EPSP). Both the fast and slow EPSPs could triggeraction potentials when the cell was “held” a few millivolts belowthreshold (shown for slow EPSP). The slow EPSP had clearnonconventional voltage dependence, being more prominent atdepolarized steady-state potentials, suggesting the involvement ofNMDA receptors.
To assess which glutamate receptors mediate the fast andslow thalamocortical EPSPs, the AMPA/KA receptor antago-nist CNQX (20 �M) and the NMDA receptor antagonist APV(50 �M), were applied to the bath while recording MG-evokedresponses. The cell in Fig. 5A illustrates the results. CNQXcompletely blocked the fast EPSP (and IPSP; discussed in thefollowing text), leaving an isolated slow EPSP that exhibitedclear nonconventional voltage dependence (larger responses atdepolarized potentials) and was subsequently blocked by theaddition of APV. The effects of APV reversed (not shown), butthe cell was lost before recovery from CNQX. Figure 5Bpresents the effects of the antagonists on the simultaneously
FIG. 4. Early and late responses of cells in layers 3–4 of the primary slice. A: responses of example cell to increasing intensities(in �A: 12, 25, 50, 100, 200). Each trace is average of 8–10 responses. Interstimulus interval (ISI) � 10 s. Note increases in slopesand amplitudes with increasing intensities. The apparent differences in spike thresholds are artifacts of averaging. Inset: 4 individualresponses for 200-�A stimulus (2 with early and late responses, 2 with early responses only). Note that failure of late responseresults in smooth decay phase. Spikes are truncated. B: average early response amplitudes as a function of intensity. The “n”represent the number of cells for each intensity. Note the graded increases in peak amplitudes with increasing intensities. C: effectsof “high divalent ACSF” (see METHODS) on late responses. Top: intracellular (same cell as in A), bottom: simultaneous middle layerfield potential. Stimulus intensity � 200 �A, ISI � 30 s. Average of 10 trials. Note that average control late response at this slowerstimulus rate is larger than average in A. Intracellular and extracellular late responses are strongly suppressed by high divalentACSF, but the early response peaks are similar to control amplitudes. Explained further in RESULTS.
369AUDITORY THALAMOCORTICAL SYNAPTIC TRANSMISSION IN VITRO
J Neurophysiol • VOL 87 • JANUARY 2002 • www.jn.org
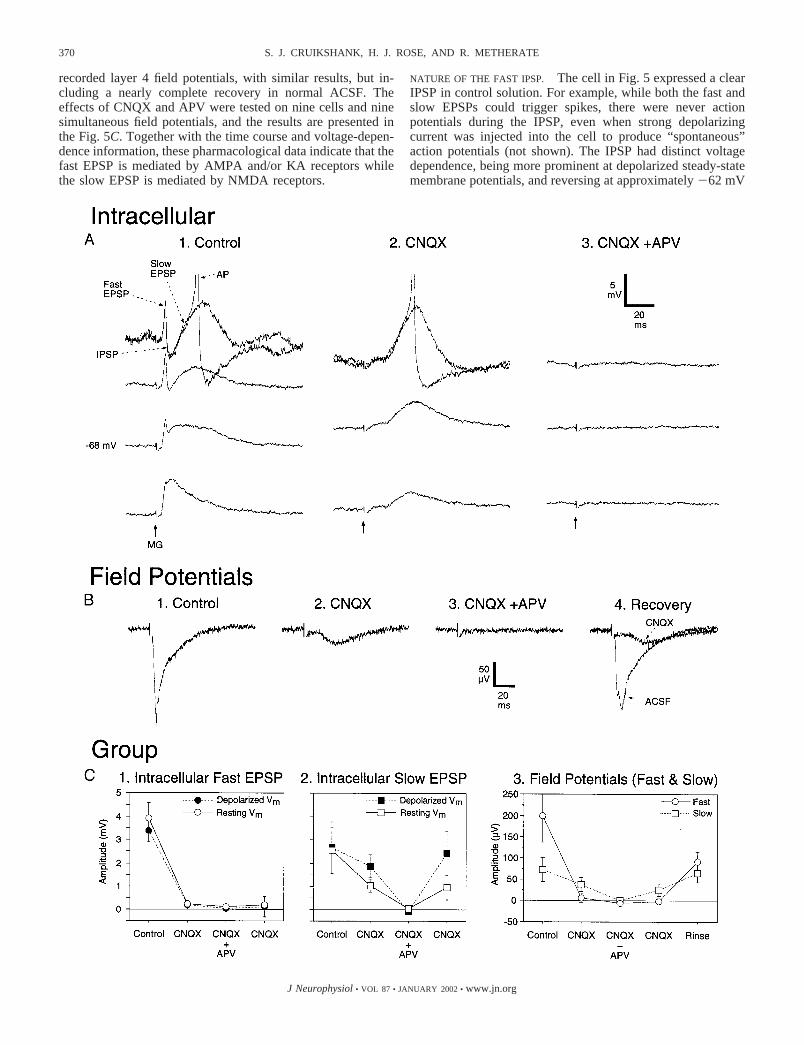
recorded layer 4 field potentials, with similar results, but in-cluding a nearly complete recovery in normal ACSF. Theeffects of CNQX and APV were tested on nine cells and ninesimultaneous field potentials, and the results are presented inthe Fig. 5C. Together with the time course and voltage-depen-dence information, these pharmacological data indicate that thefast EPSP is mediated by AMPA and/or KA receptors whilethe slow EPSP is mediated by NMDA receptors.
NATURE OF THE FAST IPSP. The cell in Fig. 5 expressed a clearIPSP in control solution. For example, while both the fast andslow EPSPs could trigger spikes, there were never actionpotentials during the IPSP, even when strong depolarizingcurrent was injected into the cell to produce “spontaneous”action potentials (not shown). The IPSP had distinct voltagedependence, being more prominent at depolarized steady-statemembrane potentials, and reversing at approximately 62 mV
370 S. J. CRUIKSHANK, H. J. ROSE, AND R. METHERATE
J Neurophysiol • VOL 87 • JANUARY 2002 • www.jn.org

(Fig. 5A1). This data, together with the fast time-course, sug-gest a GABAA receptor-mediated mechanism (Avoli 1986;Connors et al. 1988; Cox et al. 1992; Hefti and Smith 2000).Note that the IPSP was blocked during CNQX application,consistent with the interpretation that glutamatergic synapsesdrive the interneurons responsible for the IPSP (see DISCUS-SION).
To characterize the incidence of fast IPSPs across cells,responses to MG stimulation were measured at resting poten-tials and one or more other steady-state potentials (alwaysincluding a depolarized value near spike threshold) to recordon both sides of the GABAA IPSP reversal potential. Of thecells tested this way, 15/20 displayed IPSPs (always followinginitial EPSPs). For eight of these, the IPSPs were fast (onsets�11 ms) and fairly robust, such that the negative going PSPs,recorded at depolarized potentials, reached below the depolar-ized steady-state levels (included among these is the examplecell in Fig. 5A1). For six cells, the IPSPs were fast but weaker,indicated by deflections that did not reach below the steady-state levels. These weaker IPSPs either cut off the EPSPs,causing them to be narrower when recorded at depolarized thanat hyperpolarized steady-state potentials, or they creatednotches in the EPSPs when depolarized (the latter is illustratedin Fig. 6A: also see text in MG-EVOKED RESPONSE DIFFERS FROM
RESPONSE PRODUCED BY CONVENTIONAL COLUMNAR (ON-BEAM) STIM-ULATION). In addition to the 14 cells with fast IPSPs, one cellexhibited a robust IPSP with a longer latency (onset � 17 ms;but still a reversal potential of 64 mV, consistent withGABAA), and 5 cells displayed no apparent IPSPs. Minimumfast IPSP latencies range from 4.8 to 10.8 ms (mean � 6.8 0.4 ms). The latencies between the onsets of the EPSPs andIPSPs for these responses ranged from 1.4 to 6.2 ms (mean �2.8 0.3 ms).
In addition to the fast IPSPs, we occasionally observedslower hyperpolarizing potentials with reversal potentials morenegative than rest. These are likely to be GABAB receptor-mediated IPSPs. Their amplitudes were very small, and theymay have been partly masked by overlapping slow EPSPsand/or late polysynaptic responses, so they were not system-atically examined here. However, these slow IPSPs may bemore clearly illuminated in future studies with specific phar-macological and physiological manipulations (Connors et al.1988; Metherate and Ashe 1994).
MG-EVOKED RESPONSE DIFFERS FROM RESPONSE PRODUCED BY
CONVENTIONAL COLUMNAR (ON BEAM) STIMULATION. Asidefrom recent studies with intact thalamocortical slices (see IN-TRODUCTION), in vitro studies have generally employed stimu-lation of layer 6, or the white matter just below layer 6, in anattempt to activate thalamocortical axons projecting to cellsrecorded in the cortical column above (discussed in Agmonand Connors 1991; Kenan-Vaknin and Teyler 1994; Kirkwoodand Bear 1994). This conventional white matter/layer 6 stim-ulation will be referred to as “on-beam” stimulation. Here wecompared responses in primary slices evoked by MG andon-beam stimulation and found clear differences between themrelating to IPSP strengths and CSD distributions. These tworesults will each be described in turn.
Although IPSPs could clearly be evoked using MG stimu-lation, they appeared to be relatively weak compared withprevious studies of auditory cortex employing on-beam stimuli(e.g., Buonomano and Merzenich 1998; Metherate and Ashe1994). To test whether this was related to locus of stimulationor some other variable, fast IPSPs evoked by on-beam versusMG stimulation were directly compared within individualcells. For 10/12 such cells, the IPSPs evoked by the on-beamstimuli were strongest; in the remaining two cells, the MG- andon-beam-evoked IPSPs were not clearly different.
A potential problem with the above comparison is that theapparent “excitatory drive” was not always equal for the twopathways. In fact, the maximum drive for each cell, as esti-mated by EPSP amplitudes and slopes, was usually largest forthe on-beam stimulus. This is important because the thalamo-cortical IPSPs are presumed to be polysynaptic phenomena, sothe strength of IPSPs are expected to depend (at least some-what) on the strength of excitatory input from the thalamus. Tocontrol for this potential problem, we separately comparedIPSPs for the seven cells in which EPSPs evoked by MGstimulation were equal to, or stronger than, on-beam EPSPs(for at least a subset of stimulus intensities). Of these, 5/7 cellsstill had clearly stronger IPSPs for on-beam stimulation; theother 2 cells showed no clear difference between pathways.Example responses from a cell with stronger on-beam IPSPsare presented in Fig. 6A. When recorded at the resting potential(71 to 73 mV), the IPSPs were positive going and addedwith the EPSPs to produce a net depolarizing PSP. Notice thatthe initial slopes were approximately equal, and in this case,
FIG. 5. Differential effects of glutamate receptor antagonists on the 3 components of the primary slice early response: fastexcitatory postsynaptic potential (EPSP), fast inhibitory PSP (IPSP), slow EPSP. A1: example middle layer cell showing 3components of early response. Resting potential � 68 mV. Steady-state potentials adjusted by injecting intracellular current (innA, from bottom trace to top: 0.2, 0, 0.2, 0.4). MG stimulus time indicated by arrow. Stimulus intensity � 150 �A. Responsecomponents are labeled at most depolarized steady-state level. Traces at 3 most hyperpolarized steady-state potentials are averagesof 7–10 responses. Individual responses presented for depolarized potential to illustrate trials with and without action potentials(AP) initiated by slow EPSP. For other trials, the fast EPSP could induce a spike. Scale bars apply to all intracellular traces (A, 1–3).A2: 20 �M 6-cyano-7-nitroquinoxalene-2,3-dione (CNQX) blocked the fast EPSP and fast IPSP, leaving a slow EPSP withnonconventional voltage dependence. A3: the combination of 20 �M CNQX � 50 �M DL-2-amino-5-phosphonopentanoic acid(APV) blocked all the MG evoked responses for the cell (the slow EPSP recovered after removal of APV, not shown). B: fieldpotential from same slice as in A (simultaneous, layer 3–4). CNQX blocked the large fast potential, leaving a smaller slow potential(B2). Addition of APV (CNQX � APV) blocked the remaining slow potential (B3), which recovered on subsequent removal ofAPV (B4, CNQX). A large portion of the fast potential recovered during 2.5-h rinse in normal ACSF (B4, ACSF). C: group effectsof glutamate antagonists on fast EPSP (1), slow EPSP (2), and fast and slow field potentials (3; 9 cells, 9 field potentials). FastEPSPs and field potentials were measured at latency corresponding to peak (initial 20 ms) in control conditions. Slow EPSPs andfield potentials were measured at latency corresponding to peak of response during CNQX (at depolarized steady-state potentialsfor intracellular: the most depolarized value that was still sub-threshold for spiking was used). While the fast EPSP was nearlyabolished by CNQX, the slow EPSP was only moderately suppressed; the latter effect was weaker for depolarized steady-statepotentials than at resting potentials. Addition of APV reversibly blocked the slow EPSP (completely) even at depolarized potentials.The fast and slow group field potentials had similar effects as the corresponding EPSPs plus partial recovery in normal ACSF.
371AUDITORY THALAMOCORTICAL SYNAPTIC TRANSMISSION IN VITRO
J Neurophysiol • VOL 87 • JANUARY 2002 • www.jn.org
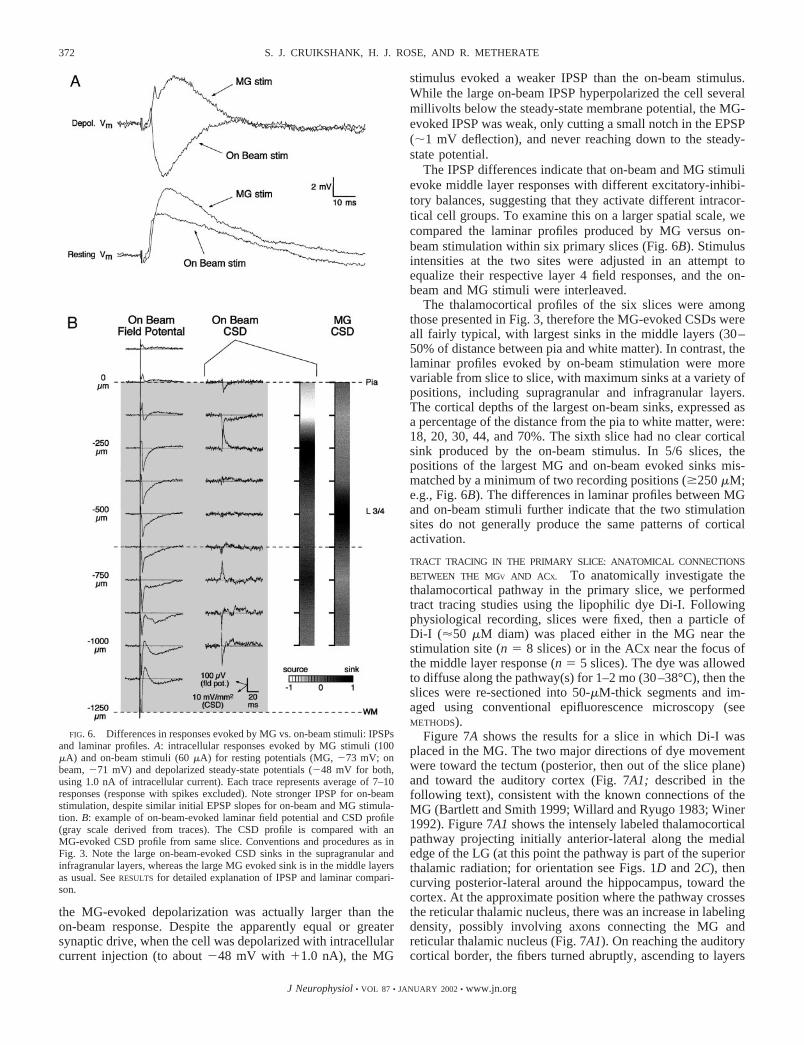
the MG-evoked depolarization was actually larger than theon-beam response. Despite the apparently equal or greatersynaptic drive, when the cell was depolarized with intracellularcurrent injection (to about 48 mV with �1.0 nA), the MG
stimulus evoked a weaker IPSP than the on-beam stimulus.While the large on-beam IPSP hyperpolarized the cell severalmillivolts below the steady-state membrane potential, the MG-evoked IPSP was weak, only cutting a small notch in the EPSP(�1 mV deflection), and never reaching down to the steady-state potential.
The IPSP differences indicate that on-beam and MG stimulievoke middle layer responses with different excitatory-inhibi-tory balances, suggesting that they activate different intracor-tical cell groups. To examine this on a larger spatial scale, wecompared the laminar profiles produced by MG versus on-beam stimulation within six primary slices (Fig. 6B). Stimulusintensities at the two sites were adjusted in an attempt toequalize their respective layer 4 field responses, and the on-beam and MG stimuli were interleaved.
The thalamocortical profiles of the six slices were amongthose presented in Fig. 3, therefore the MG-evoked CSDs wereall fairly typical, with largest sinks in the middle layers (30–50% of distance between pia and white matter). In contrast, thelaminar profiles evoked by on-beam stimulation were morevariable from slice to slice, with maximum sinks at a variety ofpositions, including supragranular and infragranular layers.The cortical depths of the largest on-beam sinks, expressed asa percentage of the distance from the pia to white matter, were:18, 20, 30, 44, and 70%. The sixth slice had no clear corticalsink produced by the on-beam stimulus. In 5/6 slices, thepositions of the largest MG and on-beam evoked sinks mis-matched by a minimum of two recording positions (�250 �M;e.g., Fig. 6B). The differences in laminar profiles between MGand on-beam stimuli further indicate that the two stimulationsites do not generally produce the same patterns of corticalactivation.
TRACT TRACING IN THE PRIMARY SLICE: ANATOMICAL CONNECTIONS
BETWEEN THE MGV AND ACX. To anatomically investigate thethalamocortical pathway in the primary slice, we performedtract tracing studies using the lipophilic dye Di-I. Followingphysiological recording, slices were fixed, then a particle ofDi-I (�50 �M diam) was placed either in the MG near thestimulation site (n � 8 slices) or in the ACx near the focus ofthe middle layer response (n � 5 slices). The dye was allowedto diffuse along the pathway(s) for 1–2 mo (30–38°C), then theslices were re-sectioned into 50-�M-thick segments and im-aged using conventional epifluorescence microscopy (seeMETHODS).
Figure 7A shows the results for a slice in which Di-I wasplaced in the MG. The two major directions of dye movementwere toward the tectum (posterior, then out of the slice plane)and toward the auditory cortex (Fig. 7A1; described in thefollowing text), consistent with the known connections of theMG (Bartlett and Smith 1999; Willard and Ryugo 1983; Winer1992). Figure 7A1 shows the intensely labeled thalamocorticalpathway projecting initially anterior-lateral along the medialedge of the LG (at this point the pathway is part of the superiorthalamic radiation; for orientation see Figs. 1D and 2C), thencurving posterior-lateral around the hippocampus, toward thecortex. At the approximate position where the pathway crossesthe reticular thalamic nucleus, there was an increase in labelingdensity, possibly involving axons connecting the MG andreticular thalamic nucleus (Fig. 7A1). On reaching the auditorycortical border, the fibers turned abruptly, ascending to layers
FIG. 6. Differences in responses evoked by MG vs. on-beam stimuli: IPSPsand laminar profiles. A: intracellular responses evoked by MG stimuli (100�A) and on-beam stimuli (60 �A) for resting potentials (MG, 73 mV; onbeam, 71 mV) and depolarized steady-state potentials (48 mV for both,using 1.0 nA of intracellular current). Each trace represents average of 7–10responses (response with spikes excluded). Note stronger IPSP for on-beamstimulation, despite similar initial EPSP slopes for on-beam and MG stimula-tion. B: example of on-beam-evoked laminar field potential and CSD profile(gray scale derived from traces). The CSD profile is compared with anMG-evoked CSD profile from same slice. Conventions and procedures as inFig. 3. Note the large on-beam-evoked CSD sinks in the supragranular andinfragranular layers, whereas the large MG evoked sink is in the middle layersas usual. See RESULTS for detailed explanation of IPSP and laminar compari-son.
372 S. J. CRUIKSHANK, H. J. ROSE, AND R. METHERATE
J Neurophysiol • VOL 87 • JANUARY 2002 • www.jn.org

3–4, where they formed a dense terminal plexus (Figs. 7A, 2and 3). There was also an intense zone of labeling in the lowercortical layers (Fig. 7A2), which included not only axons butalso pyramidal somata and dendrites (not shown, but clear inother sections from same slice). Finally, a few axons reachedlayer 1. Some of these can be seen in A3 (note: the brightlabeling on the cortical surface is an artifact, produced byreflectance off loose tissue).
Of the eight primary slices with Di-I applications in the MG,six had terminal-like zones of intense labeling in layers 3–4 ofauditory cortex; the remaining two slices had labeled axons inlayers 3–4, but they were sparse, and did not form the type of
“plexus” seen in Fig. 7A. The infragranular labeling includedfour slices with many pyramidal cells and dense processes, twoslices with a few pyramidal cells and sparse processes, and twoslices with no labeled somata (but weakly labeled processes).When present, the pyramidal somata were mostly in layer 6(�75% of the distance from pia to white matter) or around thelayer 5/6 border. Finally, in addition to the example, one otherslice had clear axons in layer 1. The density of this labelingwas considerably higher than in the example and includedmany axons oriented parallel with the cortical surface.
Of the five primary slices with Di-I particles placed in theACx, 4/5 had retrograde labeling of cell bodies in the MG.
FIG. 7. Anterograde and retrograde 1,1�-dioctadecyl-3,3,3�,3�-tetramethylindocarbocyanine perchlorate (Di-I) tracing along thethalamocortical pathway in the primary slice. Orientation for all panels: anterior toward left, lateral toward bottom. Theapproximate positions of the images in A1 and B1 are indicated by the rectangle in Fig. 1D. A1: low-magnification image of MG,ACx, and surrounding structures, following Di-I application to the MG (*). - - -, a region that includes ACx and parts of striatumand is expanded in A2. The white arrow indicates a region of increased labeling density, approximately where the thalamocorticalpathway crosses the reticular thalamic nucleus. A2: medium-magnification image showing the pattern of cortical labeling. In thissection, labeling mostly involves anterograde-filled processes with many branches in layers 3-4. Other sections from same slice alsohad retrograde labeling of deep layer pyramidal cells. A3: high-magnification image from same section showing plexus of processesin layers 3-4. B1: low-magnification image following Di-I application to ACx (*). Orientation similar to A1. B2: part of MGoutlined by dashed box in B1 is shown at higher magnification, illustrating 2 retrograde-filled MG somata. B3: image from adjacentsection of same slice showing more MG somata. Details of the primary slice tracing presented in Tract tracing in the primary slice:anatomical connections between the MGv and ACx.
373AUDITORY THALAMOCORTICAL SYNAPTIC TRANSMISSION IN VITRO
J Neurophysiol • VOL 87 • JANUARY 2002 • www.jn.org

Figure 7B presents an example. Notice that pathway appears tobe interrupted (Fig. 7B1); the middle region of the pathway isactually labeled in more ventral sections of the slice (notshown). This was a common feature and indicates that thethalamocortical pathway is curved in the dorsal-ventral plane.It is most ventral in the middle region, near the reticularthalamic nucleus, and curves dorsally toward both extremities(near the MG and ACx; see Fig. 2C for orientation). Consistentwith this, labeled cell bodies in MG were always located nearthe dorsal surface of the slice. It appears that the ventral dip inthe middle of the pathway is necessary so that the thalamocor-tical fibers can pass under the fimbria; this can be best appre-ciated by examining the structures present at different dorsal-ventral levels in the parvalbumin material (Fig. 2C).
Taken together, the anterograde and retrograde labeling in-dicates that the primary slice contains anatomically connectedaxonal pathways linking the MG and ACx. Furthermore theprojections from the MG seem to end predominantly in corticallayers 3–4, although axons are also usually present in the lowerlayers, and occasionally in layer 1. These three projectionscould contribute, respectively, to the middle layer, lower layer,and surface CSD sinks characterized previously (LAMINAR RE-SPONSE PROFILE OF PRIMARY SLICE IS DOMINATED BY MIDDLE LAYER
CSD SINK, Fig. 3).
Shell slice
ANATOMICAL FEATURES OF THE SHELL SLICE. The shell slicewas located ventral to the primary slice (Fig. 1). Gross ana-tomical observations (e.g., Fig. 1, C and E) and knowledge ofthe ventral boundaries of the primary slice (see preceding text)indicate that the thalamic portions of the shell slice are locatedbelow the MG proper. This region contains nonprimary or“shell” auditory thalamic subdivisions (e.g., the PPD and PIN;Figs. 1A and 2A) and more ventral nonauditory structures (e.g.,substantia nigra, cerebral peduncle; Figs. 1A and 2A). Similarobservations and reasoning suggest that the shell slice maycontain portions of the “belt” auditory cortical area, ventral toprimary ACx.
Direct histological information was also obtained followingrecordings from shell slices (Nissl stain: n � 17; PV-immu-nohistochemistry: n � 1). For 12/18 shell slices in whichthalamic regions were examined, the top 50–100 �M appearedto be within the PPD; for the remaining 6/18, the tops werelocated more ventrally, in the cerebral peduncle or substantianigra (for orientation, see Fig. 2, A and B). For 5/12 shell slicesin which cortices were examined (6 removed because of low-quality histology), the temporal cortices were well laminatedon the top 50–100 �M. For the other 7/12, lamination was poor(even in the most dorsal sections), indicating localization ven-tral to primary ACx. The bottoms of the shell slices alwaysappeared to be located below the PPD and primary ACx.
LAMINAR RESPONSE PROFILE OF SHELL SLICE IS DOMINATED BY
A SURFACE CSD SINK. The dominant evoked response in theshell slice, to stimulation of the region ventral to the MG(indicated by arrow in Fig. 1E; hereafter referred to as the“shell region”), was a strong CSD sink on the surface ofcortical layer 1 (Fig. 8). Generally, the field potential at theposition of the sink was predominantly negative in polarity andhad a similar time course as the sink. In contrast, the fieldpotentials in the middle and lower layers were nearly always
biphasic with a fast negative phase that preceded the surfacesink and a slower positive phase having a similar latency as thesurface sink. The example in Fig. 8A illustrates these and othercharacteristics of the shell slice laminar response (conventionsand methodology as in primary slice experiments: Fig. 3). In
FIG. 8. Laminar pattern and low-Ca2� sensitivity of cortical responses inthe shell slice. A1: laminar field potentials and associated CSDs for exampleshell slice in normal ACSF. Orientation, conventions, and procedures similarto Fig. 3. Stimulus intensity � 150 �A. Notice large CSD sink at the corticalsurface, and the source immediately below. Also note predominantly negativesurface field potential and fast biphasic middle and lower layer potentials. Theonsets of late field potential responses are also visible at the end of the traces(negative polarity in lower and middle layers, positive polarity on the surface).A2: responses of same slice during perfusion of low-Ca2� ACSF. Note the nearabsence of any evoked CSD components; arrow indicates a small surfacesource that sometimes remained. Also note the clear negative field potentialsin the middle and lower layers. Responses recovered after return to normalACSF (not shown). B: fast CSD profiles of all shell slices, arranged byrecording date. The surface sinks (dark bands) were largest in all cases exceptthe slice on the far right, for which the infragranular sink had greater area. Forfurther explanation, see RESULTS.
374 S. J. CRUIKSHANK, H. J. ROSE, AND R. METHERATE
J Neurophysiol • VOL 87 • JANUARY 2002 • www.jn.org

addition to the surface sink, there was also a CSD sourceimmediately below the sink (150 �M depth; Fig. 8A1). Thegray-scale representation of this CSD profile is drawn to theright of traces and in the group plot (Fig. 8B).
The CSD profiles of all 13 shell slices that underwentlaminar analysis are presented in Fig. 8B. Notice that each hada major sink on the cortical surface, which in 12/13 cases wasthe largest for the slice (Fig. 8B). The surface sinks werenarrow, never spanning more than one recording position(spacing: 125–150 �M). Also apparent in the gray-scale plotsare several infragranular CSD sinks. These “secondary” sinks,observed in 8/13 slices, had an average location of 58.1 2.8% of the distance from the pia to white matter. In additionto sinks, all 13 slices expressed supragranular CSD sources(sometimes difficult to see in gray scale, but clear in “raw”traces; e.g., Fig. 8A1). In most cases, these sources werepresent at the recording site immediately below the surfacesink (11/13). Finally, for four slices, there were clear infra-granular CSD sources centered 68.1 4.8% of the distancefrom the pia to white matter.
The mean onset latency for the shell slice surface sink was6.0 0.2 ms, while the mean infragranular sink latency was4.4 0.4 ms (P � 0.02, paired t-test), suggesting that theinfragranular sink is not a secondary phenomenon that followsthe main surface sink.
SURFACE CSD SINK IN THE SHELL SLICE REQUIRES SYNAPTIC
TRANSMISSION. Blocking synaptic transmission, by loweringextracellular Ca2� concentrations, strongly suppressed re-sponses evoked by shell region stimulation (Fig. 8A2). Acrossslices (n � 5), all major sinks and sources were essentiallyeliminated. The only consistent CSD feature still present inlow-Ca2� ACSF was a small source on the cortical surface(Fig. 8A2,1); while this source could sometimes be seen evenin control conditions, its duration became longer in low-Ca�2
ACSF, probably due to the removal of the large overlappingsink (Fig. 8A).
Consistent with the loss of CSD sinks, the negative fieldpotentials on the surface of the slice were largely absent inlow-calcium ACSF. Likewise, the slower positive field poten-tials in the middle and lower layers were also eliminated, ornearly so. However, reasonably large fractions of the fasternegative field potentials in the middle/lower layers remained(�50%, 5/5 slices; Fig. 8A2). Furthermore, the durations ofthese negative potentials generally increased (4/5 slices). De-spite the increased durations, these potentials produced noappreciable middle or deep layer CSD sinks (1 of the largestsinks is observed in the example, at 300 �M).
The effects of low Ca2� indicate that the major CSD sinksand sources in the shell slice, including the dominant surfacesink (and associated field potentials), represent synapticallymediated responses. In contrast, at least a portion of the fastermiddle/lower layer negative field responses are apparentlynonsynaptic. It is noteworthy that the latter are unevenly dis-tributed through the middle/lower laminae, being largest inlayers 5 and 4 (e.g., Fig. 8A2), suggesting direct activation ofa specific cell group in that region.
In addition to calcium manipulations, for two shell slices,CNQX (20 �M) was added to the bath (normal Ca2�) to testfor the involvement of AMPA/KA receptors in the synapticresponses. In both cases, all major sinks and sources were
profoundly suppressed. This left a modest surface source(similar to low Ca2�) and a very small late sink. In one slice,the NMDA receptor antagonist APV (50 �M) was subse-quently added, and this blocked the residual late sink (but notthe source). While limited, these antagonist data suggest theinvolvement of glutamate receptors in the shell slice synapticresponses.
INTRACELLULAR RECORDINGS IN SHELL SLICE REVEAL EARLY
AND LATE RESPONSES: EARLY RESPONSE TIME COURSE SIMILAR
TO SURFACE CSD SINK. Intracellular recordings were madefrom nine cells in three shell slices; eight of these cells werelocated in layers 3–4, and one cell was recorded from approx-imately layer 6. Mean values of passive membrane propertieswere as follows: resting potential � 65.0 2.3 (SE) mV,input resistance � 44.1 5.7 M�, spike threshold (current) �0.31 0.04 nA, spike threshold (membrane potential) �47.3 0.9 mV, spike height � 60.3 1.1 mV, spike width(at half-amplitude) � 1.04 0.05 ms. The range of spikewidths was 0.82–1.36 ms, and they all exhibited strong spikefrequency adaptation, consistent with the regular spiking celltype (Connors and Gutnick 1990).
Intracellular responses evoked by stimulation of the shellregion (arrow in Fig. 1E) generally consisted of an earlydepolarizing response (probable EPSP) that peaked within 20ms of the stimulus, followed by a deflection in the hyperpo-larizing direction, and finally a large depolarizing late re-sponse. These features are illustrated in Fig. 9, A and B, for twocells recorded in layers 3–4; also shown are the paired fieldpotentials, recorded from the surface of layer 1.
The early intracellular responses of the shell slice differedfrom those of the primary slice in both amplitude and latency.The shell slice responses were typically smaller, which can beseen by comparing the mean amplitudes in Figs. 9C versus 4B.For example, the average amplitudes to 100 �A stimulationwere 3.5 0.4 mV for the primary slice and only 1.1 0.3mV for the shell slice (P � 0.03, unpaired t-test). The latenciesof the early intracellular responses in the shell slice tended tobe longer than those of the primary slice (mean onsets: pri-mary � 4.0 0.1 ms, shell � 6.2 0.5 ms; P � 0.0001,unpaired t-test) and matched the latencies of field potentials inlayer 1 rather than those in layers 3–4 (Fig. 9, A and B; also seeLAMINAR RESPONSE PROFILE OF SHELL SLICE IS DOMINATED BY A
SURFACE CSD SINK and Fig. 8). The shell intracellular latenciesalso closely matched the surface CSD sinks (mean onsets:surface sink � 6.0 0.2 ms, layer 3–4 intracellular � 6.2 0.5 ms; P � 0.68, unpaired t-test). Together, these data suggestthat the early intracellular PSPs in the shell slice might beproduced by activation of synapses in layer 1, perhaps ontoapical dendrites of the recorded cells.
The late responses of the shell slices were generally similarto those of the primary slices, and to those in previous studies(Bai et al. 2000; Hsieh et al. 2000; Metherate and Cruikshank1999). For example, they contained irregular fluctuations thatvaried from trial to trial. They also had similar laminar profiles,with negative polarity field potentials in the deep and middlelayers and positive polarity in the upper layers (Figs. 4C, 8A1,9, A and B; upper layers not shown for primary). Despite thesimilarities, late responses tended to be easier to elicit in theshell slice. Although not formally quantified, it was qualita-tively apparent that these responses could be maintained at
375AUDITORY THALAMOCORTICAL SYNAPTIC TRANSMISSION IN VITRO
J Neurophysiol • VOL 87 • JANUARY 2002 • www.jn.org
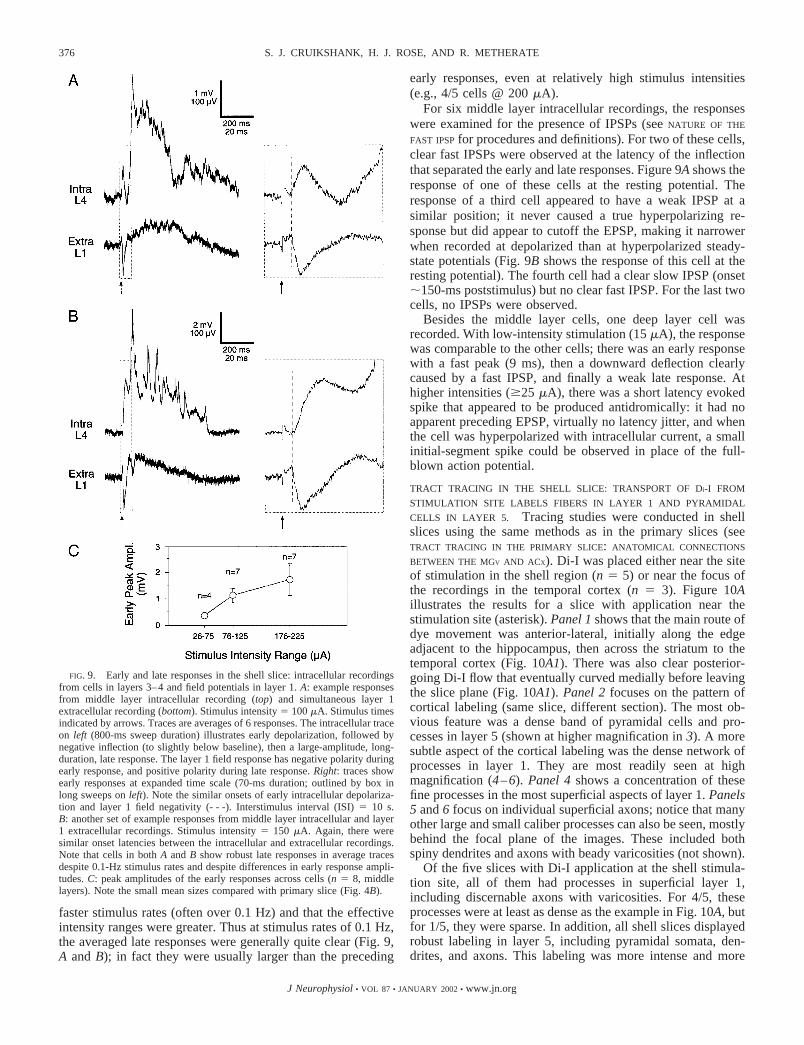
faster stimulus rates (often over 0.1 Hz) and that the effectiveintensity ranges were greater. Thus at stimulus rates of 0.1 Hz,the averaged late responses were generally quite clear (Fig. 9,A and B); in fact they were usually larger than the preceding
early responses, even at relatively high stimulus intensities(e.g., 4/5 cells @ 200 �A).
For six middle layer intracellular recordings, the responseswere examined for the presence of IPSPs (see NATURE OF THE
FAST IPSP for procedures and definitions). For two of these cells,clear fast IPSPs were observed at the latency of the inflectionthat separated the early and late responses. Figure 9A shows theresponse of one of these cells at the resting potential. Theresponse of a third cell appeared to have a weak IPSP at asimilar position; it never caused a true hyperpolarizing re-sponse but did appear to cutoff the EPSP, making it narrowerwhen recorded at depolarized than at hyperpolarized steady-state potentials (Fig. 9B shows the response of this cell at theresting potential). The fourth cell had a clear slow IPSP (onset�150-ms poststimulus) but no clear fast IPSP. For the last twocells, no IPSPs were observed.
Besides the middle layer cells, one deep layer cell wasrecorded. With low-intensity stimulation (15 �A), the responsewas comparable to the other cells; there was an early responsewith a fast peak (9 ms), then a downward deflection clearlycaused by a fast IPSP, and finally a weak late response. Athigher intensities (�25 �A), there was a short latency evokedspike that appeared to be produced antidromically: it had noapparent preceding EPSP, virtually no latency jitter, and whenthe cell was hyperpolarized with intracellular current, a smallinitial-segment spike could be observed in place of the full-blown action potential.
TRACT TRACING IN THE SHELL SLICE: TRANSPORT OF Di-I FROM
STIMULATION SITE LABELS FIBERS IN LAYER 1 AND PYRAMIDAL
CELLS IN LAYER 5. Tracing studies were conducted in shellslices using the same methods as in the primary slices (seeTRACT TRACING IN THE PRIMARY SLICE: ANATOMICAL CONNECTIONS
BETWEEN THE MGV AND ACX). Di-I was placed either near the siteof stimulation in the shell region (n � 5) or near the focus ofthe recordings in the temporal cortex (n � 3). Figure 10Aillustrates the results for a slice with application near thestimulation site (asterisk). Panel 1 shows that the main route ofdye movement was anterior-lateral, initially along the edgeadjacent to the hippocampus, then across the striatum to thetemporal cortex (Fig. 10A1). There was also clear posterior-going Di-I flow that eventually curved medially before leavingthe slice plane (Fig. 10A1). Panel 2 focuses on the pattern ofcortical labeling (same slice, different section). The most ob-vious feature was a dense band of pyramidal cells and pro-cesses in layer 5 (shown at higher magnification in 3). A moresubtle aspect of the cortical labeling was the dense network ofprocesses in layer 1. They are most readily seen at highmagnification (4–6). Panel 4 shows a concentration of thesefine processes in the most superficial aspects of layer 1. Panels5 and 6 focus on individual superficial axons; notice that manyother large and small caliber processes can also be seen, mostlybehind the focal plane of the images. These included bothspiny dendrites and axons with beady varicosities (not shown).
Of the five slices with Di-I application at the shell stimula-tion site, all of them had processes in superficial layer 1,including discernable axons with varicosities. For 4/5, theseprocesses were at least as dense as the example in Fig. 10A, butfor 1/5, they were sparse. In addition, all shell slices displayedrobust labeling in layer 5, including pyramidal somata, den-drites, and axons. This labeling was more intense and more
FIG. 9. Early and late responses in the shell slice: intracellular recordingsfrom cells in layers 3–4 and field potentials in layer 1. A: example responsesfrom middle layer intracellular recording (top) and simultaneous layer 1extracellular recording (bottom). Stimulus intensity � 100 �A. Stimulus timesindicated by arrows. Traces are averages of 6 responses. The intracellular traceon left (800-ms sweep duration) illustrates early depolarization, followed bynegative inflection (to slightly below baseline), then a large-amplitude, long-duration, late response. The layer 1 field response has negative polarity duringearly response, and positive polarity during late response. Right: traces showearly responses at expanded time scale (70-ms duration; outlined by box inlong sweeps on left). Note the similar onsets of early intracellular depolariza-tion and layer 1 field negativity (- - -). Interstimulus interval (ISI) � 10 s.B: another set of example responses from middle layer intracellular and layer1 extracellular recordings. Stimulus intensity � 150 �A. Again, there weresimilar onset latencies between the intracellular and extracellular recordings.Note that cells in both A and B show robust late responses in average tracesdespite 0.1-Hz stimulus rates and despite differences in early response ampli-tudes. C: peak amplitudes of the early responses across cells (n � 8, middlelayers). Note the small mean sizes compared with primary slice (Fig. 4B).
376 S. J. CRUIKSHANK, H. J. ROSE, AND R. METHERATE
J Neurophysiol • VOL 87 • JANUARY 2002 • www.jn.org

dominant (relative to other layers) than the analogous infra-granular labeling in the primary slice. It should also be notedthat although there were apical dendrites and ascending axonspassing through all cortical layers, there was no zone of intenseterminal-like labeling in the middle layers as commonly seen inthe primary slices. In fact, across the five shell slices studied,the middle layers appeared to be the region with lowest densityof labeled processes.
Of the three shell slices with Di-I particles placed in theACx, only one had retrograde labeling of cell bodies in thethalamus (likely in the PPD). In addition, for six pilot experi-ments (in which Di-I was first dissolved into alcohol, theninjected into the cortex), only a few small cells in two slices
were ever retrogradely labeled in the shell area. Furthermore,the path of labeling did not appear to lead to a nucleus. Insteadit labeled a narrow fiber pathway that passed through thestimulation area and continued past it, along the lateral edge ofthe thalamus/midbrain (Fig. 10B). This narrow labeled regioncorrelated well with the narrow region for effective stimulation(cf. Fig. 10A1, asterisk); more internal/medial positions weregenerally ineffective. Based on histological observations (seepreceding text), the labeled pathway appears to correspond tothe cerebral peduncle. The strong labeling of this narrow fiberpathway through the shell stimulation site, but a low incidenceof back-filled thalamic cells, suggests that the cells in the“shell” thalamic nuclei may not be the major source of input to
FIG. 10. Anterograde and retrograde Di-I tracing in the shell slice. Orientation for all panels: anterior toward left and lateral (i.e.,temporal cortical layer 1) is toward bottom, similar to Fig. 7. The approximate positions of the images in A1 and B1 are indicatedby the rectangle in Fig. 1E. A1: low-magnification image of shell pathway. Di-I travels in 2 directions from site of application nearstimulation area (�): anterior-lateral to temporal cortex and posterior then out of slice plane. A2: medium magnification image ofa nearby section from same shell slice showing pattern of cortical labeling. Retrograde labeling of cells in layer 5 is apparent. Onlysparse labeling exists in layers 3–4. Area outlined by dashed box in infragranular layers is shown at expanded magnification in A3.Area outlined by box in supragranular layers is expanded in A4. A3: numerous pyramidal cells and processes in layer 5. A4: denseconcentrations of processes in layer 1. A5 and A6: high-magnification images from adjacent section illustrating processes in upperlayer 1. Black arrows point to probable axons containing beady varicosities. White arrows point to larger caliber processes whichare probably branches of apical dendrites of retrograde filled pyramidal cells. In other focal planes, dendritic branches displayedvisible spines. B: low-magnification image of shell pathway following Di-I application to temporal cortex (�). Orientation similarto A1. Arrow points to labeling in shell stimulation area. Note that pathway labeling continues past arrow (in posterior direction)toward target outside slice plane. Details of the shell slice tracing presented in RESULTS.
377AUDITORY THALAMOCORTICAL SYNAPTIC TRANSMISSION IN VITRO
J Neurophysiol • VOL 87 • JANUARY 2002 • www.jn.org

the cortex in the shell slice. The next section addresses thispossibility.
LAYER 5 CELLS PROJECT THROUGH THE SHELL STIMULATION
REGION TO THE INFERIOR COLLICULUS AND APPEAR TO HAVE
COLLATERAL PROJECTIONS TO LAYER 1. One possible source ofinput to layers 1 and 5 of the shell slice that does not involvedirect projections from the thalamus could be axon collateralsemanating from pyramidal cells in layer 5. Given the denseretrograde labeling of layer 5 cells following Di-I applicationin the shell area, it is clear their axons pass through theeffective stimulation sites. Thus it is possible that these cellscould be antidromically activated by the shell stimuli. If theyalso have collaterals projecting to layers 1 and 5, such anti-dromic activation could subsequently produce the observedsynaptic sinks in those layers.
The preceding scenario requires that the axons labeled inlayers 1 and 5 (following Di-I application in the shell region)were actually collaterals of the layer 5 cells that were “filled”in a secondary manner; first the dye would diffuse backwardalong the main axon to the cell bodies or collateral branchingpoints, then forward to the ends of the collaterals. This scenariowould also predict a similar pattern of labeling (i.e., somata inlayer 5, axons in layers 1 and 5) if Di-I could be placed at thetermination of the main axons, wherever that might be. Be-cause the back-filled layer 5 cells in the shell tracing experi-ments appeared to be at the depth of cortico-tectal cells, wehypothesized that they might ultimately project to the tectumand that the effective stimulation site in the shell slice wasactually part of the cortico-tectal path. To test this hypothesis,we placed particles of Di-I (50–100 �M diam) bilaterally inthe inferior colliculus of five whole fixed brains, allowed 2–4mo for diffusion (30–35°C), then sectioned them at 50 �M(horizontal plane) and compared the patterns to those foundpreviously in the shell slice.
The results are illustrated in Fig. 11. Panel A shows a sectionat a level similar to the shell slice examples in Fig. 10, A1 andB. Notice the strong labeling of the pathway through the areatypically effective for stimulation in the shell slices (arrow).The pattern of temporal cortical labeling is shown in B, wherethere are clearly filled pyramidal somata in layer 5, at approx-imately the same depth as in the shell slice (Fig. 10A2). Someof these cells, and cortical layers 1–4 above them, are shownat higher magnification in C. Besides somata, many labeledprocesses can be seen in layer 5; higher magnification inspec-tion revealed that some had beady varicosities and were prob-ably axons (not shown). In addition, some processes projecttoward the upper layers, and one can be seen reaching super-ficial layer 1. Part of layers 1–2 for this section (outlined in C)is shown at still higher magnification in the F. In addition to theend of the large process mentioned in the preceding text,several other axons can be seen ascending into layer 1. Fur-thermore a matrix of small caliber, lightly fluorescing pro-cesses can be seen in the very superficial parts of layer 1. D andE illustrate upper layer 1 axons more clearly (these sectionswere adjacent to F).
Each of the five brains tested exhibited clear labeling of thepathway through the shell area, and many layer 5 pyramidalcells in temporal cortex. Furthermore, 4/5 brains had clearaxons in layers 1 and 5. These data confirm the hypothesis thataxons belonging to layer 5 cortico-tectal cells project through
the shell stimulation region on their way to the inferior col-liculus. Further, the pattern of intracortical axonal labeling isconsistent with the hypothesis that the same layer 5 cells withaxons passing through the shell region also have collaterals tolayers 1 and 5. Thus it is possible that antidromic activation ofthese cells could contribute to the synaptic CSD sinks observedin the shell slice, via contacts made by their axon collaterals.
D I S C U S S I O N
The major finding of this study is that an in vitro preparationcan be obtained from the mouse brain that contains function-ally intact thalamocortical connections from the MGv to theACx. Stimulation of the MGv in this preparation (i.e., theprimary slice) activates not only thalamocortical synapses butalso appears capable of initiating polysynaptic activity, indi-cating the presence of at least partially intact intracorticalconnectivity. A second major finding is that auditory thalamo-cortical transmission involves both AMPA and NMDA typesof glutamate receptors. Third, this paper presents (for the firsttime, to our knowledge) a detailed description of laminar CSDprofiles in ACx evoked by MG stimulation. Fourth, we ob-served that these MG-evoked profiles, and the intracellularresponses in layer 4, differ from those produced by conven-tional columnar stimulation, indicating that columnar stimula-tion may not be a reliable means of selectively activatingthalamocortical inputs. Finally, a second in vitro preparation(the shell slice) is presented in which subcortical stimulationappears to selectively activate synapses in superficial layer 1 oftemporal cortex. This observation is consistent with knownprojections of nonprimary auditory thalamic nuclei near thestimulation site, suggesting that the preparation may provide atool for investigating mechanisms of a nonprimary system;however, alternative interpretations are also presented. Each ofthese findings will be elaborated in the following text.
Primary slice includes functionally intact thalamocorticalconnections from the MGv to ACx: histology, tract tracing,and laminar physiology
MAJOR CONNECTION IS FROM MGV TO MIDDLE LAYERS OF ACX.
Gross anatomical observations, Nissl stains, and PV-immuno-histochemistry all indicated that parts of the MGv and primaryACx were contained in the primary slice. Consistent with this,the Di-I tracing experiments in the primary slice showed majorprojections from the MG to cortical layers 3–4, the principaltarget zone of MGv axons (Caviness and Frost 1980; Romanskiand LeDoux 1993; Willard and Ryugo 1983; reviewed inWiner 1992). Furthermore, stimulation of the MG-evoked re-sponses in auditory cortex that were dominated by fast CSDsinks in layers 3–4. Together these data strongly support thehypothesis that the primary slice contains functional projec-tions from MGv to middle layers of primary ACx, and thatactivation of these projections was the predominant cause ofthe observed responses. Additional support comes from theobservation that similar middle layer responses could also beobtained from stimulation of the superior thalamic radiation(Fig. 2C) or “downstream” parts of the thalamocortical path-way (e.g., in the striatum; Fig. 7A1), but could not be evokeda mere 100–200 �M outside of the pathway (e.g., in thehippocampus, LG, or ventral-basal nucleus) even when these
378 S. J. CRUIKSHANK, H. J. ROSE, AND R. METHERATE
J Neurophysiol • VOL 87 • JANUARY 2002 • www.jn.org

ineffective regions were closer to the cortex than the effectivesites. Thus nonspecific activation, or spread of stimulationcurrent to the cortex itself, is highly unlikely (Agmon andConnors 1991). It should be made clear that stimulation outsidethe MG (in primary slice experiments) was limited to prelim-inary characterization of the slices before formal data collec-tion; responses described in RESULTS were exclusively evokedby stimulation of the MG proper or the border between the MGand superior thalamic radiation but never further downstream(see Metherate and Cruikshank 1999 for effective loci alongthe pathway).
SECONDARY INPUTS TO LAYERS 1 AND 5–6. In addition to themiddle layer CSD sinks, the primary slices also sometimes had
fast secondary sinks in the deep layers and/or at the surface oflayer 1. Based on onset latency comparisons with the mainsink, it was suggested in RESULTS that these secondary sinksmight represent monosynaptic responses to direct thalamicinputs (LAMINAR RESPONSE PROFILE OF PRIMARY SLICE IS DOMINATED
BY MIDDLE LAYER CSD SINK). Consistent with such direct inputs,Di-I application in the MG often resulted in labeled axons inlayers 5–6 and occasionally in layer 1 (in addition to themiddle layers—discussed in the preceding text). Cells in theMGv could be the origin of some of these secondary inputs.For example, MGv projections are known to branch in theinfragranular cortical layers around the junction between layers5 and 6 (Romanski and LeDoux 1993; Willard and Ryugo
FIG. 11. Di-I application in the inferior colliculus of whole fixed brains: labeling of layer 5 pyramidal cells with axons goingthrough shell stimulation region, and axons in layer 1. Orientation for all panels: anterior toward left, and lateral (i.e., temporalcortical layer 1) toward bottom, similar to Fig. 10. Di-I was placed in the inferior colliculus, outside planes of images.A: low-magnification image at approximately same plane as Fig. 10A1, showing labeled tract through position typically effectivefor shell stimulation (arrow), and continuing toward temporal cortex. B: medium-magnification image of a nearby section fromsame brain showing pattern of temporal cortical labeling. Retrograde labeling of cells in layer 5 is apparent. Dashed box outlinesa region of layers 1–5 that is expanded in C. C: expanded image illustrating layer 5 pyramidal cells and ascending processes, 1 ofwhich clearly reaches superficial layer 1 (bottom). Dashed box in C outlines a region of layers 1–2 that is expanded in F. D–F:high-magnification images from same section (F) and two adjacent sections (D and E) illustrating processes in layers 1–2.Ascending processes can be observed crossing the layer 1–2 border in D and F. Many fine horizontally oriented processes, somewith varicosities, can be seen close to the surface of layer 1. Thick white lines just beyond cortical surface in E and F are bubbleartifacts. See RESULTS for more explanation.
379AUDITORY THALAMOCORTICAL SYNAPTIC TRANSMISSION IN VITRO
J Neurophysiol • VOL 87 • JANUARY 2002 • www.jn.org

1983), and some reports also indicate a sparse projection tolayer 1 (Cetas et al. 1999; Romanski and LeDoux 1993).Another possible source of the secondary inputs is the medialdivision of the MG (MGm), which was often part of theprimary slice. The major targets of MGm are layers 1 and 5–6(Herkenham 1980; Linke and Schwegler 2000; Ryugo andKillackey 1974; Willard and Ryugo 1983). Finally, the PPDmight have contributed to the superficial input; it reportedlyhas robust layer 1 projections (Linke and Schwegler 2000) andwas generally part of the bottom of the primary slice.
CORTICOTHALAMIC CELLS AND POSSIBLE NONSYNAPTIC ACTIV-
ITY. Many infragranular pyramidal cells underwent retro-grade labeling after Di-I application in the MG, indicating thatthere were corticothalamic projections within the slice. This isan interesting finding in its own right, suggesting that thepreparation might provide a means to investigate corticotha-lamic transmission (Bartlett and Smith 1999; Castro-Alaman-cos and Calcagnotto 1999; Golshani et al. 1998; Kao andCoulter 1997). It also reveals the possibility that corticotha-lamic pyramidal cells could be antidromically activated by MGstimulation and thereby contribute to MG-evoked responseseither directly or synaptically (via intracortical axon collater-als). However, Rose and Metherate (2001), using this samepreparation, showed that the probability of antidromically ac-tivating infragranular cells with MG stimulation was �3%(2/69 cells). Rose and Metherate tested with �500-�A stimu-lus intensities, whereas intensities in the laminar experimentsof the present study were limited 200 �A, presumably decreas-ing chances of antidromic activation even further. Along theselines, blockade of synaptic transmission in the present study(with low-calcium ACSF) profoundly suppressed evoked re-sponses in all layers, indicating little antidromic or other non-synaptic contributions. In fact, virtually no responses remainedin the middle and superficial layers of any tested slices, pro-viding a potentially interesting contrast with the somatosensorythalamocortical system (Agmon and Connors 1991). However,in two slices, the deep infragranular layers did maintain smallnarrow field potentials in low calcium; these could representantidromic spikes, and if the cells that produced them were tohave local collateral synapses, they might contribute further tothe sinks in normal ACSF.
Intracellular recordings in layers 3–4 reveal that auditorythalamocortical transmission is mediated by both AMPAand NMDA receptors and that thalamic stimuli caninitiate intracortical activity in vitro
LAYER 3–4 CELLS HAVE EARLY AND LATE INTRACELLULAR
RESPONSES. Intracellular recordings were made from neuronslocated near the major sink and zone of thalamocortical termi-nation in layers 3–4. This location was chosen to optimizechances of recording from cells that received direct thalamicinput. There were two major temporal components to theMG-evoked responses in these cells that were referred to as theearly and late responses. The early responses had short laten-cies and durations that generally matched the local field po-tentials and CSD sinks, suggesting they were part of theunderlying basis of the sinks. They also had consistent shapesfrom trial to trial. In contrast, the late responses had longdurations and were far less consistent from trial to trial, some-times failing entirely. Early and late responses were further
differentiated by their sensitivities to a number of manipula-tions designed to suppress polysynaptic activity; all of themdepressed the late responses much more than the early re-sponses, consistent with the late responses being predomi-nantly polysynaptic intracortical phenomenon, and the earlyresponses depending on fewer synaptic links. Exactly howmany links are involved in the early response remains to bedetermined. The correlation between the onsets of the earlyPSP and the fast sink (and field potential) combined with theobserved and known projections of the MGv to layers 3–4,suggests that the fastest parts of the early EPSPs are monosyn-aptic. However, it is clear that the IPSPs within the earlyresponse must be di- or polysynaptic (discussed in the follow-ing text). Experiments are underway to address the issue ofsynaptic order. As alluded to at the beginning of the DISCUSSION,the presence of long-lasting polysynaptic activity indicates thatsome functionally intact intracortical networks are preserved inthe preparation, and that they can be activated by thalamicinputs. This broadens the utility of the primary slice prepara-tion. For a more extensive discussion of these late responses,see Metherate and Cruikshank (1999).
EARLY RESPONSES WERE COMPOSED OF FAST AND SLOW EPSPS
AND FAST IPSPS. The relatively “secure” early responses werethemselves composed of three subcomponents. First, there wasa fast AMPA/KA receptor-mediated EPSP, which typicallyhad a weak conventional voltage dependence (Fig. 5C1) (Coxet al. 1992; Jones and Baughman 1988). A second component,present in most cells, was a fast IPSP. In cases where this IPSPwas robust, it usually had a reversal potential between theresting membrane potential and spike threshold (Fig. 5A),consistent with a GABAA receptor mechanism (Avoli 1986;Connors et al. 1988; Cox et al. 1992; Hefti and Smith 2000).On average, the IPSPs followed the onset of the fast EPSP by�3 ms, enough time for at least one synaptic delay. This issupported by the observation that IPSPs were blocked byCNQX (see also Hablitz and Sutor 1990; Metherate and Ashe1994); if the IPSPs had been the result of direct inhibitoryprojections from the thalamus, then antagonism of AMPA/KAreceptors could not have blocked them. Instead, it is likely thatexcitatory thalamic projections drove cortical inhibitory inter-neurons to fire and those interneurons synapsed on the recordedcells, producing the IPSPs (discussed in Castro-Alamancos andConnors 1997; Douglas and Martin 1991; Porter et al. 2001).This provides additional confidence that the preparation be-haves in the expected way for a thalamocortical system. Thethird major component of the early response was a slowNMDA receptor-mediated EPSP. The pharmacologically iso-lated slow EPSPs typically had nonconventional voltage de-pendencies, gradual rising and decay phases, and relatively latepeaks, all of which distinguished them from the fast EPSPs. Insome cases, the isolated slow EPSP also appeared to have alonger onset latency than the fast EPSP (e.g., Fig. 5A), sug-gesting the possibility that the recorded slow EPSPs may nothave been monosynaptic.
TRANSMISSION AT THALAMOCORTICAL SYNAPSES APPEARS TO
BE MEDIATED BY BOTH NMDA AND AMPA/KA RECEPTORS. Thelatency issue just mentioned appears to complicate the phar-macological data, and so some additional explanation will bepresented regarding what these data might say about transmis-sion at thalamocortical synapses. The basic protocol after re-
380 S. J. CRUIKSHANK, H. J. ROSE, AND R. METHERATE
J Neurophysiol • VOL 87 • JANUARY 2002 • www.jn.org
cording control responses was to first apply CNQX alone, thenCNQX � APV, followed by CNQX alone again, and finallycontrol ACSF (order illustrated in Fig. 5C3). Importantly, itwas found that combined application of CNQX � APV com-pletely blocked the middle layer responses in both intracellularand extracellular recordings. This indicates, with near cer-tainty, that transmission at the middle layer thalamocorticalsynapses is mediated by NMDA receptors or AMPA/KA re-ceptors or both. Because CNQX by itself left a clear slowcomponent that was reversibly blocked by APV, it is highlyprobable that part of the monosynaptic thalamocortical re-sponse is mediated by NMDA receptors, even if the recordedresponses were not definitively monosynaptic (i.e., hence thesometimes longer latency in CNQX). This subtractive logiccannot be used to implicate AMPA/KA receptors because APVwas never applied by itself. However, if one assumes that thefast EPSP in the middle layers is a monosynaptic event, thenthe virtually complete suppression of the fast EPSP by CNQX(RESULTS; Fig. 5) does implicate AMPA/KA receptors in trans-mission at thalamocortical synapses. Although it is difficult toprove that a response is monosynaptic, the fast EPSPs and thefast field potentials were recorded at the cortical focus, whichin the pharmacological experiments was confirmed to be theposition with the shortest latency middle layer field potential.Finally, other studies point to the involvement of AMPA/KAreceptors in thalamocortical transmission (Armstrong-James etal. 1993; Gil and Amitai 1996a; Hagihara et al. 1988; Salt et al.1995; reviewed in Castro-Alamancos and Connors 1997).
Differences in IPSPs and laminar profiles produced by MGvs. conventional stimulation; relationship to acousticresponses in vivo
Generally, the IPSPs produced by MG stimulation wereweaker than expected based on previous ACx slice studies inwhich stimuli were delivered in a conventional fashion, towhite matter/layer 6 below the recording site (on-beam)(Buonomano and Merzenich 1998; Metherate and Ashe 1994).The natural question that emerged was whether this was due todifferences between the inputs activated by the two types ofstimuli or if some other variable(s) produced the lower thanexpected inhibitory drive in the present study. For example, itis known that some aspects of cortical inhibitory systems arenot fully developed in juvenile rodents (e.g., Dunning et al.1999; Luhmann and Prince 1991; reviewed in Sutor and Luh-mann 1995). In fact, this was indicated by the relatively modestcortical PV labeling observed here; PV is a marker for a classof cortical inhibitory neurons and is expressed at much higherlevels in the adult mouse ACx (Cruikshank et al. 2001; del Rioet al. 1994). Another possibility was that the slicing procedureor some other aspect of the preparation compromised inhibi-tion. To control for these potential preparation-dependent ef-fects, we directly compared on-beam- and MG-evoked IPSPswithin the same slices. On-beam stimulation generally pro-duced robust IPSPs. Thus although the inhibition might not befully developed in these juvenile slices, this did not precludeclear expression of inhibitory responses using conventionalstimulation. In contrast, for the same neuron, MG-evokedIPSPs were weaker even when EPSP strengths were matched.These findings indicated that MG and on-beam stimuli do notactivate the same sets of synapses in cortex. This conclusion
was further supported by the observation that MG and on-beamstimuli evoked different laminar profiles. While the MG stim-uli produced expected profiles with dominant middle layerCSD sinks, on-beam stimuli evoked profiles that were highlyvariable between slices and whose largest sinks rarely appearedin the middle layers. The laminar profiles undoubtedly dependon the origins and targets of the cells and axons near thestimulating electrodes; it is possible that these factors differbetween slices more for the on-beam stimuli than the MGstimuli, contributing to the greater response variability.
It remains to be determined whether or not the corticalactivation (e.g., IPSP magnitude and laminar profile) producedby MG stimulation in the primary slice represents a “natural”pattern, similar to that produced by acoustic stimulation invivo. Some basis for optimism emerges by comparing thepresent results with the laminar patterns of click-evoked re-sponses in vivo. Recordings from ACx of rodents and primatesindicate that the fastest evoked CSD sinks occur most consis-tently in layers 3–4, and in some cases, about equally fastsmaller sinks occur in layers 5–6, similar to the MG-evokedpattern here (Barth and Di 1990; Muller-Preuss and Mitzdorf1984; Steinschneider et al. 1992). On the other hand, intracel-lular sound-evoked responses of ACx cells in vivo have clearIPSPs (de Ribaupierre et al. 1972; Metherate and Ashe 1996;Volkov and Galazyuk 1992), which may differ from thepresent results. However, it is difficult to compare IPSPs acrossstudies because the degree to which they can be observed, andtheir amplitudes, depends heavily on methodology and criteria.These issues might best be resolved by combining in vivo andin vitro approaches within a single study e.g., in vivo record-ings of responses evoked by both sound and MG stimulation,combined with in vitro thalamocortical experiments from thesame brains.
Shell slice
SHELL NUCLEI OF THE AUDITORY THALAMUS ARE DISTINCT
FROM MGV. The rodent auditory thalamus includes a constel-lation of nonprimary nuclei that surround the primary MGv ina shell-like fashion (Cruikshank et al. 2001). As indicated inthe INTRODUCTION, these nonprimary nuclei are distinguishedfrom the MGv by their distinct physiological and anatomicalproperties, including strong projections to layer 1 (Herkenham1980; Linke and Schwegler 2000; Ryugo and Killackey 1974;Willard and Ryugo 1983; reviewed in Winer 1992). Fewgroups have investigated the functional effects of the nonpri-mary inputs to ACx (Weinberger et al. 1995b), but discoveriesby Barth and colleagues are intriguing. They found that stim-ulation of one of the subdivisions (the posterior intralaminarnucleus—they refer to it as PIL, but we will use the moreconventional PIN) induces high-frequency (gamma band) os-cillations in ACx (Barth and MacDonald 1996; Sukov andBarth 2001). In addition, prolonged stimulation of PIN pro-duced steady increases in cortical cell excitability, depolariza-tion, and spiking. Based on laminar analysis, the inputs respon-sible for these effects were hypothesized to be on layer 1dendrites (Sukov and Barth 1998). To investigate cellularmechanisms by which nonlemniscal systems regulate corticalactivity, we began to look at the feasibility of obtaining a slicepreparation with intact nonlemniscal projections, and so theshell slice was developed.
381AUDITORY THALAMOCORTICAL SYNAPTIC TRANSMISSION IN VITRO
J Neurophysiol • VOL 87 • JANUARY 2002 • www.jn.org
MANY FEATURES OF THE SHELL SLICE SUGGEST AN INTACT
PROJECTION FROM PPD TO LAYER 1. The shell slice was takenfrom the region of the brain immediately below the primary sliceand, in the majority of cases, appeared to contain the PPD andnonprimary auditory cortex. These two regions have beenshown to be interconnected via projections from PPD to layer1 (Linke and Schwegler 2000). Stimulation of the region in ornear the PPD (referred to as the shell region) produced adominant sink at the surface of layer 1 in nearly every case.That sink was mediated by synaptic transmission as indicatedby the effects of low calcium and glutamate antagonists. Thelatency of the surface sink matched the fast intracellular PSPsrecorded from middle layer cells, suggesting that the PSPsmight be produced by synapses in layer 1 on apical dendritesof the recorded cells. Consistent with this scenario, applicationof tracer in the shell stimulation region produced relativelydense fiber labeling in superficial layer 1 and very little inlayers 3–4. Shell stimulation also produced long-duration lateresponses with large fluctuations. The late responses appearedto be induced more easily with shell stimulation than with MGstimulation (in the primary slice). In a previous study, weshowed that virtually identical late potentials had fluctuationswith significant power in the gamma band (Metherate andCruikshank 1999). These observations are broadly consistentwith the finding by Barth and colleagues that stimuli presumedto activate nonlemniscal pathways evoke cortical gamma bandactivity whereas lemniscal stimulation does not (Barth andMacDonald 1996). In summary, the data from the shell slicereviewed thus far support the hypothesis that the preparationcontains a nonlemniscal pathway from PPD to layer 1 oftemporal cortex, and that stimulation of this pathway causedthe observed responses.SOME OR ALL OF THE SHELL SLICE RESPONSES MIGHT BE MEDIATED
BY AXON COLLATERALS OF ANTIDROMICALLY ACTIVATED COR-
TICOTECTAL CELLS. Although about two-thirds of the shellslices contained at least part of the PPD, the other one-thirdappeared to be located more ventrally, entirely below any ofthe auditory thalamic nuclei (ANATOMICAL FEATURES OF THE
SHELL SLICE), indicating that the presence of these nuclei werenot required for shell-type responses. In addition, the effectivestimulation sites, and the subcortical components labeled aftercortical Di-I applications, mostly involved a narrow whitematter tract rather than auditory thalamic nuclei (see precedingtext). Finally, there was a low incidence of retrograde filling ofthalamic somata after cortical Di-I application. These resultshinted that the nonprimary auditory thalamic nuclei may not bea major source of cortical input within the shell slice, leadingto a search for an alternative explanation. The high incidenceof retrograde-filled layer 5 pyramidal cells seen after dyeapplication at the shell stimulation site provided a clue: be-cause they were labeled, their axons must have passed throughthe stimulation site (Clerici and Coleman 1990; Rouiller andWelker 1991). Given this, it seemed likely that shell stimulicould activate these cells antidromically. If they also had axoncollaterals to layer 1, they might contribute to the surface sink.Such a mechanism would be consistent with the conspicuousnonsynaptic field potentials in the lower and middle layers ofthe shell slice; the lower layer component could result fromsomatic spikes and the middle layers potentials could be pro-duced by depolarization and/or spiking in proximal apicaldendrites (Stuart and Sakmann 1994). Along these lines, the
single infragranular cell recorded in this study appeared todisplay antidromic spiking. The laminar position of the back-labeled cells suggested that they might project to the tectum, socontrol tracing experiments were conducted in which Di-I wasplaced in the inferior colliculus to determine whether or notaxons of auditory corticotectal cells passed through the shellstimulation area and if these cells had collateral branches tolayer 1. Both questions were answered positively; therefore itis possible that this indirect mode of activation contributed tothe layer 1 sink.
The implications of the last “control results” are worthadditional emphasis. They indicate that a structure exists thatcould produce the layer 1 sink without a direct orthodromicprojection from thalamus. However, it does not prove that thishypothetical mode of activation actually occurs or that directinput from the nonprimary auditory thalamus had no role. Itsimply means that the “layer 5 cell” alternative cannot, atpresent, be ruled out. Future experiments, possibly employingtectal stimulation combined with MG inactivation in vivo(Edeline et al. 2001), could resolve this issue.
Conclusions
In summary, the primary slice is an in vitro preparationcontaining functionally intact portions of the primary auditorythalamocortical system. Just as the analogous somatosensorythalamocortical slice has proven an invaluable tool for eluci-dating fundamental mechanisms in that system (see INTRODUC-TION), so too should the primary slice for the auditory thalamo-cortical system. In fact, this has already begun with the presentwork (cf., the pharmacological and laminar results) and withpreviously published studies conducted in parallel (Hsieh et al.2000; Metherate and Cruikshank 1999; Rose and Metherate2001). In contrast, the shell slice may constitute a “nonpri-mary” in vitro system. This possibility was supported by areasonable body of evidence, although a plausible alternativeinterpretation was presented. Thus at present it should be usedwith caution. At any rate, the shell slice does appear to providea novel way of selectively activating layer 1 synapses withextrinsic stimulation (Cauller and Connors 1994; Hess andDonoghue 1999). In closing, it should be mentioned that theremay be an alternative to the shell slice for activating a nonpri-mary pathway in vitro. This would involve stimulation of theMGm within the primary slice. The MGm was often includedwithin the primary slice. Assuming its projections to the ACxare intact, this preparation would have the added asset ofcontaining both primary and nonprimary systems within thesame slice, allowing for the study of their interaction.
This work was supported by National Institutes of Health Grants DC-02967and DA-12929 and by California Tobacco-Related Disease Research ProgramGrant 8RT-0059.
REFERENCES
AGMON A AND CONNORS BW. Thalamocortical responses of mouse somato-sensory (barrel) cortex in vitro. Neuroscience 41: 365–379, 1991.
AGMON A AND CONNORS BW. Correlation between intrinsic firing patterns andthalamocortical synaptic responses of neurons in mouse barrel cortex. J Neu-rosci 12: 319–329, 1992.
AGMON A, HOLLRIGEL G, AND O’DOWD DK. Functional GABAergic synapticconnection in neonatal mouse barrel cortex. J Neurosci 16: 4684–4695,1996.
382 S. J. CRUIKSHANK, H. J. ROSE, AND R. METHERATE
J Neurophysiol • VOL 87 • JANUARY 2002 • www.jn.org

ALLON N, YESHURUN Y, AND WOLLBERG Z. Responses of single cells in themedial geniculate body of awake squirrel monkeys. Exp Brain Res 41:222–232, 1981.
ARMSTRONG-JAMES M, WELKER E, AND CALLAHAN CA. The contribution ofNMDA and non-NMDA receptors to fast and slow transmission of sensoryinformation in the rat SI barrel cortex. J Neurosci 13: 2149–2160, 1993.
ARNAULT P AND ROGER M. Ventral temporal cortex in the rat: connections ofsecondary auditory areas Te2 and Te3. J Comp Neurolol 302: 110–123,1990.
AVOLI M. Inhibitory potentials in neurons of the deep layers of the in vitroneocortical slice. Brain Res 370: 165–170, 1986.
BAI L, YANG Q, AND WU J-Y. High frequency components of cortical popu-lation activity are sensitive to alteration of inhibitory network. Soc NeurosciAbstr 26: 548.513, 2000.
BARTH DS AND DI S. Three-dimensional analysis of auditory-evoked potentialsin rat neocortex. J Neurophysiol 64: 1527–1536, 1990.
BARTH DS AND MACDONALD KD. Thalamic modulation of high-frequencyoscillating potentials in auditory cortex. Nature 383: 78–81, 1996.
BARTLETT EL AND SMITH PH. Anatomic, intrinsic, and synaptic properties ofdorsal and ventral division neurons in rat medial geniculate body. J Neuro-physiol 81: 1999–2016, 1999.
BERRY MS AND PENTREATH VW. Criteria for distinguishing between mono-synaptic and polysynaptic transmission. Brain Res 105: 1–20, 1976.
BORDI F AND LEDOUX JE. Response properties of single units in areas of ratauditory thalamus that project to the amygdala. I. Acoustic discharge pat-terns and frequency receptive fields. Exp Brain Res 98: 261–274, 1994.
BUONOMANO DV AND MERZENICH MM. Net interaction between differentforms of short-term synaptic plasticity and slow-IPSPs in the hippocampusand auditory cortex. J Neurophysiol 80: 1765–1774, 1998.
CALFORD MB. The parcellation of the medial geniculate body of the cat definedby the auditory response properties of single units. J Neurosci 3: 2350–2364, 1983.
CASTRO-ALAMANCOS MA AND CONNORS BW. Thalamocortical synapses. ProgNeurobiol 51: 581–606, 1997.
CASTRO-ALAMANCOS MA AND CALCAGNOTTO ME. Presynaptic long-term po-tentiation in corticothalamic synapses. J Neurosci 19: 9090–9097, 1999.
CAULLER LJ AND CONNORS BW. Synaptic physiology of horizontal afferents tolayer I in slices of rat SI neocortex. J Neurosci 14: 751–762, 1994.
CAVINESS VS JR. Architectonic map of neocortex of the normal mouse. J CompNeurolol 164: 247–263, 1975.
CAVINESS VS JR AND FROST DO. Tangential organization of thalamic projec-tions to the neocortex in the mouse. J Comp Neurol 194: 335–367, 1980.
CETAS JS, DE VENECIA RK, AND MCMULLEN NT. Thalamocortical afferents ofLorente de No: medial geniculate axons that project to primary auditorycortex have collateral branches to layer I. Brain Res 830: 203–208, 1999.
CLERICI WJ AND COLEMAN JR. Anatomy of the rat medial geniculate body. I.Cytoarchitecture, myeloarchitecture, and neocortical connectivity. J CompNeurolol 297: 14–31, 1990.
CONNORS BW AND GUTNICK MJ. Intrinsic firing patterns of diverse neocorticalneurons. Trends Neurosci 13: 99–104, 1990.
CONNORS BW, MALENKA RC, AND SILVA LR. Two inhibitory postsynapticpotentials, and GABAA and GABAB receptor-mediated responses in neo-cortex of rat and cat. J Physiol (Lond) 406: 443–468, 1988.
COX CL, METHERATE R, WEINBERGER NM, AND ASHE JH. Synaptic potentialsand effects of amino acid antagonists in the auditory cortex. Brain Res Bull28: 401–410, 1992.
CREPEL V AND BEN-ARI Y. Intracellular injection of a Ca2� chelator preventsgeneration of anoxic LTP. J Neurophysiol 75: 770–779, 1996.
CRUIKSHANK SJ, KILLACKEY HP, AND METHERATE R. Parvalbumin and calbin-din are differentially distributed within primary and secondary subregions ofthe mouse auditory forebrain. Neuroscience 105: 553–569, 2001.
CRUIKSHANK S, ROSE H, AND METHERATE R. In vitro physiological comparisonof MGv inputs to layer 3/4 of auditory cortex vs. nonlemniscal inputs tolayer 1. Soc Neurosci Abstr 25: 1665, 1999.
DE RIBAUPIERRE F. Acoustical information processing in the auditory thalamusand cerebral cortex. In: The Central Auditory System, edited by Ehret G andRomand R. New York: Oxford, 1997, chapt. 5, p. 317–397.
DE RIBAUPIERRE F, GOLDSTEIN MH JR, AND YENI-KOMSHIAN G. Intracellularstudy of the cat’s primary auditory cortex. Brain Res 48: 185–204, 1972.
DEL RIO JA, DE LECEA L, FERRER I, AND SORIANO E. The development ofparvalbumin-immunoreactivity in the neocortex of the mouse. Brain ResDev Brain Res 81: 247–259, 1994.
DOUGLAS RJ AND MARTIN KA. A functional microcircuit for cat visual cortex.J Physiol (Lond) 440: 735–769, 1991.
DUNNING DD, HOOVER CL, SOLTESZ I, SMITH MA, AND O’DOWD DK.GABA(A) receptor-mediated miniature postsynaptic currents and alpha-subunit expression in developing cortical neurons. J Neurophysiol 82:3286–3297, 1999.
EDELINE J-M, HARS B, COTILLON N, AND HENNEVIN E. Muscimol diffusionafter intracerebral microinjections: a re-evaluation based on electrophysio-logical and autoradiographic quantifications. Neurobiol Learn Mem. Inpress.
EDELINE JM, MANUNTA Y, NODAL FR, AND BAJO VM. Do auditory responsesrecorded from awake animals reflect the anatomical parcellation of theauditory thalamus? Hear Res 131: 135–152, 1999.
EGGERMONT JJ. Representation of spectral and temporal sound features in threecortical fields of the cat. Similarities outweigh differences. J Neurophysiol80: 2743–2764, 1998.
EHRET G. The auditory cortex. J Comp Physiol [A] 181: 547–557, 1997.FELDMAN DE, NICOLL RA, AND MALENKA RC. Synaptic plasticity at thalamo-
cortical synapses in developing rat somatosensory cortex: LTP, LTD, andsilent synapses. J Neurobiol 41: 92–101, 1999.
FRANKLIN KB AND PAXINOS GP. The Mouse Brain in Stereotaxic Coordinates.San Diego, CA: Academic, 1997.
FRASSONI C, BENTIVOGLIO M, SPREAFICO R, SANCHEZ MP, PUELLES L, AND
FAIREN A. Postnatal development of calbindin and parvalbumin immunore-activity in the thalamus of the rat. Brain Res Dev Brain Res 58: 243–249,1991.
GIBSON JR, BEIERLEIN M, AND CONNORS BW. Two networks of electricallycoupled inhibitory neurons in neocortex. Nature 402: 75–79, 1999.
GIL Z AND AMITAI Y. Adult thalamocortical transmission involves both NMDAand non-NMDA receptors. J Neurophysiol 76: 2547–2554, 1996a.
GIL Z AND AMITAI Y. Properties of convergent thalamocortical and intracor-tical synaptic potentials in single neurons of neocortex. J Neurosci 16:6567–6578, 1996b.
GIL Z, CONNORS BW, AND AMITAI Y. Differential regulation of neocorticalsynapses by neuromodulators and activity. Neuron 19: 679–686, 1997.
GIL Z, CONNORS BW, AND AMITAI Y. Efficacy of thalamocortical and intra-cortical synaptic connections: quanta, innervation, and reliability. Neuron23: 385–397, 1999.
GOLSHANI P, WARREN RA, AND JONES EG. Progression of change in NMDA,non-NMDA, and metabotropic glutamate receptor function at the develop-ing corticothalamic synapse. J Neurophysiol 80: 143–154, 1998.
HABLITZ JJ AND SUTOR B. Excitatory postsynaptic potentials in rat neocorticalneurons in vitro. III. Effects of a quinoxalinedione non-NMDA receptorantagonist. J Neurophysiol 64: 1282–1290, 1990.
HAGIHARA K, TSUMOTO T, SATO H, AND HATA Y. Actions of excitatory aminoacid antagonists on geniculo-cortical transmission in the cat’s visual cortex.Exp Brain Res 69: 407–416, 1988.
HEFTI BJ AND SMITH PH. Anatomy, physiology, and synaptic responses of ratlayer V auditory cortical cells and effects of intracellular GABA(A) block-ade. J Neurophysiol 83: 2626–2638, 2000.
HERKENHAM M. Laminar organization of thalamic projections to the rat neo-cortex. Science 207: 532–535, 1980.
HESS G AND DONOGHUE JP. Facilitation of long-term potentiation in layer II/IIIhorizontal connections of rat motor cortex following layer I stimulation:route of effect and cholinergic contributions. Exp Brain Res 127: 279–290,1999.
HIERCK BP, IPEREN LV, GITTENBERGER-DE GROOT AC, AND POELMANN RE.Modified indirect immunodetection allows study of murine tissue withmouse monoclonal antibodies. J Histochem Cytochem 42: 1499–1502,1994.
HOF PR, GLEZER II, CONDE F, FLAGG RA, RUBIN MB, NIMCHINSKY EA, AND
VOGT WEISENHORN DM. Cellular distribution of the calcium-binding pro-teins parvalbumin, calbindin, and calretinin in the neocortex of mammals:phylogenetic and developmental patterns. J Chem Neuroanat 16: 77–116,1999.
HSIEH CY, CRUIKSHANK SJ, AND METHERATE R. Differential modulation ofauditory thalamocortical and intracortical synaptic transmission by cholin-ergic agonist. Brain Res 880: 51–64, 2000.
JOHNSTON D AND WU M-S. Foundations of Cellular Neurophysiology. Cam-bridge, MA: The MIT Press, 1995.
JONES KA AND BAUGHMAN RW. NMDA- and non-NMDA-receptor compo-nents of excitatory synaptic potentials recorded from cells in layer V of ratvisual cortex. J Neurosci 8: 3522–3534, 1988.
KAO CQ AND COULTER DA. Physiology and pharmacology of corticothalamicstimulation-evoked responses in rat somatosensory thalamic neurons invitro. J Neurophysiol 77: 2661–2676, 1997.
383AUDITORY THALAMOCORTICAL SYNAPTIC TRANSMISSION IN VITRO
J Neurophysiol • VOL 87 • JANUARY 2002 • www.jn.org

KENAN-VAKNIN G AND TEYLER TJ. Laminar pattern of synaptic activity in ratprimary visual cortex: comparison of in vivo and in vitro studies employingthe current source density analysis. Brain Res 635: 37–48, 1994.
KIRKWOOD A AND BEAR MF. Hebbian synapses in visual cortex. J Neurosci 14:1634–1645, 1994.
KUDOH M AND SHIBUKI K. Importance of polysynaptic inputs and horizontalconnectivity in the generation of tetanus-induced long-term potentiation inthe rat auditory cortex. J Neurosci 17: 9458–9465, 1997.
LEDOUX JE, RUGGIERO DA, FOREST R, STORNETTA R, AND REIS DJ. Topo-graphic organization of convergent projections to the thalamus from theinferior colliculus and spinal cord in the rat. J Comp Neurolol 264: 123–146,1987.
LEDOUX JE, RUGGIERO DA, AND REIS DJ. Projections to the subcorticalforebrain from anatomically defined regions of the medial geniculate bodyin the rat. J Comp Neurolol 242: 182–213, 1985.
LENNARTZ RC AND WEINBERGER NM. Frequency selectivity is related totemporal processing in parallel thalamocortical auditory pathways. BrainRes 583: 81–92, 1992.
LINKE R AND SCHWEGLER H. Convergent and complementary projections of thecaudal paralaminar thalamic nuclei to rat temporal and insular cortex. CerebCortex 10: 753–771, 2000.
LUHMANN HJ AND PRINCE DA. Transient expression of polysynaptic NMDAreceptor-mediated activity during neocortical development. Neurosci Lett111: 109–115, 1990.
LUHMANN HJ AND PRINCE DA. Postnatal maturation of the GABAergic systemin rat neocortex. J Neurophysiol 65: 247–263, 1991.
MCCORMICK DA, CONNORS BW, LIGHTHALL JW, AND PRINCE DA. Compara-tive electrophysiology of pyramidal and sparsely spiny stellate neurons ofthe neocortex. J Neurophysiol 54: 782–806, 1985.
MCGEE T, KRAUS N, LITTMAN T, AND NICOL T. Contributions of medialgeniculate body subdivisions to the middle latency response. Hear Res 61:147–154, 1992.
METHERATE R AND ASHE JH. Nucleus basalis stimulation facilitates thalamo-cortical synaptic transmission in the rat auditory cortex. Synapse 14: 132–143, 1993.
METHERATE R AND ASHE JH. Facilitation of an NMDA receptor-mediatedEPSP by paired-pulse stimulation in rat neocortex via depression ofGABAergic IPSPs. J Physiol (Lond) 481: 331–348, 1994.
METHERATE R AND ASHE JH. Mechanisms of dynamic afferent informationprocessing in sensory neocortex. In: Excitatory Amino Acids and the Cere-bral Cortex, edited by Conti F and Hicks P. Cambridge, MA: MIT Press,1996, chapt. 11, p. 119–125.
METHERATE R AND CRUIKSHANK SJ. Thalamocortical inputs trigger a propa-gating envelope of gamma-band activity in auditory cortex in vitro. ExpBrain Res 126: 160–174, 1999.
MITANI A AND SHIMOKOUCHI M. Neuronal connections in the primary auditorycortex: an electrophysiological study in the cat. J Comp Neurolol 235:417–429, 1985.
MITANI A, SHIMOKOUCHI M, ITOH K, NOMURA S, KUDO M, AND MIZUNO N.Morphology and laminar organization of electrophysiologically identifiedneurons in the primary auditory cortex in the cat. J Comp Neurolol 235:430–447, 1985.
MITZDORF U. Current source-density method and application in cat cerebralcortex: investigation of evoked potentials and EEG phenomena. Physiol Rev65: 37–100, 1985.
MULLER-PREUSS P AND MITZDORF U. Functional anatomy of the inferiorcolliculus and the auditory cortex: current source density analyses of click-evoked potentials. Hear Res 16: 133–142, 1984.
PHILLIPS DP. Central auditory processing: a view from auditory neuroscience.Am J Otol 16: 338–352, 1995.
PORTER JT, JOHNSON CK, AND AGMON A. Diverse types of interneuronsgenerate thalamus-evoked feedforward inhibition in the mouse barrel cortex.J Neurosci 21: 2699–2710, 2001.
ROMANSKI LM AND LEDOUX JE. Organization of rodent auditory cortex:anterograde transport of PHA-L from MGv to temporal neocortex. CerebCortex 3: 499–514, 1993.
ROSE HJ AND METHERATE R. Thalamic stimulation largely elicits orthodromic,rather than antidromic, cortical activation in an auditory thalamocorticalslice. Neuroscience 106: 341–340, 2001.
ROUILLER EM AND WELKER E. Morphology of corticothalamic terminalsarising from the auditory cortex of the rat: a Phaseolus vulgaris-leucoag-glutinin (PHA-L) tracing study. Hear Res 56: 179–190, 1991.
RYUGO DK AND KILLACKEY HP. Differential telencephalic projections of themedial and ventral divisions of the medial geniculate body of the rat. BrainRes 82: 173–177, 1974.
SAH P AND NICOLL RA. Mechanisms underlying potentiation of synaptictransmission in rat anterior cingulate cortex in vitro. J Physiol (Lond) 433:615–630, 1991.
SALT TE, MEIER CL, SENO N, KRUCKER T, AND HERRLING PL. Thalamocorticaland corticocortical excitatory postsynaptic potentials mediated by excitatoryamino acid receptors in the cat motor cortex in vivo. Neuroscience 64:433–442, 1995.
STEINSCHNEIDER M, TENKE CE, SCHROEDER CE, JAVITT DC, SIMPSON GV,AREZZO JC, AND VAUGHAN HG JR. Cellular generators of the corticalauditory evoked potential initial component. Electroencephalogr Clin Neu-rophysiol 84: 196–200, 1992.
STUART GJ AND SAKMANN B. Active propagation of somatic action potentialsinto neocortical pyramidal cell dendrites. Nature 367: 69–72, 1994.
SUKOV W AND BARTH DS. Three-dimensional analysis of spontaneous andthalamically evoked gamma oscillations in auditory cortex. J Neurophysiol79: 2875–2884, 1998.
SUKOV W AND BARTH DS. Cellular mechanisms of thalamically evoked gammaoscillations in auditory cortex. J Neurophysiol 85: 1235–1245, 2001.
SUTOR B AND LUHMANN HJ. Development of excitatory and inhibitory postsyn-aptic potentials in the rat neocortex. Perspect Dev Neurobiol 2: 409–419,1995.
VOLKOV IO AND GALAZYUK AV. Peculiarities of inhibition in cat auditorycortex neurons evoked by tonal stimuli of various durations. Exp Brain Res91: 115–120, 1992.
WEINBERGER NM. Dynamic regulation of receptive fields and maps in the adultsensory cortex. Annu Rev Neurosci 18: 129–158, 1995.
WEINBERGER NM, JAVID R, AND LEPAN B. Heterosynaptic long-term facilita-tion of sensory-evoked responses in the auditory cortex by stimulation of themagnocellular medial geniculate body in guinea pigs. Behav Neurosci 109:10–17, 1995.
WILLARD FH AND RYUGO DK. Anatomy of the central auditory system. In: TheAuditory Psychobiology of the Mouse (1st ed.), edited by Willott JF. Spring-field, IL: Charles C. Thomas, 1983, p. 201–304.
WINER JA. The functional architecture of the medial geniculate body andprimary auditory cortex. In: The Mammalian Auditory Pathway: Neuroanat-omy, edited by Webster DB, Popper AN, and Fay RR. New York: Springer-Verlag, 1992, p. 222–409.
WINER JA, KELLY JB, AND LARUE DT. Neural architecture of the rat medialgeniculate body. Hear Res 130: 19–41, 1999.
WREE A, ZILLES K, AND SCHLEICHER A. A quantitative approach to cytoarchi-tectonics. VIII. The areal pattern of the cortex of the albino mouse. AnatEmbryol 166: 333–353, 1983.
384 S. J. CRUIKSHANK, H. J. ROSE, AND R. METHERATE
J Neurophysiol • VOL 87 • JANUARY 2002 • www.jn.org