a genome-wide scan for evidence of selection in a maize ... · nome annotation, gene ontology...
TRANSCRIPT
INVESTIGATION
A Genome-Wide Scan for Evidence of Selectionin a Maize Population Under Long-Term
Artificial Selection for Ear NumberTimothy M. Beissinger,*,† Candice N. Hirsch,‡ Brieanne Vaillancourt,§,** Shweta Deshpande,††
Kerrie Barry,†† C. Robin Buell,§,** Shawn M. Kaeppler,*,‡‡ Daniel Gianola,†,§§ and Natalia de Leon*,‡‡,1
*Department of Agronomy, †Animal Sciences Department, ‡‡Department of Energy, Great Lakes Bioenergy Research Center,and §§Department of Dairy Science, and University of Wisconsin, Madison, Wisconsin 53706, ‡Department of Agronomy and
Plant Genetics, University of Minnesota, Saint Paul, Minnesota 55108, §Department of Plant Biology, and **Department ofEnergy, Great Lakes Bioenergy Research Center, Michigan State University, East Lansing, Michigan 48824, ††Department of Energy,
Joint Genome Institute, Walnut Creek, California 94598
ABSTRACT A genome-wide scan to detect evidence of selection was conducted in the Golden Glow maize long-term selectionpopulation. The population had been subjected to selection for increased number of ears per plant for 30 generations, with anempirically estimated effective population size ranging from 384 to 667 individuals and an increase of more than threefold in thenumber of ears per plant. Allele frequencies at .1.2 million single-nucleotide polymorphism loci were estimated from pooled whole-genome resequencing data, and FST values across sliding windows were employed to assess divergence between the populationpreselection and the population postselection. Twenty-eight highly divergent regions were identified, with half of these regionsproviding gene-level resolution on potentially selected variants. Approximately 93% of the divergent regions do not demonstratea significant decrease in heterozygosity, which suggests that they are not approaching fixation. Also, most regions display a patternconsistent with a soft-sweep model as opposed to a hard-sweep model, suggesting that selection mostly operated on standing geneticvariation. For at least 25% of the regions, results suggest that selection operated on variants located outside of currently annotatedcoding regions. These results provide insights into the underlying genetic effects of long-term artificial selection and identification ofputative genetic elements underlying number of ears per plant in maize.
CHANGES in allele frequency occur in populations under-going selection (e.g., Wright 1931; Crow and Kimura
1970). Understanding the patterns of such changes can pro-vide a wealth of information regarding the genetic factorsthat control traits under selection. By comparing the alleliccomposition of a population pre- and postselection, the ge-netic control of a trait may be revealed through the discov-ery of altered allele frequencies, assuming that selection
effects can be statistically separated from random geneticdrift (e.g., Krimbas and Tsakas 1971; Parts et al. 2011).Additionally, an improved understanding of the processesthat take place during selection will contribute to answeringlong-standing genetic questions. For instance, the relativelevels of diversity around selected sites may demonstratewhether selection has operated primarily on long-standingvariation or on relatively new mutations (Innan and Kim2004; Hermisson and Pennings 2005; Przeworski et al.2005). Work in this area has demonstrated that soft sweeps,or selection on standing variation, may often be found incases of polygenic traits (Strasburg et al. 2012) and areexpected to be common in human populations (reviewedby Pritchard et al. 2010). Another persistent question in-volves how rapidly selected sites approach fixation (Kimura1962), which can be addressed by an analysis of selectedsites once they are identified. Kelly et al. (2013) recentlydemonstrated a selection experiment in Mimulus for which
Copyright © 2014 by the Genetics Society of Americadoi: 10.1534/genetics.113.160655Manuscript received August 19, 2013; accepted for publication December 29, 2013;published Early Online December 30, 2013.Supporting information is available online at http://www.genetics.org/lookup/suppl/doi:10.1534/genetics.113.160655/-/DC1.Sequence data from this article have been deposited in the National Center forBiotechnology Information Sequence Read Archive under BioProject accession no.PRJNA194561.1Corresponding author: Department of Agronomy, University of Wisconsin, 1575Linden Dr., Moore Hall Room 459, Madison, WI 53706.E-mail: [email protected]
Genetics, Vol. 196, 829–840 March 2014 829
numerous partial sweeps, or selective sweeps that have notreached fixation, were found. The relative importance ofnongenic DNA is another long-standing question that maybe addressed by the identification of selected regions (e.g.,King and Wilson 1975; Wray 2007).
Previously, assessing allele frequencies in selected pop-ulations has been feasible only for an a priori set of candi-dates or for a limited set of random loci, due to the limitednumber of markers available and the cost of conducting theassays. However, the recent reduction in the cost of DNAsequencing and single-nucleotide polymorphism (SNP)detection (reviewed by Metzker 2010) now allows genome-wide characterization of allelic variants. Accordingly, multipleexperiments utilizing high-density SNP or sequence datato identify selected sites in both naturally and artificiallyselected populations and in both sexual and asexual spe-cies have been conducted (e.g., Akey et al. 2002; Parts et al.2011; Bigham et al. 2010; Turner et al. 2011). The goals ofthese experiments ranged from localizing selected sites forunknown traits in natural populations (Voight et al. 2006)to identifying quantitative trait loci for specific traits inexperimentally derived populations or crosses (Parts et al.2011).
The methods employed to identify selected sites innatural populations include assessment of variation betweenvs. within populations (Lewontin and Krakauer 1973; Akeyet al. 2002), detection of abnormalities in the site frequencyspectrum (SFS) (Payseur et al. 2002), and assessment oflocal patterns of linkage disequilibrium (LD) (Sabeti et al.2002, 2007; Voight et al. 2006) to find recent selectivesweeps (Maynard Smith and Haigh 1974). In natural pop-ulations, it is often difficult or impossible to evaluate thephenotypic effects of selected polymorphisms because manytraits are simultaneously selected in such populations andthe relative intensity of selection is unknown. In experimen-tal populations, however, selection is often deliberately con-ducted under controlled conditions, allowing for betterinference of the strength of selection and biological role ofgenes localized within potentially selected sites. Methods foridentifying selection in these artificially selected populationsmay include any of the methods utilized for natural popu-lations, but a benefit of these types of studies is that samplesof the progenitor population are frequently available, whichallows for direct measurement of allele frequency changes.Separation of selection vs. genetic drift effects has been per-formed by comparing allele frequencies to simulations ofdrift (Wisser et al. 2008) and by developing significancetests based on replicated or control populations (Partset al. 2011; Turner et al. 2011).
Long-term breeding projects in agricultural species, bothplants and animals, have generated excellent resources thatcan be leveraged for identifying loci that were affected byartificial selection. In animals, for instance, Johansson et al.(2010) worked with a population of chickens divergentlyselected for body size and found that the majority of changescan be attributed to selection on standing genetic variation
vs. new mutations. Another study using chickens identified82 putatively selected regions with reduced levels of hetero-zygosity (Qanbari et al. 2012). Similarly in cattle, Flori et al.(2009) found 13 regions that were under selection in recenthistory, a subset of which included genes previously knownto affect milk production. Also, Pan et al. (2013) identifiedselected regions in cattle based on LD and then verified thefunctional roles of several genes based on a review of ge-nome annotation, gene ontology enrichment analysis, andpathway enrichment analysis. Another interesting study incattle was conducted by Qanbari et al. (2011), whichemployed a multifaceted approach including both allele fre-quency- and LD-based methods to identify signatures ofselection.
Several studies scanning for selection in agricultural cropspecies have also been conducted. For instance, Wright et al.(2005) looked for evidence of selection across a set of 774maize genes and found that 2–4% had undergone selection.Recently, whole-genome studies have been conducted aswell; both Jiao et al. (2012) and Hufford et al. (2012)looked for signatures of selection by investigating diversesets of maize lines and highly dense marker sets. Thesestudies have also been conducted with other importantcrops, including soybeans (Lam et al. 2010) and rice (Heet al. 2011). Often, plant species have the advantage thatremnant seeds representing a population before selectionbegan often remain available for years or decades followingthe selection process itself (e.g., Odhiambo and Compton1987). This characteristic was utilized by Wisser et al.(2008), who compared marker data gathered from samplesbefore and after several generations of selection to identifyloci affecting northern leaf blight resistance in closed pop-ulations of maize that had undergone selection.
Maize is an important crop species that has beensubjected to artificial selection for �9000 years (Matsuokaet al. 2002). Modern research and breeding investmentshave provided numerous examples of existing maize popu-lations that have been selected for a particular trait overtime spans ranging from only a few cycles to .100 gener-ations (e.g., Odhiambo and Compton 1987; Coors andMardones 1989; Ross et al. 2006; Dudley 2007; Wisseret al. 2008). One such example involves the Golden Glowmaize selection project (Coors and Mardones 1989), whichhas undergone selection for a specific yield component, pro-lificacy, defined as the number of ears per plant. Selectionfor an increase in number of ears per plant was accom-plished using recurrent mass selection for 30 generations,maintaining a large effective population size (Ne) and strongselection intensity in the process. Selection succeeded inincreasing the mean number of ears per plant from 1.6 atcycle 0 to 4.9 by cycle 24 (de Leon and Coors 2002). Num-ber of ears per plant is a trait of particular interest to maizebreeders because it is highly correlated with grain yield anddensity tolerance (Russell 1984; Carlone and Russell 1987;Subandi 1990; Duvick 1997; Ahmad et al. 2011). In fact,Coors and Mardones (1989) reported a correlation between
830 T. M. Beissinger et al.
ears per plant and grain yield per plant of 0.90 through cycle12 of the Golden Glow population. Maita and Coors (1996)still found the correlation to be positive after 20 cycles ofselection (r = 0.71) and reported that increased number ofears per plant may improve the population’s ability to yieldin stress conditions. Additionally, number of ears per plant isof interest as a model trait because it is correlated with otherimportant agronomic traits, including lodging and moistureat harvest (Cross et al. 1987), and has been shown to bea secondary effect of maize domestication (Doebley et al.1990). Overall, the combination of large Ne, strong selectionintensity, substantial phenotypic response to selection, andpractical and biological relevance of the trait makes GoldenGlow an ideal crop model population to evaluate allele fre-quency changes resulting from selection.
The objectives of this study were to (1) estimate SNPallele frequencies in the cycle-30 selected population rela-tive to the initial population by pooled whole-genomeresequencing to scan for signatures of selection and (2)evaluate the putatively selected regions to assess whetherselected sites are approaching fixation, estimate the extentof selective sweeps and genetic hitchhiking, and explore theproportion of sites for which selection may have operated onintergenic as opposed to genic regions.
Materials and Methods
Germplasm
Selection for increased number of ears per plant in theGolden Glow maize population was initiated by J. H.Lonnquist at the University of Wisconsin in 1971. For thefirst 12 cycles of selection, selection intensity was main-tained at �2.5–5%. From the 13th cycle onward, the selec-tion intensity was made stronger, to between �0.5 and 1%.A complete description of the selection process was providedby de Leon and Coors (2002).
For the present experiment, 48 randomly chosen plantsfrom each of cycles 0 and 30 were utilized for analysis. Topreserve population seed samples over the decades, remnantseed from the original cycles was occasionally increasedthrough random mating of individual plants, utilizing largepopulation sizes to minimize unwanted changes in allelefrequency due to drift or unintentional selection. Whilegenetic drift was minimized during this process, it could notbe completely eliminated. The sample taken from cycle 0 hadincurred five generations of seed increase, utilizing onaverage 110 individuals each generation, while that fromcycle 30 had incurred two generations of increase, utilizingon average 130 individuals each generation.
DNA extraction, SNP genotyping, and sequencing
DNA extraction for array-based SNP genotyping was per-formed for each individual sampled. Leaf tissue was har-vested from 96 plants (48 from each population), followed byDNA extractions using the cetyl(trimethyl)ammonium bro-
mide (CTAB) method (Saghai-Maroof et al. 1984). Genotyp-ing was performed on the individual samples by PioneerHi-Bred International (Johnston, IA), using a 768-markermultiplex assay on the Illumina (San Diego) BeadArray plat-form (Jones et al. 2009). These array-based SNPs were usedonly for the determination of effective population size.
For the whole-genome resequencing, an equal amount oftissue from 48 seedlings from each population cycle washarvested and pooled. From each pool, DNA was extractedusing the CTAB method (Saghai-Maroof et al. 1984). Librar-ies with a target insert size of 270 bp were prepared accord-ing to the Illumina protocol. Libraries were sequenced usingthe Illumina HiSeq at the Department of Energy Joint Ge-nome Institute to generate 23 100 nucleotide pair-end (PE)sequence reads. Sequences are available in the SequenceRead Archive at the National Center for Biotechnology In-formation (BioProject accession no. PRJNA194561). Se-quence read quality was evaluated using the FastQCprogram (http://www.bioinformatics.babraham.ac.uk/projects/fastqc/) and sequencing lanes with insufficient quality werenot used in the analysis. In total, 555,078,520 read pairsfrom eight sequencing lanes of cycle 0 and 652,901,808read pairs from nine sequencing lanes of cycle 30 weregenerated. Prior to mapping, reads from high-quality laneswere cleaned using the fastx clipper program from theFASTX toolkit (http://hannonlab.cshl.edu/fastx_toolkit/index.html), which removed the Illumina adapter sequen-ces, and required a minimum length of 20 bp aftertrimming.
Two mapping pipelines were used to establish a high-confidence SNP set. In the “SE pipeline,” all reads thatpassed through the cleaning step above were mapped assingle-end (SE) reads, using Bowtie version 0.12.7 (Lang-mead et al. 2009), to the B73 version 2 reference sequence[AGPv2; http://ftp.maizesequence.org (Schnable et al.2009)]. An alignment was considered valid if there weretwo or fewer mismatches relative to the reference sequence(-v 2) and a read was required to have only one valid align-ment (-m 1). All other parameters were set to the defaultvalues. In the “mixed pipeline” read pairs for which bothreads passed through the cleaning step were mapped asPE and read pairs for which only one read passed the clean-ing step were mapped as SE. For the PE mapping, in addi-tion to the -m 1 and -v 2 options used in the SE pipelinemapping, the minimum insertion size was set to 0 bp andthe maximum insertion size was set to 1000 bp. All otherparameters were set to the default values.
The same SNP detection pipeline was used for alignmentsfrom both the SE pipeline and the mixed pipeline. Withineach population (cycle 0 and cycle 30), all valid alignmentswere processed using SAMtools version 0.1.12a (Li et al.2009) sort, merge, index, and pileup programs to generateunfiltered pileup files. For the pileup program, the -B optionwas used to disable BAQ computation. Nucleotide frequen-cies (A, T, C, and G) were determined at each position, re-quiring a quality score of at least 20 for a base within a read
Selection Scan for Ear Number in Maize 831

to be included. For a particular position, if at least twonucleotides were supported by at least two reads each acrossthe two populations, that position was considered polymor-phic. Only positions that were identified as polymorphic inboth the SE pipeline and the mixed pipeline were includedfor further analysis, and allele frequency estimates werebased on the SE pipeline.
SNP filtering and estimating allele frequencies
In total, 8,128,042 SNPs were identified from sequencing,but the set of SNPs selected for analysis was filtered toinclude only high-confidence sites. Only SNPs with twoalleles were included, due to the increased likelihood thatmultiallelic SNPs included sequencing errors and because ofcomplications related to assessing allele frequency changesat multiallelic loci. It was required that every SNP locationincluded in the analysis was observed at least 20 times ineach population and no more than 89 times based on the SEpipeline mapping. An observation of 89 corresponded to themean SNP coverage plus two standard deviations. SNPs readat more than this level are more likely to be from organellaror repetitive DNA that is inaccurately represented by a singleposition in the reference genome. After filtering, 1,211,745high-confidence SNPs were retained for analysis and theallele frequencies at each SNP were calculated in eachpopulation. Allele frequencies were computed according totheir maximum-likelihood estimate. Thus, the number oftimes a particular allele at a position was observed in thepopulation was divided by the total number of times anyallele was observed at that position.
Estimating effective population size
The effective population size over the course of the selectionprogram was evaluated in two ways. First, because the numberof breeding males and females used and selected in theexperiment was known and held relatively constant acrosscycles, the simple relationship Ne ¼ 4NmNf=ðNm þ NfÞ;where Nm and Nf are the numbers of mating males andfemales, respectively, was used. Next, an estimate was madeusing the 768 array-based SNPs, according to the relationshipNe ¼ 1=2ð12 ffiffiffiffiffiffiffiffiffiffiffiffiffi
Ht=H0tp Þ; where Ht and H0 are the mean lev-
els of heterozygosity in the tth (t = 30 in this case) and 0thgenerations, respectively. Both equations for effective popula-tion size are provided by Crow and Kimura (1970).
Scan for selection
A genome-wide scan for selection similar to the Lewontinand Krakauer (1973) test was conducted. Note that becauseof the simple population structure involved in this experi-ment, with there being only two subpopulations and nomigration between them, it is not expected that the short-comings of the Lewontin–Krakauer test, with respect to mi-gration (Nei and Maruyama 1975) or correlations betweensubpopulations (Robertson 1975), will be detrimental. Un-fortunately, however, the implementation of pooled se-quencing precludes the ability to accurately estimate LD in
the population and therefore makes a simulation-based ap-proach for establishing precise significance levels intracta-ble. Instead, the scan described is used to classify genomicregions as empirically divergent or not divergent over thecourse of the experiment. The most divergent sites, based ona sliding-window estimate of FST, are highlighted as themost promising candidates for selection. This approach isjustified based on the documented process of strong selec-tion, coupled with the dramatic phenotypic changes thathave accumulated during the experiment, which leads tothe conclusion that selection is expected to have changedthe allele frequency in regions of the Golden Glow popula-tion’s genome associated with the selection target. As such,those sites demonstrating the greatest levels of divergenceare those most likely to have been affected by selection.
Because of the substantial sampling error that is inherent topooled sequencing, a sliding-window approach was imple-mented to evaluate divergence. First, SNP-specific estimates ofFST were computed within R version 3.0.2 (R Core Team2013) according to FST ¼ s2=ðpð12 pÞ þ s2=rÞ; where s2 isthe sample variance of allele frequency between populations,p is the mean allele frequency across populations, and r is thenumber of populations (Weir and Cockerham 1984). This for-mula assumes a large sample size, which is met by the pre-viously described filtering step where loci observed,20 timeswere removed. The formula also corrects for bias based on thesmall number of populations sampled (in this case two). FSTvalues were averaged over sliding windows of 25 SNPs. Thus,each SNP locus was assigned a new value based on the aver-age of itself along with the 12 upstream and 12 downstreamSNPs. A window size of 25 SNPs was chosen because sucha size appeared to maximize signal from sites whileminimizingnoise from sampling and sequencing error. When smaller win-dow sizes were employed, FST values behaved erratically, andemploying larger window sizes led to FST values that wereunrealistically homogenous. Such an approach for determin-ing sliding-window boundaries has been previously demon-strated (e.g., Myles et al. 2008; Akey 2009).
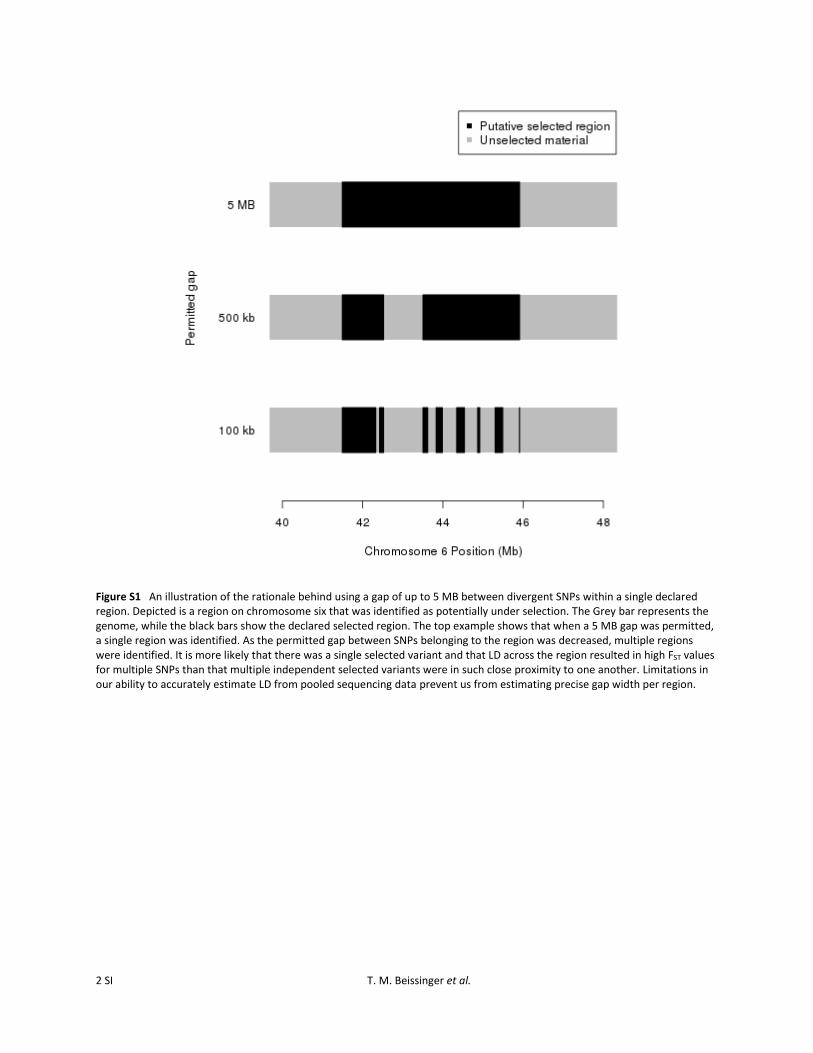
Outlying window-based FST values that exceeded the99.9% or 99.99% level of the empirical window-based FSTdistribution were identified. It should be noted that theseoutlier levels were not chosen due to a connection witha specific level of significance, but instead because they pro-vide a reasonable number of candidates for strong or ex-tremely strong selection, respectively, which are used indownstream analyses. Once SNPs exceeding the outlierthresholds were identified, overall boundaries for divergentregions were defined by taking the set of all SNPs thatexceeded the specified threshold and identifying groups ofSNPs that likely correspond to the same divergent region.This was achieved by deeming outlying SNPs that werewithin 5 Mb of one another as belonging to a single region.Five megabases was used because at distances greater thanthis, the likelihood of LD between SNPs is minimal, yetwhen a distance of ,5 Mb was employed, it was clear thatsome of the resulting regions were likely correlated with the
832 T. M. Beissinger et al.

same selection event (Supporting Information, Figure S1).Also, utilizing this relatively large window provides a conser-vative estimate of divergent region boundaries. It should beemphasized that with this approach the identified regionscould be (and usually were) ,,5 Mb (Figure S2).
Each group of outlying SNPs was considered a divergentgroup, and the position of the 12th SNP upstream of thegroup start and that of the 12th SNP downstream of thegroup end were added to the group to define the boundariesof each divergent region. The up- and downstream additionswere incorporated because the sliding-window methodincluded information from up to the 12th SNP distal fromthe region in either direction.
Testing for allele fixation
For each identified region that displayed evidence of di-vergence (exceeded the 99.9% FST level), a test was per-formed to determine whether the pattern demonstratedwas consistent with a drive toward fixation. To test for a lossof variability, the expected level of heterozygosity (based onthe expectation from Hardy–Weinberg equilibrium) wascomputed for each SNP within a region at cycle 0 and atcycle 30. Next, a t-test was performed to determine whetherthe expected heterozygosity at cycle 30 was significantlydifferent than the heterozygosity at cycle 0. A significantreduction in expected heterozygosity was interpreted as ev-idence for a tendency toward fixation at the divergent re-gion, while no change or an increase in heterozygosity wasinterpreted as evidence that the region has not yet approachedfixation.
Extent of hitchhiking
Genetic hitchhiking is the process by which the frequency ofa neutral locus is altered due to being in LD with a locusunder selection (Maynard Smith and Haigh 1974). Hitchhik-ing can occur in the instance of a “hard sweep,” where selec-tion operates on a newly arisen allele that is immediatelybeneficial, or from a “soft sweep,” in which an allele previ-ously segregating in the population becomes advantageousdue to new selective pressures (Hermisson and Pennings2005). It has been shown that the genomic footprint of a se-lective sweep is expected to extend substantially farther fromthe selected locus under a hard sweep model than in a softsweep (Innan and Kim 2004; Hermisson and Pennings 2005).To investigate whether the divergent, and potentially se-lected, regions identified by FST were consistent with soft orhard sweeps, the size of selected regions was used as an in-dicator of hitchhiking. A K-means clustering algorithm(Hartigan and Wong 1979) was performed to group divergentregions based on size. Two centers were employed, so thatidentified clusters were classified into one group of smallsize and one group of large size regions, corresponding tothose likely to depict hard sweeps and soft sweeps, respectively.
Also, data from the intermated B73 3 Mo17 (IBM) pop-ulation (Lee et al. 2002) were used to test whether the re-combination rate is the main contributor to region size
rather than the type of sweep experienced. Liu et al.(2009) estimated a map of centimorgans per megabase inthe IBM population. Although the IBM population will notnecessarily display identical recombination patterns to thoseof the Golden Glow maize population at all positions in thegenome, the overall patterns are expected to be similar. Thephysical position of each divergent region in the GoldenGlow was anchored to the nearest physical position witha given centimorgan per megabase in the Liu et al. (2009)map. In cases for which multiple IBM positions withreported centimorgans per megabase were within a singleGolden Glow selected region, the level of centimorgans permegabase across all of these positions was averaged.Thereby, every highly divergent region identified in theGolden Glow maize population was assigned a single valuefor centimorgans per megabase. A significant product–mo-ment correlation was tested for using raw data as well aslog-transformed data.
Results
Effective population size
A total of �4250 plants for cycles 1–12 and 14,250 plantsfor cycles 13–30 were evaluated in the selection plots, but�1000 males and 200 females were selected in each cycle,leading to an Ne that is smaller than the total census size.Assuming plants were randomly mating over the course ofthe experiment, it was estimated based on population de-mographics that the effective population size was expectedto be �667. However, preferential pollen flow among neigh-boring plants and assortative mating among plants flower-ing on the same day may have prevented truly randommating; thus the Ne was also estimated from markers. Basedon 768 array-based SNP markers, the effective populationsize estimate was 378. It is worth noting that due to theeffects of selection, the marker-based estimate is expectedto be biased downward. Therefore, true Ne for the GoldenGlow population over the course of the selection experimentis likely somewhere between 378 and 667 individuals.
Twenty-eight genomic regions were identified assubstantially divergent
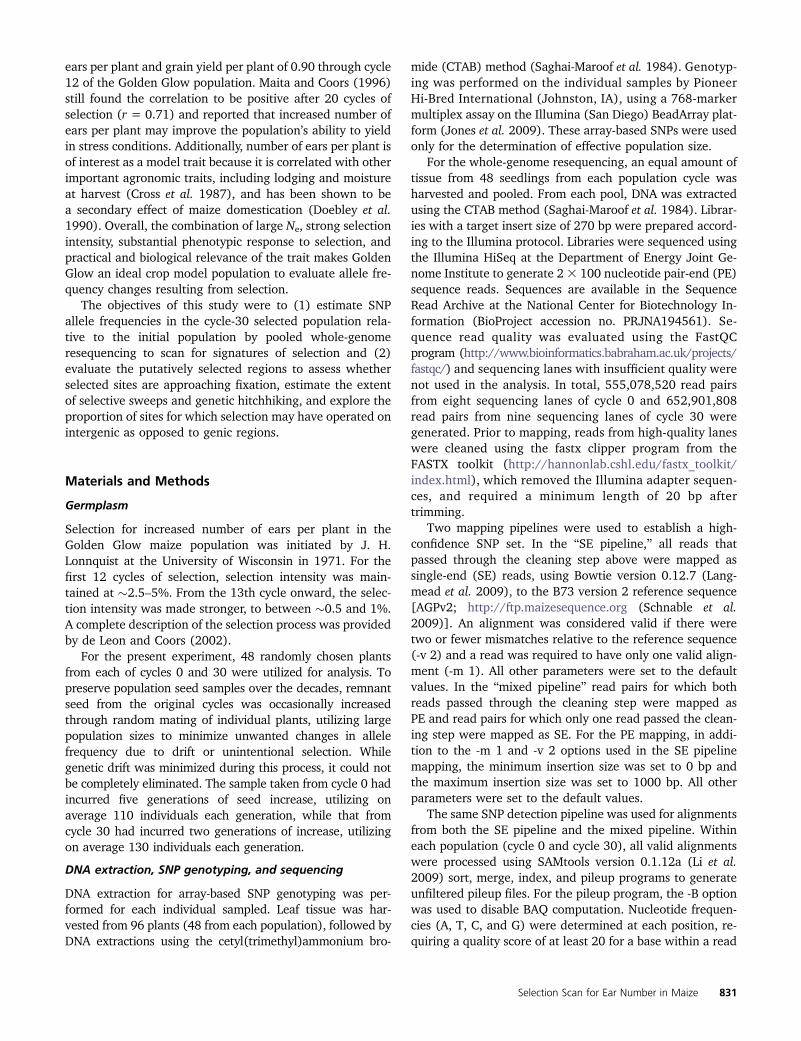
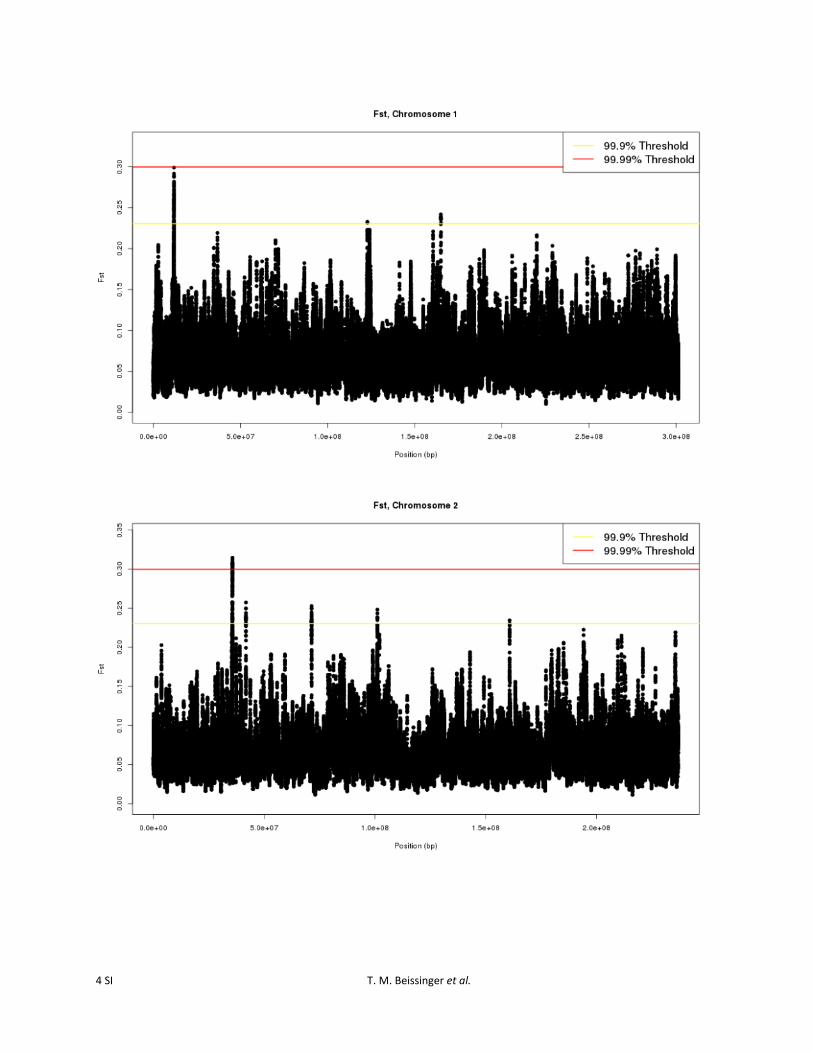
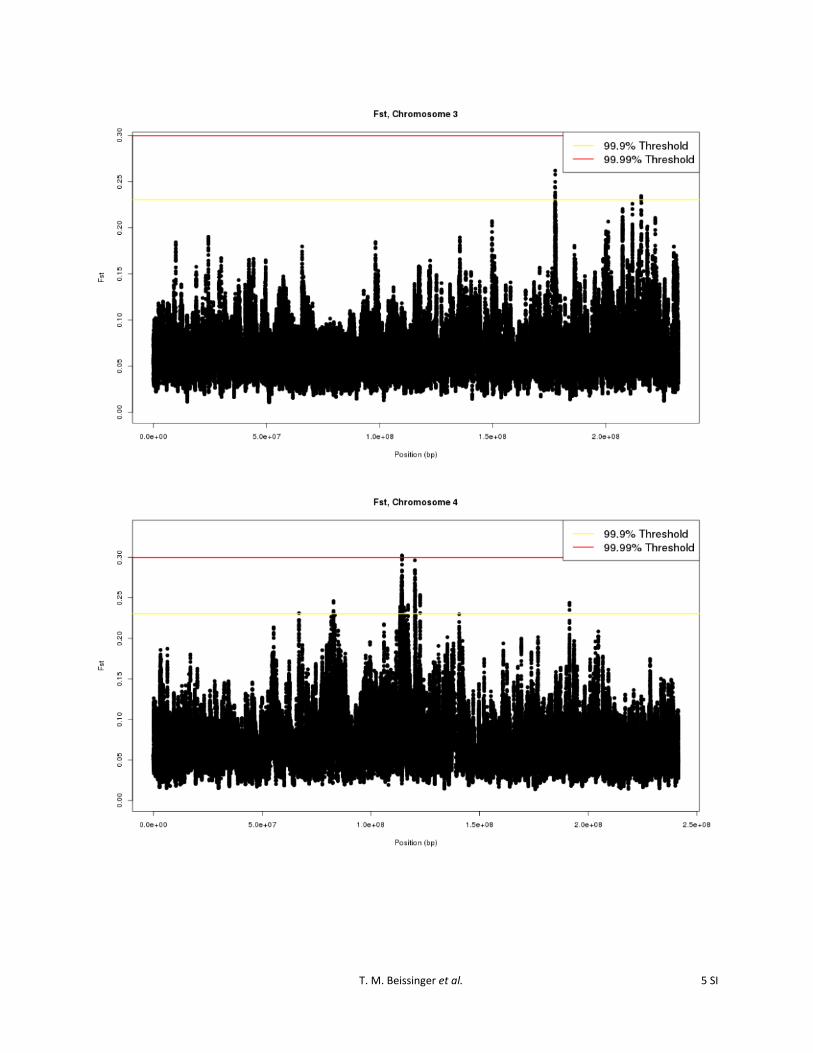
To identify the specific genomic regions most likely to havebeen affected by selection, an outlier-based approach thatscanned for regions exceeding the 99.9% or 99.99% levelsof the empirical distribution, based on 25-SNP slidingwindows, was employed. Using the 25-SNP sliding-windowstatistic, specific genomic regions that were most likely tohave been affected by selection were apparent (Figure S3).Twenty-eight regions were identified as divergent at the99.9% outlier level. Three of these regions also exceededthe 99.99% level (Figure 1; Table 1). Regions identified atthe 99.9% level were found on all 10 of the maize chromo-somes. The regions ranged in size from 4251 bp to 9.2 Mband encompassed from 0 to 73 predicted B73 5b annotatedgenes (http://ftp.maizesequence.org) (Schnable et al.
Selection Scan for Ear Number in Maize 833

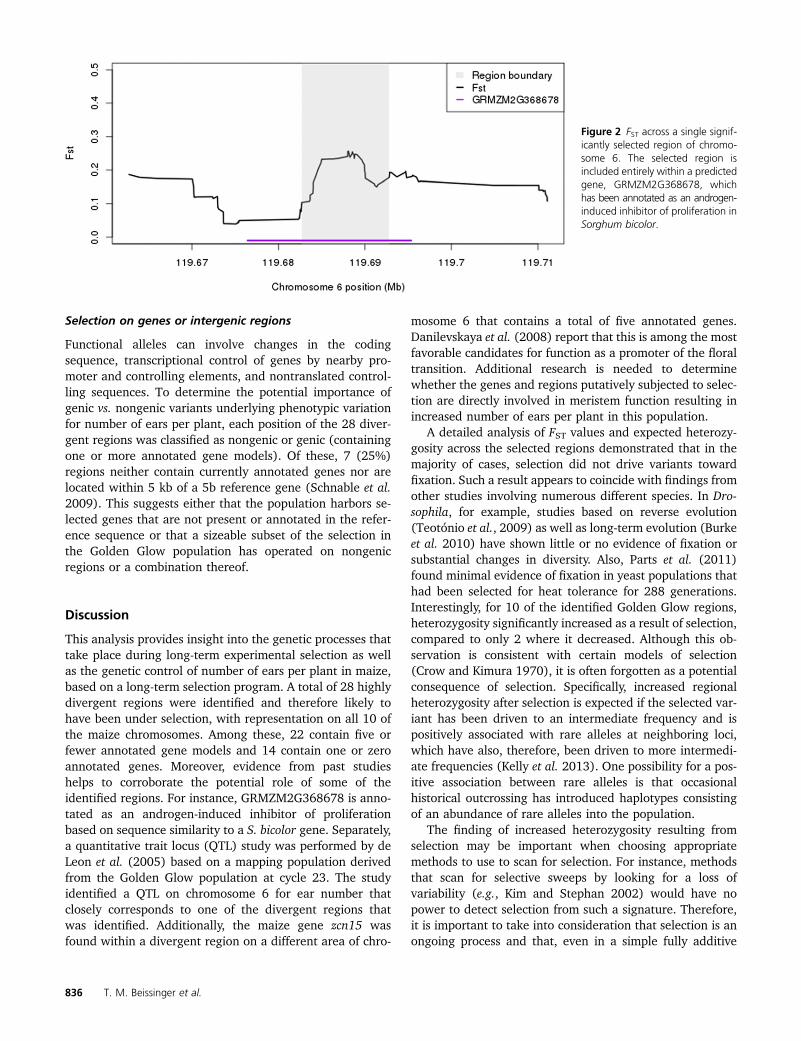
2009). Assuming that there was limited unintentional selec-tion for other traits during the course of the selection exper-iment, genes in these regions can be considered candidatesfor control of number of ears per plant in maize. Of theregions identified, 22 (79%) included #5 annotated genes,and 14 regions (50%) included 1 or 0 annotated genes. Asan example, a region on maize chromosome 6 that encom-passes �10 kb (AGPv2 position 119,682,711–119,692,810)falls entirely within a single predicted gene, GRMZM2G368678(Figure 2). This gene is annotated as an “androgen-inducedinhibitor of proliferation” based on sequence similarityto the Sorghum bicolor gene Sb10g010710.1 and isexpressed in shoot apical meristem and multiple othertissues (Sekhon et al. 2011).
Few regions show evidence of fixation
Each of the genomic regions that were identified as highlydivergent was tested for a change in expected heterozygos-ity between cycle 0 and cycle 30. A decrease in expectedheterozygosity suggests that strong selection has taken placeand that allele frequencies are being driven toward fixation.Conversely, an increase in expected heterozygosity at theselected site may be observed in the case where the initialfavorable allele frequency was ,0.5 and selection has takenplace but was not strong enough or has not been occurringfor a long enough time to move the allele frequency close tofixation. Other explanations for an increase in heterozygos-ity can include overdominance, complex linkage relation-ships between multiple selected sites, and variable selectionenvironments. It is also possible that selection has occurredbut there is no change in expected heterozygosity; this wouldbe the case, for example, if allele frequency changed from 0.4at cycle 0 to 0.6 at cycle 30.
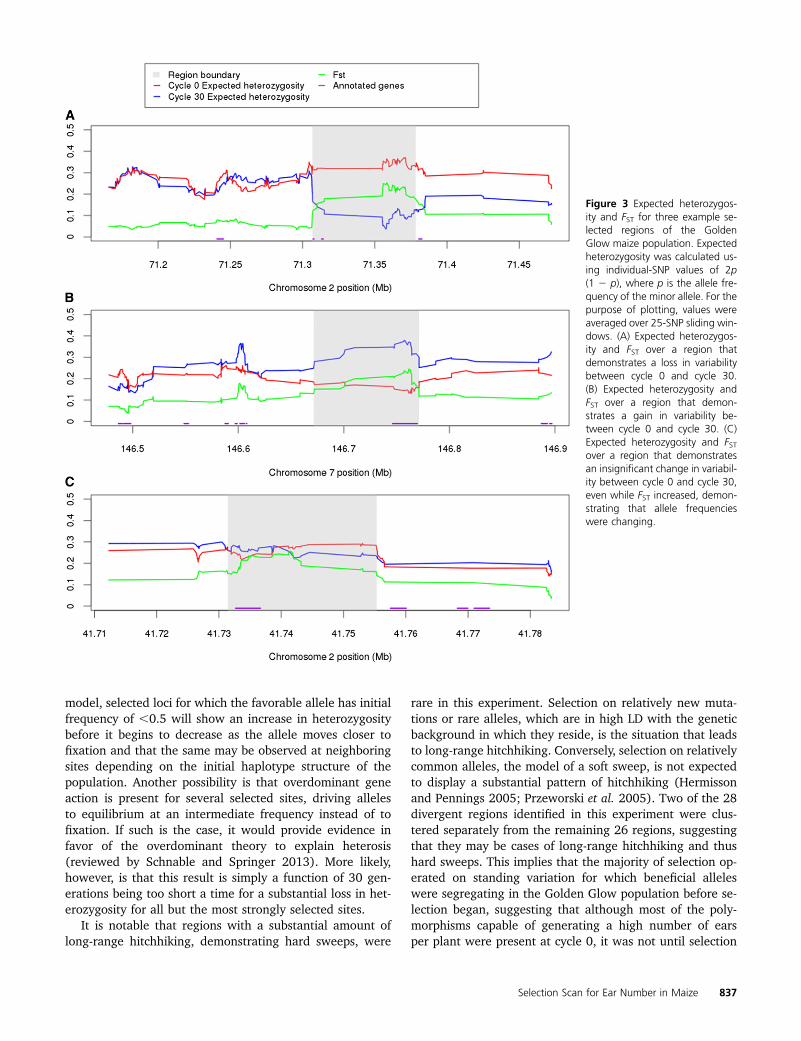
It was observed that only 2 of the 28 divergent regionsdemonstrated a statistically significant reduction in expectedheterozygosity from cycle 0 to cycle 30 (two-tailed Bonfer-roni-corrected P-value = 0.025/28 = 0.0009). However, 10regions (35.7%) displayed a significant increase in expectedheterozygosity. The change in the level of expected hetero-zygosity across the remaining 16 regions was not significant(Table 1). Examples of divergent regions that displayed anincrease, a decrease, and no change in expected heterozy-gosity are provided (Figure 3). These observations suggestthat although selection was strong, it was not strong enoughover the course of 30 generations to drive favorable allelesto fixation at the majority of sites that display evidence ofstrong divergence. Instead, most sites are still segregating inthe population and, for a substantial subset of identifiedsites, the genetic variability in the population has increasedas a result of selection. Kelly et al. (2013) demonstrated thatincreased heterozygosity across a region as a result of selec-tion is expected in the situation where not only has selectionled to more intermediate frequencies at the selected variant,but also the selected variant is positively associated withrare variants in the region. Additionally, it may be predictedthat the two regions that did display significant reductionsin heterozygosity are those that experienced the strongestselection.
Selection mostly operated on standing variation
Studies have shown that selection on rare or new alleles ismost likely to cause a hard sweep and lead to long-rangehitchhiking and that the hitchhiking pattern may be mostlyor completely absent in the case of a soft sweep, whenselection operates on an allele that was segregating in thepopulation at the onset of selection (Innan and Kim 2004;
Figure 1 Physical location of 28 regions identifiedas divergent and potentially under selection fornumber of ears per plant based on changes in allelefrequency between cycle 0 and cycle 30 of theGolden Glow maize population, using 25-bp sliding-windows estimates of FST.
834 T. M. Beissinger et al.
Hermisson and Pennings 2005; Przeworski et al. 2005).More precisely, Hermisson and Pennings (2005) showedthat a soft sweep from standing variation is expected todisplay a narrower footprint than that of a hard sweep. Thisis because for a new allele, LD between the favorable poly-morphism and the genetic background in which it resides islikely to extend a longer range than if the allele were at anintermediate frequency and therefore was present in a vari-ety of different haplotypes. To investigate the prevalence ofhard vs. soft sweeps during this selection program, the sizeof divergent regions was used to indicate the extent of hitch-hiking and thus the type of sweep that may have occurred;larger regions suggest longer-range hitchhiking and there-fore indicate a hard sweep (or the possibility of favorablealleles at multiple loci in proximity to each other), whilesmaller regions suggest less hitchhiking and likely a softsweep.
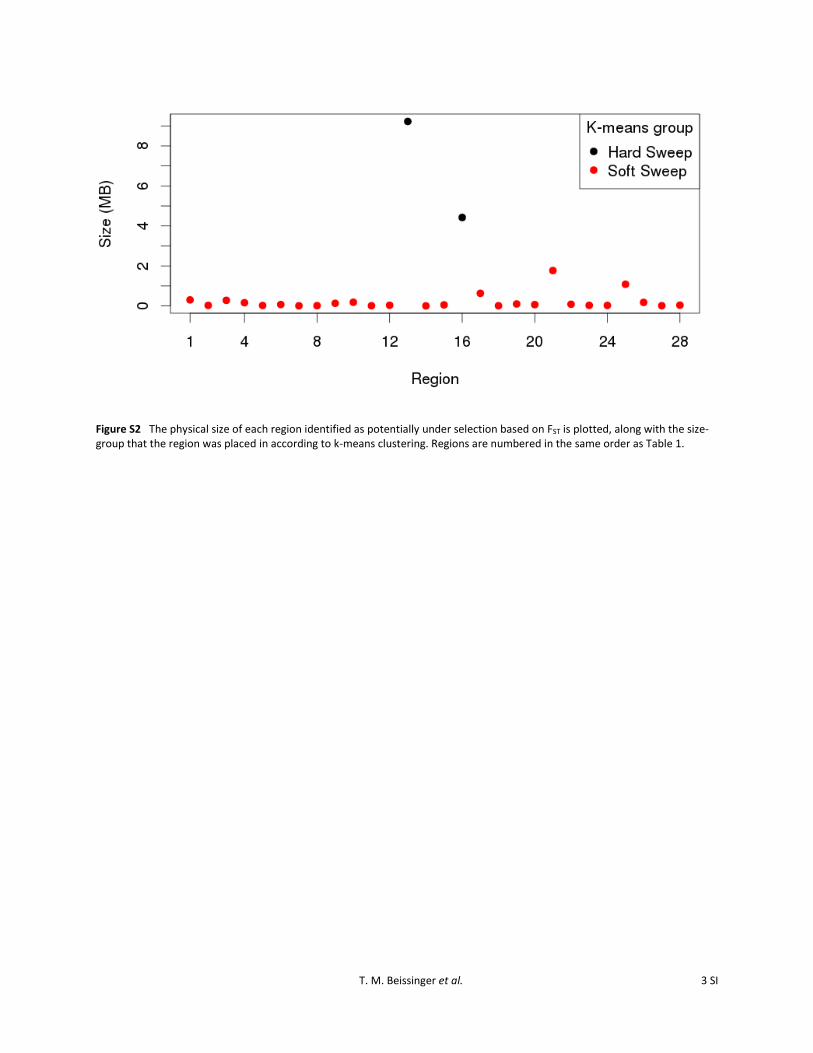
Substantial variability in the size of divergent regions wasobserved (Table 1), with a range of 4251 bp to 9.2 Mb. Themedian region size was 69.3 kb. A K-means clustering algo-rithm with two centers was employed to separate regions intotwo groups based on size (Hartigan and Wong 1979). Theresults were that 26 of the 28 regions were placed intoa small-size cluster and only 2 regions were placed intoa large-size cluster (Figure S2). The median region size forthe small-size cluster was 61.2 kb, while that of the large-size
cluster was 6.8 Mb. Because of the method by which regionswere identified, the possibility that the large regions are theresult of multiple independently selected sites in close prox-imity cannot be ruled out, although this appears to be lesslikely due to the size of the gap assumed (Figure S1).
There is also the possibility that the size of regions isheavily influenced by the variability of recombination ratesacross the genome. This was tested by utilizing a recombi-nation map developed from the IBM population (Lee et al.2002). No evidence for a correlation between recombinationrate and region size was found in the raw data (r =20.126,P-value = 0.5215) or by utilizing log-transformed regionsizes (r = 0.172, P-value = 0.3807; Figure S4). Therefore,it is likely that the 2 large regions correspond to a hardsweep model with a large amount of hitchhiking due toselection on rare, relatively new variants and the remaining26 regions demonstrate selection on standing variation.Consequently, the vast majority of selection is not consistentwith selection on new variants but instead on existing geno-mic variants that were already segregating well before cycle0. This observation is also consistent with the large pheno-typic response seen in a relatively small number of genera-tions of selection; rare variants (e.g., ,P = 0.01), even ofsubstantial magnitude, would take multiple generations ofselection before they began to contribute meaningful varia-tion to the selection response.
Table 1 Position, size, and expected heterozygosity information for each of the 28 highly divergent regions identified
Region no. Chromosome Start position End position99.99%
significanceGenes
containedHeterozygosity test
significanceaMean change inheterozygosity
1 1 11,588,371 11,892,655 N 8 0.000 0.1322 1 122,802,601 122,831,005 N 0 0.473 0.0243 1 164,947,151 165,229,053 N 12 0.191 0.0524 2 35,519,192 35,682,346 Y 3 0.000 0.1735 2 41,731,365 41,755,299 N 2 0.595 20.0196 2 71,306,928 71,378,431 N 3 0.000 20.2537 2 101,062,088 101,069,759 N 0 0.071 0.0768 2 160,786,800 160,802,631 N 2 0.608 0.0269 3 177,548,249 177,681,538 N 2 0.026 20.04710 3 215,594,013 215,778,968 N 4 0.014 20.11111 4 66,924,240 66,935,990 N 0 0.000 0.19612 4 82,825,221 82,858,997 N 0 0.006 20.13113 4 113,455,144 122,680,452 Y 73 0.000 0.08014 4 191,396,139 191,400,390 N 1 0.298 0.05115 5 30,083,952 30,139,317 N 1 0.868 0.00516 6 41,490,195 45,914,266 Y 42 0.000 0.12217 6 75,749,792 76,382,768 N 5 0.003 0.09918 6 119,682,711 119,692,810 N 1 0.000 0.22919 7 146,671,419 146,771,150 N 1 0.000 0.21120 7 167,742,364 167,809,449 N 1 0.484 20.03421 8 92,876,772 94,647,137 N 26 0.000 0.02522 8 118,681,864 118,767,444 N 3 0.106 0.06923 9 26,149,935 26,181,104 N 0 0.809 20.01024 9 101,071,793 101,097,690 N 1 0.000 20.24325 10 7,635,223 8,719,903 N 13 0.000 0.05626 10 18,846,988 19,024,881 N 1 0.931 20.00427 10 25,251,913 25,264,660 N 0 0.032 0.08928 10 97,503,134 97,542,318 N 0 0.000 0.171a Values for regions that displayed significant changes in heterozygosity (P-value = 0.0009) are in italics.
Selection Scan for Ear Number in Maize 835
Selection on genes or intergenic regions
Functional alleles can involve changes in the codingsequence, transcriptional control of genes by nearby pro-moter and controlling elements, and nontranslated control-ling sequences. To determine the potential importance ofgenic vs. nongenic variants underlying phenotypic variationfor number of ears per plant, each position of the 28 diver-gent regions was classified as nongenic or genic (containingone or more annotated gene models). Of these, 7 (25%)regions neither contain currently annotated genes nor arelocated within 5 kb of a 5b reference gene (Schnable et al.2009). This suggests either that the population harbors se-lected genes that are not present or annotated in the refer-ence sequence or that a sizeable subset of the selection inthe Golden Glow population has operated on nongenicregions or a combination thereof.
Discussion
This analysis provides insight into the genetic processes thattake place during long-term experimental selection as wellas the genetic control of number of ears per plant in maize,based on a long-term selection program. A total of 28 highlydivergent regions were identified and therefore likely tohave been under selection, with representation on all 10 ofthe maize chromosomes. Among these, 22 contain five orfewer annotated gene models and 14 contain one or zeroannotated genes. Moreover, evidence from past studieshelps to corroborate the potential role of some of theidentified regions. For instance, GRMZM2G368678 is anno-tated as an androgen-induced inhibitor of proliferationbased on sequence similarity to a S. bicolor gene. Separately,a quantitative trait locus (QTL) study was performed by deLeon et al. (2005) based on a mapping population derivedfrom the Golden Glow population at cycle 23. The studyidentified a QTL on chromosome 6 for ear number thatclosely corresponds to one of the divergent regions thatwas identified. Additionally, the maize gene zcn15 wasfound within a divergent region on a different area of chro-
mosome 6 that contains a total of five annotated genes.Danilevskaya et al. (2008) report that this is among the mostfavorable candidates for function as a promoter of the floraltransition. Additional research is needed to determinewhether the genes and regions putatively subjected to selec-tion are directly involved in meristem function resulting inincreased number of ears per plant in this population.
A detailed analysis of FST values and expected heterozy-gosity across the selected regions demonstrated that in themajority of cases, selection did not drive variants towardfixation. Such a result appears to coincide with findings fromother studies involving numerous different species. In Dro-sophila, for example, studies based on reverse evolution(Teotónio et al., 2009) as well as long-term evolution (Burkeet al. 2010) have shown little or no evidence of fixation orsubstantial changes in diversity. Also, Parts et al. (2011)found minimal evidence of fixation in yeast populations thathad been selected for heat tolerance for 288 generations.Interestingly, for 10 of the identified Golden Glow regions,heterozygosity significantly increased as a result of selection,compared to only 2 where it decreased. Although this ob-servation is consistent with certain models of selection(Crow and Kimura 1970), it is often forgotten as a potentialconsequence of selection. Specifically, increased regionalheterozygosity after selection is expected if the selected var-iant has been driven to an intermediate frequency and ispositively associated with rare alleles at neighboring loci,which have also, therefore, been driven to more intermedi-ate frequencies (Kelly et al. 2013). One possibility for a pos-itive association between rare alleles is that occasionalhistorical outcrossing has introduced haplotypes consistingof an abundance of rare alleles into the population.
The finding of increased heterozygosity resulting fromselection may be important when choosing appropriatemethods to use to scan for selection. For instance, methodsthat scan for selective sweeps by looking for a loss ofvariability (e.g., Kim and Stephan 2002) would have nopower to detect selection from such a signature. Therefore,it is important to take into consideration that selection is anongoing process and that, even in a simple fully additive
Figure 2 FST across a single signif-icantly selected region of chromo-some 6. The selected region isincluded entirely within a predictedgene, GRMZM2G368678, whichhas been annotated as an androgen-induced inhibitor of proliferation inSorghum bicolor.
836 T. M. Beissinger et al.
model, selected loci for which the favorable allele has initialfrequency of ,0.5 will show an increase in heterozygositybefore it begins to decrease as the allele moves closer tofixation and that the same may be observed at neighboringsites depending on the initial haplotype structure of thepopulation. Another possibility is that overdominant geneaction is present for several selected sites, driving allelesto equilibrium at an intermediate frequency instead of tofixation. If such is the case, it would provide evidence infavor of the overdominant theory to explain heterosis(reviewed by Schnable and Springer 2013). More likely,however, is that this result is simply a function of 30 gen-erations being too short a time for a substantial loss in het-erozygosity for all but the most strongly selected sites.
It is notable that regions with a substantial amount oflong-range hitchhiking, demonstrating hard sweeps, were
rare in this experiment. Selection on relatively new muta-tions or rare alleles, which are in high LD with the geneticbackground in which they reside, is the situation that leadsto long-range hitchhiking. Conversely, selection on relativelycommon alleles, the model of a soft sweep, is not expectedto display a substantial pattern of hitchhiking (Hermissonand Pennings 2005; Przeworski et al. 2005). Two of the 28divergent regions identified in this experiment were clus-tered separately from the remaining 26 regions, suggestingthat they may be cases of long-range hitchhiking and thushard sweeps. This implies that the majority of selection op-erated on standing variation for which beneficial alleleswere segregating in the Golden Glow population before se-lection began, suggesting that although most of the poly-morphisms capable of generating a high number of earsper plant were present at cycle 0, it was not until selection
Figure 3 Expected heterozygos-ity and FST for three example se-lected regions of the GoldenGlow maize population. Expectedheterozygosity was calculated us-ing individual-SNP values of 2p(1 2 p), where p is the allele fre-quency of the minor allele. For thepurpose of plotting, values wereaveraged over 25-SNP sliding win-dows. (A) Expected heterozygos-ity and FST over a region thatdemonstrates a loss in variabilitybetween cycle 0 and cycle 30.(B) Expected heterozygosity andFST over a region that demon-strates a gain in variability be-tween cycle 0 and cycle 30. (C)Expected heterozygosity and FSTover a region that demonstratesan insignificant change in variabil-ity between cycle 0 and cycle 30,even while FST increased, demon-strating that allele frequencieswere changing.
Selection Scan for Ear Number in Maize 837
incrementally increased the frequency of these variantswithin individuals that highly prolific phenotypes emerged.
This observation is consistent with one made by Coop et al.(2009), regarding human populations. The authors found thatwhile positive selection in the human genome may be com-mon, such selection driving new mutations to fixation is ex-ceedingly rare. Similarly, Innan and Kim (2004) investigatedselective sweeps on standing variation, as may have occurredduring a domestication event. The authors focused particularlyon maize. Their finding was that selection on standing varia-tion may not be identifiable, because genetic variation at linkedloci surrounding the selected site will not necessarily be re-duced. This finding agrees with one reported by Teshimaet al. (2006), who found that for an initially neutral mutationthat had drifted to frequency 0.05 when it became beneficial,allele frequencies in the selected population for loci surround-ing the selected site are likely to be intermediate. The onset ofselection at cycle 0 of the Golden Glow experiment parallelswhat occurs at the onset of domestication, where the fitness ofindividuals suddenly and dramatically changes due to newselective pressures; thus the patterns of variation may be sim-ilar. However, because in this study the main approach foridentifying selection was allele frequency divergence betweenthe selected and nonselected populations rather than findingregions with reduced variation, this approach is not limited bythe potential lack of reduced variation. Yet upon further ex-ploring each of the selected regions to identify those consistentwith long-range hitchhiking, the findings here match expect-ations; the overwhelming tendency was that selection modifiedallele frequencies at isolated sites rather than across widespans, suggesting that most of the observed selection operatedon standing genetic variation.
Finally, several of the divergent sites (25%) contain nocurrently annotated genes nor are they are in closeproximity to any annotated gene models. While this couldbe due to Golden Glow genes that are not present in thereference genome, it is also possible that these are instancesof selection on nongenic DNA. The possibility of expression-controlling regions leading to major phenotypic differencesbetween organisms was discussed decades ago by authorssuch as King and Wilson (1975). Since then, a multitude ofstudies have identified such regions across a wide array ofspecies (reviewed by Wray 2007). In maize, the expressionof the tb1 gene has been shown to be affected by intergenicsequence tens of kilobases away from the gene itself (Clarket al., 2006). Similarly, the finding appears to be pervasive indomesticated animal species, where studies involving horses(Gu et al., 2009), cattle (Qanbari et al. 2011), and chickens(Qanbari et al. 2012) have all identified selection in gene-poor regions. Likewise, in human populations it has beenobserved that at a minimum, 14% of selected regionsidentified across multiple studies result from selection onnoncoding material (Akey 2009). In Drosophila, various reg-ulatory changes that modify phenotype have been found(Sucena and Stern 2000; Prud’homme et al. 2006). The in-complete nature of the maize reference genome (Schnable
et al. 2009), coupled with this study’s inability to preciselyisolate the causative sites that were selected down at thenucleotide level, precludes firm conclusions regarding theproportion of selection that operated on nongenic material.For instance, even within selected regions that do includegenes it is possible that the causative variant was not one ofthose genes but instead a regulatory variant. The findingshere imply that at least for a subset of sites, noncoding poly-morphisms are selectively relevant.
In summary, important insight into the putative controlof number of ears per plant was gained by scanning forsignatures of selection based on differences in allelefrequency between selected and unselected cycles in a maizepopulation subjected to artificial selection for a number ofgenerations. Furthermore, the findings show that, at leastfor the Golden Glow population, soft sweeps appear to bemore common than hard sweeps, the rate of allele fixation isrelatively slow for regions under selection, and changes inallele frequencies in noncoding polymorphisms that haveeffects on the phenotype can be generated by selection.
Acknowledgments
This work was funded by the Department of Energy (DOE)Great Lakes Bioenergy Research Center (DOE BER Office ofScience grant DE-FC02-07ER64494). The work conductedby the U.S. Department of Energy Joint Genome Institute issupported by the Office of Science of the U.S. DOE undercontract no. DE-AC02-05CH11231. Simulations were per-formed using resources and the computing assistance of theUniversity of Wisconsin, Madison (UW-Madison) Center ForHigh Throughput Computing (CHTC) in the Department ofComputer Sciences. The CHTC is supported by UW-Madisonand the Wisconsin Alumni Research Foundation and is anactive member of the Open Science Grid, which is supportedby the National Science Foundation and the U.S. DOE’s Of-fice of Science. DuPont–Pioneer provided SNP genotypingwith the Illumina Golden Gate assay. T.M.B. was supportedby the University of Wisconsin Graduate School and by a giftto the UW-Madison Plant Breeding and Plant Genetics pro-gram from Monsanto.
Literature Cited
Ahmad, M., R. Ahmad, M. Ishaque, and A. U. Malik, 2011 Why domaize hybrids respond differently to variations in plant density?Crop Environ. 2: 52–60.
Akey, J. M., 2009 Constructing genomic maps of positive selectionin humans: Where do we go from here? Genome Res. 19: 711–722.
Akey, J. M., G. Zhang, K. Zhang, L. Jin, and M. D. Shriver,2002 Interrogating a high-density SNP map for signatures ofnatural selection. Genome Res. 12: 1805–1814.
Bigham, A., M. Bauchet, D. Pinto, Z. Mao, J. M. Akey et al.,2010 Identifying signatures of natural selection in Tibetanand Andean populations using dense genome scan data. PLoSGenet. 6: e1001116.
838 T. M. Beissinger et al.

Burke, M. K., J. P. Dunham, P. Shahrenstani, K. R. Thornton, M. R.Rose et al., 2010 Genome-wide analysis of a long-term evolu-tion experiment with Drosophila. Nature 467: 587–590.
Carlone, M. R., and W. A. Russell, 1987 Response to plant densi-ties and nitrogen levels for four maize cultivars from differenteras of breeding. Crop Sci. 28: 465–470.
Clark, R. M., T. N. Wagler, P. Quijada, and J. Doebley, 2006 Adistant upstream enhancer at the maize domestication gene tb1has pleiotropic effects on plant and inflorescent architecture.Nat. Genet. 38(5): 594–597.
Coop, G., J. K. Pickrell, J. Novembre, S. Kudaravalli, J. Li et al.,2009 The role of geography in human adaptation. PLoS Genet.5: e1000500.
Coors, J. G., and M. C. Mardones, 1989 Twelve cycles of massselection for prolificacy in maize I. Direct and correlated re-sponses. Crop Sci. 29: 262–266.
Cross, H. Z., J. T. Kamen, and L. Brun, 1987 Plant density, matu-rity and prolificacy effects on early maize. Can. J. Plant Sci. 67:35–42.
Crow, J. F., and M. Kimura, 1970 An Introduction to PopulationGenetic Theory. Harper & Row, New York.
Danilevskaya, O. N., X. Meng, Z. Hou, E. V. Ananiev, and C. R.Simmons, 2008 A genomic and expression compendium ofthe expanded PEBP gene family from maize. Plant Physiol.146: 250–264.
de Leon, N., and J. G. Coors, 2002 Twenty-four cycles of massselection for prolificacy in the Golden Glow maize population.Crop Sci. 42: 325–333.
de Leon, N. J., J. G. Coors, and S. M. Kaeppler, 2005 Geneticcontrol of prolificacy and related traits in the Golden Glowmaize population II: genotypic analysis. Crop Sci. 45: 1370–1378.
Doebley, J., A. Stec, J. Wendel, and M. Edwards, 1990 Geneticand morphological analysis of a maize-teosinte F2 population:implications for the origin of maize. Proc. Natl. Acad. Sci. USA87: 9888–9892.
Dudley, J. W., 2007 From means to QTL: the Illinois long-termselection experiment as a case study in quantitation genetics.Crop Sci. 47: S20–S31.
Duvick, D. N., 1997 What is yield? pp. 332–335 in DevelopingDrought and Low N-Tolerante Maize. Proceeding of a Symposium,edited by G.O. Edmeades, M. Bänziger, H. R. Mickelson, andC. B. Peña-Valdivia CIMMYT, El Batan, Mexico.
Flori, L., S. Fritz, F. Jaffrezic, M. Boussaha, I. Gut et al., 2009 Thegenome response to artificial selection: a case study in dairycattle. PLoS ONE 4: e6595.
Gu, J., N. Orr, S. D. Park, L. M. Katz, G. Sulimova et al., 2009 Agenome scan for positive selection in thoroughbred horses. PLoSONE 4: e5767.
Hartigan, J. A., and M. A. Wong, 1979 A K-means clustering al-gorithm. Appl. Stat. 28: 100–108.
Hermisson, J., and P. S. Pennings, 2005 Soft sweeps: molecularpopulation genetics of adaptation from standing genetic varia-ton. Genetics 169: 2335–2352.
Hufford, M. B., X. Xu, J. Heerwaarden, T. Pyhajarvi, J. Chia et al.,2012 Comparative population genomics of maize domestica-tion and improvement. Nat. Genet. 44(7): 808–811.
Innan, H., and Y. Kim, 2004 Pattern of polymorphism after strongartificial selection in a domestication event. Proc. Natl. Acad.Sci. USA 101: 10667–10672.
Jiao, Y., H. Zhao, L. Ren, W. Song, B. Zeng et al., 2012 Genome-wide genetic changes during modern breeding of maize. Nat.Genet. 44(7): 812–815.
Johansson, A. M., M. E. Pettersson, P. B. Siegel, and O. Carlborg,2010 Genome-wide effects of long-term divergent selection.PLoS Genet. 6: e1001188.
Jones, E., W. Chu, M. Ayele, J. Ho, E. Bruggeman et al.,2009 Development of single nucleotide polymorphism (SNP)markers for use in commercial maize (Zea mays L.) germplasm.Mol. Breed. 24: 165–176.
Kelly, J. K., B. Koseva, and J. P. Mojica, 2013 The genomic signalof partial sweeps in Mimulus guttatus. Genome Biol. Evol. 5(8):1457–1469.
Kim, Y., and W. Stephan, 2002 Detecting a local signature ofgenetic hitchhiking along a recombining chromosome. Genetics160: 765–777.
Kimura, M., 1962 On the probability of fixation of mutant genesin a population. Genetics 47: 713–719.
King, M., and A. C. Wilson, 1975 Evolution at two levels in hu-mans and chimpanzees. Science 188: 107–116.
Krimbas, C. B., and S. Tsakas, 1971 The genetics of Dacus oleae. V.Changes of esterase polymorphism in a natural population fol-lowing insecticide control—selection or drift? Evolution 25:454–460.
Lam, H., X. Xu, X. Liu, W. Chen, G. Yang et al., 2010 Resequencingof 31 wild and cultivated soybean genomes identifies patterns ofgenetic diversity and selection. Nat. Genet. 42(12): 1053–1059.
Langmead, B., C. Trapnell, M. Pop, and S. L. Salzberg,2009 Ultrafast and memory-efficient alignment of short DNAsequences to the human genome. Genome Biol. 10: R25.
Lewontin, R. C., and J. Krakauer, 1973 Distribution of gene fre-quency as a test of the theory of the selective neutrality of poly-morphisms. Genetics 74: 175–195.
Lee, M., N. Sharapova, W. D. Beavis, D. Grant, M. Katt et al.,2002 Expanding the genetic map of maize with the intermatedB73 x Mo17 (IBM) population. Plant Mol. Biol. 48: 453–461.
Li, H., B. Handsaker, A. Wysoker, T. Fennell, J. Ruan et al.,2009 The sequence alignment/map format and SAMtools. Bi-oinformatics 25: 2078–2079.
Liu, S., C. Yeh, T. Ji, K. Ying, H. Wu et al., 2009 Mu transposoninsertion sites and meiotic recombination events co-localizewith epigenetic marks for open chromatin across the maize ge-nome. PLoS Genet. 5(11): e1000733.
Maita, R., and J. G. Coors, 1996 Twenty cycles of biparental massselection for prolificacy in the open-pollinated maize populationGolden Glow. Crop Sci. 36: 1527–1532.
Matsuoka, Y., Y. Vigouroux, and M. M. Goodman, J. Sanchez G., E.Buckler et al., 2002 A single domestication for maize shown bymultilocus microsatellite genotyping. Proc. Natl. Acad. Sci. USA99: 6080–6084.
Maynard Smith, J., and J. Haigh, 1974 The hitch-hiking effect ofa favourable gene. Genet. Res. 23: 23–35.
Metzker, M. L., 2010 Sequencing technologies—the next genera-tion. Nat. Rev. Genet. 11: 31–46.
Myles, S., K. Tang, M. Somel, R. E. Green, J. Kelso et al.,2008 Identification and analysis of genomic regions with largebetween-population differentiation in humans. Ann. Hum.Genet. 72: 99–110.
Nei, M., and T. Maruyama, 1975 Letters to the editors: Lewontin-Krakauer test for neutral genes. Genetics 80: 395.
Odhiambo, M. O., and W. A. Compton, 1987 Twenty cycles ofdivergent mass selection for seed size in corn. Crop Sci. 27:1113–1116.
Pan, D., S. Zhang, J. Jiang, Q. Zhang, and J. Liu, 2013 Genome-wide deterction of selective signature in Chinese Holstein cattle.PLoS ONE 8: e60440.
Parts, L., F. A. Cubillos, J. Warringer, K. Jain, F. Salinas et al.,2011 Revealing the genetic structure of a trait by sequencinga population under selection. Genome Res. 21: 1131–1138.
Payseur, B. A., A. D. Cutter, and M. W. Nachman, 2002 Searchingfor evidence of positive selection in the human genome usingpatterns of microsatellite variability. Mol. Biol. Evol. 19: 1143–1153.
Selection Scan for Ear Number in Maize 839

Pritchard, J. K., J. K. Pickrell, and G. Coop, 2010 The genetics ofhuman adaptation: hard sweeps, soft sweeps, and polygenicadaptation. Curr. Biol. 20: R206–R215.
Prud’homme, B., N. Gompel, A. Rokas, V. A. Kassner, T. M.Williams et al.,2006 Repeated morphological evolution through cis-regulatorychanges in a pleiotropic gene. Nature 440: 1050–1053.
Przeworski, M., G. Coop, and J. D. Wall, 2005 The signature ofpositive selection on standing genetic variation. Evolution 59:2312–2323.
Qanbari, S., D. Gianola, B. Hayes, F. Schenkel, S. Miller et al.,2011 Application of site and haplotype-frequency based ap-proaches for detecting selection signatures in cattle. BMC Ge-nomics 12: 318.
Qanbari, S., T. M. Strom, G. Haberer, S. Weigend, A. A. Gheyaset al., 2012 A high resolution genome-wide scan for significantselective sweeps: an application to pooled sequence data inlaying chickens. PLoS ONE 7: e49525.
R Core Team, 2013 R: A Language and Environment for StatisticalComputing. R Foundation for Statistical Computing, Vienna.Available at: http://www.R-project.org/.
Robertson, A., 1975 Gene frequency distributions as a test of se-lective neutrality. Genetics 81: 775–785.
Ross, A. J., A. R. Hallauer, and M. Lee, 2006 Genetic analysis oftraits correlated with maize ear length. Maydica 51: 301–313.
Russell, W. A., 1984 Agronomic performance of maize cultivarsrepresenting defferent eras of breeding. Maydica 24: 375–390.
Sabeti, P. C., D. E. Reich, J. M. Higgins, H. Z. P. Levine, D. J. Richteret al., 2002 Detecting recent positive selection in the humangenome from haplotype structure. Nature 419: 832–837.
Sabeti, P. C., P. Varilly, B. Fry, J. Lohmueller, E. Hostetter et al.,2007 Genome-wide detection and characterization of positiveselection in human populations. Nature 449: 913–918.
Saghai-Maroof, M. A., K. M. Soliman, R. W. Jorgensen, and R. W.Allard, 1984 Ribosomal DNA spacer-length polymorphismsin barley: Mendelian inheritance, chromosomal location, andpopulation dynamics. Proc. Natl. Acad. Sci. USA 81: 8014–8018.
Schnable, P. S., and N. M. Springer, 2013 Progress toward un-derstanding heterosis in crop plants. Annu. Rev. Plant Biol. 64:71–88.
Schnable, P. S., D. Ware, R. S. Fulton, J. C. Stean, F. Wei et al.,2009 The B73 maize genome: complexity, diversity and dy-namics. Science 326: 1112–1115.
Sekhon, R. S., H. Lin, K. L. Childs, C. N. Hansey, C. R. Buell et al.,2011 Genome-wide atlas of transcription during maize devel-opment. Plant J. 66: 553–563.
Strasburg, J. L., N. A. Sherman, K. M. Wright, L. C. Moyle, J. H.Willis et al., 2012 What can patterns of differentiation acrossplant genomes tell us about adaptation and speciation? Philos.Trans. R. Soc. B 367: 364–373.
Subandi, 1990 Ten cycles of selection for prolificacy in a compos-ite variety of maize. Indones. J. Crop Sci. 5: 1–11.
Sucena, E., and D. L. Stern, 2000 Divergence of larval morphol-ogy between Drosophila sechellia and its sibling species causedby cis-regulatory evolution of ovo/shaven-baby. Proc. Natl.Acad. Sci. USA 97: 4530–4534.
Teotónio, H., I. M. Chelo, M. Bradic, M. R. Rose, and A. D. Long,2009 Experimental evolution reveals natural selection onstanding genetic variation. Nat. Genet. 41(2): 251–257.
Teshima, K. M., G. Coop, and M. Przeworski, 2006 How reliableare empirical genome scans for selective sweeps? Genome Res.16: 702–712.
Turner, T. L., A. D. Stewart, A. T. Fields, W. R. Rice, and A. M.Tarone, 2011 Population-based resequencing of experimen-tally evolved populations reveals the genetic basis of body sizevariation in Drosophila melanogaster. PLoS Genet. 7: e1001336.
Voight, B. F., S. Kudaravalli, X. Wen, and J. K. Pritchard, 2006 Amap of recent positive selection in the human genome. PLoSBiol. 4: e72.
Weir, B. S., and C. C. Cockerham, 1984 Estimating F-statistics forthe analysis of population structure. Evolution 38(6): 1358–1370.
Wisser, R. J., S. C. Murray, J. M. Kolkman, H. Ceballos, and R. J.Nelson, 2008 Selection mapping of loci for quantitative dis-ease resistance in a diverse maize population. Genetics 180:583–599.
Wray, G. A., 2007 The evolutionary significance of cis-regulatorymutations. Nat. Rev. Genet. 8: 206–216.
Wright, S., 1931 Evolution in Mendelian populations. Genetics16: 97–159.
Wright, S. I., I. V. Bi, S. G. Schroeder, M. Yamasaki, J. F. Doebleyet al., 2005 The effects of artificial selection on the maizegenome. Science 308: 1310–1314.
Ziwen, H., W. Zhai, H. Wen, T. Tang, Y. Wang et al., 2011 Twoevolutionary histories in the genome of rice: the roles of domes-tication genes. PLoS Genetics 7(6): e1002100.
Communicating editor: S. I. Wright
840 T. M. Beissinger et al.
GENETICSSupporting Information
http://www.genetics.org/lookup/suppl/doi:10.1534/genetics.113.160655/-/DC1
A Genome-Wide Scan for Evidence of Selectionin a Maize Population Under Long-Term
Artificial Selection for Ear NumberTimothy M. Beissinger, Candice N. Hirsch, Brieanne Vaillancourt, Shweta Deshpande,Kerrie Barry, C. Robin Buell, Shawn M. Kaeppler, Daniel Gianola, and Natalia de Leon
Copyright © 2014 by the Genetics Society of AmericaDOI: 10.1534/genetics.113.160655
2 SI T. M. Beissinger et al.
Figure S1 An illustration of the rationale behind using a gap of up to 5 MB between divergent SNPs within a single declared region. Depicted is a region on chromosome six that was identified as potentially under selection. The Grey bar represents the genome, while the black bars show the declared selected region. The top example shows that when a 5 MB gap was permitted, a single region was identified. As the permitted gap between SNPs belonging to the region was decreased, multiple regions were identified. It is more likely that there was a single selected variant and that LD across the region resulted in high FST values for multiple SNPs than that multiple independent selected variants were in such close proximity to one another. Limitations in our ability to accurately estimate LD from pooled sequencing data prevent us from estimating precise gap width per region.
T. M. Beissinger et al. 3 SI
Figure S2 The physical size of each region identified as potentially under selection based on FST is plotted, along with the size-group that the region was placed in according to k-means clustering. Regions are numbered in the same order as Table 1.
4 SI T. M. Beissinger et al.
T. M. Beissinger et al. 5 SI
6 SI T. M. Beissinger et al.

T. M. Beissinger et al. 7 SI
8 SI T. M. Beissinger et al.
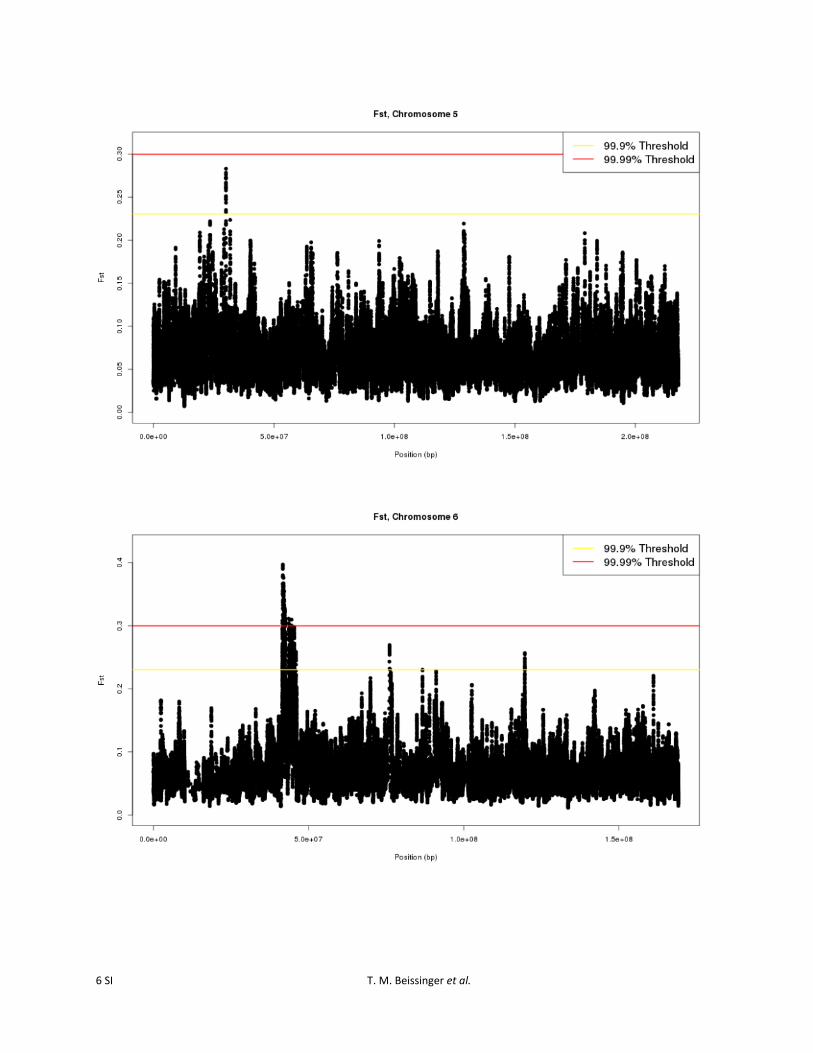
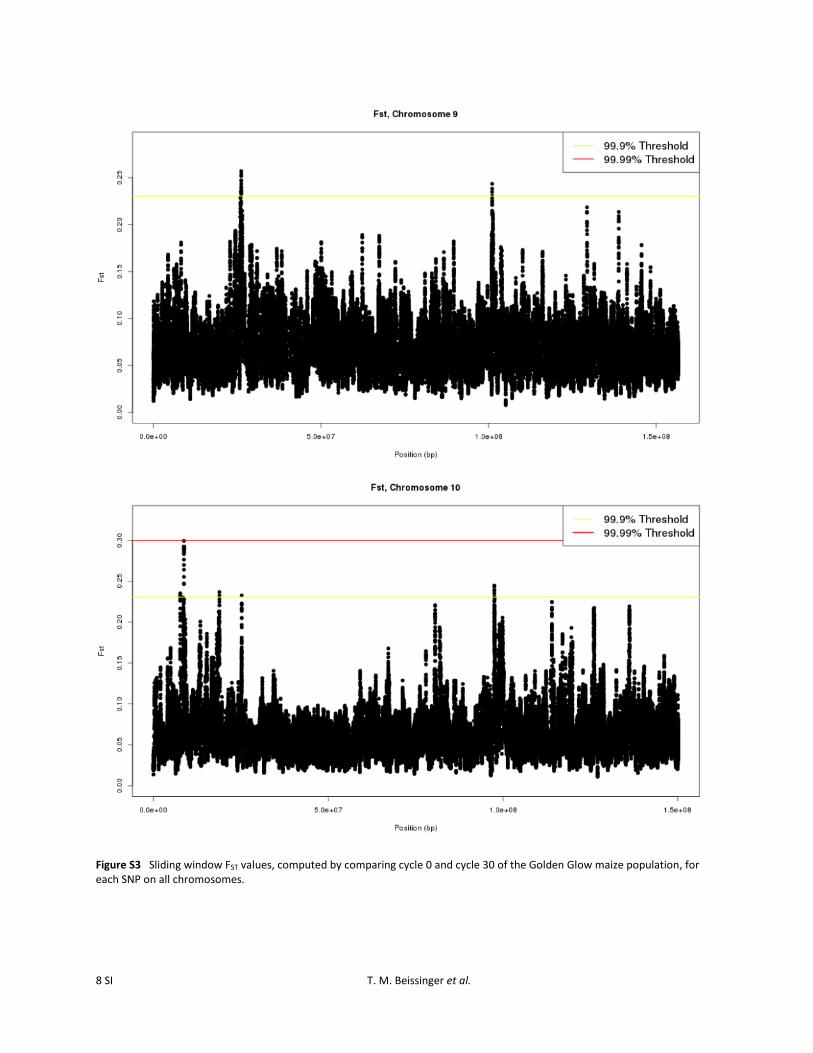
Figure S3 Sliding window FST values, computed by comparing cycle 0 and cycle 30 of the Golden Glow maize population, for each SNP on all chromosomes.
T. M. Beissinger et al. 9 SI
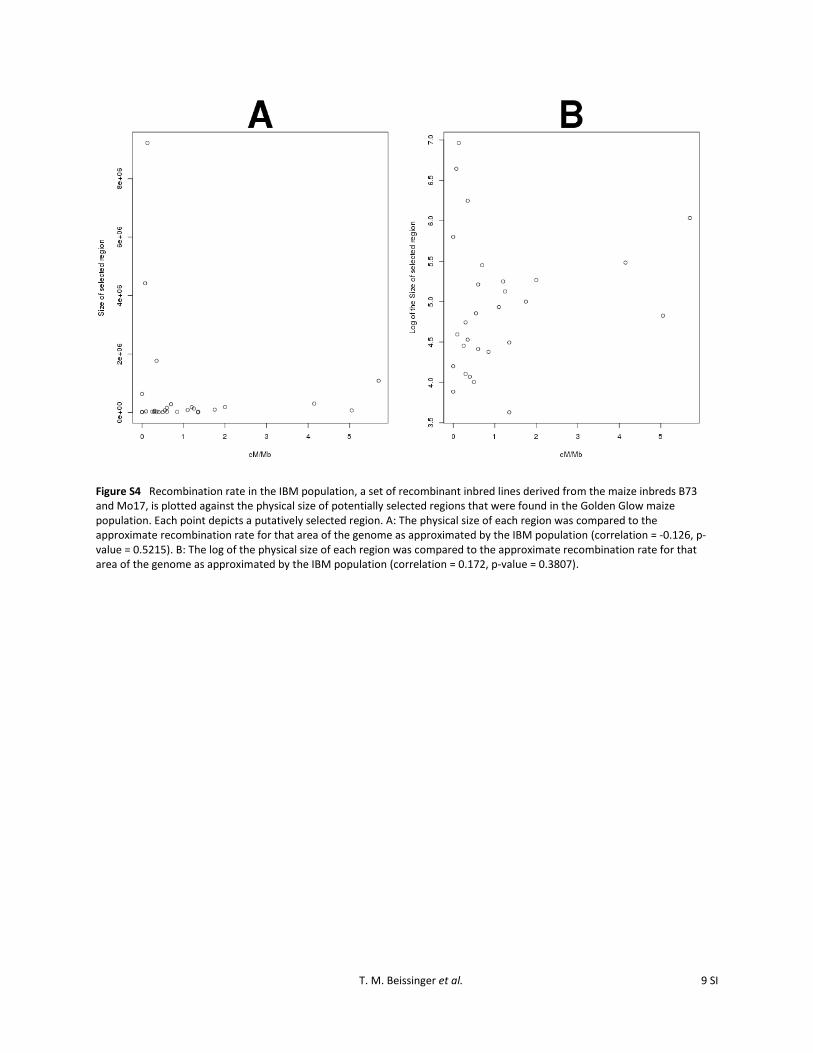
Figure S4 Recombination rate in the IBM population, a set of recombinant inbred lines derived from the maize inbreds B73 and Mo17, is plotted against the physical size of potentially selected regions that were found in the Golden Glow maize population. Each point depicts a putatively selected region. A: The physical size of each region was compared to the approximate recombination rate for that area of the genome as approximated by the IBM population (correlation = -0.126, p-value = 0.5215). B: The log of the physical size of each region was compared to the approximate recombination rate for that area of the genome as approximated by the IBM population (correlation = 0.172, p-value = 0.3807).