a gis-based decision making approach on the evaluation of...
TRANSCRIPT

Proceedings of the International Conference on Industrial Engineering and Operations Management
Bandung, Indonesia, March 6-8, 2018
© IEOM Society International
A GIS-Based Decision Making Approach on the Evaluation
of Sustainable Business Location for Purpose-Built Offices
in Malaysia
Edie Ezwan Mohd Safian, Heng Jia Yun, Burhaida Burhan, Mohd Lizam Mohd Diah and
Mat Tawi Yaacob
Department of Real Estate Management
Faculty of Technology Management and Business
Universiti Tun Hussein Onn Malaysia
Abdul Hadi Nawawi
Department of Estate Management
Faculty of Architecture, Planning and Surveying
Universiti Teknologi MARA, Malaysia
Abstract
Purpose-built office (PBO) market in Malaysia has shown progressive growths and increasing level of
competitiveness. The increasing competition in the PBO’s market would entail greater needs on their
level of business sustainability. Nevertheless, there is a lack of research in the country that had actually
studied in detail the level of sustainable locational of PBO in Kuala Lumpur, Malaysia. Therefore, the
purpose of this paper is to establish the sustainable PBO’s location in the city of Kuala Lumpur, Malaysia.
Delphi Method was selected as a reliable qualitative method based on the local context in developing
sustainable business location’s ranking through the viewpoints of local expert panels. It is believed that
the viewpoints can deliver guidance to the researcher in recognising the quality of each PBO’s sustainable
business location in local environment. GIS-based decision-making approach was applied in this research.
It is a comprehensive method that can combine the data between weightage of importance and score for
each PBO’s location characteristic. The study was successful in evaluating the sustainability of PBO
location with different results in each study area and it is expected to provide insights to the stakeholders
in improving their investment and business decision of the PBO market in Malaysia.
Keywords
Sustainable, business, purpose-built office, decision-making, and Geo-information system
1. Introduction
Over the past century, sustainable development concept has emerged to reach equilibrium between physical,
economic and social aspects in urban design and planning (Dehghanmongabadi, et al., 2014). Most of the previous
studies stated that location is one of the key factors to achieve the goal of sustainable development (Dixon, et al.,
2009). Based on the Guideline for Sustainable Building published by Federal Ministry for the Environment, Nature
Conservation, Building and Nuclear Safety (BMUB), location aspect of a building has affected the sustainability and
quality of a building through the evaluation of locational characteristics.
Findings in the summary report by Dixon, et al. (2009) ranked location of an office as an essential influence on the
decision in selecting a suitable office. The locational characteristics of an office building can be used as a
2830

Proceedings of the International Conference on Industrial Engineering and Operations Management
Bandung, Indonesia, March 6-8, 2018
© IEOM Society International
consideration in selecting an office, which can influence the overall performance of employees and the organization.
Therefore, location of office space was used as principle for classifying the office buildings (Adnan & Daud, 2010).
2. Sustainable Business Location of Purpose-Built Office (Pbo) in a Global and Local
Context
Location of a PBO is an essential factor that will impact the economic, environmental and social sustainability of a
business. Sustainable location for a business can be determined by its accessibility to public transport networks and
nodes, and to services and facilities. Hence, sustainable PBO location has to be accessible for the employees of
organizations, clients, as well as the varying range of facilities and amenities (Dalton, 2009). In addition, safety
levels and image of location can be addressed as the criteria to select the location.
The right location of an office building has the advantages of cost saving, time saving, with good accessibility to
other facilities and services. Normally, the location of a property will be a significant element for investors in
foreign countries. Thus, evaluation of the property will be performed in order to find a strategic location that meets
their requirements among the best options available (Iman, 2002). A research by Cheah, et al. (2014) had identified
several locational characteristics such as access to market, branding or image of location, proximity to clients, access
to public transport and terminal, as well as access to amenities.
As a conclusion, location is one of the key criteria in selecting a sustainable PBO for a business, broadly and locally.
To support the purpose of this paper, locational characteristics of a PBO will be identified and finalised in this
research. Table 1. shows the location assessment elements based on literature review that was used as variables in
this research.
Table 1. Locational characteristics of PBO
Sub-
Characteristics Description
Location of
commercial
feature
Place of an office building that is visible to public and able to represent the
identity of an organisation.
Examples: Petronas Twin Towers, KLCC
Availability of
transport options Public transports available for commuters to travel from a place to another.
Examples: rail, buses, and taxis
Transportation
distance Building within maximum walking distance of 500 meters to other location.
Examples: distance to main road, residential area and other commercial
buildings (hotels, shopping complexes, restaurants, cafes, etc.)
Vehicle flow The movement of traffic within the neighbourhood.
Examples: traffic condition (average speeds), infrastructure conditions (road
conditions) and external situational factors (weather, driving regulation)
Efficiency of
property market The best use of an office building to reflect the maximum benefits for
property market participants such as investors and occupiers.
3. GIS-Based Multi-Criteria Decision Making Approach
In adapting to the setting of Malaysian purpose-built office environment AHP method as Multi-Criteria Decision
Making (MCDM) technique is used to measure the weightage of importance and the weightage score for each
sustainability location characteristic of PBO. However, there are conflicting problems coexist in multi-criteria
decision-making (Gomes & Lins, 2002). Hence, combination of MCDM and GIS needs to be carried out based on
the occupants’ perceptions towards sustainability location characteristics of PBO in order to achieve the research
objective.
In general, both MCDM and GIS techniques have independent explication (Drobne & Lisec, 2009). Basically,
MCDM reveals the preferences and needs of decision makers, whereas GIS organises, presents and analyses a
variety of data to provide support for decision making. Therefore, multi-criteria decision analysis (MCDA) has been
merged with GIS to deal with decision problems related to geographical location (Drobne & Lisec, 2009; Chakhar &
2831

Proceedings of the International Conference on Industrial Engineering and Operations Management
Bandung, Indonesia, March 6-8, 2018
© IEOM Society International
Mousseau, 2007). Inevitably, GIS-based multi-criteria decision analysis has emerged since the late 1980s (Chakhar
& Mousseau, 2007).
GIS-based multi-criteria decision analysis can be considered as a process that combines and transforms input
(geographical data and decision makers’ preferences) into an output (resultant decision) (Malczewski, 1999). It can
also be known as spatial multi-criteria analysis. Both geographical data and decision makers’ preferences are used in
the process of GIS-based multi-criteria decision analysis. The geographical data are processed to obtain relevant
information regarding the sustainable business location selection for PBO. The input-output perspective of GIS-
based multi-criteria decision analysis will be illustrated in Figure 1.
Figure 1. GIS-based multi-criteria decision analysis: input-output perspective (Malczewski, 1999).
From the input-output perspective of GIS-based multi-criteria decision analysis, GIS functionality involves data
input, data storage and management, data manipulation and analysis, and data output (Malczewski, 1999). In GIS,
input data is comprised of geographical information and information on the decision makers’ preferences. These
data are organised in a geographic database. In a geographic database, there are two important components which
include spatial data that refers to geographic position and non-spatial data that refers to the properties of spatial
entities.
In common, geographical information and information about the preferences of decision makers are utilised and
organised by separate thematic maps or sets of data, referred to as a map layer (Malczewski, 1999). Each map layer
is a set of data demonstrating one item of information on each location. Every single information represents a
different nature of variables or locational attributes in a GIS system. In GIS database, a map layer can be either
displayed and analysed individually or combined with other map layers to produce the standardised output map
layer for GIS-based multi-criteria decision analysis.
Based on the clarification in the previous section, MCDM (AHP) is implemented to evaluate the sustainability
location characteristics of PBO based on the preferences and opinions of occupants. A proposed framework
integrates the capabilities of GIS and MCDM (AHP). The occupants’ perceptions are expressed from the aspects of
weightage on the importance and score assigned to each evaluation criterion. The input data will be obtained and
presented in the form of the decision matrix. Then, the input data will be organised by map layers to describe every
single information of each sustainable location of PBO. The geographical information and information about the
preferences of decision makers are combined into one-dimensional measurements of alternative decisions. The one-
dimensional measurements are integrated to provide an overall assessment of criteria with the appropriate decision
rules (Drobne & Lisec, 2009). The decision rules define the relationship between input maps and output map
through AHP procedures.
An output is obtained based on the ranking of sustainability location characteristics of PBO. After obtaining a
ranking of each sustainable location characteristic of PBO, the results are validated and verified through sensitivity
analysis to determine the robustness. The purpose of sensitivity analysis is to identify the preferred sustainable
location characteristics of PBO among decision makers or interest groups. Eventually, it ends with the
recommendation for future action.
2832

Proceedings of the International Conference on Industrial Engineering and Operations Management
Bandung, Indonesia, March 6-8, 2018
© IEOM Society International
With the visualisation technique such as maps, GIS-based multi-criteria decision making provides a more
comprehensive comparison of each sustainability location characteristic for PBO. Indirectly, the standardised output
map can be used as reference for the investors to select the best sustainable business location of PBO.
4. Methodology
There are four research areas involved in the city of Kuala Lumpur. These selected areas were chosen from the areas
that have been set by the National Property Information Centre (NAPIC). The areas include Golden Triangle (GT),
Central Business District (CBD), Within City Centre (WCC), and Suburban (Sub). Table 2. shows 111 samples of
PBO that have been selected based on cluster sampling within the Kuala Lumpur area. According to Kumar (1999),
it is easy to do the cluster sampling if the total sampling population is small, but if the population is large as in this
case of a city, it becomes challenging and expensive to categorise each sampling unit. In such case, the use of cluster
sampling is more applicable.
Table 2. Summary of the sample of PBOs in the research area.
Sampling Techniques Cluster Sampling
Purpose-built Offices
Unit Sample Size
Golden Triangle (GT) 43 34
Central Business District
(CBD)
89 27
Within City Centre
(WCC)
93 28
Suburban (SUB) 73 22
Total 111
In this research, in order to acquire and analyse comprehensive sets of data and information to determine the
sustainability of PBOs’ location, it was decided that the mixed method needs to be adopted. This approach will
facilitate a variety of aspects to support subtlety and accuracy of this research. For the first phase, semi-structured
interview (qualitative) was required to classify appropriate locational characteristics of PBO that has been viably
implemented in Malaysia. The Delphi Method was used for this phase where interviews with experts were
conducted to identify, validate and rank locational characteristics of the PBO. From the qualitative result, locational
characteristics’ ranking of PBO was developed.
In the second phase, quantitative method was involved and served as an exploratory survey in the process of
collecting data and it was divided into two groups. The first group used the questionnaire surveys t to obtain data
regarding the importance of locational characteristics of PBO from the occupants. At this stage, Analytical
Hierarchy Process (AHP) method was performed to determine the weightage of importance on each PBO locational
characteristic.
The second group used the score log for the quality level of PBO’s locational characteristics. The score to determine
the quality level of each characteristic was based on ranking that was built in the first phase. The locational
characteristics of PBO were assessed based on distance matrix using Quantum GIS (QGIS). It was based on the
building and locational characteristics’ ranking of PBO that has been built together with core evaluation through an
empirical and specific observation method. Data collected for the weightage of the importance and value of quality
score for each locational characteristic of PBO served as GIS-based decision-making approach that formed
sustainable location index of PBO.
5. Research Findings and Discussions 5.1 The Ranking of Sustainability Business Location for Malaysian PBO
The application of Delphi method had has allowed joint interviews with other expert panels from different fields
within the same sector/industry. All experts selected were expected to give appropriate feedbacks towards each
2833
Proceedings of the International Conference on Industrial Engineering and Operations Management
Bandung, Indonesia, March 6-8, 2018
© IEOM Society International
locational characteristic based on its suitability with local environment and practices. The selection of expert panels
who were involved in property valuation, property management, architecture, building surveying and estate agency
has enabled the creation of a ranking for the locational characteristics of PBO, which are more comprehensive and
flexible. However, comparisons with earlier studies must be discussed as a guidance to enhance the results of the
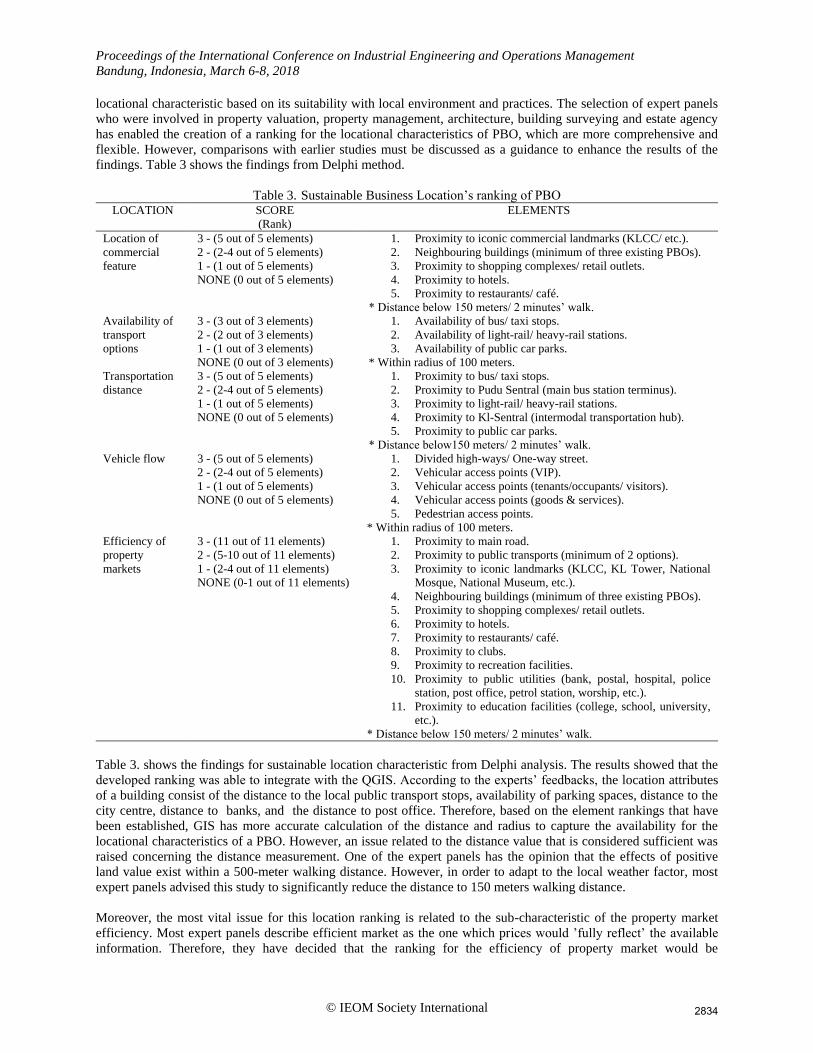
findings. Table 3 shows the findings from Delphi method.
Table 3. Sustainable Business Location’s ranking of PBO LOCATION SCORE
(Rank)
ELEMENTS
Location of
commercial
feature
3 - (5 out of 5 elements) 1. Proximity to iconic commercial landmarks (KLCC/ etc.).
2. Neighbouring buildings (minimum of three existing PBOs).
3. Proximity to shopping complexes/ retail outlets.
4. Proximity to hotels.
5. Proximity to restaurants/ café.
* Distance below 150 meters/ 2 minutes’ walk.
2 - (2-4 out of 5 elements)
1 - (1 out of 5 elements)
NONE (0 out of 5 elements)
Availability of
transport
options
3 - (3 out of 3 elements) 1. Availability of bus/ taxi stops.
2. Availability of light-rail/ heavy-rail stations.
3. Availability of public car parks.
* Within radius of 100 meters.
2 - (2 out of 3 elements)
1 - (1 out of 3 elements)
NONE (0 out of 3 elements)
Transportation
distance
3 - (5 out of 5 elements) 1. Proximity to bus/ taxi stops.
2. Proximity to Pudu Sentral (main bus station terminus).
3. Proximity to light-rail/ heavy-rail stations.
4. Proximity to Kl-Sentral (intermodal transportation hub).
5. Proximity to public car parks.
* Distance below150 meters/ 2 minutes’ walk.
2 - (2-4 out of 5 elements)
1 - (1 out of 5 elements)
NONE (0 out of 5 elements)
Vehicle flow 3 - (5 out of 5 elements) 1. Divided high-ways/ One-way street.
2. Vehicular access points (VIP).
3. Vehicular access points (tenants/occupants/ visitors).
4. Vehicular access points (goods & services).
5. Pedestrian access points.
* Within radius of 100 meters.
2 - (2-4 out of 5 elements)
1 - (1 out of 5 elements)
NONE (0 out of 5 elements)
Efficiency of
property
markets
3 - (11 out of 11 elements) 1. Proximity to main road.
2. Proximity to public transports (minimum of 2 options).
3. Proximity to iconic landmarks (KLCC, KL Tower, National
Mosque, National Museum, etc.).
4. Neighbouring buildings (minimum of three existing PBOs).
5. Proximity to shopping complexes/ retail outlets.
6. Proximity to hotels.
7. Proximity to restaurants/ café.
8. Proximity to clubs.
9. Proximity to recreation facilities.
10. Proximity to public utilities (bank, postal, hospital, police
station, post office, petrol station, worship, etc.).
11. Proximity to education facilities (college, school, university,
etc.).
* Distance below 150 meters/ 2 minutes’ walk.
2 - (5-10 out of 11 elements)
1 - (2-4 out of 11 elements)
NONE (0-1 out of 11 elements)
Table 3. shows the findings for sustainable location characteristic from Delphi analysis. The results showed that the
developed ranking was able to integrate with the QGIS. According to the experts’ feedbacks, the location attributes
of a building consist of the distance to the local public transport stops, availability of parking spaces, distance to the
city centre, distance to banks, and the distance to post office. Therefore, based on the element rankings that have
been established, GIS has more accurate calculation of the distance and radius to capture the availability for the
locational characteristics of a PBO. However, an issue related to the distance value that is considered sufficient was
raised concerning the distance measurement. One of the expert panels has the opinion that the effects of positive
land value exist within a 500-meter walking distance. However, in order to adapt to the local weather factor, most
expert panels advised this study to significantly reduce the distance to 150 meters walking distance.
Moreover, the most vital issue for this location ranking is related to the sub-characteristic of the property market
efficiency. Most expert panels describe efficient market as the one which prices would ’fully reflect’ the available
information. Therefore, they have decided that the ranking for the efficiency of property market would be
2834
Proceedings of the International Conference on Industrial Engineering and Operations Management
Bandung, Indonesia, March 6-8, 2018
© IEOM Society International
determined through the GIS perspective where all location elements around the building that could make the PBO
marketable must be taken into account. Indirectly, various elements were introduced such as distance to the main
road, public transport, iconic landmarks, commercial features, public utilities, recreation facilities, educational
facilities and others.
5.2 Evaluation of Weightage of Importance and Score for Sustainable Location Characteristics of PBO
The sustainable location characteristics of PBO consist of commercial feature locations, availability of transport
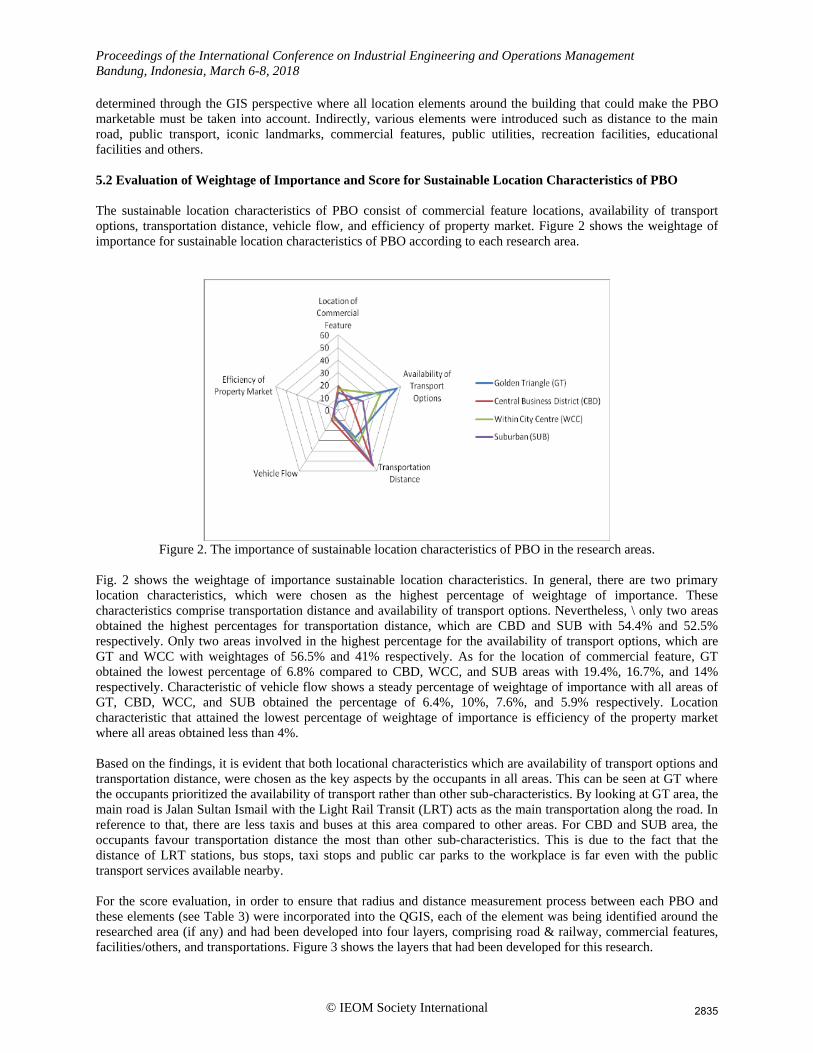
options, transportation distance, vehicle flow, and efficiency of property market. Figure 2 shows the weightage of
importance for sustainable location characteristics of PBO according to each research area.
Figure 2. The importance of sustainable location characteristics of PBO in the research areas.
Fig. 2 shows the weightage of importance sustainable location characteristics. In general, there are two primary
location characteristics, which were chosen as the highest percentage of weightage of importance. These
characteristics comprise transportation distance and availability of transport options. Nevertheless, \ only two areas
obtained the highest percentages for transportation distance, which are CBD and SUB with 54.4% and 52.5%
respectively. Only two areas involved in the highest percentage for the availability of transport options, which are
GT and WCC with weightages of 56.5% and 41% respectively. As for the location of commercial feature, GT
obtained the lowest percentage of 6.8% compared to CBD, WCC, and SUB areas with 19.4%, 16.7%, and 14%
respectively. Characteristic of vehicle flow shows a steady percentage of weightage of importance with all areas of
GT, CBD, WCC, and SUB obtained the percentage of 6.4%, 10%, 7.6%, and 5.9% respectively. Location
characteristic that attained the lowest percentage of weightage of importance is efficiency of the property market
where all areas obtained less than 4%.
Based on the findings, it is evident that both locational characteristics which are availability of transport options and
transportation distance, were chosen as the key aspects by the occupants in all areas. This can be seen at GT where
the occupants prioritized the availability of transport rather than other sub-characteristics. By looking at GT area, the
main road is Jalan Sultan Ismail with the Light Rail Transit (LRT) acts as the main transportation along the road. In
reference to that, there are less taxis and buses at this area compared to other areas. For CBD and SUB area, the
occupants favour transportation distance the most than other sub-characteristics. This is due to the fact that the
distance of LRT stations, bus stops, taxi stops and public car parks to the workplace is far even with the public
transport services available nearby.
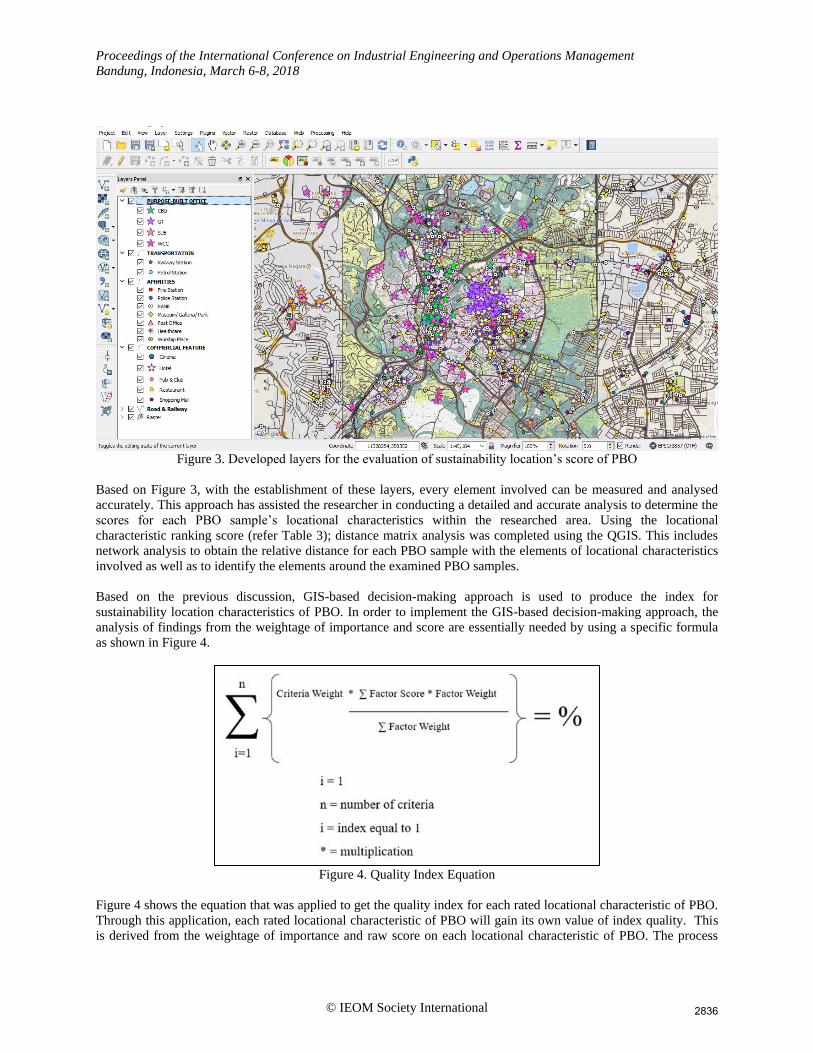
For the score evaluation, in order to ensure that radius and distance measurement process between each PBO and
these elements (see Table 3) were incorporated into the QGIS, each of the element was being identified around the
researched area (if any) and had been developed into four layers, comprising road & railway, commercial features,
facilities/others, and transportations. Figure 3 shows the layers that had been developed for this research.
2835
Proceedings of the International Conference on Industrial Engineering and Operations Management
Bandung, Indonesia, March 6-8, 2018
© IEOM Society International
Figure 3. Developed layers for the evaluation of sustainability location’s score of PBO
Based on Figure 3, with the establishment of these layers, every element involved can be measured and analysed
accurately. This approach has assisted the researcher in conducting a detailed and accurate analysis to determine the
scores for each PBO sample’s locational characteristics within the researched area. Using the locational
characteristic ranking score (refer Table 3); distance matrix analysis was completed using the QGIS. This includes
network analysis to obtain the relative distance for each PBO sample with the elements of locational characteristics
involved as well as to identify the elements around the examined PBO samples.
Based on the previous discussion, GIS-based decision-making approach is used to produce the index for
sustainability location characteristics of PBO. In order to implement the GIS-based decision-making approach, the
analysis of findings from the weightage of importance and score are essentially needed by using a specific formula
as shown in Figure 4.
Figure 4. Quality Index Equation
Figure 4 shows the equation that was applied to get the quality index for each rated locational characteristic of PBO.
Through this application, each rated locational characteristic of PBO will gain its own value of index quality. This
is derived from the weightage of importance and raw score on each locational characteristic of PBO. The process
2836

Proceedings of the International Conference on Industrial Engineering and Operations Management
Bandung, Indonesia, March 6-8, 2018
© IEOM Society International
will create an effective index that acts as an indicator in determining the sustainability of PBO’s location through
GIS-based decision-making approach. Table 3 shows final findings of sustainability of PBO’s location in all
research areas.
Table 3 Sustainability of PBO’s location index
LOCATION GT CBD WCC SUB
Location of commercial
feature
0.136 0.3874 0.3336 0.28
Availability of transport
options
1.6938 0.1283 0.4095 0.2368
Transportation distance 0.538 1.0878 0.6312 0.5245
Vehicle flow 0.1286 0.1 0.0761 0.0588
Efficiency of property
market
0.0682 0.0341 0.032 0.0398
Total 2.5646 1.7376 1.4824 1.1399
Index % (Average) 85.4 57.92 49.4 37.9
6. Conclusion
This research has utilised GIS-based decision-making approach to fit with the local environment in quantifying the
level of sustainable location characteristics that usually involved more subjective element. Through the justification
on the current GIS-based decision making approach, it has given its own uniqueness on the research where the
occupants’ orientation of the sustainability measurement method for locational characteristics of PBO was
introduced. In this research, the researcher has introduced GIS-AHP method. Findings obtained through the
application of this method are in index form that can be used as an indicator in identifying the sustainability level of
each PBO location’s characteristic evaluated.
Acknowledgements
The researcher acknowledges the other authors in this paper for giving tremendous support in completing this
research. Many thanks also to Universiti Tun Hussein Onn Malaysia (UTHM) in giving the financial support (under
STG Grant) in completing this research.
References Adnan, Yasmin Mohd, and Md Nasir Daud. Factors influencing office building occupation decision by tenants in
Kuala Lumpur city centre–a Delphi study. Journal of Design and Built Environment, 6.6, 2010, pp. 63-82.
Chakhar, Salem, and Vincent Mousseau. Spatial multicriteria decision making. LAMSADE: Publications, 2007, pp.
1-8.
Cheah, J. H., et al. Assessing technical and functional features of office buildings and their effects on satisfaction
and loyalty. International Journal of Economics and Management, 8, 2014, pp. 137-176.
Dalton, Alice. Evaluating the sustainability of office locations using GI: the Bristol city-region., 2009.
Dehghanmongabadi, Abolfazl, Şebnem Önal Hoşkara, and Nina Shirkhanloo. Introduction to Achieve Sustainable
Neighborhoods. International Journal of Arts and Commerce, 3, 2014, pp. 16-26.
Dixon, Tim, et al. Demand for sustainable offices in the UK. Investment Property Forum, 2009.
Drobne, Samo, and Anka Lisec. Multi-attribute decision analysis in GIS: weighted linear combination and ordered
weighted averaging. Informatica, 33.4, 2009.
Gomes, Eliane Gonçalves, and Marcos Pereira Estellita Lins. Integrating geographical information systems and
multi-criteria methods: a case study. Annals of Operations Research, 116.1, 2002, pp. 243-269.
Iman, Abdul Hamid Mar. An introduction to property marketing. Penerbit UTM, 2002.
Kumara, R. Research methodology: step by step Guides for: beginner, 1999.
Malczewski, Jacek. GIS and multicriteria decision analysis. John Wiley & Sons, 1999.
2837