a global perspective on the trophic geography of sharks ·...
TRANSCRIPT
Articleshttps://doi.org/10.1038/s41559-017-0432-z
© 2018 Macmillan Publishers Limited, part of Springer Nature. All rights reserved. © 2018 Macmillan Publishers Limited, part of Springer Nature. All rights reserved.
Sharks are one of the most speciose groups of predators on the planet and can be found over a broad range of habitats in every ocean1. Globally, population declines have been reported in
many species of sharks, largely due to fishing pressures and habi-tat degradation over the last century2–4. However, the impacts of these declines on broader ecosystem structure and function remain uncertain5–11. Global-scale ecological consequences from declining shark numbers are likely and may be apparent if shark taxa per-form broadly similar functions across different regions and habitat types, such that local effects scale across wide geographic regions. In marine systems, the impact of an individual on the wider ecosystem is strongly influenced by trophic interactions12. Thus, the composi-tion and spatial origin of diet plays an important part in shaping the ecological roles of individuals, species and functional groups. Here, we use the term ‘trophic geography’ to refer to spatial aspects of feeding and nutrition. Broadly quantifying the trophic geography
of marine consumers is particularly challenging because the spatial and temporal scales over which individuals forage can extend for thousands of kilometres and over months to years. Nevertheless, trophic geography provides critical information on how food webs are structured and the biological connectivity of ecosystems.
Extensive use of stable isotope analysis in localized studies of marine food webs has provided a wealth of published information on trophic ecology across broad geographic regions, and numerous ecosystems within those regions. Of particular utility, the stable iso-topic composition of carbon (δ 13C) in marine food webs provides spatial and trophic information on nutrient and biomass residence and translocation because of the predictable variation in δ 13C val-ues with latitude and among different primary production types, such as phytoplankton (− 24‰ to − 18‰), macrophytes (− 27‰ to − 8‰) and seagrasses (− 15‰ to − 3‰)13–15. The stable isotope com-position of carbon in primary producers is directly assimilated by
A global perspective on the trophic geography of sharksChristopher S. Bird 1,71*, Ana Veríssimo2,3, Sarah Magozzi1, Kátya G. Abrantes4, Alex Aguilar5, Hassan Al-Reasi6, Adam Barnett4, Dana M. Bethea7,72, Gérard Biais8, Asuncion Borrell 5, Marc Bouchoucha9, Mariah Boyle10, Edward J. Brooks11, Juerg Brunnschweiler12, Paco Bustamante 13, Aaron Carlisle14, Diana Catarino 15, Stéphane Caut16, Yves Cherel17, Tiphaine Chouvelon18, Diana Churchill19, Javier Ciancio20, Julien Claes21, Ana Colaço15, Dean L. Courtney 22,73, Pierre Cresson23, Ryan Daly24,25, Leigh de Necker26, Tetsuya Endo27, Ivone Figueiredo28, Ashley J. Frisch29, Joan Holst Hansen30, Michael Heithaus31, Nigel E. Hussey32, Johannes Iitembu33, Francis Juanes34, Michael J. Kinney 35, Jeremy J. Kiszka 36, Sebastian A. Klarian37, Dorothée Kopp38, Robert Leaf39, Yunkai Li40, Anne Lorrain41, Daniel J. Madigan42, Aleksandra Maljković43, Luis Malpica-Cruz44, Philip Matich45,46, Mark G. Meekan47, Frédéric Ménard48, Gui M. Menezes15, Samantha E. M. Munroe49, Michael C. Newman50, Yannis P. Papastamatiou51,52, Heidi Pethybridge53, Jeffrey D. Plumlee54,55, Carlos Polo-Silva56, Katie Quaeck-Davies1, Vincent Raoult 57, Jonathan Reum58, Yassir Eden Torres-Rojas59, David S. Shiffman60, Oliver N. Shipley61, Conrad W. Speed47, Michelle D. Staudinger62,63, Amy K. Teffer64, Alexander Tilley 65, Maria Valls66, Jeremy J. Vaudo67, Tak-Cheung Wai68, R. J. David Wells54,55, Alex S. J. Wyatt 69, Andrew Yool70 and Clive N. Trueman 1*
Sharks are a diverse group of mobile predators that forage across varied spatial scales and have the potential to influence food web dynamics. The ecological consequences of recent declines in shark biomass may extend across broader geographic ranges if shark taxa display common behavioural traits. By tracking the original site of photosynthetic fixation of carbon atoms that were ultimately assimilated into muscle tissues of 5,394 sharks from 114 species, we identify globally consistent biogeographic traits in trophic interactions between sharks found in different habitats. We show that populations of shelf-dwelling sharks derive a substantial proportion of their carbon from regional pelagic sources, but contain individuals that forage within addi-tional isotopically diverse local food webs, such as those supported by terrestrial plant sources, benthic production and macro-phytes. In contrast, oceanic sharks seem to use carbon derived from between 30° and 50° of latitude. Global-scale compilations of stable isotope data combined with biogeochemical modelling generate hypotheses regarding animal behaviours that can be tested with other methodological approaches.
A full list of affiliations appears at the end of the paper.
NATuRE ECOLOGY & EVOLuTION | VOL 2 | FEBRUARY 2018 | 299–305 | www.nature.com/natecolevol 299

© 2018 Macmillan Publishers Limited, part of Springer Nature. All rights reserved. © 2018 Macmillan Publishers Limited, part of Springer Nature. All rights reserved.
Articles NaTure ecoloGy & evoluTIoN
consumers through feeding, and provides a biochemical tracer linking a consumer to the basal source of carbon and/or latitudi-nal origin of the food webs that support tissue growth16. The extent of fractionation of stable isotopes of carbon during photosynthe-sis by algal phytoplankton varies strongly with latitude, and to a lesser extent with dissolved nutrient contents, due to temperature and latitude-dependent variation in factors such as cell size, growth rates and the concentration and isotopic composition of dissolved CO2
14,17. The stable isotope composition of carbon in algal phyto-plankton has been simulated using isotope-enabled biogeochemical models17, providing global-scale predictions of latitude-dependent variation in δ 13C values. Stable isotope data can thus be used as an indicator of the latitudinal origin of carbon assimilated by mobile marine consumers, providing insight into cross-ecosystem forag-ing without the need to directly track the movements of individual animals13,16. Sharks assimilating food fuelled by primary production source(s) in one region but captured in an isotopically distinct sec-ond region should have isotopic compositions that differ from those of primary producers in the capture location. Here, we compare lati-tudinal trends in δ 13C values observed in the muscle tissues of sharks found on continental shelf, open ocean and deep-sea habitats, with those predicted for phytoplankton from the known capture loca-tions to establish global patterns of trophic geography in sharks.
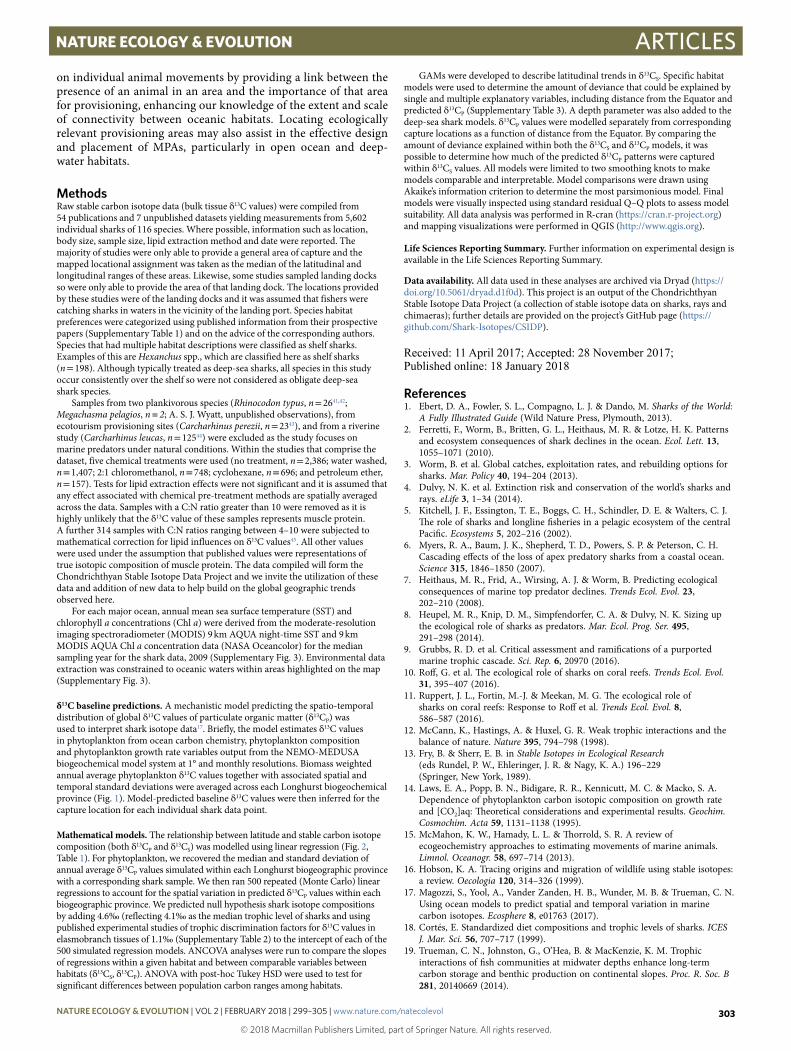
We compile a global-scale database of δ 13C values of white muscle tissue from 5,394 individual sharks from 114 species associated with continental shelves (neritic waters < 200 m in depth), oceanic (open-ocean waters but mainly occurring < 200 m) and deep-sea (conti-nental slopes and seamounts ≥ 200 m) habitats (Supplementary Table 1, Fig. 1). We compare observed shark δ 13C values (δ 13CS) with the biomass-weighted annual average δ 13C values predicted for phytoplankton (δ 13CP) within biogeographically distinct ecologi-cal regions (Longhurst biogeographic provinces) that correspond to shark capture locations (Fig. 2). We test the null hypothesis that sharks feed exclusively within the phytoplankton-derived food webs of their capture locations by comparing the observed and predicted latitudinal trends in δ 13C values. Capture location δ 13CP values are calculated from a carbon-isotope-enabled global ocean ecosystem model17 (Fig. 1). Global-scale isoscapes are not available for sources of marine production other than phytoplankton, thus we cannot discount the possibility that all sources of production show consis-tent latitudinal gradients in δ 13C values. However, the isotopic offset between phytoplankton, seagrass, macrophytes and benthic pro-duction varies substantially between sites16. Furthermore, variables such as cell size, growth rates and dissolved CO2 concentrations have less influence on the δ 13C values of alternative marine production sources14. We therefore expect that the δ 13C values of alternative pri-mary production sources will vary more at the local level, and differ-ing contributions from production sources within shark food webs will predominantly influence the variance seen in shark δ 13C values. A detailed description of the considerations and rationale behind the isotopic comparisons are given in the Supplementary Information.
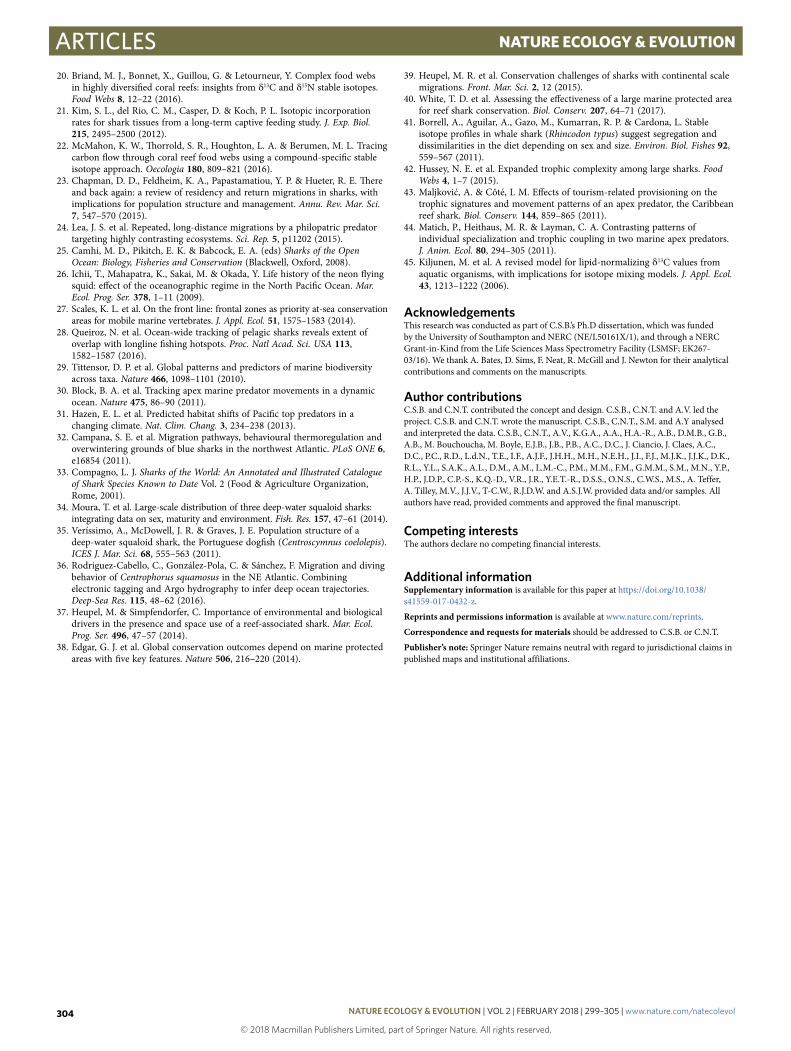
ResultsThe isotopic compositions of carbon in shark muscle (δ 13CS) co-vary negatively with latitude for oceanic and shelf sharks, but the relationship between latitude and δ 13CS values differs among habi-tats (Fig. 2). In continental shelf waters, latitudinal trends observed in shark muscle were similar to those estimated from biochemical models. The observed rate of change in δ 13C values per 1° of latitude was − 0.11 for sharks and − 0.13 for plankton, although these rates were statistically distinguishable (ANCOVA F11.864, P = 0.0006).
The average isotopic offset between plankton and shelf sharks (the difference in intercept values between the best fit linear regres-sions) is 4.6‰, close to the expected trophic offset of 4.5‰, given that the median trophic level for sharks is estimated at 4.118 and the mean isotopic difference between sharks and their prey (that is, the
trophic discrimination factor for δ 13C) is 1.1‰ (Supplementary Table 2). Best-fit generalized additive models (GAMs) indicate that the largest amount of deviance in δ 13CS in shelf sharks is explained by latitude (42.0%), with shark size having very little effect (3.1%) and a combined explanatory deviance of 46.7% (Supplementary Table 3). Across all latitudes, the range of δ 13CS values within a given single-species population of shelf sharks is higher than that of oce-anic or deep-sea sharks (Fig. 2).
Although oceanic and shelf sharks were sampled from a simi-lar latitudinal range, the observed latitudinal trends in δ 13CS values from oceanic sharks are less steep than those predicted for phyto-plankton from the corresponding Longhurst biogeographic prov-ince (ANCOVA: F205.63, P < 0.001; Fig. 2). Irrespective of capture latitude, the observed range of δ 13CS values in oceanic sharks was small (− 17.22 ± 0.99‰) across the sampling range. The lack of covariance of δ 13CS with latitude suggests oceanic sharks assimilate the majority of their carbon from a relatively restricted latitudinal range, although temporal differences in habitat use and δ 13C val-ues of prey coupled with relatively slow isotopic turnover rates of muscle in elasmobranchs could potentially mask variability driven by latitude (discussed further in Supplementary Information). Best-fit GAM models indicate that only 20.2% and 4.8% of the deviance in oceanic shark muscle isotope values is explained by latitude and shark size, respectively (Supplementary Table 3).
Despite the concentration of deep-sea samples from the North Atlantic, latitudinal trends in δ 13CS for deep-sea sharks do not co-vary with latitude (R2 = < 0.001, P = 0.314) or with δ 13CP (ANCOVA: F1581.9, P < 0.001; Fig. 2), displaying patterns similar to those seen in oceanic sharks. Body size explained 25.3% and depth of capture 17.6% of the deviance in carbon isotope compositions of deep-sea sharks (Supplementary Table 3), which implies that their trophic ecology is strongly depth and size-structured, consistent with other fishes from continental slopes19.
DiscussionStable carbon isotope compositions measured in shelf sharks express similar latitudinal trends to modelled carbon isotope compositions in phytoplankton and are consistent with our null hypothesis that shelf shark populations are supported primarily by phytoplanktonic production close to their capture location. Shelf sharks display rela-tively high intraspecific variability in stable carbon isotope compo-sitions compared with oceanic and deep-sea populations (Fig. 2). Thus although the median isotopic compositions of populations imply that the bulk of food assimilated by shelf sharks is supported by phytoplankton production, it seems that individuals within pop-ulations assimilate nutrients from a range of isotopically distinct sources. Shelf, and particularly coastal, ecosystems contain a wider diversity of ecological and isotopic niches than oceanic ecosystems, including food webs that are supported by seagrasses, benthic pro-duction, macroalgae and coral13,20. In most shelf habitats, pelagic phytoplankton yields more negative δ 13C values than alternative carbon sources13. Foraging across coastal food webs will tend to produce more varied and less negative δ 13C values than foraging solely in food webs supported by local phytoplankton. We infer that at the population level, shelf sharks act as generalist predators, but populations of at least some of those species are composed of spe-cialist individuals that forage within distinct food webs during the timescale of isotopic turnover (probably 1–2 years21). The range of δ 13CS values observed within populations of shelf sharks is greater in latitudes lower than around 40° (Fig. 2), potentially indicating a greater reliance on food webs that are supported by a range of non-phytoplankton-based resources such as seagrasses and coral reefs in less productive tropical settings. These hypotheses related to the range of primary production sources fuelling shark popu-lations could be further tested using essential amino acid carbon isotope fingerprinting22.
NATuRE ECOLOGY & EVOLuTION | VOL 2 | FEBRUARY 2018 | 299–305 | www.nature.com/natecolevol300

© 2018 Macmillan Publishers Limited, part of Springer Nature. All rights reserved. © 2018 Macmillan Publishers Limited, part of Springer Nature. All rights reserved.
ArticlesNaTure ecoloGy & evoluTIoN
Pairing stable isotope analysis with more traditional habitat-use methodologies could improve our understanding of shark behav-iour on continental shelves. Tracking studies demonstrate that while spatial residency and/or repeated return-migrations (philopa-try) are common traits among sharks that use continental shelves, some species are capable of undertaking large oceanic migrations (for example, white and tiger sharks) and philopatry is still under investigation23. Some species, identified a priori here as shelf sharks (such as tiger, white and bull sharks), use multiple habitats and can undertake offshore migrations in excess of 1,000 km24. The isotopic compositions of sharks classified as mixed-habitat species diverge in
latitudes lower than 35° (Supplementary Fig. 2). Among studies of species that are capable of utilizing multiple habitats, the majority of populations surveyed displayed δ 13C values that are more consistent with obligate shelf sharks than oceanic sharks (Supplementary Fig. 2). This suggests that while some shelf shark species may be highly migratory, the carbon supporting tissue growth is largely assimi-lated from foraging within shelf areas.
In contrast to shelf sharks, the stable isotope compositions of carbon in oceanic sharks and local phytoplankton do not co-vary, and oceanic shark populations sampled within these studies show similar carbon isotope compositions across all reported capture
–18
–30
–24
–21
–27
Shelf
Oceanic
Deep-sea
δ13CP
50° N
50° S
150° W 100° W 50° W 50° E 150° E100° E0°
0°
N
Fig. 1 | Distribution of compiled shark data overlaid on a spatial model of annual average biomass weighted δ13CP within Longhurst biogeographic provinces from the median sampling year (2009). The coloured points signify the habitat classification of those samples. Most studies provided one location for multiple samples.
δ13CP
δ13CS
δ13CE
Distance from Equator (°)
δ13C
(‰
)
a
20 40 600
b
0
3
6
9
B B
A
δ13C
ran
ge (
‰)
−25
−20
−15
−10
−5
20 40 600 20 40 600
n = 3,231 n = 676 n = 1,478
OceanicShelf Deep-sea
Shelf
Ocean
ic
Deep-
sea
Fig. 2 | Carbon isotope data. a, The relationship between δ 13CP from Longhurst biogeographic provinces associated with shark capture locations (solid black line) and δ 13CS values (dashed black line and open circles) and latitude (bottom row). The confidence envelopes reflect 500 Monte Carlo iterations considering the variance in δ 13CP values within each Longhurst biogeographic province (grey lines) and the same latitudinal trends predicted for δ 13CS with an offset of 4.6‰ added corresponding to the mean offset between δ 13CP and δ 13CS (red lines) and to the trophic effects on δ 13C values. The maps provide the individual shark sample locations overlaid with the δ 13CP isoscape from Fig. 1. b, Distribution of the observed δ 13CS ranges of species-specific shark populations in each habitat. The horizontal line is the mean δ 13CS range across shark populations within that habitat. Boxes contain 50% of the data and lines correspond to the 95% confidence interval. The letters signify analysis of variance, Tukey HSD results for significant difference, with the same letters representing mean values that are not significantly different from each other.
NATuRE ECOLOGY & EVOLuTION | VOL 2 | FEBRUARY 2018 | 299–305 | www.nature.com/natecolevol 301
© 2018 Macmillan Publishers Limited, part of Springer Nature. All rights reserved. © 2018 Macmillan Publishers Limited, part of Springer Nature. All rights reserved.
Articles NaTure ecoloGy & evoluTIoN
latitudes (Fig. 2). The limited isotopic variability seen in oceanic sharks could reflect either derivation of the majority of nutrients from a restricted latitudinal range, or extensive foraging across large latitudinal gradients to produce a consistent average value. In both cases the consumption of carbon with relatively low δ 13C values (that is, from higher latitudes) is needed to explain the relatively 13C-depleted values seen in sharks caught at low latitudes. Oceanic sharks are not commonly found in latitudes greater than approxi-mately 50° N or S25, limiting the potential to balance diet sources with higher δ 13C values. We therefore infer that the majority of the carbon assimilated was relatively depleted in 13C and is consistent with phytoplankton-based food webs (including mesopelagic food webs) from intermediate latitudes between approximately 30–50° from the Equator. The uncertainty surrounding the predictions of baseline δ 13CP, capture locations and isotopic turnover rates limit our ability to identify preferential foraging latitudes. Oceanic sharks could also potentially be intercepting migratory prey that originated from a restricted latitudinal range, such as squid26. Regardless of the mechanism(s), our data imply that intermediate latitude areas may provide globally important sources of energy and nutrients for the oceanic shark populations sampled in these studies.
Our inferences of regionally restricted foraging areas are con-sistent with latitudinal trends in oceanic productivity and satel-lite telemetry studies of several oceanic shark species27,28. Pelagic ecosystems at intermediate latitudes are typically characterized by strong thermal gradients that act to concentrate ocean productivity in frontal and eddy systems (Supplementary Fig. 3) which subse-quently attract and support oceanic consumers including cetaceans, fishes, seabirds and marine turtles27,29,30. Tracking data from some oceanic shark species show high residency within intermediate latitudes28,30,31, and our interpretation of the stable isotope data sup-ports these predictions of centralized foraging locations. Migrations away from productive foraging grounds may provide optimal habi-tats for behaviours such as breeding, pupping and avoiding intra-specific competition and harassment28,32. Oceanic sharks have distributional ranges spanning ocean basins33, therefore, recogniz-ing that most of the carbon assimilated into their muscle tissues is derived from photosynthesis occurring in a relatively limited latitu-dinal region highlights the global importance of regional food webs. More observations of oceanic sharks and/or potentially migratory prey from tropical waters are required to test our hypotheses of centralized foraging.
Similar latitudinal isotopic gradients are observed between oceanic and deep-sea sharks, which may imply a shared nutrient resource supporting sharks in both habitats (Supplementary Fig. 4). Deep-sea sharks rely on the vertical flux of nutrients derived mainly from surface phytoplanktonic production19, and may therefore be expected to closely track the stable isotope composition of surface production. However, the concentration of deep-sea shark samples from the North Atlantic Ocean (74%) makes it difficult to determine the tropho-spatial dynamics of this group, because the ameliorating effects of the Gulf Stream suppresses latitudinal variation in δ 13CP (Fig. 1). Latitudinal trends are further complicated by the strong effect of body size and depth (Supplementary Table 3), whereby some species of deep-sea shark express bathymetric segregations by size34. Although movement data for most deep-sea shark species is
limited, some larger species undertake long-distance migrations that are possibly linked to ontogeny, but may also undertake diel verti-cal migrations linked with foraging35,36. More research is needed to fully understand the trophic geography of deep-sea sharks and their functional roles in deep-sea ecosystems.
Concluding remarksNearly a quarter of all chondrichthyan species are evaluated as threatened on the International Union for Conservation of Nature Red List of Threatened Species, raising concerns on the future of many populations and the resulting effects such declines may have on ecosystem function2,4,7,37. Concurrent declines in species with shared trophic geographies help identify common risks associ-ated with fishing or climate change. While it is beyond the scope of this study, and these data, to predict the effects of further removal of sharks from the oceans, we suggest areas that warrant further investigation, specifically: (1) many shark species foraging in shelf environments are typically classed as generalist consumers, but our data suggest that populations are commonly composed of indi-viduals that forage in distinct food webs that are supported by a range of different carbon sources. Such behavioural specialization within generalist populations could in theory reduce within-species competition by partitioning resources and habitats, but the role of individual specialization in regulating shark population densities is unclear. (2) Oceanic sharks seem to predominantly forage on carbon resources from a restricted latitudinal range in sub-trop-ical regions that are characterized by relatively high productivity. We hypothesize that sharks migrate away from highly productive regions into warmer waters to engage in alternative behaviours such as reproduction, but the mechanisms and drivers underpinning lati-tude-restricted foraging in oceanic sharks remain unknown. Global patterns of trophic geography in other large mobile marine preda-tors are generally unknown, but may reveal the role mobile animals play in distributing nutrients and connecting ecosystems across the global ocean, and help to predict population responses to changes in local productivity. We have provided evidence that suggests that on a global scale sharks typically forage within spatially restricted, regional seascapes. Conservation of shelf marine environments is increasingly being addressed through the creation of marine pro-tected areas (MPAs)38. MPAs may be effective measures for protect-ing locally resident shelf shark species, providing they encompass the range of adjacent habitats and core areas utilized by these shark populations39,40. Although the distributional ranges for most oce-anic sharks are expansive, core intermediate latitudes seem to be important for the provision of nutrients and energy. Productive intermediate latitudes are also targeted by pelagic fisheries, which increases the susceptibility of oceanic sharks to exploitation28. Establishing management and protective strategies that encompass all critical habitats utilized by a species is complex. However, our results suggest that oceanic sharks may benefit from global strat-egies that mitigate negative impacts on intermediate-latitude food webs and from fishing practices that minimize shark mortality in these areas27,28.
Electronic tagging has revolutionized shark spatial ecology, pro-viding detailed records of the movement of individual animals23,30. Tracking the movement of nutrients can complement information
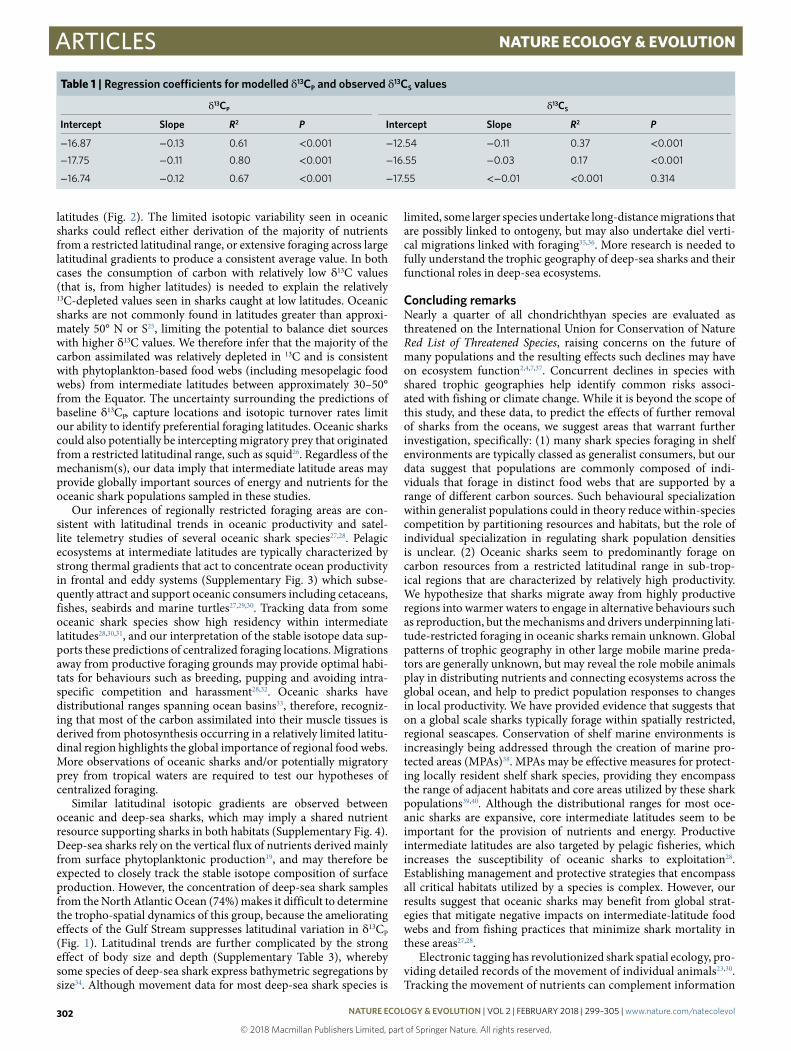
Table 1 | Regression coefficients for modelled δ 13CP and observed δ 13CS values
δ 13CP δ 13CS
Intercept Slope R2 P Intercept Slope R2 P
− 16.87 − 0.13 0.61 < 0.001 − 12.54 − 0.11 0.37 < 0.001
− 17.75 − 0.11 0.80 < 0.001 − 16.55 − 0.03 0.17 < 0.001
− 16.74 − 0.12 0.67 < 0.001 − 17.55 < − 0.01 < 0.001 0.314
NATuRE ECOLOGY & EVOLuTION | VOL 2 | FEBRUARY 2018 | 299–305 | www.nature.com/natecolevol302
© 2018 Macmillan Publishers Limited, part of Springer Nature. All rights reserved. © 2018 Macmillan Publishers Limited, part of Springer Nature. All rights reserved.
ArticlesNaTure ecoloGy & evoluTIoN
on individual animal movements by providing a link between the presence of an animal in an area and the importance of that area for provisioning, enhancing our knowledge of the extent and scale of connectivity between oceanic habitats. Locating ecologically relevant provisioning areas may also assist in the effective design and placement of MPAs, particularly in open ocean and deep-water habitats.
MethodsRaw stable carbon isotope data (bulk tissue δ 13C values) were compiled from 54 publications and 7 unpublished datasets yielding measurements from 5,602 individual sharks of 116 species. Where possible, information such as location, body size, sample size, lipid extraction method and date were reported. The majority of studies were only able to provide a general area of capture and the mapped locational assignment was taken as the median of the latitudinal and longitudinal ranges of these areas. Likewise, some studies sampled landing docks so were only able to provide the area of that landing dock. The locations provided by these studies were of the landing docks and it was assumed that fishers were catching sharks in waters in the vicinity of the landing port. Species habitat preferences were categorized using published information from their prospective papers (Supplementary Table 1) and on the advice of the corresponding authors. Species that had multiple habitat descriptions were classified as shelf sharks. Examples of this are Hexanchus spp., which are classified here as shelf sharks (n = 198). Although typically treated as deep-sea sharks, all species in this study occur consistently over the shelf so were not considered as obligate deep-sea shark species.
Samples from two plankivorous species (Rhinocodon typus, n = 2641,42; Megachasma pelagios, n = 2; A. S. J. Wyatt, unpublished observations), from ecotourism provisioning sites (Carcharhinus perezii, n = 2343), and from a riverine study (Carcharhinus leucas, n = 12544) were excluded as the study focuses on marine predators under natural conditions. Within the studies that comprise the dataset, five chemical treatments were used (no treatment, n = 2,386; water washed, n = 1,407; 2:1 chloromethanol, n = 748; cyclohexane, n = 696; and petroleum ether, n = 157). Tests for lipid extraction effects were not significant and it is assumed that any effect associated with chemical pre-treatment methods are spatially averaged across the data. Samples with a C:N ratio greater than 10 were removed as it is highly unlikely that the δ 13C value of these samples represents muscle protein. A further 314 samples with C:N ratios ranging between 4–10 were subjected to mathematical correction for lipid influences on δ 13C values45. All other values were used under the assumption that published values were representations of true isotopic composition of muscle protein. The data compiled will form the Chondrichthyan Stable Isotope Data Project and we invite the utilization of these data and addition of new data to help build on the global geographic trends observed here.
For each major ocean, annual mean sea surface temperature (SST) and chlorophyll a concentrations (Chl a) were derived from the moderate-resolution imaging spectroradiometer (MODIS) 9 km AQUA night-time SST and 9 km MODIS AQUA Chl a concentration data (NASA Oceancolor) for the median sampling year for the shark data, 2009 (Supplementary Fig. 3). Environmental data extraction was constrained to oceanic waters within areas highlighted on the map (Supplementary Fig. 3).
δ13C baseline predictions. A mechanistic model predicting the spatio-temporal distribution of global δ 13C values of particulate organic matter (δ 13CP) was used to interpret shark isotope data17. Briefly, the model estimates δ 13C values in phytoplankton from ocean carbon chemistry, phytoplankton composition and phytoplankton growth rate variables output from the NEMO-MEDUSA biogeochemical model system at 1° and monthly resolutions. Biomass weighted annual average phytoplankton δ 13C values together with associated spatial and temporal standard deviations were averaged across each Longhurst biogeochemical province (Fig. 1). Model-predicted baseline δ 13C values were then inferred for the capture location for each individual shark data point.
Mathematical models. The relationship between latitude and stable carbon isotope composition (both δ 13CP and δ 13CS) was modelled using linear regression (Fig. 2, Table 1). For phytoplankton, we recovered the median and standard deviation of annual average δ 13CP values simulated within each Longhurst biogeographic province with a corresponding shark sample. We then ran 500 repeated (Monte Carlo) linear regressions to account for the spatial variation in predicted δ 13CP values within each biogeographic province. We predicted null hypothesis shark isotope compositions by adding 4.6‰ (reflecting 4.1‰ as the median trophic level of sharks and using published experimental studies of trophic discrimination factors for δ 13C values in elasmobranch tissues of 1.1‰ (Supplementary Table 2) to the intercept of each of the 500 simulated regression models. ANCOVA analyses were run to compare the slopes of regressions within a given habitat and between comparable variables between habitats (δ 13CS, δ 13CP). ANOVA with post-hoc Tukey HSD were used to test for significant differences between population carbon ranges among habitats.
GAMs were developed to describe latitudinal trends in δ 13CS. Specific habitat models were used to determine the amount of deviance that could be explained by single and multiple explanatory variables, including distance from the Equator and predicted δ 13CP (Supplementary Table 3). A depth parameter was also added to the deep-sea shark models. δ 13CP values were modelled separately from corresponding capture locations as a function of distance from the Equator. By comparing the amount of deviance explained within both the δ 13CS and δ 13CP models, it was possible to determine how much of the predicted δ 13CP patterns were captured within δ 13CS values. All models were limited to two smoothing knots to make models comparable and interpretable. Model comparisons were drawn using Akaike’s information criterion to determine the most parsimonious model. Final models were visually inspected using standard residual Q–Q plots to assess model suitability. All data analysis was performed in R-cran (https://cran.r-project.org) and mapping visualizations were performed in QGIS (http://www.qgis.org).
Life Sciences Reporting Summary. Further information on experimental design is available in the Life Sciences Reporting Summary.
Data availability. All data used in these analyses are archived via Dryad (https://doi.org/10.5061/dryad.d1f0d). This project is an output of the Chondrichthyan Stable Isotope Data Project (a collection of stable isotope data on sharks, rays and chimaeras); further details are provided on the project’s GitHub page (https://github.com/Shark-Isotopes/CSIDP).
Received: 11 April 2017; Accepted: 28 November 2017; Published online: 18 January 2018
References 1. Ebert, D. A., Fowler, S. L., Compagno, L. J. & Dando, M. Sharks of the World:
A Fully Illustrated Guide (Wild Nature Press, Plymouth, 2013). 2. Ferretti, F., Worm, B., Britten, G. L., Heithaus, M. R. & Lotze, H. K. Patterns
and ecosystem consequences of shark declines in the ocean. Ecol. Lett. 13, 1055–1071 (2010).
3. Worm, B. et al. Global catches, exploitation rates, and rebuilding options for sharks. Mar. Policy 40, 194–204 (2013).
4. Dulvy, N. K. et al. Extinction risk and conservation of the world’s sharks and rays. eLife 3, 1–34 (2014).
5. Kitchell, J. F., Essington, T. E., Boggs, C. H., Schindler, D. E. & Walters, C. J. The role of sharks and longline fisheries in a pelagic ecosystem of the central Pacific. Ecosystems 5, 202–216 (2002).
6. Myers, R. A., Baum, J. K., Shepherd, T. D., Powers, S. P. & Peterson, C. H. Cascading effects of the loss of apex predatory sharks from a coastal ocean. Science 315, 1846–1850 (2007).
7. Heithaus, M. R., Frid, A., Wirsing, A. J. & Worm, B. Predicting ecological consequences of marine top predator declines. Trends Ecol. Evol. 23, 202–210 (2008).
8. Heupel, M. R., Knip, D. M., Simpfendorfer, C. A. & Dulvy, N. K. Sizing up the ecological role of sharks as predators. Mar. Ecol. Prog. Ser. 495, 291–298 (2014).
9. Grubbs, R. D. et al. Critical assessment and ramifications of a purported marine trophic cascade. Sci. Rep. 6, 20970 (2016).
10. Roff, G. et al. The ecological role of sharks on coral reefs. Trends Ecol. Evol. 31, 395–407 (2016).
11. Ruppert, J. L., Fortin, M.-J. & Meekan, M. G. The ecological role of sharks on coral reefs: Response to Roff et al. Trends Ecol. Evol. 8, 586–587 (2016).
12. McCann, K., Hastings, A. & Huxel, G. R. Weak trophic interactions and the balance of nature. Nature 395, 794–798 (1998).
13. Fry, B. & Sherr, E. B. in Stable Isotopes in Ecological Research (eds Rundel, P. W., Ehleringer, J. R. & Nagy, K. A.) 196–229 (Springer, New York, 1989).
14. Laws, E. A., Popp, B. N., Bidigare, R. R., Kennicutt, M. C. & Macko, S. A. Dependence of phytoplankton carbon isotopic composition on growth rate and [CO2]aq: Theoretical considerations and experimental results. Geochim. Cosmochim. Acta 59, 1131–1138 (1995).
15. McMahon, K. W., Hamady, L. L. & Thorrold, S. R. A review of ecogeochemistry approaches to estimating movements of marine animals. Limnol. Oceanogr. 58, 697–714 (2013).
16. Hobson, K. A. Tracing origins and migration of wildlife using stable isotopes: a review. Oecologia 120, 314–326 (1999).
17. Magozzi, S., Yool, A., Vander Zanden, H. B., Wunder, M. B. & Trueman, C. N. Using ocean models to predict spatial and temporal variation in marine carbon isotopes. Ecosphere 8, e01763 (2017).
18. Cortés, E. Standardized diet compositions and trophic levels of sharks. ICES J. Mar. Sci. 56, 707–717 (1999).
19. Trueman, C. N., Johnston, G., O’Hea, B. & MacKenzie, K. M. Trophic interactions of fish communities at midwater depths enhance long-term carbon storage and benthic production on continental slopes. Proc. R. Soc. B 281, 20140669 (2014).
NATuRE ECOLOGY & EVOLuTION | VOL 2 | FEBRUARY 2018 | 299–305 | www.nature.com/natecolevol 303
© 2018 Macmillan Publishers Limited, part of Springer Nature. All rights reserved. © 2018 Macmillan Publishers Limited, part of Springer Nature. All rights reserved.
Articles NaTure ecoloGy & evoluTIoN
20. Briand, M. J., Bonnet, X., Guillou, G. & Letourneur, Y. Complex food webs in highly diversified coral reefs: insights from δ 13C and δ 15N stable isotopes. Food Webs 8, 12–22 (2016).
21. Kim, S. L., del Rio, C. M., Casper, D. & Koch, P. L. Isotopic incorporation rates for shark tissues from a long-term captive feeding study. J. Exp. Biol. 215, 2495–2500 (2012).
22. McMahon, K. W., Thorrold, S. R., Houghton, L. A. & Berumen, M. L. Tracing carbon flow through coral reef food webs using a compound-specific stable isotope approach. Oecologia 180, 809–821 (2016).
23. Chapman, D. D., Feldheim, K. A., Papastamatiou, Y. P. & Hueter, R. E. There and back again: a review of residency and return migrations in sharks, with implications for population structure and management. Annu. Rev. Mar. Sci. 7, 547–570 (2015).
24. Lea, J. S. et al. Repeated, long-distance migrations by a philopatric predator targeting highly contrasting ecosystems. Sci. Rep. 5, p11202 (2015).
25. Camhi, M. D., Pikitch, E. K. & Babcock, E. A. (eds) Sharks of the Open Ocean: Biology, Fisheries and Conservation (Blackwell, Oxford, 2008).
26. Ichii, T., Mahapatra, K., Sakai, M. & Okada, Y. Life history of the neon flying squid: effect of the oceanographic regime in the North Pacific Ocean. Mar. Ecol. Prog. Ser. 378, 1–11 (2009).
27. Scales, K. L. et al. On the front line: frontal zones as priority at-sea conservation areas for mobile marine vertebrates. J. Appl. Ecol. 51, 1575–1583 (2014).
28. Queiroz, N. et al. Ocean-wide tracking of pelagic sharks reveals extent of overlap with longline fishing hotspots. Proc. Natl Acad. Sci. USA 113, 1582–1587 (2016).
29. Tittensor, D. P. et al. Global patterns and predictors of marine biodiversity across taxa. Nature 466, 1098–1101 (2010).
30. Block, B. A. et al. Tracking apex marine predator movements in a dynamic ocean. Nature 475, 86–90 (2011).
31. Hazen, E. L. et al. Predicted habitat shifts of Pacific top predators in a changing climate. Nat. Clim. Chang. 3, 234–238 (2013).
32. Campana, S. E. et al. Migration pathways, behavioural thermoregulation and overwintering grounds of blue sharks in the northwest Atlantic. PLoS ONE 6, e16854 (2011).
33. Compagno, L. J. Sharks of the World: An Annotated and Illustrated Catalogue of Shark Species Known to Date Vol. 2 (Food & Agriculture Organization, Rome, 2001).
34. Moura, T. et al. Large-scale distribution of three deep-water squaloid sharks: integrating data on sex, maturity and environment. Fish. Res. 157, 47–61 (2014).
35. Veríssimo, A., McDowell, J. R. & Graves, J. E. Population structure of a deep-water squaloid shark, the Portuguese dogfish (Centroscymnus coelolepis). ICES J. Mar. Sci. 68, 555–563 (2011).
36. Rodríguez-Cabello, C., González-Pola, C. & Sánchez, F. Migration and diving behavior of Centrophorus squamosus in the NE Atlantic. Combining electronic tagging and Argo hydrography to infer deep ocean trajectories. Deep-Sea Res. 115, 48–62 (2016).
37. Heupel, M. & Simpfendorfer, C. Importance of environmental and biological drivers in the presence and space use of a reef-associated shark. Mar. Ecol. Prog. Ser. 496, 47–57 (2014).
38. Edgar, G. J. et al. Global conservation outcomes depend on marine protected areas with five key features. Nature 506, 216–220 (2014).
39. Heupel, M. R. et al. Conservation challenges of sharks with continental scale migrations. Front. Mar. Sci. 2, 12 (2015).
40. White, T. D. et al. Assessing the effectiveness of a large marine protected area for reef shark conservation. Biol. Conserv. 207, 64–71 (2017).
41. Borrell, A., Aguilar, A., Gazo, M., Kumarran, R. P. & Cardona, L. Stable isotope profiles in whale shark (Rhincodon typus) suggest segregation and dissimilarities in the diet depending on sex and size. Environ. Biol. Fishes 92, 559–567 (2011).
42. Hussey, N. E. et al. Expanded trophic complexity among large sharks. Food Webs 4, 1–7 (2015).
43. Maljković, A. & Côté, I. M. Effects of tourism-related provisioning on the trophic signatures and movement patterns of an apex predator, the Caribbean reef shark. Biol. Conserv. 144, 859–865 (2011).
44. Matich, P., Heithaus, M. R. & Layman, C. A. Contrasting patterns of individual specialization and trophic coupling in two marine apex predators. J. Anim. Ecol. 80, 294–305 (2011).
45. Kiljunen, M. et al. A revised model for lipid-normalizing δ 13C values from aquatic organisms, with implications for isotope mixing models. J. Appl. Ecol. 43, 1213–1222 (2006).
AcknowledgementsThis research was conducted as part of C.S.B.’s Ph.D dissertation, which was funded by the University of Southampton and NERC (NE/L50161X/1), and through a NERC Grant-in-Kind from the Life Sciences Mass Spectrometry Facility (LSMSF; EK267-03/16). We thank A. Bates, D. Sims, F. Neat, R. McGill and J. Newton for their analytical contributions and comments on the manuscripts.
Author contributionsC.S.B. and C.N.T. contributed the concept and design. C.S.B., C.N.T. and A.V. led the project. C.S.B. and C.N.T. wrote the manuscript. C.S.B., C.N.T., S.M. and A.Y analysed and interpreted the data. C.S.B., C.N.T., A.V., K.G.A., A.A., H.A.-R., A.B., D.M.B., G.B., A.B., M. Bouchoucha, M. Boyle, E.J.B., J.B., P.B., A.C., D.C., J. Ciancio, J. Claes, A.C., D.C., P.C., R.D., L.d.N., T.E., I.F., A.J.F., J.H.H., M.H., N.E.H., J.I., F.J., M.J.K., J.J.K., D.K., R.L., Y.L., S.A.K., A.L., D.M., A.M., L.M.-C., P.M., M.M., F.M., G.M.M., S.M., M.N., Y.P., H.P., J.D.P., C.P.-S., K.Q.-D., V.R., J.R., Y.E.T.-R., D.S.S., O.N.S., C.W.S., M.S., A. Teffer, A. Tilley, M.V., J.J.V., T-C.W., R.J.D.W. and A.S.J.W. provided data and/or samples. All authors have read, provided comments and approved the final manuscript.
Competing interestsThe authors declare no competing financial interests.
Additional informationSupplementary information is available for this paper at https://doi.org/10.1038/s41559-017-0432-z.
Reprints and permissions information is available at www.nature.com/reprints.
Correspondence and requests for materials should be addressed to C.S.B. or C.N.T.
Publisher’s note: Springer Nature remains neutral with regard to jurisdictional claims in published maps and institutional affiliations.
NATuRE ECOLOGY & EVOLuTION | VOL 2 | FEBRUARY 2018 | 299–305 | www.nature.com/natecolevol304
© 2018 Macmillan Publishers Limited, part of Springer Nature. All rights reserved. © 2018 Macmillan Publishers Limited, part of Springer Nature. All rights reserved.
ArticlesNaTure ecoloGy & evoluTIoN
1Ocean and Earth Science, University of Southampton, National Oceanography Centre, Southampton, UK. 2CIBIO—Research Center in Biodiversity and Genetic Resources, Vairão, Portugal. 3Virginia Institute of Marine Science, Gloucester Point, VA, USA. 4College of Science & Engineering, James Cook University, Cairns, Queensland, Australia. 5IRBio, Department of Evolutionary Biology, Ecology and Environmental Sciences, University of Barcelona, Barcelona, Spain. 6Department of Biology, College of Science, Sultan Qaboos Univeristy, Muscat, Oman. 7NOAA, National Marine Fisheries Service, Southeast Fisheries Science Center, 3500 Delwood Beach Road, Panama City, FL, USA. 8Ifremer, Unité Halieutique Gascogne Sud, Laboratoire Ressources Halieutiques de La Rochelle, L’Houmeau, France. 9Ifremer, Unité Littoral, Laboratoire Environnement Ressources Provence Azur Corse, La Seyne sur Mer, France. 10FishWise, Santa Cruz, CA, USA. 11Shark Research and Conservation Program, Cape Eleuthera Institute, Eleuthera, Bahamas. 12Gladbachstrasse 60, Zurich, Switzerland. 13Littoral Environnement et Sociétés (LIENSs), UMR 7266, CNRS-Université de La Rochelle, La Rochelle, France. 14Hopkins Marine Station of Stanford University, Pacific Grove, CA, USA. 15MARE—Marine and Environmental Sciences Centre, Department of Oceanography and Fisheries, University of the Azores, Azores, Portugal. 16Estación Biológica de Doñana, Consejo Superior de Investigationes Científicas (CSIC), Sevilla, Spain. 17Centre d’Etudes Biologiques de Chizé, UMR 7372, CNRS-Université de La Rochelle, Villiers-en-Bois, France. 18Unite Bioge ochimie et E cotoxicologie, Laboratoire de Bioge ochimie des Contaminants Me talliques, Nantes, France. 19Marine Sciences Program, School of Environment, Arts and Society, Florida International University, North Miami, FL, USA. 20CESIMAR Centro Nacional Patagónico, CONICET (Consejo Nacional de Investigaciones Científicas y Técnicas), Puerto Madryn, Chubut, Argentina. 21Laboratoire de Biologie Marine, Earth and Life Institute, Université Catholique de Louvain, Louvain-la-Neuve, Belgium. 22College of Fisheries and Ocean Sciences, Juneau Center, University of Alaska Fairbanks, Point Lena Loop Road, Juneau, AK, USA. 23Ifremer, Unité Halieutique Manche Mer du Nord, Laboratoire Ressources Halieutiques de Boulogne, Boulogne-sur-Mer, France. 24Port Elizabeth Museum at Bayworld, Port Elizabeth, South Africa. 25Save Our Seas Foundation—D’Arros Research Centre (SOSF-DRC), Geneva, Switzerland. 26University of Cape Town, Department of Biological Sciences, Cape Town, South Africa. 27School of Pharmaceutical Sciences, Health Sciences University of Hokkaido, Hokkaido, Japan. 28Departamento do Mar IPMA, Lisbon, Portugal. 29Reef HQ, Great Barrier Reef Marine Park Authority, Townsville, Queensland, Australia. 30Aquatic Biology, Department of Bioscience, Aarhus University, Aarhus C, Denmark. 31School of Environment, Arts, and Society, Florida International University, North Miami, FL, USA. 32Biological Sciences, University of Windsor, Windsor, Canada. 33Department of Fisheries and Aquatic Sciences, University of Namibia, Henties Bay, Namibia. 34Department of Biology, University of Victoria, Victoria, British Columbia, Canada. 35Ocean Associates, Inc., Southwest Fisheries Science Center, National Marine Fisheries Service, National Oceanic and Atmospheric Administration, La Jolla, CA, USA. 36Marine Sciences Program, Department of Biological Sciences, Florida International University, North Miami, FL, USA. 37Centro de Investigacion para la Sustentabilidad, Facultad de Ecologia y Recursos Naturales, Universidad Andres Bello, Santiago, Chile. 38Ifremer, Unité Sciences et Techniques Halieutiques, Laboratoire de Technologie et Biologie Halieutique, Lorient, France. 39Division of Coastal Sciences, University of Southern Mississippi, Ocean Springs, MS, USA. 40College of Marine Sciences, Shanghai Ocean University, Shanghai, China. 41Institut de Recherche pour le Développement (IRD), R 195 LEMAR, UMR 6539 (UBO, CNRS, IRD, IFREMER), Nouméa, New Caledonia. 42Harvard University Center for the Environment, Harvard University, Cambridge, MA, USA. 43Department of Biological Sciences, Simon Fraser University, Burnaby, British Columbia, Canada. 44Earth to Ocean Research Group, Department of Biological Sciences, Simon Fraser University, Burnaby, British Columbia, Canada. 45Marine Sciences Program, Florida International University, North Miami, FL, USA. 46Texas Research Institute for Environmental Studies, Sam Houston State University, Huntsville, TX, USA. 47Australian Institute of Marine Science, Indian Ocean Marine Research Centre, The University of Western Australia, Perth, Western Australia, Australia. 48Mediterranean Istitute of Oceanography (MIO), Aix Marseille Université, Université de Toulon, CNRS, IRD, 13288 Marseille, France. 49Australian Rivers Institute, Griffith University, Nathan, Queensland, Australia. 50Department of Environmental and Aquatic Animal Health, Virginia Institute of Marine Science, College of William & Mary, Gloucester Point, VA, USA. 51Department of Biological Sciences, Florida International University, North Miami, FL, USA. 52Scottish Oceans Institute, School of Biology, University of St. Andrews, St. Andrews, UK. 53CSIRO Oceans and Atmosphere, Hobart, Tasmania, Australia. 54Department of Marine Biology, Texas A&M University at Galveston, Galveston, TX, USA. 55Department of Wildlife and Fisheries Sciences, Texas A&M University, College Station, TX, USA. 56Facultad de Ciencias Naturales e Ingeniería, Programa de Biología, Universidad de Bogotá Jorge Tadeo Lozano Marina, Bogotá, Colombia. 57Department of Environmental and Life Sciences, University of Newcastle, Newcastle, New South Wales, Australia. 58Conservation Biology Division, Northwest Fisheries Science Center, National Marine Fisheries Service, National Oceanic and Atmospheric Administration, Seattle, WA, USA. 59Instituto de Ecología, Pesquerías y Oceanografía del Golfo de México (EPOMEX), Universidad Autónoma de Campeche (UAC), Campeche, Campeche, Mexico. 60Earth to Oceans Group, Department of Biological Sciences, Simon Fraser University, Burnaby, British Columbia, Canada. 61School of Marine and Atmospheric Sciences, Stony Brook University, Stony Brook, NY, USA. 62Department of Environmental Conservation, University of Massachusetts Amherst, Amherst, MA, USA. 63Department of the Interior Northeast Climate Science Center, Amherst, MA, USA. 64Department of Biology, University of Victoria, Victoria, British Columbia, Canada. 65WorldFish Timor-Leste, Dili, Timor-Leste. 66Instituto Español de Oceanografía, Centre Oceanogràfic de les Balears, Palma, Spain. 67The Guy Harvey Research Institute, Nova Southeastern University, Dania Beach, FL, USA. 68State Key Laboratory in Marine Pollution, City University of Hong Kong, Kowloon, Hong Kong, China. 69Department of Chemical Oceanography, Atmosphere and Ocean Research Institute, The University of Tokyo, Kashiwa, Japan. 70National Oceanography Centre Southampton, Southampton, UK. Present address: 71Centre for Environment, Fisheries, & Aquaculture Sciences (CEFAS), Lowestoft, UK. 72NOAA National Marine Fisheries Service, Southeast Regional Office, St. Petersburg, FL, USA. 73National Oceanic and Atmospheric Administration, Southeast Fisheries Science Center, Panama City Laboratory, Delwood Beach Road, Panama City, FL, USA. *e-mail: [email protected]; [email protected]
NATuRE ECOLOGY & EVOLuTION | VOL 2 | FEBRUARY 2018 | 299–305 | www.nature.com/natecolevol 305

1
nature research | life sciences reporting summ
aryJune 2017
Corresponding Author: Christopher Bird & Clive Trueman
Date: 07/11/2017
Life Sciences Reporting SummaryNature Research wishes to improve the reproducibility of the work we publish. This form is published with all life science papers and is intended to promote consistency and transparency in reporting. All life sciences submissions use this form; while some list items might not apply to an individual manuscript, all fields must be completed for clarity.
For further information on the points included in this form, see Reporting Life Sciences Research. For further information on Nature Research policies, including our data availability policy, see Authors & Referees and the Editorial Policy Checklist.
Experimental design1. Sample size
Describe how sample size was determined. Data were compiled from as many published and unpublished datasets as available at time of study through correspondence with coauthors.
2. Data exclusions
Describe any data exclusions. See Material and Methods: Data removed due to high (>10) C:N ratios indicating lipid contamination, planktivorous species were excluded as they are not directly comparable to other taxa, One study conducted in a river was excluded as the focus is exclusively marine, and one study from a tourism provisioning site was excluded as the isotopic composition of human-fed sharks may well not reflect local sources.
3. Replication
Describe whether the experimental findings were reliably reproduced. NA as project is not experimental. We offer all data to allow full replication of our analyses
4. Randomization
Describe how samples/organisms/participants were allocated into experimental groups.
Organisms were classified into functional groups by their primary habitat utilization based on published literature and advice from corresponding authors that contributed those data.
5. Blinding
Describe whether the investigators were blinded to group allocation during data collection and/or analysis.
Not applicable
Note: all studies involving animals and/or human research participants must disclose whether blinding and randomization were used.
6. Statistical parameters For all figures and tables that use statistical methods, confirm that the following items are present in relevant figure legends (or the Methods section if additional space is needed).
n/a Confirmed
The exact sample size (n) for each experimental group/condition, given as a discrete number and unit of measurement (animals, litters, cultures, etc.)
A description of how samples were collected, noting whether measurements were taken from distinct samples or whether the same sample was measured repeatedly.
A statement indicating how many times each experiment was replicated
The statistical test(s) used and whether they are one- or two-sided (note: only common tests should be described solely by name; more complex techniques should be described in the Methods section)
A description of any assumptions or corrections, such as an adjustment for multiple comparisons
The test results (e.g. p values) given as exact values whenever possible and with confidence intervals noted
A summary of the descriptive statistics, including central tendency (e.g. median, mean) and variation (e.g. standard deviation, interquartile range)
Clearly defined error bars
See the web collection on statistics for biologists for further resources and guidance.

2
nature research | life sciences reporting summ
aryJune 2017
SoftwarePolicy information about availability of computer code
7. Software
Describe the software used to analyze the data in this study. R-cran used for all analysis. QGIS for mapping illustrations
For all studies, we encourage code deposition in a community repository (e.g. GitHub). Authors must make computer code available to editors and reviewers upon request. The Nature Methods guidance for providing algorithms and software for publication may be useful for any submission.
Materials and reagentsPolicy information about availability of materials
8. Materials availability
Indicate whether there are restrictions on availability of unique materials or if these materials are only available for distribution by a for-profit company.
-
9. Antibodies
Describe the antibodies used and how they were validated for use in the system under study (i.e. assay and species).
-
10. Eukaryotic cell linesa. State the source of each eukaryotic cell line used. -
b. Describe the method of cell line authentication used. -
c. Report whether the cell lines were tested for mycoplasma contamination.
-
d. If any of the cell lines used in the paper are listed in the database of commonly misidentified cell lines maintained by ICLAC, provide a scientific rationale for their use.
-
Animals and human research participantsPolicy information about studies involving animals; when reporting animal research, follow the ARRIVE guidelines
11. Description of research animalsProvide details on animals and/or animal-derived materials used in the study.
This is a meta-analysis of published stable isotope data recovered from wild sharks.
Policy information about studies involving human research participants
12. Description of human research participantsDescribe the covariate-relevant population characteristics of the human research participants.
-