a guidance manual for green economy indicators - un … · a guidance manual for green economy...
TRANSCRIPT
A GUIDANCE MANUAL FOR GREEN ECONOMY INDICATORS
United Nations Environment ProgrammeP.O. Box 30552 Nairobi, 00100 Kenya
Tel: (254 20) 7621234Fax: (254 20) 7623927
E-mail: [email protected]: www.unep.org
www . unep . o r g
Job no. DTI/1690/GE
2014
Partnership for Action on PAGE
Annual Progress Report1 January 2013 - 31 March 2011

Copyright © United Nations Environment Programme, 2014
This publication may be reproduced in whole or in part and in any form for educational or non-
profit purposes without special permission from the copyright holder, provided acknowledgement
of the source is made. UNEP would appreciate receiving a copy of any publication that uses this
publication as a source.
No use of this publication may be made for resale or for any other commercial purpose whatsoever
without prior permission in writing from the United Nations Environment Programme.
Citation
UNEP. (2014). Using Indicators for Green Economy Policymaking.
Disclaimer
The designations employed and the presentation of the material in
this publication do not imply the expression of any opinion whatsoever on the part of the
United Nations Environment Programme concerning the legal status of any country, territory,
city or area or of its authorities, or concerning delimitation of its frontiers or boundaries.
Moreover, the views expressed do not necessarily represent the decision or the stated policy
of the United Nations Environment Programme, nor does citing of trade names or commercial
processes constitute endorsement.
UNEP promotes
environmentally sound
practices globally and in its own
activities. This publication is printed
on 100% recycled paper, using vegetable
inks and other eco-friendly practices. Our
distribution policy aims to reduce UNEP’s
carbon footprint.

table of contents
List of acronyms
List of boxes
List of figures
List of tables
Acknowledgements
Executive summary
1 Introduction 2 Indicatorsforissueidentification 2.1 Introduction
2.2 Methodology
2.3. Step 1: Identify potentially worrying trends
2.4. Step 2: Assess the issue and its relation to the natural environment
2.5. Step 3: Analyse more fully the underlying causes of the issue of concern
2.6. Step 4: Analyse more fully how the issue impacts society, the economy
and the environment
3. Indicators for policy formulation 3.1. Introduction
3.2. Methodology
3.3. Step 1: Identify desired outcomes: define policy objectives
3.4. Step 2: Identify intervention options and output indicators
4 Indicators for policy assessment 4.1. Introduction
4.2. Methodology
4.3. Step 1: Estimate policy impacts across sectors
4.4. Step 2: Analyse impacts on the overall well-being of the population
4.5. Step 3: Analyse advantages and disadvantages and inform decision-making
5 Indicators for policy monitoring and evaluation 5.1. Introduction
5.2. Methodology
5.3. Measuring policy performance: effectiveness, investment and well-being
6 looking ahead
notesReferences
iv
iv
iv
iv
1
2
4
10
10
10
12
14
15
17
22
22
22
23
26
30
30
30
31
32
34
40
40
41
60
62
63
iii

lIst of acRonyms
CAPP Chemical Accident Prevention and Preparedness
CBD Convention on Biological DiversityCLD Causal Loop DiagramCPUE Catch per Unit of Fishing EffortDPSIR Driving force – Pressure – State –
Impact – ResponseEE Energy EfficiencyEGSS Environmental Goods and Services
SectorGDI Gender-related Development IndexGDP Gross Domestic ProductGE Green EconomyGEF Global Environment FacilityGGGI Global Green Growth InstituteGGKP Green Growth Knowledge PlatformGHG Greenhouse GasGII Gender Inequality IndexGPI Genuine Progress IndicatorHDI Human Development IndexIEA International Energy AgencyIP Integrated PolicymakingISEW Index of Sustainable Economic WelfareIWI Inclusive Wealth IndexM&E Monitoring and EvaluationMDG Millennium Development GoalsMPI Multidimensional Poverty IndexO&M Operation and ManagementOECD Organisation for Economic Co-
operation and DevelopmentPES Payments for Ecosystem ServicesPME Participatory Monitoring and EvaluationR&D Research and DevelopmentRES Renewable Energy StandardsRIA Regulatory Impact AnalysisROI Return on InvestmentsSCP Sustainable Consumption and
ProductionSD System DynamicsSEEA System of Environmental-Economic
AccountingSIDS Small Island Developing StatesSMART Specific, Measurable, Achievable,
Relevant, Time-boundSNBI Sustainable Net Benefit IndexSTAMP SusTainability Assessment and
Measurement PrinciplesUNEP United Nations Environment
ProgrammeWAVES Wealth Accounting and the Valuation
of Ecosystem ServicesWCMC World Conservation Monitoring CentreWWF Worldwide Fund for Nature
lIst of fIguRes
Figure 1 Overview of the Integrated Policymaking process. Figure 2 Example of the multiple benefits generated by green economy policy interventions. Figure 3 A schematic representation of the DPSIR Framework.Figure 4 Simplified (and partial) causal tree diagram for the issue of nutrition and possible key
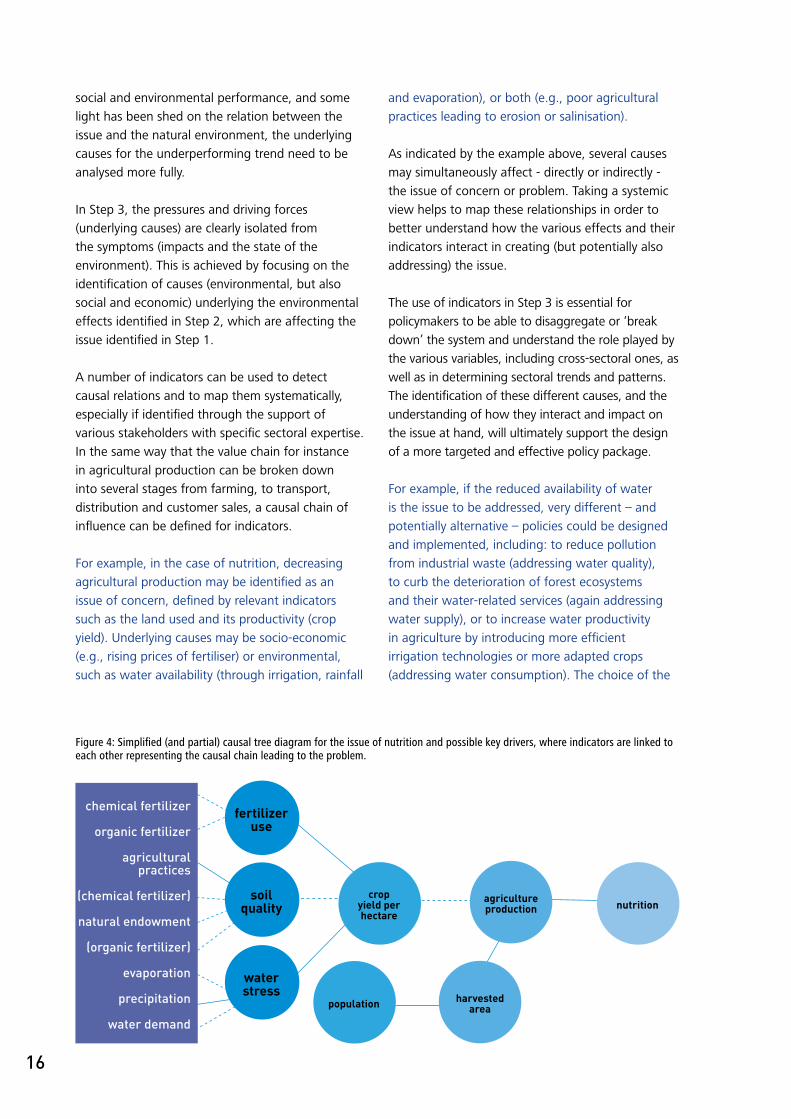
drivers, where indicators are linked to each other representing the causal chain leading to the problem.
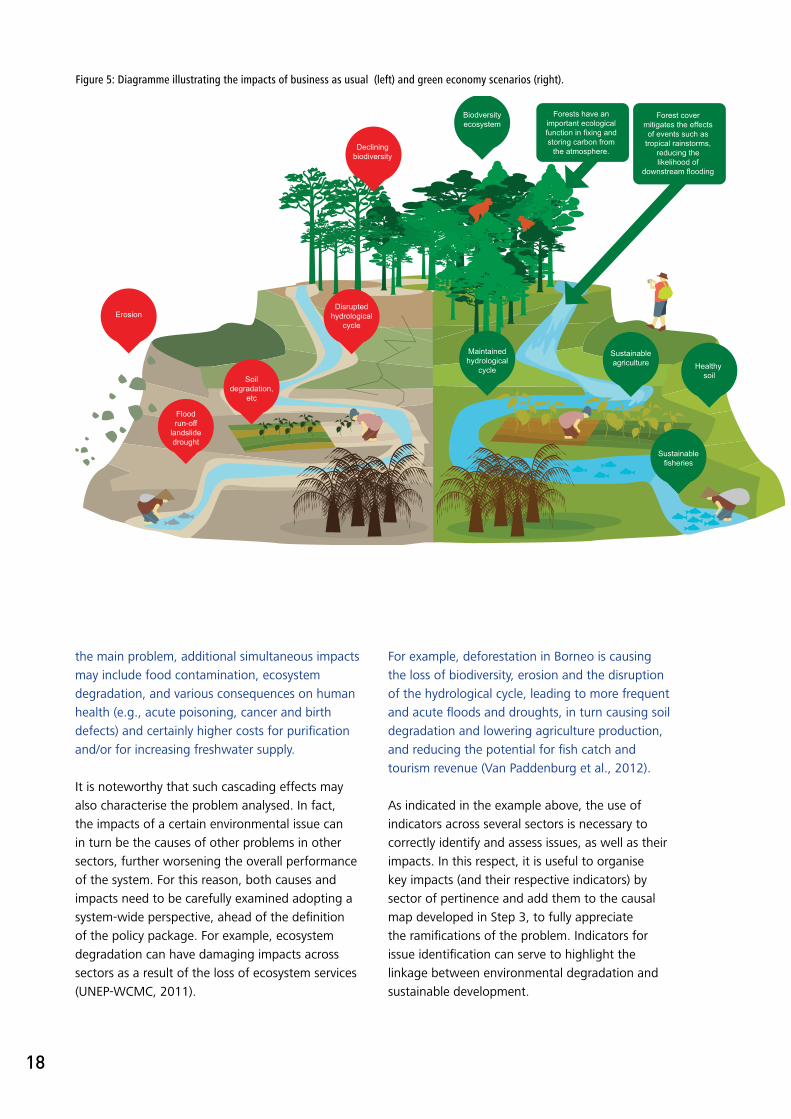
Figure 5 Diagramme illustrating the impacts of business as usual (left) and green economy scenarios (right).
Figure 6 Simplified Causal Loop Diagram representing the main causal relations existing among the economy and the environment (forest cover) in Borneo.
lIst of tables
Table 1 Overview of the structure of the manual and main steps proposed to support the policymaking process.
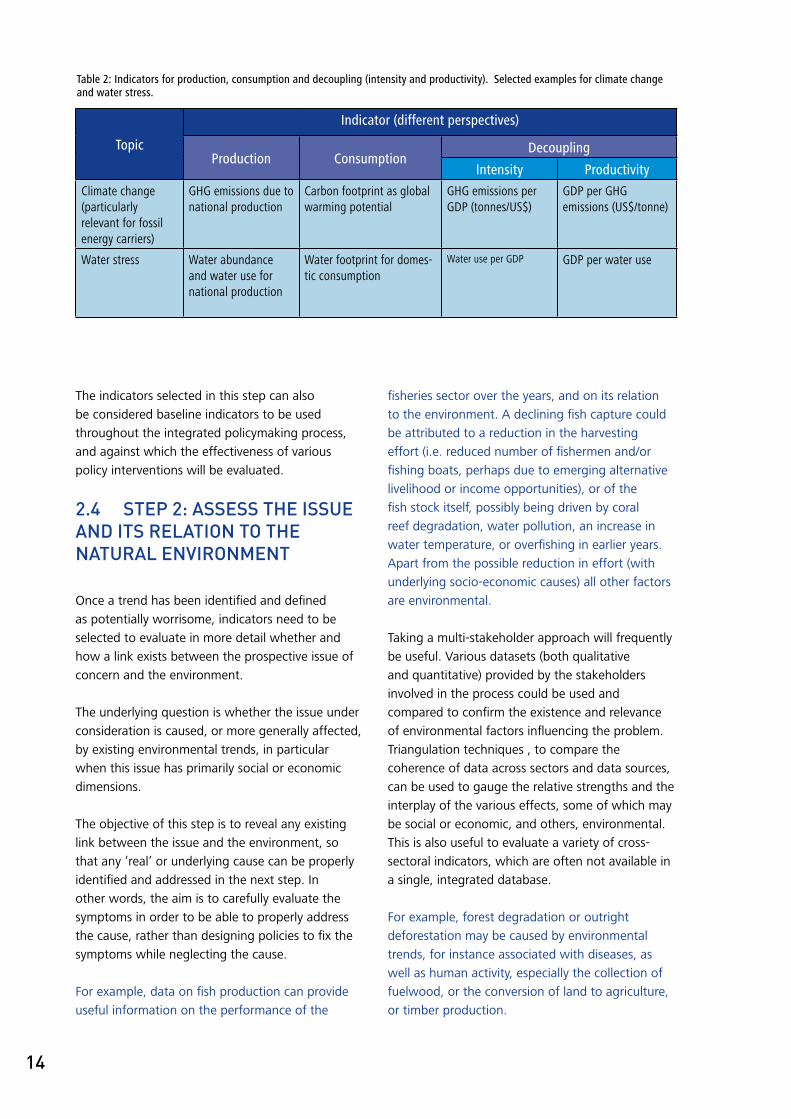
Table 2 Indicators for production, consumption and decoupling (intensity and productivity).Selected examples for climate change and water stress.
Table 3 Summary of key steps and related indicators for issue identification: Examples for deforestation, nutrition and CO2 emissions.
Table 4 Summary of key steps and related indicators for policy formulation: Examples for deforestation, nutrition and CO2 emissions.
Table 5 Key steps and related indicators for policy impact evaluation: Examples for deforestation, nutrition and CO2 emissions.
Table 6 Land-locked dry- and sub-humid country with dominant agriculture and in early phases of demographic transition and urbanisation. Key steps and sample indicators for policymaking to address the problem of decreasing agricultural production.
Table 7 Tropical or sub-tropical small island developing state with dominant industries being tourism and fisheries. Key steps and sample indicators for policymaking to address the problem of decreasing fish catch.
Table 8 Low-lying coastal middle income country with rapid industrialisation and urbanisation, and relatively advanced demographic transition. Key steps and sample indicators for policymaking to address the problem of increasing pollution and growing cost of living.
Table 9 Mountainous coastal country with mining, agriculture, and fisheries. Key steps and sample indicators for policymaking to address the problem of increasing frequency of floods.
Table 10 Developed country with limited natural resources but high potential (and financial resources) for efficiency improvement. Key steps and sample indicators for policymaking to address the problem of rising energy costs, with negative impacts on investments and competitiveness.
Table 11 Key steps and sample indicators for issue identification and green economy policy formulation, assessment and evaluation
lIst of boxes
Box 1 What is an indicator? What are its basic characteristics?Box 2 Key steps: indicators for issue identificationBox 3 Summary of Step 1: Identify potential worrying trendsBox 4 Summary of Step 2: Assess the issue and its relation to the natural environment Box 5 Summary of Step 3: Analyse more fully the underlying causes of the issueBox 6 Mapping the system with Causal Loop DiagramsBox 7 Summary of Step 4: Analyse how the issue impacts society, the economy and the
environment Box 8 Key steps: indicators for policy formulationBox 9 Analysing the effect of interventions as outputs, outcomes and impactsBox 10 Summary of Step 1: Identify desired outcomes and define policy objectivesBox 11 Summary of Step 2: Identify intervention options and output indicatorsBox 13 Summary of Step 1: Estimate policy impacts across sectorsBox 14 Summary of Step 2: Analyse impacts on the overall well-being of the populationBox 15 Summary of Step 3: Analyse advantages and disadvantages, and inform decision-makingBox 16 Ex ante and ex post modelling in support of policy formulation and evaluationBox 17 Key steps: indicators for policy monitoring and evaluationBox 18 Summary: Measure policy performanceBox 19 Land-locked dry and sub-humid country, with dominant agriculture and in early phases of
demographic transition and urbanisation.Box 20 Tropical or sub-tropical small island developing state with dominant sectors being tourism
and fisheries.Box 21 Low-lying coastal middle income with rapid industrialisation and urbanisation, and
relatively advanced demographic transition.Box 22: Mountainous coastal country with mining, agriculture and fisheriesBox 23: Developed country with limited natural resources but high potential (and financial
resources) for efficiency improvement.
iv

acknowledgements
This paper was written by Andrea M. Bassi, with substantive input from Sheng Fulai and Markus Lehman,
and with contributions from the following UNEP staff: Claudia Assmann, Alice Dauriach, Joy Kim, Alex
Leshchynskyy, Richard Scotney and Steven Stone, as well as Cleopus Wang’ombe and Germán Benitez, who
helped to review it. Diwata Hunziker, Leigh-Ann Hurt, Stephanie Mansourias and Tan Ding Yong provided
editorial assistance. The design and layout was done by Thomas Gianinazzi.
Special thanks to the participants of the International Symposium on Green Economy and Environmental
Competitiveness Indicators jointly organised by UNEP and Fujian Normal University in Fuzhou, China from
26 to 27 March 2013, in particular: Anna Chenery Mokshanand Dowarkasing, Hoseok Kim, László Pintér,
Novrizal Tahar, Zhou Xin, and Zhang Xuehua for their precious comments.

2
For UNEP, the green economy is one: “that results
in improved human well-being and social equity,
while significantly reducing environmental risks and
ecological scarcities” (UNEP, 2011a). The transition
to a green economy can occur successfully by
investing in areas that decouple economic growth
from resource use and environmental impacts. The
broad nature of green economy challenges and
opportunities requires the use of effective methods
and tools to support countries in the formulation of
targeted policies for the transition towards a more
sustainable future.
This manual provides guidance to users at the
country level on the selection of indicators and
their use as a tool for identifying priority issues,
formulating and assessing green economy policy
options, and evaluating the performance of policy
implementation. In particular, a series of steps are
suggested for the identification and use of indicators
throughout the integrated policymaking (IP) cycle.
More specifically, emphasis is put on three IP stages
in which the use of indicators is particularly relevant,
namely (1) issue identification and agenda setting;
(2) policy formulation and assessment, and (3)
monitoring and evaluation (M&E). Stage 2 (policy
formulation and assessment) is further sub-divided
into two for the purposes of this manual.
IndIcatoRs foR Issue IdentIfIcatIon
Indicators for issue identification are instruments
that help decision makers identify and prioritise
problems that might undermine the path towards
sustainable development.
Four steps are proposed for the use of indicators in
the issue identification phase, namely:
1. Identify potentially worrying trends;
2. Assess the issue and its relation to the natural
environment;
3. Analyse more fully the underlying causes of the
issue of concern;
4. Analyse more fully how the issue impacts society,
the economy and the environment.
The combination of different indicators for the
analysis of simultaneous environmental, social and
economic trends is essential to identify potential
issues (present and/or upcoming), and clearly
determine their causes and effects within and across
sectors.
IndIcatoRs foR polIcy foRmulatIon
The second stage of the integrated policymaking
cycle consists in the definition of policy goals,
to then proceed with policy formulation. While
indicators for issue identification help to frame the
problem, indicators for policy formulation help to
design solutions.
Two key steps are described in this manual for the
formulation of sound green economy policies with
the help of indicators:
1. Identify policy objectives; and
2. Identify intervention options.
The identification of policy objectives and targets
is based on the results of the issue identification
phase. Policy objectives should be stated in a
manner that is specific or targeted, measurable,
ambitious while achievable or realistic, and time-
bound (SMART). Once policy objectives and targets
are established, various intervention options
(including investments, provision of incentives or
disincentives, public targets mandated by law and
social interventions) need to be analysed with the
executIve summaRy

3
using indicators for green economy policymaking
help of indicators. Moreover, a multi-stakeholder
approach is required to ensure that different
perspectives are considered and incorporated in
the definition of policy objectives and targeted
interventions.
IndIcatoRs foR polIcy assessment
In the policy assessment phase, expected economic,
social and environmental effects of different policy
options need to be meaesured with the help of
impact indicators. Also, an analysis of advantages
and disadvantages of each policy option needs to
be carried out in order to provide solid evidence in
support of decision-making.
Three steps are suggested for this phase, namely:
1. Estimate policy impacts across sectors;
2. Analyse impacts on the overall well-being of the
population;
3. Analyse advantages and disadvantages, and
inform decision-making.
While indicators for problem identification help to
frame the issue, and indicators for policy formulation
help to design solutions, impact indicators support
the assessment of the cross-sectoral impact of
the interventions chosen. The analysis should
include an estimation of co-benefits and ancillary
benefits for the economy as a whole, as well as the
improvement of well-being of the entire population.
Finally, the use of monetary and financial indicators
enables the assessment of the feasibility of each
intervention, comparing investment and avoided
costs, or added benefits, depending on the issue to
be solved.
IndIcatoRs foR polIcy monItoRIng and evaluatIon
The last stage of the integrated policymaking cycle
consists in the monitoring and evaluation of policy
impacts during and after implementation. Indicators
for policy monitoring and evaluation support the
assessment of the performance of the intervention
implemented, and allow decision makers to design
timely corrective measures, when needed.
Three key steps are proposed for this phase:
1. Measure policy impacts in relation to the
environmental issue (using indicators for issue
identification);
2. Measure the investment leveraged (using
indicators for policy formulation);
3. Measure impacts across sectors and on the
overall well-being of the population (using
indicators for policy assessment).
In this phase, indicators for issue identification
should be analysed to test the actual effect of
the interventions on the problem identified at the
beginning of the policy cycle. Further, indicators
for issue identification should be compared to
target indicators to evaluate whether the situation
is improving and matching desired goals. Finally,
actual policy impacts on the economy and overall
well-being of the population should be carefully
monitored and compared to the expectations
defined in the policy assessment phase.
With the steps presented above, this manual
provides guidance on how to use indicators in
designing and implementing green economy policies
at the national level. The goal of the manual is
neither to propose new indicators, nor to identify
a catch-all list of indicators to be used in the
policymaking process. Instead, it acknowledges the
unique geographical and socio-cultural contexts
in which issues arise, and provides a step-by-step
guide, with examples, on how to identify and use
relevant indicators in designing and implementing
green economy responses.
4
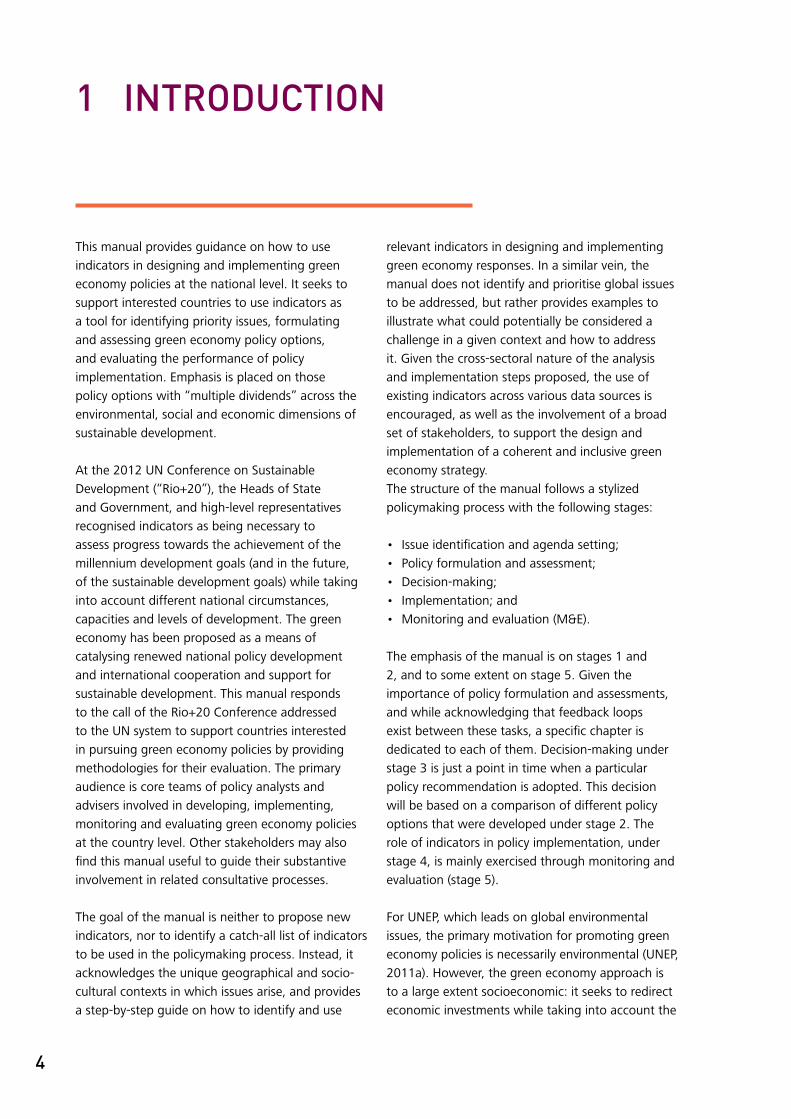
This manual provides guidance on how to use
indicators in designing and implementing green
economy policies at the national level. It seeks to
support interested countries to use indicators as
a tool for identifying priority issues, formulating
and assessing green economy policy options,
and evaluating the performance of policy
implementation. Emphasis is placed on those
policy options with “multiple dividends” across the
environmental, social and economic dimensions of
sustainable development.
At the 2012 UN Conference on Sustainable
Development (“Rio+20”), the Heads of State
and Government, and high-level representatives
recognised indicators as being necessary to
assess progress towards the achievement of the
millennium development goals (and in the future,
of the sustainable development goals) while taking
into account different national circumstances,
capacities and levels of development. The green
economy has been proposed as a means of
catalysing renewed national policy development
and international cooperation and support for
sustainable development. This manual responds
to the call of the Rio+20 Conference addressed
to the UN system to support countries interested
in pursuing green economy policies by providing
methodologies for their evaluation. The primary
audience is core teams of policy analysts and
advisers involved in developing, implementing,
monitoring and evaluating green economy policies
at the country level. Other stakeholders may also
find this manual useful to guide their substantive
involvement in related consultative processes.
The goal of the manual is neither to propose new
indicators, nor to identify a catch-all list of indicators
to be used in the policymaking process. Instead, it
acknowledges the unique geographical and socio-
cultural contexts in which issues arise, and provides
a step-by-step guide on how to identify and use
relevant indicators in designing and implementing
green economy responses. In a similar vein, the
manual does not identify and prioritise global issues
to be addressed, but rather provides examples to
illustrate what could potentially be considered a
challenge in a given context and how to address
it. Given the cross-sectoral nature of the analysis
and implementation steps proposed, the use of
existing indicators across various data sources is
encouraged, as well as the involvement of a broad
set of stakeholders, to support the design and
implementation of a coherent and inclusive green
economy strategy.
The structure of the manual follows a stylized
policymaking process with the following stages:
• Issue identification and agenda setting;
• Policy formulation and assessment;
• Decision-making;
• Implementation; and
• Monitoring and evaluation (M&E).
The emphasis of the manual is on stages 1 and
2, and to some extent on stage 5. Given the
importance of policy formulation and assessments,
and while acknowledging that feedback loops
exist between these tasks, a specific chapter is
dedicated to each of them. Decision-making under
stage 3 is just a point in time when a particular
policy recommendation is adopted. This decision
will be based on a comparison of different policy
options that were developed under stage 2. The
role of indicators in policy implementation, under
stage 4, is mainly exercised through monitoring and
evaluation (stage 5).
For UNEP, which leads on global environmental
issues, the primary motivation for promoting green
economy policies is necessarily environmental (UNEP,
2011a). However, the green economy approach is
to a large extent socioeconomic: it seeks to redirect
economic investments while taking into account the
1 IntRoductIon

5
using indicators for green economy policymaking
social implications of both the environmental issues
identified by governments and the possible policy
responses, and harnessing double or triple wins
whenever achievable. The manual recognises that
all three dimensions of sustainable development
(economic, environmental and social) are relevant.
As an illustrative example (hence concise and
partial), consider a government programme that
aims to restore degraded forest ecosystems in key
watersheds:
• The programme will respond to deforestation
and forest degradation both to restore forest
ecosystems and to address climate change, thus
contributing to the environmental dimension of
sustainable development.
• However, it will also enhance the provision of
safe drinking water as a key service of forest
ecosystems in watersheds, thus improving
the health of the local population and directly
contributing to poverty eradication and social
equity objectives – the social dimension of
sustainable development.
• In so doing, the programme will leverage
financial cost savings in other policy domains,
ranging from lower health-related (curative)
expenditures, to a lower investment need for
water purification plants, thus contributing to the
economic dimension of sustainable development.
Importantly, all three dimensions can serve as
entry points for identifying issues and developing
green economy policies. This approach is reflected
in the way this manual is organised. In line with
UNEP’s primary mandate, it uses predominantly
environmental issues as illustrative entry points
for a green economy policymaking process. More
specifically, the tables at the end of this manual
use examples from the four major thematic areas
in UNEP’s medium term strategy: climate change;
ecosystem management; resource efficiency; and
chemicals and waste. The manual will show how
UNEP defines green economy as “an economy that results in improved human
well-being and social equity, while significantly reducing environmental
risks and ecological scarcities”.
Figure 1. Overview of the integrated policymaking process
Policy evaluation makes use of the
indicators identified in the first two steps, to
evaluate the effectiveness of the
intervention and the emergence of
unexpected impacts and trends.
Policy formulation analysis focuses on issues and opportunities and on the broader advantages and disadvantages of policy implementation.
Decision-making is based on the results of the policy formulation stage, and should account for the forecasted impacts of policy implementation on the environment, the economy and overall well-being of the population.
Issues and related policy goals can be of a general nature, or they can be social, economic and environmental (with the latter being more relevant for UNEP)
Issueidentification and
agenda setting
Policy formulation/assessment
Decision-making
Policy monitoring andevaluation
Policy implementation
6
these broad themes can be brought down to a
level that is amenable to further prioritisation and
the development of policy responses. For instance,
one can consider simplifying climate change issues
by breaking them down into carbon sequestration,
energy efficiency and adaptive measures; and
equally simplifying ecosystem management by
breaking it down into patterns of land use and
land use change. In bringing broad environmental
issues to a manageable level, there will be a need
for baseline indicators against relevant thresholds
or targets (IISD, 2005). Furthermore, in order to
capture the attention of mainstream policymakers
who face competing demands at any given time,
it may also be necessary to express environmental
issues in socio-economic terms, such as the cost of
inaction.
Prospective users of this manual are not confined
to those in the environmental community. It is
important, therefore, to consider that this manual is
equally applicable to the use of non-environmental
issues as entry points. In some cases, the issue
of concern may not appear to be environmental
at first glance; for instance – taking up again the
example above – the increased prevalence of water-
borne diseases among rural farmers will initially
be perceived as a social issue, with implications
primarily for health policies. It is only upon further
analysis – by undertaking more detailed assessments
– that the strong connection to environmental
problems may be revealed.
At the policy formulation and assessment stage,
what makes the green economy approach different
from other similar approaches is its strong emphasis
on the role of redirecting investment at the societal
level to address the issues of concern. The rationale
for this approach is that misallocations of capital
frequently lead to unsustainable development –
that is, too many financial resources are spent on
for example, the use of fossil fuels, unsustainable
fishing and unsustainable water use, while too little
is spent on public transport, renewable energy,
ecosystem conservation and waste treatment
(GGKP, 2013). Such misallocations prevail whenever
externalities are present: policy interventions will
be required in order to redirect investment flows
towards more sustainable alternatives (UNEP,
2011a). Indicators are needed to define the
direction and extent of possible policy responses,
and for assessing and comparing the environmental,
social and economic implications of different policy
options (UNEP, 2012a; OECD, 2011). It is on the
basis of such assessments that specific policies can
be recommended to policymakers for adoption.
Once policymakers decide on a particular policy
option, monitoring and enforcement against a pre-
selected set of indicators is essential in the ensuing
implementation stage. These indicators can be
drawn from the ones used in the agenda setting
and policy formulation stages, and applied to assess
whether the interventions are effectively addressing
the issue, by leveraging the needed investments,
and whether green economy policies are generating
synergies across sectors, improving the overall well-
being of the population (Stiglitz et al., 2009).
The manual recognises that policymaking is never a
linear process. It is therefore designed to be easily
adaptable to different policymaking situations,
including by having feedback loops as needed
between the relevant stages.

7
using indicators for green economy policymaking
Agenda setting
Indicators for issue
identification
Policy formulation (Chapter 2)
Indicators for policy
formulation (Chapter 3)
Indicators for policy
assessment (Chapter 4)
Decision-making –
Implementation
Indicators for monitoring
and evaluation (Chapter 5)
Identify potentially worrying trends
Assess the issue and its relation to the natural environment
Analyse more fully the underlying causes of the issue of concern
Analyse more fully how the issue impacts society, the economy and the environment
Identify desired outcomes: define policy objectives
Identify intervention options and output indicators
Measure policy impacts across sectors
Analyse impacts on the overall well-being of the population
Analyse advantages and disadvantages and inform decision-making
Measure policy impacts in relation to the environmental issue
Measure the investment leveraged
Measure impacts across sectors and on the overall well-being of the population
Table 1. Overview of the structure
Starting from a problem or an opportunity, identified with the help of agenda-setting indicators, policies are identified and defined through the use of policy formulation indicators. Policy assessment indicators are then used to forecast policy impacts, and all three categories of indicators are used to support monitoring and evaluation.

8

9
using indicators for green economy policymaking
box 1. what Is an IndIcatoR? what aRe Its basIc chaRacteRIstIcs?
As the word suggests, an indicator is an instrument that provides an indication, generally used to describe and/or give an order of magnitude to a given condition. Indicators provide information on the historical and current state of a given system, and are particularly useful to highlight trends that can shed light on causal relations among the elements composing the system.
Both quantitative and qualitative information can be used to define an indicator, depending on the issue that needs to be analysed, as well as on the availability and quality of data. Quantitative indicators provide a standardised and measurable description of a given phenomenon, thereby allowing for more consistent and universal comparison across time and space (GGKP, 2013). In order to facilitate trend identification and comparison, qualitative indicators are often expressed in a quantitative manner (e.g., ranks, percentages).
A combination of different indicators might be necessary to describe complex phenomena, where different concurring causes and effects have to be measured and compared. For example, the causes of a decrease in agricultural productivity, reflected by agricultural yield trends, might have to be explored through a variety of indicators, e.g., soil erosion level, rainfall, workers’ productivity etc. Also, there are certain conditions that cannot be directly and universally measured. In these cases, proxy indicators can be used in order to get as close as possible to a reliable description of the phenomenon (e.g., life expectancy as a proxy indicator of the quality of life). As a general rule, the choice and combination of indicators should be based on available data, the information needed by policy-makers, and policy priorities (Pintér et al., 2001).
Before being used for the analysis of trends and phenomena, indicators should be assessed against a number of basic features, including (OECD, 2011):
• Policy relevance: the indicator needs to address issues that are of (actual or potential) public concern relevant to policymaking. In fact, the ultimate test of any single indicator’s relevance is whether it contributes to the policy process.
• Analytical soundness: ensuring that the indicator is based on the best available science is a key feature to ensure that the indicator can be trusted.
• Measurability: the need to reflect reality on a timely and accurate basis, and be measurable at a reasonable cost, balancing the long-term nature of some environmental, economic and social effects and the cyclicality of others. Definitions and data need to allow meaningful comparison both across time and countries or regions.

10
2 IndIcatoRs foR Issue IdentIfIcatIon
2.1 IntRoductIon
The initial stage of the integrated policymaking
cycle consists in identifying the key issues that pose
a challenge to sustainable development and that
need to be addressed by green economy policies.
In the introductory chapter, the four cross-cutting
thematic priorities of UNEP’s medium-term strategy
were introduced in order to highlight the main
environmental challenges presently identified by
UNEP at the global level. However, decision makers
face social, economic and environmental issues
simultaneously, all of which have an impact, to
varying degrees, on sustainable development.
This chapter provides guidance on how to
identify possible issues of concern with respect
to sustainable development and how to evaluate
whether they are driven (or impacted by)
environmental degradation. This approach is
therefore systemic, promotes multi-stakeholder
participation, and aims at fully incorporating
the environment in planning exercises, for the
formulation of green economy policies that would
effectively contribute to sustainable development.
2.2 methodology
Indicators for issue identification are instruments
that help decision makers to identify and prioritise
problems, present and/or upcoming, and to set the
agenda for policy interventions (UNEP, 2009). In this
respect, these indicators can be related to the set
of diagnostic indicators included in the work of the
Global Green Growth Institute (GGGI) (GGKP, 2013).
As mentioned in the introduction, problems like
climate change and ecosystem management are
Figure 2. Example of the multiple benefits generated by green economy policy interventions. Several stakeholders may benefit from a single intervention, formulated, assessed, monitored and evaluated with a variety of indicators across sectors.
Ministry of Finance
Ministry of Planning
Ministry of Agriculture
ISSUEAgriculture production
INDICATORAgricultural yield(tonne/ha/year)
Ministry of Water
ISSUEGroundwater
contamination
INDICATORPesticide
concentration in groundwater (%)
Ministry of Health
ISSUEWater pollution
diseases
INDICATORHospitalisation due to water pollution
(person/year)
Incentives to support the adoption of green
agricultural practices

11
using indicators for green economy policymaking
already high on the agenda of decision makers, for
a variety of reasons.
For example, climate change, through rising
temperatures and increased variability in
precipitation, may have negative impacts on,
among others, land use (accelerating desertification
and lowering the yield of agriculture production),
energy (reducing the generation of hydropower)
and infrastructure ( increasing damage to roads and
ports).
As a result, addressing climate change requires a
coherent policy mix consisting of several, possibly
sectoral, interventions, which are ideally designed to
work in synergy in order to maximise their collective
effectiveness (UNEP, 2011a). In fact, climate change
is often being addressed simultaneously by several
ministries, which rely on a variety of thematic
indicators (e.g., related to agriculture, energy and
infrastructure), to support policymaking in their
respective sectors of responsibility. However, these
ministries typically do not have “climate change” as
an explicit and exclusive part of their mission and
portfolio. Instead, their respective core missions
normally consist (and have consisted for years) in
ensuring sufficient agriculture production, reliable
and affordable energy sources, and providing road
infrastructure – all of which affect and are affected
by climate change.
box 2 – key steps: IndIcatoRs foR Issue IdentIfIcatIon
1. Identify potentially worrying trends;2. Assess the issue and its relation to the natural
environment;3. Analyse more fully the underlying causes of
the issue of concern; and4. Analyse more fully how the issue impacts
society, the economy and the environment.
Illustrative issues and related indicators:
UNEP cross-cutting thematic priorities
Possible issues of concern Indicators
Climate change • Country contribution to anthropogenic climate change
• Increased frequency/intensity of storm surges
• Greenhouse gas emissions (Kt of CO2 equivalent/year)
• Rainfall (mm/year) and evaporation• Storm-related damages (US$/year)
Ecosystem management • Deforestation• Loss of critical ecosystem
services
• Forest cover (ha) • Extent of land and marine conservation
areas (ha)
Resource efficiency • Falling groundwater tables• Low efficiency of non-
renewable energy sources
• Water intensity or productivity (m3/US$)• Coal consumption intensity (tonnes/GDP)
Chemicals and waste management
• Air pollution• Soil contamination
• Sulphur oxide (SOx) emissions (Kg/yWr)
• Waste recycling and reuse (%)• Toxic heavy metal concentration, e.g., Hg,
Cd, Pb, Cr. (mg/kg)
Policy formulation analysis focuses on issues and opportunities
Issueidentification and
agenda setting
Policy formulation- Assessment
Decision-making
Policy monitoring andevaluation
Policy implementation

12
Hence, in order to elaborate effective policies to
address the issues above, they have to be correctly
identified and described across all relevant sectors,
through a careful analysis of their causes and
effects:
• Only with the correct identification of the causes
of the issue can policies be designed to have a
lasting positive impact.
• Only with the correct identification of the
effects of the issue can policies be designed that
maximise synergies and avoid the emergence
of negative side effects, in particular in other
sectors.
The methodology proposed here provides four main
steps in issue identification:
1. Identify potentially worrying trends;
2. Assess the issue and how it relates to the natural
environment;
3. Analyse more fully the underlying causes of the
issue; and
4. Analyse more fully how the issue impacts society,
the economy and the environment.
This approach is consistent with the use of the
DPSIR framework (UNEP, 2008) through the
identification of Drivers (D), Pressures (P), State (S),
Impacts (I) and Responses (R) (see Figure 3).
The four proposed steps are described in this
chapter. As regards to policy responses, this will
be taken up in Chapter 3 addressing indicators for
policy formulation.
If the problem to be analysed is essentially
environmental (rather than social or economic),
steps 1 and 2 could be merged to move directly
to the full analysis of causes and impacts (steps 3
and 4).
2.3 step 1: IdentIfy potentIally woRRyIng tRends
An initial step to determine whether an issue might
constitute a threat to sustainable development is
to analyse its historical trend. This can be done
using historical quantitative data or, in case
reliable statistics are not available, qualitative
information. Such a task should be accompanied
and complemented by an assessment of political
commitment and an analysis of national visions
and goals, as well as development plans and
sectoral policies (World Bank, 2012b). Mapping
the institutional landscape and policy framework,
coupled with trend and patterns analyses, are likely
to facilitate the identification of potential challenges
that need to be placed high on the national agenda.
Figure 3: A schematic representation of the DPSIR Framework
DRIVINGFORCES
PRESSURES
STATEOF THE
ENVIRONMENT
IMPACTS
RESPONSES
13
using indicators for green economy policymaking
An example is UNEP’s “Flexible Framework”
methodology, which includes in its approach the
mapping of the institutional landscape and policy
framework of countries on chemical accident
prevention and preparedness (CAPP) through the
development of ‘country situation reports’ (UNEP,
2010b; UNEP, 2012b).
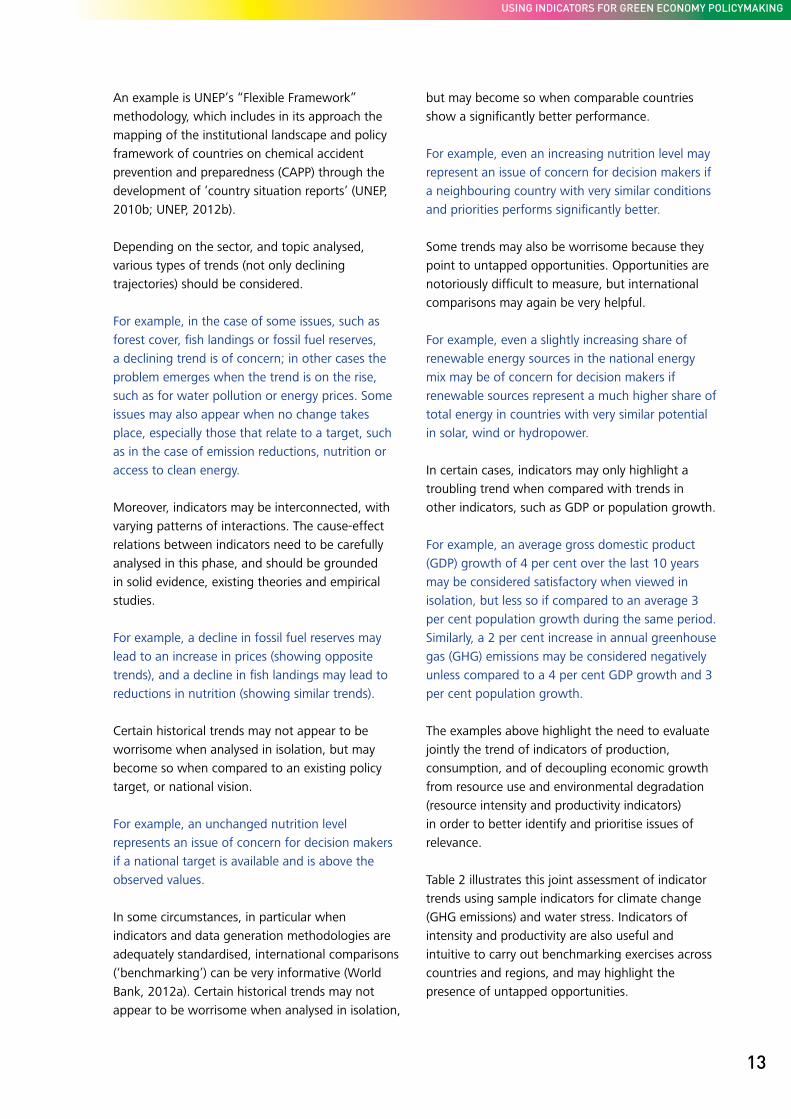
Depending on the sector, and topic analysed,
various types of trends (not only declining
trajectories) should be considered.
For example, in the case of some issues, such as
forest cover, fish landings or fossil fuel reserves,
a declining trend is of concern; in other cases the
problem emerges when the trend is on the rise,
such as for water pollution or energy prices. Some
issues may also appear when no change takes
place, especially those that relate to a target, such
as in the case of emission reductions, nutrition or
access to clean energy.
Moreover, indicators may be interconnected, with
varying patterns of interactions. The cause-effect
relations between indicators need to be carefully
analysed in this phase, and should be grounded
in solid evidence, existing theories and empirical
studies.
For example, a decline in fossil fuel reserves may
lead to an increase in prices (showing opposite
trends), and a decline in fish landings may lead to
reductions in nutrition (showing similar trends).
Certain historical trends may not appear to be
worrisome when analysed in isolation, but may
become so when compared to an existing policy
target, or national vision.
For example, an unchanged nutrition level
represents an issue of concern for decision makers
if a national target is available and is above the
observed values.
In some circumstances, in particular when
indicators and data generation methodologies are
adequately standardised, international comparisons
(‘benchmarking’) can be very informative (World
Bank, 2012a). Certain historical trends may not
appear to be worrisome when analysed in isolation,
but may become so when comparable countries
show a significantly better performance.
For example, even an increasing nutrition level may
represent an issue of concern for decision makers if
a neighbouring country with very similar conditions
and priorities performs significantly better.
Some trends may also be worrisome because they
point to untapped opportunities. Opportunities are
notoriously difficult to measure, but international
comparisons may again be very helpful.
For example, even a slightly increasing share of
renewable energy sources in the national energy
mix may be of concern for decision makers if
renewable sources represent a much higher share of
total energy in countries with very similar potential
in solar, wind or hydropower.
In certain cases, indicators may only highlight a
troubling trend when compared with trends in
other indicators, such as GDP or population growth.
For example, an average gross domestic product
(GDP) growth of 4 per cent over the last 10 years
may be considered satisfactory when viewed in
isolation, but less so if compared to an average 3
per cent population growth during the same period.
Similarly, a 2 per cent increase in annual greenhouse
gas (GHG) emissions may be considered negatively
unless compared to a 4 per cent GDP growth and 3
per cent population growth.
The examples above highlight the need to evaluate
jointly the trend of indicators of production,
consumption, and of decoupling economic growth
from resource use and environmental degradation
(resource intensity and productivity indicators)
in order to better identify and prioritise issues of
relevance.
Table 2 illustrates this joint assessment of indicator
trends using sample indicators for climate change
(GHG emissions) and water stress. Indicators of
intensity and productivity are also useful and
intuitive to carry out benchmarking exercises across
countries and regions, and may highlight the
presence of untapped opportunities.
14
The indicators selected in this step can also
be considered baseline indicators to be used
throughout the integrated policymaking process,
and against which the effectiveness of various
policy interventions will be evaluated.
2.4 step 2: assess the Issue and Its RelatIon to the natuRal envIRonment
Once a trend has been identified and defined
as potentially worrisome, indicators need to be
selected to evaluate in more detail whether and
how a link exists between the prospective issue of
concern and the environment.
The underlying question is whether the issue under
consideration is caused, or more generally affected,
by existing environmental trends, in particular
when this issue has primarily social or economic
dimensions.
The objective of this step is to reveal any existing
link between the issue and the environment, so
that any ‘real’ or underlying cause can be properly
identified and addressed in the next step. In
other words, the aim is to carefully evaluate the
symptoms in order to be able to properly address
the cause, rather than designing policies to fix the
symptoms while neglecting the cause.
For example, data on fish production can provide
useful information on the performance of the
fisheries sector over the years, and on its relation
to the environment. A declining fish capture could
be attributed to a reduction in the harvesting
effort (i.e. reduced number of fishermen and/or
fishing boats, perhaps due to emerging alternative
livelihood or income opportunities), or of the
fish stock itself, possibly being driven by coral
reef degradation, water pollution, an increase in
water temperature, or overfishing in earlier years.
Apart from the possible reduction in effort (with
underlying socio-economic causes) all other factors
are environmental.
Taking a multi-stakeholder approach will frequently
be useful. Various datasets (both qualitative
and quantitative) provided by the stakeholders
involved in the process could be used and
compared to confirm the existence and relevance
of environmental factors influencing the problem.
Triangulation techniques , to compare the
coherence of data across sectors and data sources,
can be used to gauge the relative strengths and the
interplay of the various effects, some of which may
be social or economic, and others, environmental.
This is also useful to evaluate a variety of cross-
sectoral indicators, which are often not available in
a single, integrated database.
For example, forest degradation or outright
deforestation may be caused by environmental
trends, for instance associated with diseases, as
well as human activity, especially the collection of
fuelwood, or the conversion of land to agriculture,
or timber production.
Topic
Indicator (different perspectives)
Production ConsumptionDecoupling
Intensity Productivity
Climate change (particularly relevant for fossil energy carriers)
GHG emissions due to national production
Carbon footprint as global warming potential
GHG emissions per GDP (tonnes/US$)
GDP per GHG emissions (US$/tonne)
Water stress Water abundance and water use for national production
Water footprint for domes-tic consumption
Water use per GDP GDP per water use
Table 2: Indicators for production, consumption and decoupling (intensity and productivity). Selected examples for climate change and water stress.

15
using indicators for green economy policymaking
It is worth considering that some problems may
only, or primarily, have social and/or economic
drivers, or may erroneously be perceived as such.
In this respect, it is important to identify indicators
that can highlight relevant trends in order to be
able to design effective policies.
For example, an increase in CO2 emissions can
be caused by the use of fossil fuels (a source of
emissions), but also by deforestation (with forests,
and biomass more generally, emitting CO2 when
burnt). Other more indirect indicators showing the
linkages between the source of emissions and the
environment are the extraction and use of fossil fuels,
as well as their stock level (simultaneously influenced
by discovery and extraction). On the other hand,
population and economic growth are often identified
as other critical causes of rising CO2 emissions
(in absolute terms); however such indicators, for
several reasons, are much harder, and perhaps less
preferable, to influence with policy interventions
than targeting energy efficiency, reducing forest loss,
reforestation, and adaption measures.
2.5 step 3: analyse moRe fully the undeRlyIng causes of the Issue of conceRn
Once a prospective issue has been detected by
analysing and comparing indicators of economic,
box 3 – summaRy of step 1: IdentIfy potentIal woRRyIng tRends
Tasks:1. Identify indicators of sectoral performance related to the problem.2. Collect relevant data. 3. Identify national trends and compare them with existing national, regional and global targets.4. Compare trends with the performance of comparable countries and/or regions.
Key questions: • Has the trend worsened in recent years?• Is the trend in line with national, regional or global targets?• Is the trend in line with the performance of similar countries?
box 4 - summaRy of step 2: assess the Issue and Its RelatIon to the natuRal envIRonment
Tasks:1. Identify indicators of environmental performance related to the problem. 2. Collect data relevant to the issue. 3. Identify national trends and compare them with existing national, regional and global targets.4. Compare trends with comparable countries and regions.
Key question:• Is the issue influenced by the environment? For instance, is the issue influenced by natural
resource depletion or degradation, erosion of ecosystem services, or the reduced provision of ecosystem services?Is the trend in line with the performance of similar countries?
–
16
social and environmental performance, and some
light has been shed on the relation between the
issue and the natural environment, the underlying
causes for the underperforming trend need to be
analysed more fully.
In Step 3, the pressures and driving forces
(underlying causes) are clearly isolated from
the symptoms (impacts and the state of the
environment). This is achieved by focusing on the
identification of causes (environmental, but also
social and economic) underlying the environmental
effects identified in Step 2, which are affecting the
issue identified in Step 1.
A number of indicators can be used to detect
causal relations and to map them systematically,
especially if identified through the support of
various stakeholders with specific sectoral expertise.
In the same way that the value chain for instance
in agricultural production can be broken down
into several stages from farming, to transport,
distribution and customer sales, a causal chain of
influence can be defined for indicators.
For example, in the case of nutrition, decreasing
agricultural production may be identified as an
issue of concern, defined by relevant indicators
such as the land used and its productivity (crop
yield). Underlying causes may be socio-economic
(e.g., rising prices of fertiliser) or environmental,
such as water availability (through irrigation, rainfall
and evaporation), or both (e.g., poor agricultural
practices leading to erosion or salinisation).
As indicated by the example above, several causes
may simultaneously affect - directly or indirectly -
the issue of concern or problem. Taking a systemic
view helps to map these relationships in order to
better understand how the various effects and their
indicators interact in creating (but potentially also
addressing) the issue.
The use of indicators in Step 3 is essential for
policymakers to be able to disaggregate or ‘break
down’ the system and understand the role played by
the various variables, including cross-sectoral ones, as
well as in determining sectoral trends and patterns.
The identification of these different causes, and the
understanding of how they interact and impact on
the issue at hand, will ultimately support the design
of a more targeted and effective policy package.
For example, if the reduced availability of water
is the issue to be addressed, very different – and
potentially alternative – policies could be designed
and implemented, including: to reduce pollution
from industrial waste (addressing water quality),
to curb the deterioration of forest ecosystems
and their water-related services (again addressing
water supply), or to increase water productivity
in agriculture by introducing more efficient
irrigation technologies or more adapted crops
(addressing water consumption). The choice of the
Figure 4: Simplified (and partial) causal tree diagram for the issue of nutrition and possible key drivers, where indicators are linked to each other representing the causal chain leading to the problem.
agricultureproduction
cropyield perhectare
harvestedareapopulation
waterstress
nutritionsoil
quality
fertilizeruse
chemical fertilizer
organic fertilizer
agricultural practices
(chemical fertilizer)
natural endowment
(organic fertilizer)
evaporation
precipitation
water demand

17
using indicators for green economy policymaking
appropriate policy mix would then depend on the
specific causes identified, the strength or relative
importance of their individual impacts, and the
analysis of their interplay.
While silver bullets are rare, in some cases, there
are examples in which the implementation of
a single policy helps to address several causes
simultaneously. In setting the policy agenda, and
depending on the local context, interventions that
could generate double and triple dividends and co-
benefits could be prioritised for implementation.
For example, localised deforestation in many
cases is caused by the need to increase agriculture
production, in light of a growing population and
a reduction in soil productivity. An intervention
aiming at improving agricultural yields would
allow an increase in production without the
need to expand agricultural land at the expense
of forests. Safeguarding the provision of forest-
related ecosystem services would be an important
additional benefit.
2.6 step 4: analyse moRe fully how the Issue Impacts socIety, the economy and the envIRonment
Given that budgetary resources are often scarce,
and that there is competition for budget allocation
across sectors, great care must be taken in
identifying which issues are important enough to be
eventually included in the government agenda.
In the first three steps we have analysed trends, and
identified the underlying causes of the issue in order
to ensure that it is properly addressed and that
targeted information is provided to decision makers
in the policy formulation stage.
Step 4 extends the analysis to the impacts that
the underperforming trend may have on other
social, economic and environmental indicators.
By so doing, we can identify additional issues that
can also be addressed, thus realising synergies,
and further prioritising the issues and the need for
intervention. We may also use this step to identify
any negative secondary effects arising from the
envisaged policy response (such as for example
weight-based targets in recycling policies hindering
rather than promoting recycling of many critical
elements in complex products which are usually
present in very low concentrations; UNEP, 2013),
as well as possible ways and means to mitigate or
otherwise address such effects as they emerge. As a
result, the indicators identified in this step could be
used to raise awareness about any ramification of
the issue, and make the case for policy interventions
to address it.
For example, harmful chemical substances and
hazardous waste can produce a number of negative
effects on several sectors. If access to potable water
is the issue to be addressed, and water pollution is
box 5 – summaRy of step 3: analyse moRe fully the undeRlyIng causes of the Issue
Tasks:1. Identify causal relations and map them systemically.2. Evaluate whether multiple causes act simultaneously and are also causally linked with each
other.3. Evaluate their respective strength.
Key questions:• Is there a causal relation between the trend observed and economic, social or environmental
variables?• What are the key drivers and pressures?• Are there multiple and simultaneous causes?
18
the main problem, additional simultaneous impacts
may include food contamination, ecosystem
degradation, and various consequences on human
health (e.g., acute poisoning, cancer and birth
defects) and certainly higher costs for purification
and/or for increasing freshwater supply.
It is noteworthy that such cascading effects may
also characterise the problem analysed. In fact,
the impacts of a certain environmental issue can
in turn be the causes of other problems in other
sectors, further worsening the overall performance
of the system. For this reason, both causes and
impacts need to be carefully examined adopting a
system-wide perspective, ahead of the definition
of the policy package. For example, ecosystem
degradation can have damaging impacts across
sectors as a result of the loss of ecosystem services
(UNEP-WCMC, 2011).
For example, deforestation in Borneo is causing
the loss of biodiversity, erosion and the disruption
of the hydrological cycle, leading to more frequent
and acute floods and droughts, in turn causing soil
degradation and lowering agriculture production,
and reducing the potential for fish catch and
tourism revenue (Van Paddenburg et al., 2012).
As indicated in the example above, the use of
indicators across several sectors is necessary to
correctly identify and assess issues, as well as their
impacts. In this respect, it is useful to organise
key impacts (and their respective indicators) by
sector of pertinence and add them to the causal
map developed in Step 3, to fully appreciate
the ramifications of the problem. Indicators for
issue identification can serve to highlight the
linkage between environmental degradation and
sustainable development.
Figure 5: Diagramme illustrating the impacts of business as usual (left) and green economy scenarios (right).

19
using indicators for green economy policymaking
Figure 6 represents a causal loop diagram for
the deforestation example above, and shows
how indicators are linked to each other using
arrows that depict the causal relation (positive or
negative) between them, and includes the problem
(deforestation), its causes and cross-sectoral direct
and indirect effects. The diagram illustrates that,
from a short-term economic perspective, palm oil
plantations and timber production contribute to
economic growth. However, in the medium- and
longer-term, an increase in deforestation would
reduce forest cover, increasing climate variability
and vulnerability (e.g., to floods and droughts),
thus negatively impacting biodiversity as well as
economic growth because of the need to increase
government expenditure to mitigate damage and
adapt to higher vulnerability. Box 6 provides a brief
explanation of causal loop diagrams and systems
mapping more generally.
Table 3 summarises the four main steps in this
phase, using sample indicators to illustrate each
step.
Figure 6: Simplified Causal Loop Diagramme representing the main causal relations existing among the economy and the environment (forest cover) in Borneo.
box 6 – mappIng the system wIth causal loop dIagRammes
In general terms, a Causal Loop Diagram (CLD) is a map of the system analysed: a way to explore and represent the interconnections among the key indicators in the sector, or system analysed.
More specifically, a CLD is an integrated map (because it represents different dimensions of the system) of the dynamic interplay (because it explores circular relations, or feedbacks) existing between the key elements (main indicators) that constitute a given system.
By highlighting drivers and impacts of the issue to be addressed, and by mapping the causal relations existing among key indicators, CLDs support a systemic decision-making process aiming at designing solutions that last over time. By explicitly representing feedback loops, CLDs shed light on possible future trajectories generated, from within or as a reaction to external events, by any given decision. As a result, CLDs enable the identification and use of synergies emerging within and across the key elements of the system, as well as avoiding possible unintended consequences.
palm oil/timberprofitability
investment
gdp
ecotourism
biodiversity
forest cover
flood&drought
climatevariability
infrastructure&built capitaldeforestation

20
box 7 – summaRy of step 4: analyse how the Issue Impacts socIety, the economy and the envIRonment
Tasks:1. Identify impacts of the issue on society, the economy and the environment.2. Identify indicators relevant to the issue analysed, considering its social, economic and
environmental impacts.3. Relate causes to cross-sectoral impacts using the causal relations identified in Step 3.
Key questions:• How is the problem affecting the system and its socio-economic and environmental performance?• Are the impacts of the problem immediate or emerging slowly, and do they last for a long time?

21
using indicators for green economy policymaking
Steps Description Indicator typology and tasks Indicator samples
1. Identify potentially worrying trends
Analyse data and detect worrying trends. •Has the trend worsened in recent
years? • Is the trend in line with national,
regional or global targets, and with the performance of similar countries?
a. Identify indicators of sectoral performance related to the problem.
b. Collect data relevant to the issue under consideration.
c. Identify national trends and compare them with existing national, regional and global targets.
d. Compare trends with the performance of comparable countries and/or regions.
Deforestation: •Value of timber products (US$/
year)•Deforestation (ha/year)•Annual harvest of wood
products (m3/year)Nutrition:•Dietary energy supply (Kcal/day
per person)•Crop yield (tonnes/ ha)•% of newborns with low birth
weight (<2500g)CO
2 emissions:
•CO2 emissions (Kt of CO
2
equivalent)• Temperature variability (%
annual increase in °C)•CO
2 emissions (Kt of CO
2
equivalent per US$1 GDP - PPP)
2. Assess the issue and its relation to the natural environment
Identify environmental trends that could contribute to the problem considered.• Is the issue influenced by the
environment, for instance by natural resource depletion or degradation, erosion of ecosystem services, or the reduced provision of ecosystem services?
a. Identify indicators of environmental performance related to the problem.
b. Collect data relevant to the issue under consideration.
c. Identify national trends and compare them with existing national, regional and/or global targets.
d. Compare trends with comparable countries and regions.
Deforestation:• Forest land cover (ha)•Annual desertification of forest
area (ha or % of forest land)•Degraded forest land (ha or % of
forest land)Nutrition:•Rainfall (mm/year)•Droughts (n. of droughts/year)• Fish landing (tonnes/year)CO
2 emissions:
•Production of fossil fuels (Btu/year)
• Fossil fuel reserves (Btu)• Forest cover (ha)
3. Analyse more fully the underlying causes of the issue of concern
Investigate more fully the causes for the underperforming trends.• Is there a causal relation
between the trend observed and economic, social or environmental variables? What are the key drivers and pressures?
•Are there multiple, and simultaneous causes?
a. Identify causal relations and map them systemically.
b. Evaluate whether multiple causes act simultaneously and are also causally interlinked.
c. Evaluate their respective strength.
Deforestation: •Agriculture land (ha)• Fuelwood consumption (kg/year)•Population (people)Nutrition:•Population (people)• Fish stocks (tonnes)•Water consumption (L/year)CO
2 emissions:
•Population (people)•Energy consumption from fossil
fuels (KWh; % of total)•GDP growth (US$/year)
4. Analyse more fully how the issue impacts society, the economy and the environment
Analyse impacts of the identified worrying trends on the system•How is the problem affecting the
system and its socio-economic and environmental performance?
•Are the impacts of the problem immediate or emerging slowly, and do they last for a long time?
a. Identify impacts of the issue on society, the economy and the environment.
b. Identify indicators relevant to the issue analysed, considering its social, economic and environmental impacts.
c. Relate causes to cross-sectoral impacts using the causal relations identified in step 3.
Deforestation: • Income of forest communities
(US$/year per capita)• Freshwater supply (L/year)•Ecotourism (n. of visits/year;
US$/year; % of GDP)Nutrition:• Life expectancy (years) •Agriculture GDP (US$/year)•Primary sector employment
(people)CO
2 emissions:
• Increase in average temperature (°C)
•Diseases from air pollution (n. of respiratory diseases/year)
•Crop yield (tonnes/ha)
Table 3: Summary of key steps and related indicators for issue identification: Examples for deforestation, nutrition and CO2 emissions.
22
3 IndIcatoRs foR polIcy foRmulatIon
3.1 IntRoductIon
The second stage of the integrated policymaking
cycle consists in the definition of policy goals,
to then proceed with policy formulation. While
indicators for problem identification help to frame
the issue, indicators for policy formulation help to
design solutions.
This chapter provides guidance on how to
identify indicators that support policy formulation
and analyse the strengths and weaknesses of
various possible intervention options, using a
systemic approach. Focus is given to the use of
indicators that help to assess the adequacy of the
interventions analysed, taking into account their
repercussions on the key actors in the economy and
impacts across sectors.
While the policy options analysed in this manual are
designed to be implemented at the national level
in response to issues highlighted in the problem
identification phase, additional interventions may
be considered. These include policies that would
ensure compliance with international standards, or
with regional and global goals, addressing problems
such as the leakage of greenhouse gas emissions.
Indicators can be identified and used to support
policy formulation and assessment, regardless
of the national boundaries of the impact of the
intervention.
3.2. methodology
This chapter discusses how to utilise the information
gathered on the issue to: (1) set policy objectives,
and (2) identify the possible policy options and set
associated targets.
While this process would ideally require the use of
several methodologies and instruments, analysing
historical qualitative and quantitative information
as well as the projections of economic and
biophysical simulation models, this manual focuses
on the specific contribution of indicators during
the two main steps for policy formulation (with
additional steps being included in the policy impact
assessment stage):
1. Identify policy objectives;
2. Identify intervention options.
These steps are described more fully in the
following sections. Considerations on indicators for
policy impact assessment are presented separately
in Chapter 4.
A differentiation is made in this report between the
effects of interventions on (i) outputs; (ii) outcomes;
and (iii) impacts. This terminology is commonly used
when assessing or evaluating the effectiveness of
measures (see Box 9 for further explanations and
definitions). As a result, the effectiveness of policy
interventions needs to be assessed at three different
levels:
1. The effectiveness of the intervention in terms of
desired outcome needs to be addressed against
the specific, stated policy objective or objectives.
Step 1 addresses the role of indicators with
respect to outcomes.
2. The quality or effectiveness of the intervention
in terms of output needs to be measured against
agreed specifications. Step 2 addresses the role
of indicators with respect to outputs.
3. The effectiveness of the intervention in terms
of impact needs to be addressed against the
overarching, strategic objectives enshrined in the
concept of sustainable development. Chapter
4 reviews the role of indicators with respect to
impacts.

23
using indicators for green economy policymaking
box 8 – key steps: IndIcatoRs foR polIcy foRmulatIon
In order to gauge the cost-efficiency of alternative
policy interventions, policy inputs also need to
be measured – typically in the form of public
expenditures. It is noteworthy that, in some
circumstances, input indicators are also used as
proxies for measuring output, in particular when
output is difficult to measure directly or when the
policy intervention relates closely to financial flows.
An example of the former would be expenditures
for public education serving as a proxy for the state
of the public education system. An example of the
latter would be the implementation of a public
payment scheme for ecosystem services, where
the amount of funds distributed (output) could be
approximated by overall expenditures (input) minus
the estimated administrative overhead. Clearly, such
indirect methods of measuring success need to be
applied with due caution, as they are inherently
unable to capture the effectiveness of the policy
intervention itself.
3.3 step 1: IdentIfy desIRed outcomes: defIne polIcy objectIves
The identification of policy objectives is based
on the results of the issue identification phase
and precedes the definition and choice of policy
interventions. It is therefore a crucial step for
decision makers, as policy objectives will frame the
specific steps taken in order to address the issue.
The definition of associated policy targets will also
1. Identify potentially worrying trends;2. Assess the issue and its relation to the natural
environment;3. Analyse more fully the underlying causes of
the issue of concern; and4. Analyse more fully how the issue impacts
society, the economy and the environment.
Illustrative issues and related indicators:
UNEP cross-cutting thematic priorities
Possible issues of concern Indicators
Climate change • Country contribution to anthropogenic climate change
• Increased frequency/intensity of storm surges
• Greenhouse gas emissions (Kt of CO2
equivalent/year) • Rainfall (mm/year) and evaporation• Storm-related damages (US$/year)
Ecosystem management • Deforestation• Loss of critical ecosystem services
• Forest cover (ha) • Extent of land and marine conservation
areas (ha)
Resource efficiency • Falling groundwater tables• Low efficiency of non-renewable
energy sources
• Water intensity or productivity (m3/US$)• Coal consumption intensity (tonnes/GDP)
Chemicals and waste management
• Air pollution• Soil contamination
• Sulphur oxide (SOx) emissions (Kg/yr)
• Waste recycling and reuse (%)• Toxic heavy metal concentration, e.g., Hg,
Cd, Pb, Cr. (mg/kg)
Issues and related policy goals can be of a general nature, or they can be social, economic and environmental (with the latter being more relevant for UNEP).
Issueidentification and
agenda setting
Policy formulation- Assessment
Decision-making
Policy monitoring andevaluation
Policy implementation

24
ensure effective monitoring and evaluation during
and after implementation.
Given its primary importance in the policy cycle,
the definition of policy objectives should be carried
out carefully, ensuring that a systemic, cross-
sectoral and multi-stakeholder approach is followed
throughout the process. An example of this process
is represented by the Bellagio STAMP (SusTainability
Assessment and Measurement Principles), which
suggests eight general principles that could be
adopted globally (Pintér et al., 2012; IISD, 2013).
More precisely, objectives should be formulated
and phrased according to a shared understanding
of the steps needed to solve the specific issue, in
accordance with the national vision, if available.
High-level government officials should be involved in
this process to guide the decision-making process,
aligning policy objectives with existing strategies and
plans. Moreover, all relevant stakeholders should be
engaged and consulted to take into account different
points of view and expertise, and to set goals that
do not conflict with key social values, norms and
beliefs. Finally, scientific evidence needs to inform the
formulation of policy objectives, so as to ensure that
objectives are appropriate and achievable.
Defining the policy objective or objectives relates
to the desired outcome of the policy intervention.
Ideally, policy objectives are stated in a manner that
is specific or targeted, measurable, ambitious while
achievable or realistic, and time-bound (SMART)
(Doran, 1981).
Indicators play a role in defining policy targets as the
explicit statement of desired results over a specified
period of time. Expressing targets in a quantified
manner will simplify the measure of progress towards
their achievement (IISD, 2005). However, not in every
case may it be desirable or possible to further specify
policy objectives by defining quantifiable targets.
For example, the Government of Indonesia set the
following targets in 2011: 7 per cent GDP growth
per year by 2014, and 41 per cent carbon emission
reductions by 2020 - of which 15 per cent with
international support. Additional objectives include
improved food security and poverty alleviation
(to ensure more inclusive growth) and wise use
of natural resources (to support future economic
growth but also to provide means of subsistence for
rural communities); these objectives are however
not quantified.
Several social, economic and environmental
objectives and thresholds exist at national, regional
box 9 – analysIng the effect of InteRventIons as outputs, outcomes and Impacts
While conceptual nuances exist, in accordance with the mandates and missions of organisations, existing methodologies for evaluation and results-based management commonly distinguish (i) outputs from (ii) outcomes and (iii) impacts. For the purposes of the present manual, these terms are defined as follows:• Output: is the immediate result of the policy intervention, in terms of the product, process, good
or service that it delivers.• Outcome: is the observable positive or negative change in the actions of social actors that have
been influenced, directly or indirectly, partially or totally, intentionally or not, by the output.• Impact: is the long-term, sustainable change in the conditions of people and the state of the
environment that structurally reduces poverty, improves human well-being and protects and conserves natural resources – in a nutshell, that achieves sustainable development.
The key to distinguishing these terms is that policymaking and implementation controls its outputs, influences outcomes, and contributes to impacts.
Source: Wilson-Grau 2008

25
using indicators for green economy policymaking
and global level, and can be used to formulate
national policy objectives and targets. Examples of
the latter are:
• the Millennium Development Goals (MDGs) and
their respective targets, agreed globally and
used to improve national performance (e.g.,
halving the proportion of the population without
sustainable access to safe drinking water and
sanitation by 2015);
• the Strategic Plan for Biodiversity 2011-2020,
adopted in 2010 by the Conference of the
Parties to the Convention on Biological Diversity,
contains twenty global policy targets (the
‘Aichi Biodiversity Targets’) under five strategic
objectives, some of which are quantified. For
instance, target 11 calls for at least 17 per cent
of terrestrial and inland water, and 10 per cent
of coastal and marine areas, to be conserved
through effectively and equitably managed
protected areas by 2020;
• At the regional level, among many examples, the
EU has established a CO2 emission target for new
passenger vehicles, not to exceed 130 grams
of carbon dioxide per kilometre (g CO2/km) by
2015.
When not explicitly or formally stated, possibly
due to the emerging nature of the issues to be
addressed, the objectives set at the national level
should be aligned, or consistent with, agreed
regional and international objectives.
The EU Roadmap to a Resource Efficient Europe,
which includes a series of milestones to be reached
by 2020, is an example of regional targets. Among
these milestones one refers to resource efficient
production: “Milestone: By 2020, market and
policy incentives that reward business investments
in efficiency are in place. These incentives have
stimulated new innovations in resource efficient
production methods that are widely used. All
companies, and their investors, can measure and
benchmark their lifecycle resource efficiency.
Economic growth and well-being are decoupled
from resource inputs and come primarily from
increases in the value of products and associated
services.”
Targets could focus on: (1) a specific issue, (2)
the causes of the issue or, more generally, (3) the
performance of the sector, or the economy as a
whole.
In order to define specific targets, the choice
of indicators at the adequate scale and level of
disaggregation is critical. For instance, consider the
example of defining policy targets for addressing
deforestation:
1. Setting a target on forest area alone, while
helping decision makers to gauge the
effectiveness of policies against the desired
outcome, in itself would not provide focus
on the key drivers of forest degradation or
deforestation.
2. Setting additional targets on the causes of
deforestation would help to support the design
and effective implementation of policies that
would directly and specifically address these
underlying causes, and may also bring about
double and triple dividends (see Chapter 2), as
the causes of deforestation may also contribute
to other problems.
3. Setting a target on the performance of the
sector, or the economy as a whole, would allow
decision makers to consider several additional
interventions, some of which may actually be
more effective than reduced deforestation.
Given the high competition for budgetary
expenditure across sectors, setting a high level
goal may be detrimental to solving very specific
issues, despite the fact that these issues have
an impact on the overall performance of the
system. As in the case of (1) above, decision
makers may overlook the key drivers of
deforestation, leading to the persistence of the
problem and the possible creation of additional
unexpected side effects. For instance, if the main
issue to be addressed is the reduction in GDP in
the forestry sector, the allocation of subsidies to
lower costs would make timber production more
attractive, stimulating investment in activities
that would further push deforestation in the
short term, and further undermine the potential
growth and sustainability of the sector in the
future.

26
More specific targets support more focused policy
formulation. A more targeted policy formulation
exercise, carried out within specific boundaries,
would also reduce the risks related to policy
implementation, increasing effectiveness and
reducing the emergence of elements of policy
resistance.
The above being said, macro targets (such as
those on GDP growth) remain important, as, in the
end, the combination of all policies implemented
to reach specific targets should lead to an
improvement of the overall performance of the
system. Macro indicators, in fact, may be useful
to measure impact along key dimensions. In this
respect, a more specific analysis of the impact of
policy implementation from a macro and cross-
sectoral perspective will be presented in Chapter 4.
3.4 step 2: IdentIfy InteRventIon optIons and output IndIcatoRs
After policy objectives and targets are established,
various intervention options can be considered
to achieve them, and various indicators can be
identified to evaluate the effectiveness of these
options once implemented. These indicators
address the output of the policy intervention.
For example, should private motor vehicles
represent a rapidly increasing share of the
transportation network of a major city, this could
lead to an increase in detrimental effects on
public health and quality of life more generally, as
well as an increase in economic costs associated
with ever-longer travel times. In such a case, city
administration, identifying this as a worrying trend,
could decide to reduce the modal share of private
motor vehicles (outcome: policy objectives). More
specifically, it could seek to reduce its modal share
from 80 per cent in 2010 to 55 per cent in 2020
(outcome: policy target and indicator). As part of its
adopted policy package, and in co-operation with
the federal government, it could launch a massive
investment programme into public transportation,
with a view to expand its metro system by 50 km,
its public bus system by 150 km, and to implement
30 per cent of bus lines on dedicated lanes (output:
targets and indicators).
There are four main ways for governments to
influence behaviour and shape future trends in
order to reach stated objectives: investments,
provision of incentives or disincentives, public
targets mandated by law (regulation) and social
interventions. Current and past policies adopted
for solving similar issues (i.e. address similar causes)
should be analysed to evaluate their efficiency
and effectiveness in the specific context of
implementation, also to identify the emergence of
potential side effects. The analysis of the adequacy
of these options, as well as their impacts (as
presented later on) will certainly benefit from the
adoption of a multi-stakeholder approach (UNDP,
2012).
box 10 – summaRy of step 1: IdentIfy desIRed outcomes and defIne polIcy objectIves
Tasks:1. Analyse indicators of sectoral and environmental issues.2. Select target indicators tailored to the national context, with the help of existing global and
regional targets: • Set specific targets to address the causes of the problem.• Set specific targets to reduce the impacts of the problem.
Key questions• What is the desired outcome that can be reached through policy interventions?• What is the key target to be reached?
27
using indicators for green economy policymaking
Investment
Investment by the government is a direct
intervention, originating from budgetary allocation,
aimed at creating new or improved green
infrastructure, or restructuring existing public
services. These investments can be implemented
for several purposes, including upgrading public
infrastructure (e.g., climate resilient transport
infrastructure) and modernising other services (e.g.,
expansion of the power transmission network, or
investment in renewable energy supply, such as
wind power).
For example, investments in public transport, if
well designed, support the reduction of liquid fuel
consumption and CO2 emissions, while at the same
time reducing traffic congestion and accidents,
possibly also lowering transport and health costs for
households.
Public capital investment can also contribute to
the abatement of costs for green activities, thus
potentially influencing future private expenditure
and investment.
For example, in the case of decreasing agricultural
production, investments in pilot projects for the
adoption of micro irrigation systems would show
the benefits of the technology in saving water
and increasing land productivity, thus potentially
triggering private investment.
Indicators relevant for the analysis and use of capital
investments are monetary flows, such as R&D
investment (% of GDP), EGSS investment (US$/year)
and specific sectoral investments, such as renewable
energy expansion (MW/year and US$/year).
IncentIve measuRes
Incentives and disincentives can be used to
stimulate or dissuade private investments. They are
powerful instruments to guide the market through
price signals, towards more sustainable production
and consumption. Incentives and disincentives
can come in several forms, including taxation and
subsidies.
For example, investments in renewable energy can
be stimulated by the introduction of feed-in tariffs,
an incentive that allows households to sell the
excess energy produced and increase their return
on investment. Providing payments for ecosystem
services can redirect the incentives of land holders,
in particular farmers, towards undertaking activities
that are beneficial (or, at least, less harmful) for
ecosystem conservation.
Indicators can be used to target, monitor and
evaluate the adequacy and performance of
incentives. This analysis requires a cross-sectoral
approach, as the impacts of these interventions
typically have social, economic and environmental
ramifications even beyond the targeted sector.
From a green economy perspective, particular
emphasis is put on the removal or phasing out of
harmful subsidies and the introduction of taxes
or fees that reflect the full opportunity cost of
nature’s goods and services. Full-cost pricing means
that prices are corrected for the external costs
of transactions, and ensures that consumers and
producers face a price that restores socially-efficient
decision-making.
For example, the removal, phasing out or
reform of environmentally-harmful subsidies,
such as those that subsidise the use of fossil
fuels would lead to higher prices thus lowering
demand and consumption, implying energy
savings or substitution of fossil fuel use with less
carbon-intensive energy sources. In identifying
subsidy programmes for reform or removal, the
effectiveness of the programme (or lack thereof)
against stated social or development policy
objectives is an important factor, and identifying
appropriate indicators would be very useful; for
instance the share of subsidy beneficiaries along
income brackets. Moreover, removing harmful
subsidies would also leverage scarce public
resources that can be put to better use (also an
important indicator).
publIc taRgets mandated by law
The establishment of laws and standards can be
seen as the formal enactment of a target, to ensure
that it is reached. In fact, unless mandated by law,
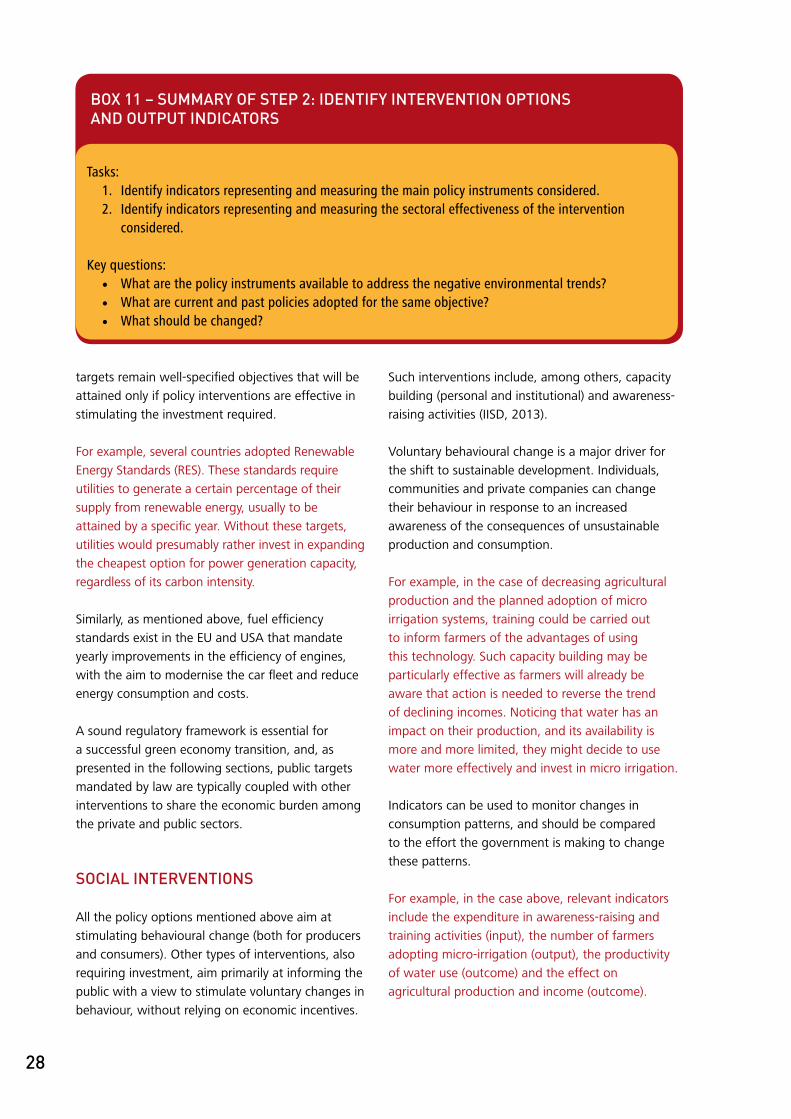
28
targets remain well-specified objectives that will be
attained only if policy interventions are effective in
stimulating the investment required.
For example, several countries adopted Renewable
Energy Standards (RES). These standards require
utilities to generate a certain percentage of their
supply from renewable energy, usually to be
attained by a specific year. Without these targets,
utilities would presumably rather invest in expanding
the cheapest option for power generation capacity,
regardless of its carbon intensity.
Similarly, as mentioned above, fuel efficiency
standards exist in the EU and USA that mandate
yearly improvements in the efficiency of engines,
with the aim to modernise the car fleet and reduce
energy consumption and costs.
A sound regulatory framework is essential for
a successful green economy transition, and, as
presented in the following sections, public targets
mandated by law are typically coupled with other
interventions to share the economic burden among
the private and public sectors.
socIal InteRventIons
All the policy options mentioned above aim at
stimulating behavioural change (both for producers
and consumers). Other types of interventions, also
requiring investment, aim primarily at informing the
public with a view to stimulate voluntary changes in
behaviour, without relying on economic incentives.
Such interventions include, among others, capacity
building (personal and institutional) and awareness-
raising activities (IISD, 2013).
Voluntary behavioural change is a major driver for
the shift to sustainable development. Individuals,
communities and private companies can change
their behaviour in response to an increased
awareness of the consequences of unsustainable
production and consumption.
For example, in the case of decreasing agricultural
production and the planned adoption of micro
irrigation systems, training could be carried out
to inform farmers of the advantages of using
this technology. Such capacity building may be
particularly effective as farmers will already be
aware that action is needed to reverse the trend
of declining incomes. Noticing that water has an
impact on their production, and its availability is
more and more limited, they might decide to use
water more effectively and invest in micro irrigation.
Indicators can be used to monitor changes in
consumption patterns, and should be compared
to the effort the government is making to change
these patterns.
For example, in the case above, relevant indicators
include the expenditure in awareness-raising and
training activities (input), the number of farmers
adopting micro-irrigation (output), the productivity
of water use (outcome) and the effect on
agricultural production and income (outcome).
box 11 – summaRy of step 2: IdentIfy InteRventIon optIons and output IndIcatoRs
Tasks:1. Identify indicators representing and measuring the main policy instruments considered. 2. Identify indicators representing and measuring the sectoral effectiveness of the intervention
considered.
Key questions:• What are the policy instruments available to address the negative environmental trends? • What are current and past policies adopted for the same objective?• What should be changed?

29
using indicators for green economy policymaking
Steps Description Indicator typology and tasks Indicator samples
1. Identify desired outcomes: define policy objectives
• Based on the worrying trend and its environmental causes, define policy objectives and set targets for their achievement.− What is the desired outcome
that can be reached through policy interventions?
− What is the key
a. Analyse indicators of sectoral and environmental issues.
b. Select target indicators tailored to the national context, with the help of existing global and regional targets: − Set specific targets to address
the causes of the problem. − Set specific targets to reduce
the impacts
Deforestation• Reduced deforestation (e.g. 50%
reduction by 2030)• Increase in protected area (ha)• Certified timber production ($/
year; ha)Nutrition• Increased nutrition levels (e.g.
2000 kcal/day per person)• Increased production of
agricultural products (tonne/year)• Higher water productivity in
agriculture (L/tonne)CO
2 emissions
• Decreased CO2 emissions (Kt of
CO2 equivalent)
• Increased renewable energy production (KWh)
• Lower electricity losses (% of electricity generation)
2. Identify intervention options and output
• Establish an initial list of potential policy instruments.
• Carry out an analysis of past interventions adopted to address the same issue, and their outcomes.
− What are the policy instruments available to address the negative environmental trends?
− What are current and past policies adopted for the same objective? What should be changed?
a. Identify indicators representing and measuring the main policy instruments considered.
b. Identify indicators representing and measuring the sectoral effectiveness of the intervention considered.
Deforestation• PES (payment for ecosystem
services): funding transferred (US$/year and/or US$/ha)
• Agroforestry development: investment per ha (US$/ha/year)
• Timber certification: activities certified (#/year and output)
Nutrition• Ecological fertilisers: investment
and productivity (US$/ha/year, tonnes/ha)
• Water efficiency: investment and productivity (US$/ha/year, tonnes/L)
• Improved fishing practices: public subsidy (US$/person/year)
CO2 emissions
• Renewable energy: feed-in tariffs (US$/MWh)
• Energy efficiency: national standards (CO2 emission % reduction)
Table 4. Summary of key steps and related indicators for policy formulation: Examples for deforestation, nutrition and CO2 emissions.
The policy instruments mentioned above will be
analysed in the following chapter, taking into
consideration their strengths and weaknesses in
solving the problems identified in Chapter 2, as well
as the potential synergies that can be created by
designing a policy package that combines several
intervention options.
Table 4 summarises the two main steps in this phase,
using sample indicators to illustrate each step.
30
4.1 IntRoductIon
A green economy is one that results in improved
human well-being and social equity while
significantly reducing environmental risks and
ecological scarcities (UNEP, 2011a). Therefore,
the final objective of green policy interventions
is to protect the environment while ensuring the
well-being of the population in a sustainable way.
Impact indicators are thus needed to highlight the
linkage between green economy and sustainable
development.
Once objectives and targets are defined, and
intervention options identified, a policy assessment
needs to be carried out to estimate the ultimate,
long-term impacts of implementation, to evaluate
the effectiveness of each option in supporting
sustainable development, and to inform decision-
making. While indicators for problem identification
help to frame the issue, and indicators for policy
formulation help to design solutions, impact
indicators support the estimation of the cross-
sectoral impacts of the interventions chosen.
Guidance provided in this chapter focuses on the
use of indicators already identified in Chapter
2 (issue identification), and Chapter 3 (policy
formulation), with a more marked focus on
indicators for socio-economic impacts and well-
being. Complementary to these indicators, there are
several impact assessment methods that support a
systemic analysis across sectors and actors.
4.2 methodology
Once a policy is designed, its expected impacts have
to be estimated to inform decision-making and
implementation. In this phase, clear understanding
needs to be developed of the time needed to
progress from policy formulation to decision-
making and consequently implementation. The use
of a multi-stakeholder approach is encouraged,
and roles, responsibilities and procedures should
be clearly defined and agreed upon (UNDP, 2009).
In addition, policy assessment should take into
account the time needed to implement the policy
and for its impacts to emerge. While being equally
effective in the longer term, certain policies may
generate positive results already in the short term,
while others may require more time to show any
meaningful impact.
For example, the expansion of forest protected
areas is a policy intervention that may require the
engagement of a number of relevant stakeholders,
including, when applicable, forest dwellers, logging
companies, government representatives from
different ministries, enforcement agencies, civil
society organisations, research institutions, etc. The
time needed to consult different actors and reach
an agreement on general objectives and principles,
as well as respective roles and responsibilities
for implementation (e.g., who is responsible for
monitoring the area; what is the procedure in case
of violations; what are the exceptions, if any, for
local dwellers). Moreover, the assessment should
include estimations of the time and costs needed to
implement and enforce new regulations, including
relocating companies and communities, creating
the capacity to control the area, and an assessment
of when results of policy implementation would be
visible (e.g., employment may be generated in the
short term, but impacts on biodiversity may take
longer).
Finally, the evaluation of policy effectiveness should
account for possible “rebound effects”, where
part of the policy-induced gain is offset by system
responses. These can be feedbacks involving the
price, income and/or the economy-wide rebound
effect. A rebound effect could limit the desired
impact of the policy, thereby influencing the time
required to achieve policy objectives.
4 IndIcatoRs foR polIcy assessment

31
using indicators for green economy policymaking
For example, in the case of a policy targeting a 10
per cent improvement in energy efficiency, energy
consumption may only be reduced by 6 per cent.
This is due to a reduction in energy consumption
and expenditure (policy impact) possibly leading to
a re-allocation of resources which ultimately lead
to higher expenditure and consumption (system
response).
Economic, social and environmental impacts have to
be forecasted and evaluated to support the creation
of a policy package that would lead to double or
triple dividends. The results of these assessments
will feed back into the further development and
fine-tuning of the policy options. The iterative
‘back-and-forth’ expressed in such feedback loops
are typical for the policy cycle.
Policy impact indicators are also fundamental for
the evaluation of the performance of policies during
and after implementation, and also contribute to
the next policymaking round (starting, again, with
issue identification).
The approach used for the identification of
policy impact indicators covers a broader set
of consequences of a social, economic and
environmental nature, and thus requires a multi-
stakeholder approach. These indicators include
information on the state of the environment,
directly related to the environmental issues and
target indicators, as well as indicators of sectoral
performance and socio-economic progress, such as
employment and well-being.
For example, the adoption of standards and
regulations for the exploitation of fisheries should
have positive effects on the preservation of
fish stocks, and thus the long-term profitability
of fishing activities. At the community level,
policy impacts could be measured through the
development of small-scale fisheries, which are
directly linked to food security and employment
generation.
Moreover, the restoration of damaged marine
ecosystems should help to prevent future floods
and coastal erosion, thus protecting coastal
communities and their livelihoods, as well as crucial
industries and infrastructure. Finally, revenues of
marine ecotourism activities (i.e. accommodation
and entertainment services) could be analysed to
quantify benefits deriving from healthier coasts.
Also, as an example from the waste sector, the
adoption of the 3R approach (reduce, reuse,
recycle) is mainly aimed at reducing pollution
and contamination derived from inappropriate
waste disposal and management. Together with
positive impacts on the environment, the success
of innovative policies for industrial and municipal
waste management might be reflected in improved
health conditions (e.g., reduced pollution), water
quality (e.g., reduced water contamination), energy
supply (e.g., energy generation from waste),
increased fish stocks (e.g., reduced contamination
of ocean and inland water resources). Moreover,
economic and employment opportunities could be
created by collecting, sorting and reusing waste.
Impacts are notoriously more difficult to identify
and assess. In the absence of more definite impact
indicators, early pointers of impact may be used
during implementation to indicate progress toward
achieving policy objectives. For example, in many
cases, output indicators and indicators of risk
factors can serve as suitable intermediate or leading
indicators of impact.
The methodology proposed focuses on three main
steps to identify indicators for policy monitoring
and evaluation:
• Analyse policy impacts across sectors;
• Analyse impacts on the overall well-being of the
population;
• Analyse advantages and disadvantages, and
inform decision-making.
These steps are described in the following sections.
4.3 step 1: estImate polIcy Impacts acRoss sectoRs
After having measured the effectiveness of the
policy intervention in addressing the issue at hand,
cross-sectoral impacts should also be measured
to evaluate whether the policy is effectively

32
contributing to sustainable development.
In fact, given the high degree of interdependence
of social, economic and environmental indicators,
every green policy implemented in one sector is
also likely to produce impacts (either positive or
negative) on other sectors.
For this reason, an integrated, cross-sectoral impact
analysis of green policies should be carried out in
order to provide a coherent evaluation of synergies,
side effects and ancillary benefits.
For example, greening the agriculture sector is
expected to improve soil quality and increase
yields and production, and consequently farmers’
incomes. Additional positive effects and synergies
are improvements in nutrition (social), reductions in
food imports (economic), and reductions in the rate
of deforestation (environmental), among others.
A policy example includes energy subsidies, which
are effective instruments to support economic
growth in the short term, by lowering the cost of
energy to consumers. On the other hand, economic
growth leads to higher energy demand, and higher
demand - in an open market - leads to higher
energy prices, offsetting the initial advantage
gained by introducing subsidies. This side effect
indicates that subsidies should be phased out over
time to maintain competitiveness, not only for fossil
fuels, but also for renewable energy.
For instance, subsidies on solar capacity reduce
market prices, pushing demand higher. On the
other hand, when demand increases, the price of
the raw materials used to produce solar panels
also increases (mostly due to the fact that demand
grows faster than the increase in supply), making
such panels more expensive. This is a case that has
particularly affected production in China, and, as
a consequence, global markets as well. Additional
interventions could be designed to mitigate
the strength of the side effect, by introducing
incentives for energy efficiency while removing
fossil fuel subsidies and by introducing incentives
for a less material-intensive production process for
solar panels while also, in this case, phasing out
consumer subsidies.
4.4. step 2: analyse Impacts on the oveRall well-beIng of the populatIon
The green economy is a vehicle to reach sustainable
development. For this reason, economic, social
and environmental impact indicators need to be
identified in the policy assessment phase and
monitored, focusing on how green economy
interventions contribute to the improvement of
well-being. In particular, potential co-benefits
and ancillary benefits of green policies should
be measured in order to assess the impacts
on the quality of life of communities, and to
identify additional opportunities to create positive
synergies between green growth and sustainable
development (OECD, 2011; UNEP, 2012a).
Several indicators can be used to estimate the
impact of green economy policies on well-being,
including, among others, employment and income
generation (ILO, 2013), total wealth (e.g., value of
natural resource stocks), access to resources (e.g.,
energy, water, sanitation) and health (e.g., harmful
chemicals in water, people hospitalised due to air
pollution).
The impact of green interventions on well-being can
be both direct and indirect:
• Direct benefits include employment generation
(e.g., new jobs for installing and maintaining
renewable energy infrastructure), improved
access to energy and water, increased food
security (e.g., as result of ecological agriculture
practices), among others.
• Indirect benefits include health (e.g., reduced
occurrence of diseases linked to air or water
pollution, adoption of healthy lifestyle),
education (e.g., higher quality education and
business skills resulting from capacity-building
activities on innovative green techniques and
technologies).
For example, a number of well-being indicators
could be considered when evaluating policies on
green agricultural practices. Improvements include
health conditions (e.g., cases of malnutrition or
intoxication due to water pollution), employment
(e.g., new jobs in agriculture and related sectors),

33
using indicators for green economy policymaking
food security (e.g., share of food insecure people,
MDG hunger target). Further, education would
improve (with technical knowledge on improved
management practices, but also due to higher
household income), and the risk of floods might be
reduced with better management of land and water
upstream.
From a bird’s eye perspective, the impact of green
policy interventions can also be estimated through
compound indicators (aggregated indicators,
composite indicators and indices) of well-being,
which measure the advancement towards
sustainable development through the combination
of several variables (IISD, 2005). Examples of these
aggregate indicators include:
• Human Development Index (HDI)
• Gender-related Development Index (GDI)
• Millennium Development Goals (MDGs)
• Genuine Progress Indicator (GPI)
• Gender Inequality Index (GII)
• Multidimensional Poverty Index (MPI)
• Inclusive Wealth Index (IWI)
• Index of Sustainable Economic Welfare (ISEW)
• Sustainable Net Benefit Index (SNBI)
Compound indicators are the result of a compilation
of single indicators on the basis of an underlying
model (Nardo et al., 2005; Hak, 2011). They are
designed to be more accessible to policymakers,
since they condense vast amounts of data into
one single value. However, they are particularly
prone to subjectivity, since value systems may
influence the theoretical framework for the selection
and combination of individual indicators, and in
particular with regard to the relative weights given
to the individual components. As suggested in
previous studies (UNEP, 2012a), methodological
pluralism coupled with stakeholder participation and
open and informed debate could reduce subjectivity
and increase the value of compound indicators for
measuring policy impacts on well-being.
box 13 – summaRy of step 1: estImate polIcy Impacts acRoss sectoRs
Tasks•Select and analyse indicators of policy impacts on other sectors.
Key questions• Is the policy having positive/negative impacts on other sectors?
box 14 – summaRy of step 2: analyse Impacts on the oveRall well-beIng of the populatIon
Tasks: • Select and analyse indicators of policy impacts on:
− Employment, total wealth, access to resources, etc.
• Select and analyse composite indicators of well-being, such as: − Human Development Index (HDI), Gender-related Development Index (GDI),
Millennium Development Goals (MDGs), Genuine Progress Indicator (GPI).
Key questions: • What is the impact of the policy on the overall well-being of the population?

34
Evaluating compound indicators of well-being can
help to evaluate the aggregated impacts of green
policies on quality of life and human development,
with particular attention to vulnerable groups.
Synergies between green economy strategies and
sustainable development become more evident in
this phase of the policy cycle, with an integrated
evaluation that touches upon direct and indirect
impacts of green interventions on the economy,
society and the environment.
For example, higher quality education and business-
related skills would contribute to an improved
Human Development Index (HDI) and in many
cases potentially to a better Gender-related
Development Index (GDI) as well. Further, access to
energy and water would improve the overall MDG
performance, and natural resource conservation
would increase adjusted net savings.
4.5 step 3: analyse advantages and dIsadvantages, and InfoRm decIsIon-makIng
The goal of policy formulation, including the
assessment of the likely impact of the interventions
chosen, is to design a policy package that can
effectively solve the problem and equitably allocate
the economic burden, as well as the benefits, across
the key actors in the economy.
An analysis of advantages and disadvantages
is necessary to identify the winners and losers,
concerning both required investments and benefits.
Simply put, this analysis would generally compare
investment and avoided costs, or added benefits,
depending on the issue.
For example, the adoption of energy efficient
technology requires upfront investments (capital
expenditure), but will reduce energy consumption
and expenditure (avoided cost), while possibly
creating new jobs and income (added benefit).
Added benefits and avoided costs may change
depending on the problem analysed, and can
be compared with indicators of the historical
and current performance of the sector to assess
whether the investment can be sustained, and how
the economic burden can be allocated across the
main actors impacted by the intervention (e.g.,
public versus private investment).
For example, in the case of deforestation, avoided
costs include the replacement of deteriorating
ecosystem services with built infrastructure
(e.g., roads), and the lowered production and
income from ecosystem goods (e.g., rubber
and other non-timber forest products). In fact,
aggressive deforestation may cause siltation, or the
accumulation of sediments in rivers, negatively-
impacting on navigation, water supply, fishing
communities, hydropower infrastructure, among
others. As a consequence, companies involved
in mining, for example, can either build roads to
offset the loss of river use for transport, plant trees,
compensate communities or contribute to the
clean-up of river beds.
The following steps could be followed to carry out
an analysis of advantages and disadvantages:
1. establish the baseline and estimate the cost of inaction
This includes an analysis of trends, especially
of baseline indicators (see Chapter 2) and the
estimation of economic, biophysical, social and
cultural damage resulting from inaction.
These include, for instance, costs of biodiversity loss
(expressed as lost ecotourism GDP); crop losses due
to extreme weather events (expressed as income
and production loss, increased imports, as well
as nutrition and relative health impacts); costs of
health treatment for respiratory diseases (expressed
as the number of people hospitalised, the cost
of treatment and the impact on GDP through
reductions in labour productivity).
In all these examples, a variety of indicators should
be monitored simultaneously in order to properly
establish cause-effect relations, and assess the actual
impact of interventions. In the case of tourism, for
instance, biodiversity loss does not necessarily lead to
a decline in revenues. In fact, while this could be true
for ecotourism services, it may not be the same for
traditional tourism business. In this case, considerable

35
using indicators for green economy policymaking
short-term growth could be achieved by expanding
hotel capacity at the expense of forest cover and
biodiversity.
2. Quantify the costs of policy intervention
Each policy instrument may imply several typologies
of costs, for various stakeholders (e.g., planning,
capacity-building, research, operation and
management), and some of these costs may be
prolonged or even become regular (e.g., operation
and management).
These include, for instance, salaries for park
rangers, training, management and operational
costs for the establishment of forest protected
areas; investments in research for the identification
of locally-adapted varieties, training and awareness-
raising activities for the introduction of climate-
resistant crop seeds; project and capital upfront
costs, and maintenance and capacity building
expenditure for investments in renewable energy
infrastructure.
3. Quantifytheadvantagesorbenefitsof policy intervention
Benefits to all stakeholders include avoided
damages, direct and indirect economic and/
or biophysical positive impacts, qualitative and/
or quantitative social improvements (e.g., well-
being) and cultural impacts, and more. Specific
methodologies for this quantification can be found
in several sectors. For biodiversity these include,
among others, market and non-market valuation
techniques (UNSD, 2003; EC et al., 2012). In the
case of policies that involve the private sector,
(e.g., incentives to EGSS), expected returns on
investments (ROI) and more conventional cost-
benefit and multi-criteria analyses could be carried
out. Further, reputational benefits deriving from
enhanced corporate social responsibility could also
be estimated.
It is important to underline that such advantages
will not just include benefits in a narrow sense, such
as monetary or financial benefits.
Examples of financial benefits include, for instance,
revenues from forest products; avoided costs for
the replacement of watershed management and
other ecosystem services; increased revenues from
ecotourism activities and from the sustainable
management of forests; increased agricultural
production and value; increased food exports
(or decreased imports); avoided costs of health
treatments for nutrition-related diseases or
intoxication from polluted water caused by the
use of climate-resilient crop-seeds; reduced fossil
fuel costs; avoided cost of health treatments
for respiratory diseases caused by polluted air;
increased employment; and lowered volatility of
electricity prices from investments in renewable
energy.
4. compare advantages and disadvantages (qualitative and quantitative, monetary and biophysical, social and cultural, across sectors and key actors, and over time)
Several methods can be used to estimate
advantages and disadvantages of the policy
options, depending on the information available.
These methods include the use of simulation
models for ex ante analysis (see Box 16) which
can facilitate the analysis of forecasted impacts of
policy implementation across sectors. Further, if
an exclusively economic analysis, such as a cost-
benefit analysis or a cost-effectiveness analysis, is
not deemed adequate or appropriate in the specific
situation, multi-criteria analyses could be applied
whereby policy options are ranked against a variety
of criteria, including social and cultural ones, chosen
ad hoc, as well as analyses of distributional impacts,
as applicable.
Given the need to consider the many ramifications
of the impacts of policies in the context of a green
economy analysis, the comparison of costs and
benefits is likely to require cross-sectoral expertise.
In fact, this activity should be carried out using a
multi-stakeholder approach in order to ensure that
assessments are objective (UNDP, 2009).
For instance, since the removal of harmful
subsidies has several measurable impacts, a
variety of indicators should be utilised to evaluate
the performance of the intervention. These
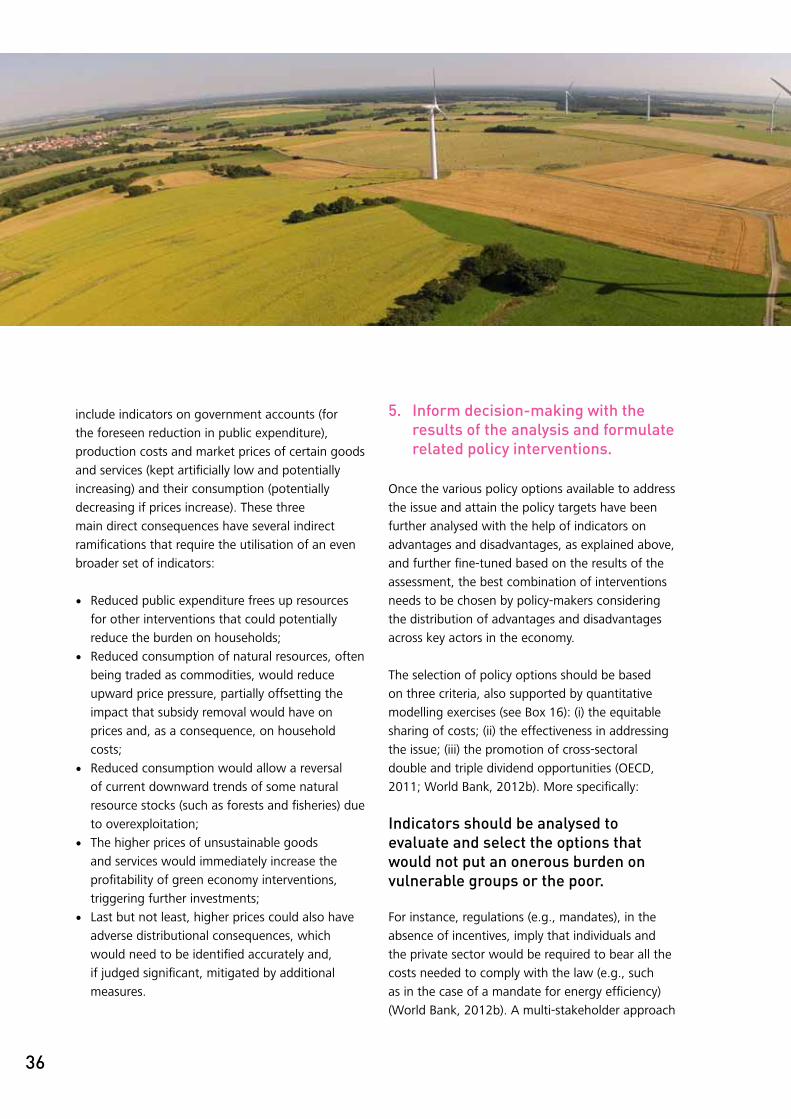
36
include indicators on government accounts (for
the foreseen reduction in public expenditure),
production costs and market prices of certain goods
and services (kept artificially low and potentially
increasing) and their consumption (potentially
decreasing if prices increase). These three
main direct consequences have several indirect
ramifications that require the utilisation of an even
broader set of indicators:
• Reduced public expenditure frees up resources
for other interventions that could potentially
reduce the burden on households;
• Reduced consumption of natural resources, often
being traded as commodities, would reduce
upward price pressure, partially offsetting the
impact that subsidy removal would have on
prices and, as a consequence, on household
costs;
• Reduced consumption would allow a reversal
of current downward trends of some natural
resource stocks (such as forests and fisheries) due
to overexploitation;
• The higher prices of unsustainable goods
and services would immediately increase the
profitability of green economy interventions,
triggering further investments;
• Last but not least, higher prices could also have
adverse distributional consequences, which
would need to be identified accurately and,
if judged significant, mitigated by additional
measures.
5. Inform decision-making with the results of the analysis and formulate related policy interventions.
Once the various policy options available to address
the issue and attain the policy targets have been
further analysed with the help of indicators on
advantages and disadvantages, as explained above,
and further fine-tuned based on the results of the
assessment, the best combination of interventions
needs to be chosen by policy-makers considering
the distribution of advantages and disadvantages
across key actors in the economy.
The selection of policy options should be based
on three criteria, also supported by quantitative
modelling exercises (see Box 16): (i) the equitable
sharing of costs; (ii) the effectiveness in addressing
the issue; (iii) the promotion of cross-sectoral
double and triple dividend opportunities (OECD,
2011; World Bank, 2012b). More specifically:
Indicators should be analysed to evaluate and select the options that would not put an onerous burden on vulnerable groups or the poor.
For instance, regulations (e.g., mandates), in the
absence of incentives, imply that individuals and
the private sector would be required to bear all the
costs needed to comply with the law (e.g., such
as in the case of a mandate for energy efficiency)
(World Bank, 2012b). A multi-stakeholder approach

37
using indicators for green economy policymaking
is necessary to identify and evaluate inconsistencies
in the cost allocation as well as impacts across
stakeholders, and to determine the indicators
necessary to evaluate the expected impacts of
policy interventions. In fact, indicators of household
investment as well as disposable income could be
used to evaluate whether the new policy would
require a considerable reallocation of resources
(possibly reducing consumption and savings) that
could lead to negative economic impacts. In such
a case, the gradual phasing in of the regulation,
possibly coupled with additional incentives, could
be considered. In the case of additional incentives,
their impact on government accounts – using
indicators associated with the annual deficit and
debt - should be carefully monitored.
Indicators should be analysed to evaluate the effectiveness of the interventions available.
As an example, investments in setting up a public
system for the collection and sorting of waste
may be very effective in creating employment, but
may prove to be very expensive and ineffective
in supplying the required quantity of waste to
recycling facilities. Investments in public awareness
instead, and the installation of waste disposal units
in several parts of the city may not generate jobs,
but may reduce implementation costs and increase
the flow of waste reaching recycling facilities, all
thanks to voluntary action.
Indicators should be used to design policy packages that make use of synergies and create double and triple dividends.
For example, while an investment in renewable
energy may be perceived to be very effective in
reducing fuel consumption (import and cost), the
impacts of the various policy options available to
reach a renewable energy target can be many and
varied. Importing manufactured capacity from
abroad, through a direct capital investment, while
minimising costs, will not create local employment
and capacity. On the other hand, incentives for the
expansion of capacity will stimulate local operators
to learn about the technology and either import
it or create it locally, generating knowledge and
employment.
Table 5 summarises the three main steps in this
phase, using sample indicators to illustrate each
step.
box 15 – summaRy of step 3: analyse advantages and dIsadvantages, and InfoRm decIsIon-makIng
Tasks:1. Identify indicators to estimate the costs of reaching selected targets through various policy
interventions (e.g., including capital and O&M costs, training expenditure, etc.).2. Identify indicators to evaluate expected benefits and avoided costs of the investment and
interventions considered.3. Identify and analyse indicators that highlight the presence of possible synergies and/or side
effects.
Key questions:• What is the economic cost of the targets and intervention(s) proposed?• How does it compare to the cost of inaction?• What are the economic and cross-sectoral benefits of policy options in the short, medium and
long-term?• Which options are expected to generate the maximum cross-sectoral benefit at the least cost?

38
box 16 – ex ante and ex post modellIng In suppoRt of polIcy foRmulatIon and evaluatIon
Due to the cross-sectoral impacts of green policy interventions, an integrated approach is needed to design an effective policy package.
As indicated in Chapters 2, 3 and 4, policymakers should use multiple indicators in order to better understand the functioning of the system, maximise synergies across sectors and avoid unintended consequences. Indeed, policies can have very positive impacts for certain sectors and create issues for others. Furthermore, successful policies in the longer term may have negative short-term impacts, for which mitigating actions may be designed and implemented.
Integrated policymaking requires a holistic perspective and constant monitoring of multiple, simultaneous changes in the drivers of the system. Integrated simulation models that address social, economic and environmental factors within a single analytical framework can support decision makers in identifying upcoming problems, estimating and evaluating the prospective impacts of policy implementation. More specifically, simulation models can be used ex ante - in the problem identification and policy formulation phases - and ex post - when policies are under implementation and their performance needs to be monitored and evaluated.
Ex ante modelling can generate “what if” projections on the expected (and unexpected) trends, as well as on the impacts of proposed policy options on a variety of key indicators across sectors. In addition, well-designed models that integrate various economic and biophysical variables and sectors can assist in the analysis of advantages and disadvantages and the prioritisation of policy options. The use of structural models that explicitly link policy interventions to their impacts can generate projections on how a certain target could be reached, and when.
Ex post modelling can support impact evaluation by improving the understanding of the relations existing among key variables in the system. Comparing actual with projected performance under given initial conditions and historical data enables improvements in the model and understanding of the system, and ultimately supports the refinement of objectives, targets, and policies.
The System Dynamics (SD) methodology, coupled with econometrics and optimisation in the sectors of relevance, has been successfully used to develop and test green economy principles at the global level, and to design several national green economy strategies in collaboration with the respective governments. One of the main advantages of SD - a methodology that emphasises causal relations and highlights the complexity of the system - is its transparency, and also its capacity to explicitly account for feedback loops, delays and non-linearity.

39
using indicators for green economy policymaking
Table 5: Key steps and related indicators for policy impact evaluation: Examples for deforestation, nutrition and CO2 emissions.
Steps Description Indicator typology and tasks Indicator samples
1. Estimate policy impacts across sectors
Evaluate the direct economic, environmental and social benefits (and potential side effects) of the interventions implemented.
Use integrated simulation models to project the future impact of the interventions on key sectors and indicators.• Is the policy having positive/
negative impacts on other sectors?
Evaluate the direct economic, environmental and social benefits (and potential side effects) of the interventions implemented.
Deforestation• Increased revenues from river
transport activities (US$/year)• Increased water supply (L/year)• Reduced flood risk (US$/year; % of
GDP)Nutrition• Revenue creation for food processing
industries (US$/year)• Water savings due to micro-irrigation
(L/year)• Increased water availability for
hydropower (KWh/year)CO
2 emissions
• Reduced cost of energy imports (US$/year)
• Lowered road transport costs (US$/year)
• Households consumption and savings (US$/year)
2. Analyse impacts on the overall well-being of the population
Identify impacts of policy imple-mentation on sustainable develop-ment, including poverty allevia-tion, equity, social inclusiveness, inclusive wealth etc.• What is the impact of the policy
on the overall well-being of the population?
a. Select and analyse indicators of policy impacts on:
− Employment, total wealth, access to resources, etc.
b. Select and analyse composite indicators of well-being, such as:
− HDI, GDI, MDGs, GPI.
Deforestation• Employment and income generation,
e.g., in sustainable forest management (people /year, US$/year)
• Deaths from landslides and floods (deaths /year)
• Revenues from ecotourism (US$/year)Nutrition• Employment and income generation,
e.g., in agriculture (people/year, US$/year)
• Malnutrition (people hospitalised/year)
• Newborn health (% of newborns with low birthweight)
CO2 emissions
• Access to modern forms of energy (%)• Employment and income generation
(people/year, US$/year)• Respiratory diseases due to smoke
inhalation from indoor burning cooking stoves (people hospitalised/year)
3. Analyse advantages and disadvantages and inform decision-making
Analyse short, medium and long-term advantages and disadvantages of the various policy options considered.
Compare options based on the analysis of advantages and disadvantages.• What is the economic cost of
the targets and intervention(s) proposed? How does it compare to the cost of inaction?
• What are the economic and cross-sectoral benefits of policy options in the short, medium and long-term?
• Which options are expected to generate the maximum cross-sectoral benefit at the minor cost?
a. Identify indicators to estimate the costs of reaching selected targets through various policy interventions (e.g., include, capital and O&M cost, training expenditure, etc.)
b. Identify indicators to evaluate expected benefits and avoided costs of the investment and interventions considered.
c. Identify and analyse indicators that highlight the presence of possible synergies and/or side effects.
Deforestation• Cost of reforestation (US$/ha)• GEF benefits index for biodiversity• Income creation for rural communities
(US$/year)Nutrition• Cost of interventions: material inputs
and training (US$/year, % of GDP)• Reduction of child malnutrition (%
and %/US$ invested)• Avoided food imports (US$/year or %
change)CO
2 emissions
• Investment in renewable energy (US$/year, % of GDP)
• Rural access to clean energy (%)• Avoided energy costs from savings
(US$/year, % of GDP)

40
5.1 IntRoductIon
The last stage of the integrated policymaking cycle
consists in the monitoring and evaluation of policy
impacts. While indicators for problem identification
help to frame the issue, and indicators for policy
formulation help to design solutions, indicators
for policy monitoring and evaluation support the
assessment of the performance of the intervention
implemented.
This approach focuses on the use of indicators
already identified in Chapter 2 (issue identification)
and Chapters 3 and 4 (policy formulation and
assessment).
5.2. methodology
Given that the integrated policymaking cycle is
continuous, the impact of policies needs to be
monitored and evaluated, firstly to support the
agenda-setting stage. In fact, if the impacts differ
from expectations, unsolved issues will remain high
on the agenda of policymakers, and corrective
actions will have to be taken and then monitored
and evaluated.
For example, the impact of interventions in public
transport should be measured in relation to
initial expectations, such as the reduction of CO2
emission, which may have been perceived as a
priority issue in the agenda-setting stage. In this
case, data monitoring may reveal that emission
levels, although declining, are still above desired
targets. This could be due to an underestimation
of secondary impacts, such as transit-oriented
development, resulting from the extension of the
public transport infrastructure. In particular, the
expansion of railway networks connecting urban
and lower density areas might result in increased
urbanisation, with the growth of suburbs. As a
result, corrective measures need to be identified
and implemented.
Monitoring and evaluation is also crucial to
identify and anticipate patterns and trends,
through the analysis of emerging and unexpected
events. Despite all efforts made during the policy
identification and assessment stages described in
previous chapters, unforeseen policy responses,
in the form of negative side effects or potentially
positive synergies, may only be detected during
the implementation stage. This may also lead to a
redefinition of targets (either lowered or increased)
and to the modification of policies already in place.
For example, policy interventions to reduce
CO2 emissions have included incentives for the
cultivation of sugar or starch crops - such as corn or
sugarcane- to produce energy and reduce fossil fuel
exploitation. However, subsequent assessments or
monitoring and evaluation during implementation
have, in a number of cases, highlighted a trend
towards shifting land use from food crops to biofuel
crops, with consequent increases in food prices and
negative impacts on food security and nutrition.
Furthermore, large amounts of water and fertilisers
are needed to obtain adequate biofuel crop yields
leading to reduced water availability for other
uses, as well as soil degradation and groundwater
pollution from chemical fertilisers.
These early warning signs may induce policymakers
to consider lowering the target for biofuel
production, or implementing interventions that
mitigate the negative effects of existing production
practices (such as more stringent water efficiency
standards or land use regulations, or the provision
of incentives for ecological agricultural practices).
In order to conduct comprehensive monitoring and
evaluation, a broad range of stakeholders need to
be engaged in the process to provide feedback on
5 IndIcatoRs foR polIcy monItoRIng and evaluatIon
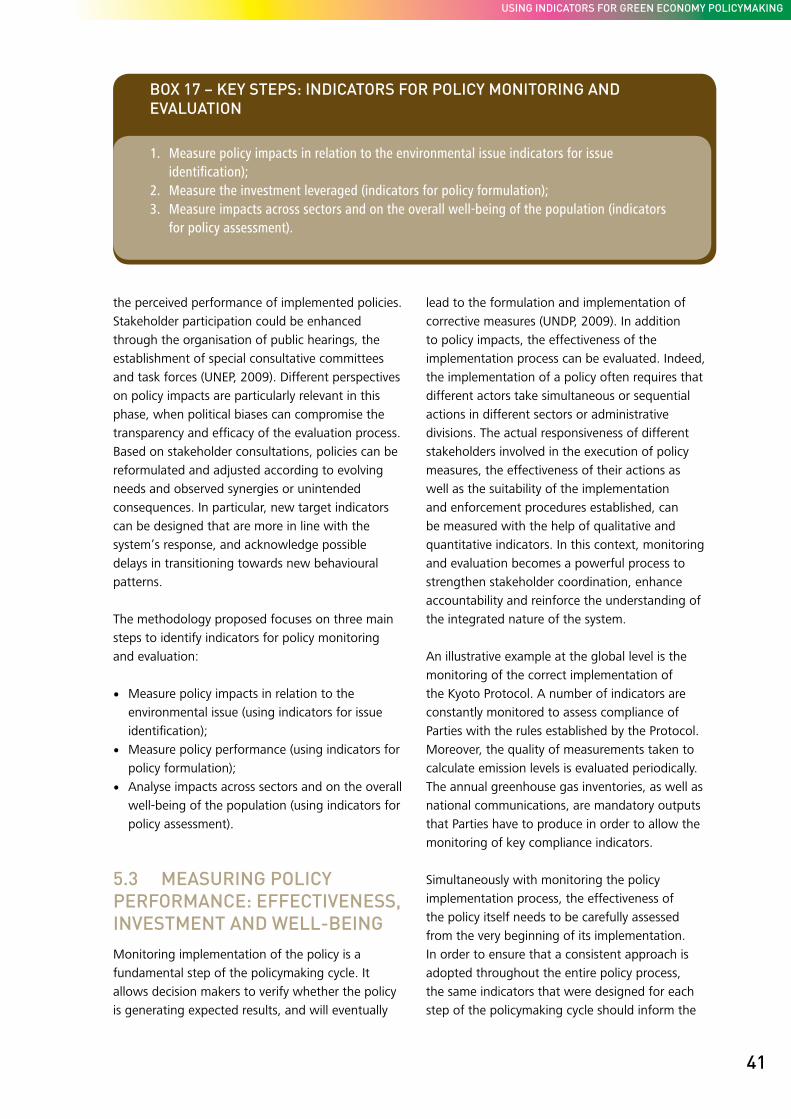
41
using indicators for green economy policymaking
the perceived performance of implemented policies.
Stakeholder participation could be enhanced
through the organisation of public hearings, the
establishment of special consultative committees
and task forces (UNEP, 2009). Different perspectives
on policy impacts are particularly relevant in this
phase, when political biases can compromise the
transparency and efficacy of the evaluation process.
Based on stakeholder consultations, policies can be
reformulated and adjusted according to evolving
needs and observed synergies or unintended
consequences. In particular, new target indicators
can be designed that are more in line with the
system’s response, and acknowledge possible
delays in transitioning towards new behavioural
patterns.
The methodology proposed focuses on three main
steps to identify indicators for policy monitoring
and evaluation:
• Measure policy impacts in relation to the
environmental issue (using indicators for issue
identification);
• Measure policy performance (using indicators for
policy formulation);
• Analyse impacts across sectors and on the overall
well-being of the population (using indicators for
policy assessment).
5.3 measuRIng polIcy peRfoRmance: effectIveness, Investment and well-beIng
Monitoring implementation of the policy is a
fundamental step of the policymaking cycle. It
allows decision makers to verify whether the policy
is generating expected results, and will eventually
lead to the formulation and implementation of
corrective measures (UNDP, 2009). In addition
to policy impacts, the effectiveness of the
implementation process can be evaluated. Indeed,
the implementation of a policy often requires that
different actors take simultaneous or sequential
actions in different sectors or administrative
divisions. The actual responsiveness of different
stakeholders involved in the execution of policy
measures, the effectiveness of their actions as
well as the suitability of the implementation
and enforcement procedures established, can
be measured with the help of qualitative and
quantitative indicators. In this context, monitoring
and evaluation becomes a powerful process to
strengthen stakeholder coordination, enhance
accountability and reinforce the understanding of
the integrated nature of the system.
An illustrative example at the global level is the
monitoring of the correct implementation of
the Kyoto Protocol. A number of indicators are
constantly monitored to assess compliance of
Parties with the rules established by the Protocol.
Moreover, the quality of measurements taken to
calculate emission levels is evaluated periodically.
The annual greenhouse gas inventories, as well as
national communications, are mandatory outputs
that Parties have to produce in order to allow the
monitoring of key compliance indicators.
Simultaneously with monitoring the policy
implementation process, the effectiveness of
the policy itself needs to be carefully assessed
from the very beginning of its implementation.
In order to ensure that a consistent approach is
adopted throughout the entire policy process,
the same indicators that were designed for each
step of the policymaking cycle should inform the
box 17 – key steps: IndIcatoRs foR polIcy monItoRIng and evaluatIon
1. Measure policy impacts in relation to the environmental issue indicators for issue identification);
2. Measure the investment leveraged (indicators for policy formulation);3. Measure impacts across sectors and on the overall well-being of the population (indicators
for policy assessment).

42
monitoring phase. Therefore, when monitoring and
evaluating impacts of green policy interventions,
the indicators for issue identification (see Chapter 2)
should be analysed to test the actual effect of the
interventions implemented. Further, indicators for
issue identification should be compared to target
indicators (see Chapter 3) to evaluate whether the
situation is improving and matching desired targets.
For example, if deforestation has been identified
as a worrying trend, and the establishment of new
protected areas has been selected as a green policy
option to protect forests and reverse the trend, the
first indicators to monitor are deforestation and
its causes. Further, if a target is available for the
reduction of deforestation, a comparison should be
made, to evaluate whether the trend is improving
enough to reach the stated target on time.
If the analysis indicates that the problem has not
been effectively addressed, the emphasis should
be put on the causes of the problem to evaluate
whether the inertia of the system (i.e. delay times
in the implementation of the policy and in it having
an impact) is preventing sudden and measurable
changes.
For example, in the case of fisheries, despite the
introduction of natural reserves to reduce catch
and support the natural growth of the fish stock,
it may take months or years for the fish stock
to reach desired levels due to the biology of fish
reproduction and other natural processes (e.g.,
natural predation, or growth of corals) affecting the
system.
If no change is visible in the causes of the problem,
a more specific policy analysis should be carried out,
to evaluate the impacts of the intervention on the
causal chain and to identify weak links, including
side effects and unintended consequences.
For example, in the case of energy efficiency,
despite the success of incentives for energy
efficient light bulbs and appliances, household
energy consumption may not decline as much as
expected because of the rebound effect, whereby
the avoided energy costs resulting from the
energy saved, may be spent on purchasing more
energy intensive appliances (e.g., a larger TV or
refrigerator) or simply using them more (e.g., light
bulbs being left on for a longer period of time).
The performance of the policy in addressing the
problem should be evaluated in relation to the
resources it has mobilised. For this reason, to
assess the effectiveness of the policy instrument
chosen, the investment disbursed should be
measured, either directly (e.g., in the form of capital
investment and/or incentives) or indirectly (e.g.,
private investment triggered by the allocation of
incentives, laws and regulations, or by the pricing
of externalities).
For example, the monitoring and evaluation of
renewable energy incentives may reveal that
progress towards reaching a desired renewable
energy growth target is below expectations. In
light of this result, possible direct and indirect
causes of failure should be analysed. These include
the possibility that government incentives are not
adequate (or sufficiently attractive) to trigger the
required private sector investments. In this case,
the incentive package could be revised. Another
possible explanation may be that the target
set was too ambitious compared to the private
financial resources available (e.g., with low access
to credit, even an attractive incentive may prove
unsuccessful).
Finally, with the green economy being a vehicle
for sustainable development the monitoring
and evaluation of policy impacts should also be
extended to effects across sectors and on well-
being. Since a green economy is expected to favour
inclusive growth, the distribution of costs and
benefits across actors also needs to be carefully
evaluated. Participatory Monitoring and Evaluation
(PME) is strongly recommended as an effective
approach to understand multiple perceptions of
policy impacts on well-being (UNEP, 2009).
For example, when evaluating the effects of a
stimulus package for ecotourism, co-benefits should
be measured also in other sectors, such as the
provision of local services and the manufacturing
of tourism-related goods (e.g., beds, souvenirs,
equipment etc.). These, and other activities, impact
on the well-being of the population through job
creation, income, but also through the creation of
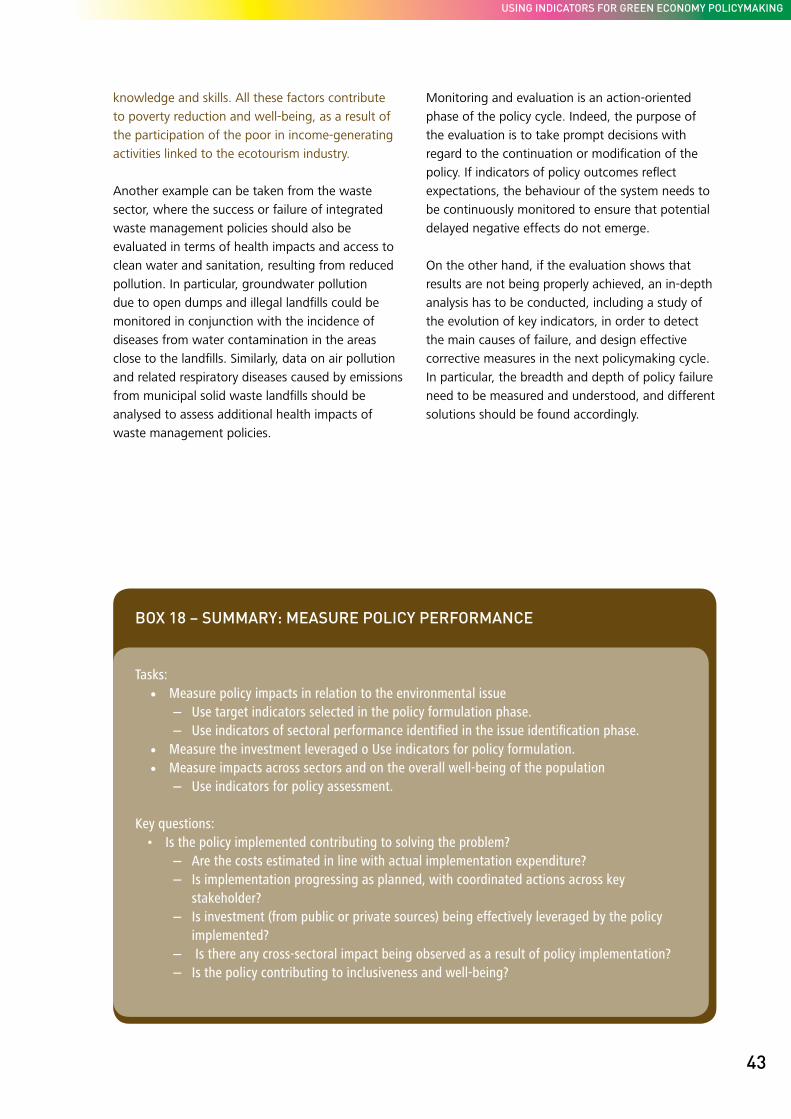
43
using indicators for green economy policymaking
knowledge and skills. All these factors contribute
to poverty reduction and well-being, as a result of
the participation of the poor in income-generating
activities linked to the ecotourism industry.
Another example can be taken from the waste
sector, where the success or failure of integrated
waste management policies should also be
evaluated in terms of health impacts and access to
clean water and sanitation, resulting from reduced
pollution. In particular, groundwater pollution
due to open dumps and illegal landfills could be
monitored in conjunction with the incidence of
diseases from water contamination in the areas
close to the landfills. Similarly, data on air pollution
and related respiratory diseases caused by emissions
from municipal solid waste landfills should be
analysed to assess additional health impacts of
waste management policies.
Monitoring and evaluation is an action-oriented
phase of the policy cycle. Indeed, the purpose of
the evaluation is to take prompt decisions with
regard to the continuation or modification of the
policy. If indicators of policy outcomes reflect
expectations, the behaviour of the system needs to
be continuously monitored to ensure that potential
delayed negative effects do not emerge.
On the other hand, if the evaluation shows that
results are not being properly achieved, an in-depth
analysis has to be conducted, including a study of
the evolution of key indicators, in order to detect
the main causes of failure, and design effective
corrective measures in the next policymaking cycle.
In particular, the breadth and depth of policy failure
need to be measured and understood, and different
solutions should be found accordingly.
box 18 – summaRy: measuRe polIcy peRfoRmance
Tasks: • Measure policy impacts in relation to the environmental issue
− Use target indicators selected in the policy formulation phase. − Use indicators of sectoral performance identified in the issue identification phase.
• Measure the investment leveraged o Use indicators for policy formulation. • Measure impacts across sectors and on the overall well-being of the population
− Use indicators for policy assessment.
Key questions: • Is the policy implemented contributing to solving the problem?
− Are the costs estimated in line with actual implementation expenditure? − Is implementation progressing as planned, with coordinated actions across key
stakeholder? − Is investment (from public or private sources) being effectively leveraged by the policy
implemented?− Is there any cross-sectoral impact being observed as a result of policy implementation? − Is the policy contributing to inclusiveness and well-being?

44
box 19 – land-locked dRy and sub-humId countRy, wIth domInant agRIcultuRe and In eaRly phases of demogRaphIc tRansItIon and uRbanIsatIon.
Given their socio-economic and environmental context, land-locked, dry and sub-humid countries relying heavily on agriculture might face a number of direct or indirect environmental challenges. Examples include:
• A reduction in soil quality, possibly due to climate change impacts and unsustainable agricultural practices, leading to a decrease in food production.
• Increasing water stress, due to growing demand for municipal and agricultural uses, and to variability in precipitation.
• High demographic growth, leading to urbanisation and creating pressures on the provision of basic services, such as access to sanitation and health care.
Sample indicators are presented for each step of the policymaking process to address the problem of decreasing agricultural production in this specific country context.
2. Issue identification
Step 1: Identify potentially worrying trends. In the first step of the issue identification phase, past and current trends are monitored in order to identify potential issues that might compromise national development.
The problem can be identified by analysing production (tonnes/year) and productivity (tonnes/ha), or indirectly, with the help of indicators related to food availability, such as food security, average nutrition level (Kcal/day/person) and health (% of newborns with birth weights inferior to 2500g).
Step 2: Assess the issue and its relation to the natural environment. Once the issue has been identified as potentially harmful for national development, indicators are used to clarify the relation (if any) between the problem and the environment.
In the case of decreasing agricultural production, a number of cause-effect relations might be explored between soil fertility, agricultural practices and environmental quality. On the one hand, the adoption
of unsustainable cultivation and irrigation practices is likely to put pressure on natural resources, thereby impacting the overall performance of the sector. On the other hand, the sector can also be affected by environmental trends (such as increased climate variability, leading to water scarcity). Key indicators that can support this type of analysis include, among others, water use (L/year), rainfall (mm/year), irrigated land area (ha), water intensity in agriculture (L/tonne), use of fertilisers and pesticides (tonnes/ha), drought occurrence (n. of droughts/year).
Step 3: Analyse more fully the underlying causes of the issue of concern. After a general analysis has been conducted on the key elements having an influence on agricultural production, a more in-depth study is carried out to clearly identify causes and effects. For example, lower yields might be caused by soil erosion, in turn determined by a number of unsustainable practices, such as intensive use of chemical fertilisers (tonnes/ha), limited crop rotation, deep tillage etc. Another concurring cause could be the lack of water, attributable to low water productivity (m3/USUS$), reduced or highly variable rainfall (mm/year) and temperatures as a result of climate change.
Step 4: Analyse more fully how the issue impacts society, the economy and the environment. Once the key causes of the problem have been detected with the help of indicators and causal maps, the effects of decreased agricultural production on national socio-economic and environmental performance need to be measured.
For example, economic impacts could be evaluated by analysing trends in agriculture value added (USUS$/year); social impacts may include reduced employment (people/year), as well as increasing malnutrition (n. of malnutrition-related diseases/year); environmental impacts might derive from unsustainable practices to increase production at the expense of ecosystems; these may include deforestation (ha/year), more intensive use of fertilisers (tonnes/ha) leading to further soil degradation (% of agriculture land) and groundwater pollution (BOD mg/L), etc.

45
using indicators for green economy policymaking
3. Policy formulation
Step 1: Identify desired outcomes: define policy objectives. The information provided by indicators of problem causes and effects is used to define the desired outcomes of policy interventions. The main goal of the policy could be the improvement of agricultural practices for the achievement of adequate and sustainable production. Time-bound targets could be defined with the help of relevant indicators in order to track progress towards desired outcomes. These may include crop yield (% increase), reduced use of chemical inputs (% decrease in use, measured in tonnes/ha), water efficiency (% reduction of irrigation water losses).
Step 2: Identify intervention options and output indicators. Once broad policy goals and related specific targets have been set, an initial list of potential policy interventions is designed. Examples of potential green policies for this specific country context are incentives and training on sustainable agricultural practices and investment in efficient irrigation technology.Output indicators are used in this phase to measure the suitability of each policy option with respect to the identified goals and targets. Indicators may include, for example: investment in and productivity of organic fertilisers (USUS$/ha/year; tonnes/ha), investment in water efficient technology and avoided water losses (USUS$/year; % of GDP; L/year), investment in and outreach of training activities (USUS$/year; n. of farmers involved).
4. Policy assessment
Step 1: Measure policy impacts across sectors. The impact of each policy option is measured with respect to the main sector addressed (i.e. agriculture) as well as to other key sectors. First of all, expected impacts are evaluated using indicators of agricultural production (tonnes/year). In addition, cross-sectoral impacts can be measured, such as revenue creation for food processing industries (USUS$/year), increased water availability for hydropower (KWh/year).
Step 2: Analyse impacts on the overall well-being of the population. Relevant indicators should be used to assess the impact of different green policy interventions on well-being. For example, an increase in agriculture production through the adoption of more sustainable practices is expected to bring health benefits (e.g., number of people hospitalised due to malnutrition or diseases related to water pollution), improve access to potable water and sanitation,
and generate employment (number of new jobs in agriculture and related sectors).
Step 3: Analyse advantages and disadvantages, and inform decision-making. A comparative analysis of costs and benefits is essential to evaluate the feasibility of the policy. The overall investment needs to be estimated (USUS$/year), including training of farmers, storage facility construction and maintenance, incentives for organic fertilisers etc. Investments are then compared with benefits, such as additional value added (USUS$/year), avoided chemical fertiliser and water use, as well as food imports (USUS$/year or % change), additional income generated through employment (USUS$/year), reduced mortality (%), etc.
5. Monitoring and evaluation
Step 1: Measure policy impacts in relation to the environmental issue. Once the policy is under implementation, progress towards the stated targets has to be measured. Target indicators, such as % increase in crop yield, % decrease in the use of chemical inputs, % reduction of water losses, are compared with actual results in order to evaluate the effectiveness of the selected interventions.
Step 2: Measure the investment leveraged. Similarly, the indicators of expected costs and benefits identified in the policy formulation and assessment phases are monitored to evaluate the actual response of the system.
Step 3: Measure impacts across sectors and on the overall well-being of the population. Finally, actual policy impacts on well-being indicators are evaluated, using the same indicators identified in the assessment stage.

46
box 20 –tRopIcal oR sub-tRopIcal small Island developIng state wIth domInant sectoRs beIng touRIsm and fIsheRIes.
Small island developing states (SIDS) are exposed to various environmental challenges, especially due to their high vulnerability to climate change impacts. Moreover, the performance of key sectors such as tourism and fisheries is strongly dependent on the environment and climate.
Examples of problems that may affect SIDS are:• Increased risk of floods and storm surges due to
climate change.• Lowered and erratic fisheries production and
productivity, possibly due to overfishing and marine ecosystem deterioration.
• Decreasing tourism arrivals and profitability due to the deterioration of marine and coastal ecosystems and the depletion of key natural resources, among others.
Sample indicators are provided below for each step of the policymaking process to address the problem of decreasing fish catch in this specific country context.
2. Issue identification
Step 1: Identify potentially worrying trends. Decreasing fish catch is a problem that can be identified with the help of various indicators. In particular, worrying trends can be detected through the monitoring of fish landings (tonnes/year) and, possibly, fish stocks (tonnes), but also through indirect indicators such as food security (number of food insecure people) or average household income (US$/year), especially when a large part of the population depends on fishing activities for nutrition and livelihoods.
Step 2: Assess the issue and its relation to the natural environment. The relation between fish catch and environmental trends can be assessed through the health of marine ecosystems, measured through coral reef degradation (% of live, bleached, broken coral), water pollution (BOD mg/L), number of fish species threatened with extinction, among others. Also, indicators of climate change impacts on marine ecosystems can be analysed, including average ocean temperature (°C), sea level rise (mm/year), etc.
Step 3: Analyse more fully the underlying causes of the issue of concern. The underlying causes of declining fish production can be further explored with the help of causal maps, which would include climate change impacts on ocean water temperature (°C) and possible relative changes in migratory patterns, intensive fishing practices (e.g., leading to overfishing and destruction of marine habitats), impacts of tourism activities on water pollution from waste (BOD mg/L) and coral reef deterioration (% of damaged coral cover), and limited extension of marine protected areas (ha).
Step 4: Analyse more fully how the issue impacts society, the economy and the environment. Once key environmental and other causes of the observed problem have been analysed, the multiple impacts of reduced fish catch can be measured. In particular, the depletion of fish stocks is likely to have negative impacts on the national economy, which can be quantified through fisheries value added (US$/year); social impacts include a reduction of direct and indirect employment (number of jobs/year), as well as reduced food security (% of food insecure people); finally, the progressive decline of fish stocks might encourage companies to further increase their fishing effort (Catch per Unit of Fishing Effort, CPUE), in turn leading to water pollution and further overfishing.
3. Policy formulation
Step 1: Identify desired outcomes: define policy objectives. The overall objective of the policy intervention would be to achieve sustainable levels of catch in order to allow fish stocks to regenerate. Specific targets could be set to facilitate the monitoring of policy results. The same indicators used in the issue identification phase can be used to quantify the expected outcomes of the policy intervention within a given time frame. Targets in this specific context could refer directly to the observed problem (e.g., % increase in fish catch, % increase in fisheries GDP, stock value, average weight of fish caught) or to the causes of the problem itself (e.g., % expansion of marine protected areas, % regeneration of damaged coral reef).
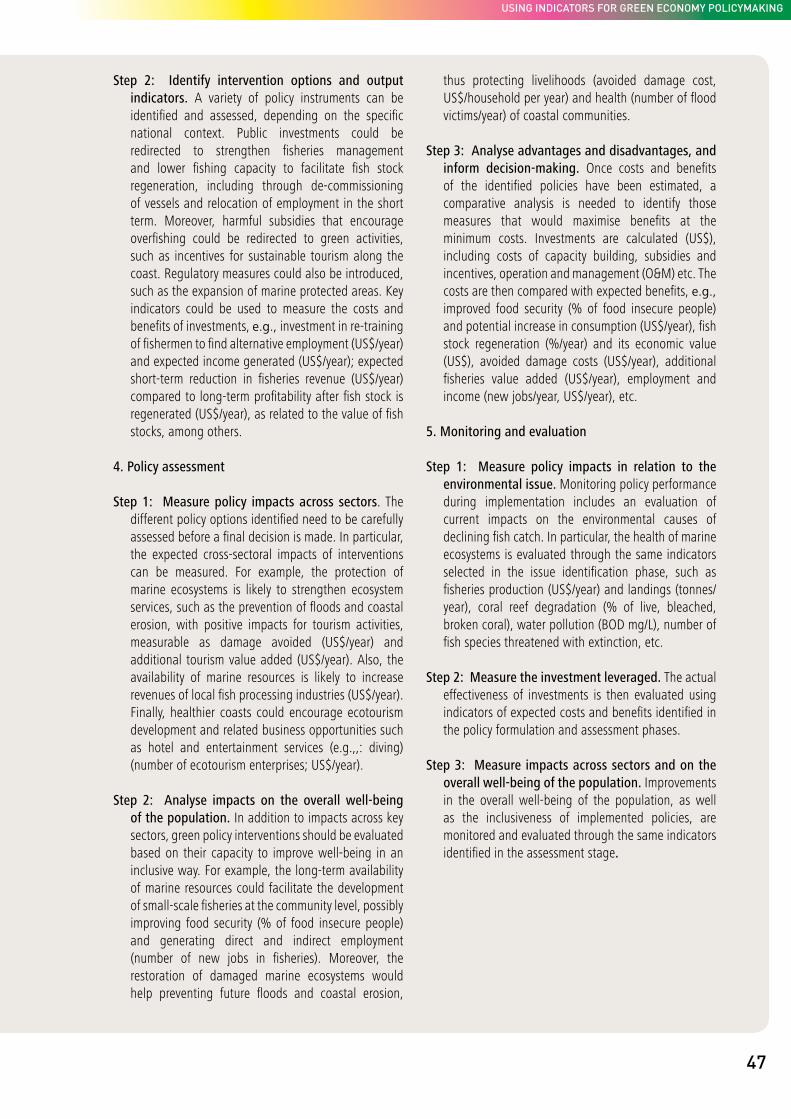
47
using indicators for green economy policymaking
Step 2: Identify intervention options and output indicators. A variety of policy instruments can be identified and assessed, depending on the specific national context. Public investments could be redirected to strengthen fisheries management and lower fishing capacity to facilitate fish stock regeneration, including through de-commissioning of vessels and relocation of employment in the short term. Moreover, harmful subsidies that encourage overfishing could be redirected to green activities, such as incentives for sustainable tourism along the coast. Regulatory measures could also be introduced, such as the expansion of marine protected areas. Key indicators could be used to measure the costs and benefits of investments, e.g., investment in re-training of fishermen to find alternative employment (US$/year) and expected income generated (US$/year); expected short-term reduction in fisheries revenue (US$/year) compared to long-term profitability after fish stock is regenerated (US$/year), as related to the value of fish stocks, among others.
4. Policy assessment
Step 1: Measure policy impacts across sectors. The different policy options identified need to be carefully assessed before a final decision is made. In particular, the expected cross-sectoral impacts of interventions can be measured. For example, the protection of marine ecosystems is likely to strengthen ecosystem services, such as the prevention of floods and coastal erosion, with positive impacts for tourism activities, measurable as damage avoided (US$/year) and additional tourism value added (US$/year). Also, the availability of marine resources is likely to increase revenues of local fish processing industries (US$/year). Finally, healthier coasts could encourage ecotourism development and related business opportunities such as hotel and entertainment services (e.g.,,: diving) (number of ecotourism enterprises; US$/year).
Step 2: Analyse impacts on the overall well-being of the population. In addition to impacts across key sectors, green policy interventions should be evaluated based on their capacity to improve well-being in an inclusive way. For example, the long-term availability of marine resources could facilitate the development of small-scale fisheries at the community level, possibly improving food security (% of food insecure people) and generating direct and indirect employment (number of new jobs in fisheries). Moreover, the restoration of damaged marine ecosystems would help preventing future floods and coastal erosion,
thus protecting livelihoods (avoided damage cost, US$/household per year) and health (number of flood victims/year) of coastal communities.
Step 3: Analyse advantages and disadvantages, and inform decision-making. Once costs and benefits of the identified policies have been estimated, a comparative analysis is needed to identify those measures that would maximise benefits at the minimum costs. Investments are calculated (US$), including costs of capacity building, subsidies and incentives, operation and management (O&M) etc. The costs are then compared with expected benefits, e.g., improved food security (% of food insecure people) and potential increase in consumption (US$/year), fish stock regeneration (%/year) and its economic value (US$), avoided damage costs (US$/year), additional fisheries value added (US$/year), employment and income (new jobs/year, US$/year), etc.
5. Monitoring and evaluation
Step 1: Measure policy impacts in relation to the environmental issue. Monitoring policy performance during implementation includes an evaluation of current impacts on the environmental causes of declining fish catch. In particular, the health of marine ecosystems is evaluated through the same indicators selected in the issue identification phase, such as fisheries production (US$/year) and landings (tonnes/year), coral reef degradation (% of live, bleached, broken coral), water pollution (BOD mg/L), number of fish species threatened with extinction, etc.
Step 2: Measure the investment leveraged. The actual effectiveness of investments is then evaluated using indicators of expected costs and benefits identified in the policy formulation and assessment phases.
Step 3: Measure impacts across sectors and on the overall well-being of the population. Improvements in the overall well-being of the population, as well as the inclusiveness of implemented policies, are monitored and evaluated through the same indicators identified in the assessment stage.

48
box 21 – low-lyIng coastal mIddle Income countRy wIth RapId IndustRIalIsatIon and uRbanIsatIon, and RelatIvely advanced demogRaphIc tRansItIon.
Middle-income countries that are rapidly transitioning to an indus-trialised and service economy can experience various environmental challenges that could undermine their development. In particular, if the industrialisation process is achieved at the expense of the environment, side effects are likely to emerge. Examples include:
• Increasing pollution from indus-trial processes could lead to public health problems, in turn requiring higher public expendi-ture (e.g., for water purification, sanitary assistance).
• Unplanned urbanisation, coupled with rapid indus-trial growth, could lead to an increase in the average price of basic services in urban settings, and consequently to an increase in the number of low-income families in urban areas.
• Intensive exploitation of natural resources for industrial purposes might result in a rapid degrada-tion of ecosystems, leading to an increase in public expenditure to cover replacement costs of envi-ronmental goods and ecosystem services.
Sample indicators are provided below for each step of the poli-cymaking process to address the problem of increasing pollution and growing cost of living.
2. Issue identification
Step 1. Identify potentially worrying trends. Different indicators can
be monitored to identify worrying trends related to unsustainable industrial expansion. Key indica-tors include, among others, the cost of basic services, e.g., water price (US$/L), electricity price (US$/Kwh), air pollution (ppm), water pollution (BOD mg/L), public expenditure for water purification (US$/year), CO
2 emission levels (Kt
of CO2 equivalent), diseases from
air and water pollution (number of respiratory diseases/year; number of diseases related to water pollu-tion/year), urban poor (% of urban poor population), etc.
Step 2: Assess the issue and its rela-tion to the natural environment. A more in-depth analysis should focus on the relation between the problem and environmental trends. For example, indicators of pollu-tion can be compared with the number of hospitalised people due to water and air pollution diseases. Also, indicators of availability and use of natural resources could be analysed in order to understand the level of environmental stress, e.g., fossil fuel consumption (Btu/year), forest land cover (ha).
Step 3: Analyse more fully the underlying causes of the issue of concern. Increasing pollution and growing costs of living might be determined by, among others, fossil fuel consumption (KWh/year), resource intensive industrial production processes (e.g., Btu/US$, and the use of chemicals), as well as demographic pressure (% of urban population). Industrial
and municipal pollution, if not treated can also be an important cause of water contamination among others.
Step 4. Analyse more fully how the issue impacts society, the economy and the environ-ment. Once the main causes of the problem, and their respective weightings, have been identified and analysed with the help of the causal map, attention should be paid to economic, social and envi-ronmental impacts of pollution and increasing costs of basic services. Relevant indicators include, among others: contribution of the manufacturing sector to GDP (US$/year), access to basic services in urban settings (%), subsidies to the urban poor (US$/year), inci-dence of pollution-related diseases (number of hospitalised people/year).
3. Policy formulation
Step 1: Identify desired outcomes: define policy objectives. The main objective of green economy policy interventions is to ensure long-term economic development while minimising social and envi-ronmental impacts of industriali-sation and urbanisation. Specific targets can be set to measure progress towards the achieve-ment of policy objectives within a given time frame. These may include, for example: emission reduction targets (% reduction in CO2
emissions), energy efficiency targets for industries and buildings

49
using indicators for green economy policymaking
(% increase in energy efficiency), waste collection, potential recycle and reuse targets, increase in access to basic social services, etc.
Step 2: Identify intervention options and output indicators. Decision makers can assess a number of different instruments that can create the enabling conditions for a shift to more sustainable industrial and urban develop-ment. These include, mong others, incentives for life-cycle approaches that enable dematerialisation and expanded service systems; incen-tives for the purchase of energy efficient technology and the adop-tion of less resource-intensive industrial processes; investments in public transport infrastructure; investments in monitoring and metering devices that provide real time information on resource use; and introduction of stricter indus-trial pollution regulations and standards. Output indicators can be used to measure the adequacy of policy options with respect to expected outcomes. Indicators may include, for example: invest-ment and avoided costs deriving from energy efficiency incen-tives (US$/year), investment and reduced emissions deriving from public transport infrastructure (US$/year; % CO
2 equivalent) etc.
4. Policy assessment
Step 1: Measure policy impacts across sectors. Greening the manufacturing sector and investing in more sustainable cities is likely to have positive impacts across key sectors. For example, water and energy savings in indus-trial processes would increase resource availability for the devel-opment of other sectors, e.g.,
allowing an increase in irrigated agriculture land (ha), or potentially lowering prices for municipal water consumption. In general, efficient energy use in industrial produc-tion might reduce the vulnerability of the sector to external (and internal) shocks, and its reliance on volatile energy sources. Also, reduced pollution and improved environmental quality are factors that could positively impact on the tourism attractiveness of the country, thereby improving annual revenues from tourism activities (US$/year).
Step 2: Analyse impacts on the overall well-being of the popu-lation. Indicators can be used to evaluate the expected impact of green policies on well-being. In particular, measures to reduce pollution are expected to positively impact on health (number of water and air pollution related diseases/year). Moreover, incentives and investments in resource efficient industrial production are likely to increase resource availability and reduce the price of basic services, with a possible reduction in the number of urban poor (% of urban poor). Also, increased productivity of the industrial sector would likely generate employment (number of new jobs in green manufacturing).
Step 3: Analyse advantages and disadvantages, and inform deci-sion-making. A final comparison between costs and benefits of different policy options can guide policymakers towards the most effective solutions to the problem identified. Total investments (USUS$) would include incentives, subsidies, capital investments, capacity building, research and development etc. The benefits of
different policy options should include avoided water purifica-tion expenditure, lowered energy imports, expected income genera-tion (US$/year) also through a reduction in work days lost due to illness, increase in GDP (US$/year), and also environmental and social benefits, such as reduced emis-sions (Kt of CO
2 equivalent) and
related health problems (number of pollution-related diseases), reduced price of basic services (%) etc.
5. Monitoring and evaluation
Step 1: Measure policy impacts in relation to the environmental issue. The actual impact of the policy should be monitored after implementation. Indicators of envi-ronmental trends, such as carbon emissions (Kt of CO
2 equivalent),
pollution indices, availability of natural resources, should be moni-tored to measure policy effects on sustainable growth.
Step 2: Measure the investment leveraged. Expected costs and benefits, identified in the policy formulation and assessment phases, should be compared with the actual results obtained during implementation.
Step 3: Measure impacts across sectors and on the overall well-being of the population. The actual positive effects on the performance of key sectors need to be evaluated using the same indicators of the policy assessment phase. Similarly, the advancements in well-being and the level of inclu-siveness of green policies should be constantly monitored, using the indicators selected during policy assessment.
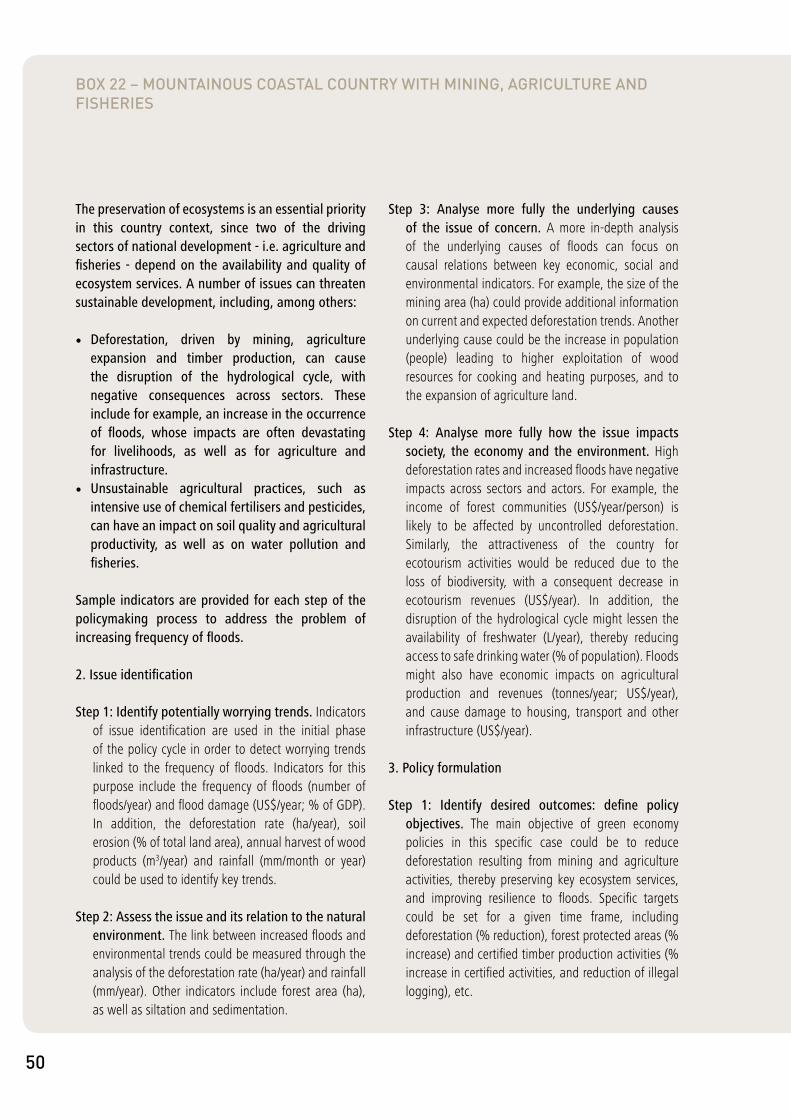
50
box 22 – mountaInous coastal countRy wIth mInIng, agRIcultuRe and fIsheRIes
The preservation of ecosystems is an essential priority in this country context, since two of the driving sectors of national development - i.e. agriculture and fisheries - depend on the availability and quality of ecosystem services. A number of issues can threaten sustainable development, including, among others:
• Deforestation, driven by mining, agriculture expansion and timber production, can cause the disruption of the hydrological cycle, with negative consequences across sectors. These include for example, an increase in the occurrence of floods, whose impacts are often devastating for livelihoods, as well as for agriculture and infrastructure.
• Unsustainable agricultural practices, such as intensive use of chemical fertilisers and pesticides, can have an impact on soil quality and agricultural productivity, as well as on water pollution and fisheries.
Sample indicators are provided for each step of the policymaking process to address the problem of increasing frequency of floods.
2. Issue identification
Step 1: Identify potentially worrying trends. Indicators of issue identification are used in the initial phase of the policy cycle in order to detect worrying trends linked to the frequency of floods. Indicators for this purpose include the frequency of floods (number of floods/year) and flood damage (US$/year; % of GDP). In addition, the deforestation rate (ha/year), soil erosion (% of total land area), annual harvest of wood products (m3/year) and rainfall (mm/month or year) could be used to identify key trends.
Step 2: Assess the issue and its relation to the natural environment. The link between increased floods and environmental trends could be measured through the analysis of the deforestation rate (ha/year) and rainfall (mm/year). Other indicators include forest area (ha), as well as siltation and sedimentation.
Step 3: Analyse more fully the underlying causes of the issue of concern. A more in-depth analysis of the underlying causes of floods can focus on causal relations between key economic, social and environmental indicators. For example, the size of the mining area (ha) could provide additional information on current and expected deforestation trends. Another underlying cause could be the increase in population (people) leading to higher exploitation of wood resources for cooking and heating purposes, and to the expansion of agriculture land.
Step 4: Analyse more fully how the issue impacts society, the economy and the environment. High deforestation rates and increased floods have negative impacts across sectors and actors. For example, the income of forest communities (US$/year/person) is likely to be affected by uncontrolled deforestation. Similarly, the attractiveness of the country for ecotourism activities would be reduced due to the loss of biodiversity, with a consequent decrease in ecotourism revenues (US$/year). In addition, the disruption of the hydrological cycle might lessen the availability of freshwater (L/year), thereby reducing access to safe drinking water (% of population). Floods might also have economic impacts on agricultural production and revenues (tonnes/year; US$/year), and cause damage to housing, transport and other infrastructure (US$/year).
3. Policy formulation
Step 1: Identify desired outcomes: define policy objectives. The main objective of green economy policies in this specific case could be to reduce deforestation resulting from mining and agriculture activities, thereby preserving key ecosystem services, and improving resilience to floods. Specific targets could be set for a given time frame, including deforestation (% reduction), forest protected areas (% increase) and certified timber production activities (% increase in certified activities, and reduction of illegal logging), etc.

51
using indicators for green economy policymaking
Step 2: Identify intervention options and output indicators. A variety of policy interventions can be analysed and combined to tackle the problem of unsustainable deforestation and increasing floods. Examples of possible options are, among others: investments and regulations for the expansion of forest protected areas in order to limit harmful land-use practices; improved forest management certification; payments for ecosystem services (PES) schemes; investments in planted forests, primary forests, natural modified forests; incentives for the development of agroforestry. Output indicators could be used to measure the expected costs and benefits of interventions, such as payments for ecosystem services (US$/year and/or US$/ha), investments in afforestation and reforestation initiatives (US$/ha/year), incentives for agroforestry development (US$/ha/year).
4. Policy assessment
Step 1: Measure policy impacts across sectors. Impacts of reduced deforestation can be measured in terms of improved ecosystem services and reduced frequency of floods, but also in relation to other key sectors. For example, reduced sedimentation might improve the navigability of rivers, thereby increasing revenues from river transport activities (US$/year). Agricultural revenues (US$/year) might, in general, benefit from reduced deforestation (i.e. due to reduced soil erosion and floods), and also from the expansion of agroforestry activities. In addition, the improvement of environmental quality and biodiversity in forest ecosystems might lead to an increase in forest ecotourism revenues (US$/year). Furthermore, there is potential for revenues derived from the carbon market (US$/year) which could be used to support the green economy transition of other sectors, on top of providing incentives for natural resource conservation.
Step 2: Analyse impacts on the overall well-being of the population. Reduced frequency of floods is likely to have a direct impact on the well-being of the local population, both in terms of avoided re-building, or relief costs (US$/year) and reduced deaths and injuries (number of deaths attributed to floods/year). Also, the possible loss of employment in the mining and logging sectors (if constrained in its development) might be more than compensated by new employment (number of new jobs /year) in other expanding sectors, such as ecotourism and agroforestry.
Step 3: Analyse advantages and disadvantages, and inform decision-making. An evaluation of advantages and disadvantages of the selected policy options would imply the comparison of investment (US$) - including subsidies, capacity building, operation and management costs - and expected benefits, in the form of income generation for forest and rural communities (US$/year), avoided flood damage costs (US$/year), as well as the value of natural resource stocks.
5. Monitoring and evaluation
Step 1: Measure policy impacts in relation to the environmental issue. Once the strategy has been drafted and implemented, the expected effects of policy interventions on deforestation rates and ecosystem preservation need to be monitored and evaluated. Indicators of issue identification, in particular target indicators, can be used to verify the effectiveness of policy instruments.
Step 2: Measure the investment leveraged. The actual benefits deriving from targeted investments need to be verified by comparing expected and current results through indicators of policy formulation and assessment.
Step 3: Measure impacts across sectors and on the overall well-being of the population. The well-being of the population is expected to improve thanks to reduced negative impacts on health and income from uncontrolled deforestation and increased floods. In the monitoring and evaluation phase, the actual impacts need to be confronted with ex ante assessments, in order to detect potential early warning signs and gaps in policy implementation.

52
box 23 – developed countRy wIth lImIted natuRal ResouRces but hIgh potentIal (and fInancIal ResouRces) foR effIcIency ImpRovement.
Developed countries make use of capital, advanced technology and knowledge to foster economic growth. In this specific country context, the limited availability of natural resources requires investments in resource efficiency to maximise the productivity of key economic sectors. Examples of problems that might arise in relation to resource constraints include, among others:
• Excessive dependency on fossil fuel imports, possibly sustained by harmful subsidies, can limit the exploitation of renewable energy sources, thereby increasing the vulnerability to fossil fuel price variability.
• Intensive use of fossil fuels in key sectors, such as transport and manufacturing, leads to an increase in greenhouse gas emissions, in turn contributing to global warming and pollution, with consequences for health and environmental quality.
Sample indicators are suggested for each step of the policymaking process to address the problem of rising energy costs, with negative impacts on competitiveness.
2. Issue identification
Step 1: Identify potentially worrying trends. Indicators of issue identification include, among others, energy demand and supply (Mtoe/year), energy productivity (Btu/US$) and energy price and cost (US$/Btu).
Step 2: Assess the issue and its relation to the natural environment. There is a strong relationship between the intensity in fossil fuel use and impacts on environmental quality. These can be analysed through air pollution (ppm), CO
2 emissions (Kt of
CO2 equivalent), , all being related to unsustainable
production and consumption.
Step 3: Analyse more fully the underlying causes of the issue of concern. A reduction in the competitiveness of national industries due to increasing energy costs
can be traced back to several concurring causes, which should be mapped and carefully analysed. These include, among others, energy prices (US$/Btu), energy intensity (Btu/tonne, or Btu/US$) as well as the existence of fossil fuel subsidies and taxation (USUS$ or % of GDP) and the reliance on imports, or fossil fuel dependency (%).
Step 4: Analyse more fully how the issue impacts society, the economy and the environment. High energy prices can have a negative influence on economic, social and environmental indicators. Indeed, the performance of key economic sectors is highly dependent on energy prices (their absolute value and relative change over time). This relation can be assessed, for example, by comparing the energy bill (USUS$/year) of selected sectors and their contribution to GDP (US$/year). Energy prices also have a direct impact on households through an increase in the price of basic services and inflation, e.g., electricity (US$/Kwh), as well as food prices, which will affect consumption and private investment (US$/year). Finally, environmental impacts can be measured by analysing, for example, pollution indices and CO
2
emission (Kt of CO2 equivalent).
3. Policy formulation
Step 1: Identify desired outcomes: define policy objectives. One major goal of green economy policy interventions is to maximise energy efficiency in production processes, while stimulating the growth of the renewable energy sector, and progressively loosening the dependence on carbon-intensive energy resources. Specific targets could be set to foster the achievement of stated objectives within a given time frame, including targets for renewable energy power generation (% of power generation), energy efficiency (% efficiency increase), CO
2 emission reduction (%
decrease in Kt of CO2 equivalent).
Step 2: Identify intervention options and output indicators. A successful combination of energy

53
using indicators for green economy policymaking
policies can be explored, with the help of relevant output indicators to estimate the feasibility of each option. Examples of interventions are: upfront investments in renewable energy infrastructure, phasing out of fossil fuel subsidies and introduction of carbon taxes; incentives for the purchase of energy efficient technologies in households and industrial processes; feed-in tariffs, direct subsidies and tax credits for private companies interested in renewable energy investments; investments in public transport infrastructure. Relevant indicators that can be used in this phase are, for example, renewable energy feed-in tariffs (US$/MWh); investments in renewable energy infrastructure (USUS$ or % of GDP); avoided costs of fossil fuel subsidies (US$/year); avoided costs from energy consumption and losses (US$/year); expected increase in energy supply (Btu/year; %); cost of capacity building, institutional capacity, research and development (US$ or % of GDP).
4. Policy assessment
Step 1: Measure policy impacts across sectors. Reductions in the energy bill and improvements in efficiency are likely to influence the performance of key economic sectors, possibly leading to higher productivity and competitiveness, leading to higher revenues (US$/year) and lower costs, thus improving profitability and GDP (US$/year), among others.
Step 2: Analyse impacts on the overall well-being of the population. Energy efficiency and renewable energy policies could reduce production costs in key sectors, with positive impacts on prices and overall cost of living. Moreover, since the renewable energy sector is labour intensive, impacts can be measured on employment generation (number of new jobs in renewable energy), taking into account possible negative effects in fossil fuel-related sectors. In addition, impacts of reduced use of fossil fuels on health can be assessed through indicators of air pollution-related diseases (number of people hospitalised due to respiratory diseases). Finally, the reduction in CO
2
emissions would more generally contribute to mitigate the negative effects of climate change on livelihoods, resource availability and health.
Step 3: Analyse advantages and disadvantages, and inform decision-making. Costs and benefits
of green energy policies could be measured through the analysis of investments (USUS$), taking into account incentives, upfront capital expenditure on infrastructure, capacity building, operation and management as well as research and development. These can be then compared with expected benefits for the economy, society and the environment. Indicators would include reduced energy costs (US$/year), increased competitiveness (GDP growth), income generated from new employment opportunities (US$/year) as well as avoided health costs (US$/year).
4. Monitoring and evaluation
Step 1: Measure policy impacts in relation to the environmental issue. The monitoring and evaluation phase should start immediately after the implementation of the policy package. First of all, the environmental impact of the interventions should be measured, focusing in particular on energy consumption and CO
2 emissions and pollution.
Step 2: Measure the investment leveraged. At the same time, the effectiveness of implemented policies needs to be evaluated by comparing indicators of expected costs and benefits (i.e. policy formulation and policy assessment indicators) with actual results.
Step 3: Measure impacts across sectors and on the overall well-being of the population. The actual improvement of the overall well-being of the population is measured using indicators of policy assessments, with particular consideration for the distributional and inclusive character of the implemented policies.

54
Table 6. Land-locked dry- and sub-humid country with dominant agriculture and in early phases of demographic transition and urbanisation. Key steps and sample indicators for policymaking to address the problem of decreasing agricultural production
Stages Steps Indicator samples
Issue identification
1. Identify potentially worrying trends • Agriculture production (tonnes/year)• Dietary energy supply (Kcal/day per person)• Crop yield (tonnes/ha)
2. Assess the issue and its relation to the natural environment
• Rainfall (mm/year)• Droughts (n. of droughts/year)• Soil erosion (% of total agriculture land)
3. Analyse more fully the underlying causes of the issue of concern
• Population (people)• Use of chemical fertilisers and pesticides
(tonnes/ha)• Water consumption (L/year)
4. Analyse more fully how the issue impacts society, the economy and the environment
• Agriculture GDP (US$/year)• Employment (people)• Access to potable water and sanitation (%)
Policy formulation
1. Identify desired outcomes: define policy objectives
• Increased nutrition levels (e.g. 2000 kcal/day per person)
• Increased agriculture production and productivity (tonnes/year, tonnes/ha)
• Higher water productivity in agriculture (L/tonne)
2. Identify intervention options and output indicators
• Organic fertilisers: incentive and use (US$/year, ha)
• Water efficiency: investment and productivity (US$/ha/year, tonnes/L)
• Training: support to public outreach (people, US$/person/year)
Policy assessment
1. Estimate policy impacts across sectors • Revenue creation for food processing industries (US$/year)
• Water savings due to micro-irrigation (L/year)• Increased water availability for hydropower
(KWh/year)
2. Analyse impacts on the overall well-being of the population
• Employment and income generation (people/year, US$/year)
• Malnutrition (people hospitalised/year)• Newborn health (% of newborns with low birth
weight)
3. Analyse advantages and disadvantages and inform decision-making
• Cost of interventions: material inputs and training (US$/year, % of GDP)
• Additional GDP and income created (US$/year)• Avoided food imports (US$/year or % change)
Policy monitoring and evaluation
1. Measure policy impacts in relation to the environmental issue
• Water intensity in agriculture (L/tonne)• Use of chemical fertilisers and pesticides
(tonnes/ha)• Soil erosion (% of agriculture land)
2. Measure the investment leveraged • Cost of interventions: material inputs and training (US$/year, % of GDP)
• Training: support to public outreach (people, US$/person/year)
• Organic fertilisers: investment and productivity (US$/ha/year, tonnes/ha)
3. Measure impacts across sectors and on the overall well-being of the population
• Employment and income generation (people/year, US$/year)
• Malnutrition (people hospitalised/year)• Newborn health (% of newborns with low birth
weight)

55
using indicators for green economy policymaking
Table 7. Tropical or sub-tropical small island developing state with dominant industries being tourism and fisheries. Key steps and sample indicators for policymaking to address the problem of decreasing fish catch
Stages Steps Indicator samples
Issue identification
1. Identify potentially worrying trends • Fish production (tonnes/year)• Fish stock (tonnes)• Average nutrition level (Kcal/day per
person)
2. Assess the issue and its relation to the natural environment
• Coral reef degradation (% of total reef)• Average ocean temperature (°C)• Sea level rise (mm/year)
3. Analyse more fully the underlying causes of the issue of concern
• Fishing effort (vessels)• Water pollution (BOD mg/L)• Marine conservation areas (ha)
4. Analyse more fully how the issue impacts society, the economy and the environment
• Fisheries GDP (US$/year)• Food security (% of food insecure
population)• Depletion of fish stock (%)
Policy formulation
1. Identify desired outcomes: define policy objectives
• Fish catch (% increase)• Marine conservation areas (% increase)• Coral reef regeneration (% of regenerated
reef)
2. Identify intervention options and output indicators
• Investment in re-training of fishers (US$/year)
• Establishment of marine protected areas (enforcement cost per ha)
• Reduction in vessel stock (US$/year)
Policy assessment
1. Estimate policy impacts across sectors • Ecotourism revenues (US$/year)• Revenues of fish processing industries
(US$/year)• Avoided costs of flood damage to
infrastructure (US$/year)
2. Analyse impacts on the overall well-being of the population
• Food security (% of food insecure population)
• Employment (people/year)• Income generation (US$/year)
3. Analyse advantages and disadvantages and inform decision-making
• Total costs of interventions (US$/year)• Fish stock regeneration (% of previous
year’s stock, US$)• Income generation for fishing communities
(US$/year per capita)
Policy monitoring and evaluation
1. Measure policy impacts in relation to the environmental issue
• Coral reef degradation (% of degraded reef)• Fish stock regeneration (% of previous
year’s stock)• Water pollution (BOD mg/L)
2. Measure the investment leveraged • Total costs of interventions (US$/year)• Fisheries GDP (US$/year)• Fish catch (tonnes/year)
3. Measure impacts across sectors and on the overall well-being of the population
• Food security (% of food insecure population)
• Revenues of fish processing industries (US$/year)
• Employment and income generation, e.g. in fisheries (people/year, US$/year)

56
Table 8. Low-lying coastal middle income country with rapid industrialisation and urbanisation, and relatively advanced demographic transition. Key steps and sample indicators for policymaking to address the problem of increasing pollution and growing cost of living
Stages Steps Indicator samples
Issue identification 1. Identify potentially worrying trends • Air pollution (ppm)• Water pollution (BOD mg/L)• Electricity price (US$/KWh)
2. Assess the issue and its relation to the natural environment
• Fossil fuel reserves (Btu)• Consumption of fossil fuels (Btu/year)• Forest land cover (ha)
3. Analyse more fully the underlying causes of the issue of concern
• Population (people)• Urbanisation (% of urban population)• Energy intensity in manufacturing (Btu/US$)
4. Analyse more fully how the issue impacts society, the economy and the environment
• Manufacturing GDP (US$/year or %)• Access to basic services in urban settings
(%)• Waste generation (tonnes/year)
Policy formulation 1. Identify desired outcomes: define policy objectives
• Carbon emissions (% reduction in CO2 emissions)
• Waste collection, recycle and reuse (tonnes/year, %)
• Access to basic services (% increase)
2. Identify intervention options and output indicators
• Subsidies: energy efficiency improvement (US$/year, %/year)
• Investment: public transport infrastructure (US$/year, % of travel)
• Incentive: waste collection, recycle and reuse (US$/year, tonnes/year)
Policy assessment 1. Estimate policy impacts across sectors • Manufacturing value added (US$/year)• Avoided cost for fossil fuel and water
purification (US$/year)• Water stress and access to sanitation (%)
2. Analyse impacts on the overall well-being of the population
• Health (number of water and air pollution related diseases/year)
• Employment (number of new jobs in green manufacturing)
• Urban poor (% of population)
3. Analyse advantages and disadvantages and inform decision-making
• Total investments, i.e. incentives, infrastructure, capacity building (US$/year)
• Manufacturing GDP (US$/year or %)• Reduction in water and electricity prices
(%)
Policy monitoring and evaluation
1. Measure policy impacts in relation to the environmental issue
• Carbon emissions (% reduction in CO2 emissions)
• Water pollution (BOD mg/L)• Energy bill (US$/year)
2. Measure the investment leveraged • Total costs of interventions (US$/year)• Manufacturing GDP (US$/year)• Energy and water intensity in
manufacturing (Btu/US$)
3. Measure impacts across sectors and on the overall well-being of the population
• Health (number of water and air pollution-related diseases/year)
• Employment (number of new jobs in green manufacturing)
• Urban poor (% of population)

57
using indicators for green economy policymaking
Table 9. Mountainous coastal country with mining, agriculture, and fisheries. Key steps and sample indicators for policymaking to address the problem of increasing frequency of floods
Stages Steps Indicator samples
Issue identification
1. Identify potentially worrying trends • Flood frequency (number of floods/year) • Deforestation (ha/year)• Annual harvest of wood products (m3/year)
2. Assess the issue and its relation to the natural environment
• Forest land cover (ha)• Rainfall (mm/year)• Degraded forest land (ha or % of forest land)
3. Analyse more fully the underlying causes of the issue of concern
• Agriculture land (ha)• Population (people)
4. Analyse more fully how the issue impacts society, the economy and the environment
• Income of forest communities (US$/year per capita)
• Freshwater supply (L/year)• Ecotourism (n. of visits/year; US$/year; % of
GDP)
Policy formulation
1. Identify desired outcomes: define policy objectives
• Reduced deforestation (e.g. 50% reduction by 2030)
• Forest protected area (ha)• Certified timber production (US$/year; ha)
2. Identify intervention options and output indicators
• PES: funding transferred (US$/year and/or US$/ha)
• Agroforestry development: investment per ha (US$/ha/year)
• Timber certification: activities certified (#/year and output)
Policy assessment
1. Estimate policy impacts across sectors • River use for transport activities (days/year and US$/year)
• Value of natural resource stock and ecosystem services (US$ and US$/year)
• Revenues derived from the carbon market (US$/year)
2. Analyse impacts on the overall well-being of the population
• Employment, e.g. in sustainable forest management (number of jobs/year)
• Deaths from landslides and floods (deaths /year)
• Income generation from ecotourism (US$/year)
3. Analyse advantages and disadvantages and inform decision-making
• Cost of reforestation (US$/ha)• GEF benefits index for biodiversity• Income creation for rural communities (US$/
year)• Deforestation (ha/year)
Policy monitoring and evaluation
1. Measure policy impacts in relation to the environmental issue
• Forest cover (ha)• Flood frequency (number of floods/year)
2. Measure the investment leveraged • Total investment, i.e. capital investments, incentives, O&M etc. (US$/year)
• Reduced flood risk (US$/year; % of GDP)• Revenues from ecotourism and river transport
(US$/year)
3. Measure impacts across sectors and on the overall well-being of the population
• Employment, e.g. in sustainable forest management (number of jobs/year)
• Deaths from landslides and floods (deaths /year)
• Income generation from ecotourism and ecosystem goods (US$/year)

58
Table 10. Developed country with limited natural resources but high potential (and financial resources) for efficiency improvement. Key steps and sample indicators for policymaking to address the problem of rising energy costs, with negative impacts on investments and competitiveness
Stages Steps Indicator samples
Issue identification
1. Identify potentially worrying trends • CO2 emissions (Kt of CO
2 equivalent)
• Fossil fuel consumption (Mbtu/year, US$/year or % of GDP)
• Energy productivity (Btu/US$)
2. Assess the issue and its relation to the natural environment
• Production of fossil fuels (Btu/year)• Fossil fuel resource and reserve (Btu)• Natural resource endowment (e.g., GWh from
solar and wind power)
3. Analyse more fully the underlying causes of the issue of concern
• Population (people)• Energy consumption from fossil fuels (Btu/year;
% of total)• Fossil fuel subsidies and taxation (US$/year or
% of GDP)
4. Analyse more fully how the issue impacts society, the economy and the environment
• Electricity and other energy prices (US$/Btu)• Diseases from air pollution (n. of respiratory
diseases/year)• Increase in average temperature (°C), or climate
variability
Policy formulation
1. Identify desired outcomes: define policy objectives
• Decreased CO2 emissions (Kt of CO
2 equivalent)
• Increased renewable energy production (KWh)• Lower electricity losses (% of electricity
generation)
2. Identify intervention options and output indicators
• Renewable energy: feed-in tariffs (US$/MWh)• Energy efficiency: national standards (CO
2
emission % reduction)• Public transport: ridership for the bus network
(%)
Policy assessment
1. Estimate policy impacts across sectors • Reduced cost of energy imports (US$/year)• Lowered road transport costs (US$/year)• Household consumption and savings (US$/year)
2. Analyse impacts on the overall well-being of the population
• Reduced electricity prices (US$/KWh or % reduction)
• Employment and income generation (people/year, US$/year)
• Respiratory diseases (people hospitalised/year)
3. Analyse advantages and disadvantages and inform decision-making
• Investment in renewable energy (US$/year, % of GDP)
• Competitiveness, productivity and GDP (US$/year)
• Avoided energy costs from savings (US$/year, % of GDP)
Policy monitoring and evaluation
1. Measure policy impacts in relation to the environmental issue
• CO2 emissions (Kt of CO
2 equivalent)
• Fossil fuel reserves (Btu)• Energy productivity (Btu/US$)
2. Measure the investment leveraged • Total investment, i.e. capital investments, incentives, O&M etc. (US$/year)
• Avoided energy costs from savings (US$/year, % of GDP)
• Competitiveness, productivity and GDP (US$/year)
3. Measure impacts across sectors and on the overall well-being of the population
• Employment and income generation (people/year, US$/year)
• Respiratory diseases (people hospitalised/year)• Transport fatalities (people/year)
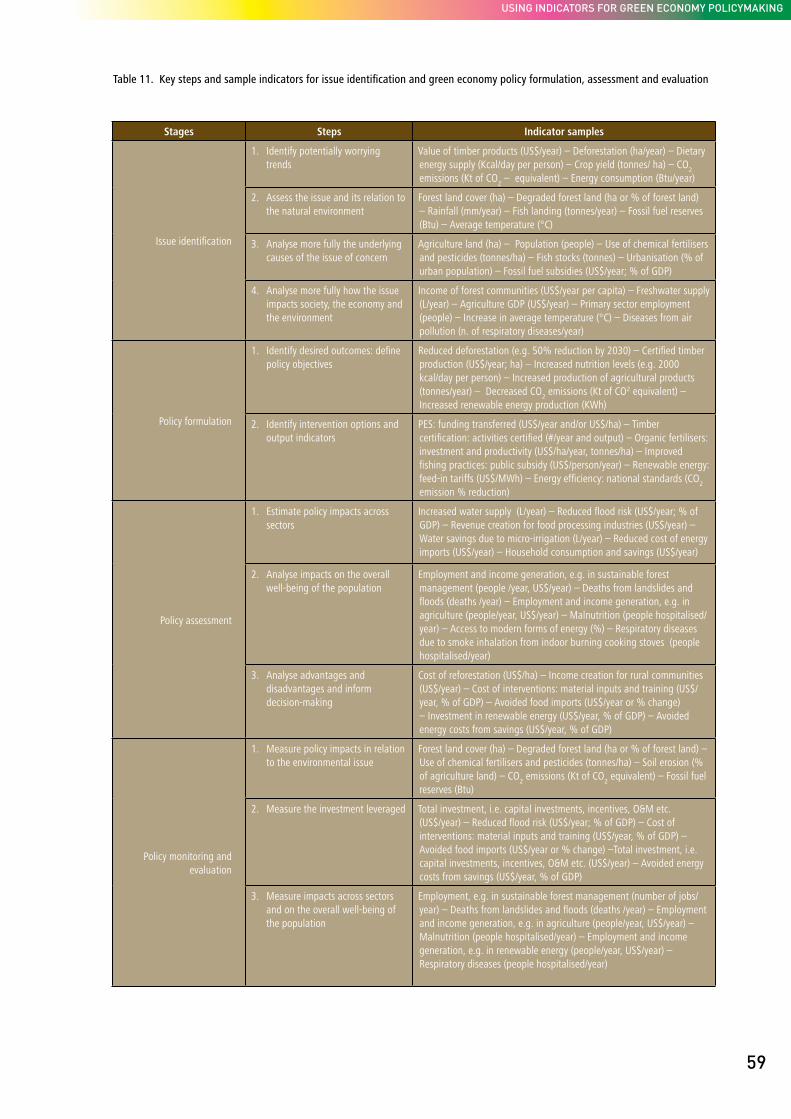
59
using indicators for green economy policymaking
Table 11. Key steps and sample indicators for issue identification and green economy policy formulation, assessment and evaluation
Stages Steps Indicator samples
Issue identification
1. Identify potentially worrying trends
Value of timber products (US$/year) – Deforestation (ha/year) – Dietary energy supply (Kcal/day per person) – Crop yield (tonnes/ ha) – CO
2
emissions (Kt of CO2 – equivalent) – Energy consumption (Btu/year)
2. Assess the issue and its relation to the natural environment
Forest land cover (ha) – Degraded forest land (ha or % of forest land) – Rainfall (mm/year) – Fish landing (tonnes/year) – Fossil fuel reserves (Btu) – Average temperature (°C)
3. Analyse more fully the underlying causes of the issue of concern
Agriculture land (ha) – Population (people) – Use of chemical fertilisers and pesticides (tonnes/ha) – Fish stocks (tonnes) – Urbanisation (% of urban population) – Fossil fuel subsidies (US$/year; % of GDP)
4. Analyse more fully how the issue impacts society, the economy and the environment
Income of forest communities (US$/year per capita) – Freshwater supply (L/year) – Agriculture GDP (US$/year) – Primary sector employment (people) – Increase in average temperature (°C) – Diseases from air pollution (n. of respiratory diseases/year)
Policy formulation
1. Identify desired outcomes: define policy objectives
Reduced deforestation (e.g. 50% reduction by 2030) – Certified timber production (US$/year; ha) – Increased nutrition levels (e.g. 2000 kcal/day per person) – Increased production of agricultural products (tonnes/year) – Decreased CO
2 emissions (Kt of CO2 equivalent) –
Increased renewable energy production (KWh)
2. Identify intervention options and output indicators
PES: funding transferred (US$/year and/or US$/ha) – Timber certification: activities certified (#/year and output) – Organic fertilisers: investment and productivity (US$/ha/year, tonnes/ha) – Improved fishing practices: public subsidy (US$/person/year) – Renewable energy: feed-in tariffs (US$/MWh) – Energy efficiency: national standards (CO
2
emission % reduction)
Policy assessment
1. Estimate policy impacts across sectors
Increased water supply (L/year) – Reduced flood risk (US$/year; % of GDP) – Revenue creation for food processing industries (US$/year) – Water savings due to micro-irrigation (L/year) – Reduced cost of energy imports (US$/year) – Household consumption and savings (US$/year)
2. Analyse impacts on the overall well-being of the population
Employment and income generation, e.g. in sustainable forest management (people /year, US$/year) – Deaths from landslides and floods (deaths /year) – Employment and income generation, e.g. in agriculture (people/year, US$/year) – Malnutrition (people hospitalised/year) – Access to modern forms of energy (%) – Respiratory diseases due to smoke inhalation from indoor burning cooking stoves (people hospitalised/year)
3. Analyse advantages and disadvantages and inform decision-making
Cost of reforestation (US$/ha) – Income creation for rural communities (US$/year) – Cost of interventions: material inputs and training (US$/year, % of GDP) – Avoided food imports (US$/year or % change) – Investment in renewable energy (US$/year, % of GDP) – Avoided energy costs from savings (US$/year, % of GDP)
Policy monitoring and evaluation
1. Measure policy impacts in relation to the environmental issue
Forest land cover (ha) – Degraded forest land (ha or % of forest land) – Use of chemical fertilisers and pesticides (tonnes/ha) – Soil erosion (% of agriculture land) – CO
2 emissions (Kt of CO
2 equivalent) – Fossil fuel
reserves (Btu)
2. Measure the investment leveraged Total investment, i.e. capital investments, incentives, O&M etc. (US$/year) – Reduced flood risk (US$/year; % of GDP) – Cost of interventions: material inputs and training (US$/year, % of GDP) – Avoided food imports (US$/year or % change) –Total investment, i.e. capital investments, incentives, O&M etc. (US$/year) – Avoided energy costs from savings (US$/year, % of GDP)
3. Measure impacts across sectors and on the overall well-being of the population
Employment, e.g. in sustainable forest management (number of jobs/year) – Deaths from landslides and floods (deaths /year) – Employment and income generation, e.g. in agriculture (people/year, US$/year) – Malnutrition (people hospitalised/year) – Employment and income generation, e.g. in renewable energy (people/year, US$/year) – Respiratory diseases (people hospitalised/year)
60
The preceding sections provided guidance on how
to use indicators in designing and implementing
green economy policies at the national level,
following a basic policymaking framework, namely,
on the use of indicators as a tool for: (i) identifying
priority issues, (ii) formulating and assessing green
economy policy options, and (iii) evaluating the
performance of policy implementation. In so doing,
the manual explicitly recognised that issues arise
in a specific geographical, socio-economic and
socio-cultural context, and focused on providing
process-oriented guidance, illustrated with
concrete examples. Given the cross-sectoral nature
of the analysis and implementation steps proposed,
the use of existing indicators across various data
sources is encouraged, as well as the involvement of
a broad set of stakeholders, to support the design
and implementation of coherent and inclusive green
economy policies.
The last point is important for another reason: by
providing guidance that is meant to be applicable
to all countries, the manual by necessity takes
a somewhat idealised perspective, mapping out
an optimal process – and the use of indicators
within – devoid of both complications, and the
resource and information constraints faced by
real-world policymakers. Note though that the
manual, to some extent, takes such constraints into
consideration by advocating an incremental, issue-
driven approach to green economy policies over the
design and implementation of comprehensive green
economy strategies. This incremental, issue-driven
approach calls for a prioritisation exercise during the
agenda-setting stage and builds on existing policy
priorities. Recall that the initial step suggested
by the manual consists of identifying potentially
worrying trends, accompanied and complemented
by an assessment of existing political commitments
enshrined in national visions, goals, development
plans and sectoral policies.
Even within this incremental approach, limitations
in data availability and quality may limit the use
of indicators. For this reason, it is all the more
important to put existing data collections to
best use, bearing in mind that these are typically
scattered across a range of government ministries or
agencies, academic and other research institutions,
and even private sector and non-governmental
organisations. Engaging these stakeholders and
forging partnerships and cooperation with these
institutions will be an important and integral part
of green economy policies, particularly as concerns
indicators.
Moreover, improving data availability and quality
will frequently be another critical element of
green economy policies, in that it will gradually
enable their enhanced fine-tuning. Work on
implementing or improving environmental
accounting, as a complement to the existing system
of national accounts, is one concrete example.
The recent adoption, by the United Nations
Statistical Commission, of the revised System of
Environmental-Economic Accounting (SEEA) as an
international standard has generated considerable
interest and political momentum among countries
towards making progress on this aspect – illustrated
by the fact that, at the date of publication of this
manual, sixty-six countries had expressed their
commitment to advance natural capital accounting
by signing the communique of the so-called 50:50
initiative of the World Bank-led partnership on
wealth accounting and the valuation of ecosystem
services (WAVES).
While the manual, throughout its suggested steps,
alludes to a broad range of existing indicators for
illustrative purposes, it does not identify a standard,
catch-all list of indicators to be used in the
policymaking process, nor does it provide a more
extensive, in-depth description of those indicators,
6 lookIng ahead

61
using indicators for green economy policymaking
including their strengths and limitations. This task is
relegated to the companion volume: the Technical
Manual for the Construction and Use of Indicators.
Finally, it is important to recall that the present
manual, by presenting one particular tool for
designing green economies, operates within a
specific overall architecture of UNEP guidance
materials on the topic. First, it needs to be read
and understood in the context provided by the
Manual on Green Economy Policy Assessments,
which provides the general framework by covering
the needs, services and tools offered by UNEP in an
introductory and non-technical manner.
Second, the present manual underlined that,
due to the cross-sectoral impacts of green policy
interventions, an integrated approach is typically
needed to design an effective green economy policy
package, and briefly pointed to the importance
of modelling. This important tool is addressed in
further detail in the manual on Using Models for
Green Economy Making. Acting as a twin manual
to the present one, it also comes in two volumes,
where general, non-technical guidance is being
complemented by a compendium Technical Manual
for the Use of Models in Specific Policy Analysis.
62
1 According to GGGI, diagnostics indicators are designed to assess the overall sustainability of the country and to
identify key issues that should be considered in the Green Growth Planning process (GGKP, 2013).
2 Triangulation consists in the evaluation of the consistence and coherence of data, across sources and sectors. Given
the cross sectoral nature of causes and effects in the context of the green economy, the trend of a social variable
may be affected by the behaviour of an environmental one, requiring data collection from different sources. Trends
for these variables should be evaluated to determine the presence of behavioural patterns that would reflect the
presence of causal relations.
3 Government of Indonesia, 2011.
4 Communication from the Commission to the European Parliament, The Council, The European Economic and Social
Committee and The Committee of the Regions. Roadmap to a Resource Efficient Europe (European Commission,
2011).
notes

63
using indicators for green economy policymaking
RefeRences
Doran, G. T. (1981). “There's a S.M.A.R.T. way to write management's goals and objectives” in Management Review 70 (11): 35-36.
European Commission (2011). Communication from the Commission to the European Parliament, The Council, The European Economic and Social Committee and The Committee of the Regions. Roadmap to a Resource Efficient Europe. Brussels, Belgium.
European Commission, Food and Agriculture Organisation of the United Nations, International Monetary Fund, Organisation for Economic Co-operation and Development, United Nations and World Bank (2012). System of Environmental-Economic Accounting. Central Framework. Brussels, Rome, Washington DC, Paris and New York: EC, FAO, IMF, OECD, UN and World Bank.
Government of Indonesia, National Development Planning Agency (2011). Acceleration and Expansion of Indonesia Economic Development Report (MP3EI). Jakarta, Indonesia.
Green Growth Knowledge Platform (GGKP) (2013). Moving Towards a Common Approach on Green Growth Indicators. A Green Growth Knowledge Platform Scoping Paper. Seoul, Paris, Nairobi and Washington DC: Global Green Growth Institute, Organisation for Economic Co-operation and Development, United Nations Environment Programme and World Bank.
Hak, T. (2011). Status report on composite indices of environmental sustainability. Prepared for UNEP.
International Institute for Sustainable Development (IISD) (2005). Sustainable Development Indicators: Proposals for the Way Forward. Winnipeg: IISD.
International Institute for Sustainable Development (IISD) (2013). Measuring Progress Towards Sustainable Development Goals. Working Paper. Winnipeg: IISD.
International Labour Organization (ILO) (2013). Sustainable Development, Decent Work and Green Jobs. Report V. International Labour Conference, 102nd Session, 2013. Geneva: ILO.
Nardo, M. and M. Sasiana (2005). Handbook on Constructing Composite Indicators: Methodology and User Guide. OECD Statistics Working Papers, 2005/03. Paris: OECD.
Organisation for Economic Co-operation and Development (OECD) (2011). Towards Green Growth: Monitoring Progress. Paris: OECD.
Pintér L., P. Hardi, A. Martinuzzi and J. Hall (2012). “Bellagio STAMP: Principles for Sustainability Assessment and Measurement” in Ecological Indicators 17: 20-28
Pintér, L., K. Zahedi and D. Cressman (2001). Capacity Building for Integrated Environmental Assessment and Reporting. Training Manual. Second edition. Winnipeg: IISD for UNEP.
Stiglitz, J.E., A. Sen and J.P. Fitoussi (2009). Report by the Commission on the Measurement of Economic Performance and Social Progress. Paris: Commission on the Measurement of Economic Performance and Social Progress.
United Nations Development Programme (UNDP) (2009). Handbook on Planning, Monitoring and Evaluating for Results. New York: UNDP.
United Nations Development Programme (UNDP) (2012). Multi-Stakeholder Decision-Making. A Guidebook for Establishing a Multi-Stakeholder Decision-Making Process to Support Green, Low-Emission and Climate-Resilient Development Strategies. New York: UNDP.
United Nations Environment Programme - World Conservation Monitoring Centre (UNEP-WCMC) (2011). Developing Ecosystem Service Indicators: Experiences and Lessons Learned from Sub-global Assessments and other Initiatives. Technical Series No. 58. Montreal: Secretariat of the Convention on Biological Diversity.
United Nations Environment Programme (UNEP) (2008). SCP Indicators for Developing Countries. A Guidance Framework. Paris: UNEP.
United Nations Environment Programme (UNEP) (2009). Integrated Policymaking for Sustainable Development. A reference manual. Geneva: UNEP.
United Nations Environment Programme (UNEP) (2010b). A Flexible Framework for addressing Chemical Accident Prevention and Preparedness: A Guidance Document. Paris: UNEP.
United Nations Environment Programme (UNEP) (2011a). Towards a Green Economy: Pathways to Sustainable Development and Poverty Eradication. Nairobi: UNEP.
United Nations Environment Programme (UNEP) (2012a). Measuring Progress Towards an Inclusive Green Economy. Paris: UNEP.
United Nations Environment Programme (UNEP) (2012b). A Flexible Framework for Addressing Chemical Accident Prevention and Preparedness: An Implementation Support Package. Paris: UNEP.
United Nations Environment Programme (UNEP) (2013). Metal Recycling: Opportunities, Limits, Infrastructure. Paris: UNEP.
United Nations Statistics Division (2003). Handbook of Integrated Environmental and Economic Accounting (SEEA). New York: United Nations.
Van Paddenburg, A., A. Bassi, E. Buter, C. Cosslett and A. Dean (2012). Heart of Borneo: Investing in Nature for a Green Economy. Jakarta: WWF Heart of Borneo Global Initiative.
Wilson-Grau, R. (2008). Evaluating the effects of international advocacy networks. Paper presented at the Advocacy Impact Evaluation Workshop, Evans School for Public Affairs, University of Washington, 4-6 December, 2013. Seattle, WA, USA.
World Bank (2012a). World Development Indicators 2012. Washington, DC: World Bank.
World Bank (2012b). Inclusive Green Growth. The Pathway to Sustainable Development. Washington, DC: World Bank.
WWF, Global Footprint Network and Zoological Society of London (2012). Living Planet Report 2012. Biodiversity, Biocapacity and Better Choices.

A GUIDANCE MANUAL FOR GREEN ECONOMY INDICATORS
United Nations Environment ProgrammeP.O. Box 30552 Nairobi, 00100 Kenya
Tel: (254 20) 7621234Fax: (254 20) 7623927
E-mail: [email protected]: www.unep.org
www . unep . o r g
Job no. DTI/1690/GE
2014
Partnership for Action on PAGE
Annual Progress Report1 January 2013 - 31 March 2011