a handheld image analysis system for portable and ...€¦ · a handheld image analysis system for...
TRANSCRIPT

1
A Handheld Image Analysis System for A Handheld Image Analysis System for Portable and Objective Print Quality AnalysisPortable and Objective Print Quality Analysis
Ming-Kai TseQuality Engineering Associates (QEA), Inc.,
USA
Presented at the
Imaging Conference JAPAN 2007(The 99th Annual Conference of the Imaging Society of Japan)
June 6-8, 2007
2
ObjectivesObjectives
• Expansion of Imaging (Concept of ICJ2007)
Measurement technology is critical to the advancement of the science and technology of imaging.
• Democratization of Objective Image Quality Analysis
Our goal is to bridge the gap between sophisticated image analysis in the laboratory and the need for a practical tool for EVERYDAY USE by EVERYONE.

3
RequirementsRequirements• Functional – calibrated, accurate, predictive, utilizes
international and industry standards, …
• Easy-to-Use – simple operation even for the most sophisticated analyses: quick response, easy reporting, with specialized expertise built-in.
• Portable and Affordable - compact, light weight, and low cost
• Flexible – meets diverse measurement needs
• Upgradeable – capable of staying with the state-of-the-art at all times
4
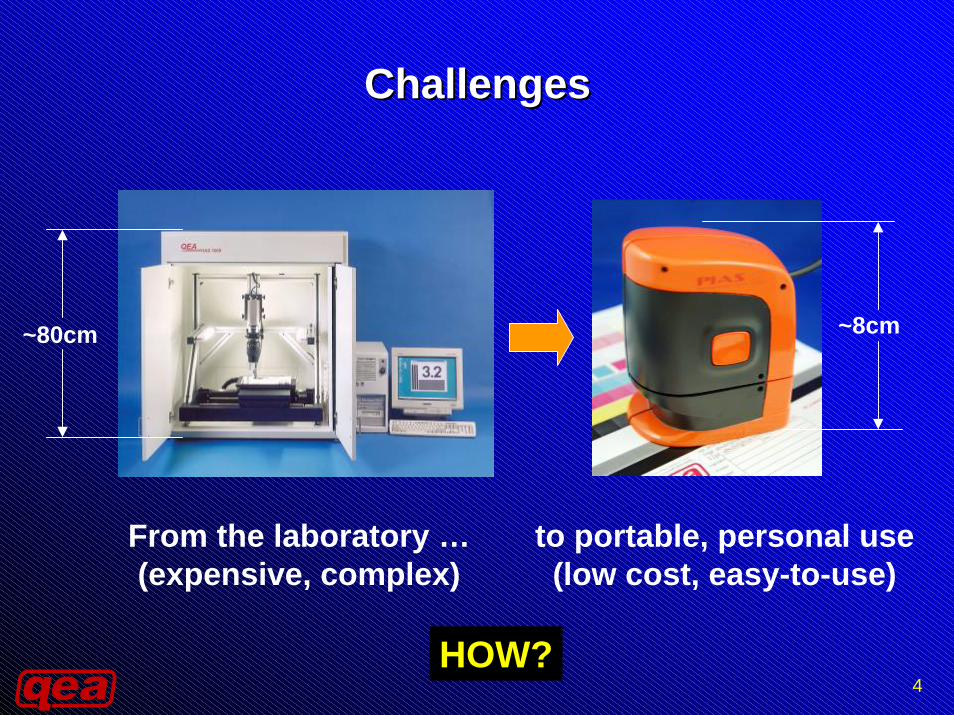
ChallengesChallenges
~8cm ~80cm
From the laboratory …(expensive, complex)
to portable, personal use(low cost, easy-to-use)
HOW?

5
Hardware SolutionHardware Solution• Compact design & light weight
– ~350g• USB 2.0 interface to PC
– No battery needed• Interchangeable optics:
– Different resolution & FOV– Different illumination
geometry & spectral characteristics
• Built-in calibration– Grey level & spatial
dimensions• Processing capabilities

6
Optical ModulesOptical Modules• Fixed focus • Multiple resolution
modules - Hi & Lo• 45/0, coaxial, …• Reflective &
transmissive• Visible, IR & UV
High Resolution5 µm/pixel
3.2mm x 2.4mm
Low Resolution37.5 µm/pixel
24mm x 18mm
Visible
Visible
IR
UV Fluorescence
Security printing, forensic and other novel applications

7
Why Different Magnifications Why Different Magnifications (1)(1)
To improve correlation with human perception:
Low Resolution OpticsLarge Field of View
A
B

8
Why Different Magnifications Why Different Magnifications (2)(2)
To provide machine diagnostic information:
High Resolution OpticsSmall Field of View
A
B

9
Calibration Calibration (1)(1)
• Grey level (Reflectance and Density)– Use a test chart with calibrated CMYK tone
scales (traceable)– Obtain camera RGB values– Obtain correlation between camera RGB and
calibrated reflectance % (CMYK) – Convert reflectance % to optical density (for
Status A, T, DIN and DIN NB) • Color (L*a*b*)
– Use a test chart with known sRGB values– Convert camera RGB to sRGB– Convert sRGB to L*a*b*

10
Calibration Calibration (2)(2)
• Spatial Dimensions (x and y)– Use a calibrated (traceable), precision
Ronchi ruling (chrome on glass)– Obtain x and y resolution in µm/pixel

11
Software SolutionSoftware Solution
• Intuitive user interface• Analysis in real time or on
saved images• Mostly “one-click” to obtain
useful results
A
Analytical Tools
• Efficient data & image interface to Excel or database
• Expandable analysis toolbox, e.g. A - basic, B - advanced
NumericalResults
B
FOV (Image)
ROI
GraphicalResults

12
Analysis Toolbox Analysis Toolbox (1)(1)
• Dot quality (dot gain, dot shape and placement)• Line and edge quality (width, blurriness, raggedness,
contrast, fill and darkness – ISO13660)• Text quality (stroke quality, fidelity, uniformity)• Color adjacency and inter-color bleed• Image noise (graininess and mottle – ISO13660)• Banding, streaking, … (NPS – Noise Power Spectrum)• Inkjet satellites, toner background, voids, ghosting …

13
Analysis Toolbox Analysis Toolbox (2)(2)
• Spatial Frequency Response (“slant edge” technique ISO12233) and Resolution
• Color registration error (“slant edge” technique)• Profile and histogram tools• Color channel viewing tools• Density and color• OCR (optical character recognition)• Colorant % coverage• Gloss and DOI

14
ApplicationsApplications
• Engineering and Machine Diagnostics – (e.g, machine chatters, unsteady paper feed,
inkjet printhead misfiring, laser scanner instability, thermal or LED printhead non-uniformity, …)
• Objective Image Quality vs. Perceptual Quality– Tone and color reproduction– Sharpness and details– Image artifacts (defects)– Gloss and DOI (Distinction of Image)

15
Application Example Application Example (1) (1)
–– Inkjet Print Head DiagnosticsInkjet Print Head Diagnostics
-1500
-1000
-500
0
500
1000
1500
-2000 -1000 0 1000 2000
TargetMeasured
Jetting Pattern Analysis Results
High Resolution OpticsDot Tool

16
Application Example Application Example (2a) (2a) Printer Benchmarking, A Printer Benchmarking, A vsvs BB
BA
Two High Speed Color Electrophotographic Printers

17
Application Example Application Example (2b) (2b) Tone Reproduction & Image NoiseTone Reproduction & Image Noise
• “A” & “B” have similar tone reproduction
• Image noise mostly higher in “B” and is dependent on Lightness (L*)
Low Resolution OpticsArea Tool
L*~30 ~55 ~85
Tone Reproduction
Graininess

18
Application Example Application Example (2c) (2c) Image Noise: ISO13660 Graininess/Mottle & NPS AnalysisImage Noise: ISO13660 Graininess/Mottle & NPS Analysis
Low Resolution Optics
A
B
NPS Tool
Area Tool

19
Application Example Application Example (2d) (2d) Sharpness & Details: Line Quality (ISO13660)Sharpness & Details: Line Quality (ISO13660)
• “A” has significant problem in writing thin lines correctly.
• Edge raggedness difference is small and imperceptible.
A B
High Resolution Optics – Line Tool

20
Application Example Application Example (2e) (2e) Text Quality Text Quality –– Dot & Line ToolsDot & Line Tools
• “A” appears much bolder than “B” as indicated by Stroke Width & Character Area.
• Edge raggedness difference is small and imperceptible.
High Resolution Optics – Line Tool
A
B

21
Application Example Application Example (2f) (2f) Resolution & MTF (SFR Tool)Resolution & MTF (SFR Tool)
• The SFR tool (Slant Edge ISO12233) conveniently provides MTF information.
• “A” has slightly higher MTF than “B”.
High Resolution Optics – SFR Tool
A
B

22
Application Example Application Example (2g) (2g) Background AnalysisBackground Analysis
• “GS” is a very useful metric for measuring Background, combining the role of number and size of particles.
• “A” is significantly better than “B”
High Resolution Optics – Background Tool
A
B

23
Summary Summary (1)(1)
• Objective image quality analysis has advanced significantly in recent years; the challenge is that the technology is not readily available to most practicing imaging professionals.
• Our goal is simply to bridge this gap by developing a reliable image analysis tool for everyday use by everybody.
• This presentation summarizes our design approach and the hardware and software solutions of a second generation portable image analysis system.

24
Summary Summary (2)(2)
• The new tool provides a broad range of IQ analysis functions, and addresses the requirements of portability, flexibility, upgradeability, affordability, and most importantly, ease-of-use.
• We also place much emphasis on issues of calibration, reliability, and adaptation of international and industry standards.
• We hope our effort has made a contribution to the imaging industry, and towards the theme of “Expansion of Imaging” in ICJ2007.