a health picture of hud-assisted children 2006–2012 · barry l. steffen. elizabeth rudd jon...
TRANSCRIPT

A Health Picture of HUD-Assisted Children, 2006–2012HUD Administrative Data Linked With the National Health Interview Survey
U.S. Department of Housing and Urban Development | Office of Policy Development and Research

Visit PD&R’s website
huduser.govto find this report and others sponsored by HUD’s Office of Policy Development and Research (PD&R).
Other services of HUD User, PD&R’s research information service, include listservs, special interest
reports, bimonthly publications (best practices, significant studies from other sources), access to public
use databases, and a hotline (800-245-2691) for help accessing the information you need.
A Health Picture of HUD-Assisted Children, 2006–2012HUD Administrative Data Linked With the National Health Interview Survey
Prepared for:U.S. Department of Housing and Urban Development
Prepared by:Veronica E. HelmsBarry L. SteffenElizabeth Rudd Jon Sperling
March 2018
A Health Picture of HUD-Assisted Children, 2006–2012
DISCLAIMER The contents of this report represent the views of the authors and do not necessarily reflect the views or
policies of the U.S. Department of Housing and Urban Development or the U.S. government
.

A Health Picture of HUD-Assisted Children, 2006–2012
Page iii
CONTENTS
Executive Summary ........................................................................................................................... v
Introduction ...................................................................................................................................... 1
Housing as a Social Determinant of Health .................................................................................... 1 HUD Rental-Assistance Programs ................................................................................................... 2
HUD-NCHS Data Linkage Sources ..................................................................................................... 3
National Health Interview Survey ................................................................................................... 3 HUD Administrative Data ............................................................................................................... 3
Child Groups Examined ..................................................................................................................... 5
HUD-Assisted Children.................................................................................................................... 5 Unassisted Low-Income Children in Renter Households ................................................................ 5 General Child Population ................................................................................................................ 5
Methods ............................................................................................................................................ 6
Data Linkage ................................................................................................................................... 6 Statistical Analysis........................................................................................................................... 6
Sociodemographic Characteristics Among Children Ages 0–17 ....................................................... 7
Age at Interview ............................................................................................................................. 7 Sex .................................................................................................................................................. 7 Race and Ethnicity .......................................................................................................................... 7 Region ............................................................................................................................................. 8 Metropolitan Classification............................................................................................................. 9 Ratio of Family Income to Poverty Threshold................................................................................. 9 Family Structure ...........................................................................................................................10 Highest Educational Attainment in Household .............................................................................11 Summary of Sociodemographic Characteristics Among HUD-Assisted Children Ages 0–17 .......11
Health Status Among Children Ages 0–17 ......................................................................................13
Reported Health Status ................................................................................................................13 Emergency Room Visits ................................................................................................................13 Current Asthma ...........................................................................................................................14 Summary of Health Status Among HUD-Assisted Children Ages 0–17 ........................................15
Learning-Related Health Status Among School-Aged Children Ages 6–17 .....................................16
School Days Missed ......................................................................................................................16 Any Learning Disability .................................................................................................................17 Attention Deficit Hyperactivity Disorder or Attention Deficit Disorder ........................................17 Summary of Learning-Related Health Status Among School-Aged Children Ages 6–17...............18
Healthcare Access Among Children Ages 0–17 ..............................................................................19
Health Insurance Coverage...........................................................................................................19 Unmet Need for Health Care ........................................................................................................20 Could Not Afford Medication .......................................................................................................20 Could Not Afford Medical Care.....................................................................................................21

A Health Picture of HUD-Assisted Children, 2006–2012
Page iv
Well-Child Visits ............................................................................................................................22 General Doctor Visits ....................................................................................................................22 Specialist Visits .............................................................................................................................23 No Usual Source of Care ...............................................................................................................24 Summary of Healthcare Utilization and Access Among Children Ages 0–17 ................................24
Healthcare Access Among School-Aged Children Ages 6–17 .........................................................26
Dental Care Affordability ..............................................................................................................26 Dental Visits ..................................................................................................................................26 Mental Healthcare Affordability ...................................................................................................27 Mental Health Professional Visits .................................................................................................28 Eyeglasses Affordability ................................................................................................................28 Summary of Healthcare Utilization and Access Among School-Aged Children Ages 6–17 ...........29
Conclusion .......................................................................................................................................30
References ......................................................................................................................................32
Appendix .........................................................................................................................................35
A Health Picture of HUD-Assisted Children, 2006–2012
Page v
Executive Summary
Housing is an important social determinant of health, yet little systematic evidence exists about the
health of U.S. Department of Housing and Urban Development (HUD)-assisted households. Current
knowledge and understanding of the health of the nation’s assisted housing population is based primarily
on case studies and anecdotes.1 This knowledge gap is being addressed through an interagency effort
between the Centers for Disease Control and Prevention, National Center for Health Statistics and HUD.
National Health Interview Survey (NHIS) responses were linked with HUD’s administrative data on rental
assistance programs. For the first time, reliable estimates of the prevalence of health conditions and
healthcare utilization among HUD-assisted individuals—including adults and children—are now available
at a national level (Sperling and Helms, 2016).
This report focuses on the health of children in HUD-assisted households.2 Among the 5 million
households and 10 million individuals receiving HUD rental housing assistance, approximately 4 million
are children, representing nearly 6 percent of all children in the United States.3 This report describes the
health characteristics of HUD-assisted children using various NHIS variables. Findings establish a baseline
that can inform policymakers and stimulate further research. Comparative data for two relevant child
groups—children residing in unassisted low-income renter households and the general child population—
are provided for context. Differences between groups are not tested for statistical significance.
Analyses revealed that important health status indicators characterize the population of HUD-assisted
children. Major findings are highlighted in the following list.
• Sociodemographic characteristics of HUD-assisted children. Most HUD-assisted children were Black
(52.2 percent). The largest proportion resided in the South (44.1 percent). Most HUD-assisted
children lived in a single-parent, female-headed household (74.6 percent). Additionally, a large
proportion resided in large metropolitan centers (31.9 percent), and 40.7 percent had a family
income that was less than one-half of the federal poverty threshold (based on poverty levels for
2012).4
• Health status of children ages 0–17 years. Among HUD-assisted children, 5.2 percent had a
knowledgeable adult report their health as fair or poor. HUD-assisted children were frequent users of
the emergency room. During the year prior to the interview, 14.2 percent of HUD-assisted children
visited the emergency room two or more times. A high percentage of HUD-assisted children (21.2
percent) had current asthma.
• Learning-related health status of school-aged children (ages 6–17). Among HUD-assisted children, 16.2
percent of school-aged children missed 6 to 10 days of school during the previous year, and 8.5
1 For some exceptions, see Ahrens et al. (2016) and Fenelon et al. (2017). Authors used the same HUD-National Center for Health Statistics linked data to support findings. 2 A previous report focused on HUD-assisted adults. See Helms, Sperling, and Steffen (2017). 3 Estimate based on statistics published by the Federal Interagency Forum on Child and Family Statistics (2016). 4 Based on 2012 poverty thresholds published by the Census Bureau, a ratio of family income to the poverty threshold of less than 0.5 translates to an annual household income no greater than $9,249 for a family of three with one adult and two children (U.S. Census Bureau, 2017).

A Health Picture of HUD-Assisted Children, 2006–2012
Page vi
percent missed 11 or more days. School-aged, HUD-assisted children experience high rates of
learning disabilities: 26.5 percent of children had any learning disability reported by a school or health
professional; this included 16.1 percent who had been diagnosed with attention deficit hyperactivity
disorder or attention deficit disorder and 10.4 percent ever diagnosed with some other kind of
learning disability.
• Healthcare access among children ages 0–17. Most HUD-assisted children ages 0–17 years had
insurance coverage via public health insurance programs (86.8 percent). A smaller proportion of
children were uninsured among the HUD-assisted population (4.1 percent) than among the general
child population (8.2 percent). Additionally, the percentage of children with unmet medical needs
due to cost was similar among HUD-assisted children (3.5 percent) and children in the general
population (4.4 percent). Most HUD-assisted children had a well-child visit (84.4 percent) or general
doctor visit (85.9 percent) during the prior year.
• Healthcare access among school-aged children (ages 6–17). Among HUD-assisted children ages 6–17,
8.3 percent reported unmet dental healthcare needs due to cost. Most (81.1 percent) HUD-assisted
children ages 6–17 had obtained oral health services during the prior year. A small percentage (2.5
percent) of HUD-assisted children reported unmet mental healthcare needs. In addition, 16.1 percent
of HUD-assisted children saw a mental health professional during the prior 12 months. In HUD-
assisted households, 5.6 percent of children were reported to need eyeglasses but did not get them
because the family was unable to afford them.
Descriptive analyses show clear differences between HUD-assisted children, children residing in low-
income, unassisted households, and children in the general population. The differences reported here
were not tested for statistical significance, but the findings underscore the need for further research to
better understand the connection between rental housing assistance programs administered by HUD and
the health of children in HUD-assisted households.
A Health Picture of HUD-Assisted Children, 2006–2012
Page 1
Introduction
The U.S. Department of Housing and Urban Development (HUD) provides rental housing assistance to
approximately 5 million households and 10 million low-income individuals. Approximately 40 percent of
HUD-assisted tenants—more than four million—are children. Children living in HUD-assisted households
represent nearly 6 percent of all children in the United States.5 This report presents a broad overview of
the health characteristics of HUD-assisted children using various health survey metrics to establish a
baseline to inform policymakers. Comparative data for two relevant child groups, (1) children residing in
unassisted low-income renter households and (2) the general child population, are provided for context.
Descriptive statistics are presented for children ages 0–17 and for school-aged children ages 6–17.
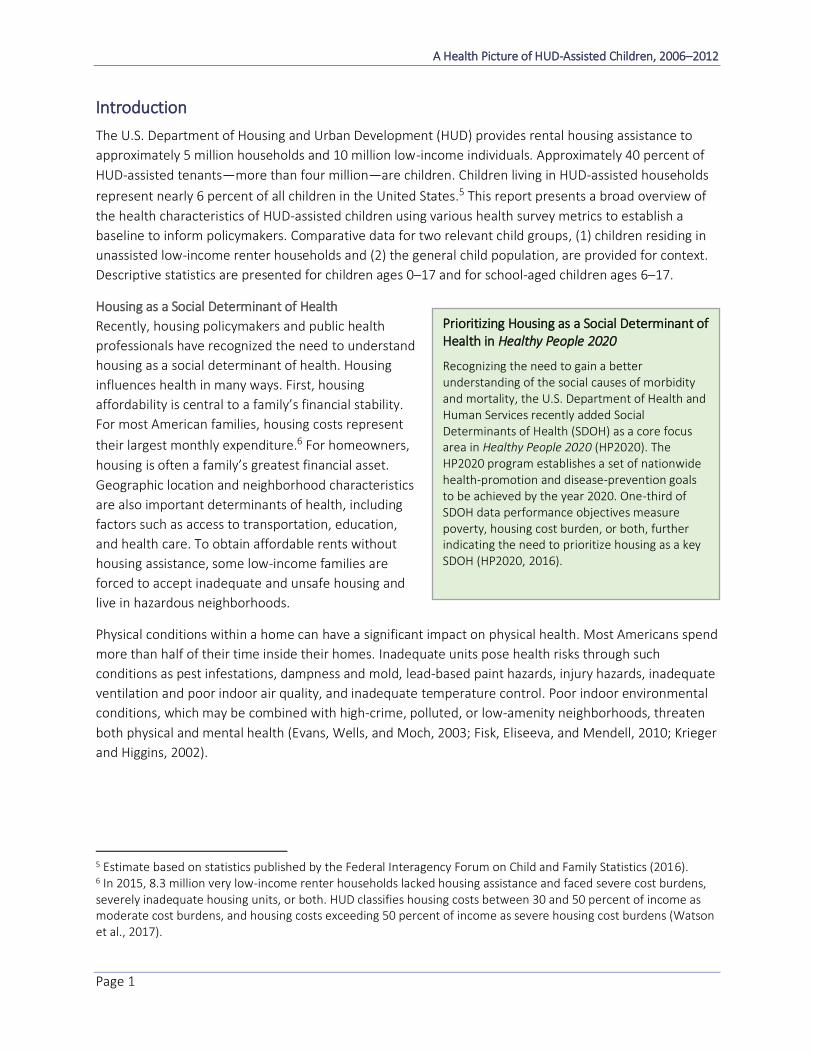
Housing as a Social Determinant of Health
Recently, housing policymakers and public health
professionals have recognized the need to understand
housing as a social determinant of health. Housing
influences health in many ways. First, housing
affordability is central to a family’s financial stability.
For most American families, housing costs represent
their largest monthly expenditure.6 For homeowners,
housing is often a family’s greatest financial asset.
Geographic location and neighborhood characteristics
are also important determinants of health, including
factors such as access to transportation, education,
and health care. To obtain affordable rents without
housing assistance, some low-income families are
forced to accept inadequate and unsafe housing and
live in hazardous neighborhoods.
Prioritizing Housing as a Social Determinant of Health in Healthy People 2020
Recognizing the need to gain a better understanding of the social causes of morbidity and mortality, the U.S. Department of Health and Human Services recently added Social Determinants of Health (SDOH) as a core focus area in Healthy People 2020 (HP2020). The HP2020 program establishes a set of nationwide health-promotion and disease-prevention goals to be achieved by the year 2020. One-third of SDOH data performance objectives measure poverty, housing cost burden, or both, further indicating the need to prioritize housing as a key SDOH (HP2020, 2016).
Physical conditions within a home can have a significant impact on physical health. Most Americans spend
more than half of their time inside their homes. Inadequate units pose health risks through such
conditions as pest infestations, dampness and mold, lead-based paint hazards, injury hazards, inadequate
ventilation and poor indoor air quality, and inadequate temperature control. Poor indoor environmental
conditions, which may be combined with high-crime, polluted, or low-amenity neighborhoods, threaten
both physical and mental health (Evans, Wells, and Moch, 2003; Fisk, Eliseeva, and Mendell, 2010; Krieger
and Higgins, 2002).
5 Estimate based on statistics published by the Federal Interagency Forum on Child and Family Statistics (2016). 6 In 2015, 8.3 million very low-income renter households lacked housing assistance and faced severe cost burdens, severely inadequate housing units, or both. HUD classifies housing costs between 30 and 50 percent of income as moderate cost burdens, and housing costs exceeding 50 percent of income as severe housing cost burdens (Watson et al., 2017).

A Health Picture of HUD-Assisted Children, 2006–2012
Page 2
Descriptive statistics in this report aim to provide
new insights into the link between subsidized
housing and children’s health. The report seeks to
encourage focused research using the HUD-
National Center for Health Statistics (NCHS) data
linkage. Health status and healthcare utilization
outcomes for children in HUD-subsidized
households are summarized alongside estimates
for children in unsubsidized renter households
with incomes below the federal poverty line and
children in the general population. Comparisons
provide context for findings about HUD-assisted
children but are not statistically valid comparisons.
HUD Rental-Assistance Programs
This report focuses on HUD-assisted children,
defined to include children residing in households
receiving one of HUD’s three major rental subsidy
program types—public housing, housing choice
vouchers (HCVs),7 and assisted multifamily
housing.8 Public housing and HCVs are
administered by state and local public housing
agencies (PHAs). Within multifamily programs, in
contrast, private building owners contract directly
with HUD to make units available at subsidized rents. For all three program types, housing providers
verify income eligibility of subsidized renters and submit tenant data to HUD, which sets the level of
tenant rent contributions. Most tenants have incomes substantially below 50 percent of Area Median
Income (AMI)9 on admission.
Households that receive HUD assistance may differ from the general population of all households eligible
for HUD assistance. For instance, households receiving assistance tend to be poorer, be older, have more
disabilities, and be more likely to have a history of homelessness than the group of all eligible households.
Therefore, the health of children living in assisted households might differ from the health of children in
the larger group of eligible households because of these selection processes. Additional research should
make health comparisons between the presented populations with respect to selection into HUD
programs.
7 HCVs are also known as tenant-based rental assistance. 8 Historically, assisted multifamily programs also have been referred to as project-based rental assistance. 9 HUD estimates AMI based on metropolitan areas, identified by the Census Bureau, and the nonmetropolitan balance of states. The term very low income refers to incomes of no more than 50 percent of AMI, with adjustments for family size. The definitions of low income, very low income, and extremely low income are outlined in the United States Housing Act of 1937, as amended.
A Health Picture of HUD-Assisted Children, 2006–2012
Page 3
HUD-NCHS Data Linkage Sources
In collaboration with HUD, the NCHS linked longitudinal HUD administrative data with two cross-sectional
health interview surveys across a 14-year period (1999 through 2012)—the National Health Interview
Survey (NHIS) and the National Health and Nutrition Examination Survey.10 This report focuses on
prevalence estimates produced from NHIS-HUD linked data from 2006 to 2012.
National Health Interview Survey
The NHIS11 is an annual cross-sectional interview
survey of approximately 35,000 households (90,000
participants). NHIS is designed to monitor the health
of the civilian noninstitutionalized U.S. population by
collecting data on a broad range of health topics.
The sampling plan follows a multistage area
probability design that permits the representative
sampling of households and noninstitutionalized
group quarters.
The core NHIS questionnaire contains four major
components. The Household component collects limited demographic information for all individuals living
in a housing unit. For example, this file captures the number of household members who did and did not
respond and the household’s type of living quarters. The Family component collects and verifies
additional demographic information on each member in the housing unit and collects data on topics
including health status, injuries, healthcare access and utilization, and health insurance. From each family,
NCHS randomly selects one sample adult and one sample child (if any children are present) to collect
more detailed information. The sample adult is interviewed directly, and an adult who is familiar with the
child (a knowledgeable adult) gives information about the selected sample child. This report largely
focuses on information collected from the Sample Child survey component.
HUD Administrative Data
HUD-affiliated housing providers collect administrative data on families participating in HUD assistance
programs and transmit these data to HUD. Information collected includes—
• Dates of enrollment, income recertification, and end of participation.
• Name of each person living in the housing unit and personal attributes including sex, race, Social
Security number, date of birth, and relationship to the head of household.
• Family characteristics that might qualify the family for tenant selection preferences.12
10 The HUD-NCHS linked data website contains more information about this linked product, including data documentation, public use feasibility files, and analytic guidelines (Lloyd and Helms, 2016). 11 For more information about NHIS, see NCHS (2013a). 12 For example, some public housing and assisted multifamily units are designated for people with disabilities, and homeless individuals and families may receive preferential admission. Selection preferences vary across PHAs.
A Health Picture of HUD-Assisted Children, 2006–2012
Page 4
• Detailed income and assets information for all household members.
• Anticipated family income for the next 12 months and sources of that income.
• Geographic information for assisted units.
The federal forms used to collect HUD administrative data are forms HUD-50058,13 HUD-50058 MTW,14
and HUD-50059.15 The data are stored in two databases—the Public and Indian Housing Information
Center contains information public housing and the HCV program and the Tenant Rental Assistance
Certification System contains information on properties subsidized by programs of HUD’s Office of
Multifamily Housing.16
13 Administrative Form HUD–50058, the Family Report, is used to collect data on people who participate in the HCV and public housing programs. 14 PHAs participating in the Moving to Work (MTW) demonstration have fewer data requirements. Form HUD–50058 MTW (MTW Family Report) is used only by PHAs participating in MTW. 15 Administrative Form HUD–50059, titled “Owners Certification of Compliance with HUD’s Tenant Eligibility and Rent Procedures,” is used to collect data on the people who participate in multifamily programs. 16 For more information about HUD data systems in connection with the linked data, consult Lloyd and Helms (2016).
A Health Picture of HUD-Assisted Children, 2006–2012
Page 5
Child Groups Examined
Analyses examined sociodemographic characteristics and health outcomes among three groups of
children ages 17 or younger, defined by income and status of HUD assistance during survey years 2006 to
2012. This report focuses on HUD-assisted children and presents indicators for other child groups to
provide useful context. The three child groups were defined as follows:
HUD-Assisted Children
The primary group of interest for this study comprises linkage-eligible17 sample
children in the NHIS who linked with HUD administrative data and received housing
assistance at the time of health interviews during NHIS survey years 2006 to 2012.18
Children in this group lived in households that received one of three types of HUD
rental assistance—HCVs,19 public housing, or multifamily housing.
Unassisted Low-Income Children in Renter Households
A second group represents linkage-eligible sample children who lived in unassisted
rental units, did not link with HUD administrative data for the relevant years, and
had household incomes below the federal poverty threshold.20 Renter status is
based on NHIS responses, and individuals assisted by HUD at the time of interview
are excluded from this group. Low-income renter households may be unassisted
because the head of household did not apply for assistance, did apply but was not
admitted to the program because of limited public resources,21 or was once assisted
but is no longer assisted.
General Child Population
A final group examined was all linkage-eligible sample children from NHIS survey
cycles 2006 to 2012. Children in this group represent the general child population
without regard to income, housing tenure, or housing assistance status. This group
does not exclude HUD-assisted children or children in low-income, renting
households.
17 Approximately 55 percent of NHIS survey participants were linkage-eligible during NHIS survey years 2006–2012. Details describing linkage eligibility criteria and linkage processes are described in Lloyd et al. (forthcoming) and Lloyd and Helms (2016). 18 Receipt of HUD assistance for NHIS participants was determined using the standard NCHS concurrency variables, which are based on the survey date being preceded and followed by HUD administrative records that are not more than 425 days apart, or 790 days apart for MTW agencies (Lloyd and Helms, 2016). 19 The Homeownership Program and the Moderate Rehabilitation Single Room Occupancy Program, both included in the HCV program category, have a trivial effect on estimates. 20 In this report, low income is used generically to mean incomes below the federal poverty threshold, which are comparable with the incomes of most HUD-assisted renters. The term neither means nor aligns with the substantially greater threshold of 80 percent of AMI that HUD uses to define which families are low income for purposes of program administration. 21 Only 25 percent of those eligible receive housing assistance. For more information regarding unmet housing needs, consult Watson et al. (2017).
A Health Picture of HUD-Assisted Children, 2006–2012
Page 6
Methods
Data Linkage
NCHS linked NHIS survey participant data to administrative records from HUD’s largest housing assistance
programs using Social Security number, name, gender, and date of birth. Based on assurances and
procedures to ensure confidentiality and privacy, the NCHS Research Ethics Review Board and HUD’s legal
staff approved the data linkage.
The HUD-NCHS linkage was primarily a deterministic, rules-based matching process. The NHIS
questionnaire, implemented since 1997, has core questions and supplements. From each family in the
NHIS, one sample child is randomly selected from whom to collect information on the Sample Child
component. During NHIS survey years 2006 to 2012, information was collected from a knowledgeable
adult about approximately 77,000 sample children. Among sample child survey participants,
approximately 32 percent (N = 76,627) met linkage eligibility criteria. The respondent (that is, the
knowledgeable adult) provided sufficient personal identifying information, provided linkage consent, and
did not refuse to answer a question about housing assistance status (N = 25,018).22 During NHIS survey
years 2006 to 2012, approximately 1,516 children were linkage-eligible and received housing assistance at
the time of their NHIS (NCHS, 2016).
Statistical Analysis
This report primarily uses data from the Sample Child component of NHIS. All tables display weighted
percentages of demographic, socioeconomic, and health characteristics among children in the three
groups and displayed percentages are estimated national prevalence rates. The appendix provides
estimates of standard errors. Data were pooled across survey years 2006 to 2012 to ensure sufficient
sample for statistically valid estimates.
Data analysis was performed using SAS software, version 9.4 (SAS Institute, Cary, NC), and SAS-callable
SUDAAN, version 9.0 (RTI, Research Triangle Park, NC). NCHS adjusted NHIS sample weights, which
account for nonresponse and for unequal probabilities of selection, to account for linkage eligibility.
Weighted percentages were based on the linkage eligibility-adjusted sample weights, and standard errors
of the percentages were estimated accounting for the complex survey sampling design (NCHS, 2013a).
Multiple imputation methods enabled the ratio of family income to the poverty threshold to be estimated
without omitting cases that lack complete income data (NCHS, 2013b).23
The report provides a broad descriptive summary of health characteristics of HUD-assisted children. This
report does not test for causal associations. Moreover, side-by-side comparisons for the three child
groups are designed to provide context for findings about HUD-assisted children. This report does not
include statistical tests of differences between the groups compared. Analyses provide a general picture
of the health of HUD-assisted children.
22 Individuals who refused to answer questions regarding housing assistance status were presumed hesitant to share information regarding their housing situation; therefore, to protect confidentiality and respect privacy, these individuals were considered ineligible for data linkage with HUD administrative data. 23 NCHS provided poverty ratio intervals in NHIS public use data files beginning with the 1997 NHIS. The poverty ratio is a ratio of the family’s income to the appropriate federal poverty threshold. Published poverty thresholds from the Census Bureau are used to calculate this ratio.

A Health Picture of HUD-Assisted Children, 2006–2012
Page 7
Sociodemographic Characteristics Among Children Ages 0–17
Individual-level and household-level sociodemographic characteristics were examined among HUD-
assisted children, unassisted children in low-income renter households, and the general child population.
Table A-1, in the appendix, displays weighted percentages and standard error estimates for each of the
three groups examined.
Age at Interview
The following three age categories were analyzed: 0 to 5, 6 to 11, and 12 to17 years. Among HUD-
assisted children, 35.6 percent were ages 0 to 5, 37.1 percent were ages 6 to 11, and 27.3 percent were
ages 12 to 17. The proportion of children under age 5 was greatest (46.4 percent) among the unassisted,
low-income renter household group (figure 1) and was similar among HUD-assisted children (35.6
percent) and the general child population (33.8 percent). The percentage of children ages 6 to 11 was
similar among all three groups. During the reference period, children residing in unassisted, low-income
renter households had the smallest proportion of adolescents ages 12 to 17 (20.8 percent), and the
general child population had the greatest proportion (33.7 percent). Generally, the age distribution was
similar among HUD-assisted children and the general child population; however, children residing in low-
income, unassisted renting households tended to be younger than the other two child groups.
33.8
46.4
35.6
32.5
32.8
37.1
33.7
20.8
27.3
0% 10% 20% 30% 40% 50% 60% 70% 80% 90% 100%
General Population
Unassisted Low-Income Renter
HUD-Assisted
Weighted Percentage
Figure 1: Distribution of Children by Age and Child Group, 2006–2012
0-5 years 6-11 years 12-17 years
SOURCE: Authors’ tabulations of NHIS-HUD Linked Data
Sex
Among all three child groups examined, the sex ratio is balanced (table A-1). All groups exhibit a male and
female sex distribution around 50 percent.
Race and Ethnicity
Because of potential sample size limitations, race and ethnicity variables were recoded into four broad
categories: Hispanic, non-Hispanic White, non-Hispanic Black, and non-Hispanic other (henceforth termed
Hispanic, White, Black, and other). The racial and ethnic composition differs between the three child
groups (figure 2). Among HUD-assisted children, most were Black (52.2 percent), followed by White
(24.6 percent), Hispanic (20.3 percent), and other (3.0 percent). Among children residing in unassisted
low-income renter households, one-third (35.2 percent) were Black, one-third (34.7 percent) were

A Health Picture of HUD-Assisted Children, 2006–2012
Page 8
Hispanic, and one-fourth (25.5 percent) were White. The general child population is less diverse, with
56.8 percent White, 22.0 percent Hispanic, and 15.6 percent Black. Such differences between low-income
renters, on the one hand, and the general child population, on the other, reflect the persistent
association between poverty and minority status in the United States.
22.0
34.7
20.3
56.8
25.5
24.6
15.6
35.2
52.2
5.6
4.6
3.0
0% 10% 20% 30% 40% 50% 60% 70% 80% 90% 100%
General Population
Unassisted Low-Income Renter
HUD-Assisted
Weighted Percentage
Figure 2: Distribution of Children by Race and Ethnicity and Child Group, 2006–2012
Hispanic White Black Other
SOURCE: Authors’ tabulations of NHIS-HUD Linked Data
Region
To ensure respondent confidentiality in the linked data set, the lowest level of geography available for
aggregation and reporting using NHIS data is region. The United States is divided into four census
regions—Northeast, Midwest, South, and West.
Among HUD-assisted children, 15.0 percent resided in the Northeast, 26.8 percent resided in the
Midwest, 44.1 percent resided in the South, and 14.2 percent resided in the West. When examining the
distribution of children by region among the three child groups, low-income renters—whether HUD-
assisted or not—were similar to the general child population (figure 3). For all three groups, a plurality of
children resided in the South.
12.4
12.0
15.0
26.7
22.8
26.8
40.8
45.0
44.1
20.2
20.2
14.2
0% 10% 20% 30% 40% 50% 60% 70% 80% 90% 100%
General Population
Unassisted Low-Income Renter
HUD-Assisted
Weighted Percentage
Figure 3: Distribution of Children by Region and Child Group, 2006–2012
Northeast Midwest South West
SOURCE: Authors’ tabulations of NHIS-HUD Linked Data
A Health Picture of HUD-Assisted Children, 2006–2012
Page 9
Metropolitan Classification
An urban-rural classification schema developed by NCHS was used to examine urban-rural differences
across child groups (NCHS, 2014). The measure defines U.S. counties and county-equivalent entities to
one of six categories. The 2006 version used in this report is based on the 2000 census and the Office of
Management and Budget’s 2005 delineation of metropolitan and micropolitan statistical areas.24
The most urban category consists of central counties of large metropolitan areas, and the most rural
category consists of nonmetropolitan (referred to as “noncore”) counties. When listed from urbanity to
rurality, metropolitan classification categories include—large central metro, large fringe metro, medium
metro, small metro, micropolitan, and noncore.
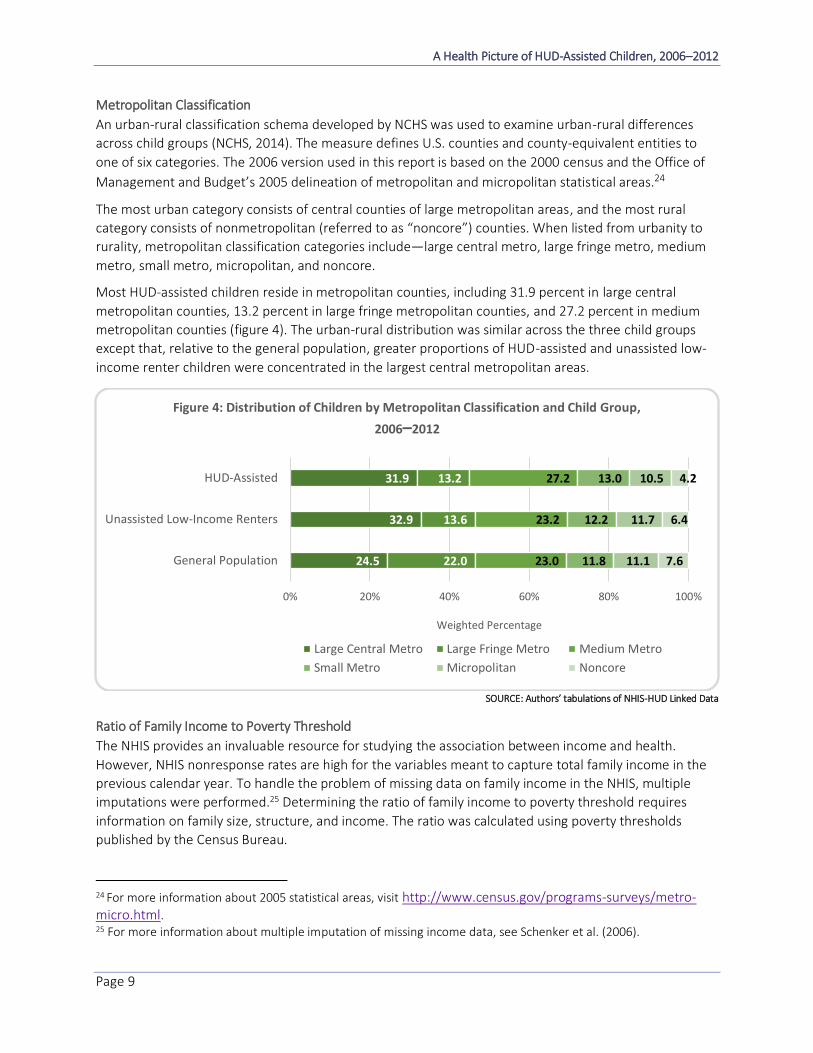
Most HUD-assisted children reside in metropolitan counties, including 31.9 percent in large central
metropolitan counties, 13.2 percent in large fringe metropolitan counties, and 27.2 percent in medium
metropolitan counties (figure 4). The urban-rural distribution was similar across the three child groups
except that, relative to the general population, greater proportions of HUD-assisted and unassisted low-
income renter children were concentrated in the largest central metropolitan areas.
24.5
32.9
31.9
22.0
13.6
13.2
23.0
23.2
27.2
11.8
12.2
13.0
11.1
11.7
10.5
7.6
6.4
4.2
0% 20% 40% 60% 80% 100%
General Population
Unassisted Low-Income Renters
HUD-Assisted
Weighted Percentage
Figure 4: Distribution of Children by Metropolitan Classification and Child Group,
2006–2012
Large Central Metro Large Fringe Metro Medium Metro
Small Metro Micropolitan Noncore
SOURCE: Authors’ tabulations of NHIS-HUD Linked Data
Ratio of Family Income to Poverty Threshold
The NHIS provides an invaluable resource for studying the association between income and health.
However, NHIS nonresponse rates are high for the variables meant to capture total family income in the
previous calendar year. To handle the problem of missing data on family income in the NHIS, multiple
imputations were performed.25 Determining the ratio of family income to poverty threshold requires
information on family size, structure, and income. The ratio was calculated using poverty thresholds
published by the Census Bureau.
24 For more information about 2005 statistical areas, visit http://www.census.gov/programs-surveys/metro-micro.html. 25 For more information about multiple imputation of missing income data, see Schenker et al. (2006).

A Health Picture of HUD-Assisted Children, 2006–2012
Page 10
More than three-fourths of HUD-assisted children
resided in households with incomes below the
poverty threshold—40.7 percent of households
had a ratio of family income to the poverty
threshold below 0.5, and 35.6 percent had a ratio
between 0.5 and 1.0 (figure 5). Consistent with the
definition used to define the group, all children
residing in unassisted low-income renter
households had incomes below the federal poverty
threshold. Dissimilarly, among the general
population, one-half of children (51.5 percent)
resided in households with family incomes
exceeding twice the federal poverty threshold.
Family Structure
To determine family structure, variables meant to
capture the presence of various family members
were recoded to assess parental presence in a
household.26 Family structure, in terms of parents
present in the home, varied across the three child groups (figure 6). Most HUD-assisted children resided
in households with a mother and no father (74.6 percent), and few (3.2 percent) resided in households
with neither a mother nor father. Similarly, most (65.3 percent) unassisted low-income renter children
resided in households with a mother and no father. In contrast, most children (66.9 percent) in the
general child population resided in household with a mother and a father, and 27.1 percent resided in
households with a mother and no father present.
27.1
65.3
74.6
3.1
2.0
3.4
66.9
29.5
18.8
2.9
3.2
3.2
0% 10% 20% 30% 40% 50% 60% 70% 80% 90% 100%
General Population
Unassisted Low-Income Renter
HUD-Assisted
Weighted Percentage
Figure 6: Distribution of Children by Family Structure and Child Group, 2006–2012
Mother, No Father Father, No Mother Mother and Father Neither Mother Nor Father
SOURCE: Authors’ tabulations of NHIS-HUD Linked Data
26 Per NHIS documentation, the terms mother and father can include biological, adoptive, step, and foster relationships. The recoded variable does not classify legal guardians as parents.
40.7
35.6
19.9
3.9
0%
10%
20%
30%
40%
50%
60%
70%
80%
90%
100%
HUD-Assisted ChildrenW
eigh
ted
Per
cen
tage
Figure 5: Distribution of HUD-Assisted Children by the Ratio of Family Income to
Poverty Threshold, 2006–2012
2.00+
1.00-1.99
0.5-0.99
<0.5
SOURCE: Authors’ Tabulations of NHIS-HUD Linked Data

A Health Picture of HUD-Assisted Children, 2006–2012
Page 11
Highest Educational Attainment in Household
Administrative data are not meant for research purposes, so data collection instruments collect
information strictly pertinent to program participation. Extraneous nonprogram information generally
cannot be collected without proper authorization. Thus, administrative systems often lack key
sociodemographic variables, such as education level, for assessing social circumstance. The linked HUD-
NCHS data provide a mechanism to assess educational attainment among HUD-assisted families. The
NHIS data include a recoded variable that captures the highest education level attained by any adult in
the surveyed family. Previous research strongly suggests that parental educational level is a key predictor
of child outcomes (Dubow, Boxer, and Huesmann, 2009).
Only 4.3 percent of HUD-assisted children lived in a household in which at least one member had attained
a bachelor’s degree or higher, and 22.7 percent resided in households in which no member held a high
school diploma or a general educational development (GED) certificate (figure 7). Low-income unassisted
children were even more likely to reside in a household in which no one had earned either a high school
diploma or a GED (37 percent), and only 3.9 percent lived in a household in which a member had attained
a bachelor’s or higher degree. The rate of living with someone who had attained at least a bachelor’s
degree was much higher for children in the general population (32 percent).
11.4
37.0
22.7
22.0
34.2
34.5
34.5
25.0
38.5
32.0
3.9
4.3
0% 10% 20% 30% 40% 50% 60% 70% 80% 90% 100%
General Population
Unassisted Low-Income Renter
HUD-Assisted
Weighted Percentage
Figure 7: Distribution of Children by Highest Family Educational Attainment and Child Group, 2006–2012
Did not complete High School High school Graduate or GED
Some College or Associate's Degree Bachelor's Degree or Higher
SOURCE: Authors’ tabulations of NHIS-HUD Linked Data
Summary of Sociodemographic Characteristics Among HUD-Assisted Children Ages 0–17
Descriptive statistics reveal important variations in the distribution of sociodemographic characteristics
across the three child groups. Among HUD-assisted children, the largest proportions were Black (52.2
percent), the region with the largest proportion of HUD-assisted children was the South (44.1 percent),
and most HUD-assisted children lived in households with a mother but no father present (74.6 percent).
Additionally, pluralities of nearly one-third of HUD-assisted children resided in large metropolitan centers
A Health Picture of HUD-Assisted Children, 2006–2012
Page 12
(31.9 percent), and very few lived in rural counties. Nearly one-half (40.7 percent) lived in households
that had a ratio of family income to poverty threshold less than 0.5, which translates to approximately
$9,249 (or less) for a family of three with one adult and two children.27
Consistent with prior research, substantial sociodemographic differences were evident between the two
low-income groups and the general child population. For example, race and ethnicity varied across child
groups. Family structure also varied—HUD-assisted children were mostly in single-parent families, as are
low-income unassisted children, but the general child population had mostly two-parent families. Not
presented in these data is the significant fact that most U.S. households, including households with
children, are homeowners. The general population group thus includes homeowners, but the two renter
groups do not include homeowners. This difference is important, because housing tenure has
implications for the resources available to each group and for the health outcomes that follow (Pollack,
Griffin, and Lynch, 2010).
27 Estimate based on 2012 poverty thresholds published by the Census Bureau (U.S. Census Bureau, 2017).
A Health Picture of HUD-Assisted Children, 2006–2012
Page 13
Health Status Among Children Ages 0–17
Analyses examined individual-level health characteristics among HUD-assisted children and two relevant
child groups. Underlying data are presented in appendix table A-2, including weighted percentages and
standard error estimates for each group examined.
Reported Health Status
The NHIS asks a knowledgeable household adult to rate the sample child’s general health status on the
following five-point Likert scale—excellent, very good, good, fair, or poor. The distribution of general
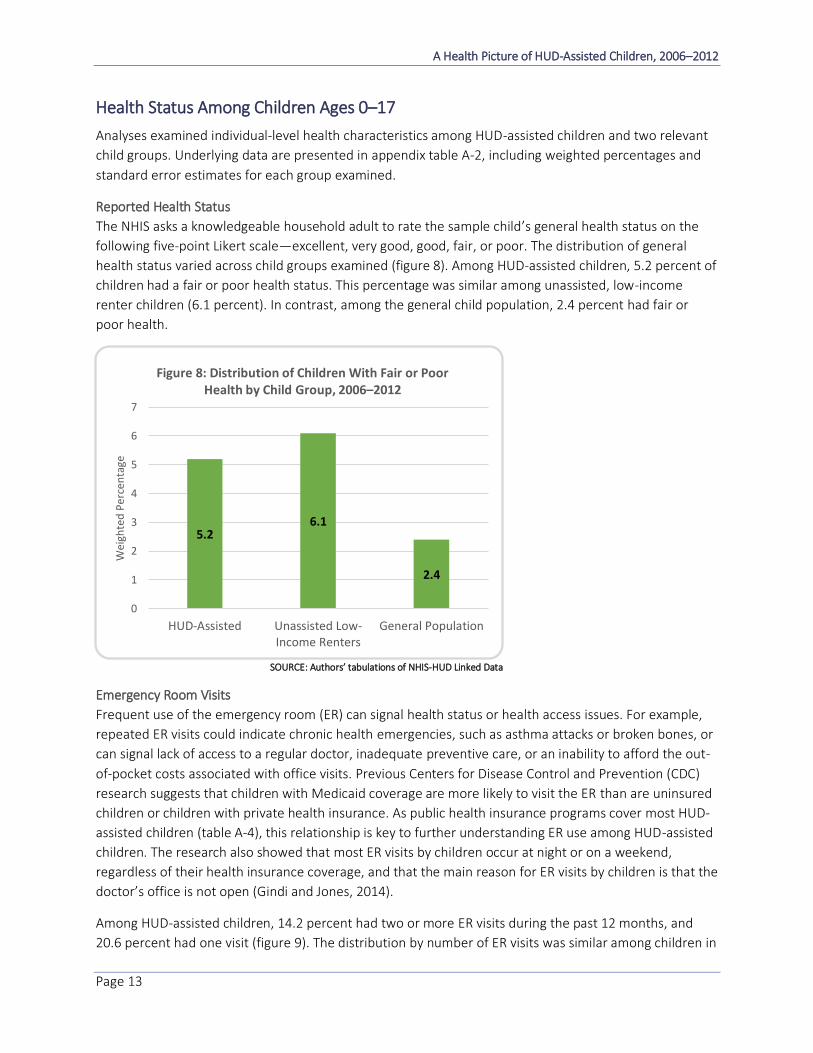
health status varied across child groups examined (figure 8). Among HUD-assisted children, 5.2 percent of
children had a fair or poor health status. This percentage was similar among unassisted, low-income
renter children (6.1 percent). In contrast, among the general child population, 2.4 percent had fair or
poor health.
5.26.1
2.4
0
1
2
3
4
5
6
7
HUD-Assisted Unassisted Low-Income Renters
General Population
Wei
ghte
d P
erce
nta
ge
Figure 8: Distribution of Children With Fair or Poor Health by Child Group, 2006–2012
SOURCE: Authors’ tabulations of NHIS-HUD Linked Data
Emergency Room Visits
Frequent use of the emergency room (ER) can signal health status or health access issues. For example,
repeated ER visits could indicate chronic health emergencies, such as asthma attacks or broken bones, or
can signal lack of access to a regular doctor, inadequate preventive care, or an inability to afford the out-
of-pocket costs associated with office visits. Previous Centers for Disease Control and Prevention (CDC)
research suggests that children with Medicaid coverage are more likely to visit the ER than are uninsured
children or children with private health insurance. As public health insurance programs cover most HUD-
assisted children (table A-4), this relationship is key to further understanding ER use among HUD-assisted
children. The research also showed that most ER visits by children occur at night or on a weekend,
regardless of their health insurance coverage, and that the main reason for ER visits by children is that the
doctor’s office is not open (Gindi and Jones, 2014).
Among HUD-assisted children, 14.2 percent had two or more ER visits during the past 12 months, and
20.6 percent had one visit (figure 9). The distribution by number of ER visits was similar among children in

A Health Picture of HUD-Assisted Children, 2006–2012
Page 14
unassisted, low-income renter households, of which 15.7 percent had two or more ER visits and 17.4
percent had one ER visit in the past 12 months. Among the general child population, a smaller proportion,
8.5 percent, had two or more ER visits and 14.8 percent had one ER visit. These results suggest that
children in the general population may have a qualitatively different pattern of ER usage than the two
groups of children residing in low-income, renter households.
76.7
66.9
65.1
14.8
17.4
20.6
8.5
15.7
14.2
0% 20% 40% 60% 80% 100%
General Population
Unassisted Low-Income Renters
HUD-Assisted
Weighted Percentage
Figure 9: Distribution of Children by Emergency Room Visits During the Past 12 Months and Child Group, 2006–2012
Zero One Two or More
SOURCE: Authors’ tabulations of NHIS-HUD Linked Data
Current Asthma
Asthma is a potentially fatal inflammatory disease that affects the lungs and is characterized by episodes
of wheezing, breathlessness, coughing, or chest tightness.28 Indoor environmental allergens, including
those found in substandard housing such as cockroach infestations or mold, are significant asthma
triggers. Early childhood exposure to cockroach allergen and mold have also been associated with asthma
development (Do, Zhao, and Gao, 2016; Jaakkola, Hwang, and Jaakkola, 2005; Reponen et al., 2011).
Traffic-related air pollution, which may be more concentrated in low-income neighborhoods, also is
associated with asthma development (Bowatte et al., 2015). NHIS sample children were considered to
have current asthma if the knowledgeable adult answered affirmatively to the sample child (1) ever
having had asthma and (2) still having asthma at the time of the health interview.
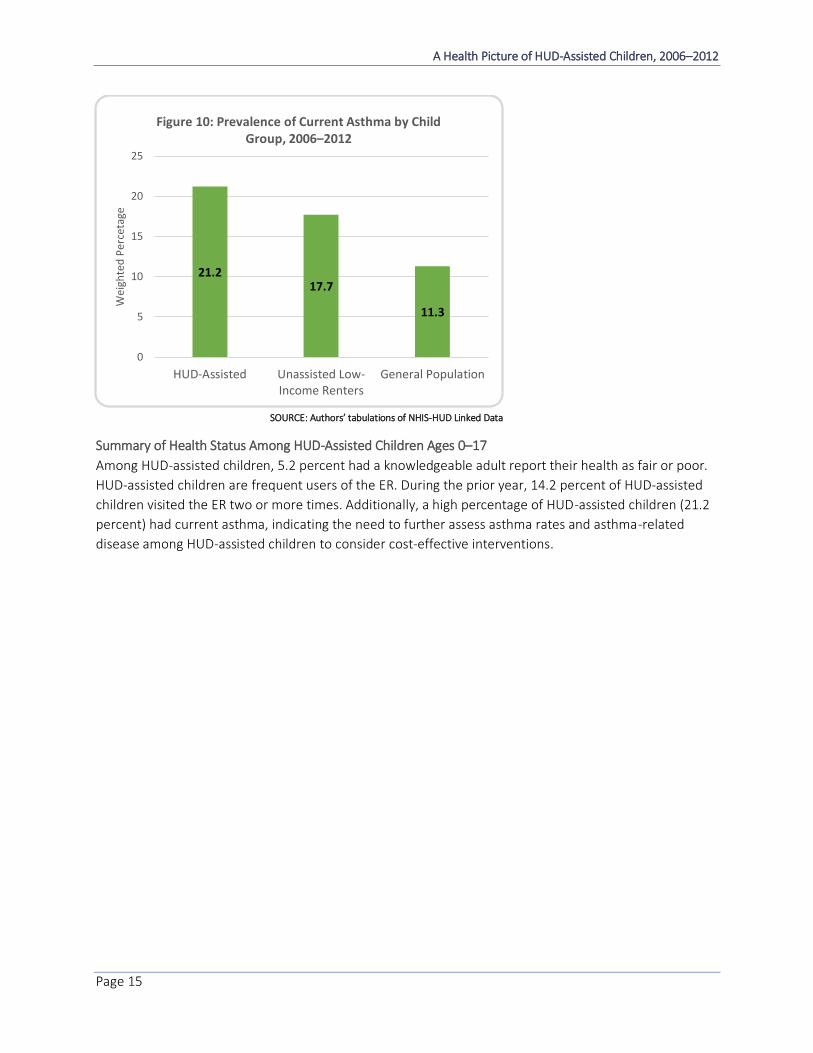
Among HUD-assisted children, 21.2 percent had current asthma (figure 10). Among unassisted children in
low-income renter households, 17.7 percent had current asthma, but only 11.3 percent of the general
child population had current asthma.29 Such disparities in asthma prevalence suggest the possibility that
poorly controlled asthma, including nighttime attacks, could be leading to greater ER use by children in
the HUD-assisted and unassisted low-income renter groups.
28 For more information about asthma, visit https://www.cdc.gov/asthma/. 29 Previous research shows a similar pattern of asthma disparities among HUD-assisted adults. See Helms, Sperling, and Steffen (2017).
A Health Picture of HUD-Assisted Children, 2006–2012
Page 15
21.217.7
11.3
0
5
10
15
20
25
HUD-Assisted Unassisted Low-Income Renters
General Population
Wei
ghte
d P
erce
tage
Figure 10: Prevalence of Current Asthma by Child Group, 2006–2012
SOURCE: Authors’ tabulations of NHIS-HUD Linked Data
Summary of Health Status Among HUD-Assisted Children Ages 0–17
Among HUD-assisted children, 5.2 percent had a knowledgeable adult report their health as fair or poor.
HUD-assisted children are frequent users of the ER. During the prior year, 14.2 percent of HUD-assisted
children visited the ER two or more times. Additionally, a high percentage of HUD-assisted children (21.2
percent) had current asthma, indicating the need to further assess asthma rates and asthma-related
disease among HUD-assisted children to consider cost-effective interventions.

A Health Picture of HUD-Assisted Children, 2006–2012
Page 16
Learning-Related Health Status Among School-Aged Children Ages 6–17
For school-aged children, the NHIS
collects several indicators relevant for
understanding school performance,
including school days missed due to
illness or injury and learning disability
status. This analysis examined such
indicators among school-aged HUD-
assisted children, children in
unassisted low-income households,
and children in the general child
population.
For the purposes of this report,
school-aged was defined as children
ages 6 to 17 years of age at the time of their health interview. Data are presented in table A-3, including
weighted percentages and standard error estimates for each of the three child groups.
School Days Missed
To assess the number of school days missed due to injury or illness, the following interview question was
asked about sample children ages 5 to 17 years: During the past 12 months, about how many days did
{Sample Child} miss school because of illness or injury?
Among HUD-assisted children, 16.2 percent of school-aged children missed 6 to 10 days of school during the
previous year, and 8.5 percent missed 11 or more days due to illness or injury (figure 11). Rates were similar
for children in unassisted, low-income renter households, with 13.8 percent missing 6 to 10 days of school
and 8.7 percent missing 11 or more days of school. Among children in the general population, 12.2 percent
missed 6 to 10 days of school during the previous year due to illness or injury, and 6.3 percent missed 11 or
more days.
25.4
27.5
25.4
56.2
50.0
49.9
12.2
13.8
16.2
6.3
8.7
8.5
0% 20% 40% 60% 80% 100%
General Population
Unassisted Low-Income Renters
HUD-Assisted
Weighted Percentage
Figure 11: Distribution of School Days Missed During the Past 12 Months
by Child Group, Ages 6–17, 2006–2012
0 Days 1-5 Days 6-10 Days 11+ Days
SOURCE: Authors’ tabulations of NHIS-HUD Linked Data

A Health Picture of HUD-Assisted Children, 2006–2012
Page 17
Any Learning Disability
Learning disorders are difficulties that a child experiences with one or more areas of learning that may or
may not affect overall intelligence or motivation. Learning disability symptoms include difficulties
concentrating, remembering instructions, and understanding the concept of time (CDC, 2017). Among
NHIS sample children,30 the following question was used to assess the prevalence of learning disabilities:
Has a representative from a school or a health professional ever told you that {Sample Child} had a
learning disability? Among HUD-assisted children, more than one-fourth (26.5 percent) of children ages 6
to 17 years had a learning disability reported by a school or health professional (figure 12). The
prevalence of any learning disability was similar among children in unassisted, low-income renter
households (24.4 percent), but among children in the general population, only 20.0 percent had a
learning disability as reported by a school or health professional. The “any learning disability” metric
included the most prevalent type of learning disorder among children, attention deficit hyperactivity
disorder (ADHD) or attention deficit disorder (ADD).
26.524.4
20.0
0
5
10
15
20
25
30
HUD-Assisted Unassisted Low-Income Renters
General Population
Wei
ghte
d P
erce
nta
ge
Figure 12: Prevalence of Any Learning Disability by Child Group, Ages 6–17, 2006–2012
SOURCE: Authors’ tabulations of NHIS-HUD Linked Data
Attention Deficit Hyperactivity Disorder or Attention Deficit Disorder
One of the most prevalent learning disorders among children is attention deficit hyperactivity disorder
(ADHD) or attention deficit disorder (ADD). ADHD/ADD, characterized by trouble paying attention, is a
common neurodevelopmental disorder among children that often continues into adulthood. The CDC
estimates that in 2011, 11 percent of children ages 4 to 17 years were diagnosed with ADHD/ADD (CDC,
2016). To assess the prevalence of ADHD/ADD, the following survey question was employed: Has a doctor
or health professional ever told you that {Sample Child} had [...] attention deficit hyperactivity disorder
(ADHD) or attention deficit disorder (ADD)? HUD-assisted children and children in unassisted low-income
30 This question is asked for sample children ages 3–17; however, for this metric, this report limited the study population to children ages 6–17.
A Health Picture of HUD-Assisted Children, 2006–2012
Page 18
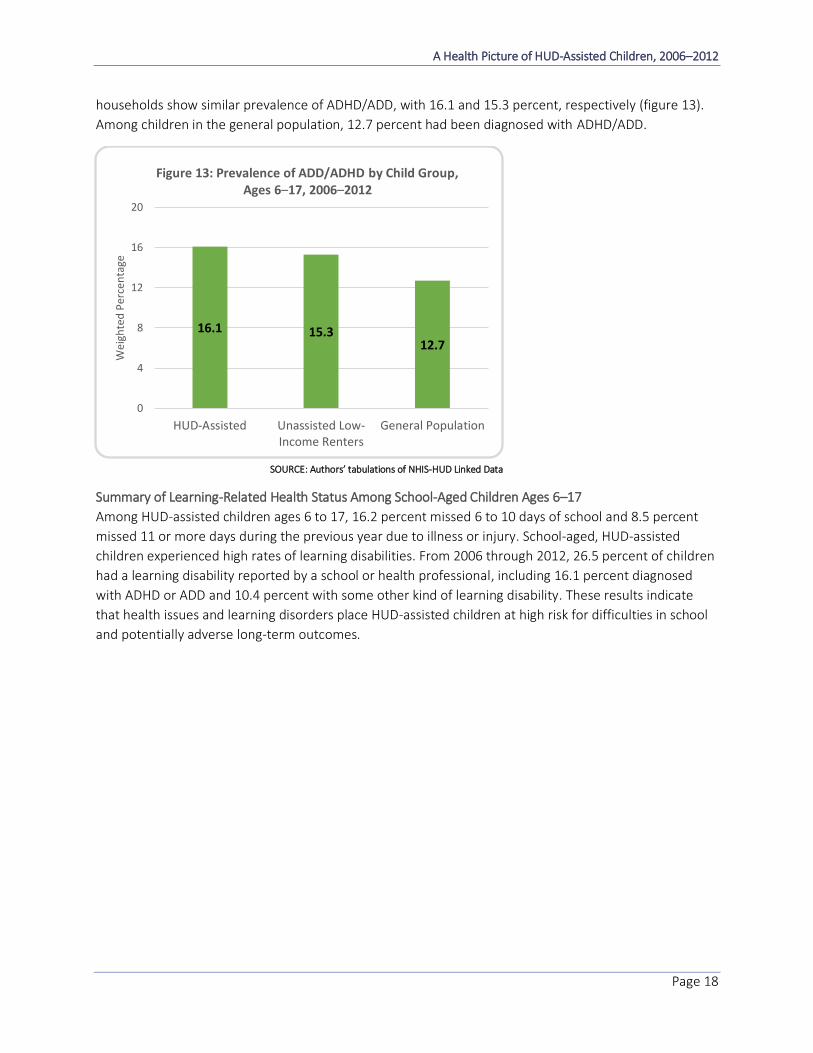
households show similar prevalence of ADHD/ADD, with 16.1 and 15.3 percent, respectively (figure 13).
Among children in the general population, 12.7 percent had been diagnosed with ADHD/ADD.
16.1 15.312.7
0
4
8
12
16
20
HUD-Assisted Unassisted Low-Income Renters
General Population
Wei
ghte
d P
erce
nta
ge
Figure 13: Prevalence of ADD/ADHD by Child Group, Ages 6–17, 2006–2012
SOURCE: Authors’ tabulations of NHIS-HUD Linked Data
Summary of Learning-Related Health Status Among School-Aged Children Ages 6–17
Among HUD-assisted children ages 6 to 17, 16.2 percent missed 6 to 10 days of school and 8.5 percent
missed 11 or more days during the previous year due to illness or injury. School-aged, HUD-assisted
children experienced high rates of learning disabilities. From 2006 through 2012, 26.5 percent of children
had a learning disability reported by a school or health professional, including 16.1 percent diagnosed
with ADHD or ADD and 10.4 percent with some other kind of learning disability. These results indicate
that health issues and learning disorders place HUD-assisted children at high risk for difficulties in school
and potentially adverse long-term outcomes.
A Health Picture of HUD-Assisted Children, 2006–2012
Page 19
Healthcare Access Among Children Ages 0–17
The NHIS asks survey participants several questions about sources of health care, including health
insurance coverage, access to general practitioners, medical specialists, and mental health professionals.
Appendix table A-4 contains weighted percentages and standard error estimates for each of the three
child groups examined.
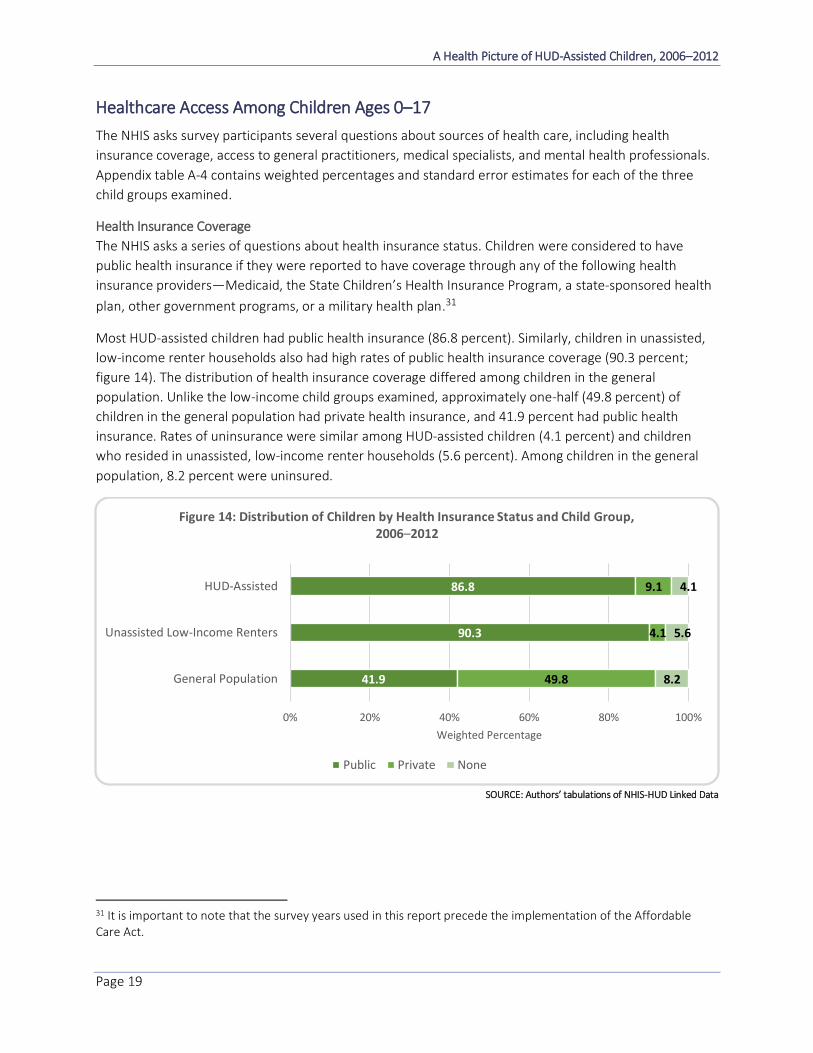
Health Insurance Coverage
The NHIS asks a series of questions about health insurance status. Children were considered to have
public health insurance if they were reported to have coverage through any of the following health
insurance providers—Medicaid, the State Children’s Health Insurance Program, a state-sponsored health
plan, other government programs, or a military health plan.31
Most HUD-assisted children had public health insurance (86.8 percent). Similarly, children in unassisted,
low-income renter households also had high rates of public health insurance coverage (90.3 percent;
figure 14). The distribution of health insurance coverage differed among children in the general
population. Unlike the low-income child groups examined, approximately one-half (49.8 percent) of
children in the general population had private health insurance, and 41.9 percent had public health
insurance. Rates of uninsurance were similar among HUD-assisted children (4.1 percent) and children
who resided in unassisted, low-income renter households (5.6 percent). Among children in the general
population, 8.2 percent were uninsured.
41.9
90.3
86.8
49.8
4.1
9.1
8.2
5.6
4.1
0% 20% 40% 60% 80% 100%
General Population
Unassisted Low-Income Renters
HUD-Assisted
Weighted Percentage
Figure 14: Distribution of Children by Health Insurance Status and Child Group, 2006–2012
Public Private None
SOURCE: Authors’ tabulations of NHIS-HUD Linked Data
31 It is important to note that the survey years used in this report precede the implementation of the Affordable Care Act.
A Health Picture of HUD-Assisted Children, 2006–2012
Page 20
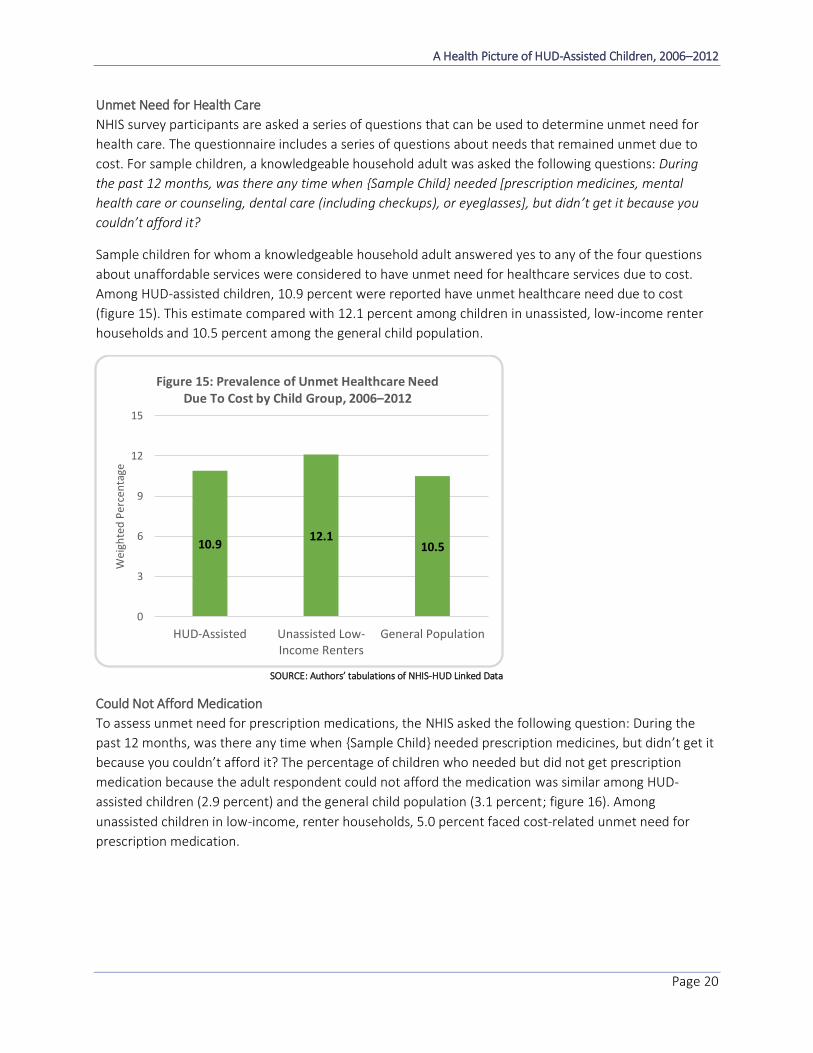
Unmet Need for Health Care
NHIS survey participants are asked a series of questions that can be used to determine unmet need for
health care. The questionnaire includes a series of questions about needs that remained unmet due to
cost. For sample children, a knowledgeable household adult was asked the following questions: During
the past 12 months, was there any time when {Sample Child} needed [prescription medicines, mental
health care or counseling, dental care (including checkups), or eyeglasses], but didn’t get it because you
couldn’t afford it?
Sample children for whom a knowledgeable household adult answered yes to any of the four questions
about unaffordable services were considered to have unmet need for healthcare services due to cost.
Among HUD-assisted children, 10.9 percent were reported have unmet healthcare need due to cost
(figure 15). This estimate compared with 12.1 percent among children in unassisted, low-income renter
households and 10.5 percent among the general child population.
10.912.1
10.5
0
3
6
9
12
15
HUD-Assisted Unassisted Low-Income Renters
General Population
Wei
ghte
d P
erce
nta
ge
Figure 15: Prevalence of Unmet Healthcare Need Due To Cost by Child Group, 2006–2012
SOURCE: Authors’ tabulations of NHIS-HUD Linked Data
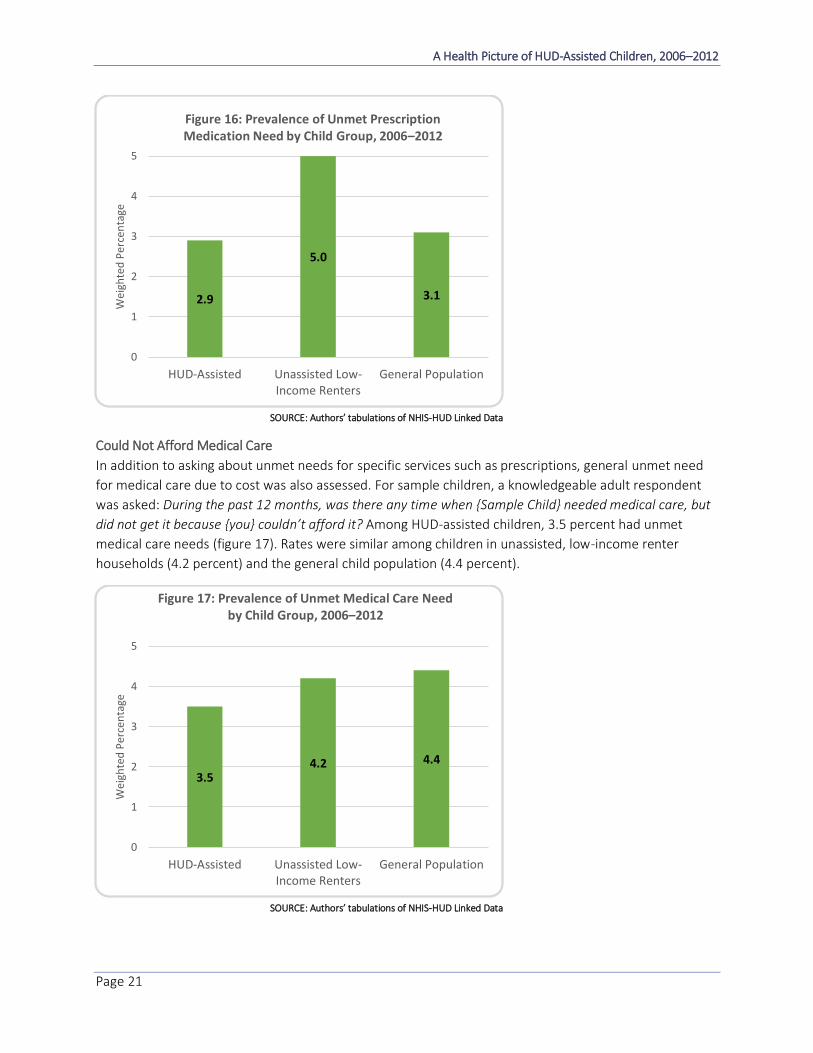
Could Not Afford Medication
To assess unmet need for prescription medications, the NHIS asked the following question: During the
past 12 months, was there any time when {Sample Child} needed prescription medicines, but didn’t get it
because you couldn’t afford it? The percentage of children who needed but did not get prescription
medication because the adult respondent could not afford the medication was similar among HUD-
assisted children (2.9 percent) and the general child population (3.1 percent; figure 16). Among
unassisted children in low-income, renter households, 5.0 percent faced cost-related unmet need for
prescription medication.
A Health Picture of HUD-Assisted Children, 2006–2012
Page 21
2.9
5.0
3.1
0
1
2
3
4
5
HUD-Assisted Unassisted Low-Income Renters
General Population
Wei
ghte
d P
erce
nta
geFigure 16: Prevalence of Unmet Prescription Medication Need by Child Group, 2006–2012
SOURCE: Authors’ tabulations of NHIS-HUD Linked Data
Could Not Afford Medical Care
In addition to asking about unmet needs for specific services such as prescriptions, general unmet need
for medical care due to cost was also assessed. For sample children, a knowledgeable adult respondent
was asked: During the past 12 months, was there any time when {Sample Child} needed medical care, but
did not get it because {you} couldn’t afford it? Among HUD-assisted children, 3.5 percent had unmet
medical care needs (figure 17). Rates were similar among children in unassisted, low-income renter
households (4.2 percent) and the general child population (4.4 percent).
3.54.2 4.4
0
1
2
3
4
5
HUD-Assisted Unassisted Low-Income Renters
General Population
Wei
ghte
d P
erce
nta
ge
Figure 17: Prevalence of Unmet Medical Care Need by Child Group, 2006–2012
SOURCE: Authors’ tabulations of NHIS-HUD Linked Data

A Health Picture of HUD-Assisted Children, 2006–2012
Page 22
Well-Child Visits
To assess the occurrence of regular physicals and well-child visits, the following questions were asked:
During the past 12 months, did {Sample Child} receive a well-child checkup—that is, a general checkup
when {he/she} was not sick or injured? Consistent with the prevalence of public insurance, the prevalence
of well-child visits among HUD-assisted children was high—84.4 percent had a well-child visit in the past
year (figure 18). Among children in unassisted, low-income renter households, 80.2 percent had a well-
child visit during the prior 12 months. The prevalence of well-child visits among children in the general
population was 76.8 percent.
84.4 80.2 76.8
0
20
40
60
80
100
HUD-Assisted Unassisted Low-Income Renters
General Population
Wei
ghte
d P
erce
nta
ge
Figure 18: Prevalence of Well-Child Visits by Child Group, 2006–2012
SOURCE: Authors’ tabulations of NHIS-HUD Linked Data
General Doctor Visits
The NHIS asks survey participants several questions about healthcare sources, including the following
question meant to capture whether the sample child had contact with a general practitioner during the
prior year: During the past 12 months, have you seen or talked to the following about [Sample Child]’s
health? A general doctor who treats a variety of illnesses (a doctor in general practice, pediatrics, family
medicine, or internal medicine)? Estimated rates of general doctor visits were similar to rates of well-child
visits. Among HUD-assisted children, 85.9 percent had visited a general doctor during the prior year
(figure 19). Lower rates were observed among children in unassisted low-income renter households (83.3
percent) and the general child population (82.9 percent).

A Health Picture of HUD-Assisted Children, 2006–2012
Page 23
85.9 83.3 82.9
0
20
40
60
80
100
HUD-Assisted Unassisted Low-Income Renters
General Population
Wei
ghte
d P
erce
nta
geFigure 19: Prevalence of General Doctor Visits by Child
Group, 2006–2012
SOURCE: Authors’ tabulations of NHIS-HUD Linked Data
Specialist Visits
To find out whether children in respondent households had visited a medical specialist, the NHIS included
the following question: During the past 12 months, have you seen or talked to the following about
{Sample Child}’s health? A medical doctor who specializes in a particular medical disease or problem.
According to the survey instrument, a specialist is defined in NHIS as a “medical doctor who specializes in
a particular medical disease or problem (other than obstetrician/gynecologist, psychiatrist or
ophthalmologist).” Among HUD-assisted children, 14.4 percent were reported to have visited a specialist
during the past year (figure 20). Children in the general population had slightly more visits to specialists
(16.1 percent), and children in unassisted low-income renter households had slightly fewer (12.6
percent).

A Health Picture of HUD-Assisted Children, 2006–2012
Page 24
14.412.6
16.1
0
4
8
12
16
20
HUD-Assisted Unassisted Low-Income Renters
General Population
Wei
ghte
d P
erce
nta
geFigure 20: Prevalence of Specialist Visit by Child
Group, 2006–2012
SOURCE: Authors’ tabulations of NHIS-HUD Linked Data
No Usual Source of Care
Usual source of health care among sample children was examined using the following question, which
was asked to a knowledgeable adult: Is there a place that {Sample Child} usually goes when {he/she} is sick
or needs advice about {his/her} health? If survey respondents said the sample child had no usual place,
then the child was classified as having no usual source of care. In each of the three child groups, very few
children lacked a usual source of care. HUD-assisted children were the least likely to lack a usual source of
care (1.6 percent; figure 21). Among the general child population, a similar proportion of 2.7 percent
lacked a usual source of care. Among unassisted low-income renter children, 3.3 percent were reported
to have no usual source of care.
1.6
3.3
2.7
0
0.5
1
1.5
2
2.5
3
3.5
HUD-Assisted Unassisted Low-Income Renters
General Population
Wei
ghte
d P
erce
nta
ge
Figure 21: Prevalence of No Usual Source of Care by Child Group, 2006–2012
SOURCE: Authors’ tabulations of NHIS-HUD Linked Data

A Health Picture of HUD-Assisted Children, 2006–2012
Page 25
Summary of Healthcare Utilization and Access Among Children Ages 0–17
The clear majority of HUD-assisted children ages 0–17 years had insurance coverage via public health
insurance programs (86.8 percent). HUD-assisted children were uninsured at a lower rate (4.1 percent)
than uninsured children in the general child population (8.2 percent). The percentage of HUD-assisted
children with unmet need for medical care (3.5 percent) was similar to the proportion among children in
the general population (4.4 percent). Most HUD-assisted children were reported to have had a well-child
visit (84.4 percent) or general doctor visit during the prior year (85.9 percent).
A Health Picture of HUD-Assisted Children, 2006–2012
Page 26
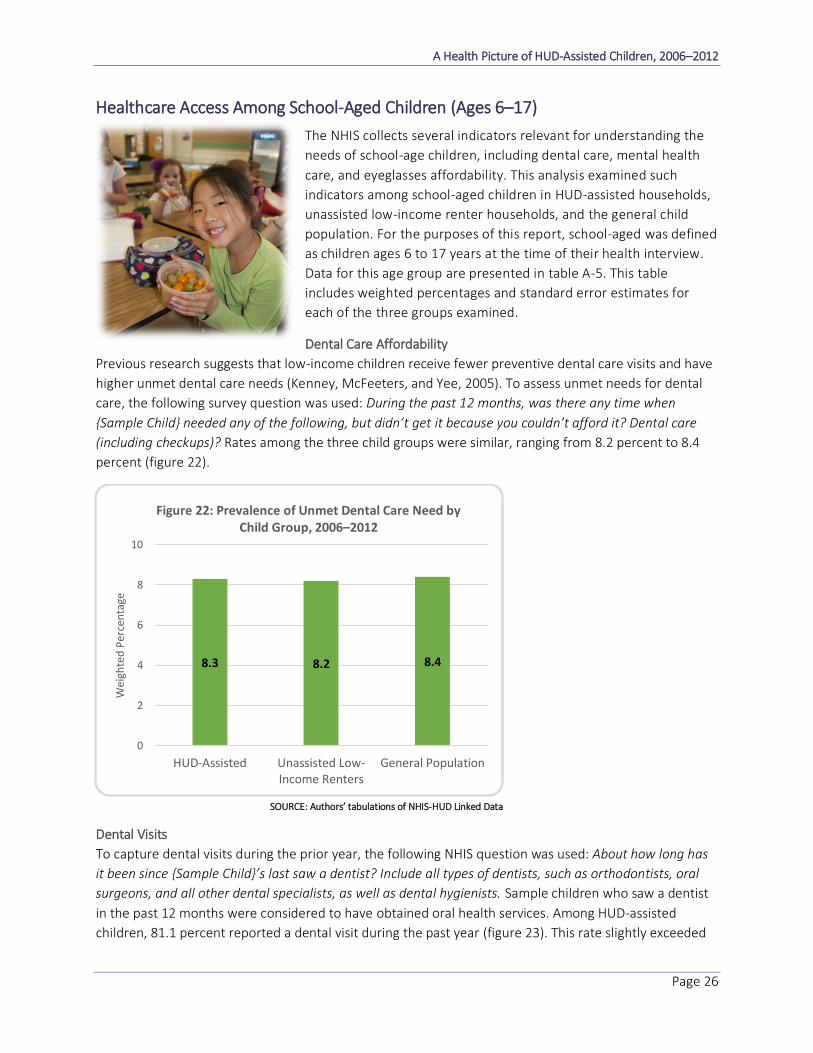
Healthcare Access Among School-Aged Children (Ages 6–17)
The NHIS collects several indicators relevant for understanding the
needs of school-age children, including dental care, mental health
care, and eyeglasses affordability. This analysis examined such
indicators among school-aged children in HUD-assisted households,
unassisted low-income renter households, and the general child
population. For the purposes of this report, school-aged was defined
as children ages 6 to 17 years at the time of their health interview.
Data for this age group are presented in table A-5. This table
includes weighted percentages and standard error estimates for
each of the three groups examined.
Dental Care Affordability
Previous research suggests that low-income children receive fewer preventive dental care visits and have
higher unmet dental care needs (Kenney, McFeeters, and Yee, 2005). To assess unmet needs for dental
care, the following survey question was used: During the past 12 months, was there any time when
{Sample Child} needed any of the following, but didn’t get it because you couldn’t afford it? Dental care
(including checkups)? Rates among the three child groups were similar, ranging from 8.2 percent to 8.4
percent (figure 22).
8.3 8.2 8.4
0
2
4
6
8
10
HUD-Assisted Unassisted Low-Income Renters
General Population
Wei
ghte
d P
erce
nta
ge
Figure 22: Prevalence of Unmet Dental Care Need by Child Group, 2006–2012
SOURCE: Authors’ tabulations of NHIS-HUD Linked Data
Dental Visits
To capture dental visits during the prior year, the following NHIS question was used: About how long has
it been since {Sample Child}’s last saw a dentist? Include all types of dentists, such as orthodontists, oral
surgeons, and all other dental specialists, as well as dental hygienists. Sample children who saw a dentist
in the past 12 months were considered to have obtained oral health services. Among HUD-assisted
children, 81.1 percent reported a dental visit during the past year (figure 23). This rate slightly exceeded

A Health Picture of HUD-Assisted Children, 2006–2012
Page 27
the prevalence among children of unassisted low-income renters (79.8 percent) but was lower than the
rate among children in the general population (84.5 percent).
81.1 79.8 84.5
0
20
40
60
80
100
HUD-Assisted Unassisted Low-Income Renters
General Population
Wei
ghte
d P
erce
nta
ge
Figure 23: Prevalence of Dental Visits During the Prior Year by Child Group, 2006–2012
SOURCE: Authors’ tabulations of NHIS-HUD Linked Data
Mental Healthcare Affordability
The following question was used to measure unmet need for mental health care due to lack of
affordability: During the past 12 months, was there any time when {Sample Child} needed any of the
following, but didn’t get it because you couldn’t afford it? Mental health care or counseling? Rates were
similar across all three child groups examined. Among HUD-assisted children, 2.5 percent were reported
to have unmet mental healthcare need. Among the general child population, 1.5 percent of children had
unmet mental healthcare need due to affordability (figure 24).
2.5
1.81.5
0
1
2
3
HUD-Assisted Unassisted Low-Income Renters
General Population
Wei
ghte
d P
erce
nta
ge
Figure 24: Prevalence of Unmet Mental Health Care Need by Child Group, 2006–2012
SOURCE: Authors’ tabulations of NHIS-HUD Linked Data
A Health Picture of HUD-Assisted Children, 2006–2012
Page 28
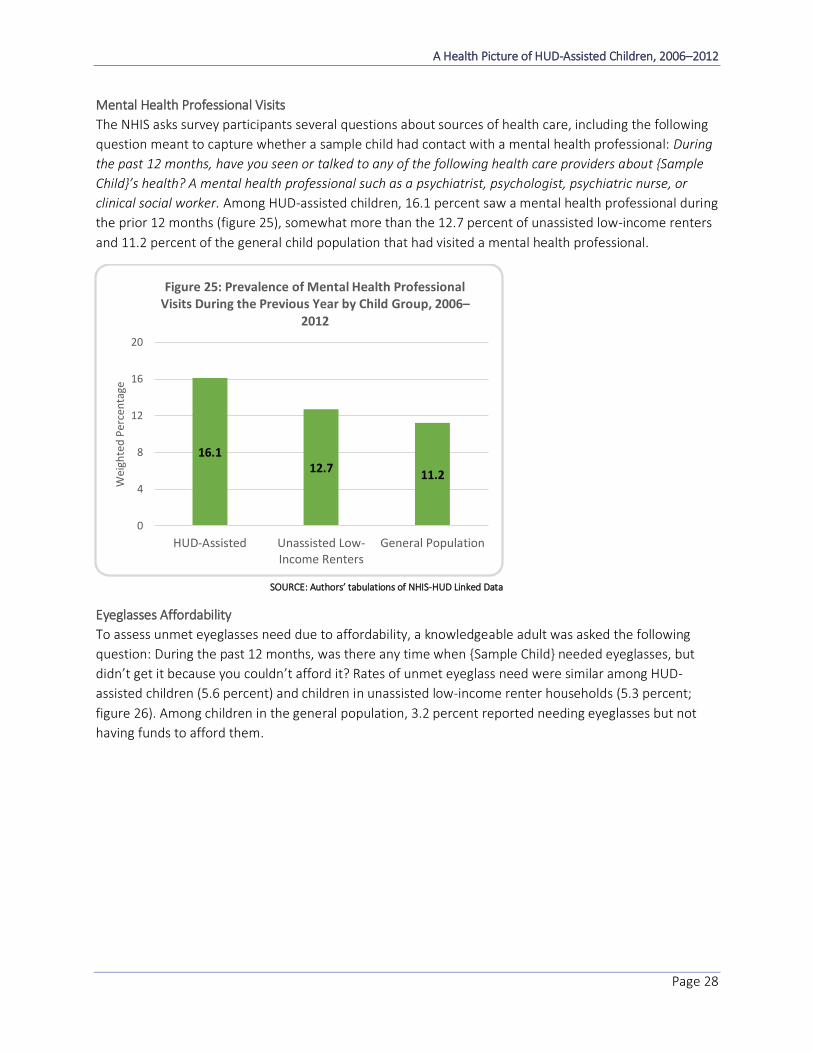
Mental Health Professional Visits
The NHIS asks survey participants several questions about sources of health care, including the following
question meant to capture whether a sample child had contact with a mental health professional: During
the past 12 months, have you seen or talked to any of the following health care providers about {Sample
Child}’s health? A mental health professional such as a psychiatrist, psychologist, psychiatric nurse, or
clinical social worker. Among HUD-assisted children, 16.1 percent saw a mental health professional during
the prior 12 months (figure 25), somewhat more than the 12.7 percent of unassisted low-income renters
and 11.2 percent of the general child population that had visited a mental health professional.
16.112.7
11.2
0
4
8
12
16
20
HUD-Assisted Unassisted Low-Income Renters
General Population
Wei
ghte
d P
erce
nta
ge
Figure 25: Prevalence of Mental Health Professional Visits During the Previous Year by Child Group, 2006–
2012
SOURCE: Authors’ tabulations of NHIS-HUD Linked Data
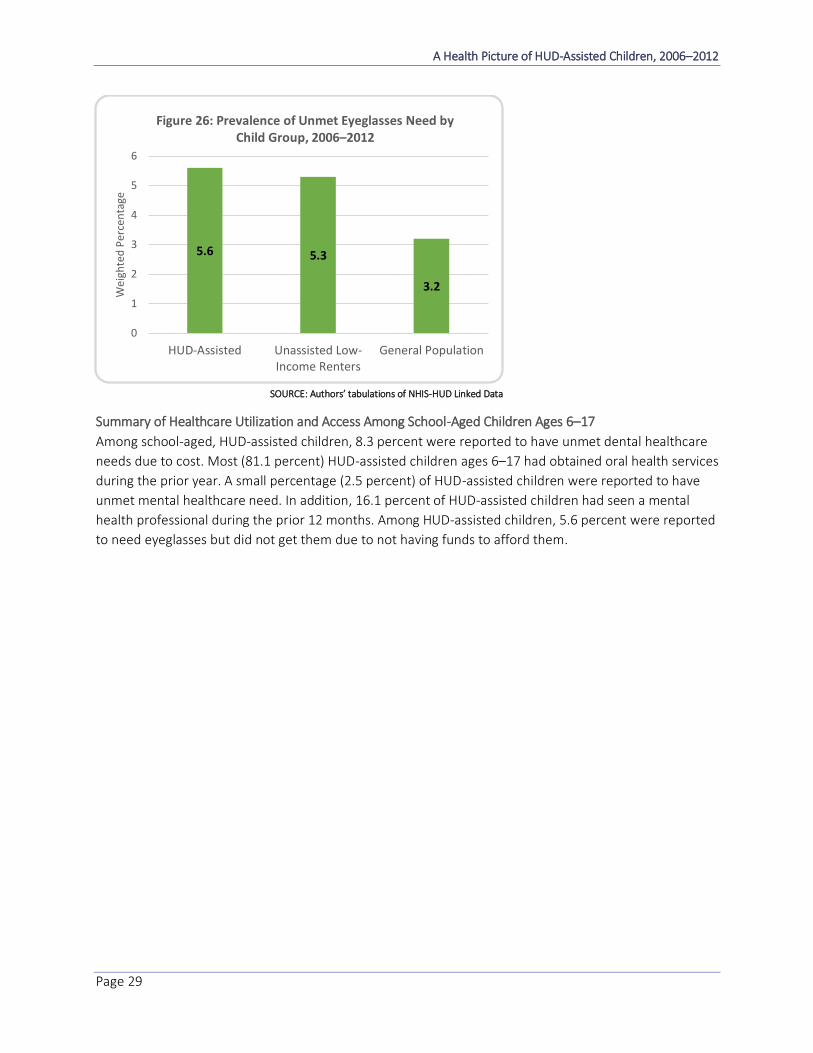
Eyeglasses Affordability
To assess unmet eyeglasses need due to affordability, a knowledgeable adult was asked the following
question: During the past 12 months, was there any time when {Sample Child} needed eyeglasses, but
didn’t get it because you couldn’t afford it? Rates of unmet eyeglass need were similar among HUD-
assisted children (5.6 percent) and children in unassisted low-income renter households (5.3 percent;
figure 26). Among children in the general population, 3.2 percent reported needing eyeglasses but not
having funds to afford them.
A Health Picture of HUD-Assisted Children, 2006–2012
Page 29
5.6 5.3
3.2
0
1
2
3
4
5
6
HUD-Assisted Unassisted Low-Income Renters
General Population
We
igh
ted
Per
cen
tage
Figure 26: Prevalence of Unmet Eyeglasses Need by Child Group, 2006–2012
SOURCE: Authors’ tabulations of NHIS-HUD Linked Data
Summary of Healthcare Utilization and Access Among School-Aged Children Ages 6–17
Among school-aged, HUD-assisted children, 8.3 percent were reported to have unmet dental healthcare
needs due to cost. Most (81.1 percent) HUD-assisted children ages 6–17 had obtained oral health services
during the prior year. A small percentage (2.5 percent) of HUD-assisted children were reported to have
unmet mental healthcare need. In addition, 16.1 percent of HUD-assisted children had seen a mental
health professional during the prior 12 months. Among HUD-assisted children, 5.6 percent were reported
to need eyeglasses but did not get them due to not having funds to afford them.

A Health Picture of HUD-Assisted Children, 2006–2012
Page 30
Conclusion
Analyses provided a descriptive summary of the linked 2006-to-2012 HUD-NCHS data for HUD-assisted
children. This report presents the first nationally representative estimates of the overall health status,
including healthcare access and utilization, for HUD-assisted children. Findings represent a first step in
sharing an important data resource for housing and health researchers and the general public.
Although statistical testing between groups was not conducted, clear differences emerged when
examining side-by-side estimates among HUD-assisted children, children residing in low-income,
unassisted renter households, and children in the general population. Examining sociodemographic
characteristics of the three child groups showed that unassisted, low-income children of renters and
HUD-assisted children were similar, but that these groups differ substantially from the general child
population. Notably, more than one-half of HUD-assisted children are Black; only one-third of low-income
unassisted children and less than one-fifth of the general child populations are Black. HUD-assisted
children and low-income unassisted children tend to live in major metropolitan areas, but the general
child population is concentrated outside of these areas. Additionally, the educational attainment in HUD-
assisted families exceeds attainment of low-income unassisted families but is much lower than families in
the general population. The demographic differences between child groups should be considered when
examining differences among the health indicators presented throughout this report.
In terms of health status, HUD-assisted children are like other low-income, unassisted renter children.
However, HUD-assisted children appear to have worse health status than children in the general
population, despite appearing to have greater access to health care and higher utilization. For example,
86.8 percent of HUD-assisted children had public health insurance, and 85.9 percent visited a general
health doctor during the prior year. However, even with high rates of healthcare access, 14.2 percent of
HUD-assisted children visited the ER two or more times during the prior year, and more than one-fifth of
HUD-assisted children had current asthma. Poverty, quality of healthcare resources, and neighborhood
conditions may account for much of these differences, but further research is needed to understand this
relationship.
School-aged, HUD-assisted children have high rates of learning disabilities: 26.5 percent had ever been
told by a school or health professional that they had a learning disability, and 16.1 percent had been
diagnosed with ADHD or ADD. In terms of dental healthcare needs, 8.3 percent of HUD-assisted children
had unmet dental healthcare needs due to cost, but most (81.1 percent) had obtained oral health
services during the prior year. HUD-assisted children had high mental healthcare needs. During the prior
12 months, 16.1 percent had seen a mental health professional, and 2.5 percent were reported to have
had unmet needs for mental health care.
Overall, the health status of HUD-assisted children is similar to children in unassisted, low-income renter
households but several key findings emerged: HUD-assisted children are more likely to have asthma,
more likely to miss school due to illness or injury, and are more often diagnosed with a learning disability.
On other indicators, however, HUD-assisted children displayed some advantages over children in
unassisted, low-income renter households, such as greater prevalence of health insurance and of well-
child preventive healthcare visits. Such conclusions, however, must be viewed as exploratory and
preliminary. Assisted housing programs may shape selection mechanisms so that less-healthy populations
A Health Picture of HUD-Assisted Children, 2006–2012
Page 31
become assisted. For this reason, the descriptive nature of this research cannot determine the extent to
which assisted housing influences health. Nevertheless, HUD-assisted populations have significant health
needs that warrant attention by policymakers.
The United States makes substantial public investments in both housing and health care every year. Using
these newly linked data to better align housing assistance programs and health policy has the potential to
improve the cost effectiveness and outcomes of public investments. Considering that children are in
vulnerable early stages of development, interventions to address specific health needs at an early stage
or to better coordinate the existing health services available to assisted housing populations can yield
great benefits during the life course for young, developing individuals and the broader society.

A Health Picture of HUD-Assisted Children, 2006–2012
Page 32
References
Ahrens, Katherine A., Barbara A. Haley, Lauren M. Rossen, Patricia C. Lloyd, and Yutaka Aoki. 2016.
“Housing Assistance and Blood Lead Levels: Children in the United States, 2005–2012,” American Journal
of Public Health 106 (11): 2049–2056.
Bowatte, Gayan, C. Lodge, A.J. Lowe, B. Erbas, J. Perret, M.J. Abramson, M. Matheson, and Shyamali
Dharmage. 2015. “The Influence of Childhood Traffic-Related Air Pollution Exposure on Asthma, Allergy
and Sensitization: A Systematic Review and a Meta-Analysis of Birth Cohort Studies,” Allergy 70 (3): 245–
256.
Centers for Disease Control and Prevention (CDC). 2016. “Attention-Deficit / Hyperactivity Disorder
(ADHD).” https://www.cdc.gov/ncbddd/adhd/data.html.
———. 2017. “Learning Disorder.” https://www.cdc.gov/ncbddd/childdevelopment/learning-
disorder.html.
Do, D.C., Y. Zhao, and P. Gao. 2016. “Cockroach Allergen Exposure and Risk of Asthma,” Allergy 71 (4):
463–474.
Dubow, Eric F., Paul Boxer, and L. Rowell Huesmann. 2009. “Long-Term Effects of Parents’ Education on
Children’s Educational and Occupational Success: Mediation by Family Interactions, Child Aggression, and
Teenage Aspirations,” Merrill-Palmer Quarterly 55 (3): 224–249.
Evans, Gary W., Nancy M. Wells, and Annie Moch. 2003. “Housing and Mental Health: A Review of the
Evidence and a Methodological and Conceptual Critique,” Journal of Social Issues 59 (3): 475–500.
Federal Interagency Forum on Child and Family Statistics. 2016. America’s Children in Brief: Key National
Indicators of Well-Being, 2016. Washington, DC: U.S. Government Printing Office. 60 p.
https://www.childstats.gov/pdf/ac2016/ac_16.pdf.
Fenelon, Andrew, Patrick Mayne, Alan Simon, Lauren M. Rossen, Veronica Helms, Patricia Lloyd, Jon
Sperling, and Barry L. Steffen. 2017. “Housing Assistance Programs and Adult Health in the United States,”
American Journal of Public Health 107 (4): 571–578.
Fisk, William J., Ekaterina A. Eliseeva, and Mark J. Mendell. 2010. “Association of Residential Dampness
and Mold With Respiratory Tract Infections and Bronchitis: A Meta-Analysis,” Environmental Health 9
(72): 1–11.
Gindi, Renee M., and Lindsey Jones. 2014. “Reasons for Emergency Room Use Among U.S. Children:
National Health Interview Survey, 2012.” https://www.cdc.gov/nchs/data/databriefs/db160.pdf.
Healthy People 2020 (HP2020). 2016. “Social Determinants of Health.”
https://www.healthypeople.gov/2020/topics-objectives/topic/social-determinants-of-health.
Helms, Veronica E., Jon Sperling, and Barry L. Steffen. 2017. A Health Picture of HUD-Assisted Adults,
2006–2012: HUD Administrative Data Linked With the National Health Interview Survey. Washington, DC:
U.S. Department of Housing and Urban Development, Office of Policy Development and Research. 55 p.
https://www.huduser.gov/portal/publications/Health-Picture-of-HUD.html.

A Health Picture of HUD-Assisted Children, 2006–2012
Page 33
Jaakkola, Jouni J., Bing-Fang Hwang, and Niina Jaakkola. 2005. Home Dampness and Molds, Parental
Atopy, and Asthma in Childhood: a Six-Year Population-Based Cohort Study,” Environmental Health
Perspectives 113 (3): 357.
Kenney, Genevieve M., Joshua R. McFeeters, and Justin Y. Yee. 2005. “Preventive Dental Care and Unmet
Dental Needs Among Low-Income Children,” American Journal of Public Health 95 (8): 1360–1366.
Krieger, James, and Donna L. Higgins. 2002. “Housing and Health: Time Again for Public Health Action,”
American Journal of Public Health 92 (5): 758–768.
Lloyd, Patricia, and Veronica Helms. 2016. NCHS-HUD Linked Data: Analytic Considerations and
Guidelines. Hyattsville, MD: National Center for Health Statistics, Office of Analysis and Epidemiology. 70
p. http://www.cdc.gov/nchs/data/datalinkage/nchs_hud_analytic_considerations.pdf.
Lloyd, Patricia C., Veronica Helms, Alan Simon, and Cordell Golden. Forthcoming. Linkage of 1999–2012
National Health Interview Survey (NHIS) and 1999–2012 National Health Examination Survey (NHANES) to
Administrative Records From the U.S. Department of Housing and Urban (HUD). Hyattsville, MD: U.S.
Department of Health and Human Services, Centers for Disease Control and Prevention, National Center
for Health Statistics.
National Center for Health Statistics (NCHS). 2013a. “2012 National Health Interview Survey (NHIS) Public
Use Data Release: NHIS Survey Description.”
ftp://ftp.cdc.gov/pub/Health_Statistics/NCHS/Dataset_Documentation/NHIS/2012/srvydesc.pdf.
———. 2013b. Multiple Imputation of Family Income and Personal Earning in the National Health
Interview Survey: Methods and Examples. Hyattsville, MD: U.S. Department of Health and Human
Services, Centers for Disease Control and Prevention, National Center for Health Statistics.
———. 2014. “NCHS Urban-Rural Classification Scheme for Counties.”
https://www.cdc.gov/nchs/data_access/urban_rural.htm.
———. 2016. “NCHS Data Linkage: Match Rate Tables.” http://www.cdc.gov/nchs/data-linkage/hud-
methods.htm.
Pollack, Craig Evan, Beth Ann Griffin, and Julia Lynch. 2010. “Housing Affordability and Health Among
Homeowners and Renters,” American Journal of Preventive Medicine 39 (6): 515–521.
Reponen, Tina, Stephen Vesper, Linda Levin, Elisabet Johansson, Patrick Ryan, Jeffery Burkle, Sergey A.
Grinshpun, Shu Zheng, David I. Bernstein, James Lockey, Manuel Villareal, Gurjit K. Khurana Hershey, and
Grace LeMasters. 2011. “High Environmental Relative Moldiness Index During Infancy as a Predictor of
Asthma at 7 Years of Age,” Annals of Allergy, Asthma & Immunology 107 (2): 120–126.
Schenker, Nathaniel, Trivellore E. Raghunathan, Pei-Lu Chiu, Diane M. Makuc, Guangyu Zhang, and Alan J.
Cohen. 2006. “Multiple Imputation of Missing Income Data in the National Health Interview Survey,”
Journal of the American Statistical Association 101 (475): 924–933.
A Health Picture of HUD-Assisted Children, 2006–2012
Page 34
Sperling, Jon, and Veronica Helms. 2016. “Linking National Health Surveys and HUD Administrative Data,
an Interview With Jon Sperling & Veronica Helms.” https://www.huduser.gov/portal/pdredge/pdr-edge-
trending-012516.html.
U.S. Census Bureau. 2017. “Poverty Thresholds.” https://www.census.gov/data/tables/time-
series/demo/income-poverty/historical-poverty-thresholds.html.
Watson, Nicole Elsasser, Barry L. Steffen, Marge Martin, and David A. Vandenbroucke. 2017. Worst Case
Housing Needs: 2017 Report to Congress. Washington, DC: U.S. Department of Housing and Urban
Development, Office of Policy Development and Research.

A Health Picture of HUD-Assisted Children, 2006–2012
Page 35
Appendix
Table A-1: Demographic and Socioeconomic Characteristics of Linkage-Eligible U.S. Children Ages 0–17, by
HUD Assistance, Tenure, and Low-Income Status (Weighted NHIS-HUD Linked Data, 2006–2012)
Table A-2: Health Status of Linkage-Eligible U.S. Children Ages 0–17, by HUD Assistance, Tenure, and Low-
Income Status (Weighted NHIS-HUD Linked Data, 2006–2012)
Table A-3: Learning-Related Health Status of Linkage-Eligible, School-Aged U.S. Children Ages 6–17, by
HUD Assistance, Tenure, and Low-Income Status (Weighted NHIS-HUD Linked Data, 2006–2012)
Table A-4: Healthcare Access, Utilization, and Affordability of Linkage-Eligible U.S. Children Ages 0–17, by
HUD Assistance, Tenure, and Low-Income Status (Weighted NHIS-HUD Linked Data, 2006–2012)
Table A-5: Healthcare Access, Utilization, and Affordability of Linkage-Eligible, School-Ages U.S. Children
Ages 6–17, by HUD Assistance, Tenure, and Low-Income Status (Weighted NHIS-HUD Linked Data, 2006–
2012)

A Health Picture of HUD-Assisted Children, 2006–2012
Page 36
Table A-1: Demographic and Socioeconomic Characteristics of Linkage-Eligible U.S. Children Ages 0–17, by HUD Assistance, Tenure, and Low-Income
Status (Weighted NHIS-HUD Linked Data, 2006–2012)
HUD-Assisted Children (n = 1,516)
Children Residing in Unassisted Low-Income Renter Households
(n = 1,844)
General Child Population (n = 25,018)
Characteristic n % (SE) n % (SE) n % (SE) Age at interview (years) 0–5 507 35.6 (1.67) 844 46.4 (1.70) 8,427 33.8 (0.41) 6–11 554 37.1 (1.66) 560 32.8 (1.45) 7,461 32.5 (0.40) 12–17 455 27.3 (1.64) 440 20.8 (1.44) 9,130 33.7 (0.41) Sex Male 750 49.2 (1.56) 940 51.9 (1.69) 12,827 51.1 (0.41) Female 766 50.8 (1.56) 903 48.1 (1.69) 12,191 48.9 (0.41) Race/ethnicity Hispanic 369 20.3 (1.79) 695 34.7 (1.72) 6,709 22.0 (0.51) White non-Hispanic 288 24.6 (2.54) 381 25.5 (1.72) 12,067 56.8 (0.66) Black non-Hispanic 815 52.2 (2.54) 678 35.2 (1.82) 4,696 15.6 (0.49) Other non-Hispanic 44 3.0 (0.78) 89 4.6 (0.84) 1,546 5.6 (0.29) Region Northeast 266 15.0 (1.98) 236 12.0 (1.28) 3,137 12.4 (0.45) Midwest 370 26.8 (3.25) 378 22.8 (2.16) 5,871 26.7 (0.76) South 639 44.1 (2.90) 818 45.0 (2.03) 10,237 40.8 (0.77) West 241 14.2 (2.23) 411 20.2 (1.45) 5,773 20.2 (0.69) Metropolitan classification Large central metro 529 31.9 (2.36) 688 32.9 (1.70) 7,185 24.5 (0.60) Large fringe metro 208 13.2 (2.04) 238 13.6 (1.54) 5,139 22.0 (0.85) Medium metro 395 27.2 (2.70) 408 23.2 (1.82) 5,526 23.0 (1.16) Small metro 153 13.0 (3.26) 196 12.2 (2.01) 2,599 11.8 (1.16) Micropolitan 164 10.5 (1.73) 194 11.7 (1.76) 2,693 11.1 (1.12) Noncore 67 4.2 (1.17) 119 6.4 (1.05) 1,876 7.6 (0.93)

A Health Picture of HUD-Assisted Children, 2006–2012
Page 37
HUD-Assisted Children (n = 1,516)
Children Residing in Unassisted Low-Income Renter Households
(n = 1,844)
General Child Population (n = 25,018)
Ratio of family income to poverty threshold
< 0.5 572 40.7 (1.85) 2,418 9.7 (0.34) 0.5–0.99 521 35.6 (1.85) 3,510 14.1 (0.37) 1.00–1.99 340 19.9 (1.48) 6,318 25.2 (0.45) 2.00+ 82 3.9 (0.64) 12,766 51.1 (0.64) Family structure Parents: mother, no father 1,155 74.6 (1.88) 1,242 65.3 (1.68) 7,574 27.1 (0.47) Parents: father, no mother 58 3.4 (0.66) 48 2.0 (0.39) 884 3.1 (0.15) Parents: mother and father 235 18.8 (1.60) 495 29.5 (1.66) 15,703 66.9 (0.50) Parents: neither 68 3.2 (0.49) 58 3.2 (0.55) 857 2.9 (0.13) Highest education in household Did not graduate HS 369 22.7 (1.69) 691 37.0 (1.70) 3,025 11.4 (0.36) HS graduate (includes GED) 503 34.5 (1.68) 582 34.2 (1.76) 5,509 22.0 (0.39) Some college/associate’s degree 572 38.5 (1.62) 487 25.0 (1.43) 8,865 34.5 (0.45) Bachelor’s degree or higher 71 4.3 (0.70) 79 3.9 (0.63) 7,612 32.0 (0.62)
GED = general educational development (certificate). HS = high school. HUD = U.S. Department of Housing and Urban Development. NHIS = National Health Interview Survey. SE = standard error. Note: Due to rounding, not all reported percentages precisely equal 100.0 percent.

A Health Picture of HUD-Assisted Children, 2006–2012
Page 38
Table A-2: Health Status of Linkage-Eligible U.S. Children Ages 0–17, by HUD Assistance, Tenure, and Low-Income Status (Weighted NHIS-HUD Linked
Data, 2006–2012)
HUD-Assisted Children (n = 1,516)
Children Residing in Unassisted Low-Income Renter Households
(n = 1,844)
General Child Population (n = 25,018)
Characteristic n % (SE) n % (SE) n % (SE) Reported health status Excellent, very good, or good 1,436 94.8 (0.71) 1,736 93.9 (0.77) 24,388 97.6 (0.13) Fair or poor 80 5.2 (0.71) 107 6.1 (0.77) 628 2.4 (0.13) Emergency room visits, past 12 months 0 visits 988 65.1 (1.82) 1,220 66.9 (1.54) 18,972 76.7 (0.39) 1 emergency room visit 310 20.6 (1.54) 333 17.4 (1.25) 3,812 14.8 (0.30) 2 or more emergency room visits 216 14.2 (1.22) 289 15.7 (1.15) 2,220 8.5 (0.25) Current asthma Current asthma 306 21.2 (1.45) 301 17.7 (1.28) 2,816 11.3 (0.27)
HUD = U.S. Department of Housing and Urban Development. NHIS = National Health Interview Survey. SE = standard error. Note: Due to rounding, not all reported percentages precisely equal 100.0 percent.

A Health Picture of HUD-Assisted Children, 2006–2012
Page 39
Table A-3: Learning-Related Health Status of Linkage-Eligible, School-Aged U.S. Children Ages 6–17, by HUD Assistance, Tenure, and Low-Income
Status (Weighted NHIS-HUD Linked Data, 2006–2012)
HUD-Assisted Children (n = 1,516)
Children Residing in Unassisted Low-Income Renter Households
(n = 1,844)
General Child Population (n = 25,018)
Characteristic n % (SE) n % (SE) n % (SE) School days missed 0 days 279 25.4 (1.77) 299 27.5 (1.98) 4,404 25.4 (0.47) 1–5 days 492 49.9 (2.29) 472 50.0 (2.12) 9,041 56.2 (0.50) 6–10 days 145 16.2 (1.85) 131 13.8 (1.64) 1,989 12.2 (0.36) More than 10 days 90 8.5 (1.09) 84 8.7 (1.25) 1,057 6.3 (0.26) Learning disability Any learning disability 274 26.5 (1.71) 212 24.4 (1.86) 3,289 20.0 (0.37) Attention deficit hyperactivity disorder or attention deficit disorder
163 16.1 (1.59) 130 15.3 (1.60) 2,070 12.7 (0.32)
HUD = U.S. Department of Housing and Urban Development. NHIS = National Health Interview Survey. SE = standard error. Note: Due to rounding, not all reported percentages precisely equal 100.0 percent.
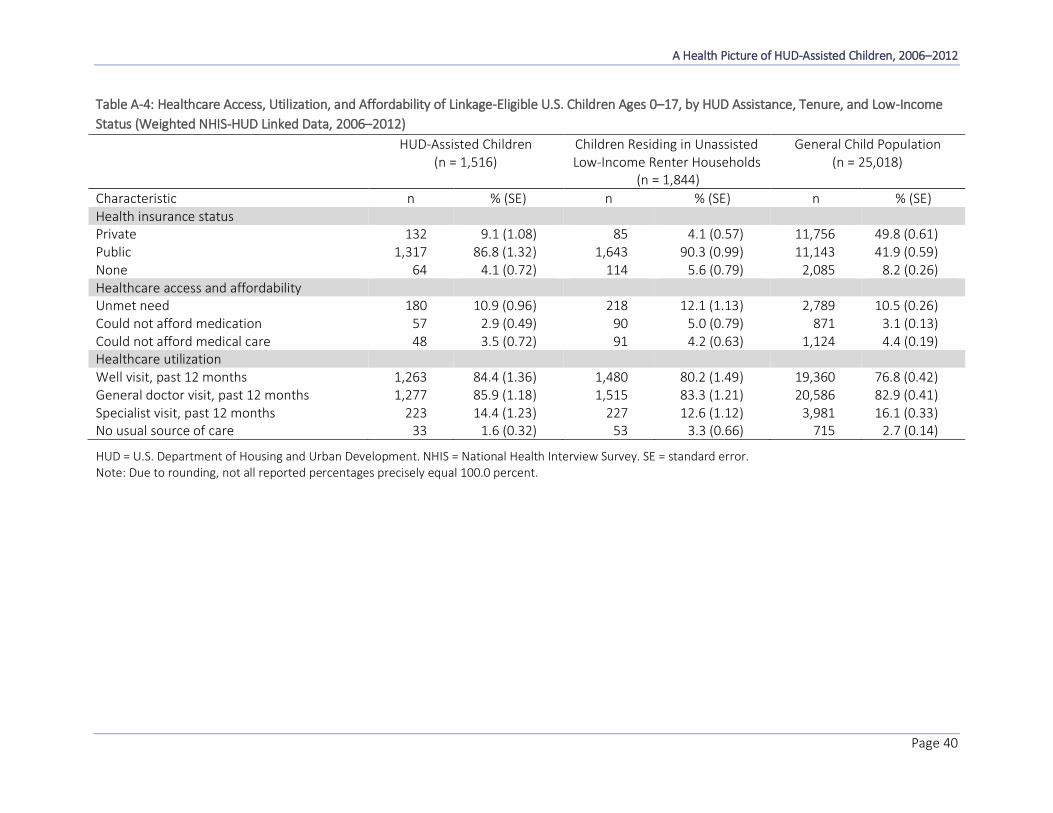
A Health Picture of HUD-Assisted Children, 2006–2012
Page 40
Table A-4: Healthcare Access, Utilization, and Affordability of Linkage-Eligible U.S. Children Ages 0–17, by HUD Assistance, Tenure, and Low-Income
Status (Weighted NHIS-HUD Linked Data, 2006–2012)
HUD-Assisted Children (n = 1,516)
Children Residing in Unassisted Low-Income Renter Households
(n = 1,844)
General Child Population (n = 25,018)
Characteristic n % (SE) n % (SE) n % (SE) Health insurance status Private 132 9.1 (1.08) 85 4.1 (0.57) 11,756 49.8 (0.61) Public 1,317 86.8 (1.32) 1,643 90.3 (0.99) 11,143 41.9 (0.59) None 64 4.1 (0.72) 114 5.6 (0.79) 2,085 8.2 (0.26) Healthcare access and affordability Unmet need 180 10.9 (0.96) 218 12.1 (1.13) 2,789 10.5 (0.26) Could not afford medication 57 2.9 (0.49) 90 5.0 (0.79) 871 3.1 (0.13) Could not afford medical care 48 3.5 (0.72) 91 4.2 (0.63) 1,124 4.4 (0.19) Healthcare utilization Well visit, past 12 months 1,263 84.4 (1.36) 1,480 80.2 (1.49) 19,360 76.8 (0.42) General doctor visit, past 12 months 1,277 85.9 (1.18) 1,515 83.3 (1.21) 20,586 82.9 (0.41) Specialist visit, past 12 months 223 14.4 (1.23) 227 12.6 (1.12) 3,981 16.1 (0.33) No usual source of care 33 1.6 (0.32) 53 3.3 (0.66) 715 2.7 (0.14)
HUD = U.S. Department of Housing and Urban Development. NHIS = National Health Interview Survey. SE = standard error. Note: Due to rounding, not all reported percentages precisely equal 100.0 percent.
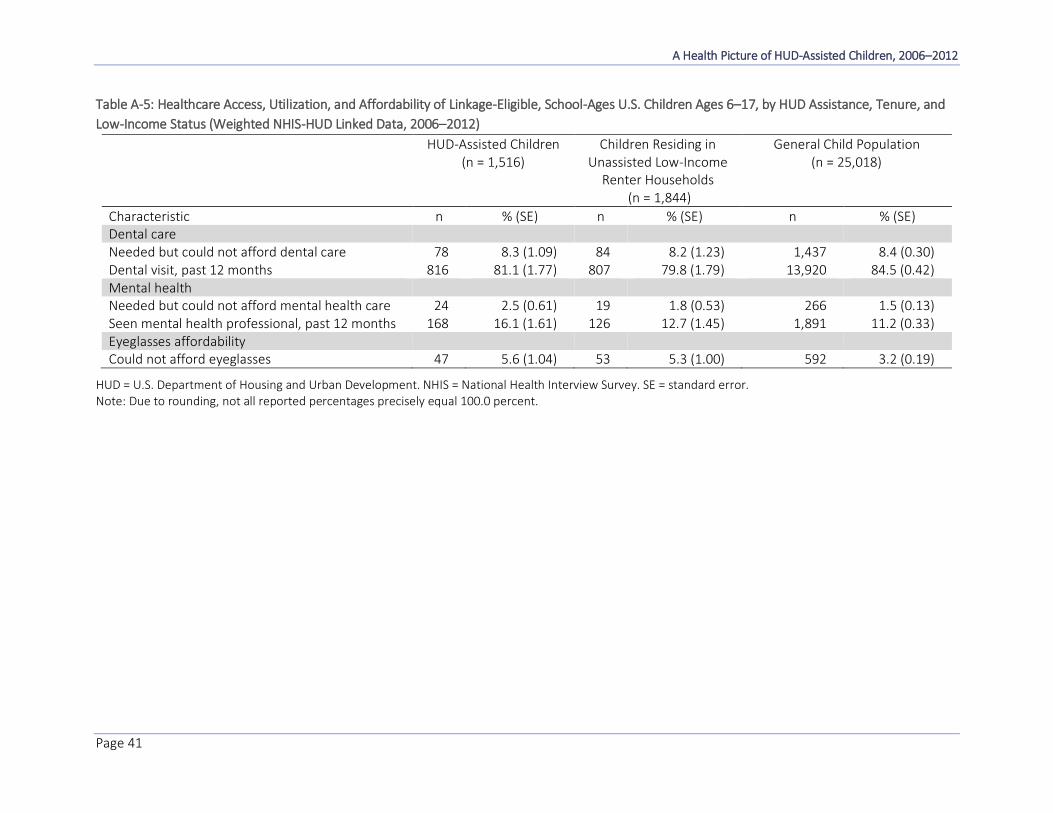
A Health Picture of HUD-Assisted Children, 2006–2012
Page 41
Table A-5: Healthcare Access, Utilization, and Affordability of Linkage-Eligible, School-Ages U.S. Children Ages 6–17, by HUD Assistance, Tenure, and
Low-Income Status (Weighted NHIS-HUD Linked Data, 2006–2012)
HUD-Assisted Children (n = 1,516)
Children Residing in Unassisted Low-Income
Renter Households (n = 1,844)
General Child Population (n = 25,018)
Characteristic n % (SE) n % (SE) n % (SE) Dental care Needed but could not afford dental care 78 8.3 (1.09) 84 8.2 (1.23) 1,437 8.4 (0.30) Dental visit, past 12 months 816 81.1 (1.77) 807 79.8 (1.79) 13,920 84.5 (0.42) Mental health Needed but could not afford mental health care 24 2.5 (0.61) 19 1.8 (0.53) 266 1.5 (0.13) Seen mental health professional, past 12 months 168 16.1 (1.61) 126 12.7 (1.45) 1,891 11.2 (0.33) Eyeglasses affordability Could not afford eyeglasses 47 5.6 (1.04) 53 5.3 (1.00) 592 3.2 (0.19)
HUD = U.S. Department of Housing and Urban Development. NHIS = National Health Interview Survey. SE = standard error. Note: Due to rounding, not all reported percentages precisely equal 100.0 percent.

U.S. Department of Housing and Urban Development
Office of Policy Development and Research
Washington, DC 20410-6000
March 2018