a history of statistics in new zealand - stats.org.nz
TRANSCRIPT


A History of Statistics in New Zealand
Edited and written by HS Roberts

Published by the New Zealand Statistical Association (Inc)PO Box 1731
Wellington
ISBN 0 9597632 7 9
This book is copyright under the Berne convention. All rights reserved, no reproduction without permission
© New Zealand Statistical Association (Inc)
Production by Bateson Publishing Limited
Design and layout by Unicorn Design & Pre Press
Printed by Hutcheson, Bowman and Stewart


DeDication
This history is dedicated to Ian Douglas Dick who, more than anyone else, was responsible for bringing the applications of statistical methods into experimental scientific work in New Zealand.

vii
Preface
The genesis for the publication of this book was the New Zealand Statistical Association’s Conference on the History of Statistics in New Zealand which was held at Victoria University on 1 July 1987. Attendees at the conference included a number of our elder statisticians such as Professors Jim Campbell and Geoff Jowett along with Stan Roberts.
Some, but not all of the papers presented during the day were subsequently published in The New Zealand Statistician, and a sub committee of the New Zealand Statistical Association was established to investigate how we could best retain the knowledge of the past, and ensure that it was readily available to our younger new members.
This book is the result. In 1996 Stan Roberts was asked by the Association to edit and to do the substantive writing of this text. His dedication and tenacity, particularly in tracking down old material, is apparent in the volume and quality of material presented. The Association would like to put on record its sincere thanks to Stan for all his work.
A number of other members of the association have also made major contributions including Frances Krsinich, Jean Thompson and Mike Camden and I would like to express my appreciation to them also.
It is the hope of the New Zealand Statistical Association that this book will be a valuable resource for present and future generations of statisticians.
Sharleen ForbesPresident 1997 to 1999New Zealand Statistical Association

viii

about the eDitor
HS (Stanley) Roberts was born in 1920. He worked for the Applied Mathematics Division of the DSIR for 30 years, from 1951 to 1981. He was made a life member of the New Zealand Statistical Association in 1981, and received the first Campbell Award in 1999.


contents
introDuction 1chaPter 1statistical institutions 3
Early Official Statistics in New Zealand: Statistics New Zealand up to 1960, Frances Krsinich ...........................................................................................3
Department of Agriculture, Jean Heywood ................................................................ 20Applied Mathematics Division, Editor ........................................................................... 28A Tribute to the Applied Maths Division, DSIR (1952–1986), Ken Seal .............. 39The first four years of the Applied Mathematics Laboratory, I D Dick................ 46Personal reminiscences (1953–1962), Bob Williams ................................................. 49How to be ‘usefully vulgar’ – the example of AMD, John Darwin ........................ 51Reminiscences about AML, Peter Whittle ..................................................................... 53Computing at AMD: 1949–1965, Garry Dickinson .................................................... 67Computing at AMD, 1965-1982: the ELLIOTT 503, Brian Gibson ......................... 70
chaPter 2some new ZealanD statisticians 73
Alexander Craig Aitken (1895–1967), P C Fenton ...................................................... 73Sir George Ernest Francis Wood (1900–1978)
Government Statistician (1946–1958), Kristeene Parkes ................................... 76James Towers Campbell (1906–1994), R M Williams ................................................ 83Harold Silverstone (1915–1974), Editor ......................................................................... 88Ian Douglas Dick: (1918–1999), Editor ........................................................................... 91Peter Whittle (1927–) – an autobiography ................................................................... 97Steve Kuzmicich (1931–) – Government Statistician (1984–1992),
Frances Krsinich ..............................................................................................................103Geoff Jowett (1922–), Editor ............................................................................................112
chaPter 3eDucation 116
Primary Schools, Editor .....................................................................................................116Post Primary Schools, Editor............................................................................................119Polytechnic, Hans (John) Offenberger .........................................................................123Universities, Editor ..............................................................................................................131
chaPter 4early surveys, trials, anD fielD exPeriments 146
Introduction ..........................................................................................................................1461923 Forestry, P J McKelvey, Graham Whyte .............................................................147

1930 The Appleby experiments, Editor .......................................................................1521931 The Hudson-Gosset Correspondence, G.C. Arnold ......................................1541932 Fisheries, K. Radway Allen ....................................................................................1601936 Changes in mental ability in New Zealand
school children 1936–1968, Editor .......................................................................1641940 Notes on the State of NZ Climatological Statistics
in the 1940s, N. G. Robertson ....................................................................................1671947 Dental caries and soil types, Editor ....................................................................1711947 Foot Measurements of New Zealand Children, Editor ................................1741949 Aerial top-dressing measurement trials, Editor ............................................1751951 Identical twin experiments, I D Dick ..................................................................1771952 Experimentation in industry, L F Jackson, Ken Seal .....................................1811953 Early work on the econometrics of wool prices, Bryan Philpott .............1841953 A survey of wheat cropping and diseases, G M Wright ..............................1901957 Airline queueing, Hamish Thompson ...............................................................1931960 Actuarial, Athol Tills .................................................................................................1961961 The sheep population of Campbell Island, Editor ........................................2011965 Criminology, S W Slater ..........................................................................................2031966 Soil fertility in Niue Island soils, John P Widdowson ...................................2061968 Birds at Auckland International Airport, Editor .............................................2091974 Alcohol in the blood of New Zealand drivers, Editor ..................................2111974 Libraries, Editor .........................................................................................................213
chaPter 5the new ZealanD statistical association 215
Formation and early beginnings ...................................................................................215The Genesis and Activities of the New Zealand Statistical Association,
K J A Revfeim ....................................................................................................................217The New Zealand Statistician (Volume 1, March 1966, Number 1) ...................231The NZSA (1966–1970), Greg Arnold ...........................................................................235The Survey Appraisal and Public Questions Committee,
Stephen Haslett ..............................................................................................................237The Education Committee, Mike Camden .................................................................241The NZSA (1990–1993), Jean Thompson ....................................................................245
chaPter 6General 250
Florence Mary Harding (1910–1977), Editor..............................................................250Frank A Haight, Editor ........................................................................................................251Dr Michael Cullen (1945–), Editor ..................................................................................252A note on the ‘Cold War’ period in New Zealand, Editor .......................................253Gleanings from the New Zealand Statistician ..........................................................255
inDex of names 262

1
IntroductIon
“Statistics”, like most words, is continually changing its meaning. In order to find the meaning of a word we tend to reach for a dictionary, but dictionaries do not so much “define” the meanings of words, but rather give their current usages, together with examples. Following are examples relating to statistics taken from the 1933 Oxford English Dictionary (13 Vols). Note that in each entry the date indicates the first usage found.
Statism: Subservience to political expediency in religious matters. 1609 –
“Religion turned into Statisme will soon prooue Atheisme.”
Statist: One skilled in state affairs, one having political knowledge, power, or influence; a politician, statesman. Very common in 17th c.. 1584 – “When he plais the Statist, wringing veri unlukkili some of Machiavels Avioxmes to serve his Purpos then indeed; then he tryumphes.”
Statistical: 1. Of, or pertaining to statistics, consisting or founded on collections of numerical facts, esp. with reference to economic, sanitary, and vital conditions. 1787 “The work (by Zimmerman) before us is properly statistical. It consists of different tables, containing a general comparative view of the forces, the government, the extent and population of the different kingdoms of Europe.”
2. Of a writer, etc: Dealing with statistics. 1787 – “Some respectable statistical writers.”
Statistician: One versed or engaged in collecting and tabulating statistics. 1825
– “The object of the statistician is to describe the condition of a particular country at a particular period.”
Statistics: In early use, that branch of political science, dealing with the collection, classification, and discussion of facts (especially of a numerical kind), bearing on the condition of a state or community. In recent use, the department of study that has for its object the collection and arrangement of numerical facts or data, whether relating to human affairs or to natural phenomena. 1787 – Zimmerman – “This science distinguished by the newly-coined name of Statistics, is
2
become a favourite in Germany.”
Statistic: The earliest known occurrence of the word seems to be in the title of the satirical work “Microscopium Statisticum”, by Helenus Politanus, Frankfort (1672). Here the sense is prob. “pertaining to statists or to statecraft”.
The Concise Oxford Dictionary (1976) gives us two modern usages.
Statistics: 1. Numerical facts systematically collected 2. Science of collecting, classifying and using statistics.
Finally, the first verse of a poem composed in 1799 by William Wordsworth, and entitled, “A Poet’s Epitaph”, successfully clarifies this difficult matter. Art thou a Statist in the van Of public conflicts trained and bred? First learn to love one living man; Then may’st thou think upon the dead.
* * * * * * * * Note: This history starts from the earliest records that the editor and authors have been able to track down. Some of the sections finish somewhere in the 1960s. This was because of two very important events which happened about this time. The first was that somewhere in the 1950s and 1960s, formal, regular lectures in Mathematical Statistics began to be given at the Universities, and the second was the arrival of Electronic Computers, the ELLIOTT 503 arriving in 1965. Both these events significantly changed the face of statistics in New Zealand. Other sections, such as that of the Chapter on the New Zealand Statistical Association, have been taken up to 1998.
3
chapter 1
Statistical InstitutionsEarly Official Statistics in New Zealand: Statistics New Zealand* up to 1960.Frances Krsinich, Statistics New Zealand
IntroductionThis short history of official statistics in New Zealand is based on George Wood’s memoirs, Progress in Official Statistics 1840-1957 – A Personal History, the first annual report of the Department in 1956 and excerpts from early departmental publications. For an outline of some key developments in the Department of Statistics after this time, see Chapter 2, Steve Kuzmicich.
A brief historyThe Census and Statistics Department officially came into existence in 1936, but was only required to submit an annual report after the passing of the Statistics Act 1955. In this first report the Government Statistician, George Wood, gave a very brief outline of official statistics in New Zealand to that date:
Statistics were collected in New Zealand many years before the first Government Statistician was appointed, some even as early as 1829. From 1840 to 1851 statistical ‘blue books’ were prepared for the Colonial Office, but these were not published. They contained statistics of population of settlements, trade, and agriculture. Annual counts of the populations of European settlements were made from 1841, and the first general census [this first ‘general census’ did not include Maori] was conducted in 1851, since when there have been regular censuses of population (with two exceptions due to the economic depression in the 1930s and to the Second World War). Early censuses were taken triennially, but from 1881 they have been held at quinquennial intervals. The first count of the Maori population was made in 1857-58.The first official publication of a ‘Year-Book’ type appeared in 1875, but it was not until 1893 that the first New Zealand Official Yearbook was published. It has since appeared annually (with two exceptions – where combined issues were made). The Monthly Abstract of Statistics first appeared in 1914, and has been published regularly since that date.The earlier publications for the colony as a whole were the responsibility of the Registrar-General, with the exception that the basic statistics of exports and imports were, and still are [in 1956], compiled by the Customs Department.
* Originally the Census and Statistics Department, the Department changed its name to the Department of Statistics in 1955, and then to Statistics New Zealand in 1994.
4
Early statistical publicationsIt is difficult to trace statistical publications in the first 36 years of colonial rule in New Zealand, particularly the period 1853-1876. The basic statistics of central government are available but provincial government publications are scarce.
There must have been concern about the lack of national statistics, because in 1858 the Registrar-General compiled and presented to Parliament the volume Statistics of New Zealand for 1853, 1854, 1855 and 1856, compiled from official records:
Beyond the preparation of the annual ‘Blue Books’ – which were not designed for general circulation – the compilation of Statistics in New Zealand has hitherto been limited to particular parts of the Colony, or to particular period or occasion, and necessarily failed to present any complete view of New Zealand ... the following tables form the first attempt to present to the public the General Statistics of the entire Colony in one comprehensive and authorised Compilation.
He acknowledged some limitations of these early statistics:
In numerous instances, the returns arrived so slowly as to greatly retard progress, but, when they were received, proved either to be defective, or to have been prepared with such diversities of form as to render the attempt to classify them clearly, in tabular views embracing the entire Colony, impossible; while in some cases, available returns could not be procured in any form, up to the period at which it became indispensable to close the present compilation.
There were other limitations. For example – counts of the population of the Blue Books, undertaken by District Magistrates, excluded Maori.
In 1889 the Registrar-General, Mr William Robert Edward Brown, produced a Report on the Statistics of New Zealand. This was a 224 page publication containing a brief history of New Zealand, followed by descriptive and interpretive comment on each of the main classes of statistics published in the Annual Statistical Report. A similar edition followed in 1890.
The Blue BooksThe first officially produced statistics in New Zealand were the Blue Books, produced by the Colonial Secretary. The term ‘Blue Book’ arises from the English practice of binding Parliamentary and Privy Council reports in blue covers.
Initially, the Blue Book was not a public document. There were only three copies produced of each issue – one was for the Colonial Secretary and the other two were sent to the Colonial Office in London.
In 1848 New Zealand was divided into two provinces, New Ulster and New Munster. New Munster was south of a line drawn eastwards from the mouth of the Patea River. The 1851 Blue Book for New Munster is now held in the National
5
The position of Government Statistician was created in 1910, the first encumbent, Mr W M Wright, being attached to the Registrar-General’s Office. In 1913 a separate Census and Statistics Office was established. It initially formed a branch of the Internal Affairs Department, but became part of the Department of Industries and Commerce in 1931. The Census and Statistics Department was established in 1936 as a separate Department.The Census and Statistics Act 1926 was merely a consolidation of existing legislation, and this meant that the Department had operated from 1910 (that is, from the date of the Census and Statistics Act 1910) until the end of 1955 under substantially the same legislation. Over this period of forty-five years there had been a gradual, but nevertheless real, change of emphasis in the importance of the various classes of statistics in common with the growth and changing structure of the New Zealand economy. The quinquennial census, for example, though no less important than it had ever been, had by 1955 become only one of many important classes of statistics. The Consumers’ Price Index and the National Income Estimates are two examples of other classes of statistics which have either developed in importance or originated from modern day needs. When the time came in 1955 to undertake a complete revision of the legislation, the change of emphasis was recognised by a change in the name of the Department from ‘Census and Statistics Department’ to ‘Department of Statistics’.
The earliest known record of statistical activity in New ZealandThe earliest known record of statistical activity in New Zealand is from “copies or extracts of correspondence relative to New Zealand in continuation of papers presented to the House of Commons on 14th of April 1840 in pursuance of address of 8th April”:
Instructions to our trusty and well beloved William Hobson esq. our Governor and Commander in Chief in and over our Colony of New Zealand or in his absence our Lieutenant Governor ... Given at our Court at Buckingham Palace on 5th date of December 1840 – Victoria R.Lord John Russell to Governor Hobson 9th December 1840And whereas you will receive through one of our Secretaries of State a book of table in blank commonly called the Blue Book, to be annually filled up with certain returns relative to the revenue and expenditure, militia, public works, legislation, civil establishments, population, schools, course of exchange, imports and exports, agricultural produce and other matters in the said Blue Book, more particularly specified to the state of our sociology, now we hereby signify our pleasure that all such returns be accurately prepared and punctually submitted to us from year to year through our Secretaries of State and that no officer in our said colony within whose Department it may be to contribute any return or returns for the purpose aforesaid or to prepare the same when so contributed, shall be entitled to receive or shall receive from you any warrant for the payment of his official salary which may become due and payable to him so long as such duty as aforesaid shall be in arrear[s] or remain unperformed.
As George Wood speculates:
The loss of the American Colonies must have shaken the Colonial Office more than somewhat, and brought home to it the necessity for factual data regarding the Colonies.

6
Archives.The 1859 Blue Book includes chapters on the European and ‘Aboriginal’
populations; immigration and emigration; births, deaths and marriages; shipping; imports and exports; the Post Office; prices of provisions and livestock; New Zealand’s revenue; District Court civil and criminal cases; resident magistrates’ Courts; prisoners and savings banks. Its appendix has information on meteorological conditions and the Maori population of Canterbury.
Sir,I have the honour to present a series of Statistical Tables for the year 1859, in continuation of the volumes of Statistics of New Zealand for 1853-1856, 1857, and 1858, which have been previously published.In the important branches of information dependent on the Census, it is obvious that, during the interval between one triennial enumeration and another, the utmost that can be arrived at must be approximations, more or less close according to the nature and extent of the data upon which each can be calculated. As respects the POPULATION, however, it has usually been found that, – by adding to the previously ascertained Numbers, the excess of Births over Deaths, and of Immigration over Emigration, – an estimate can be obtained, which may be received as substantially reliable. On this plan the Population Table (No.1) has been compiled, the Census taken in December 1858 forming the basis. It will be seen that the increase of the population of European descent in New Zealand during the year 1859 is estimated to have been no less than 12,180, – viz., 7,428 Males, and 4,752 Females: – an augmentation the magnitude of which becomes evident when it is shown centesimally, the increase upon every 100 of the gross Population having amounted to 22.10 on the Male, and 18.50 on the Female Population respectively …In other branches of the Census Statistics, the same closeness of approximation cannot be expected, no data of equal trustworthiness being available. Still, the assumption that the persons added to the Population in 1859 may, generally speaking, be regarded as divisible into about the same proportions as respects Places of Birth, Religious Denominations, Occupations, and State of Education, with the persons who were in the Colony when the Census was taken, may perhaps be admitted as some guide in the absence of more accurate information …In this, as in other Colonies, the inquiry into the OCCUPATIONS of the people is perhaps that in which the information to be obtained from the Census is least capable of being tabulated with precision. Many settlers pursue more than one avocation; and the calling entered in the Census Schedule is not always that in which the person is most habitually engaged or from which he principally derives his maintenance. The descriptions are also frequently indefinite, and different names are given to what may be regarded as substantially the same business.
The Year BookThe Official Handbook of New Zealand first appeared in 1875, edited by Julius Vogel and printed in London on behalf of the New Zealand Government. From the Introduction:
In order that this Handbook may be fairly estimated, it is necessary to explain the manner of its

7
8
– charity schemes, health and compulsory education legislation and then welfare programmes.
In 1893 The Official Handbook of New Zealand became The New Zealand Official Year Book, which it has remained ever since. From the Preface by Von Dadelzen to the 1893 publication:
The handbook published last year met with so favourable a reception that the Government decided on publishing a similar work annually, to be called the ‘New Zealand Official Yearbook’. This volume will therefore be one of a series.As the demand for the Handbook was largely in excess of the number printed, it seemed evident that some of the special articles, after having been revised, would bear repetition. But there is a large quantity of completely new matter introduced into this book, especially in the portions relating to agriculture, sheep-farming, meat-freezing, butter- and cheese-making, climate and temperature, mineral waters, thermal springs, land- and income-tax methods, &c. Of the articles dealing with these subjects, some appear for the first time, while others have been re-written and enlarged ...The statistical information, with small exceptions, will be found to contain the latest figures. The difficulty of obtaining complete figures for 1892 covering such a range of subjects as is here dealt with, early enough to print in a book to be presented to Parliament during this session, was found to be very considerable; and the date at which many figures became available left little time for analysis or comment thereon. But certainly the information is made public at a much earlier date than is the case in the neighbouring colonies.
Included in the 1893 Yearbook are chapters on Government activity; articles on ‘special subjects’ (for example, agriculture, the frozen-meat industry, the introduction of trout to New Zealand, hints to Prospectors for Gold and other Minerals, rivers, lighthouses, lunatic asylums and industrial schools); a digest of land laws and description of land for each province; and synopses of statistics showing the progress of the colony.
Monthly Abstract of StatisticsThe Census and Statistics Act 1910 specifically provided for a census to be taken every five years, but as George Wood, in his memoirs, says:
A very significant feature of the [Census and Statistics Act 1910] is – an omission. While the Act specifically lays down that a Census of Population be taken at five yearly intervals, and that an imposing array of subjects be surveyed at annual intervals, there is not one word which suggests that statistics for some subjects be collected and compiled for quarters, months, or other short-term intervals. It was apparently thought at the time that statistical collection, compilation and publication was inevitably a long-term exercise.
But the Government Statistician was collecting monthly food prices and other short-term data to such a volume that it culminated in the appearance of a Monthly Abstract

9
preparation. Most of the works about New Zealand have been written either by those who have made only a short visit to the Colony, or who, possessing an acquaintance with some particular part or parts of the two Islands, have been still unable, however much inclined, to do justice to the several Provinces into which New Zealand is divided.The colonisation of New Zealand has been conducted by several communities, which, as organised and initiated, were perfectly distinct in their character, their objects, the bonds that held them together, and their plans of operation. As might be expected, the isolation in which these communities dwelt assisted for some time to intensify the distinctness of their characteristics. Of late years, the isolation has yielded to the intercourse consequent upon larger facilities of communication. At first, some of the Provinces occasionally heard news of each other more rapidly from their communications with Australia than from their direct communications. But for many years past steamers have abounded on the coast, and there has been much intercommunication. The consequences are that the Provinces know more of each other; they have in many cases exchanged settlers and residents; and the old exclusiveness has assumed rather a character of ambitious competition for pre-eminence in the race for wealth and material advancement. The railways and roads which are being constructed will much increase the intercommunication between different parts of the Colony and will tend to further reduce the Provincial jealousy that still survives. But not for a long time to come, if ever, will the characters the settlements received from their early founders be entirely obliterated.The object of this Handbook is to give to those who may think of making the Colony their home or the theatre of business operations, an idea of New Zealand from a New Zealand point of view. To do this, it was necessary to recognize the distinctions which have been already explained. No one man in New Zealand could faithfully interpret the local views of the various Provinces. It was, therefore, determined that the book should consist of a number of papers, some devoted to the Colony as a whole, but most of them independent accounts of separate localities …The design, as has been said, is to give a New Zealand view of New Zealand; and it is hoped that, in its pages, the merits and demerits of the Colony will alike be apparent. The order in which the Provinces are dealt is from south to north, and quite independent of their relative size and importance.
The 1875 Handbook has chapters on the discovery and settlement of the colony; the native race; form of Government; national resources; latest statistics; the Public Works and Immigration departments, an official directory and chapters on each of the provinces.
E J von DadelzenOne of the people who helped shape New Zealand’s national institutions was Edward John von Dadelzen. He was Registrar-General from 1892 to 1909. As such, his principal duties were census enumeration and registration of births, deaths and marriages. From the 1930s the compilation of census and registration statistics had been gaining increasing importance for sound public administration. During Dadelzen’s time as Registrar-General the gathering and analysis of statistics acquired even more significance, as it began to provide a basis for social policy implementation

10
1916 and the individual household schedules were used for this purpose. This would not have been possible under the secrecy provisions of more recent Statistics Acts. George Wood comments:
I have carefully examined the Census and Statistics Act of 1910 and there is not one word in it which specifically limits the purposes to which the Government Statistician may put individual schedules. True there is an implied assumption that the returns will be used for statistical purposes. Indeed, Clause 21 which defined the areas for which annual statistics shall be collected, states:
The Statistician shall, subject to the directions of the Minister collect annually statistics in relation to all or any of the following matters.
The prime purpose for which the returns shall be collected is thus stated – but there is no limiting clause. In the event the Statistician’s authority to use these returns for a “foreign” purpose – to check up on Military defaulters – was never challenged.
During the First World War, public hysteria about ‘aliens’ led, in 1917, to the Department being given the duty of compiling and maintaining a ‘Register of Aliens’. This was continued until 1923, when the Registration of Aliens Act 1923 was temporarily suspended.
Statistics Act 1926In 1926 a new Statistics Act was passed. The wording of the 1910 Act was tightened up and some important changes made, including: In the Census of Population, those not in the immediate family of the householder
in charge were enabled to complete a personal schedule on their own behalf. Confidentiality could be preserved by enclosing this schedule in an envelope, meaning that more sensitive questions (eg income) could be successfully collected in the census.
The 1910 Act stated:
19. If any enumerator, sub enumerator or clerk divulges or makes use of any information required by this Act to be given or the contents of any form required to be filled up except for the purposes required by this Act, he shall be liable to a fine not exceeding fifty pounds.
In the 1926 Act, the words ‘other person’ were substituted for ‘clerk’. According to George Wood, this was a definite improvement, although still unsatisfactory in terms of a secrecy provision.
The 1910 Act contained a definition of a ‘Native’ – a person ‘belonging to the aboriginal race of New Zealand’ – for the purpose of excluding Maori from the provisions of the Act. In the 1926 Act this definition was omitted, making the Act apply to the whole population.
However, one backward step for statistics was the abolishment of the following 1910 requirement:
11
of Statistics in 1914. Malcolm Fraser, the Government Statistician, wrote in the Preface to the first abstract:
In accordance with the instructions of the Hon. the Minister of Internal Affairs it has been decided to issue monthly an abstract of the principal statistics of the Dominion, on somewhat similar lines to those published by the Commonwealth Statistician in Australia and the Government Statistician in New South Wales. The Monthly Abstract will provide a compact medium for publishing quickly, in handy form for reference, without comment or analysis, the latest statistical figures available in regard to the Dominion.
This 1914 publication included statistics on population, immigration and emigration; births, deaths and marriages; magistrates’ Courts; imports and exports; trade; shipping; railways; livestock; agriculture; banks; post office; pensions; the consolidated fund; the public works fund; taxation; indebtedness of government; loan expenditure of boroughs and valuations of land and improvements.
Organisation and legislationNew Zealand’s formal statistical activities commenced with the establishment of the position of Registrar-General of Births, Deaths, and Marriages, in 1847. The Colonial Secretary handed his statistical activities duties over to the Registrar-General and, apart from having two separate statistical services for New Ulster and New Munster for a short period, there has been a national statistical service ever since.
The first Government Statistician was appointed in 1910, as part of the Registrar-General’s office. This appointment was a result of the Census and Statistics Act 1910, providing a substantial official statistical system. It was introduced at the request of the United Kingdom.
The Census and Statistics Act 1910 gave the Minister of Internal Affairs the function of directing the Government Statistician on the collection of statistics. While the Act limited statistical activity to Government direction, it seems that the Government Statistician was reasonably free to proceed as he saw fit.
In 1915, an amendment to the 1910 Act meant that the Government Statistician was no longer part of the Registrar-General’s Office, moving him up several places in the Department’s hierarchy. The statistics office became a separate branch of the Internal Affairs Department, responsible to the Undersecretary and with direct access to the Minister.
That same year, the National Registration Act 1915 was passed, requiring all males in certain age groups to register for military service. The following year, the Military Service Act 1916 was passed, bringing in conscription for the first time in New Zealand. Administration of both these Acts was added to the duties of the Government Statistician, Malcolm Fraser, who was required to use ‘all information available to him’ in order to complete the National Register. A Population Census had been held in April
12
The first population census for the Colony as a whole, was taken in 1851, but only included Europeans. The first count that included Maori was the Census of 1858. But Maori were not enumerated on the same basis as Pakeha until 1945, when Maori were offered schedules in either Maori or English. (Only English schedules were offered at the following Census, as ‘only’ 25 percent of Maori had used the Maori schedules in 1945.)
The Census Act 1877 was passed, providing for the taking of a Census in 1878, 1881 and every fifth year afterwards. This five-yearly sequence has been followed ever since (except for 1931, when it was dropped for economy reasons during the Depression, and in 1941, during World War II). It had become usual to hold the census in the autumn, but in 1945 this sequence was broken when the Labour Government wanted the redefinition of electorates available in time for the 1946 election, and so advanced the date of the census to September 1945. All these irregularities were unfortunate from a statistical point of view.
In the early days of colonial New Zealand, the population census provided a unique opportunity for making contact over the whole country, and so other statistical collections were often tagged on. The extra statistics collected included agriculture and livestock, industries, libraries and church attendance.
As regular annual statistics became available for some items, they were dropped from the census. The Superintendent of the Census commented in his 1921 General Report:
In addition to becoming definitely a population census, the present day enumeration is further tending steadily in the direction of a complete restriction to population. In other words, the scope of the census is now confined almost wholly to population, the characteristics of the people and the circumstances of their immediate environment. By this means its permanent value is continually mounting. Authoritative opinion is ever according more and more significance to sociological knowledge, and the census is the great instrument of sociological information in its quantitative statistical aspect.
Price indexesThe early Blue Books regularly included series of tables on ‘Prices of provisions on the Goldfields’. Apart from this, there is little evidence of official interest in price movements in the early days of settlement.
A breakthrough came in 1911 when Dr James McIlraith published a thesis called ‘The Course of Prices in New Zealand’. This incorporated an index number series starting in 1861 and ending in 1910. On the urgent need for a series of price index numbers that would indicate changes in the purchasing power of the sovereign, Dr McIlraith said:
Though no official index numbers have yet been compiled in New Zealand, there is an increasing field for their use. The nature of much of our recent legislation has been such as to

13
25(2). All statistics or abstracts prepared for publication and the Statistician’s observations thereon (if any) shall be laid before both Houses of Parliament.
This deprived the Government Statistician of an important opportunity of expressing an independent view at top level on the state of official statistics.
The Labour Government was elected in 1935 and Walter Nash became the Minister in charge of the Statistical Office. He had the Office raised to the status of a separate Department. This was a ministerial decision which involved no change in the Department’s controlling legislation – the Census and Statistics Act 1926 – so, born on April Fool’s Day 1936, the new Department did not actually report its activities to Parliament for another 20 years.
Statistics Act 1955The First Annual Report of the Department of Statistics 1956 gave a broad outline of the reasons behind the new legislation:
[T]he Department had, until the end of 1955, been operating under legislation which dated back to 1910. Over the years there had been many developments in the statistical field. The statistical technique of ‘sampling’ had been introduced into more general use, many collections had grown in importance, and there were many new types of collections. The secrecy provisions and the penalty clauses of the old legislation were weak and called for thorough revision. There was, therefore, good reason to recommend to the Government that a Bill be placed before Parliament with the intention of bringing the legislation fully up to date. Implementation of these objectives was accomplished with the passing of the Statistics Act 1955.
The report went on to list some of the more significant provisions of the 1955 Act:
The Statistics Act 1955 is something of a milestone in the history of the Department. It has many features not in previous legislation, some of the more important of these being:(a) It sets out in general terms the functions and duties of the Department and of the
Government Statistician.(b) It provides for the position of Deputy Government Statistician.(c) It provides for every employee of the Department to take an oath of fidelity and secrecy.(d) It authorises the Minister to approve the use of statistical schedules (previously the whole
forms had to be gazetted).(e) It broadens the scope of the statistical field within which the Government Statistician is
permitted to collect data.(f) It sets out the position of the Department in so far as secrecy is concerned.(g) It strengthens the penalty clauses (which had recently been proved too weak to secure a
conviction in the Courts).
Census of population
14
retail prices had been completed. It was published as a Report on the Cost of Living 1891 – 1914. In the introduction, existing methods of compiling wholesale prices were described and the necessity for introducing a different technique for retail prices was stressed. It was decided to use the recently devised ‘aggregate expenditure method’.
Sixty-six commodities were included in the index, plus rent. There were 59 food items and 7 items representing fuel and lighting. The weights were determined as follows:
The mass unit for each of the commodities selected was ascertained by taking the average production of each commodity in New Zealand plus imports less exports covering the average of the past ten years. The sales for one month of the various grocery items were obtained and considered, and in the case of meat the proportions of the animals cut into the various joints were obtained from several recognised experts. The relative expenditures as shown by the household budgets collected by the Department of Labour were used to verify the results.
A second report on prices appeared in 1920. This was more comprehensive than the 1915 report, incorporating wholesale prices, producers’ prices and export prices as well as retail prices.
In 1921 the first ‘all groups’ consumer price index was prepared, based on 1909-1913 consumption patterns from a Budget inquiry by the Labour Department. It covered approximately 88 percent of total family expenditure and, therefore, represented a much wider coverage than its predecessors.
Based on 1926-1930 consumption, the pattern of aggregate expenditure weightings was revised in 1930. Change in living habits was much slower then than now, and the revised pattern of weightings was not much different from that derived from 1909-1913 results. The 1930 revision was the last in which a ‘working class’ living standard was used as the basis of the group-weighting pattern.
The wartime prices index was based on an austere wartime standard of living. The 1949 and subsequent revisions were based on ‘overall’ consumption patterns.
System of national accountsThe first attempt at estimating National Income was made in 1893, and published in The New Zealand Official Yearbook 1894. Two men – Mr Hayter and Mr Mulhall – used different methods but came up with surprisingly similar results.
Mr Hayter allotted a probable income to each description of occupation recorded in the 1891 Census and adjusted the estimates to the 1893 population estimates to get an aggregated income between £27-£28 million. Mr Mulhall estimated the value of output for each industry and took varying percentages of these totals as income, resulting in a total income for New Zealanders of £27.8 million.
After this, there was no further activity in this area of statistics for quite a while; there was more interest in producing estimates of Private Wealth. But in the 1930s the Department started to produce official ‘aggregate of private income’ estimates.
15
make the accurate determination of fluctuations in the purchasing power of the medium of exchange a matter of great importance.
Cost of livingNew Zealand’s official statistics were extensively reviewed by the 1912 Royal Commission on the Cost of Living in New Zealand, chaired by Edward Treager. In this report, the cost of living was defined thus:
The cost of living may therefore be regarded as roughly measured by the sum of money that represents the efforts and sacrifices necessary to obtain the goods for securing and maintaining a certain standard of existence and efficiency – or in brief necessary to purchase a certain amount of food, clothing and other necessaries and comforts.
In answer to the question ‘What steps should be taken with a view to reducing the cost of necessities in life?’, the Royal Commissioners noted that:
The first essential in the study of any problem is the correct diagnosis of the case ... until we have available trustworthy statistical descriptions of the national resources of the productive powers of the people, of the organisation of the markets, of price and wage changes, of the way in which national income is distributed, of the modes and amount of consumption etc, any economic legislation is but a leap in the dark, and our industries are deprived of knowledge which is as necessary for their successful development as a plentiful supply of labour …
The Royal Commission made specific recommendations on the subject, including that: The Government Statistician should have full control of the collection and
publication of all statistics to ensure uniformity of definition, methods of collection and presentation; in order to enable proper comparisons and therefore to minimise the risk of fallacious reasoning.
An Advisory Board of Statistics should be set up, consisting of members representing, for example, agricultural and pastoral concerns, industrial interests, commercial interests, labour interest and academia. This would ensure that statistical inquiries were directed into those channels specifically requiring investigation.
Of these recommendations, Sir George Wood noted:
As a blue print for the proper and orderly development of statistics, this prescription could hardly be bettered. The foresight of the Commissioners, looking at our statistical problems as long ago as 1912, is to be admired ... . Although over the years many august bodies have made recommendations regarding this or that class of official statistics, the 1912 Royal Commission is the only occasion which I can recall where the whole of official statistics – in all government departments, has been brought under review by an authoritative body not directly concerned with that work.
In 1915 the Government Statistician was able to announce that an investigation into

16
before computerisation:
Provisional estimates of incomes are required as soon as possible after receipt of sample returns. As an alternative to hand sorting and resorting of cards containing incomes data, the cards have now been redesigned to use a semi-mechanical system of sorting with a considerable saving of time at the most appropriate period. Holes are punched near the edge of the cards bearing the basic information, each hole representing an income group. A hand-punched slot is then made to connect the hole for the appropriate income group to the outer edge of the card. Sorting is done simply by pushing a steel pin through the hole for the group desired and raising the pin. All cards in this group fall out, other groups remaining on the pin.
Some key staffOver the period 1910–1920 some brilliant young economists descended on the office, then with a total staff of around 50.
Dr J B Condliffe (1914), external trade indexes. The results of Condliffe’s research into external trade were published as a special article in the 1915 Yearbook. His work set the pattern for the derivative statistics on the subject for many years afterwards.
Dr C B Copeland (1914–1916), retail prices. Among other things, Copeland was involved with the Department’s first venture into retail prices. A comprehensive report was published in November 1915 – ‘Report on the Cost of Living 1891–1914’.
Dr E P Neale (1916-1919, 1926-1928), 1916 Census. While Mr Cruickshank was in the armed forces, Neale took over the control and ‘writing up’ of the 1916 Census.
G W Clinkard (1917–1920), wholesale prices, wages. Clinkard made a statistical investigation of wages and working hours. This was published as a special article in the 1919 edition of the Yearbook.
Early links with AustraliaStatistical offices were established in the States of Australia very early on – well before the Federal Government came into existence. In 1861 the ‘State Government Statists’ (as they were then called) met in Melbourne, and another conference was held in 1875. E J von Dadelzen represented New Zealand at the 1890 conference which had the theme ‘Census of Australasia 1891’. In 1902 and 1906 New Zealand was again represented at these conferences.
Common standards were developed through these interactions. An 11 volume series by T A Coghlan was published from 1890 to 1904 – A statistical account of the seven colonies of Australasia, continued by Statistical account of Australia and New Zealand.
An international perspective on New Zealand’s official statistics in 1922In Economica 1922, A L Bowley, Professor of Statistics at the University of London, wrote the following review of UK Statistics by UK statistical officials:
We can learn something of the possibilities of properly organised public statistics and also of

17
National Income research in New Zealand was set back during the wartime statistical ‘freeze’, when the long standing statistics of income and income tax (derived from income tax returns) were abandoned for four years.
In 1949 the first official estimates of National Income were produced. Work continued on refining and extending the system of National Accounts until, in 1956, the Department was able to announce the completion of a structure of sector accounts for the economy. This enabled the preparation of input-output tables to start, and by the time George Wood left the Department in 1957, the first tables had been published.
Research and Technical UnitThe First Annual Report of the Department of Statistics 1956, described the recently set up Research and Technical Unit:
In July 1953 the post of Chief Research Officer was created and a service branch known as the Research and Technical Unit set up under his control. The new branch absorbed the research section of the former Research and Trade and Transport and also other scattered activities of research nature. Its functions are:1. To revise existing statistical series and to inaugurate new series as required, the new or
revised series after being put into running order being handed over to the respective operating branches.
2. To provide other branches with mathematical or technical assistance where necessary, particularly in the way of sampling techniques.
3. To reply to inquiries from other Departments, public bodies, international agencies, and the general public, more especially those having a research element or requiring discussion of the scope or interpretation of published statistics.
4. To carry out approved research projects on behalf of such outside agencies.5. To compile periodical statistics which necessitate the use of actuarial methods.6. In special cases to compile current statistics involving continuous research.Also in the exercise of these functions matters not infrequently arise within the unit which point to a need for further investigation and which may later become approved research projects.
Some early technology1921 saw the introduction to the Department, of mechanical methods for classifying statistical data. Malcolm Fraser attended the first Commonwealth Conference of Statisticians in London in August 1920, and at the same time he had gained authorisation to get Powers-Samas accounting machines. He visited the United States to arrange the purchasing of these. It took a while to come to grips with the machines – the Superintendent of the Census (who was unenthusiastic about them) had framed on his wall the first sorting slip to emerge from the machine room correct in all respects (a rarity apparently).
The 1956 annual report describes a new system for fast sorting of income data, which gives an idea of the physical constraints under which statistics were compiled

18

19
the chaotic state of information of many of the most pressing world problems of the day from, on the one hand, the Official Year Book of the Commonwealth of Australia, 1920, and the New Zealand Official Yearbook, 1920, and on the other hand, from Labour Overseas, published quarterly by the Minister of Labour, and from the International Labour Review, issued monthly by the International Labour Office, Geneva. New Zealand, Australia, Canada and South Africa have apparently accepted the responsibility of the Government with regard to the publication of information, and especially in New Zealand the range of statistics includes the great majority of subjects (with the exception of incomes) about which statisticians have been able to devise measurements. We notice that there is no material for computing marriage and birth rates corrected for the varying distribution of the age, sex and marriage constitution of the populations, nor has the problem of allowing for modification of diet in the early construction of cost of living index-numbers been tackled, nor is any measurement given of the quantity or volume as distinct from the value of external trade; otherwise the best and most modern methods appear generally to be used.
ReferencesCook, Len W. (1987) A Sample of Highlights in the History of Government Statistics.
The New Zealand Statistician, Vol. 24 No. 2, 57-65.Wood, Sir George (1976) Progress in Official Statistics 1840-1957; A Personal History.
Wellington: Department of Statistics.

20
in his classical conflict with Fisher. He was supplying him with data and pressing him to fight for the systematic cause. But this cause was lost, of course, on Student’s death on the eve of his proposed visit to his brother and Hudson in New Zealand. A summary of the correspondence between Hudson and Gosset was prepared by Arnold (1985). See Chapter 4, The Hudson-Gosset correspondence.
After Hudson moved to Massey in 1936, the experimental work was continued. Another agricultural graduate, P B Lynch, joined the section for a while before he was taken into the armed forces; then in 1945 came the first appointment of a statistician, A A Rayner, and Lynch returned to head the section.
At about the same time, one of the notable leaders in the department, P W Smallfield, was setting up the Rural Sociology Division to deal with the sociological aspects of rural life, including the farm home, rural employment, the place of women, and farm finance. I came in to set up the statistical studies for that section. Before I got very far, Rayner departed for Edinburgh on a scholarship and it was considered more essential that I move across to fill the gap in the Crop Experimental Section. The rural sociology concept was probably a bit before its time.
From 1945 to 1960 the statistical work of the Crop Experimental Section expanded, as did the staff, and new field research stations were set up. Also, by the early 1940s the Ruakura Animal Research Station had accumulated a lot of data from their experiments on identical twins. Alan Carter was appointed there and after his return from Cambridge in 1948, there were two centres where statistical analyses were performed, the one at Ruakura and the larger one in Wellington, where we had quite a lot of contact with the Biometrics Section of the DSIR. See Chapter 1, Applied Mathematics Division.
During this period the Department of Agriculture was structured into several fairly watertight divisions. The biometrics group in Wellington were only concerned with the experimental work carried out within the Fields Division. This comprised the extensive co-operative programme on farmers’ land, the work at the Rukuhia, Winchmore and Invermay research stations, and several demonstration farms, all of which belonged to the Fields Division. Sometimes individuals from other divisions sought help from the biometricians who became aware of what they saw as an appalling lack of design or mishandling of data in these other divisions, but were not able to do much about it.
Briefly, some other strands of statistical importance were: the vast collection of data by the Dairy Division on production, grading of products, miles travelled by the inspections, etc; data collected by the Livestock Division on animals on the farm and animals killed in the meat works; the collection of economic data by a group, a legacy from the first economist, E J Fawcett, in the 1930s; the accumulation of results from tests for tuberculosis and other diseases in the large programmes for eradication of animal disease begun in the 1950s. These all remained as data collections, with calculated means, sometimes to 4 decimal places, and surveys were beginning to be the

21
Department of AgricultureJean Heywood (neé Miller) MA (NZ), Dip Math Stat (Cantab)
In May 1945, Jean Miller left the Dominion Physical Laboratory where she had been in charge of the Meteorological Laboratory, measuring gauges for use in armament production, and joined the Department of Agriculture. Soon after she was asked to take over the statistical work of the Crop Experimentalists section, in the Fields Division. From 1956-1958 she studied at Cambridge and gained a post-graduate Diploma in Mathematical Statistics. On return, she became Director of an independent Biometrics unit, to service other parts of the Department besides the Fields Division. Jean retired in 1969 as Director of the Biometrics Division and then worked part time as Biometrician at the Levin Horticultural Research Station. She returned to Wellington to work on special projects, many of which were related to her position as Chairman of the International Seed Testing Association. In 1980 she left the Department to work for a computer company, then as a biometrician for the Building Research Association of New Zealand, finally retiring in 1985.
The author discusses some of the more important strands in the history of statistics in the Department of Agriculture, with particular emphasis on the pre-1975 period. Personal recollections and comments, which are not on any official records, have been added. A version of this chapter was originally printed in The New Zealand Statistician, Vol 24 No 2, 43-49, Dec 1989.
Historical sketchThe history of analytical statistics in agriculture is generally considered to begin in the Department of Agriculture in the middle of the 1920s, when the ideas of R A Fisher and W S Gosset (Student) on replicated field experiments were adopted here. Results were analysed using calculated estimates of error to evaluate the significance of observed differences between varieties of manure treatments on field crops. One of these early trials had 31 replicates of 5 treatments.
In 1928 the Crop Experimental Section was set up under A W Hudson, initially in Palmerston North but later transferred to Wellington. For the next decade Hudson organised large series of experiments on farmers’ properties and calculated the significance of results using Student’s method of paired comparisons. He also analysed the records of many past experiments.
Although most statisticians of that time had accepted Fisher’s dictum that randomisation was essential, Hudson strongly believed that real error could best be minimised by systematic layouts. Hudson took a very active part in supporting Student

22
of the statistician for replication against the breeder’s limited supply of seed.We had another flurry in August before the Crop Meeting, which dealt with oats,
barley, turnips, etc. For the rest of the year it was summarising and analysing data from pasture trials that were cut at frequent intervals. Dry matter samples were taken as well as species determination. The walls of the office were festooned with coloured graphs of all this pasture growth data. These were done ‘in the winter when we are not busy,’ I was told. After a couple of years we had two days of winter, then I never saw it again.
At that time textbooks on practical applications of theory were very limited – really, only the two Fisher classics, which most agreed were pretty heavy reading. We had a well-thumbed copy of the Yates monograph on factorial experiments, as we used these a lot, with plenty of confounding, a term which the field people were only too willing to throw back at us. Although we read Biometrika, the Journal of the Royal Statistical Society, Annals of Mathematical Statistics, etc, it usually took too long to figure out how to apply the theory to our mundane problems. As Fisher said in his introduction, to use some of the classical probability theory was like taking a cannon to kill a sparrow, and you would probably miss the sparrow. In 1947, the formation of the International Biometric Society, and their journal, was a great stimulus to exploring new methods. After 1950 the flow of textbooks really took off.
It was always important for the biometrician to take part in the field-work for most kinds of trials. A willingness to get our hands dirty did much to dispel the distrust of the theoretician from Head Office, as well as giving us an appreciation of the practical problems. Trials were always carried out to simulate farming conditions as much as possible. We had once advocated a change in wheat plot lengths from 2 chains to 3, based on results from uniformity trials. It seemed a very good idea until a biometrician went to help harvest a very good crop and found he had to lift and carry bags of over 100lb, this being the yield from each plot. But the local agriculturist in charge of the trial would never have reported this; he would only have gone on grumbling about those ‘theory guys’ in Head Office forever. Once, I used a gadget devised by the great Bruce Levy to measure species composition in pasture. It consisted of 2 legs joined across the top by a horizontal bar with 10 equally spaced holes. With the legs pushed into the ground, the operator pressed a long hatpin down through each hole, recording the species of pasture which it touched. I soon realised that there was enough wobble in the hatpins for the operator to guide them onto a species he hoped to find. I was not sure that even a pasture ecologist, who really knew his or her grasses better than I did, would not also be tempted to get the easy answer or the one that he or she wanted. So I got the agricultural engineer to redesign the gadget.
We had a good relationship with most of the field staff. They were more used to the need for a statistical approach, possibly because of Rothamsted’s work which was held in very high regard, and the tradition from Hudson, but also because they were dealing with relatively small differences in a world with wide variability. This was in
23
‘in thing’.By 1960 there were many areas where there was a clear need for some kind of
biometrical help in the design of schemes and analysis of results. On the other hand there was a group of biometricians and supporting staff with a considerable amount of expertise which was available to only part of the Department. Under the authority of the Director-General, P W Smallfield, a separate autonomous Biometric Section was set up, outside any division, amalgamating the Wellington group and the staff responsible for the economic statistics. This group was to service all parts of the Department except the Ruakura campus.
However, a year later the whole Department was restructured and the Research Division was created and the Biometrics Section incorporated in it. This was not an ideal arrangement, even though there was a clear understanding that it would service all other divisions with the same priority as its Research Division clients. It was adopted because of the State Services system of salary promotions based on markings. It was considered best that biometricians and technicians should belong in the same division as all other scientists. As there was still only a handful of professional staff, they were kept together at Wellington, travelling as much as possible to their clients rather than being dispersed to any of the research centres. Ruakura had its own section that was growing in numbers and coverage of work.
By 1970 a new economics division had been created and expanded, so the economic statistics work was returned to it. With a larger staff of biometricians it was appropriate that some of them should be physically located at each of the research stations. Two fisheries divisions had been transferred into what then became the Ministry of Agriculture & Fisheries (MAF), each bringing its statistical history.
In 1976, with another restructuring of MAF, a new Management Services Division was formed. Biometrics and Computer Services logically became part of that. At the same time, those biometricians servicing the research stations were made responsible to the station directors, leaving the central unit to service all the other divisions. Since then, statistical work in the Ministry has become very diverse, and it would not be appropriate to discuss only that of the actual Biometrics Section.
Type of work and philosophyWhen I first came to the department in 1945, almost all experiments were comparisons of the varieties of manure on field crops and pastures, and data was handled by analysis of variance with the Fisher F-test. We had much co-operation with the Wheat Research Institute in testing their newly bred varieties. We used to have a spell of feverish activity in March to get all the results in and analysed before the Wheat Meeting in April, when the trials for the next season were planned; they had to be sowed in late April or May. The meeting was held in Christchurch, with an extra day at Lincoln to finalise all the details and designs; as usual, balancing the desire
24
abroad, were better paid than scientists in other disciplines, and thought they had pre-emptive rights on all knowledge relating to their field. These days, of course, with large-scale projects in animal disease control and epidemiological studies, it is a completely different situation.
That makes me think of one of the major differences in the type of work in the last 20 years compared with the first 20 years of the statistician in the department. Today statistics are widely used for management instead of merely for agricultural research and experimentation. This has demanded that the biometrician use a very much wider range of techniques and also have the ingenuity to devise new ones to suit each situation, where the data and the problems are far removed from classical.
The changing face of the StaffSo much for glimpses of the types of work and how they have changed over the years. It is perhaps interesting to look at the staff and how they fared in the environment of a government department with widely diverse functions. This is also related to changes in the types and means of computations.
When I first came to the Department of Agriculture, in the Crop Experimentalist Section there were two assistants called clerks who did most of the computations and handled the records of the experiments. As the work expanded we needed more assistants. It was comparatively easy to employ school-leavers with a good ability in maths and who could be trained to do quite complex analyses; the department hired girls who could easily have coped with university but the social climate did not give them the opportunity to do so. They were very happy to have a job that extended and interested them, in place of the mundane junior office work that would have been their alternative. But we had a real struggle to get recognition for them in the Public Service structure. At that time, in the non-professional division, all males with University Entrance (UE) progressed to the top of the basic grade, and from there competed for specific positions, but non-UE males and all females were stopped two steps below the maximum. Eventually it became possible for a woman with UE to pass this bar if she could obtain a higher mark than the males in the same work in the clerical division. But the senior clerks who did the marking would not recognise the value of our work, as they could not understand it. We did eventually get some promotion for our best women, but even after Equal Pay legislation was implemented it was always difficult to get recognition for them until the establishment of the technician grade.
Incidentally, in the Department of Agriculture I did not feel I suffered from sex discrimination, in marked contrast to the attitude in at least one division of DSIR where I was during the war. There I discovered one day that the male graduates of equal standing were receiving a higher duties allowance and when I said that I should be equally entitled to it, I was told, “But you are getting a very good salary

25
contrast to the approach in the older research stations where their work was more qualitative. They were looking for major breakthroughs, such as when hundreds of animals were dying of bush sickness through lack of cobalt. Even as late as 1950 you will find a published article from one station quoting the death of two sparrows as support for a theory!
At that time too, chemists traditionally duplicated analyses on the samples they received in the laboratory and quoted the agreement between themselves as a measure of the validity of the result. When they came to deal with such things as soil tests, they continued this approach, ignoring the huge variability between possible samples that could have been taken from the field. Much of the biometrician’s work, then, was in studying field variability, devising optimum plot sizes, and sampling schemes. I guess it still is, although probably in a more sophisticated way.
After a while there were many new lines of research and field experimentation, such as weed or pest control and the newer graduates had received statistical training during their degree course. Being familiar with analysis of variance, they proceeded to do their own calculations and write up results. But this was often not appropriate. Their data were grossly skewed distributions, often with many zeroes, or truncated distributions from a range of limited scores from 0 to 5, or 0 to 10. The sort of problem was that someone scored for the amount of clover remaining and got scores of 8, 9 or 10, mean 9, then also scored for the presence of the main weed and got scores of, say, 2, 1 or 0, mean 1. Conclusion: the first is the better system since it has a coefficient of variation of 12% compared with a coefficient variation of 100% for the latter!
I could go on about the explosion of surveys in the 1960s, along with horror stories about the use and abuse of multiple linear regression models, for which there were ready-made computer programs for the calculations but no guidance on the interpretation of the results. When the gathering of statistics became part of the work of the Biometrics Section, serious attempts were made to improve the validity of the basic data supplied, as well as correct tabulation and interpretation – a fairly thankless task, as those in the Statistics Department know full well. For instance, there were major discrepancies in figures on different aspects of meat production provided by the meat companies to the Statistics Department, Meat Board, and Department of Agriculture. We knew that the meat companies regarded this as a chore and also that they kept extensive statistics for their own management purposes. We felt that if we could set up a system where they produced figures for us at the same points in the process as they did for themselves, it would satisfy our need for getting correct data and be much less work for them. But no way would they discuss what that was. They just kept saying, “You tell us what you want, and you’ll get it”.
It was initially difficult to wean the veterinarians away from their traditional qualitative approach to experimentation. They had all been specially selected to train
26
delivered at the 1987 Conference on the History of Statistics in New Zealand – Ed.)
To conclude
In an organisation such as MAF, even within one aspect of it such as statistics, there are naturally several strands of development, sometimes coming together and sometimes separating. The organisation itself has gone through various cycles of Divisions and Section being amalgamated, then separated, then regrouped and brought together only to be separated again, as is happening at present.
References:Tee, G J, “New Zealand and the Early Pioneers of Computing”, New Zealand Journal of
Computing 1, No 2 (1989)G C Arnold, “The Hudson-Gosset Correspondence”, The New Zealand Statistician 20,
No 1, 20-25 (1985)

27
for a woman”. So off I went to the Department of Agriculture. I think it was P W Smallfield who set the attitude that it was what you did that mattered, and he was very willing to accept my view against that of his male agricultural staff if he thought it made sense. With his appreciation of the statistical approach, he made the biometrician a full member of the committees that deliberated on the work of the research stations. After meetings of these committees it was taken for granted that we would all drink at the lounge bar, where I could join them, rather than at the public bar. This was not the same when our work expanded to include handling the economic statistics and I attended meetings with other traditionally clerical departments where the senior staff was always male. I was not invited to join them in the back bar.
Anyway, to return to the development of computations: by 1960 the amount of experimental work had increased so that we were becoming less able to get results out on time, and the supply of suitable girls was drying up as more and more went to university. Fortunately, that was when the computer era arrived. In 1956 we had begun some mechanical computation. The head mechanic at Treasury, Jack Dainty, was sufficiently interested, through an approach by Errol Jones of DSIR’s Applied Mathematics Division, to modify one of his Powers-Samas punched card machines, to enable it to do sums of squares and products. On these cards we could punch up data from a large pasture experiment, or a survey, sort them in the mechanical sorter several times and then get total seasonal yields of dry matter or the values for the normal equatrions of a multiple linear regression analysis. It was a help, but still very clumsy.
But we knew of how Rothamsted was using an Elliott for analyses of variance, and when the IBM 650 arrived at Treasury in 1960 we were well geared to make use of it. The first program to run completely through it satisfactorily was Neil Mountier’s analysis for 2n factorial trials, on Christmas Eve 1960. This was before the Treasury programmers had got their government pay program going, which was the real justification for the purchase of the computer. The subject of the history of the use of computers is part of the development of statistics. (See Tee’s (1989) paper, also
28
surveys.The beginnings of the Division have been described in the chapter Some New
Zealand Statisticians – Ian Douglas Dick. Briefly, many of the biologists and agriculturists in the DSIR (then under F R Callaghan, Deputy Secretary until 1946 when he became Secretary) were finding that they were unable to handle the statistical analyses of their experiments, and the DSIR Council was asked to appoint a statistician to the staff of DSIR. In 1939, Ian Dick, who was a Senior Scholar in Mathematics from Canterbury University College, was appointed. When World War II came he served overseas, returning to New Zealand in 1946. On his return he was asked to set up a biometrics unit within the Head Office.
He decided to set up three sections in Wellington – theoretical, applied and computing. For the first section he began to recruit top mathematicians who would work without direction from him, provided they stayed in the general field of statistics. There were three in this group, each of whom was a Senior and a Postgraduate Scholar, and all gained PhDs at overseas universities.
Note, the following appointments were all made during the directorship of Ian Dick.
Theoretical1946His earliest appointment was Bob Williams MA (NZ) BA PhD (Cantab), who gained a Shirtcliff Fellowship from Canterbury. Bob chose to take up his scholarship at Cambridge University first passing the Mathematical Tripos, and then gaining a PhD with a thesis in two parts entitled “Systematic Experimental Designs for use with Serially Correlated Observations” and “The Use of Fiducial Distributions with Special Reference to the Behrens-Fisher Problem”. Bob returned to New Zealand in 1950 and three years later became the Director of AML. He left at the end of 1962 to become a member of the New Zealand State Services Commission. In 1967 he accepted the position of Vice-Chancellor of Otago University, and in 1973 he moved to Australia to become Vice-Chancellor of the Australian National University. Returning to New Zealand in 1975 he became Chairman of the State Services Commission, retiring in 1981.1947The next appointee was John Darwin MSc (NZ) BA (Cantab) PhD (Manch), who was also from Canterbury, who travelled first to Cambridge University, where he passed the Mathematical Tripos, and then to Manchester, where he studied under M S Bartlett, completing a PhD thesis entitled “Some biological distributions and their growth”. John stayed with the Division until 1978 when he became Deputy Government Statistician, and then Government Statistician in 1980, retiring in 1984.1948

29
Applied Mathematics DivisionEditor
The Biometrics Section DSIR (1946-1949)The Applied Mathematics Laboratory (1949-1964)The Applied Mathematics Division (1964-1990)The Applied Mathematics Group DSIR (Phys Science) (1990-1992)
The above four-named organisation (hereafter called the BS, AML, AMD, or Division) remained part of the former Department of Scientific and Industrial Research (DSIR) for almost its whole life. Its scientific history and work is written in the papers produced by its members, either individually or in association with authors outside the Division. The first such article was published in 1945 by Ian Dick – “A Note on the Evaluation of Determinants and Matrices”, NZ J Sc & Tech B26(6) pp 332/3. During the next five or six years the staff rose to about 10 and then to about 45 by the early 1980s, but by 1990 it had dropped to two. During this period 827 scientific papers were produced; that is about 18 per year, or one paper every two or three weeks. In addition, there were another 171 unpublished scientific reports made between 1967 and 1990. As well, staff members co-operated with other authors, either as compilers or major contributors, in producing a number of books. All these publications were indexed by the librarian, Cathie Benson, in 1992, and recorded in Publications and Personal Recollections – DSIR APPIED MATHEMATICS – Laboratory, Division, and Group (privately published, August, 1993). The Division gave much advice to other scientists, but their help was not always recorded in the published papers.
In addition to the written work, many of the staff gave lectures to a number of groups and organisations, covering a wide range of scientific and other disciplines at various levels, from elementary to advanced.
Most of the staff were located in Wellington but there were three outlying stations, one at Auckland working mainly with the Plant Diseases Division, another at Palmerston North with the Grasslands Division, and the third at Lincoln College and the Crop Research Division, both near Christchurch. At Wellington, in-house lectures were held more or less regularly at weekly or fortnightly intervals, and seminars with outlying staff two or three times a year.
Another aspect of the work of the Division was the training of statisticians for other organisations. For example, in the mid 1950s, Bill Warren (who later achieved a Doctorate from the University of North Carolina, Chapel Hill in 1963) from the Forest Service joined the Division on a temporary basis and remained for six months. He returned to the Forest Service and greatly enhanced the effectiveness of their

30
retiring.1951Garth Ward MSc (NZ), was the seventh appointee in this group. He only remained two years with the Division, and then became an actuary and joined the AMP. He married one of our computer operators, Jeanette Murray, and later moved to Sydney.
The final member of this group was Stan Roberts MA (NZ). He began his degree in 1940 as a part-time student attending evening classes at Victoria. With four years war service, plus school teaching, he gained a BA in 1947. He applied for a job but was told that he first needed to gain a Masters degree. After a further year’s teaching he was granted a rehabilitation scholarship for one year, completing his MA in 1949. In 1951 a vacancy occurred due to Phil Armstrong’s resignation, and Stan was appointed to the Wellington section.
ComputingAll the recruitments in this section were appointed to Wellington.1946Errol Jones MA (NZ), was appointed in charge of Computing in May 1946, and worked on the Powers-Samas punched-card machines. In 1965 he oversaw the installation of the ELLIOTT 503. He resigned in 1968 when he accepted a position with the NY State University, Ithaca.
About a fortnight later, Betty Milne BSc (NZ), was appointed as Errol’s assistant, but later moved to Christchurch, to help with computing at the Crop Research Division. She resigned in 1951.1948Claire Marshall BA (NZ), was the next appointee, who remained with the Section until 1953, and then accepted a teaching position at Hutt Valley High School.1950Jeanette Murray BSc (NZ), resigned in 1954, marrying a former member of the staff, Garth Ward.Clerical1948A clerk-typist, Jean Ewing was appointed in 1948, and remained with the Division until 1952.
Mathematical/Physics(The history of this section is recorded in the Publications and Personal Recollections of the Division – see above).1949Robin Wooding MSc (NZ) PhD (Cantab). One further appointment was made by Ian Dick, but not in the Statistics section. Robin had been working in the Underwater
31
The third member was Peter Whittle MSc (NZ) PhD (Uppsala), from Victoria University, whose career is given in the chapter Some New Zealand Statisticians. He resigned in 1957.
Applied1946The first appointee was Phil Armstrong MSC (NZ), who was working with Ian Dick during the war in the Radio Development Laboratory. He was stationed in Wellington. (See the note about him in Chapter 6, A note on the Cold War).1947The second was Hamish Thompson MSc (NZ) PhD (Manch) from Auckland, who travelled to Manchester and also studied under Bartlett, completing a PhD thesis entitled “Spatial Point Processes with Applications to Ecology.” Hamish became Director of the Division in 1963, and in 1982 went to the Head Office of the DSIR as a Chief Director, retiring in 1987.
The third was Graham Wright MSc (NZ), who was recruited to work at the Crop Research Division at Lincoln. In 1953 he transferred to that division.1948Fourth was Brian Hayman MSc (NZ) PhD (Birm) who went to Birmingham University, studying under K Mather, and whose thesis was entitled “A Mathematical Representation of Gene Action and Interaction”. The external examiner was R A Fisher. He continued research in quantitative inheritance at Birmingham until he achieved a record period of overseas leave (seven years) from the DSIR. On his return in 1955 he was seconded to the Crop Research Division at Lincoln. Brian remained with the Division until 1964, when he became Professor of Mathematics at Massey University.1949The next was Bill Taylor MSc (NZ) MSc (Lond) PhD (Adel), recruited from Auckland, and on returning from England, was stationed in Wellington. He left the Division in 1960, working first with the NZ Wool Board, and then the NZ Meat Board, and in 1966 accepted a lectureship at the University of Adelaide, South Australia. In 1968 a Department of Statistics was formed, and he was employed there until his death in 1994. His PhD thesis (1972) was entitled “Some Aspects of Statistical Analyses of Shape with Application to Bone Morphology”.1950Arch Glenday MA (NZ) MSc (Lond), completed his MA at Canterbury and then took a short-term commission with the RAF. He became a navigational instructor in England. Unfortunately he got TB, and when in hospital he decided to do a London MSc in Mathematics. He achieved this and then returned to New Zealand, and was stationed with the Grasslands Division at Palmerston North. He died in 1967 before

32
Director had a room to himself. Bob Williams, John Darwin and I shared a room.One of my jobs was to look after the library which was in another room, shared
with the computors who often used the small calculators. When I first joined the Division there would have been a thousand or so books, and about 20 journals. Ian Dick was always keen on a good library, and according to Head Office, who did the ordering of books, we got far more books than the size of the staff warranted. He claimed, however, that the Division spent little on equipment and should therefore be permitted to spend more on books. He continued to build up the library, and by the time he left in 1953 he had built up a first class statistical library. No university in New Zealand had anything like the quality or quantity that this one had – the reason being that the Mathematics departments of the universities did not start lecturing in the subject until many years later. We had borrowers from all over New Zealand continually using our services.
The books most used by the staff were –
Cochran & Cox, Experimental Designs, Wiley & Sons, 1950H.Cramer, Mathematical Methods of Statistics, Princeton, 1945W Feller, Probability, Vol 1, Wiley, 1950R A Fisher, Statistical Methods for Research Workers, Oliver & Boyd, 1925C H Goulden, Methods of Statistical Mathematics, John Wiley, 1939P G Hoel, Introduction to Mathematical Statistics, John WileyM G Kendall, The Advanced Theory of Statistics, 2 Vols, 1945-1946, Griffin & Co, LondonAlexander Mood, Introduction to the Theory of Statistics, McGraw Hill, 1950George W Snedecor, Statistical Methods, Iowa State College Press, 1937L H C Tippett, Methods of Statistics, Williams & Norgate, 1931C E Weatherburn, A First Course in Mathematical Statistics, Cambridge UP, 1949G Udny Yule & M G Kendall, An Introduction to the Theory of Statistics, Griffin & Co, London
There was one big room which housed all the Powers-Samas equipment. My first job was an analysis of the Appleby Experiment (see Chapter 4). The original analysis had been started by Phil Armstrong. There was an immense number of records for the years from 1933 to 1956 which, when put on to punched cards, seemed to keep a good proportion of the computing staff occupied for about two years, and the writing-up a further two years. The complete analysis amounted to a bulletin of 155 pages (see Chapter 4, The Appleby experiments).
In 1953 we moved to the upper floor of 21a Courtenay Place. This was certainly not an academic area but very much downtown, among a cheap shopping area, with some obvious benefits for the staff. The building had a verandah on the street side, on
33
Research Laboratory since 1948. This appointment was a result of the DSIR Council asking Ian Dick to take charge of all geothermal investigations in New Zealand. This meant that the work of the Division would be widened to include a mathematics-physics group, and the name was changed to the Applied Mathematics Laboratory. Dick looked round for staff and met up with Robin Wooding, who by this time had received a Post-Graduate Scholarship which he was about to take up at the Cavendish Laboratory at Cambridge. He gained a PhD and returned to New Zealand in 1954.
Work BeginsThe Division began work in 1946 in an old building known as ‘Samuels & Kelly’ (clothing manufacturers), in Majoribanks Street, Mt Victoria, Wellington. It was located in a penthouse that had been erected during the war to house the Radio (Radar) Development Laboratory. The small staff had, along with almost all other labs round the world, very limited computing equipment which consisted of hand and desk calculators. This was improved a few years later by the transfer of some old Powers-Samas punched-card machines from the Department of Statistics.
The only newly appointed staff who had had any formal training in Mathematical Statistics were John Darwin and Graham Wright who took lectures in this subject for MSc in 1946 under Professor Saddler, who swore he would never teach it again. It was an optional course not formally listed in the College Calendar. Lectures for a degree unit in this subject did not start until many years later (see Chapter 3, Universities). So, the early appointees learnt their statistics either at an overseas university, or from books in the library, or from returning overseas staff.As one of the staff (Hamish Thompson) remembers it –
In retrospect the Majoribanks Street office was a peculiar place. My recollection of its geography is very hazy after 44 years, but there was one huge room in which everybody (except Ian and the computors) sat in a location of their own choosing, except for Phil ensconsed right outside Ian’s room which was off one corner of the big room. There was another big room occupied chiefly by a pile of old Radio Development Lab coats, with some rooms off it, one occupied by Bob Unwin and Lyn Henderson of the Dominion Physical Laboratory (doing ionosphere work, I think); one of the computer operators (I can only remember Betty Milne); and, I presume, Errol Jones. I don’t even remember if the Powers-Samas equipment was there then – I can only recall its thumping on later visits when I was stationed in Auckland.
The first move of the Division was during 1950, to the second floor of Levy Buildings in Manners Street, which was also occupied by the Income Tax Department (Levy was a manufacturing tailor). I began my vacation appointment at the end of that year. Like all other vacation appointees I was given a straight-forward problem to solve. Mine turned out to be a replicated, three-way analysis of variance. Without any formal training in statistics I found the i, j, and ks, very confusing, but my solution was apparently satisfactory, as I became a member of the staff. In this building the

34
Bridge and/or chess was played every lunch hour and the system used for bidding in bridge was invented by a staff member, Ewan Drummond, of the mathematical-physics section. Another great hobby was singing. A madrigal group was formed which sang together as a four-part ensemble for about 25 years, and then widened itself to a small chamber group. There seems to be a high correlation between music and mathematics, although there are some extreme outliers – one of our directors (Bob Williams) was one of only three boys who were actually ejected from his school choir.
In the early years of the Division the necessary calculations were done with hand and electric desk calculators – Frieden, Facit, Multo, Brunsviga, Munromatic etc, with one member constantly using a slide rule. In addition, some of the staff used a book of tables. In 1814, Peter Barlow, of the Royal Military Academy of Woolwich, England, produced a magnificent book of tables for all integers up to 12,000, with functions such as Square, Square Root, Cube, Cube Root, Reciprocal, etc.
It has 80,000 entries, some of them containing as many as 14 digits. It must have been a horrendous task. In his preface Peter Barlow says, “The only motive which prompted me in this unprofitable task was the utility I conceived might result from my labour.” These tables were sometimes used in conjunction with a hand machine – looking up a table entry, and then using Newton’s iterative method to approximate the answer to whatever accuracy was desired. Other members simply guessed the answer and iterated.
The Munromatic Electric Hand Calculator (model 10/1/213) was the main machine used by computors. It resembled an old Remington typewriter, in that it was full of moving parts, and weighed about 15 kg. It had a keyboard of 10 rows and 10 columns, plus two registers each of 21 places. The lower register gave the result of an operation, and the upper one recorded the number of operations. A favourite method of finding square roots was to use the fact that the sum of the first n odd numbers equalled n 2, and one used the reverse process to find the square root. If, for example, the square root of 16 was required, this number was first entered on the lower register, and then 1, 3, 5, 7 were successively subtracted. The lower register gave zero, and 4 appeared in the upper one. This method could be applied to any number. It was an extremely fast method for those times – the square root of a four-digit number could be computed, correct to four decimal places, in about 20 seconds. One staff member used to try to beat this method by guessing and iterating by Newton’s method, but never succeeded. One member of the computing staff claimed to have invented an analogous method for finding cube roots but found it too cumbrous for quick calculations. Another advantage of this machine was its ability to calculate correlation coefficients quickly, provided the numbers were not more than three digits. x was entered on the far left side of the keyboard and y on the far right. When the multiplication key was pressed x 2 appeared on the left-hand side of the register, 2xy in the centre, and y 2 on the right.
35
which the vacation students would, in fine weather, bask in the sunshine stripped to the waist, complete with their statistics books, claiming that they were studying. There were also, unfortunately, large windows facing the opposite side of the street, and we had our morning tea in one of these rooms.
From time to time, shopkeepers would ask us why we took so long over tea, and we had to explain that our teas were taken at times when we were discussing mathematical and statistical problems. This verandah also provided a grandstand for various processions that passed from time to time. One capping week, some students on the back of a truck threw flour bombs at us. Two of the staff retaliated but unfortunately their aim was not too good, and a very irate woman, accompanied by a young policeman, stormed up the stairs, and the two spent the next half-hour cleaning her car. One of the shops below was that of a hairdresser by the name of Duncan, and by a rare chance, one of our staff was also named Duncan. One Christmas party some alcohol was ordered by the Social Club under the name of Duncan. It was delivered by mistake to the hairdresser, who regarded it as a Christmas gift from heaven, and immediately began to drink it. He handed over the remainder, but only under a threat of police action was he prepared to pay for what he had already imbibed.
At this time in the DSIR, the salary scale was called the “Watson-Munro Scale” named after the former DSIR Assistant Secretary, who invented it. Each Division was given the same average mark, and the scientists were grouped about that average according to the Director’s estimate of their value. In addition, each Division had a number of technicians who were paid a lower salary, generally, than the scientists. Our Director managed to get two of our technicians’ designations changed to that of scientists, which even on a low scientist’s rating, significantly increased their salaries. And as a result of two staff having a low scientist rating, and because of the ‘average’ system, this gave him the freedom to get more of his scientists into top gradings. The top of the technician’s scale overlapped well into the Scientists’ scale. This system was changed later on, to a large overall system, where all scientists were put into an order of merit system for each division, then all were slotted into a giant list for the whole of DSIR. This apparently caused tremendous arguments among the various directors, because of the obvious difficulty of comparing the work required by different scientific disciplines. The salary distribution of our top staff was in fairly close relationship with that of the senior staff of a university. The applied staff were more or less equal to middle university staff. The salaries were not large but were sufficient. They were hardly comparable to those in private enterprise, but the security in tenure was much greater. About the only reason for dismissal in the Civil Service was that one was continually late for work, continually drunk, or, most importantly, constantly annoying one’s superior officer. However, the superannuation was very good – after 40 years continuous service, one retired on a life pension of two-thirds of one’s final salary.

36
from Lake Grassmere in Marlborough.About 1959 the Division felt that it ought to move to a more appropriate home.
The possibility of finding space close to the Victoria University Mathematics Department had been considered at a previous time, but it became a possibility when it was known that the Maths Department was destined to move into a new library building, still in the planning stage. Jim Campbell (Professor of Maths) and Bob Williams decided it was time to move, and secured the necessary agreements. The main reason for seeking the closer arrangement was the advantage of forming a larger group that provided opportunity for discussion and a variety of ideas. Common access to libraries was also significant. Although the Division was hoping to acquire a computer that would also be of use to the University, this was never a condition of the agreement. The DSIR Council accepted the scientific argument for the move. Jim Williams (Vice Chancellor at Victoria) shrewdly suggested that we should not float the idea at Victoria until the plans for the new library were approved, so that our space could be seen as clearly additional space, and not at the expense of the University. This was done and the University Council approved the arrangement.
The Department of Education (which at that time had the University finance on its vote), suggested that the cost be included in their votes so that the administration of the whole contract could be a single vote. We accepted that eventually the University library would want to expand into that space, as was intended with other floors, and in those trusting days we assumed that if the arrangement had worked well, a similar co-operative attitude would prevail to house the two organisations together on some other part of the campus. The Ministry of Works also supported the scheme as being no more costly than any other solution. We expected not to have to move for 25 years. (This was perhaps the best estimate, scientific or otherwise, we ever made – we moved there in 1965 and out again in 1990.)
Although Bob Williams was the moving spirit behind the move, he resigned in 1962 to go to the State Services Commission as a Commissioner, and Hamish Thompson became the new Director of the Division, and successfully moved us into our new home three years later. At the same time he successfully moved himself into the wonderful new Director’s office, designed by Bob, with a magnificent view over Wellington City and harbour. This occurred in 1965, at the same time as the arrival of our new Computer, the ELLIOTT 503. Nobody realised the effect that electronic computers were to have, not only in our own work, but in the lives of everybody else. They heralded a complete revolution in our ability to handle scientific data, and were the death of all hand and electric calculators. The Division had previously had access to two earlier machines, the IBM 650, and IBM 1401, and these two, together with the ELLIOTT 503 are treated below.
In 1964 the names of several of the smaller laboratories of the DSIR became ‘Divisions’. The reason for this change was probably as follows – the Head of the

37
With larger numbers, the numbers on the register simply ran into each other.A small machine favoured by some staff members was the Multo hand machine,
measuring about 15 × 15 × 10 cm, and which sat on a desk. On this machine, Ewan Drummond computed, and published in the local newspapers all the times when the first Russian Sputnik would be passing over New Zealand. One of the interesting musical facts about this machine, was that when turned negatively through zero it gave out a little ‘ding’, and if a number of these machines were being used at the same time, it became quite orchestral.
Many of the jobs were concerned with multivariate analysis, where several independent variables were simultaneously acting on one dependent variable – eg the yield of some agricultural crop would be dependent on many variables such as meteorological data, different fertilisers, geographical positions etc. These would be expressed by a number of simultaneous equations and would be solved by the inversion of a matrix, most of these matrices being symmetric. At this time many different methods of solution were being evolved, and searches were made for the quickest method. The technique we used was called ‘pivotal condensation’. One just sat at the machine and hammered away, hour after hour. A competent operator could invert a 6 × 6 matrix in less than a morning, but to invert an 8 × 8 would take a full day’s work. One operator was asked to invert a 12 × 12, but gave up after a day. However, the scientist decided to do the computations himself, and spent three days at the keyboard. A big attempt told to me by our man in Palmerston North, was that of the inversion of a 23 × 23 matrix by a scientist, who eventually gave up because of rounding errors.
In the late 1960s I was appointed by the Government Stores Board, who were responsible for the purchase of all Government equipment, to examine and report on all new types of electronic hand calculators. This only lasted a few months, as I was deluged by calculator salesmen, mainly Japanese. I was asked by only one such salesman what we actually wanted. I replied that a machine with five memories (for correlation) would be helpful, but it seemed that this would price such a machine out of the market.
While we were in Courtenay Place, in addition to the machines already described, we purchased for £25($50) a Differential Analyser, in 1950. This had been built by Professor Douglas Hartree and brought to New Zealand by Dr H A Whale of Auckland University, from Manchester University. It had been built in 1934, almost entirely from Meccano parts. Errol Jones spent much time in re-assembling it. It resembled five turntables for long-playing records, all turning at different speeds, the speeds being the input variables, and a pencil was attached at one end which drew graphs on a sheet of paper. Like all analogue computers it could only cope with the limited class of problems with which it could be considered to be analogous. It was used for a couple of problems – fluctuations in rabbit populations and salt production

38
DSIR was formerly known as a ‘Secretary’, but aiming at greater status he decided to become a General, and so became known as the ‘Director-General’. And a General of course, must have ‘Divisions’ under his command. So all the laboratories which were numerically small and whose opinions consequently counted for nothing, were compelled, willy-nilly, to become Divisions.
39
A Tribute to the Applied Maths Division, DSIR (1952–1986)Ken Seal, Chief Technical Officer, Amalgamated Brick & Pipe Co and Crown Lynne Potteries, Auckland. (A version of this paper was originally printed in The New Zealand Statistician, Vol 32 No 2, 1997)
“If it works, don’t fix it”If only the present Government recognised the old adage. I was appalled when I heard of the reorganisation planned for the DSIR and in particular the demise of a division such as Applied Maths. This independent group of government mathematicians, covering different specialist disciplines and fields of research was, I believe, unique. It says much for the foresight and acumen of Ian Dick to consolidate statisticians, pure and applied mathematicians, mathematical physicists, and operational research experts into a single group instead of the fragmentation that is common elsewhere overseas. The success of this combination of specialists enabled them to tackle complex and formidable problems in widely diverse fields. Their numbers were sufficient to bring to bear their different specialist skills on specific problems and to stimulate and generate original ideas and fresh approaches through their mutual interaction.
The contribution by Applied Maths to New Zealand’s wealth in the diverse fields of agriculture, horticulture, industry, transport, energy, minerals, and other resources, is immense. Its scope in assisting industry alone cannot be judged solely by the number of scientific papers that their staff published in this field. The ‘publish or perish’ syndrome was never the main criteria used by the group to determine whether to offer assistance to any particular industry. They just helped whenever they could. Publications have often been limited by industry’s need to preserve competitive secrecy and by some companies’ unwillingness for the Division’s prowess to be blazoned abroad – lest others follow!
While the immediate effects of the Division’s demise will not be felt immediately, I fear for the lack of ‘seed corn’ research and for the availability of a sizeable group of experts, embedded in the Crown Research Institute, to handle future problems as they arrive. Future economic growth for New Zealand depends not only on immediate ‘market forces’, it also requires a flow of novel ideas suitable for niche marketing. These are unlikely to be provided either by accountants or politicians and neither of these groups are likely to have original ideas when solutions are needed.
Before citing some of the case studies where Applied Maths have helped the companies with whom I have worked, a background as to how I became involved with them may be of interest. As a geo-chemist, my mathematical abilities are

40
promptly helped me with this immediate problem and set in train the very fruitful association with the Division that lasted throughout my working life. He also invited me to visit Courtenay Place where I met Bob Williams and the others in the group and learnt from them of their various fields of expertise.
Soon after this introduction to Applied Maths, Hamish Thompson returned from Manchester and became based at Mt Albert. And so a lasting personal friendship was forged and he became my mentor in statistics, experimental design, and operations research. Through our joint efforts and the active cooperation of management and staff at Amalgamated Brick, we devised a series of extremely successful plant experiments. These doubled the rate of brick production, reduced loss, enabled less raw material to be used, and improved the final product. From then on there was never any problem when Hamish or others from Applied Maths, visited the plant and suggested we try something new.
But the value placed on this work by Bill and Hamish is best reflected in the support given by Malcolm Clark, my Managing Director. He approved the recruitment of Fraser Jackson as my first professional staff appointment. Even this appointment was in collusion with Applied Maths, for originally, Bob Williams had intended to recruit Fraser for the Division. Bob was keen to see if industry could benefit from having a mathematician in their midst. He need not have bothered, for it is significant that while I was responsible for the technical side at Amalgamated, we always had at least one mathematician on the staff.
Fraser was joined early on by Graham Tate, while Maurie Mountfort and Ron Allen later became members of our technical staff. Subsequently, Fraser and Graham assumed chairs at Victoria and Massey Universities respectively, and Ron became a senior lecturer at Waikato for a while. They obviously had not suffered from being tarnished by industry as many academics had predicted!
All these people made significant and profitable contributions while with the Company. Just as important, they were accepted without hesitation by management and operating staff. The acceptance by the later was undoubtedly helped by one of Fraser’s first essays into practical experimentation when, for a period of thirty-six hours, be climbed under a hot kiln to adjust thermocouples. Not the usual introduction to higher mathematics! Yet the importance of obtaining this sequence of results for the whole passage of cars through the kiln was to be shown later.
We had recently increased brick production by the construction of a tunnel kiln designed by Tom Clark, the joint Managing Director. The kiln was fired by automatic coal stokers sited on top of the kiln. Initially problems of controlled feeds were overcome by systematic sampling of the stoker’s discharge rates and applying standard quality control techniques. But the solving of this obvious variability did not eliminate some ware leaving the kiln either underburnt or melted. It was to investigate this problem that Fraser performed his antics. When the results were laid out it became

41
barely adequate and I make no claim to be a mathematician. I left school in 1939 and became a Student Assistant in the research laboratories of the General Electric Company (GEC) in Wembley, England. My interview was with B P Dudding of Quality Control Chart fame. This coincidence at least made me appreciate what statisticians could do. He offered me a job!
As part of GEC’s in-house training, Dudding arranged a series of seminars in experimental design and quality control, to familiarise staff with the services offered by his group. Thus, from the start of my working life I was introduced to the power, beauty, and logic of statistics and applied mathematics. During the time I worked at GEC I was able to attend Birkbeck College part-time and eventually to become a member of GEC’s scientific staff. In about 1946 was published, what for me was a most important monograph, “Industrial Experimentation” by K A Brownlee. Hardly an advanced textbook by Applied Maths standards, but just right for the uninitiated with its wealth of worked examples. As part of his general oversight, Dudding presented all scientific staff with their own copy; mine I still retain.
While at GEC, it was unnecessary to personally design any critical experiments as this service was provided by Dudding’s group. The situation changed dramatically when in 1948 I moved to London Brick Company. There, Dudding was invited to help in introducing quality control methods for much of brick production, but for research purposes, I was reduced to using simple experimentation designs copied from Brownlee. When I got stuck and needed help, as was often the case, I resorted to visiting Rothampstead Agriculture Centre as this was situated closer to Bedford than Wembley. I thus quickly associated the name of Fisher and agricultural research establishments with experimental design, an association that led directly to my later involvement with Applied Maths.
In early 1952 I arrived in New Zealand and commenced to work for what was then Amalgamated Brick & Pipe Company and Crown Lynn Potteries, later Ceramco. This proved a very happy association with those concerned and lasted until my retirement in 1986. My well-worn copy of Brownlee accompanied me across the high seas and became my sole support for designing plant experiments. It was not long before my limitations became clear. I had cheerfully moved from calculating regression lines and correlation coefficients into, what was for me, advanced multiple correlation, with two, and even three, variables! But now I wanted to try the effect of adding a fourth variable and Brownlee had no such worked example for me to follow slavishly. I now needed help badly!
At that time I lived in Mt Albert and was well aware of the Plant Diseases Laboratory of DSIR, which was nearby. From my experience at Rothampstead I automatically assumed these laboratories would have their own resident statistician and so I phoned and asked to speak to whoever it was. It turned out to be Bill Taylor, who fortunately for me, was visiting Auckland from Wellington at that time. He

42
especially the use of EVOP techniques. The operators and staff in all plants were now largely responsible for their own testing and quality control charts. Only random walk checks by independent inspectors were established and these were easily extended to police the systematic changes required of EVOP. By now the success of calling on the assistance of Applied Maths became well known in the ceramic industry; as a company we had certainly been able to demonstrate their helpfulness. Peter Foster, the Director of Pottery and Ceramic Research Association, had already worked with Alec McNabb, also from Applied Mathematics, on the diffusion of hydrogen in steel, and with our successful examples, he introduced Applied Maths to other ceramic firms, all of whom benefited from the help they received.
But further assistance in Operational Research was needed when it came to a major decision as to what additional equipment would be needed to support a further doubling of brick output. All senior personnel were invited to draw up what extra equipment would be needed to achieve this. Unfortunately, no two people agreed on what additional plant should have priority! We called on Applied Maths and Tony Vignaux helped resolved the impasse. Tony modelled the whole plant with its varied outputs, simplifying where needed but retaining all the critical parameters. He then simulated the operations over several months and came up with an optimum solution. And the solution was the surprise. All of us, nominally competent in our jobs, had failed to recognise where the main bottleneck was situated. Tony’s solution provided not only by far the cheapest option, but later proved, in practice, to be eminently satisfactory.
Maurie Mountfort worked with Alex McNabb on the theoretical drying of clays, coming up with a novel approach to determine their relevant characteristics in the lab. This work enabled the company to use the many local clay deposits that were too small and risky to exploit before this work was completed. Likewise Ron Allen revised and improved the overall control of pipe size, initiated earlier by Fraser. Maurie and Ron also devised a new test for sewer lines that eliminated temperature differences due to changing meteorological conditions. This work, when it was published, received its final accolade when the British Ceramic Research Association patented the idea in the UK without any acknowledgement or reference!
The Mineral Resources Council, of which I was Chairman, made a request for the services of Fraser Jackson, John Darwin, and Tony Vignaux, to quantify the worth of New Zealand’s mineral potential. The National Development Conference reports confirmed they were successful and their findings were accepted as a first in this field. To achieve this they had developed new techniques and given positive economic reasons as to why mining and further geological exploration should be encouraged. This is a further example of how work in an unrelated field may be beneficial in others. This estimation method was used, with only small modifications, to prioritise the geothermal prospects of Indonesia. The technique combined the technical and
43
apparent that there were continuous cyclic temperature fluctuations, both in the ware and at the control thermocouples. But why were the kiln temperatures periodically going haywire when the controls that were installed should have been taking corrective actions? Again, it was time to call in Applied Maths.
This time both Ewan Drummond and Peter Whittle became involved. After they had perused the data they came up with a novel solution. Turn off all the control systems for a short period every day! What was happening was that the cyclic temperature fluctuations at the control points were giving rise to ‘beats’. That is, periodically, the temperatures at the control points partially reinforced or cancelled each other out; which in turn led to the alternating melting or underburning that was experienced. Ewan and Peter’s simple solution prevented any significant beats becoming permanently established and eliminated the problem at no additional cost. Graham, John Darwin, and Stan Roberts then solved the problem as to how to combine and prioritise a number of independent attributes so as to give an overall quality appraisal of bricks leaving the kiln.
Peter and Fraser tackled the problem of selective fitting of sewer pipes to exacting size restrictions from a bivariate distribution leaving only a minimum number of rejects. Concurrently Fraser was introducing into the plant a sophisticated system for the control of the mean pipe sizes. Also, as part of these new developments, Fraser solved the distribution of gap size resulting when two ellipses of different sizes and eccentricities, each with their own independent distributions, are randomly presented to each other. Hamish later analysed a major lifetesting experiment that helped determine the safety factor required to combat static fatigue in general ceramic materials.
But it was Hamish who remained our constant support. It would be impossible in this note to cover all the help and advice that Hamish offered over the years. Without the backup he provided, many of the ideas germinated by our staff would never have been tested by feasible and effective experimental designs. One such design that was hammered out in this manner formed the basis for body control that was introduced at Crown Lynn Potteries.
The original concept was based on a paper presented by Arch Glenday at a Statistical Association Conference in the late 1950s. Arch was interested in removing the effects of meteorological conditions from various grasslands’ fertiliser treatments. Capitalising on his idea and modifying his experimental design, it proved possible to separate, into their component parts, the independent effects of firing conditions and body composition on the final product. Standard quality control techniques could then be applied separately to both factors. The system ultimately introduced, using this serial design, served extremely well. It formed the underlying basis for the overall control system at Crown Lynn from that date until the plant’s closure.
Much of the Operations Research was derived from in-house research,

44
is the case! However, they never once made me feel inferior or amateurish in my approach. Always they have treated me as a welcome colleague, even when I disturbed their peace and current researches at Courtenay Place or at Victoria!
I regret their demise as a separate organisation and their incorporation into what I fear will prove a less sympathetic organisation. I fear that their unique place in New Zealand science will tend to be forgotten and their successes overlooked. It was their independence of outlook, their independence of association with other disciplines, and the cross-fertilisation of ideas from within a coherent group, that gave them their special flair. It should also be remembered that their strengths arose partially from the brilliance of their recruitment policy – in appointing largely first class brains. This helped ensure the continuing quality of their scientific output. I mourn their amalgamation into a hodge-podge of other disciplines and the loss of many of their excellent scientists in the quest for rapid monetary paybacks. The Applied Maths Division has already contributed much to New Zealand. How much more it might have conferred, if it had only been preserved, we shall never know.

45
economic data into a single figure on which priorities could be based. How successful the technique proved, can best be judged in that four out of the top five prospects identified as having the highest priority, are already being developed.
From the field of ceramics to geothermal, it was to Alec McNabb that I turned to help form a conceptual model of the Kamojang geothermal field in West Java. His knowledge and the wealth of knowledge from Applied Maths and other divisions of DSIR, helped substantially in the delineation and development of this field. The success of their contributions may be judged by the fact that its generative capacity now exceeds that at Wairakei.
In conclusion, I find it difficult to find any reason for the draconian treatment of Applied Maths by government. The economic return from their work, for just one company, is impossible to estimate. This belated tribute barely touches the surface of the variety of help given willingly over more than forty years. Their professional expertise, experience, and willingness to ‘get their hands dirty’ in working with industry needs remembering long after they have ceased to exist as a separate Division. They will certainly not be forgotten by those they have assisted.
All staff with whom I have been associated have given much of their own, as well as departmental, time to help me both personally and my company. They have however, one fault that I feel must be mentioned with wry humour. They have often assumed that as the recipient, I had much more competence in their subject than

46
the New Zealand Dairy Board, he had embarked on statistical studies of interest and importance both to the dairy industry and dairy science.
Men like Hudson and Campbell and others, however, were, because of their normal occupations, unable to give anything like the amount of assistance and advice required. Consequently, New Zealand work was frequently criticised overseas for lack of statistical analysis, till recently still prevalent, as reported by Poole on his return from London in 1947. Steps were taken in 1939 to improve the position; but the war intervened and nothing was done until 1946 when the Biometrics Section of the DSIR was established as a permanent service.
Before going into details, something should be said as to the organisation thought best to achieve the objects set out above. The Laboratory consists of three groups:(i) Theoretical statisticians,(ii) Applied statisticians, and(iii) Computers.No other type of mathematical work, such as mathematical physics, is yet being attempted. It is thought best to do one thing properly than try several things at once, and because of lack of highly trained staff in various fields, do none of them well.
The computational group, using desk calculators and punched card equipment, met requirement (c) above; the applied group meet requirements (a), (e) and (f); while the theoretical group meet (b) and, with the applied group, (d) as well. To ensure that the Applied Group is most effective, the group is decentralised; an officer each at Auckland, Wellington, and Christchurch has already been appointed. A new graduate has been appointed and, after a suitable period of training will be located at Palmerston North. Decentralisation of the applied group has been adopted for two important reasons – (i) it is considered essential that the applied statistician be in constant contact with research workers; (ii) through their constant association with research work in various circles and fields, the applied group will be able to indicate to the theoretical group the directions in which new advances and further work are required for the solution of practical problems.
On the theoretical group depend the long-term value to the DSIR and scientific worth of the Laboratory. For two reasons. Unless the laboratory has a group of men who can critically understand and evaluate overseas work, then the value of overseas work will, for New Zealand, be largely reduced. Secondly, New Zealand has, in agriculture particularly, her own peculiar problems, often requiring new methods for solution. Overseas research men, not being continuously confronted with our peculiar problems, are often unaware of them, fail to appreciate their significance to us or are so preoccupied with their own work that they do not give our problems the concentrated attention their solution requires. In his report, “Science – the Endless Frontier”, Vannevar Bush’s comments on this point are particularly apt:

47
The first four years of the Applied Mathematics LaboratoryI D Dick (AMD)
Editor’s note – This article was first written in 1951 and hence the use of the present tense. For author’s biographical details, see Chapter 2.
This Laboratory was originally set up under the name of the Biometrics Section. However, the increasing activity of this section, in applying statistical methods to other branches of scientific work such as geophyics etc, made some more general designation desirable, and hence the name of the Biometrics Section was changed to Applied Mathematics Laboratory in the middle of 1949.The duties of this Laboratory are –(a) To advise departmental research officers as to the most efficient statistical
techniques and theory appropriate to their investigations;(b) To advance the study of applied mathematics and their application to biology,
agriculture, psychology, physical sciences, and industry;(c) To undertake large-scale computational work of a research character for
all branches of the DSIR, and, if facilities permit, for other Government Departments, University Colleges, Institutes, etc;
(d) For the benefit of DSIR, to systematically study recent advances in the studies detailed in (b) above;
(e) To inculcate in research workers an appreciation of the part played by modern statistical methods in the design and execution of experiments; and
(f) To provide, if desired, statistical advice to other Government Departments, University Colleges, Institutes etc.
This survey attempts to show how the Laboratory has tried to achieve its purpose over its first four years.
To explain, in detail, the reasons why the Department established this Laboratory would take too much space but it must be pointed out that the establishment of the Laboratory did not, of itself, introduce statistical methods into New Zealand.
Statistical method in agriculture was first introduced to New Zealand by Hilgendorf in 1924 and it was used extensively by Hudson and his colleagues in the Fields Division of the Department of Agriculture, and also by Hilgendorf and Frankel in the Wheat Research Institute, to mention only two of the most prominent groups. In addition, Dr J T Campbell of Victoria University College had given departmental scientists, and others, valuable assistance; while with Mr A H Ward of

48
A nation which depends on others for its new basic scientific knowledge, will be slow in its industrial progress, and weak in its competitive position in world trade, regardless of its mechanical skill.

49
Personal reminiscences (1953–1962)Bob Williams, Director (AMD)
Ian Dick had already been at Canterbury College for a year when I arrived to do mathematics in the Department, staffed by Prof Saddler, Mr L J Darwin (father of John – see the following section), and a school teacher who gave some evening lectures. Ian and I did a number of courses together, and he appeared to be embarking on a further Master’s degree in Physics, when he unexpectedly announced that he had been appointed to the DSIR to do ‘Biometrics’ – whatever that might be. I felt that I was present at the conception, if not the birth, of AMD.
There was a long period of gestation, for the war disrupted our careers. We spent some years together in the Radar Laboratory’s aerial section, and occasionally talked of his plans for setting up a biometrics section when the war was over. In 1944, when radar development was running down, Ian departed for the army (initially in Operations Research), and a little later I was seconded to the British group working on the Manhattan Project in the United States. When the war was over I went to Cambridge to take up a long-deferred scholarship. We kept in touch, and in 1947 he organised some funds to enable me to do a PhD at Cambridge, initially under John Wishart, and then, thankfully, under Frank Anscombe.
Returning by ship to New Zealand with a wife and three young children, we were met by Ian on the Wellington wharf a couple of days before Christmas, 1949. Ian and his wife, Betty, welcomed us warmly and took us to a tiny aero-club plane (the weather was too bad for the airlines) so that we could spend our first Christmas, after five years absence, with our relatives in Nelson. After Christmas, I returned to start a rewarding career with AML, then housed in the old radar laboratory penthouse in Majoribanks St, Wellington.
It was just thirteen years later, on the Friday before Christmas, when in the middle of our Christmas party I received a call to go immediately to the office of the Minister for State Services, Tom Shand. My feelings on the tram to Parliament combined relief that I happened to be wearing a suit that day, and anxiety as to what crime I had committed that could merit the attention of a Minister whom I had never met. Alan Atkinson, the Chairman of the about to be established State Services Commission, was already there and after a little conversation Shand asked me if I would like to be a member of the Commission, and to let him know before Monday because it had to go to Cabinet then. On Sunday, after talking to Ian Dick, by then an Assistant Director-General (who gave me some characteristic advice – “You’ve got no bloody choice, Bob”) – I rang Shand to accept, consoling myself with the thought that, at the age
50
of 43, my best mathematical days, such as they were, were over. Later, I remembered that I had once written a letter to the Commission, pointing out the statistical defects of their marking system, and subsequently, I had observed Alan Atkinson sitting unobtrusively (and unexpectedly) at a talk I was giving at a staff training course. I understand that another factor in my appointment was a totally mistaken belief that I knew something about computers.
I was never to enjoy the magnificent view from the office I had planned for myself, in the new building at Victoria University, which Jim Campbell and I had planned. My memory of the AML was to be of a scruffy pinex-walled building, infested by rats that we sought, by various innovative and largely unsuccessful methods, to eliminate. But it was also ‘infested’ by a bunch of very talented, warm, and cheerful mathematicians. I was fortunate that my abrupt transition to an occupation usually regarded by scientists with loathing and or contempt, was eased by a new group of colleagues for whose very different talents I developed huge respect and who loyally covered my abysmal ignorance; and by a Minister whose consideration, integrity and ability, left me with a totally unrealistic picture of the species.

51
How to be ‘usefully vulgar’ – the example of AMDJohn Darwin (AMD)
About 40 years ago, not many years after AMD began, I said to one of the rising American stars of research into problems in probability theory, that it was becoming quite difficult to understand the titles of papers in the Annals of Mathematical Statistics, let alone understand the papers themselves. I added that my main concern with probability and statistical theory was whether they were useful in particular problems of data analysis. He looked at me with mock horror and said, “You mean to say, there are people so vulgar as to use actual figures?”
He was, of course, not decrying the use of probabilistic models in furthering the understanding of cause and effect in the many disciplines in which numerical information may shed some light on the continued relevance of theoretical models. He was just more interested in the implications and development of probabilistic models, studied for their own sake.
Working researchers in a host of disciplines will, of course, be interested in any kind of theoretical work that describes interactions between the variables they have measured. Whenever they are sure that the models suggested by the statistician adequately represent the problems, they will usually be happy to accept the results of a statistical analysis. This is, for instance, quite likely to be the case in agriculture when there may have been a long history of consultation between researcher and statistician.
However, there are many disciplines in which there is not such a rich background. In such cases, the initial contact between statistician and researcher must be enough for the statistician to become sufficiently familiar with the researcher’s discipline and concerns for there to be a mutual understanding of the statistical study of patterns in the data.
Of course this is common knowledge to every working statistician, and many groups of statisticians have spent a long time with their clients to try to reach a common understanding of the true significance of collected data. The particular advantage of an organisation such as AMD was that it brought together scientists from different disciplines – statisticians, physicists, operations researchers, and computer specialists. In addition, there were well-established contacts between the staff and researchers in other disciplines. The virtue of this kind of mix was that there was a greater chance of a relevant description of a problem that was acceptable both to the researcher and the consultant team, than there would sometimes have been if there had been only a single discipline – say, statistics – represented in the very important initial contact between researcher and consultant.

52
The problems of Ken Seal’s, with pottery data (see Chapter 4, Experimentation in Industry) illustrate the worthwhileness of a team structure like that at AMD. Probably the most worthwhile work on his problems came from the contributions of physicists and chemists, with statisticians and operations researchers adding something once the proper models of the work had been formulated.
There have been many other AMD examples in which consultation with non-statisticians has been necessary; to illustrate the range of disciplines, I give just two. The first is the prediction of the greatest flows in a catchment area over a stated time. For this kind of problem, consultation with hydrologists, meteorologists, engineers, and geologists might prove a necessary supplement to a simple use of something like extreme value theory. In a rather different problem – the grading of a teacher according to the switches in his or her classroom from one classroom state to another (eg from teacher talking, to pupil asking a question) – might require input from educationists or psychologists, if a suitable model for data collection and analysis is to be achieved.
These, and many other examples, underline the worthwhileness of there being as wide a consultation between researcher and consultant, as is necessary to create a common understanding of a problem, and of how data analysis might contribute to its solution. The task of ensuring that data problems in the various scientific disciplines are tackled in a relevant manner, has, to some extent, been lost with the passing of AMD and its suitable measure of skills. AMD, as well as other wide-thinking institutions, showed it was possible to devise appropriate analyses for appropriate data, or, in reference to the title of this note, how to be ‘usefully vulgar’.

53
Reminiscences about AMLPeter Whittle (AMD)
For most of my time in AML I was too junior to know much of policy, so these recollections concern science as I encountered it there, and very much concern personalities and the memorable small events which make up the texture of life in such a group. This account then, is not the least official in character, but simply records my experience of working in a group which we, its sometime members, recall with affection and gratitude. My inclination is to be frank and I have tempered this only occasionally. These reminiscences, as literal as I can make them, contain both anecdote of a private and slight character and undoctored impressions of living individuals; alike, inappropriate for quasi-official accounts.
Being written with no other end in view than to preserve memories before they fade, this account is neither connected, finished nor polished. I have left loose ends which I could not knit in, and should be grateful to others who can. An article I wrote in 1994 (see Chapter 2, Peter Whittle) covers my own career in more technical detail; this complements the present account on some points.
My first encounter with AML came about through the beneficent cooperation of the head and founder of the unit, Ian Dick, and the most active figure in the Mathematics Department at Victoria University College (VUC), Professor J T Campbell – Jim Campbell to my seniors. I was in my second undergraduate year at VUC, and Professor Campbell arranged that I should spend the summer vacation 1946-1947 as a student employee at what was then the Biometrics Section. This represented a welcome change from the wool-stores, but turned out to be much more significant than that – in fact, to redirect my whole career.
The Biometrics Section had been set up in DSIR to meet the increasing demand for specialist statistical advice, from within the Department in the first instance. The problems in those early days generally came from the agricultural sector, although that later broadened greatly. The founder and first director of the Biometrics Section was Ian Dick. Ian was determined that this infant unit should become an elite group, and with his own drive and enlightened approach, he succeeded.
My impressions of Ian will emerge over the following pages, but I should lay in the outlines of a sketch. Ian had graduated from the University of New Zealand in mathematics, but had been caught up in the war, and had served with the Second NZEF throughout the Italian campaign at least – as a surveyor, I think, attached to the artillery. The New Zealanders developed a reputation for the effectiveness of their rolling barrage, from which the troops would emerge the moment it stopped. In
54
There was a definite post-war garrulity; people who had been exposed to the alternate stresses and boredom of wartime service life were always ready to while away time in chat. Ian himself willingly held forth about his experiences, spiced with reports on the continuation of war by other means – his current skirmishes with higher authority. However, the prize for garrulity went to someone innocent of service experience – the cleaner. He was almost a stock comedy figure: belt and braces retained trousers and overalls hitched over a low-slung paunch; a grey, toothbrush moustache set off an obtusely amiable face. His principal activity was conversation, his principal prop (also in the literal sense), a large broom. He obviously thought that whatever we were doing left us as leisured as he felt himself. Our instincts of courtesy, sociability and democracy were soon strained too far, and Ian had to assume the mantle he found so foreign – that of authority.
The vacation students were clean slates as far as statistics were concerned, and the first thing that Ian did was to set us to reading. Indeed, this formed the only statistical training I ever received. We began with texts such as those by Cochran and Shewhart. Later came Maurice Kendall’s magisterial Advanced Theory of Statistics, a work for which I still have the highest regard (see the 1994 article, Chapter 2).
For computation we had electrical versions of the Monroe, the Marchant and later on, the Facit. It came as a surprise to me then when I later found hand-Brunsvigas still in use in Uppsala and Cambridge. Somewhat later came the Powers-Samas punched-card machines, hand-me-downs from one of the other Government departments, nursed and cherished by a contemporary of mine at Victoria, Errol Jones.
As soon as we had done a little reading Ian introduced us to some of the statistical problems which the Lab had been asked to face. DSIR offered problems aplenty, and of a particularly enlightened character – partly so because they were provided by other scientists. They were rarely routine, and constituted research rather than consultation exercises. For example, at Ruakura we had the world’s largest herd of identical twin heifers, gathered to reduce the effects of individual variation. The construction and analysis of identical twin designs was then one of our first problems and provided my first journal publication, jointly with Ian Dick.
We student vacation workers were treated very well. As I have said, we had the chance to read ourselves into a new field and then to embark on research problems which were of real interest to somebody – indeed, to the applied scientists whom we met. These were, unfailingly, people of character and initiative, who accepted us as colleagues, scrubs as we were. However, Ian liked also to reward us with a ‘jolly’ and used to take us for a few days at the end of the summer to one of the research stations in the country. In this way Brian Hayman and I were taken to Massey College in Palmerston North, and to Ruakura.
I remember that in Palmerston North we stayed at a country hotel of a type which now perhaps scarcely exists. It was in the town centre – had perhaps once constituted

55
contrast to so many occasions in the past, the defenders were thus rushed before they could emerge and take up position. The role of the surveyors in planning the barrage was essential. However, in order to control errors of the second kind, the surveyors were also required to be in the fore of the advance, as Ian wryly recalled.
Ian well exemplified the free-booting, opportunistic approach which had characterised ‘Freyberg and his 40,000 Thieves’. Like most ex-servicemen, he also enjoyed a relaxed yarn. However, he also had real intellectual curiosity and a determination to build an elite unit, taking whatever time was needed. In person, I saw him as Celtic – dark-haired and dark-eyed. He was quite certainly also idealistic and sensitive, but kept this well concealed under a determined crudity of accent and combativeness.
One of Ian’s first problems was that of recruitment, and here he had to think long. There was no statistical training in New Zealand at that time, and so certainly no pool of trained statisticians. Moreover, Ian aimed to recruit the best, and had his eye on the stream of NZ mathematics graduates. His plan was to bring in promising undergraduates for holiday employment, and to develop their interest in the work of the Section sufficiently that after return from their graduate studies abroad (partially supported by DSIR in some cases) they would return to employment in the Section. By 1946-1947 he had already recruited two outstanding graduates whose studies had been interrupted by war-work: Bob Williams and John Darwin. Bob was working for his PhD at Cambridge; John was to do so at Manchester after completing the Mathematical Tripos at Cambridge.
The Biometrics Section was housed in Marjoribanks Street, ascending Mount Victoria from near Courtenay Place, and one’s first test was to get the pronunciation of ‘Marjoribanks’ right. The Section occupied the top floor of a commercial building, high enough that I unashamedly took the lift. I was puzzled one day to notice the lift knocking as it rose, and found out only later that there had been an earthquake.
The top storey of which I spoke had a tacked-on look. It had indeed been added to the building under the emergency conditions of the war, when it had housed the Radio Development Lab (RDL). The RDL still maintained a presence in the person of Bob Unwin. Also in the existence of a workshop with a drill press, guillotine, sheet-metal folder etc, which we all found useful for private odd jobs from time to time.
The Section itself was principally contained in a single large room, with desks disposed here and there in an open plan, Ian Dick being in the throne position. The permanent staff then consisted, as I recall, just of Ian, Phil Armstrong (who had served with the RNZAF in the Pacific, I believe) and Betty Milne. Betty was employed principally for computation, and worked in an adjoining room where the desk calculators were housed, of which more anon. Brian Hayman and I were the two meek vacation students.

56
of expression, leaving me ashamed but quite unresentful. However, principles are often inconsistent with a sympathetic nature. As the first Christmas after his return, approached, he refused to join in the mounting fever of cards, greetings etc (mild enough in those days) on the grounds that it was all artificial flummery. By Christmas Eve he could no longer hold out, and wished us all a ‘Happy Christmas’.
Ian Dick’s own research career had been interrupted at a critical time by the war. However, his intellectual curiosity was unblunted, and restlessly sought for answers, perceived opportunities. At a technical level, I remember that he saw that the elements of the powers of a matrix must obey a linear recursion with scalar coefficients, and so must have a solution linear in powers of scalars. This is of course effectively a derivation of the spectral representation of a matrix via the Cayley-Hamilton theorem, but Ian had worked it all out for himself from scratch – evidence of what he was capable.
I mentioned the existence of the Radio Development Lab workshop at Marjoribanks Street. About 1947-1948 I took advantage of a DC source there to do some silver plating. It turned out that I needed half a pound of potassium cyanide. There was great incredulity and suspicion on the part of the chemist when I asked for this, but surprisingly, after long argument and explanation, I was given it – which could never happen now. I made up my solution and the electroplating went quite well. I left the solution over Christmas clearly marked Caution! Potassium cyanide! but this had the opposite effect to that intended. When I came back after Christmas, Bob Unwin had tipped the lot down the lavatory without consultation. For once I was angry enough that Bob was somewhat contrite but, perhaps rightly, not so contrite that he would not have done the same again.
After completing my MSc in the November of 1948, I joined DSIR on a permanent basis since, although I would have to complete an overseas PhD, the timing of academic years in the two hemispheres meant that I would not leave for this before July of the following year, 1949. This was a fascinating time. Local interest was now extending beyond the agricultural and we began to develop a particular interest in time series analysis and stochastic processes. We followed the work of Maurice Bartlett and also that of the strong Scandinavian school – Arley, Jensen, Lundberg, Cramér, Wold, Karhunen. These works brought home to me the particular fascination of the combination of dynamic and probabilistic concepts. Scandinavia then seemed a good option. (There were also other factors. I had become interested in distance running and Sweden had magic names at that time: Gundar Hägg, Arne Anderson, Bertil Albertson. More generally, Scandinavia had a romantic strangeness for me. Less idealistically, I also wanted to get back to New Zealand as quickly as possible, and was impatient with the Cambridge requirement that one should complete Part III of the Tripos before being accepted as a research student.) After investigating possibilities both in the United Kingdom and in Sweden, I opted for Uppsala, with Herman Wold. In the six months

57
the town centre; a two-storied wooden building, lacking in mod cons but offering the most satisfying comfort. Dinner was a kind of unlimited offering of roast meat and vegetables, followed by an open and indefinite selection from a sideboard stacked with jellies, trifles, fruit salad.
One of my most vivid pictures from Massey College is also one of abundance: the pathology collection. This was housed in a large room, lined with spirit-filled jars seemingly preserving every variety of tumour, internal parasite and abnormality of every known species of farm animal.
Our principal interest at Ruakura concerned trials with the herd of identical twin heifers, mentioned earlier. The head of the station was Dr C P MacMeekan, rightly celebrated for his energy, forthrightness and vigour of expression. On the staff at that time was a Swedish-speaking Finn (‘Finländare’), John Hancock. I was interested in Scandinavia, and was fascinated to find him dark rather than fair – black hair and swarthy skin, with a strong jaw. Later, in 1949, when it turned out that I would be going to Sweden, he offered to teach me Swedish if I would spend the time up there helping him with statistics. I appreciated the offer, but wanted to spend my last months at home. Later still, when I was in Sweden, I read an article by an unnamed Finländare who had emigrated to New Zealand. It was bitter: ‘ett immigrantliv är ett förspillt liv’ (‘an immigrant life is a wasted life’). The writer found himself culturally and emotionally isolated. People in New Zealand do not realise – or did not then – that they are kindly and helpful in their way, but off-handed and not given to opening their hearts, or indeed to recognising that organ at all. Adaptable in practical matters themselves, they are unaccommodating to someone who cannot meet them rather more than half way.
I think that it was by my second summer spell at BS (1947-1948) that John Darwin appeared. A few years older than me, with studies interrupted by the war, he had just completed his New Zealand degree and was about to go overseas to study, firstly at Cambridge and then to complete a PhD at Manchester, with partial support from DSIR, under Ian’s recruitment scheme. John remains what he was then – boyish and modest, with a sardonic humour which is the only wicked thing about him; I think of him as the most decent and honourable person I have known. He is extremely intelligent, but motivated much more by the general good than his own good. In other words, idealistic rather than ambitious. His humour and mine could interact in a rally which could take off and surprise us both. Play often took a simpler form. I remember that later in Courtenay Place (and so in our 30s) we used to play the ‘sixpence game’. Somebody would be idly tossing a sixpence, someone else would make a grab for it, and in a moment there would be a wild scrum over and under tables, with tussles for the elusive sixpence, not helped by the fact that we were half-helpless with laughter. Several of us played, but I think that John and I found particular pleasure in rolling back the years in this way.
John has strong principles; I remember his reproving me for some coarseness
58
the bureaucracy, although how Norm could rile anybody I do not know. He was charming, unfailingly pleasant, considerate and humorous, and would always make do with what was to hand with happy ingenuity – dismissed by himself with typical unpretentiousness.
The reduction of wave statistics was a heavy computational task. I remember Norm producing the reduction he wanted (a two-dimensional probability density) by allowing the waves to rock a mirror, so making a light spot scan a photographic plate to produce the desired plot directly. When he later gave lectures these were always enlivened by amusing models of his own construction. Much of his oceanographic work was concerned with the location of distant storms by the analysis of the swell they produced. He was then concerned with arrays of detectors – arrays just of the type now central to radio-astronomy. The derivation of good design rules for both the arrays themselves and the associated processors is a task of real technical difficulty and sophistication, which has now generated a huge theory and practice. Typically, Norm had worked out a great deal for himself in those early days, and had his arrays happily working.
Norm adapted to the New Zealand style with ease, being indeed the supreme free spirit in his undemonstrative way. He lived at Eastbourne, and himself undertook the re-piling of his house, replacing the old wooden piles with concrete ones. That is a job both heavy and awkward, but he made light of it, painting a word-picture of himself crawling under the house, carrying the packing cement a mouthful at a time.
My other quite thorough time-series analysis was of fluctuations in the number of New Zealand rabbits – pests of the first order. This came about through the long and fruitful contact between AML and the Animal Ecology Section of DSIR under Dr Wodzicki – formerly Count Kazimirz and Polish Consul to New Zealand. The model was necessarily nonlinear (host-parasite interactions being a feature) which made analysis less clean, but the continuing challenge of such models all the stronger. The joint work with Animal Ecology was made a pleasure by the interest of the problems, the outstanding professional competence of the staff, and Dr Wodzicki’s own amiable and courtly charm. I remember that a young lady was late for an appointment with him. He soothed her apologies with the reassurance, “It is I who must apologise, for I have clearly chosen a time inconvenient for you”. This could be read ironically but was in fact delivered in a spirit of the utmost sincerity and consideration.
The time series work then led into the study and statistical analysis of spatial models, material published in 1954. I was puzzled, as was everybody at that stage, by the absence of a definite ‘direction of conditioning’. I still believe this is best resolved by study of the full spatio-temporal process. The data I used was taken from Fairfield Smith’s collection of uniformity trial data, which I used again later in the United Kingdom to show that, for these data, the spatial auto-correlation functions behaved as inverse powers of distance in their tail, and that an inverse first power occurred

59
that remained, I learned Swedish and spatial processes simultaneously by translating Bertil Matérn’s work on sampling surveys in forestry.
I indeed followed the time series path in Uppsala and completed my PhD in 1951. However, it was 1953 before I returned, to be met in Auckland by Ian Dick. By this time the Biometrics Section had become the Applied Mathematics Laboratory and was located in Courtenay Place, in first floor quarters just a little way along from the Adams Bruce shop.
Activity had developed considerably, and AML now had a wide range of contacts – eg geophysics, animal ecology, industry. The next six years were to prove deeply formative for me. Part of the necessity for the change in name was that the original statistical unit was now complemented by a group of mathematical physicists, of which more anon. Quality had been maintained, and the main change in character was that AML was now effectively active in mathematical models generally. The only split between the two groups was the professional one; in all other respects we were a single and remarkably amicable unit. One behavioural difference which did manifest itself was that none of the statisticians smoked and (at one stage at least) all of the mathematical physicists did. Even that caused no trouble – we were in different rooms, and the bogey of passive smoking had not yet raised itself.
I don’t know what the quarters had been before, but now they had been divided into offices by pinex partitioning. The cavity in the double pinex partitions provided ideal living and nesting space for the rats from which we never freed ourselves. Actually, the rats were more trouble in death than in life. A rat would return to the wall-space to die, and would then made itself known in a few days (or over a Christmas break, in one case), as Hamlet warned that Polonius would do. It then became a matter of urgency to divine the source and deal with it.
There were many projects on the go; I can speak with authority only of a couple of my own. For a while I continued with the time series work. One set of observations which proved fruitful, methodologically at least, and in any case interesting, was provided by some oceanographic data (from Island Bay rock channels). The analysis demonstrated the existence of two interpretable seiches, one much more dissipative than the other, and analysis of evidence of some nonlinear effects produced the first treatment of a threshold model. Shame to say this was also the most complete analysis I ever made. Time series analysts have a particularly low calculation/theorising ratio – perhaps more excusable in those days when computation of a single correlogram took the punched-card machine several days.
I believe that oceanography came under geophysics, administered by the Geophysics Division. In any case, it had a most impressive and likeable representative in the person of Norman Barber. Norman was English, had been involved in oceanographical work during the war, and had then come to New Zealand – I do not know the history. He was one of those maverick individuals who seem to rile

60
conservation in the Canterbury hill country – the statistical analysis of line transects. That is, one seeks to make inference on a two-dimensional field of random variables from a one-dimensional array of observations embedded in that field; early work on a topic whose importance is now well recognised.
Bob was very different from Ian. Ian was the eternal gadfly and rebel, whose very real sensitivity and culture were determinedly concealed behind a throwaway manner and an often exaggerated twang. In Bob these same qualities were quite evident, built into his nature and manner by a clerical family background and private schooling. He was a very good mathematician (although, again, the break in his studies meant that he certainly never reached his full potential) but also truly cultured in a much broader sense. He would quote poetry at length, aptly and with pleasure (Housman and Browning are the ones I principally remember). He had an affable, authoritative manner, and later ascended the administrative heights as the most natural thing in the world.
Bob had an experience similar to (but different from) John Darwin’s, in that he had a Christmas crisis of conscience with a reasonably graceful resolution. It had become the custom for the staff to take the afternoon of Christmas Eve as a holiday, although in fact it was not one officially. Bob saw this as improper and decreed that those following the practice would be regarded as having taken a half-day of their annual leave entitlement. There was no overt protest, but everybody took the half-day – the custom was so strongly established that family arrangements had been built around it, and the official allowance was even then felt as somewhat Scrooge-like. After Christmas, Bob realised the human tide that was running, and relented.
Bob was far from parsimonious, but he did see various opportunities for economy. One was when we all acquired blackboards by the simple application of blackboard paint (one tin did the lot) to our pinex partitions. That worked reasonably well. A less happy instance was the bulk purchase by our typist, Eleanor Burns, of cheap green tea from a Chinese supplier, replacing the familiar grocer’s Indian blend we used at our tea-breaks. Eleanor saw this as an advance in refinement with the bonus of economy. We all thought the change fairly ghastly, but the Earth had come off its axis as far as Stan Roberts was concerned. First he boycotted the tea breaks, and then he tipped what remained of the offending leaf into the rubbish.
The unofficial side of life in the Lab was very pleasant. On special occasions, such as the run-up to Christmas, there would be a party in the Lab with families invited. My most distinctive memory is of the saveloys being boiled in the coffee urn – a full urn means a lot of luscious saveloys. Then we often had evenings at people’s houses, and these were often musical, with singing and recorder playing. Stan organised a madrigal group at the Lab, which practiced assiduously in the lunch-break. The participants at least enjoyed it greatly, although I remember once dropping a cup when Mary Chung suddenly burst into song.

61
definitely and dominantly. This latter was explained by a spatio-temporal model. There it was left; the theme of self-similar processes foreshadowed by Kolmogorov had not yet been picked up, and fractals were as yet unthought of.
Mention of time series analysis brings to mind the computational aids we had at the time – the time before electronic computers, either mainframe or desk, had come into wide use. We now had an upgraded Powers-Samas punched-card installation. However, as I said, this still required several days to produce an auto-correlogram, for instance, demanding many passes by the patient and skilled Errol Jones. Then a couple of remarkable pieces of equipment came Errol’s way. One was Hartree’s original differential analyser. This was a mechanical analogue machine which produced solutions, in graphical form, of systems of differential equations – limited in order and dimension, but with the possibility of building in nonlinearities. We had the prototype, made entirely of Meccano, with the exception of six purpose-built rolling-ball integrators. The semi-dismantled analyser looked indeed like what it was: the hybrid of a giant Meccano set and some special-purpose components, requiring patient insight to bring it to life. Errol assembled it all on a metal-faced board and indeed resurrected it.
The other monster was a device for the frequency analysis of time series which had been developed, built and used by the Royal Navy during the war, and looked it – built of solid castings and painted a Navy grey. It consisted of a substantial flywheel, some three feet in diameter, which could be spun up to a high speed by an electric motor, and was then allowed to run down over 20 minutes or so under natural dissipative forces. The series to be analysed was represented by a trace of variable width drawn on a strip made to fit around the circumference of the flywheel. A photo-electric cell scanned the rotating strip; its output drove a narrow-pass filter from which one then derived an estimate of the power of the signal in the corresponding frequency band. This band shifted as the wheel slowed down; a continuous reading of the output then gave a reasonable estimate of the power spectrum of the trace over frequencies.
An analysis then had almost the drama of a bouncing bomb: the spun-up wheel ominous in its stored energy, deliberate in its decline, and then yielding an output to be anxiously examined much as one would examine photographs of a raid. I remember putting the classic lynx/snowshoe-hare data on the machine and finding a very sharp spectral peak – evidence of the nonlinear predator/prey interaction.
The Directorship of AML had now been taken over by Bob Williams, Ian Dick having been appointed Assistant Director-General of the DSIR and administrator of the Dominion Physical Laboratory at Gracefield. Bob’s studies had also been interrupted by the war when he had been one of the British scientists working at the Manhattan Project. After the war he completed his PhD at Cambridge, with Frank Anscombe, developing experimental designs for serially correlated observations. Later, back in New Zealand, he worked on an interesting problem suggested by work on soil

62
mathematics (principally non-linear partial differential equations and associated maximum principles), also for his radical extensions of the theory of subsidence (of ground under load).
As with the AML in general, the group was a cheerful one, with plenty of horseplay. Much of this centred around Rob Wooding who usually fell into the role of the innocent, although enjoying the fun as well as anybody. Rob was a keen diver; he had made his own spear gun, with projection based upon a car inner tube. Bob Williams cautiously tested this in the Lab. Not cautiously enough; the spear easily penetrated the double partition of the office wall to emerge by the differential analyser. Luckily, no-one was analysing.
Several of us travelled down to Dunedin in 1957 to attend a meeting of the NZAAA. About four of us shared a room in a boarding house. Rob was to come in late one evening, and I remember putting blocks under the foot of his bed, to see whether he would be perplexed by the rotation of his environment. The joke was on me; Rob slept through the night unperturbed.
I was not, myself, involved in day to day consultation with other groups in DSIR as much as some of the others were. However, what contacts I had were personally rewarding for me in the highest degree, in the sense both of being pleasant and of furnishing me with a set of fundamental statistical/physical problems which left me with a challenge for life (see my 1994 account, Chapter 2).
Within Geophysics there was an oceanographic group (with which I think Rob Wooding had earlier been associated). From this I got the seiche data whose analysis turned out to be so interesting; also the contact with Norm Barber and his detector arrays. I was impressed at the time, and am still more so in retrospect, by the fundamental nature of the technical challenges thrown up in this applied work – challenges which still preoccupy world science. The detector arrays are a case in point. Frank Evison, later Head of Geophysics, brought what he thought would be a simple matter: the evaluation of the effective mechanical properties of rock with randomly varying structure. The rock in question lay beneath one of New Zealand’s many hydro-electric dams, was volcanic and flecked throughout with inclusions of weaker material. The problem was, then, one in the bulk properties of random media; one still not solved at a fundamental level despite the real advances which have been made since that time.
Frank was also exercised by the well-recognised fact that the continents of the earth are almost entirely antipodal to ocean, and asked how likely this would be on a random distribution of landmass. As with most such questions, there is no simple exact solution, but one can obtain an estimate. Hamish Thompson’s investigation of the agglutination reaction for viruses and antibodies awoke my interest permanently in the statistical theory of polymerisation. A problem of sap flow in trees subject to attack by boring insects provided an early example of a percolation problem. I looked

63
Every now and again five or six of us would go to the pub after work. This was still the time of the famous ‘6 o’clock rush’, so drinking was more purposeful than in an English pub, and beer came by the jug rather than by the glass. However, we were not purposeful drinkers, and it was all very companionable and jolly.
The Courtenay Place location was convenient neither to other branches of DSIR or to VUC, but it had its advantages. In summer we could take a lunchtime swim in Oriental Bay. Those who wished could pick up a case of fruit from the market, where fruit and vegetables were auctioned.
By Bob’s time AML boasted a secretary. One of these was Mrs Domb, sardonic but efficient. Mr Domb was an enthusiastic drummer in one of the local pipe-bands, his evident relish in full-dress performance made more memorable by the fact that he was also very evidently Jewish. One was reminded of the line from the song: “Py Yiminy, I’m the only Swede in MacNamara’s band”.
There is yet one more Christmas memory, inconsequential but vivid. The men’s lavatory was a cubicle (part of the literal rat-run) at first floor level inside a narrow well in the building. It was reached by a gangway the door to which was always kept locked out of hours. I once called in quickly over the Christmas holiday to pick up something and, noticing that the door was unlocked, virtuously but thoughtlessly locked it and left. In fact, Alec MacNabb was out there and, although equable in temperament and a champion gymnast, he must have been dismayed by the Christmas he now faced. Luckily, someone else called in half an hour later and was bold enough to investigate the knockings and hallooings.
We saw something of Ian from time to time. He would call in and sit down, and we would find ourselves standing in a ring around him while he gleefully recounted his skirmishes with, and scorings off, various establishment figures. Gravitas was a quality which Ian never cultivated, and the practice was an injudicious one; I would see doubt creeping into Bob’s face. Bob and I agreed on a characterisation of Ian as ‘either a rebel or a king-maker; but never a king’. However, Ian showed his mettle later in retirement when, having lost his beloved wife and suffering both the transient and the permanent effects of radical surgery, he bounced back to learn Chinese cooking, to make his own clothes and to become the very active president of the society formed by his fellow-sufferers.
As I have said, AML consisted of the statisticians of the former Biometrics Section plus a group of mathematical physicists. The two sub-groups remained fairly distinct professionally, but merged totally at the personal level. The mathematical physicists included at various times Ewan Drummond, Alec McNabb and Rob Wooding. The group was set up primarily to investigate the various problems thrown up by the Wairakei geothermal power scheme; principally, the understanding of the passage of hot steam through the porous medium of the ground. Alec MacNabb won an international reputation for his study of these matters and the underlying
64
evenings and the saveloy boil-ups were the practical manifestations. Stan Roberts built his own house at Tawa Flat over a demanding year. The crucial moment, demanding concentrated teamwork, was the casting of the concrete foundations. Stan had the boxing all prepared and one Saturday found the major part of the AML staff pushing full barrows up flexing gangplanks, while Stan watched anxiously for a similar flexure in his boxing. It was a hard day’s work with a good outcome, as I recall.
One afternoon my wife, Käthe, phoned the Lab to say that the gorse on the section next to our home (at Houghton Bay) was on fire and was threatening the house. Stan took the message and, after passing it on to me, set off for Houghton Bay on his bicycle. In this extreme situation I took a taxi, passing Stan on the way. All went well in the end – by the time Stan arrived the fire brigade had gained control, and the house had suffered no more than some blistered paint. A bad half-hour, but also reassuring.
I left New Zealand in 1959 to go to Cambridge; the Lab gave Käthe and me a grand send-off. Over time, contact became intermittent. AML was metamorphosed until it now survives in no recognisable form, and my colleagues from the AML years have all retired in various ways. However, my subsequent interests and career were largely shaped by those years. More than that, I value the warmth of that time ever more, as I believe do all who knew it.

65
a little at earthquake statistics and models, something to which David Vere-Jones has since brought a much more serious and sustained attack.
AML of course provided a consultation service greatly more intensive and extensive than I have indicated. This developed from what was originally a statistical consultation service to one in mathematical modelling generally, and served not only other units of DSIR, but other Government departments and New Zealand industry generally. There were field officers placed at the Grasslands Division at Palmerston North, the Plant Diseases Division at Auckland and the Crop Research Division at Christrchurch. I particularly remember Arch Glenday. During the war he had served in Britain, seconded to the RAF from the RNZAF. He might have continued in service life had he not developed pulmonary tuberculosis in the United Kingdom, an affliction which allowed him some years of productive life in New Zealand but ultimately led to his early death. These experiences, past and latent, were somehow evident in the quiet grit of his character. I remember his speaking of his wartime RAF colleagues. These were the ‘Brylcreem boys’, newly out of public school to a large extent. Arch initially found it hard to strike any common chord with them, but then came to know them better. “Those chaps”, he said, “would never let you down – they would have suffered torture, and still not let you down”.
One of the very successful industrial contacts (which I observed only at a remove) was with Crown Lynn potteries in Auckland. There were two factors in this success which impressed me deeply, and which made it a model of successful specialist/industrial co-operation for me. One was that the co-operation was a long-term one, maintained over years, with a stable nucleus of people on each side. However, such a mutually beneficial and lasting relationship was made possible only by the presence of a key individual in Crown Lynn – Ken Seal, an industrial chemist from the United Kingdom. Ken was the perfect example of the link-man, the essential matching gear in the train, who is so often missing in such enterprises. He was not just a passive link, but was brimming over with ideas and enthusiasm. He had the broad technical expertise which enabled him to bridge the two sides in a way that either a managerial type or a specialist on one side or the other, could never have done. Yet more, he was quite unselfish – he was driven, not by ambition or the quest for expansion, but by simple delight in the solving of real-life problems. Such people are the true catalysts in an organisation; they should be given esteem, time and a free hand.
AML continued the practice from which I had gained so much: of taking on bright mathematical undergraduates for summer work. This was, of course, with recruitment and beneficial liaison more in mind than anything else, but good work was done and a constructive nudge given to the careers even of those who ultimately went elsewhere. From my time in the 1950s, I remember particularly Roy Kerr, John Elder, Volker Heine, David Vere-Jones, Ross Leadbetter and John Butcher.
AML showed considerable social solidarity. Just as memorable as the musical

66
67
Computing at AMD: 1949–1965Garry Dickinson (AMD)
Punched-Card Computing: 1949-1960The work in the early days started off as the analysis of agricultural experiments and then diversified into mathematical physics and operations research. The growing workload led to a decision to get punch card machines. These were not cheap but Ian Dick found out that the Department of Statistics who had been using Powers-Samas machines since 1921, had managed to persuade their Minister, Walter Nash (who was also Minister of Finance), to buy them new ones. Ian asked the then Government Statistician, Jim Butcher, if Applied Mathematics could be given the old ones, but Mr Butcher said he would get into tremendous trouble if Walter Nash found out, even though the Department of Statistics planned to take the old machines to the tip. Ian suggested that scavenging at the tip would be in order but in the end commonsense prevailed and a more direct hand-over was arranged. (The mention of Walter Nash as Minister of Finance dates this story to some time before the general election and subsequent change of Government at the end of 1949.)
The second-hand Powers-Samas machines were replaced two years later by new ones – card punches, sorters and tabulators. Like their predecessors, they used 80 column cards with round holds and the tabulators were programmed by changing connections in a rectangular plug board. They were used for analysing large scale experiments, such as the Appleby fertiliser trials (see Chapter 4, The Appleby Experiments), and in many of the other pieces of work done by Applied Mathematics staff. The great variety of topics handled is shown in the publication list (178 papers up to 1963) and the 1957 report by Bob Williams reproduced in the Publications and Personal Recollections volume, and many of these would have had a computational component.
An interesting sideline in the late 1940s and later, was the acquisition of a mechanical differential analyser built from Meccano parts. This analogue computer had come from Cambridge and was refurbished and set up at Applied Mathematics to solve ordinary differential equations up to order five. Programming was by screwdriver and spanner, and Robin Wooding describes how it was used in a study of predator-prey dynamics in a rabbit population. Errol Jones mentions another application on the setting up of the salt evaporation plant at Lake Grassmere, but Ian Dick sees the differential analyser as being not much more than an interesting gimmick.
Early electronic computing: 1961–1965By the end of the 1950s the computing needs of the Government Sector as a whole,

68
reader. The internal operations were in decimal form, not binary, with the processing registers holding data in banks of condensers, each of which could be set and held to one of ten levels of charge.
One machine code instruction could be loaded into each word of storage, two digits for the operation being performed, four for the address of the data being operated on, and the last four for the address of the next instruction. To make efficient use of the machine it was necessary to arrange the spacing of the instruction locations around the drum so that the waiting period for the next instruction to come under the read heads was minimised. Most programming was done in an optimising symbolic assembler though a good deal of debugging and patching was done directly in machine code. There was a very early Fortan compiler but it compiled so slowly that it was seldom used.
The IBM 650 was physically large and drew about 100 kW of power. There was a diesel motor and electric battery back-ups of the air-conditioning plant, as an unprotected shut-down from a power failure would have been disastrous. Long runs of eight to ten hours, especially on engineering tasks for the Ministry of Works, were not unknown, and it was essential to have restart points built into the programmes in case of hardware or power supply failure.
The location of the IBM 650 at Treasury in Stout Street, meant that the computing staff (about five in all) were physically separated from the rest of the Wellington Applied Mathematics staff, who were in Courtenay Place. This was unavoidable, but it was an extra handicap in providing an efficient service, and mechanical calculators were still important. What sticks in my mind, as one of the computing team, was the extreme slowness with which any project was completed. In many cases a decision had eventually to be made to terminate the work with the results obtained, even though there may well have been further analyses which could have yielded useful results.
It became obvious by 1963 that the pent-up demand for scientific computing was beyond the capacity of the IBM 650 and its later supplement, an IBM 1401. Treasury had come to a similar conclusion about the accounting workload, and after a good deal of investigation and discussion, the purchase of a separate computer for Applied Mathematics was agreed. The resulting ELLIOTT 503 was installed on the Victoria University site in mid 1965, and with its commissioning, scientific computing moved out of its introductory phase.

69
had outgrown the punch-card machines then in use in such Departments as Treasury and Social Security. In 1960 an IBM 650 digital computer was installed in Treasury primarily for accounting work. DSIR, through Applied Mathematics, was allowed to use it for scientific computing, having been allocated 30% of the time; but Treasury had first call on it. In this work Applied Mathematics acted as coordinator for other Departments, Agriculture and Works among them, who needed access. In the History Day transcript (NZSA, 1987), Jean Heywood notes that the first scientific job on the IBM 650 was an analysis of a factorial design run by Neil Mountier of the Department of Agriculture, on Christmas Eve, 1960.
The IBM 650 is generally recognised as having been the world’s first commercially successful computer and it was in widespread use by 1960. Its main memory was 2,000 words, each of ten decimal digits, and these were located on a magnetic drum running at 12,500 revolutions per minute. There were also 60 words of core storage used both as indexing registers and as the pathway to five magnetic tape decks. There was a card reader/punch and an accounting machine rigged up as a printer and auxiliary card

70
maintenance of the proposed computer installation could well be undertaken by the same Technical Officers. As a result of this decision, I, as senior Technical Officer of the Observatory, was asked whether I would be prepared to take on the added responsibility of the computer engineering and maintenance aspects of the AMD’s ELLIOTT 503 installation, as well as continuing as Officer-in-Charge of the New Zealand Time Service. I agreed to this proposal, but made it quite clear that I would require thorough training in the new discipline of Computer Engineering. I was told that this was acceptable by the Department and it was also insisted upon by the local suppliers, as well as by ELLIOTT Automation, who would not supply the computer unless it was to be supported by an ELLIOTT-trained, owner staff, team of engineers. As it turned out the ‘team’ initially consisted of just one person, me.
The ELLIOTT 503 was a second generation computer described as a small, high speed, digital computer designed primarily for simplicity of operation and programming in a wide range of languages, combined with high reliability. Owing to the wide range of peripheral equipment available, it could be used equally successfully for scientific, commercial, or process control applications. The logical design included arrangements for time-sharing between the computing function and a wide range of peripheral devices using sophisticated interrupt facilities.
The ELLIOTT 503 central processor consisted of three adjacent cabinets, each two metres high, containing the power supplies, the logic, and the 8192 (8k), 39 bit word main store. Each word could contain either a pair of instructions or an operand (more than one operand, if packed). An additional cabinet contained the slower, 16384 (16k) backing store. Instructions were of the single address type and were obeyed in sequential order, except when preceded by a ‘jump’ instruction. Each instruction consisted of six function digits with the more significant of the instruction pairs (left most) being obeyed by the less significant (right most). If up, the B digit (digit 20), called the B-line, was used to signify that the right instruction, before being obeyed, was to be modified by the addition of the 19 least significant digits of the left instruction.
The operation of the computer was controlled by 13 registers, each of which had a different function and was individually programmable. The instruction code consisted of 64 functions in eight functional groups, each consisting of eight instructions. Operands could be represented in either fixed-point or floating-point format, and parity checking was carried out on the result of every operation.
Although available at the time of purchase, financial constraints precluded the initial installation from containing magnetic tape drives. Later, when there was operational necessity and finance became available, magnetic tape drives were added to the configuration. Unfortunately, by the time the decision to add the magnetic tapes to the system was made, the ELLIOTT 503 assembly line had closed and it became necessary for the engineering support staff of AMD to design and build a

71
Computing at AMD, 1965-1982: the ELLIOTT 503Brian Gibson (AMD)
In the early days of scientific computing in New Zealand Government Departments, circa 1960, the IBM 650 of the Treasury was the major resource and, as a consequence, was in high demand by all those departments and agencies which had a requirement for large scale computing facilities. One such department was the Department of Scientific and Industrial Research (DSIR), which then had responsibility for the provision of scientific services within its own Divisions, and also for other Government Departments. It very quickly became apparent that the Treasury machine had become overloaded, much of the DSIR’s work having to be run in the midnight shift.
The DSIR had also inherited an additional, very heavy, ongoing work load as the direct result of New Zealand’s involvement in the International Geophysical Year (1957-1958) and its subsequent contribution. Two of the disciplines, as diverse as Seismology and Astronomical Research, were centred at the Seismological Observatory of the Geophysics Division, which had no computing capacity of its own and had to rely on the skills and facilities of the DSIR’s Applied Mathematics Division, and computing staff from the Department of Lands and Survey. As a direct result of this major increase in requirement for computing capacity within government, the decision was made to send two officials, one each from DSIR and the Treasury, overseas to assess the best available computer mainframes to provide the services required by those Departments and their dependents. The resulting decision was in favour of an IBM 360/40 for Treasury and an ELLIOTT 503 for the DSIR.
There was, however, one problem with the choice of the ELLIOTT 503 and that was that the New Zealand agents for the machine were Cory-Wright and Salmon, an engineering equipment supplier, which had no computer expertise with which to provide support for the proposed installation, and the nearest other ELLIOTT 503 installation in the Southern Hemisphere was about to be located at the University of Tasmania in Hobart, Australia.
This left the question of the provision of the engineering maintenance to be resolved before a final decision to purchase could be made. The Director-General of the DSIR, at the time, was well aware that the Seismology Observatory at Kelburn had skilled electrical engineering staff who were involved in the development and maintenance of complex electronic equipment, and as the Observatory was only a matter of minutes walking time away from the University it was decided that the
72
logic cabinet and adapt NCR magnetic drives to provide this most additional facility. It also became necessary for the systems support programmers to write new control and interface codes to enable the attachment of these ‘foreign’ devices to the system.
The installation of the ELLIOTT 503 in the new home of the Division, alongside the University’s Mathematics Department on the seventh floor of the new Rankine-Brown Building at Victoria University, was in itself an interesting exercise. The logic cabinets were too tall to fit in the lift. So it became necessary to build a platform on top of the lift and have a lift engineer manually control the operation of moving all of the computer hardware up to the seventh floor, where it was installed in a rigidly controlled, air-conditioned environment.
There was, however, an initial problem with the method of inputting both programs and data into the computer, which was by means of one inch wide, eight-bit character paper tape. The two tape input readers were capable of reading the tapes at the fast rate of 1,000 characters per second. Output from the computer, other than via the line printer, was by means of two 100 character per second, tape punches. This method of input/output, although quite fast and efficient, was foreign to most of the users who had been working in an 80-column card environment for about 20 or more years. The main problem with using paper tape lay in the editing and correcting of both programmes and data, at which stage it was necessary to cut the tape with a pair of scissors and replace the correction with a snippet of aluminium foil which was sealed in place with a small heating iron.
The ELLIOTT 503 gave good and effective service for a long period of time but was eventually replaced when newer and easier-to-use technology came along. The purchase price of the initial installation was £250,000 ($500,000), and was eventually sold, in 1982, for $111 to an amateur radio enthusiast, who wanted it for the thousands of transistors it contained.

73
chapter 2
Some New Zealand StatisticiansAlexander Craig Aitken (1895–1967)P C Fenton, Senior Lecturer, Otago University
Alexander Craig Aitken was born 100 years ago, on 1 April 1895, in Dunedin, New Zealand. His work in actuarial mathematics and statistics has been widely influential and he made important contributions to linear algebra. E T Whittaker’s comment that Aitken was the best algebraist since Cayley, has undertones of British insularity, but conveys the sense of Aitken’s eminence. A conference marking the centenary of Aitken’s birth and representing the main themes of his work was held at his alma mater, the University of Otago, in Dunedin, from 28 August to 1 September 1995.
Setting aside a period of service in the Middle East and France during the Great War, Aitken spent his first 28 years in Dunedin. All the main threads of his life have their origins there, though it would be an affront, both to Aitken and to those of us currently traversing the undulations of middle and later age, to neglect subsequent influences, some of which are critical to an understanding of him. Nevertheless, in the late 1950s, Aitken wrote:
Just as the first part of my academic career, up to my arrival in Edinburgh, was quite chaotic and unorthodox, so the second half has been conventional and could be easily reconstructed by anyone with the indications in Who’s Who.
The tone is, as usual, self-deprecatory but also reflects a certain weariness that periodically took possession of him.
Aitken was the eldest of seven children of William Aitken, a grocer, and his wife, the former Elizabeth Towers. William had been born of intelligent, rural, Scots parents at Maungatua, a small settlement 20 miles from Dunedin. Elizabeth had arrived in New Zealand at the age of seven, from Wolverhampton, though her parents too were Scots. The Aitken household was materially poor but not deprived. William’s gentle simplicity and indifference to worldly attainment was absorbed by the children and is the source of the same qualities so often remarked upon in Aitken.
Aitken’s memory and calculative power, both of which are legendary (he could recite the first 1,000 decimal places of π and was considered the most impressive mental calculator for whom reliable records exist) were present early, and his first years at school were remarkable, without necessarily suggesting the extent of his later achievement. He “took off ”, as he put it, in middle adolescence, under the

74
Students’ Association and became one of the most effective presidents, bringing order to the Association’s slapdash procedures and straightening out a financial mess that threatened scandal. In his final examinations Aitken and other colonial mathematics students were undone by a paper of impossible difficulty, set from the splendid isolation of ‘Home’. He graduated with first class honours in languages but only a second in mathematics. Bitterly disappointed, he abandoned the idea of a career in mathematics and took a job teaching, mainly languages and geography, at his old high school.
Aitken was married in 1920 to Winifred Betts, a brilliant student of botany, who became the first female lecturer at the University of Otago. When R J T Bell, Richards’ successor to the chair of Mathematics, required an assistant, he called on Aitken; and with Bell’s encouragement, Aitken’s mathematical ambitions revived. He applied for, and was awarded, a University of New Zealand scholarship to study under E T Whittaker, at Edinburgh. Aitken left New Zealand in July 1923, Winifred joining him at the conclusion of the academic year.
Aitken’s thesis, on the graduation of observational data, was completed in 1925, but at great personal cost. He suffered a severe breakdown in 1927 that permanently altered his outlook, though not entirely for ill. He wrote:
Since that time, there is not a tree, not a turn in the road, not a hill top, not even a swaying reed, but speaks of the beauty; the terrible beauty and mystery of the world.
Aitken was appointed to the staff at Edinburgh, as Lecturer in Actuarial Mathematics, in 1925; was promoted to Reader, following his FRS in 1936; and was invited to take up the chair of Pure Mathematics – “my real line”, as he put it – on Whittaker’s retirement in 1948.
To an unusual extent, Aitken was able to incorporate his extraordinary abilities into a view of humanity that gives primacy to pure being. Despite recurrent illness, his simplicity and natural grace were refined by age. He died on 3 November 1967.
Note: Aitken supervised the PhD theses of five New Zealand students: J T Campbell (1906-1994, see below); F M Harding (1910-1977, see Chapter 6); H Silverstone (1915-1974, see below); A A Rayner (1917-1994); and E R Dalziel.
75
influence of his mathematics master at Otago Boys’ High School – the extraordinary W J Martyn. He began to exercise his calculative ability and to build up an immense arithmetic landscape. One has the sense that in many calculations Aitken was able to avoid large computational steps by drawing on memory, with the same kind of intuitive certainty with which a navigator might draw on subconscious representations of known topographical features to determine a course. A much-quoted example illustrates the point. Aitken was asked by his children to multiply 123,456,789 by 987,654,321.
I saw in a flash that 987,654,321 by 81 equals 80,000,000,001; and so I multiplied 123,456,789 by this, a simple matter, and divided the answer by 81. Answer: 121,932,631,112,635,269. The whole thing could hardly have taken more than half a minute.
His memory developed in other directions; as a boy he knew the Aeneid by heart. During school holidays Aitken stayed with his grandparents on their farm on the Otago Peninsula, an area that abuts the outer suburbs of Dunedin while keeping its own, quite separate identity. Out of his wanderings over the Peninsula developed his profound love of the natural world, one of the romantic elements that, in combination with certain classical tendencies – mathematics of course, athletics and music, and classical art and literature – produced the vibrancy of the mature Aitken. Music was central to his life. Eric Fenby, Delius’s amanuensis, who described Aitken as the most accomplished amateur musician he had known, wrote to him:
At our first meeting it was evident to me that I had not met a man like you before, and it has been my privilege to know several men of most outstanding power, but not one of their several occupations called for the sustained effort of brain and memory imperative in yours … I thank God that you have your Bach. No composer could possibly appeal to and satisfy your whole complicated nature as he.
Aitken entered the University of Otago in 1913, enrolled in mathematics, French, and Latin. The effect of the Mathematics Department, in the person of Professor D J Richards (a “temperamental, eccentric Welshman, who seemed to lack the power to communicate his knowledge to his students”) was to turn Aitken’s interests, hitherto balanced between mathematics and languages, distinctly towards the latter. With the war in Europe, Aitken volunteered on his twentieth birthday, in time to participate in the latter stages of the Gallipoli debacle. He was commissioned in the field in northern France, and was wounded in one of the countless raids that filled gaps between bombardments and helped to make up the Battle of the Somme. Invalided home in 1917, he passed a year of recuperative inactivity in Dunedin during which he wrote a draft of the memoir, published later as Gallipoli to the Somme (1967). For this work he was elected a fellow of the Royal Society of Literature.
Aitken resumed his studies in 1918. In 1919 he was elected President of the
76
Government Statisticians were viewed as just officials in Government who didn’t get mentioned at all in association with official statistics.
Steve Kuzmicich (Government Statistician, 1984-1991) described George Wood as a “very bright man with an enquiring mind, but very shy”. He would never look anyone in the eye and walked with his eyes cast down, whether you saw him on the street or at work. He liked to have a drink of beer after work despite 6 o’clock closing time and was well known among the Watersiders a group of ‘regulars’ he drank with down at the Old Western Hotel on Lambton Quay. Steve considered George to be a very good economist, rather than a statistician, a comment that has been made by more than one person, including George himself.
John Baker, George’s successor as Government Statistician, and Deputy during the 1950s when George was Government Statistician, described him as having “tremendous experience, and a good statistician because he had the economics side”.
George never extended his mathematical education beyond secondary school. He thought that not having a well developed mathematical background was a hindrance for a Government Statistician, as he commented in a letter to Lawrence Nielsen (Deputy Statistician, 1975-1978) in 1971 before he died.
At my age, I’m now in the 70s, old codgers like me usually speculate on how different things would have been — if only … I have no such regrets. I would be a Statistician all over again — a most rewarding career. The only thing I would change is that I would do more maths. My maths, though not contemptible was never quite adequate to meet all the demands of the job. This puts you too much in the hands of the Mathematical Statisticians — a quite crazy crew. They invariably assume that because they can get from A to B so much more elegantly than you can, they are ex-hypothesis more qualified than you are to set the premises. And they are so often hopelessly naïve in their starting assumptions. You have to watch the B’s like a hawk, or they will land you in trouble.
A career in statisticsOne of Wood’s first major works after coming to the Department was on price statistics. Before World War I retail prices were collected only for food, fuel and lighting. As prices rose during the war, the Arbitration Court needed wider information on prices and he started to assemble it. The result was the All Groups Price Index. As George himself put it, “if you are concerned with inflationary trends, it is mere commonsense to get someone to sit down and work out how much prices have gone up or down”. He also developed statistics on industrial disputes and accidents.
By the 1930s George had gone “up a bit in the world” (as he put it) and achieved the impressive title of Chief Compiler. He edited the Year Book and other publications the Department was producing.
In 1938 he was seconded to the British Colonial Service and went to Palestine as Government Statistician. He served there until the end of 1945 and his work is

77
Sir George Ernest Francis Wood (1900–1978) Government Statistician (1946–1958)Kristeene Parkes, Statistics New Zealand
BackgroundSir George Wood was born in Greymouth on 6 July 1900, the son of George Francis Wood and the former Eileen Alice Oudaille. The family moved to Wellington when George was quite small. After leaving school George had his heart set on becoming an engineer. With strong academic grades in mathematics, economics and applied statistics, he was accepted to study engineering at the University of Otago, but owing to the family’s financial position, they could not afford to send him away to study. He subsequently enrolled at Victoria University College and completed a Master of Arts with honors in economics; graduating in 1921.
George joined the Census and Statistics Department in 1921 shortly after graduation. With the exception of a brief stint as Government Statistician in Palestine during the war (1938-1945), he remained with the Department until his retirement 37 years later. While in Palestine, he established the Statistics Organisation of the New State of Palestine, and upon his return to New Zealand in 1946, became Government Statistician of the Census and Statistics Department.
Appointment as Government StatisticianGeorge’s appointment as Government Statistician was not without controversy. The appointment was apparently resented by the Deputy Statistician, D J Cruickshank, to the extent that they avoided talking to each other. John Baker, the then Manager of the Research Unit, acted as a mediator to keep the peace between the two. The feud was well known throughout the Department, and some staff split into either Wood supporters or Cruickshank supporters, until Cruckshank retired.
As time went on, the hostility surrounding George Wood’s appointment as Government Statistician abated as he made a lot of friends both within the Department and outside. He was described by J P Lewin (Government Statistician, 1969-1973) as the “greatest Government Statistician New Zealand ever had and a great man. Small in inches but big in stature, he was well respected and had a lot of friends”.
George never stopped being “a Government Statistician”, even in the social environment. Through various social contacts, he raised the profile of the Department to the outside world and was the first Government Statistician to have a public profile recognised outside of board meetings and statistical conferences. Prior to that,
78
means to complete a more comprehensive investigation. The advent of exchange control in 1938 would have made it possible to publish a more accurate balance of payment estimates but, owing to financial constraints caused by the war, the Department was forced to cease preparing balance of payment statistics. It wasn’t until 1950, after a 22-year break, that the Department began producing balance of payment statistics again. These statistics were produced based on the principles adopted by the International Monetary Fund, with suitable modifications made to make them relevant to the New Zealand economy in conformity with the methods used in most overseas countries. George considered balance of payment statistics to be a form of national bookkeeping to give the Government and the community the same sort of analysis of the country’s affairs as a person would get from running their own business.
George had big plans for balance of payment statistics. He loved detail and wanted to produce a publication that described the methodology of the statistics and gave definitions and the composition of each item that appeared in the tables. In 1953 he got to include all this as well as a glossary to the main items, as the Government saw the value in the statistics and increased the Department’s budget to achieve this. In 1956 a new feature was added to balance of payments statistics, in dealing with the direction of New Zealand trade, by including statistics on the distribution of exports and imports by monetary percentage of all imports and exports.
As well as reinstating the balance of payment statistics, George Wood also instigated the Consumer’s Price Index (CPI) as we know it today. He was internationally recognised for producing consumer price statistics in a timely fashion. The Government required a mechanism for interpreting and monitoring consumer spending in order to manage New Zealand’s system of centralised wage bargaining and to adjust welfare payments to account for increases in the Cost of Living. George came up with the Consumer’s Price Index, and his focus was on releasing the figures as quickly as possible — generally within 10 days from the end of the quarter, compared to the four to five weeks which prevailed in most countries.
The 1950s also saw the introduction of sampling methods in line with recommendations developed by United Nations Sponsored Committees of Statistical Experts. New Zealand had a problem with its small population, as sampling among small populations created particular problems in managing volatility.
George’s reign at the Department of Statistics was during the non-electronic era. Except for a few Powers-Samas tabulating machines introduced in the 1930s, most of the calculations were done by hand. The Department tried to get a computer in 1950 but was judged as not needing one, and Treasury was granted the only one available in Wellington at the time. The population censuses were processed using the Power-Samas equipment up to 1961.
In the 1950s the Department started population forecasting and set forward

79
credited with contributing to its comparative economic stability. His trip to Palestine must have had a lasting impression on him as a person. While dining out at an international statistical conference in London, he used rough bits of paper to scribble on, which he was well known for. Once he had finished he’d throw them over his shoulder and by the end of the evening the table and the floor would be covered in bits of paper. When asked why he did not use the waste paper basket, George’s reply was “If I had put all the rubbish into the wastepaper basket in Palestine, some poor bloke wouldn’t have had a job”.
The political climate in which George workedBy 1933, under George Forbes of the United Coalition Party, New Zealand was credited with one of the largest per capita national debts in the world. Half of this was domiciled abroad. By 1931-1932, 26% of the country’s total exports was required merely to pay the interest, which in 1933 amounted to 40% of total Government expenditure. This dependence on foreign debt to finance investment and its exposure to international commodity prices made the economy especially vulnerable to the worldwide depression of the 1930s.
Following the election of the Labour Government in 1935, a combination of expanded Government spending, and a gradual pick up in world economies, lead to an improvement in New Zealand’s economic performance. From 1939 to 1945, war time requirements reinforced more centralised economic controls, which persisted during the post war period in response to the need to re-integrate returning servicemen into a civilian economy.
In the immediate post war year, national income dropped from £150 million to £90 million, the value of exports fell 40% in two years and there were nearly 80,000 registered unemployed (this figure did not include women or men not registered as looking for employment). The Government had to do something to bridge the gap between external prices and internal costs.
Sidney Holland was elected Prime Minister in 1949 following the National Party victory in the election of that year. Jack Watts was Minister of Finance. The National Government set about deregulating the economy by ending rationing, relaxing import controls, encouraging home ownership, cutting Government expenditure, raising interest rates and encouraging capital investment rather than consumption. Inflation was still a problem, and as export prices of butter, wool and cheese started to collapse, the prospect of a serious balance of payments crisis loomed.
Influence on statistical initiativesThe Census and Statistics Department published balance of payments statistics every year to 1938-1939, based on customs merchandise trade records and estimates of invisible items. These were approximate only as the department did not have the

80
George was also known as being a liberal man who was very strict on what we would refer to today as ‘professional ethics’ and avoided any semblance of political partiality in the output of the Department.
George Wood was a very active member of the Consumer’s Price Index Advisory Committee right up until his death in 1978.
PersonalityGeorge used to borrow books from the General Assembly Library and, being “a man of very trenchant forthright views”, if he came across something he didn’t like, he wouldn’t hesitate to write “Bullshit!” or something similar in the margin. The librarian at the time, Gilbert Hodgkinson, to the best of his ability, had to go through any book George returned to check, and subsequently delete, any comments that he came across. Twink had not been invented then, and George did not always restrict his writing to the use of a pencil. Gilbert sometimes just hoped no one would notice them because he found it impossible to erase them all.
George thought John Baker was a “rotten travel companion”. The two travelled overseas together quite frequently. George was a member of the United Nations Statistical Commission, and in 1957 he was elected Chairman of the Commission. John accompanied George to most of the conferences. At one conference they both went to London and had adjacent hotel rooms, but had to share a bathroom. There was a sliding door on both sides with the bathroom separating the bedrooms. George always used to lock both doors, and forgot to open John’s when he was finished in the bathroom, so often, that John went downstairs and requested another room, which George took great exception to.
John also remembers when the two were flying over Rome and the pilot said that if you looked down you could see Mount Vesuvius. Everybody moved over to one side of the plane to have a look, but George was asleep. Assuming George would want to look at the famous landmark as well, John woke George up only to get as a response from George “What a bloody nonsense!”
George liked telling stories. At an international statistics conference a colleague whom George knew well challenged George to tell a particular story without making a mistake. When George got up and told the story, he made a mistake and John, who was appointed judge, pointed out the mistake he’d made, causing George to lose his bet. George was not a happy man after that.
Other achievements and honoursGeorge was director of the Consumer Council of New Zealand and guided the organisation for its first 16 years. Through his leadership he built a unique movement which had become so respected for its impartiality and fairness that it had won the goodwill and co-operation of trade organisations generally. He shaped the policies and

81
predictions of population, which ultimately went into policy formation. Forecasts were broken down by gender and by age group. These projections were based on assumptions which were stated so anybody who used the projection also had to accept the assumptions. This move to ‘forecasting’ was a significant departure for a Department that, hitherto, had produced data about past events.
George also built up the research side of the Department and took over semi-actuarial functions, in particular the making of the life tables, which were compiled mainly from census information (the Government Actuary had previously done this task). The 1950s saw Maori statistics included in the life tables. Until then, Maori life tables were not included. The Department also produced multiple decrement tables. In accident compensation claims, the focus was to decide on compensation to a widow if her husband was killed, which was usually a lump sum. It was necessary to work out the expectations of life of the husband, and it was also necessary to work out the expectation of widowed life of the widow, and to know about a man’s expected working life, as distinct from his expected life.
Within the Department itself, George recognised the need to have a tiered salary and promotion structure to prevent the same people performing the same job day in and day out. Under the old system, employees were paid the same rate regardless of the standard of their work, and there were no monetary rewards for increased productivity. He devised a 5-tier salary scale, with possible movement within that scale to recognise individual initiative and productivity. Until then, the only salary movement was through promotion, and he had observed that if a worker was not interested in progressing their career, they generally stayed in the same place on the same salary until they retired.
In order for this new salary system to work, George encouraged regular monthly meetings with his staff and expected them to report on progress against specified targets for all the various projects underway. This had never been done in the Department before, but he thought his staff should be accountable for the work they did and the money that was spent. He first set this structure up after the war and the system has been slowly adapted over the years.
During the 1950s, with economic prosperity and full employment, George had trouble recruiting “decent, qualified, hard working people”. Anecdotal evidence suggests the Statistics Department had become a place for employing difficult people in the public service, whom the other departments did not want to employ. This had affected the reputation of the Department and it was not until the early 1950s that George took steps to recruit his own staff. This involved some tension between the Department and the State Services Commission which managed the centralised recruitment and appointment of staff across the public service.
George was well respected by his staff and regularly made rounds of the Department to meet and chat with them. Back then it was possible to do this as staff numbers were not as high as they are today. His staff referred to George as the ‘Pie Cart Manager’ because his jacket was always covered in food.

82
became well respected for his impartiality and thoroughness. George was well known and highly respected throughout the world consumer movement.
He was the author of several books including, Wordsmiths, a devastating study of advertising in the early 1960s; Consumers in Action, the history of the Council’s first 15 years; and also Progress of Official Statistics – 1840–1957, a history of the Department of Statistics. He also wrote the first Annual Report for the Department in 1956, which was required under the Statistics Act 1955.George was first honoured in 1949 when he received an Order of the British Empire (OBE). In 1956 he received the Imperial Service Order (ISO), and was knighted in 1975 for public services, in particular for the work he did while chairman of the Consumers Council.
Sir George Wood died at Whangarei Hospital after a short illness on 18 December 1978, aged 78. His wife Eileen and his daughter survived him.
83
James Towers Campbell (1906–1994)R M Williams, Former Director, Applied Mathematics Division, DSIR
Jim Campbell arrived in Gisborne from Scotland, aged six, in 1913. His father found work in his trade as a plumber. Jim enrolled at primary school. For most children in that area, schooling finished at primary school. But we can assume that his father, influenced by that Scottish belief in education (which has played such an important part in New Zealand’s history) ensured that Jim was one of the three out of a standard six class of 30, who went to Gisborne High School.
At high school, Jim, who had found arithmetic dull and predictable discovered the exciting and mysterious world of algebra – the beginning of a life long love affair. But other aspects of the mathematics class were less pleasing. The master divided the class into boys on the right, girls on the left. The girls were told to get on with their knitting; the boys were taught mathematics. This injustice was a lasting memory for him – and throughout his life he vehemently challenged the idea that women could not do mathematics. It is no coincidence that an unusually high proportion of young women from his classes pursued successful careers in mathematics – helped, no doubt by the quality of his teaching, but far more by his positive confidence in their ability.
His concern for his students, men and women, manifested itself in a multitude of ways. David Vere-Jones relates how, in his final year, Campbell unexpectedly materialised by his side and suggested that he might slip into a room where they happened to be doing the preliminary selection for Rhodes Scholarships. He brushed aside David’s protest that he was not an applicant – the paperwork could be dealt with later! As a result, David studied in Oxford, Moscow, and Tashkent (before returning to New Zealand and finally to a chair at Victoria University). It was this practical regard for the welfare of his students and staff, that enabled Jim to run a department which was remarkable for its warmth and stability, at a time when staffing mathematics departments was a continuing difficulty.
But to return to his career. He won a scholarship to go to the University of Otago where he studied under Professor R J T Bell – in Campbell’s view, by far his best teacher. He obtained a first class honours degree and was awarded one of the few post-graduate scholarships for overseas study. On Bell’s sound advice he rejected the well-worn path to Cambridge and went to Edinburgh to do a PhD under the New Zealander, A C Aitken, also one of Bell’s students. Two years later, in 1932, he completed and published his thesis on orthogonal polynomials in relation to correlated Poisson variables. David Vere-Jones tells us that many years later, when

84
Dick, knowing nothing about agriculture, statistics, or Government departments, found in the Campbell’s home the only decent collection of statistical literature in New Zealand, a warm welcome from Margaret and Jim on his visits to Wellington, and some very thoughtful discussions on how statistics might develop in New Zealand. In fact, statistics had to go on the back burner for the duration of the war; Ian became involved in radar and other military activities.
When in 1941 I went from Christchurch to Wellington, also to go into radar, I was advised by my professor that if I wanted to keep in touch with mathematics, to go and see Campbell. To my disappointment, Campbell was warm and friendly but about to leave for the Navy. His next four years were spent mainly in Australia, on decoding work, which he found mathematically unrewarding.
He returned with relief to Victoria University in 1946. Heavily involved in teaching (with inadequate resources) the surge of students that followed the war, he still found time to be warmly supportive of Ian Dick when he was establishing the Biometrics Section (later to become the Applied Mathematics Laboratory, AML). In 1948, the New Zealand Statistical Association was formed, with Campbell as President and Dick as Secretary. Throughout his life he continued to be involved with that still flourishing Association and gave it generous financial assistance.
One form of support for the AML was to encourage some of his most able students to spend their long vacations working in the Laboratory and to find for themselves that there was interesting work to be done there. This became the regular means by which the Laboratory identified staff it might recruit and enabled it to attract the interest of a remarkably high standard of graduates. Many of them had won post-graduate scholarships, and Ian was content to appoint them and then wait for their return after completing their PhDs overseas. The most distinguished of these was Peter Whittle who, after graduating at Victoria University and studying in Sweden, spent some years with the Laboratory and then went overseas, finally to become a fellow of the Royal Society and the Churchill Professor of the Mathematics of Operational Research at Cambridge.
Campbell became a Professor and then Head of Department in 1952, continuing at Victoria University until 1968. He thought deeply and independently about what the University should offer its students. When it became increasingly fashionable to emphasise research and play down the importance of teaching, he had no hesitation in swimming against the tide. His own lectures always conveyed the enthusiasm and love he had for mathematics even to those whose own abilities were modest. He saw his task as enabling students to attain the limit of their ability, to have access to the excitement and elegance of mathematics, and to expose them to the intellectual rigour and honesty it demanded.
Although he was, in those early days, easily the best-equipped person in New Zealand to mount serious statistical courses, he chose not to do this himself and was
85
working on bivariate distributions, which had then become fashionable, he chanced on this paper written long before its time. Jim, of course, had not mentioned it.
After a year’s teaching at Edinburgh University, he returned to New Zealand, taught for a year or so at Nelson College, and in 1935 started lecturing at Victoria University. The only other staff member was Professor Miles. It was common in the University of New Zealand at that time, for two people to do all the pure and applied mathematics teaching. Fortunately, as well as being an enthusiastic teacher, he had a deep love of mathematics. So, in spite of a horrendous workload, he found time to do that extensive reading which made him a quite exceptionally broad and well-informed mathematician. This was not achieved without sacrifice; he did not attempt much research but he did something else that, in the circumstances, was much more important.
He gave a remarkable amount of time to consulting in statistics. For example, he would sometimes spend the May or August vacations in Palmerston North, working with people in agriculture at Massey or the DSIR. His clients included some formidable names. Professor Riddett, Director of the Dairy Research Institute; and Dr Dry, the geneticist who, in the face of considerable criticism, developed the Drysdale breed of sheep which has been a vital element in our carpet wool industry. Otto (later Sir Otto) Frankel of the Wheat Research Institute; and A W Hudson who conducted a vigorous correspondence about the merits of random and systematic experiments with W S Gosset, better known by his pseudonym ‘Student’ (see Chapter 4, The Hudson-Gosset correspondence), and for the famous t-test he invented.
Most significant was Campbell’s collaboration with Arthur (later Sir Arthur) Ward, who started in a very humble role in a dairy factory and became the Chief Executive of the Dairy Board. Ward saw the possibility of massive improvements in the quality of the New Zealand dairy herd by an extensive programme of testing and statistical analysis. It was Campbell who, recognising in Ward a natural, albeit untrained statistician, provided the statistical expertise which helped to make Ward’s work a major source of strength to the dairy industry. (See for example, Ward A H and Campbell J T, “The practical application of age conversion factors to dairy cattle production (butterfat) records” J Ag Sci, 1938.)
The value of Campbell’s work was recognised very rapidly and in 1937 he was asked to accept a part time, at least, appointment in DSIR to provide statistical consulting services. He very sensibly declined. He loved the whole of mathematics, he was devoted to teaching and his students, and he was shrewd enough to know that regular consulting would make intolerable demands on his time. But the ball he had set in motion continued to roll and in 1939 the DSIR recruited for the same purpose Ian Dick, who was about to graduate in mathematics from Canterbury. I have no doubt that Campbell’s advice was to recruit a good mathematician and let him learn about agriculture and statistics rather than to try to teach an agriculturist about statistics.

86
time the latest of our makeshift homes was above some shops in Courtenay Place (later occupied by the Depot Theatre). Jim and I had long believed a critical mass of mathematicians was essential to do good research. and when Victoria University started to plan a new library building, which was also to house the mathematics department, we got Government money and University support to add an extra floor to provide a permanent home for the Laboratory. Although I left the Laboratory before the building was completed and never occupied that office with a wonderful view (that I had planned for myself), I believe that many of the hopes that both sides had for this centre of excellence were fulfilled. It is ironic that although, nearly thirty years later, the creation of such centres was trumpeted as one of the advantages of science restructuring, the restructuring in fact lead to its dissolution.
After his retirement to Nelson, he spent a number of years as a part time mathematics teacher at Nelson Girls’ College; 50 years after that episode in Gisborne High School he was still setting things right!
So what did it all add up to? Some of the specific achievements have suffered at least temporary setbacks. But institutions change and may reform. The enduring legacy is a tradition of excellence in teaching and a concern for students and staff; the sense of excitement and intellectual honesty which, through his teaching of mathematics, this kind and wise man was able to give to so many people.

87
content to leave that to be done later, and very ably, by Jock Hoe. He was, on the other hand, sympathetic to departments that wanted to provide some statistical courses for their non-mathematical students. Sympathetic, but not uncritically so. One department was informed that, given the mathematical equipment of their students, the best thing that could be done for them was to provide elementary courses in very basic algebra, on which statistics might some time later be based. He was shocked to find in another department that what purported to be statistical courses were being given by a staff member who appeared to lack even that elementary knowledge of algebra.
An extraordinarily helpful and sympathetic man, he occasionally gave voice to anger and frustration provoked by woolliness or dishonesty of thought. In spite of these occasional explosions, his judgement and decency made him widely liked and respected in the large university community. He shaped the role that he saw as most appropriate for the times and filled it with great energy. Peter Whittle described him affectionately as a “square peg in a square hole”.
He took a great interest in the teaching of mathematics in schools, and not only to the most able students. Perhaps if he had been even more heavily involved, the introduction of the new mathematics would have faced fewer problems.
One contribution he made to education came from his association with Dr E G (Peter) Jacoby. Peter and his wife, Ilse, had come to New Zealand as refugees from Germany, just before the war. Peter, a lawyer by training, a sociologist by inclination, and, in his first years here, almost anything else by necessity, finally found his niche as a research officer in the Department of Education. Campbell recognised in him, as he had in Ward (who, by background and temperament was almost the exact opposite of Jacoby), a natural though untrained statistician. He valued the friendship and respected the abilities of both men. Jacoby’s work in predicting student numbers and staff requirements, as well as more general demographic questions, gave a very good planning base for the Department of Education. He developed the controversial (but essential) scaling system for examination marks, now under ill-informed attack. In all these matters, Campbell’s wise and quiet support was a vital element.
One can only be amazed at how Jim, without apparent stress was able to be involved in such a vast range of activities. Some answer can be found in the close personal network to which he and Margaret belonged. The Campbells, the Wards, the Jacobys, the Beagleholes and a number of others formed a mutually supportive group with common interests, notably in music and walking.
On a more personal note. I had returned from Cambridge in 1949, and in 1953 followed Ian Dick as the director of the Applied Mathematics Laboratory. At that
88
student at the Otago University, and a vacation student at the Applied Mathematics Laboratory in the early 1950s:
One incident shows the independence, courage and integrity of Harold Silverstone. He was Senior Lecturer in the Maths. Dept., and was publicly attacked for his political opinions by an editorial in the Otago Daily Times which called for his dismissal. Prof. Gabriel (Head of Maths Dept.) entered the fray vigorously in Dr Silverstone’s defence, arguing the importance of academic freedom. Dr Silverstone was a member of the Communist Party, and communism was a very dirty word at that time, both on account of the growing Cold War with the McCarthy witchhunts in the USA, and industrial strife in New Zealand. Silverstone was a moderate and fair person, rather mild in nature.
Alister McLellan, Lecturer in Physics:
Another member of the staff, whom I knew well, was Harold Silverstone , who must have been the first staff member qualified to teach statistical mathematics. He was a brilliant mathematician, whose knowledge of, and expertise in, what was then modern mathematics seemed to me to be outstanding. He was kind enough to spend many hours discussing mathematics with me.
Bruce Moon, a former student:
The other staff member was Harold Silverstone, who was mildly notorious for being a communist. With him we did Calculus, and in Stage III, Matrices and Determinants in the style of A.C.Aitken’s rather pure approach. He was also keen on Statistics, and outside of the formal structure of the Department’s courses, he offered us one lecture a week on Statistics. To him I owe a thorough and invaluable grounding in Fisherian statistics, albeit I have discovered since that it is not the entire world of statistics as we thought then. Through the Prof. he no doubt got the University to offer a Certificate in Statistics to those of us who met what he thought was an adequate standard in his course.
George Spears, a former student and Senior Lecturer in the Department of Preventative and Social Medicine, University of Otago:
In 1951, some of the students during Pure Maths III were invited to join a class taken by Dr Silverstone leading to the Certificate of Statistics. It is probably more correct from my memories of Professor Gabriel to say that we were instructed to attend. The next year, 1952, those interested were invited to take the new two-paper course, Statistical Mathematics I. However, very early in the first term Dr Silverstone was admitted to Waikari Hospital with pulmonary tuberculosis. All the other students withdrew from the course but I continued my enrolment. I recall going to Waikari Hospital for a couple of sessions with Dr Silverstone but these were probably just to outline reading. On his discharge home, about mid-year, we established a routine for the remainder of the year. One afternoon a week I spent at his home in Opoho where he tutored me, and Mrs Silverstone provided afternoon tea. I passed well at the end of the year and this set me on a lifelong career path.
Editor:In 1957 Professor Gabriel died, and the Chair was advertised. Silverstone applied, but

89
Harold Silverstone (1915–1974)Editor
Lecturer and Senior Lecturer at Otago University, 1946-1959; Senior Lecturer and Reader in the Department of Social and Preventative Medicine, University of Queensland, Brisbane, 1959 until his death in 1974. (See also Chapter 3, Education and Chapter 6, Note on Cold War.)
Mark Woolf Silverstone, the father of Harold, was born in Poland in 1883 of Jewish parentage. Some years later, his family moved to London in the wake of anti-Semitic persecution. By the age of 19, he was representing foreign workers on a committee of the London Furniture Trade Unions. He arrived in New Zealand in 1904, obtaining work as a cabinet-maker. He joined a number of left-wing political parties, advocating revolutionary socialism thereby alarming leading Labour moderates. From 1916, he helped establish the New Zealand Labour Party in Otago. His political activities brought him into conflict with his employers, resulting in his dismissal, after which he established his own joinery business. In 1936, Walter Nash, the Minister of Finance in the first Labour Cabinet, appointed him to the Board of Directors of the Reserve Bank of New Zealand. (See Encyclopedia of New Zealand Biography, 1996.)
Harold Silverstone was born in 1915, educated at Otago Boys’ High School and at Otago University, where he obtained a BA in 1934 and an MA (1st Class Hons) in 1935. This was followed by three years full-time research in Edinburgh and London, with a PhD (Edinburgh) in 1939. He became Statistician to the New Zealand National Service Department in 1940, then was appointed to the Department of Mathematics at the Otago University in 1946. Politically, Harold followed in his father’s footsteps, becoming an ardent member of the Communist Party, never hesitating to express his views whenever opportunity offered. Following are some comments by friends and students.
Ron Smith was the Communist Party candidate for the Island Bay Electorate for a number of General Elections. He wrote a book entitled Working Class Son: My fight against Capitalism and War (Ed Harry Orsman, 1994):
A great feature of the Island Bay Branch of the Party was the presence of Harold Silverstone. He was a highly educated person, a graduate in Mathematics of Glasgow (sic) University, and an excellent tutor in Marxism. He took our regular study covering economics, the theory of surplus value, … the historical sequence of slavery, feudalism, capitalism and socialism, … etc. Harold was the editor of a legal paper being run under cover by the Party – “The Industrial Worker” – which dealt almost exclusively with industrial issues. Week by week he would comment to us on the paper’s content … I remember Harold got a scoop – the full text of Stalin’s historic speech of July 3rd: ‘Scorch the earth! … etc.’ Stalin’s speeches were never published in the capitalist newspapers – Harold published this one in his paper.
Professor Volker Heine, Cavendish Laboratory, Cambridge University was a former
90
another staff member, Desmond Sawyer, was appointed. Sawyer was a pure mathematician with an interest in the Geometry of Numbers, and held a Readership. Silverstone, who was a Senior Lecturer, was an applied mathematician with an interest in Statistics. At this point in time Mathematical Statistics was a relatively new comer in the field of applied mathematics. I telephoned Silverstone’s wife, Madge, who is still living in Brisbane, and she was quite certain that he missed the Chair because of his political views. I also rang some former communist friends in Wellington, who were in Dunedin in 1957, and they were of the same opinion. Dr Robin Milne, Dept of Mathematics, University of Western Australia, in his article on A. C. Aitken and his Research Students: A Survey comments:
Towards the end of (Silverstone’s time at Otago) he was appointed to the Chair of Mathematics, but the New Zealand Government refused to ratify the appointment because of the prominent role Silverstone had played in the New Zealand Communist Party.
Also, Professor Douglas Gordon, Head of the Department of Social and Preventative Medicine at the University of Queensland (where Silverstone worked after leaving Otago) gave Silverstone’s eulogy. In it he said, “He was the successful applicant for the Otago Chair in Mathematics, but due to his political beliefs, this was not confirmed.”
I had serious doubts as to whether the New Zealand Government ever had the power to either confirm or cancel a University appointment. (See Chapter 6, Note on the Cold War.) However, the Government, with two or three appointees on the University Council and who, more importantly, made major financial grants to the Universities, could bring some pressure to bear on any appointment. I wrote to the Registrar of the Otago University, asking for information concerning this, and received the following reply from Linda Moore, Assistant Archivist, Hocken Library (OU File 670):
Harold Silverstone did apply for the position, but did not make the shortlist drawn up by the special committee appointed by the Council. In consultation with English advisors the committee’s shortlist consisted of Desmond Sawyer and three British Mathematicians. The committee unanimously recommended the Council appoint Sawyer, subject to approval by the Senate and the University of New Zealand, which was received. No mention is made of Silverstone’s communist views although the minutes of the Committee meetings are brief. Silverstone’s publication record was short in comparison with other candidates.
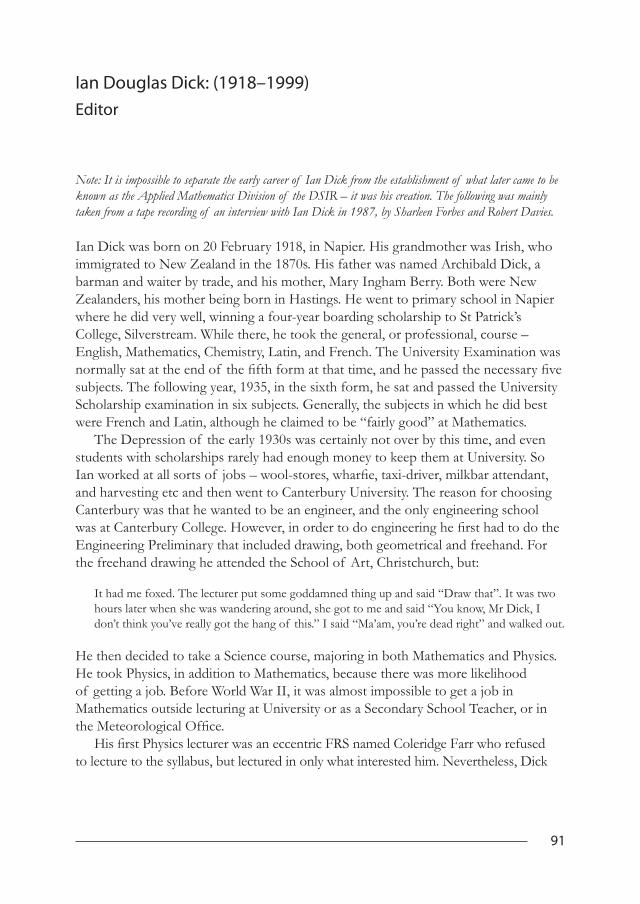
91
Ian Douglas Dick: (1918–1999)Editor
Note: It is impossible to separate the early career of Ian Dick from the establishment of what later came to be known as the Applied Mathematics Division of the DSIR – it was his creation. The following was mainly taken from a tape recording of an interview with Ian Dick in 1987, by Sharleen Forbes and Robert Davies.
Ian Dick was born on 20 February 1918, in Napier. His grandmother was Irish, who immigrated to New Zealand in the 1870s. His father was named Archibald Dick, a barman and waiter by trade, and his mother, Mary Ingham Berry. Both were New Zealanders, his mother being born in Hastings. He went to primary school in Napier where he did very well, winning a four-year boarding scholarship to St Patrick’s College, Silverstream. While there, he took the general, or professional, course – English, Mathematics, Chemistry, Latin, and French. The University Examination was normally sat at the end of the fifth form at that time, and he passed the necessary five subjects. The following year, 1935, in the sixth form, he sat and passed the University Scholarship examination in six subjects. Generally, the subjects in which he did best were French and Latin, although he claimed to be “fairly good” at Mathematics.
The Depression of the early 1930s was certainly not over by this time, and even students with scholarships rarely had enough money to keep them at University. So Ian worked at all sorts of jobs – wool-stores, wharfie, taxi-driver, milkbar attendant, and harvesting etc and then went to Canterbury University. The reason for choosing Canterbury was that he wanted to be an engineer, and the only engineering school was at Canterbury College. However, in order to do engineering he first had to do the Engineering Preliminary that included drawing, both geometrical and freehand. For the freehand drawing he attended the School of Art, Christchurch, but:
It had me foxed. The lecturer put some goddamned thing up and said “Draw that”. It was two hours later when she was wandering around, she got to me and said “You know, Mr Dick, I don’t think you’ve really got the hang of this.” I said “Ma’am, you’re dead right” and walked out.
He then decided to take a Science course, majoring in both Mathematics and Physics. He took Physics, in addition to Mathematics, because there was more likelihood of getting a job. Before World War II, it was almost impossible to get a job in Mathematics outside lecturing at University or as a Secondary School Teacher, or in the Meteorological Office.
His first Physics lecturer was an eccentric FRS named Coleridge Farr who refused to lecture to the syllabus, but lectured in only what interested him. Nevertheless, Dick
92
the inquiries came from Lincoln, from the Grasslands Division at Palmerston North, and a little later from the Plant Diseases Division at Auckland and Dick was constantly travelling backwards and forwards to these centres.
During this time, and up to 1955, Dick published a dozen scientific papers relating to these projects on which he was working, seven of them solo, and five as a joint (see Chapter 4, Foot Measurements of New Zealand children, Identical Twin Experiments). In addition, as late as 1967, while he was occupying an administrative position, he still found time to publish two more joint scientific papers. All these papers are listed in Publications and Personal Recollections, DSIR Applied Mathematics, August 1993.
One of the most noticeable points about Dick was his ability to attract top quality staff. The mathematics departments of the Universities were also looking to attract mathematicians of scholarship material, and one of the University Professors used to complain “Dick goes down to the wharf to meet the scholars returning from their training at overseas Universities and immediately offers them a job.” But Dick had a different method. He would first find out the top mathematics scholars at each of the four universities, and offer them employment for the university vacation, before they were even aware of their final results. Nearly always they were glad of the opportunity. It was not so much to test their ability, about which he already knew, but to see if they were interested in working in statistics in general, or with a team in particular. Having finished their final examinations in New Zealand, the students would return to the Laboratory, and work for some months before taking up their overseas scholarships. Dick felt strongly that the best results for the Laboratory would be achieved by the students attending different universities, preferably in different countries. Bob Williams went to Cambridge, John Darwin and Hamish Thompson to Manchester, Peter Whittle to Uppsala in Sweden, Bill Taylor and Arch Glenday to London. He felt that he did not want a little Cambridge, a little London, or a little Manchester, but would prefer a wide variety of ideas and interests which would be invaluable in a scientific organisation.
Some of his administrative practices were very unusual. For example, when he started the section in 1946, he was given a big room with a table and chair but no other equipment, the reason given being that there were shortages because of the war. During the first week at the office, he would wait until everyone was at morning tea, then he would move round the office taking something very small from each desk – a pen, pencil or a few sheets of paper, and transfer them to his own desk. By the end of the first week, he had sufficient stationery for his own immediate requirements, and no one seemed to have noticed any loss from their own desk. Some months later, he received a phone-call from Head Office, asking why they had received no leave returns (which, according to Public Service rules, must be returned each month). He met this difficulty in his own way – he returned zero leave forms for five months, then in the sixth month he returned half the staff as being on leave. He repeated this for the

93
found him a magnificent lecturer. His mathematics lecturer was named Saddler, who was a first-class mathematician. Saddler always lectured without notes, and consequently many overlapping lectures were given. Also, without notes, he would do everything on the board, often getting stuck – in which case he would go to a corner of the board and try to work out the problem. This, in itself, Dick thought, was first-class training. Eventually, at the end of his BSc, Dick became the Senior Scholar in Mathematics. The following year, 1939, he completed the Honours course in Mathematics.
About this time the DSIR began to think that their agricultural research workers were finding that the statistical design of experiments, and the ideas of probability, were becoming too difficult for them to handle, and that they ought to employ some specialists in the subject. There was apparently some discussion in the DSIR Council as to whether an agriculturist should be trained in mathematical statistics, or vice versa. The Chairman of the Council was also the Professor of Chemistry at Canterbury – Henry George Denham, and he knew about Dick because of his Senior Scholarship, and also because he had advanced both Physics and Mathematics. So Dick was offered a position in the DSIR, which he accepted, and began work in December 1939.
He started in the Agronomy Division at Lincoln College, and began a BAgSc degree, studying soils and fertilisers, genetics, animal husbandry, and field husbandry. He was in a somewhat unusual position at Lincoln, being a DSIR officer, a student at the college, and an honorary lecturer – all at the same time. The few lectures he gave were mainly in the Design of Experiments to the BAgSc students. However, this only lasted for 18 months. At this time the New Zealand defence forces were developing radar, and needed radio-physicists. Because of his training in physics, Dick was sent by the Manpower to do a course in radio-physics at Canterbury University, and then was sent to the Radio Development Laboratory in Wellington. During this period he met Jim Campbell, a mathematics lecturer at Victoria University, who loaned him a book on mathematical statistics by A C Aitken; and also The Annals of Mathematical Statistics – the only set in the country. From these he was led on to reading Gosset (‘Student’), Fisher, Snedecor, and Kendall.
In 1942, he was given the job of setting up a Biometrics Section of the DSIR, once the war had ended (later to become the Applied Mathematics Laboratory – AML). He immediately invited three of his colleagues in the Radio Development Laboratory – Bob Williams, John Darwin, and Phil Armstrong – to join him in the Biometrics Section that was to be; so his recruiting began in 1942. Shortly after this, he was moved by the Manpower into the Army, received a commission, and was sent first to Australia, then to Egypt and Italy.
Returning to New Zealand in 1946, he began work in the Head Office of the DSIR. As soon as the agriculturalists heard that a biometrician was actually available, they immediately began to ask for help in the designing of their experiments. Most of

94
seismology. He accepted this, but then found to his surprise that he had been put in charge of all geothermal investigations in New Zealand. In agreeing to this, he widened the scope of the Biometrics Section, and so changed the name of the section to that of the Applied Mathematics Laboratory. Three years later, in 1953, he was appointed as Assistant Secretary in the Head Office of the DSIR. Although this was an administrative position, he nevertheless insisted on continuing his scientific work. He rarely dictated, for example, more than one letter per month, but he published a number of research papers. During this period the Directorship of the Physics Laboratory, which was under his care, became vacant and he decided to occupy the Directorship himself for over a year before appointing a new Head.
In addition to this, he was also put in charge of all the scientific research investigations in the big Wairakei geothermal projects, and then was seconded to the Steel Investigating Company, a wholly owned Government company, and remained on the board for two years. This board was set up by the Government, who originally asked private companies to take over all the investigations, but they had refused because they were not to be given a monopoly.
Dick found that his training in mathematics, physics, and statistics were an invaluable help with both technical and financial problems. For example, one such problem came up with the geologists in drilling. He felt it was necessary to keep drilling until they had achieved a 95 percent probability that the ore reserves were not less than a certain figure – the geologists had never worked before with such a principle.
Some years later, in 1967, he became Under-Secretary to the Mines Department. Again, he found his former training invaluable. At the beginning, his main concern was for the safety of the miners. He first appointed a safety officer who was also a first-class technical worker, not simply an office worker who knew nothing of technical matters. Again, he used simple tables and graphs to record the place, time, and other aspects of the disasters. One problem in particular, which was reported to him as a racial problem, was the administrators’ claim that Polynesian and Maori workers had a very high accident rate. Of the underground workers, some were working at the coal face, which had the highest accident rate; some working on the transport of the coal; and others in underground maintenance. Dick insisted that accurate records be kept as to which miners were employed in each of the different types of work, and found that the most dangerous jobs were in fact being worked mostly by Polynesian and Maori. When the figures were racially analysed, it was found that in fact the accident rate for the Europeans was actually higher than for the others.
The Ministry of Energy was set up in 1977. The Mines Department and the State coal mines were made a Division of this new Ministry. Some years later the Coal Corporation was set up as a State Owned Enterprise. Dick was transferred from Mines to become an Assistant Secretary of Energy for long-term planning and to help

95
second half of the year. The times of actually taking leave, of course, was completely independent of the times returned on the forms. No one seemed to object to this system, so he imagined everyone was happy.
He generally had very little sympathy with forms. Each time he received a form from Head Office, he simply filed it in his bottom drawer, and only returned it when it was asked for. He found that this drawer was gradually filling up with unreturned forms. There is no record as to what finally happened to these forms, so presumably only a few of the forms were important. Once he asked Head Office for some petty cash and was given a couple of pounds. When he asked for more, he was asked to show his cash book; but he felt that keeping records for such small amounts was nonsense. However, since Head Office was some distance away, he needed tram tickets for travelling there and back. They were prepared to issue him with a number of these, without his having to keep to a cash book, so by some devious method, perhaps by selling these to his staff, he was able to recoup enough cash for his small wants.
As more and more scientists heard about the help they could get from the Biometrics Section, the work tended to increase, and the Section was asked to handle problems with an increasing amount of data. But it was not possible to make analyses with the small hand machines then available. So Dick decided he wanted punch card machines. He found that at this time the Department of Statistics were about to obtain new Powers-Samas machines, so Dick went to interview the Government Statistician, James Butcher, to see if he could obtain the old ones. But Butcher replied that he had needed to declare that the old ones were unusable in order to obtain the new ones, so he would be in trouble if it were found that another Government Department was actually able to use them. When asked how he was going to dispose of them, Butcher replied that he would be taking them to the rubbish tip. Dick then asked him the date on which they would be taken there, and then said that he would take his own truck round and pick them up from the tip. Butcher finally gave in, and Dick acquired a Powers-Samas system that was 25 years old. This served the Section for two more years, when new machines were bought.
Getting enough funds to build up a library was always going to be a difficulty, especially as he was starting from nothing. Other branches of the DSIR could mostly get funds for equipment, as well as a certain amount for library purposes. So he argued that, having hardly any equipment, he should be entitled to a bigger library grant. He always ordered as many books and journals as he could, more in fact than he needed, on the assumption that if the book grant was ever cut back, he could still maintain the supply of essential books by cutting back on those which were not absolutely necessary. The library he eventually built was regarded as by far the best library of statistical books and journals in the country.
In 1950 Dick was asked by the Council of the DSIR to help in the area of

96
the new Ministry to get under way as a going concern. He finally retired in December 1979.

97
Peter Whittle (1927– ) – an autobiographyIntroductory note by Bob Williams
Peter Whittle came to the Biometrics Section via the enlightened scheme initiated by Ian Dick, under which, able undergraduates worked in the Section in the long vacation, and the most able were offered, and often accepted, appointment on graduation before departing overseas on scholarships for graduate studies. Developing an interest in time series and stochastic processes, Peter chose, in 1949, to work under Herman Wold at Uppsala – a choice presumably made easier by the fact that he is a natural linguist.
After four years he returned to New Zealand about the time that I took over from Ian Dick as Director. A reviewer of his first book Hypothesis Testing in Time Series Analysis (published in 1951 and based on his PhD work) described him as “clearly a pioneer in this subject”.
His impact, both inside and outside the laboratory, was striking. In one university, a recently arrived professor harboured the common academic view that nothing good could come out of the public service, but after Peter had given a short course of lectures there, was warm and generous in his praise, and encouraged his best students to spend some time with us.
His broad interests enabled him to work with a wide range of clients. The small group of mathematical physicists which we were gradually building up, found him a stimulating colleague – he had described himself as a “physicist manqué”. He produced a steady stream of papers ranging from fluctuations in rabbit populations, through oscillations in a coastal water channel, into abstract methodology. His genuine interest in people and their work, his admiration for other’s achievements, his boyish sense of humour and lack of pretension, made it possible for him to carry his own intellectual pre-eminence without exciting jealousy or antagonism.
His departure for England in 1959, followed by two university chairs and an FRS, was a proper step in his own development, but left a vast gap in the Laboratory, both intellectually and personally.
Author’s note: This autobiographical note is a reduced version of the 1994 reference below; the 1992 reference gives some additional material on the Swedish years.
I was born in Wellington on 27 February 1927. After attending Island Bay Primary School and Wellington College (Dux in 1944), I went on to take my BSc at Victoria University College and then my MSc, with First Class Honours in Mathematics. I
98
different characters, but both interpretable and with some interesting non-linear effects of a threshold nature.
The other set of data came from Animal Ecology, and concerned variation in rabbit numbers. Here there was evidence of a rather diffuse periodicity, the mechanism producing this being almost certainly interaction of the rabbit population with a liver parasite to which it was subject – Eimeria Stiedae. The parasite was of interest as a possible control on rabbit numbers, but the mechanism itself was, again, an instance of non-linearity, always so fascinating and so frustrating.
The range and fundamental character of the issues thrown up in DSIR was quite fascinating. Norm Barber, in Geophysics, was concerned with the design of detector arrays and their associated processing. Frank Evison, also in Geophysics, was concerned with the mechanical properties of random media – in this case non-homogenous volcanic material lying under some of New Zealand’s dams. There was interest from the forestry people in what could be seen as a critical effect in a percolation model – the failure of a tree when damage to its cortex from boring insects exceeded what seemed to be a fairly definite threshold. Hamish Thompson, in Auckland, was concerned with critical polymerisation effects, in relation to virus/antibody interactions. In most cases I could not digest these problems (in the sense of making any progress with them); only store them as an ostrich does stones in its gizzard. However, there were other successes – the transfer of my time series results to the more puzzling context of spatial processes; clarification of threshold effects in stochastic epidemic models; explanation (with Herman Wold) of the Pareto law of wealth distribution; ideas on reversibility in stochastic processes; determination of the joint distribution of transition totals in a Markov chain.
The DSIR allowed me to take 1957 at the Australian National University in Canberra as Senior Research Fellow. It was delightful to spend time with Pat Moran’s group there, and the spell gave me a chance to clarify thoughts on other issues such as smoothing problems, multivariate Tchebichev inequalities and (a new one) extension of optimal prediction ideas to optimal control.
Largely for family reasons, and with great regret, I left New Zealand and the DSIR in 1959 for a Lectureship at the University of Cambridge. I had never spent much time in the United Kingdom, and to start a new life there was certainly a challenge, but one that largely proved pleasant and beneficial. I had not held a lecturing post since my Docentur at Uppsala. The principal difference, I found, from work in DSIR was that instead of concentrating on a few islands of expertise, I was expected to be knowledgeable over a wide continuum. In 1961 I was appointed to the Chair of Mathematical Statistics at Manchester. This was an honour, but the real honour in my eyes was to be Maurice Bartlett’s immediate successor. There followed six years, redolent with memories.
My interest in optimal control flowered into a book, Prediction and Regulation. My

99
derived particular stimulus from the teaching of Dr (later Professor) J T Campbell, who had himself studied with A C Aitken in Edinburgh. Although my inclinations were towards mathematical physics, the experience of vacation work in the Biometrics Section of the DSIR (an opportunity created by the liaison of its Director, I D Dick, with Dr Campbell) diverted me into mathematical statistics. However, subsequent contacts in DSIR carried me into much broader waters.
Ian Dick was concerned to make an elite unit of the Biometrics Section, which had been newly founded to meet the growing need for statistical advice within DSIR, principally in the agricultural sector. In this aspiration, he succeeded. I learned my statistics within the Section and also had my first taste of research there. This was to develop, with Ian, designs and their analysis for use with the world’s largest herd of twin heifers gathered at Ruakura, to reduce the effects of individual variation. Our work resulted in a joint paper – my first journal publication.
I began permanent employment with the DSIR in 1948, before going overseas for graduate work. By this time work in the Section was extending beyond the agricultural, and we began to develop a particular interest in time series analysis and stochastic processes. We followed the work of Maurice Bartlett and that of the strong Scandinavian school – Arley, Jensen, Lundberg, Cramér, Wold and Karhunen. These works brought home to me the particular fascination of the combination of dynamic and probabilistic concepts, and also directed my interest towards Scandinavia. This led me to follow what was, at that time, an unusual course (though now much less so) – to travel to Uppsala to work with Herman Wold. I took my PhD there in 1951 and stayed on as Docent (a research post with mild teaching duties) until 1953.
Life in Sweden brought many new experiences. I will mention only the public defence of my doctoral thesis, with myself and my ‘opponents’, Ulf Grenander and Bertil Matern, in white tie and tails. These can be fierce affairs, but I was given a very fair run. The thesis itself was on inference in time series analysis. I would claim that this, and the papers that I wrote in Uppsala, provided the first asymptotic inference theory for the stationary Gaussian process. Many would criticise the work for lack of rigour, but my impulse has always been to make the essential breakthrough and then move on.
I returned to New Zealand and the DSIR in 1953. The first person to greet us at the Auckland wharf was Ian Dick. The Biometrics Section had now become the Applied Mathematics Laboratory which now included mathematical physicists as well as statisticians, and essentially provided a service in mathematical model building and analysis for the whole of DSIR. I continued for a while with time series analysis, and analysed two particularly interesting sets of data. One came from the oceanographic group within Geophysics, and gave water heights at 15 second intervals in a rock channel near my boyhood home in Island Bay. The analysis demonstrated the existence of two seiches (oscillations), of rather

100
the concepts of optimism and pessimism on the part of the optimiser, and radically extends the so-called certainty equivalence principle. These ideas in turn link up with large-deviation theory, whose application is now seen as all pervasive. I set out this material in Risk-sensitive Optimal Control (1990) and Optimal Control (1996). My interest in stochastic networks persists, and has resulted in Neural Networks and Chaotic Carriers (1998).
I was elected an FRS in 1978, but have felt equally honoured to be elected a member of the Royal Society of New Zealand in 1982 and to be awarded an Honorary DSc by the Victoria University of Wellington in 1987. Other awards I have received are: the Research Medal of the New Zealand Association of Scientists (1954), the Guy Medal in Silver of the Royal Statistical Society (1966), the Lanchester Prize of the Operations Research Society of America (1987), the Sylvester Prize of the Royal Society (1994), the Guy Medal in Gold (1996) and the John von Neumann Theory Prize of the Institute for Operations Research and Management Science (1997).
My formal training in mathematics ceased after my MSc, and so was embarrassingly slight. I have tried to improve on it, but have managed with a tool-kit consisting largely of some concepts of matrix theory, Fourier and complex variable theory, Lagrange multipliers and the like. I remain a mathematical physicist manqué (or, rather, égaré) and the concepts that are the most beautiful to me are those provided by the formalism behind Nature. I should like to know much more group theory and algebra but, from a certain stage, life was too short for measure theory.
I would name two personal qualities, which I recognise in myself and which I think have been useful, although some will rightly say that they have their negative obverses. One is laziness. If a piece of work is heavy and complicated then it is wrong. In calculations one will of course persist for quite a way with mounting complication and obscurity, but there has to be a resolution, a simplification at some point, if one is on the right path. Of course, the simplicity may be ‘simplicity’ in a more subtle sense than one would before have understood. This raises the second quality, which is almost stochastic in nature. One has to keep a particular openness of mind. Solving a problem is like going to a strange place, not to subdue it, but simply to spend time there, to preserve one’s openness, to wait for the signals, to wait for the strangeness to dissolve into sense.
Lastly, this note must surely reveal the extent of my debt to those vivid and comradely years with New Zealand DSIR.
References:Whittle, P (1994) “Almost Home”, in Probability, Statistics and Optimisation (Ed F Kelly),
1-28, Wiley, ChichesterWhittle, P (1992) “Obituary for Herman Wold”, J Roy Statist Soc A 155, 466-469
101
interest in optimisation, more generally, had been stimulated in Cambridge by Dennis Lindley, with his enthusiasm for statistical decision theory and its inescapable Bayesian element. I had some success with the polymerisation problem in these years, and also made my first encounter with stochastic networks by rediscovering the equilibrium distribution for Jackson queueing networks. Although a rediscovery, there was the bonus of recognising the partial balance phenomenon which later proved significant.
In 1967 I returned to Cambridge to become the first occupant of the Churchill Chair in Mathematics for Operational Research, a post which I held until my retirement in 1994. The Chair had been endowed by Esso Petroleum Ltd to promote the subject of Operational Research within the universities. The creation was a timely one since it was becoming recognised that the physical applications of classical applied mathematics were now being balanced by non-physical applications with a coherent theory: probability, statistics, optimisation, game theory and those aspects of subjects such as control theory, communication theory and mathematical economics which might be pursued by someone technically based in probability and optimisation. There were calls for systematic courses in this area, now dubbed ‘Applicable Mathematics’, and association of the area with the Churchill Chair was natural. I started by producing courses in convex optimisation, dynamic optimisation, and statistical communication theory. As I explained in the 1994 reference, I found this period to be a trying and humbling one, since I had no formal training or testing experience in any of these subjects. However, launched the courses had to be, and launched they ultimately were.
In 1970 I published Probability, an introduction to the subject taking expectation as the primal concept. This had a Russian edition in 1982 and was radically revised to Probability via Expectation in 1992. The optimisation course led to Optimisation under Constraints in 1971; essentially a geometric view of convex optimisation, with some applications which are still novel in this context, eg Michell structures and the Tchebichev bounds on distribution functions with prescribed moments. However, dynamic ideas continued to interest me most, and in 1982-1983, I at last published the two volume set on dynamic programming which I had promised Wileys – Optimisation over Time. The timing indeed turned out to be fortunate. In 1979 I had managed, after years of effort, to find a succinct and insightful proof of the optimality of John Gittins’ long unrecognised solution of the multi-armed bandit problem. To be able to present John’s marvellous solution of this classic problem in a compact and convincing form gave the book a peg which would have been sufficient on its own. Subsequent work has made these problems, once so daunting, seem ever simpler.
In 1986 I drew several themes together in Systems in Stochastic Equilibrium. I then found that the very complete theory of optimal control that exists for models with a quadratic cost function can be extended to the so-called risk-sensitive case, when the cost function is the exponential of a quadratic. This gives natural expression to

102

103
Steve Kuzmicich (1931– ) – Government Statistician (1984–1992)Frances Krsinich, Statistics New Zealand
Introduction Steve Kuzmicich started working for the Department of Census and Statistics in 1954, in the Research and Technical Unit, under Ernie Harris. In 1964 he became Assistant Government Statistician, and in 1978, Deputy Government Statistician. In 1984 he became Government Statistician, a position he held until 1992.
Len Cook (the current Government Statistician) observes that Steve made an unusually significant contribution to official statistics by leading four major revolutions – in the 1950s, statistical sampling; in the 1960s, the introduction of computers; in the 1970s, the integrated statistical system; and in the 1980s, the marketing of statistics.
BiographicalLike many other Croatians who came to New Zealand in the early 1900s, Stjepan Kuzmicich, Steve’s father, came to New Zealand because of the poor economic conditions in Croatia, and to avoid conscription into the Austrian Army. Mona Smeyah, Steve’s mother, was of mixed Danish, Lebanese, and Italian descent. Steve’s parents met in Napier.
On 2 November 1931, Steve Kuzmicich was born prematurely, arriving on the kitchen floor in his family home in Napier. He attended a Catholic convent school in Napier until 1939, when his father got a job working on a stall in the Centennial Exhibition, and the family moved to Wellington. After staying with relations in Miramar, they eventually settled in the Hutt Valley.
Steve attended St Patrick’s College in Wellington, being Dux in his last year. He wanted to become an electrical engineer but his family was poor, and it was not financially viable for him to study at Canterbury University, then the only place where electrical engineering was taught. So, abandoning this idea, he decided to study Maths and Physics at Victoria University. One of his lecturers was Professor Jim Campbell, who exerted a major influence through his approach to teaching mathematics.
Steve was initially unsure exactly what mathematically related work he wanted to do but decided on the Meteorological Service, which offered him a job, but which he turned down after discovering that single men often got early posting to remote Pacific observing stations.
He then applied for a job with the Department of Census and Statistics by chance:

104
factor inputs of capital labour etc, and intermediate inputs of raw materials and purchases from other industries. It then traces the outputs – both of intermediate goods and outputs of final goods to export, or to capital formation or to the household sectors, the final consumers. These flows can be represented by a matrix, with inputs and outputs forming the rows and columns. The mathematical analysis of this model required the inversion of a matrix, a huge arithmetical task in the days when computers were not available. It was necessary to find or devise a method for inverting a matrix using the electro-mechanical calculators that were available at the time. The method of pivotal condensation, developed by the New Zealand mathematician A C Aitken, was adopted as the most efficient.
ComputingSteve Kuzmicich became Divisional Director, responsible for machine data processing (punch card based), when the 1956 Population and Dwelling Census was still being processed. At the time the Census took four years to process on these ICT punch card machines.
In some countries, official statistical agencies have been the Government’s main adviser in computerisation strategy, and Steve feels strongly that the whole history of computer processing in the Department could have been different if the Department had pushed earlier and more forcefully to acquire their own computer. In the event, it was Treasury who got the first computer and the role of computer adviser to Government. Later, it became apparent that although the Public Service Commission had the legal responsibility for this role, it had no technical competence and no interest.
The Department of Statistics eventually got a computer, after assuring Government that if they got it by the deadline they specified, they would undertake to produce overseas trade statistics within a month from the end of each reference month. Compiled by the Customs Department, the extreme lateness of these statistics (more than a year after each reference month) had been proving a major problem to Government.
Two tenders were submitted to the Department for IBM and ICL (formerly ICT) machines. Treasury wanted the Department to take the ICL machine because of its larger capacity. However, the ICL computer had to be initially programmed in machine code, which would have been a complicated and error-prone process, and no firm guarantee on the early availability of symbolic programming was given. Eventually, the Department, assisted by the Minister of Labour, Mr Tom Shand, argued successfully for the IBM machine, which could be programmed in symbolic language.
Steve says that one of the most interesting and challenging tasks he ever had was supervising the establishment of a viable and professionally competent computer

105
I was walking down from Victoria University to the Wellington railway station to go home to the Hutt, where I lived, and I saw this building at the end of the Terrace, the Bowen Street end, with the name ‘Department of Census and Statistics’ on it, so I thought that maybe they might employ someone with a mathematics education. Anyway I walked in and spoke to the receptionist about the prospect of being interviewed for a job, her name was Mrs Raven, and she ushered me into the room of one Mr Jim Nicholls who was called in those days the Chief Clerk …This was on a Thursday, I remember it quite vividly, and after seeing Mr Nicholls I was ushered into the room of the Deputy Government Statistician, Mr John Baker. I was a bit intrigued by all this fuss. I found out later that the department had very few mathematicians on its staff …I viewed the job as a temporary one until I found something I liked. However, I found that working in the department was rewarding and congenial and the role of the department was a key factor in the quality of government. I was treated very well by the department’s management. I got some rather rapid promotion by normal public service standards and of course I stayed.
Among the technical developments that Steve Kuzmicich was involved with when he first began working for the Department of Statistics was the development of working life tables. Based on a well-known form of demographic statistics called a life table, which summarises longevity experience in the population, a working life table analyses the labour force experience during the life cycle. This posed some interesting and challenging technical problems, particularly the complication of women re-entering the work force after leaving for marriage. New Zealand was a pioneer in this methodological work.
The Department had recently begun the use of sample surveys, initially applying the technique to the annual agriculture survey. Steve was given the task of developing improved estimators for the survey after the failure of the initial survey plan. Having done this, he proposed that sampling should be discontinued in this type of survey, which needs a large range of small area estimates. He recommended that sampling in economic and business surveys be used mainly for the production of short term economic indicators which relied on simple and national outputs, and this technical policy was accepted by the Department’s management. Subsequently, socially oriented household sample surveys were introduced.
He also helped redesign the retail trade survey to an area-unit/cluster sample survey, overcoming the problem of updating the sample for changes to the survey population (‘births’ and ‘deaths’ of businesses). The work of field staff carrying out the price surveys for the consumers’ price index was very cyclical, and so the surveying of sample area units for new retail businesses in the survey could be carried out in slack periods.
During the late 1950s the Department commenced an inter-industry study of the economy, also known as an ‘output-input’ study. This takes each particular production industry in the producing side of the economy and analyses its inputs – both primary

106
adopt economic policies conducive to businesses achieving these goals. This was the motivation behind the National Development Conference.
The Targets Committee controlled all the analytical work and formatted proposals for growth from all the sectors of the economy. Steve’s role was basically to ensure that the Targets Committee knew what relevant data were available, to get the Committee access to the data it needed, and to assist in the methodology of the analytical work involved in target setting.
One outcome of this work was the realisation that a sufficiently wide range of economic statistics for serious economic studies was not available. Particularly, there was a lack of sufficient short term indicators, and the range of economic statistics available was not integrated enough to readily allow efficient development of New Zealand’s national accounts. So, under the prompting of the Targets Committee, one of the strong recommendations of the National Development Conference was that Government should significantly increase the resources of the Department of Statistics, and do a study of what extra statistics were needed.
This led to the establishment of the Technical Committee on Statistics, which was mainly comprised of representatives of the main users of official statistics and senior staff of the Department of Statistics and chaired by the Government Statistician. It formulated a development plan for official statistics and the subsequent report was accepted by Government. This led to close to a 40% increase in staff for the Department, after the State Services Commission had conducted another review of official statistics to confirm the assessments of staffing and other resources required.
By this time, Jack Lewin had been appointed as Government Statistician, and he conceived the approach of bringing into the Department experienced public servants, mainly middle rung, with knowledge of general economic affairs and some demonstrated competence in handling data. They were mainly from departments like Inland Revenue, Industries and Commerce and Customs. It was still necessary to recruit for university mathematical statisticians and economists, for more specialised analytical work. Mr Lewin also succeeded in getting greatly improved gradings for departmental staff generally, which vastly improved the Department’s appeal as a public service employer.
The Labour Government of the time laid down the restriction that, although the Department could expand its resources, it was not allowed to increase the size of the Wellington office beyond its existing level. So it became necessary to consider how the Department’s work could be moved out of Wellington. Initially, a managerially decentralised system was considered, with the Wellington office doing national statistics and other offices doing regional statistics. After some consideration, this was rejected, and a dispersed system was adopted, with every office doing national work in particular subject matter areas. For example, the business surveys were undertaken from the Auckland office, and the Population and Dwelling Census work was based in Christchurch.

107
section in the Department. There were not many, if any, computer programming courses run by educational institutions, so it was necessary to canvass existing staff to find those with the aptitude for computer programming, and then send them to the vendors to learn programming.
In the late 1960s the Government became worried about the proliferation of computer installations in Government, with doubts about the ability of some departments to effectively use their equipment. So, in 1970, the Government Computer Center was established. Although there were financial arguments in favour of this approach, there were practical problems due to competing priorities and programmers not being familiar with the work of the departments they were servicing. The Department of Statistics argued strongly that the Consumer’s Price Index could be at risk from conflicting processing jobs of other departments, and managed to get a small ICL machine as a sop. The Government Computer Center machine allocated to the Department was also an ICL. According to Steve Kuzmicich, this was a seriously damaging feature of the Government Computer Center to the Department, as they thus lost all access to the standard statistical software then available from North America, all of which was IBM, and not ICL, compatible. And the Computer Centre did not always accord statistical processing the degree of priority in applications systems development that was needed by the Department.
In the late 1970s the Department got back its own IBM installation suitably upgraded, and were able to slowly wean all their work off the Center’s computers. Most of the original programming group had been lost to the Government Computer Center or private employment, so a programming group was reassembled. By this stage universities and polytechnics were producing trained programmers, but a difficulty was that they tended not to have any statistical background. In those days, before user-oriented data processing philosophies, communication between users and programmers was poor. As output became more complicated, misunderstandings occurred, technical features were not conveyed and allowed for in the programmes, and breakdowns in processing systems sometimes occurred with corresponding delays. However, Steve Kuzmicich believes that, despite these problems, the Department of Statistics was one of the few departments, if not the only department, which managed to avoid any serious catastrophes in data processing during the period from the 1960s to the 1990s.
Expansion of the DepartmentWhile still Assistant Government Statistician, Steve became a member of the Targets Committee of the 1969 Technical Committee of the National Development Conference. The National Government of the time were opposed to the economic philosophy of central planning, but adopted indicative planning, whereby sector groups would set targets for growth and restructuring and Government would

108
Steve Kuzmicich says, “I had to explain to him that there was very little parallel between the two. In fact I gave him the example which I thought was a fair one, that counting sheep compared with measuring New Zealand’s Balance of Payments was like comparing throwing a stone in the air with putting a man on the moon. The comparative complications were of that order of magnitude, if slightly exaggerated.”
In the new political and administrative environment there was immense pressure to apply the ‘Deane model’, by separating out the three different functions of the Department – its policy advisory role, the production of public-good statistics, and revenue generation. Steve considers it one of his greatest achievements as Government Statistician that, with the significant help of the then Minister of Statistics, Mrs Margaret Shields, this potentially disastrous restructuring was warded off and the Department retained its original form and functions.
International involvementThe United Nations (UN) undertakes a lot of technical work in statistics. A large part of this work is concerned with the development of standards for, and methodology of, official statistics. Steve Kuzmicich made it a goal to get New Zealand’s profile lifted, and have a more effective input in this work with gain to the Department of improved access to knowledge of technical statistical research and development.
Before becoming Government Statistician, Steve had started going to meetings of the Statistics Committee of the UN Economic and Social Commission for Asia and the Pacific (ESCAP), which met at their regional headquarters in Bangkok. And when New Zealand won a term as a member of the UN Statistical Commission, meeting in New York, he attended those meetings and was elected as Rapporteur, responsible for the reports of the Commission. Unfortunately, New Zealand was not elected for another term due to the system of membership rotation between countries, but Steve was able to continue attending the meetings as an observer and having input into the discussions. As was the experience of an earlier Government Statistician, John Baker, who was also UN Commission Rapporteur, Steve missed out on becoming Commission Statistician, the normal experience of the Rapporteur.
When Steve became Government Statistician, he managed to negotiate with Treasury a significantly increased travel vote, which meant that not just senior management, but also staff involved in technical development work, were able to travel overseas, attend conferences, and visit other overseas statistical agencies. Later, with the advent of bulk funding, overseas travel, except for that of the Government Statistician, was fully controlled by the Government Statistician.
There are fixed and variable costs in the development and production of official statistics. The fixed elements in the development costs of official statistics are a major burden for smaller countries. These benefit from the work of international bodies and larger countries. New Zealand has, through necessity, had to adopt

109
Reform of the public serviceThe reform of the public service in the mid-1980s aimed to make it more efficient and accountable, with chief executives losing tenure and being put on employment contracts, and with monitoring of performance in terms of output production. Funding arrangements changed, and the Department of Statistics became only partly Crown funded, with the balance to be made up by direct revenue.
Of the Department’s counterparts in the western world, Sweden had the highest commercial revenue target at the time, set at a level of 15% of their total expenditure. But it also had the right to undertake commercial market research surveys and political polls, unlike the NZ Department of Statistics. Steve Kuzmicich, recently appointed as Government Statistician, recommended 10% as an initial revenue target but, much to his dissatisfaction, the figure was set at 20%. Luckily, there was a five year transition period and, as it turned out, the business revenue rule was reinterpreted to mean that the Department didn’t have to achieve 20% of the total expenditure, but only had to keep within the net funding level, which involved restraint in total expenditure.
The Department had to develop rules about how it would produce revenue without compromising its key role of producing public-good statistics, and without restriction in user access. Foremost, it stipulated that public-good statistics should be funded by Crown revenue and not limited to those who could pay. In addition, there would be customised ad hoc statistics paid for by the users. There was a problem of user pays being quoted back at the Department by participants in the business surveys, in particular the annual census of agriculture, with some respondents sending the Department a bill for services along with their completed questionnaires. So the Department had to work hard to explain that there was a social contract, and that respondents would get all the public-good statistics free of charge. Ultimately, response rates were not affected.
One frustrating aspect of the new funding environment was that there was a constraint on total expenditure rather than total profit. That is, it was not possible to spend money to make money. This made it difficult when it became necessary to buy in professional marketing expertise, for example. So the Department had to become more efficient.
An added difficulty was the disappearance of some key administrative data sources. Removal of exchange controls badly affected the production of overseas balance of payments statistics. With no extra resource to initiate new surveys, but a continued requirement to produce balance of payments statistics, the Department was forced initially to make ‘informed estimates’ that led to some major revisions when they turned out to be wrong. Steve Kuzmicich suffered a lot of criticism in the news media and by Parliamentarians. One Backbencher, a sheep farmer, commented, “if I had the mistakes you’re making in measuring our balance of payments in counting my sheep, I’d give the shepherd the sack. Why shouldn’t we sack you?”

110
of the Association, and a number as Secretary-Treasurer.
Career after Government StatisticianAfter his term as Government Statistician ended in 1992, Steve Kuzmicich has worked as a casual consultant for the International Monetary Fund (IMF) and the World Bank. Working mainly in the republics of the former Soviet Union, he has been helping to develop international standard measures of inflation, helping implement the UN System of National Accounts, and conducting management reviews of statistical services. Working in such diverse and exotic capitals as Moscow, Hanoi, Dublin, Kiev, Riga, Almuty, Kuwait and Ashkhabad has been a stimulating and challenging experience he says, and he acknowledges that his New Zealand Department of Statistics training and experience had equipped him well in coping with statistical redevelopment problems in transition and developing economies.

111
a more pragmatic approach than larger countries, not indulging in too much theoretical analysis. The Department has been very successful in this balancing act and the results have often been highly successful. For example, the central register of businesses (now called the Business Frame) – which was initially developed very quickly in two years, rather than over decades as in some other countries – is now recognised as one of the best in the world. This proportionally high cost of development also means that there are significant benefits to the Department of getting and maintaining good contacts with overseas statistical agencies. As Steve says, “it was very good for us to have contact with these overseas statisticians because what we could learn by spending a fortnight with them in Ottawa might have taken us months or years to do in isolation here in New Zealand.”
Statistics Act 1975The Statistics Act 1955 was reviewed and, as a result, the Statistics Act 1975 was passed. One of the new provisions of this Act was that other Government Departments were no longer able to instigate new statistical series without the approval of the Minister of Statistics. There were two motivations behind this:
1 It enabled a rationalisation, or coordination, of data collection demands on the community, by ensuring that no department could embark on the public collection of data for a survey if the data were already available. The Act required the Department of Statistics to give a report on potential duplication to the Minister of Statistics before he or she gave approval to any department doing a statistical survey; and
2 The survey methodology was able to be vetted by the Department of Statistics, so minimum standards in survey work could be maintained.
Another feature of the 1975 Act was the introduction of a requirement for the Department of Statistics to periodically conduct formal reviews of users and suppliers of statistics in various subject matter areas. A very successful device, these reviews have resulted in publicly available reports, and have helped to ensure the continued relevance and usefulness of the statistics prepared by the Department.
New Zealand Statistical AssociationSteve Kuzmicich has served one of the longest terms on the committee of the New Zealand Statistical Association – 16 years. Five of those years were spent as President

112
Geoff Jowett (1922– ) Editor
The following is taken from the New Zealand Statistician 19 (2), November 1984
At the Association’s most recent Annual General Meeting Geoffrey Harcourt Jowett, Ph.D., F.S.S. was elected to honorary life membership of the Association. Dr Jowett first came to New Zealand in 1964; hence he did not have the opportunities for participation in the formative stages of the Association, in which the other two life members, Professor J.T. Campbell and Mr H.S. Roberts, played such distinguished parts, nor did he ever serve on the Executive Committee. Nonetheless, from the time of his arrival until his recent retirement in 1982, Dr Jowett has been one of the Association’s most active, well liked and respected members. During this time he has been particularly noted for the energy and tenacity with which he has furthered the wider recognition in New Zealand of the importance of statistical methods in science and industry, and the hard work and resourcefulness he has brought to the task of developing means to cater for the educational demands arising in consequence.
Dr Jowett had no formal training in statistics, but became involved in it as a result of the war. On completing a first class honours degree in mathematics at King’s College London in 1943, he was directed into a mysterious section S.R.17 of the Ministry of Supply, where he found himself in the company of several other mathematics graduates, most of whom were as ignorant of statistics as he was. The job proved to be to learn statistics from books and one another and then go out into the armaments factories to do statistical trouble shooting and install control charts and sampling inspection schemes. When the section broke up at the end of the war and its members distributed themselves among industry and the Universities to spread the statistical gospel, Dr Jowett moved to Sheffield, working for the United Steel Companies Ltd as part of a small team which was given two years to justify its existence. At this time he became involved with the Sheffield group of the Royal Statistical Society, serving for several years as secretary and helping to establish the journal ‘Applied Statistics’ (now Series C). The steel industry produced some interesting problems of designing statistical analyses for serially correlated data, which became his major research interest, and which was later to form the topic for his Ph.D.
His first academic job came when he approached the Mathematics Department at the University of Sheffield with an offer to give a few lectures on statistics and was promptly offered an opportunity to join the Department fulltime. The job was an
113
assistant lectureship, the brief to lay on three courses: one for mathematics students, one for economics students, and one for interested members of staff. Residual time was to be filled in with research and consulting help to other departments. Although kept very busy, particularly by medical staff, he managed to retain contact with industry, and by the time he left Sheffield for Melbourne twelve years later the assistant lectureship had become the United Steel Companies Senior Lectureship in charge of a separate Department of Statistics which had grown up under his leadership. During this time he had also been instrumental in setting the first G.C.E. papers in statistics in the joint Matriculation Board’s mathematics subjects, foreshadowing future activities in both Australia and New Zealand.
At the University of Melbourne, although there was a well established Department of Statistics under Professor M.H. Belz with its own honours degree, it was still a matter of helping to get things going, notably courses in operational research and, for a second time, statistics in schools. Once again there as an emphasis on consulting, notably in mining exploration and again in medicine which continued to supply the stimulus of serially and spatially correlated data.
In 1964 Dr Jowett was appointed to the newly established chair of statistics in the Department of Mathematics at the University of Otago, with the brief of initiating and developing courses in Statistics. At Otago he set about the work for which he is perhaps most widely known within New Zealand. Simultaneously with a substantial programme of statistics courses for the Mathematics degree, he began to set up courses in statistical methods for students in other Departments. In this he had the assistance and collaboration of Mr Tom Robertson, who joined him from the Department of Agriculture in 1965 and also of M George Spears, the consulting statistician to the Medical Faculty. They introduced large numbers of students who thought they had finished with mathematics at school certificate to basic statistical concepts, using an experimental approach and carefully thought out analogies for sophisticated concepts. At the suggestion of Dr Robin L. Williams, a post graduate diploma course was set up, with an integrated programme of statistics and computer science courses so that those who discovered the need for statistical skills on the job could return and acquire them. At the same time, he was working with Mr H.S. (Stan) Roberts to have statistics included as part of the school mathematics syllabus. The heavy work load generated by these pioneering activities, coupled with chronic staff shortages in the Department which involved him in much administration and even (in emergencies) in such things as teaching first-year hydrostatics and second-year calculus, unfortunately left Dr Jowett little peace to pursue his research interests, or to add to his impressive list of published work, amounting at that time to about fifty papers.
In 1972 Dr Jowett left Otago University to join the Ministry of Agriculture and Fisheries as a biometrician at Invermay Agricultural Research Station. Here for a short time he was able to enjoy working purely as a consultant statistician, but rapidly the

114
demand for statistical expertise reached a point where it became apparent that the only way to avoid being completely swamped was to involve scientists in the statistical analysis and computing of their own data. Tackling this problem led to another major exercise in education. The story goes that he solved the problem of the scientists’ instinctive lack of confidence with computers by setting up computer terminals as word processors for the typists. Seeing the typists rattling away on the dread computers, the scientists soon lost their inhibitions.
Many members of the New Zealand Statistical Association will have attended one of Dr Jowett’s entertaining and original conference papers, for which he was well known and which were much looked forward to. Among his colleagues, he is noted for his acumen in formulating the statistical issues underlying a practical problem, his ingenuity in devising ways of dealing with them, and his clear appreciation of the difference between the approximate and the unsound.
Government Statistician Len Cook comments on what it was like having Geoff Jowett as a lecturer:Learning statistics with Geoff Jowett was as interactive and engaging an experience as a university could achieve, for those of us in the seven or eight cohorts of statisticians of the Jowett years at Otago.
Professor Geoff Jowett has a wonderful way of emanating wisdom without the recipient feeling diminished by the experience. This underpinned the insights we all got out of measuring leaves, water levels and traffic counts as we were taught an understanding of statistical inference through observation, analysis and conclusion. We were engaged in the entire process of analysis.
We learnt also of operations research, manual calculating machines, computing, communications, international literature and research, patience and humour.
Geoff Jowett taught as a crusader not only for the practical application of good scientific method, but also for enthusiastic engagement in practical and important problems, building up to a wide ranging and numerate community.
As students, we thought we were smart, quick off the mark, bright young things, but most still learnt our first listening skills, and how to focus our curiosity from both insight and analysis, off Geoff Jowett.
It was only after we left Otago that I appreciated the full depth of Geoff Jowett’s impact on statistics education, through friends who became teachers and whose keenness for statistics was enriched by his holiday programmes for school teachers, along with Stan Roberts, for more than a decade. The guitar and song were as much a part of the Jowett armoury as matrix inversions.
Over 25 years since Geoff Jowett left Otago, there exists still an immediate bond, a sense of common appreciation of statistics, statistical thinking, curiosity, pleasure and ethics amongst the Jowett cohorts. We know well what a special start we had from this

115
very gifted man, and wonderful personality.

116
other things, ‘social arithmetic’ which was defined as the application of arithmetic to domestic, economic and civic conditions of life, and called for activities such as shopping games, scoring games, weighing parcels and estimating postage; and compiling tables and graphs of various kinds. The aim was to “familiarise pupils with ideas and processes that will enter into their daily lives, rather than to give practice in computation.”
In the same Gazette, an anonymous author, describing some of the ideas which had already been put into practice, said: “It was quite in keeping with the nature of the Headmaster’s theory and practice in arithmetic, for a well-thumbed copy of the official Year-Book to be lying on one of the shelves of the Form II room. Now for those who like to let the imagination play around solid realities the Year-Book is a fascinating volume. He who reads will discover, among other striking facts, that New Zealanders need over five million pair of boots and shoes annually, that half a dozen people die of scarlet fever every year … Furthermore the pages of sober reports, analysed and synthesised statistics, put the everyday into its right perspective … Using household expenditure percentages given in the Year-Book, the children were working out how far a pound goes in the average New Zealand home, showing what proportion pays for food, housing, clothing, light and fuel, and what for miscellaneous needs. The interpreting of this graph paves the way for study of graphs in general, said the Headmaster, and he was able to point to simple pictorial graphs drawn to compare the lengths of rivers, the heights of our mountains, the shift of population over the last eighty years and so forth.”
There was, thus, a gradual shift away from computational accuracy, and towards such aspects as estimation, and the study of tables and graphs. For example, in the Form 1 Arithmetic Syllabus for 1943:
Mechanical Operations — Especially in exercises involving relatively complex mechanical operations full use should be made of methods of approximation by inspection and of checking for accuracy.
This was repeated in the Form 2 Syllabus, with the addition of “The estimation of averages.” Further, in the Form 2 syllabus:
It must be clearly understood, that the main aim of this part of the programme is to familiarise pupils with ideas and processes that will enter into their daily lives … interpretation of tables — construction and interpretation of time-charts, of linear and bar graphs, and picture statistics, treated largely in social studies and art lessons; distribution tables and graphs may be introduced at first with simple data – eg heights, weights, school marks.
A final comment from the 1943 revision:

117
chapter 3
EducationPrimary SchoolsEditor
In the late nineteenth century, Arithmetic, besides having obvious practical uses, was held to have special value as a means of exercising and strengthening the reasoning powers. However, in order to achieve such strengthening, a marked emphasis was laid on mechanical accuracy and the learning of multiplication tables, although these tables were learnt by ear, not by understanding. In 1923, the New Zealand Educational Institute urged the elimination, from the syllabus, of material that had no obvious relation to ‘some real need of life’, or ‘that was outside children’s comprehension’. Criticising existing practice, the Institute quoted the following as examples of sums that pupils, just promoted to Standard 5, were expected to do: £3,986.10.3 ½ × 769; How many square inches in 739 acres, 482 square yards, 289 square feet, 67 square inches? (Note that these calculations would have to be done either with pencil and paper, or on a slate.)
In 1926 a Syllabus Revision Committee was set up by the Department of Education and devised a new syllabus which tended to move away from the very formal aspects of teaching; for example, the prescription for the Standard 6 syllabus included “Estimation of answers to problems” (Education Gazette April 1, 1926, p 49).
Two years later the syllabus was further revised. A new syllabus was published in 1928, known as ‘The Red Book’, and officially gazetted the following year. The Standard 7 prescription included “Graphical Arithmetic: Extension of work of Standard VI”, including thermographs, bar graphs and simple statistical graphs of different kinds, among others. (p 27)
Over the following years it was found that the 1928 prescription made excessive demands on children of ordinary ability, especially after the abolition of the proficiency examination (in 1936), when less time was allocated to arithmetic. Other activities also claimed a greater share of the school day. A revised syllabus was published in the Education Gazette, 2 August 1943, shortly after Dr C E Beeby had become Director of Education. In the introduction to the section “Primary School Arithmetic” it stated: “By making mechanical proficiency the end, said the critics, the schools had destroyed the reality of arithmetic and had carried it as far away from everyday life as higher mathematics.” (p 171).
The new syllabus (Education Gazette 2 August 1943, pp 180-5) introduced, among

118
In the school curriculum of the present-day subject walls are breaking down, and arithmetic cannot be maintained in the peculiar position of isolation it has hitherto occupied. To vitalise the teaching of arithmetic there must be closer association not only with the realities of life, but also with other phases of the curriculum.
Then in 1967, New Zealand changed to decimal currency and introduced a metric system of weights and measures. This necessitated a very large change in the teaching of arithmetic. New syllabuses and new text books were required, especially in the Primary schools, with special emphasis on decimal currency. In 1969 the Education Department brought out two new syllabuses for Mathematics – Infants to Standard 4, and Forms 1 to 4. Elementary statistics was included in both of these. One section of the syllabus was headed:
Mathematical Idea: GRAPHS
Infant Classes:Using blocks and charts to give a picture of observations and events.
Standard 1:1 Continuation of the work of the infant classes and extension to making written records.2 Oral discussion based on a study of graphs which have been made by children.
The ideas in the Syllabus gradually increased to
Standard 4: Graphs, Statistics, and Probability1 Further study of data to establish the range, the average, the mode and the median.
Preparation of tables, linear graphs, bar graphs, and double bar graphs.2 The meaning of probability as illustrated by sets and subsets.3 Study of the probability of two mutually exclusive events.
The above information was gained from:J L Ewing The Development of the New Zealand Primary School Curriculum 1877-1970, New
Zealand Council for Educational Research, 1970, pp 72,170-1,180Department of Education Syllabus of Instruction for Public Schools, 1928, pp 5-6,
17-30 (“Red Book”)The Education Gazette 2nd August 1943 pp 180-185

119
Post Primary SchoolsEditor
The secondary school syllabus at that time, consisted of a number of ‘core’ subjects for the third and fourth forms, which were compulsory for all students. A Report of a 1942 Consultative Committee stated, in a section headed “Elementary Mathematics”: “There should be extensive inter-relation of Mathematics with other subjects, as, for example, in the use of numerical and graphical methods to solve problems arising in Science, Social Studies, Homecraft, and Workshop Activities. Much of the arithmetic should be of a social and informational character, drawing its data from daily life in the home and at work, and from the newspaper, the Official Year-Book etc. (p 39)” Under this section is a topic titled “Graphs of statistics”, but without further comment, but whereas in the section labelled “Mathematics”, no mention is made of statistics at all.
Two years later, in 1944, another Consultative Committee was set up “to evolve plans for converting a School Certificate, for the fifth form, introduced in 1935 but soon discredited, into a qualification which the community would recognise as testifying to the satisfactory completion of three or four years secondary education by pupils of varying abilities and interests.” (J L Ewing, Development of the New Zealand Primary School Curriculum 1877-1970, p 206.) This became known as the Thomas Report. (W Thomas was Rector of Timaru Boys’ High School, and Chairman of the Committee.) In 1945, new Regulations of Instruction and Prescription for the School Certificate Examination were published by the Education Department. The new mathematics syllabus included “Graphs of Statistics, interpolation”.
The new School Certificate examination began the following year. For the next several years the questions were concerned with mean, median, mode, range, and quartile deviation. Max Riske, a Wellington secondary school teacher, compiled a booklet of School Certificate Mathematics Papers, from 1946 to 1959 (Whitcombe & Tombs, 1957), giving a number of examples of questions set in those years. One such example (1946) was:
In an examination 27 candidates totalled 1,296 marks. When arranged in order of merit it was found that the first candidate got 95, the seventh 55, the fourteenth 50, the twenty-first 45, and the poorest 10 marks. Find the average mark and the quartile deviation.
In 1948, and again in 1954, the School Publications Branch of the Education Department published two Post-Primary Bulletins, both by H Henderson, Superintendent of Education, Auckland and both entitled “Statistics” — Vol 2(2) and

120
member to give a lecture, and I (the Editor) was chosen. My talk was concerned with the nature of statistics and the importance of including it in the formal mathematics curriculum, without going into precise details as to how it should fit into the curriculum. Professor Geoff Jowett from Otago University, was actually not invited to attend, but nevertheless had a paper read by another member of his Department. Jowett’s paper offered a complete package deal, based partly on his overseas experience, and partly on his discussions with local teachers. It offered: (1) Syllabuses for lower and upper sixth forms, with notes on their interpretation; (2) Specimen questions with model answers and marking schemes; (3) Experiments suitable for class projects or demonstrations; and (4) A way of exploiting the current situation to bring the subject in gradually, with minimal trauma to teachers who had little or no knowledge of the subject.
At this time, the University Entrance examination had an optional subject, UE Mechanics, which had very few takers and Jowett’s suggestion that it be changed into UE Applied Mathematics, with part of the paper being dedicated to statistics, was favourably received. Over the next few years, Jowett ran a number of vacation courses for teachers, and demonstrated a number of statistical aids to understanding, e.g., sampling bottles, distribution generators, etc. The main text used for these courses was an Australian book entitled General Mathematics, by J B Fitzpatrick, Jacaranda Press, 1965, Chapters 22-28.
It was necessary to have the follow through to Bursary level in place in time for the 1969 Bursaries Handbook, and so a last moment meeting was arranged for 11 April 1968. The weather was awful; aircraft were grounded, the Wahine sank, and several members could not get to it. Unfortunately, these members were the ones knowledgeable about the statistics part, and so the syllabus went ahead without new topics in statistics but just a fuller treatment of the old ones. A new subject, UE Applied Mathematics, was formally introduced and examined in 1968. Since it was the practice to let syllabuses run for a few years, it was not until the ‘new’ Alternative Mathematics appeared in 1971 that the suggested Upper Sixth syllabus was fully implemented with its additional topics as part of what was thenceforward named Additional Mathematics.
This was the turning point for statistics being introduced into the Secondary syllabus. I myself visited a number of schools and mathematical associations, demonstrating various teaching techniques, and gathering information as to the best method of presenting statistics as a subject in its own right.
In the early 1970s, the Department of Education brought out a new syllabus for Forms 1 to 4 (in addition to the Primary Syllabus already referred to earlier). In this, a new section entitled “Probability and Statistics” was introduced for Form 1. Probability was set out under four headings: (a) a ratio by the selection of a subset from a set, eg the probability of selecting a black card from a pack of cards; (b) zero
121
Vol 8(2). (A class set of every such Bulletin was sent to every Secondary School in the country.) In both these Bulletins, Henderson constantly stressed the need to relate statistics to real life situations. In 1948, he states: “Statistics are constantly being used by scientists, economists, government officials, and others, and directly or indirectly our lives are affected by the conclusions drawn from them … The purpose of simple statistics is to present arithmetical facts in tabular, graphical or pictorial form so that useful conclusions may be drawn from such facts.” In 1954 he commented: “Every citizen is faced with statistics in his daily reading … Newspapers abound with articles dealing with such matters as progress in the building of houses, of schools, of hospitals, figures dealing with the number of miles of new roads built and old roads sealed, of increases or decreases in the production of wool, butterfat and a thousand other commodities … Statistics has in fact become a part of every civilised person’s mental equipment.” He introduces many statistical terms such as histogram, frequency polygon, cumulative frequency, mean, median, mode, variability, quartile, range, sampling, central tendency, and various types of distributions. The Bulletins are very well illustrated with graphs, tables, charts, and have many worthwhile exercises.
There is always a certain amount of resistance to the introduction of new techniques. J H Murdoch (“The Teaching of Mathematics in Post-Primary Schools”, NZCER 12–1950), while discussing the statistics content of the School Certificate Mathematics, commented: “A pupil who leaves after even one year of secondary school mathematics should, in this respect, have learned something of value. Just how far this work should go at the School Certificate stage, however, is doubtful. While some introduction to very elementary pictorial, diagrammatic, and graphical work is possible and desirable with core pupils, the further elaboration of this work raises ticklish problems. Statistical work is deceptive and dangerous, full of snares for the ignorant and the unwary; and superficial knowledge may expose its owner to dangers that do not exist for the completely ignorant. The introduction of the work depends largely for its justification on the use made of by social studies, science, and geography teachers in their ordinary classroom work. That is its natural milieu; elsewhere it fits awkwardly into existing mathematical schemes.”
During the 1950s and 1960s, mathematics was beginning to move away from the more formal ideas of earlier mathematics, such as Euclidean geometry with its formal, deductive proofs; and introducing topics such as matrices, groups, sets, transformations, etc, and looking at numbers as Patterns rather than at numbers in isolation. The mathematical teaching world was in a ferment — some teachers wanting quick changes and others taking a more conservative position. It was felt by some that statistics should be included in the syllabus, but at the same time it was realised that most teachers were not trained in the subject.
In 1964 a secondary school teachers’ conference on ‘The New Maths’, was held at Titirangi, in Auckland. The New Zealand Statistical Association was invited to send a
122
and one as probabilities; (c) two mutually exclusive events; and (d) two independent events happening at the same time. Statistics consisted of: (a) collecting data; (b) bar and line graphs; (c) range, mean, median, mode; and (d) the interpretation of results. By the time the student arrived at Form 4, the syllabus was extended to: (a) frequency distributions and descriptive statistics; (b) simple introduction to normal probability distribution; (c) probability of an event; and (d) complementary events.
In 1974 I produced a third statistical Bulletin (Vol 17(5)), for the Education Department entitled “Social Statistics”. In this I emphasised, as Henderson had also done, that the main aim of statistics was not just the clear presentation of numerical material, although that in itself was very necessary, but that it was the drawing of conclusions about that material. It generally followed the pattern of Henderson’s Bulletins, but included new chapters on Probability, Relationships, and Drawing Conclusions. These Bulletins were sent out to schools, and while my Bulletin usually finished up in the Maths Department, in one school at least, it was put into the library of the Social Studies Department. To me it showed that statistics was at last finding its rightful place in the schools.
By 1981 statistics was clearly becoming a part of the secondary school syllabus. The School Certificate Examination 1981 on “Mathematics” included one statistical question, which was compulsory and worth 9 out of 100 marks. The question related to the drawing of conclusions from a histogram and a question on probability was also given — “What is the probability of a four figure telephone number ending in 2, 5, or 8?” In 1986, an examination specifically on statistics and probability was introduced into the University Bursary course. This included linear regression, probability (including binomial and poisson), confidence intervals, and hypothesis testing. (Note, for more recent developments, see Chapter 5, Education. Statistical Association.)
123
PolytechnicHans (John) Offenberger, Head of School of Mathematics and Science, Wellington Polytechnic 1957-1983
Oral and anecdotal history can assist the historian who tries to explain past events by reconstructing situations from documents alone. Such evidence, when critically assessed, may help to formulate, modify, or rule out the assumptions on which the interpretation is based. Following are some personal reminiscences of my teaching of statistics in Technical Education.
Early stirringsMy story begins in the late 1940s when my daughter was a baby. My wife came back from her weekly visit to the Plunket-Rooms with an account of a pecking order that had sprung up among the young mothers. The Plunket book, in which the baby’s weight was recorded week by week as a graph, contained a line indicating the weight of a ‘normal’ baby, representing the average weights for given ages. Young mothers whose babies were above average, looked smugly down on those others, who, full of shame, had to admit that theirs was below average.
Graphs of data were rarely covered in secondary schools; statistics was not part of the curriculum. An average was calculated by “adding them all up and dividing by their number”. As a young, inexperienced teacher at what was then the Wellington Technical College, I had some fifth form girls for arithmetic. They were bored with ratios and proportions applied to recipes, curtain calculations, and household budgets. With the permission of the Head of the Department – easily obtained as they were not examination students, I introduced them to graphs and central measures via my Plunket book story. Before long I had their interest and could follow this up by graphing and interpreting census data. From then on, a little on graphs and statistics made its way into some non-examinable mathematics classes. A few years later I was asked to write a new syllabus for the New Zealand Chamber of Commerce, in a subject called ‘Arithmetic’, at the fourth form level. I was able to introduce ‘bar graphs’, ‘broken line graphs’, and their interpretation. Candidates were expected to recognise seasonal fluctations, eg from a graph of monthly volumes of sales of ice-cream plotted over three or four years. By the early 1960s there were a few thousand candidates for this examination each year.
Night school classes in statistics, for public servants, began in 1949. I believe the syllabus was laid down, in some detail, by the Department of Statistics and was designed to prepare public servants for some internal examinations. It covered
124
a production control problem solved for the Amalgamated Brick and Pipe Co of New Lynn. In this latter case, production of rejects was significantly lowered by the application of factorial design to obtain optimum settings of existing machinery. The punch line was delivered in the discussion that followed – the company doubled its dividend within a year.
Statistics teaching at Wellington Technical CollegeThe follow up to this conference was the introduction of courses on statistical method at Wellington Technical College, and their continuation at Wellington Polytechnic. The choice of teacher was important. It had to be someone with first hand, practical knowledge of the subject who could make students feel confident they were learning something applicable to their jobs, and who was a gifted teacher. Phil Armstrong, who had formerly worked with the Applied Mathematics Laboratory, was the first to develop the course. Although the aim was to train people in industry and commerce, the students from that section were few. They came from the meat industry and various Government departments, with others from research areas – biologists, veterinarians, and psychologists etc. They all had one thing in common – they needed training in statistics, and this was the only way that tuition could be obtained at that time.
A teaching problem arose in two ways. Firstly, the mathematical background of the students varied from barely having School Certificate Mathematics to University degrees. Secondly, their jobs varied from the gathering of statistical data to designing experiments or surveys, or to designing optimisation systems (eg for the overseas meat trade). Such a class, non-homogeneous in background and in learning aims, could not be taught in traditional ways. In 1962 the Wellington Polytechnic split off from the Wellington Technical College, and Phil Armstrong moved to become a lecturer at the Wellington Teachers’ Training College.
Programmed teaching at Wellington PolytechnicThe next significant development was the work of Pat Bruce, who tackled the problem by what he called ‘Programmed Teaching’. The role of the teacher was to write the courses in such a way that every student could proceed at his or her own pace, following an individualised programme, in keeping with the specific needs of the student with respect to subject matter. The teaching units were by no means static once they had been written. They were constantly written, improved, and rewritten, with new topics added. Striving for perfection, he continued the process over many years. As computing technology changed to programmable calculators and computers, he was able to extend the range and depth of statistical ideas. Students could join the course at any time and take a flexible number of hours per week, working at their own speed. The tutor was always at hand to help with difficulties until the student had
125
graphical representation of statistical data, mean, median, mode, and semi inter-quartile range of discrete and grouped data. There were no aids to calculation, therefore examples to illustrate principles were based on contrived and artificial data in order to minimise the drudgery. Time series were studied graphically and by the use of moving averages. The course was taught by a part time teacher who, as an employee of the Department of Statistics, had first hand knowledge of the subject. The course was discontinued after a few years.
Changes in the 1950sImportant changes in the attitude and policy in technical education foreshadowed the establishment of the technical institute system. ‘Daylight’ training of apprentices had become accepted, and employers generally realised that it was to their benefit to allow staff to attend daytime classes on full pay. Gradually, technical colleges began to liaise with industry and commerce in order to identify training needs and to establish classes and training programmes to fill the gaps. The resulting expansion was underwritten by the Education Department. New teaching staff was recruited with experience in industry or research. The attention was focussed on technician teaching, which had previously been a haphazard process. The controlling authority for the New Zealand Certificate in Engineering (NZCE) was established in 1954. Later, its function widened to become the Technicians’ Certification Authority (TCA), to be succeeded, with wider functions still, by the Authority for Advanced Vocational Awards (AAVA). It was these changes that made subsequent developments of statistics teaching possible, locally at the Wellington Technical College at Wellington Polytechnic, and then nationally at the various technical institutes.
1959 Conference on Operational ResearchThrough personal contact with the Applied Mathematics Laboratory, I became aware of a need to disseminate to management in industry something of the power of statistical methods when applied to practical situations. A number of success stories of recent applications of Operational Research (OR) and statistical techniques provided an opportunity. I enlisted the help of the Head of Department of Commerce (the late Jack Murphy) who, in turn, obtained the sponsorship of the New Zealand Institute of Management to run a special Conference on Operational Research.
The speakers were Ian Dick, Bob Williams, Hamish Thompson of AMD, and Ken Seal of Ceramco Ltd (see Appendix). They were able to convey, in non-technical language, what OR techniques were, what they could do, and most importantly, they could point to cases where they had been successfully applied in New Zealand. One was an Airline Reservation Control method to achieve optimum occupancy that had been developed for Tasman Empire Airways (TEAL). The other example dealt with

126
fields in other sciences, commerce, engineering, and government, and there is a unity of statistical method despite the diversity of applications, ranging from agriculture to auditing, manufacturing to medicine and military intelligence. It is therefore recommended that the course structure be designed to contain a common core of subjects of a general nature. Those engaged in statistics must have an appreciation of the field to which statistics is applied, and they must be able to communicate with those working in that field. Hence it is recommended that the Technician’s course allow for a choice of peripheral subjects. The Technician, who will be directed by a professional, should be able to carry out tasks without constant supervision. He must be aware of the limitation of the techniques and the practical methods he is applying, and he must be able to recognise problems which require the attention of the professional. Hence his training in the theory of statistics will have to be of sufficient depth to include some mathematical statistics, though the course as a whole will be directed mainly toward techniques and skills. Statistics inevitably deals with data, and the Technician must have the necessary skills to collect these, organise and present them in a form required by the professional. He must be able to deal reliably with computations. Hence the inclusion of a study of numerical methods, computing on desk calculators, and electronic data processing. A holder of a NZC Statistics should be a useful assistant to a professional statistician in any field, be it in science, commerce, engineering, or government. Hence the course should be general and broad.
The New Zealand Certificate in StatisticsThe New Zealand Statistical Association conducted a survey of demand, and having found that it would be small but significant, the TCA accepted its evidence, and by 1968 the TCA had approved the New Zealand Certificate in Statistics. The subject Elements of Statistics superseded Laboratory Mathematics, and became widely taught in New Zealand Science courses. Applied Statistics I, the next stage, became part of the NZCS (Biology). At the request of the Department of Statistics, the course structure of NZC Statistics was modified in order to accommodate Social and Economic statistics. For some reason the staffing at technician level of that department never reached the intended number and, as a consequence, the subject was taught only once before it became defunct. While the number of New Zealand Certificates in Statistics has remained small, the availability of statistical subjects helped to spread their use to other certificate courses.
The New Zealand Certificate in Data ProcessingThe New Zealand Computer Society initiated a New Zealand Certificate in Data Processing (NZCPD) which shared many subjects with the New Zealand Statistics course, and had a similar general structure. Teaching began in 1974. Full-term students had the option to complete either certificate. However, once they found employment in EDP, they rarely had employer support to complete their studies. Private sector employers in particular were not keen to allow time off for studies, and for quite some time anomalies existed in the State Sector as well. Initially, students who wanted to complete an NZC Statistics or NZC Data Processing, were not given study leave on

127
mastered each topic of their choice. At the end of the course a Wellington Polytechnic Certificate was issued, listing the topics completed. The programme ran from the 1960s into the early 1990s.
Statistics in the technical institutesWhen the TCA extended technician training, national syllabuses were established with a statistical content and these were then taught at many of the newly established technical institutes. The first of these was Laboratory Mathematics in 1961, as a subject of the course leading to a New Zealand Certificate in Science or NZCS (Chemistry). This was later modified and replaced by Elements of Statistics, in order to serve other options; later still, it became Statistics.
In 1963 the subject Experimental Mathematics was examined for the first time as a subject for the NZCS (Physics). It had a substantial section dealing with statistics. That year there were only eight students and it was taught only at Wellington Polytechnic. What was significant, however, was that it served to demonstrate the need for electromechanical calculators in the classroom. I recall having to defend a case for their introduction at a meeting of top level Education Department officials, who had to be convinced that numerical mathematics and statistics required more than the traditional pencil and paper, and that the slide rule was not the right equipment for summations. Initially, one machine was approved at a cost of £428 ($856). While it took a number of years to obtain a full class set of 16 machines, the policy was eventually accepted. When technology changed, electronic desk calculators were issued to replace them. Other national examining boards began to prescribe statistical subjects which then became available at various technical institutes, for example, Quantitative Techniques (New Zealand Society of Accountants), Quantitative Methods (New Zealand Institute of Management), and Statistics (New Zealand Institute of Transport).
The coming of the computerElectronic Data Processing (EDP) made its entry into New Zealand in 1961 when the Treasury obtained its computer. At the request of the State Services Commission, Wellington Polytechnic began programming courses in 1963, primarily for state employees. Soon the demand for programmers increased, and one-year courses for school leavers were planned for 1966. It was thought that school leavers required greater depth and variety than was offered in the twelve week block courses to which students were recruited. Subjects such as accounting, economics, and statistics were thought to be suitable additions. It was then that the New Zealand Statistical Association came up with the idea of a New Zealand Certificate in Statistics.Their proposal to the TCA was much wider:
The science of statistics is a branch of mathematics, and as with the other branches the reasoning is essentially independent of the field to which it is applied. Statistics finds applications to diverse

128
the same scale as students aiming at an NZCE. Nor were they given the same salary and other career advantages as holders of longer-established certificates in engineering or science. This proved to be an impediment to the ultimate success of either course and to their acceptance by private industry.
Revision of New Zealand Certificate in StatisticsVery few students proceeded beyond Stage 3 of either certificate. Computer technology had changed rapidly since either course had been designed, and so had the approach to statistics. It was time to look at the two closely connected courses leading to the NZC Statistics and the NZCDP, to sample employer demands, and examine possible consequences. Work began in 1979 and continued until 1985. There were meetings with the Government Statistician and with the State Services Commission in 1982 to discuss the need for revision and reorientation of the NZC Statistics, in order to clarify the way in which users of statistical personnel wanted change.
In 1985 a complete revision began. The group charged with the revision affirmed the initial intention of the Certificate as stated in the above quoted letter by the New Zealand Statistical Association. The outcome was a re-named New Zealand Certificate in Science (Statistics). Also renamed were the core courses at stages 3, 4,and 5 – all called Statistics – with a complete updating in approach and content. These courses influenced other Polytechnic courses, such as the Statistics courses for Business Computing and the National Diploma in Business. They helped to set Polytechnic statistical education in a direction which involved the use of available software, the use of graphs, and awareness of the real features of the data. The new prescriptions were all available for introduction from 1986. Much work was done by the members of the Prescription Revision Committee, and much aid was given by the staff of the Applied Mathematics Division (DSIR) in organising and running a course for Technical Institute tutors, in order to convey to them the new approaches implicit in the revision.


131
UniversitiesEditor
Note: This section of the history on universities in New Zealand makes no claim to be definitive. To do so would need an intensive study of all university departments likely to be running courses in statistics, inclusive of staff meetings, term tests, optional and unrecorded lectures etc, outside that given in the College Calendars, from the late nineteenth century onwards. The following information has been taken from the various Calendars, the Examination Papers of the University of New Zealand (which were set until 1961), and from personal letters from former students and lecturers. However, I believe that the following shows a generally true picture of the subject as taught within the New Zealand university system.
Beginnings of the New Zealand universitiesThe University of New Zealand was founded by the passing of an Act of the General Assembly that became law on 13 September 1870.
This university was almost an abstraction. It was, as concretely as one may define it, an office, the function of which was to arrange the examination of candidates for degrees. This function was superintended by a Senate, which included in its number, a small minority of working professors, but was otherwise ‘lay’ — that is, although some or most of its members might have received a university education, they had no connection with university teaching or students except the administrative one. But the function tended to greater and greater complexity, because the examination involved the definition of courses, and the Senate, meeting normally only once a year, therefore determined a great deal of the essential life of the colleges, and perforce determined it often in a casual way … There was no organic connection between this ‘University’ and the colleges which were simply ‘affiliated’ to it, tied externally by the statute of 1874. (The University, after much scuffling and a certain measure of backstairs intrigue, was set up under an Act of Parliament of 1874 on the ruins of another Act of Parliament of 1870). The governing bodies of the colleges had no connection with the governing body of the ‘University’. University teaching, university life, in any intelligible sense, existed only in the four colleges. Here, in the fundamental faculties of arts and science, and largely in law, professors and lecturers taught, or were supposed to teach, according to a syllabus imposed on them from outside — ie drawn up by the Senate — and their students were examined by examiners appointed from outside — ie by the Senate — and resident mainly in Great Britain. The teacher ignored the requirements of the system at his peril. If he did not ‘get his students through’ their examinations he would be unpopular, and whatever he knew about his subject, however brilliant his mind or profound his originality, however painstaking his philosophy, nothing could alter that fundamental fact.
J C Beaglehole, Victoria University College, New Zealand University Press, 1949, p 4 and pp 132-133

132
of a degree course until the early 1950s. This occurred at Auckland, Canterbury, and Otago, ten years later at Victoria, and shortly afterwards at Massey.
This late start of the Mathematics departments seems to follow the historical development of statistics. The collection and recording of data began in the ancient past when, for example, observations were made and recorded of the movements of the stars, the rise and fall of the Nile. In the medieval past, records were taken of the number of deaths due to the plague, warfare, and of various financial disasters. Again, in the sixteenth and seventeenth centuries, merchants would insure against the loss of ships at sea, and both they and their insurers must have carefully examined the frequency of such losses, and calculated their expectations without the help of any advanced probability theory. Mathematics seemed to play little part in the development of statistics until Pascal’s work on probability in the seventeenth century or until that of LaPlace and Gauss in the eighteenth and nineteenth centuries.
CommerceThe first examination in Statistics counting towards a University degree, was in 1907, for the “Bachelor of Commerce — Second Examination”. The examiner was A L Bowley, a Lecturer (later Professor) in Statistics at the London School of Economics and Political Science. His book Elements of Statistics was published in 1901. It was based on lectures he gave at the London School in the five years following its foundation in 1895. He defined statistics as “The Science of Counting”, but distinguished it from arithmetic in that “whereas arithmetic attains exactness, statistics deals with estimates”. He claimed that: “There seems to be no text book in English dealing directly and completely with the common methods of statistics [and] there is no compact statement of principles acknowledged by statisticians of the methods common to most branches of statistical work, of the artifices developed for handling and simplifying the raw material, and of the mathematical theorems by the use of which the results of investigations may be interpreted.” Also, “the most important results of the Theory of Error have been obtained without the use of the Differential or Integral Calculus, and it is hoped that the greater part even of the chapter on Correlation will be intelligible to those who are not so well equipped as the Major-General in the ‘Pirates of Penzance’.”
The examples given to illustrate statistical methods are the censuses of Population and Wage, with references to the Labour Department and Foreign Trade. The ‘Law of Error’ is developed as an approximation to the Binomial Distribution. There is no Hypothesis Testing. Because of its historical importance, the examination paper is set out in full.
Note: It is not easy to sort out the various stages at which courses on statistics were given, especially in the early years. At times the same course appears to be given for the various degrees and diplomas, either in the Arts or Commerce faculties.
133
However, prior to the foundation of the University of New Zealand, the Provincial Council of Otago had already passed, in June 1869, the Otago University Ordinance creating the University of Otago as a corporate body with power to grant degrees in arts, medicine, and music. Not to be outdone, Canterbury moved to establish a ‘Collegiate Union’ which was granted affiliation to the University of New Zealand in April 1872. Ten years later, the Auckland University College Act was passed, as was a similar Act for Victoria in 1897. In 1927 the New Zealand Agricultural College Act was passed which established the Massey Agricultural College. Lincoln College, which had formerly been attached to Canterbury College, was granted the status of a University College in 1930. A new college, the Palmerston North University College, opened in 1960, and later amalgamated with Massey Agricultural College to become Massey University. A Hamilton Branch of Auckland University also opened in 1960, later to become the Waikato University. The Colleges became Universities in name from 1958. In the early days Otago claimed the right to confer its own degrees (see Hugh Parton, The University of New Zealand, 1979, especially pp 201-202). Up until 1961, some departments of the colleges seemed to have the power to set their own examinations, although the degrees were still granted by the University of New Zealand, eg, in 1947, an examination for Stage II EDUCATION was headed “UNIVERSITY OF NEW ZEALAND — VICTORIA UNIVERSITY COLLEGE.”
Early course including statisticsDegree courses which included statistics as part of the course began in the Commerce Departments of both Auckland and Canterbury in 1906, Victoria in 1912, and Otago in 1917. The prescriptions in these early years did not usually mention statistics as part of the degree course, but simply gave a set text, by far the most popular being Bowley’s Elements of Statistics.
In Education, an examination was set in “Experimental Pedagogy” in 1923, which included one or two elementary statistical questions, but statistics got no mention in any of the Departments of Education until 1930, at Auckland. During the 1930s the other colleges followed suit, with all four mentioning the text by Tiegs and Crawford — Statistics for Teachers.
At Massey, elementary courses in Agricultural statistics began in 1928.In Psychology, elementary statistical courses were run at Auckland, Victoria, and
Christchurch in the late 1940s, but did not start at Otago until 1965.In the Mathematics departments, statistics was a late starter. The first course in
any of the four colleges consisted of a part of an optional, non-degree course in Computing Methods, offered by Professor D M Y Sommerville at Victoria, in 1926. In the following years, lecturers at the four colleges may have given optional lectures in the subject which were not recorded in the calendars, but it did not become part

134
both included a course on “Introduction to Econometrics. Frequency Distributions, time series, regression analysis, tests of significance”, with the text, Statistical Method, by F C Mills.
Economics III included a paper on “Econometrics. Probability Distributions including multivariate distributions, statistical inference and simpler econometric models”. Texts used were J Johnston’s Economic Methods, and A M Mood’s Introduction to the Theory of Statistics. The Honours courses included one on “Economic Growth and Fluctuation” with a text by R G D Allen, Mathematical Economics; and another paper on “Econometrics”, with texts by Hood and Koopmans, Studies in Econometric Methods, and by L R Klein, Econometrics.
Victoria University of WellingtonIn 1906, Economics was introduced to Victoria University, the first lecturer appointed being Mr T A Hunter MA BSc (NZ) (who later became Vice-Chancellor). In 1912, an advanced class was begun as part of the course “at times to be arranged “for” Senior Scholars or Repeat Economics”, for two hours per week. No prescription was given, but one of the set texts was Bowley, Elements of Statistics. B E Murphy BA LLB BComm (NZ) was appointed lecturer in 1918, and then professor two years later. In 1920 a course was introduced in the ‘Senior Division’ called “Economic Methodology and Statistics — A general treatment of the scope and method of Economics and of statistical methods treated so as not to require a knowledge of mathematics higher than matriculation standard.” Texts assigned were: Bowley’s Elements of Statistics, and Elementary Manual of Statistics, and King’s Elements of Statistical Method. In 1929, Hilda G Heine MA (NZ) PhD (Berlin) was appointed and lectured in the statistics courses. The prescription remained more or less the same for the next 20 or so years, with minor changes in texts. For example, texts by Hays and by Day, both entitled Outline of Statistics, and later by L R Connor. In 1952 the ‘Advanced Courses’ were separated into Stages II, III, and Honours; “Statistical Method” was promoted to Stage III. In 1956 “Econometrics” appeared in the Calendar for Honours, without prescription or texts. In 1963 Economics III includes the text Cramer — Introduction to Probability Theory.
Canterbury UniversityAs at Auckland, statistics was introduced into the B Commerce degree course in 1906. James Hight was appointed that year as lecturer in Economics, Commerce, and History, becoming professor in 1910. The course for B Com included “Statistical Method (after 1906)”, and for the Certificate of Commerce (Second Year) — “Statistical Method, one hour”. In 1927, A H Tocker MA (NZ), was appointed to the chair, and for MA and Honours, a course was included — “Scope and methods of Economic Investigation with special reference to the use of statistics. Two hours per week”. In 1944 the course was also introduced into the BCom and into

135
However, no lectures in statistics were given in Stage I courses. One text in particular, The New Zealand Official Yearbook, plus various guides to it, was constantly used for statistical purposes by the Commerce Department of all universities for many years.
University of AucklandIn 1906 J P Grossman Esq MA, was appointed lecturer in Mental Science, Economics, History, and Commercial Geography. (He later became Professor in all four subjects.) The first reference to Statistics being taught at the University was in this year, for the B Commerce degree. Two topics were included — “Statistical Method” which was compulsory, and “Actuarial Methods” which was optional. No prescriptions and no texts were given, but in 1908 the following prescriptions appeared:
Statistical Method: Data and forms of returns; Tabulation and other forms of reduction of data; Averages and type; Distribution about the average, and measurement of dispersion, ascertainment of probability of given deviations; Accuracy, and estimation of limits of error; Proportional error in results caused by errors in original data; The use of graphical methods in statistics; The use of index numbers; and The more common forms of statistical fallacy.
Actuarial Mathematics: The use of logarithms and of easy series as applied to interest, mortality tables, insurance, and annuities; Probabilities with reference to easy problems connected to life expectation, insurance, annuities, and other matters of applied economics; Graphical methods applied to easy economic problems; The treatment of errors, and the method of least squares as applied to such problems; Approximate methods of solving easy actuarial problems; and Limits of error in the approximations.
This remained until 1927, when Horace Belshaw MA (NZ) PhD (Cantab), was appointed Professor of Economics. The following year a new course was introduced in Economics for Masters and Honours — “Scope and Method for Economic Investigation, with Special Reference to the use of Statistics. The course will presuppose a knowledge of Algebra to Matriculation standard”. The following texts were set:
King, Elements of Statistics; Bowley, Elementary Manual of Statistics; and Boddington, Statistics in their Application to Commerce.
In 1930 this course was shifted to the BCom and MA degrees, and in 1938 to the MCom and MA degrees. In 1945, C G F Simkin MA Dip Soc Sci, DPhil (Oxford) was appointed professor, and by 1951 the statistics for Economics Honours was becoming quite advanced, with texts by Yule and Kendall — Introduction to Advanced Statistical Method, and Kenny — Mathematics of Statistics — Vols I and II.
By 1964, the statistics content had advanced further. Economics II and BCom
136
correlation, elementary theory of sampling and estimation of limits of error. The problems of time series: simple curve fitting, index numbers, and the elementary analysis of seasonal, cyclical, secular, and random components. Students will be expected to be familiar with graphs, logarithms, and the manipulations of algebraic equations.” The texts were Mills’ Statistical Methods, Neale’s Guide to New Zealand Official Statistics, and Allen’s Statistics for Economics.
In 1961 J W Williams MComm (NZ) PhD (Lond), was appointed professor. By 1964 much less attention appeared to be given to statistics. For Stage II, a compulsory course was prescribed for “Elementary statistics and quantative methods in economics”; and for Stage III and Honours, optional courses were set in Econometrics.
EducationThe second University Department to begin teaching statistics was Education. The various calendars rarely mentioned any prescription for the courses, but the texts used in the earlier years were quite comprehensive in detailing statistical methods and techniques up to, but not including, confidence intervals or tests of hypothesis. However, by 1959 a text used at Canterbury (Connolly & Sluckin) set out such tests, up to the analysis of variance. In 1923 a paper for the Diploma in Education was set by the University of New Zealand, in “Experimental Pedagogy”. The examiner was J A Johnson (MA). Even though the statistics examined was at an elementary level, it was nevertheless helping to develop a more scientific approach in this field, which in the past had been to a large extent theoretical and philosophical. There were two questions on statistics in the paper, given below.
5. Draw a column graph based on the following data. Calculate as exactly as you can the median and quartile deviation. Suggest an explanation of the slight skewness of this distribution.
Speed of writing test (Burt) Class IIILetters Written per Minute No of cases 40-49 1 50-59 1 60-69 6 70-79 16 80-89 15 90-99 17 100-109 12
9. What is correlation? Give some indication (without necessarily producing the exact formula) of the various methods of calculating correlation, and show what is the particular value of each method.
Over the years, the prescriptions in the various Calendars for the section

137
the Diplomas in Banking, Journalism, etc. In 1950 C Westrate LLD (Leiden), was appointed professor and in that year a course on “Elementary Statistical Method” was introduced into Economics III and two optional courses for MA and Honours were given — Advanced Statistical Method, and Mathematical Economics. In 1955, Fraser Jackson (who later became Professor at Victoria; see also Chapter 4, Experimentation in Industry) had just completed his BA, which included Statistical Mathematics. He immediately began teaching the Economics III paper on Elementary Statistical Method. In 1962 A J Danks MA, became professor, and two years later a course appeared in Economics II — “Introduction to Statistics for Economists”, with a text by P H Karmel, Applied Statistics for Economists. In Economics III, an optional course was given called “Advanced Statistics and Introduction to Econometrics.”
University of OtagoIn 1915 H D Bedford was appointed to the Chair of Economics at Otago also lecturing in English History. In 1917, a course was offered in “Honours and Repeat Economics” (without a prescription) for “Three hours a week to be arranged to suit students”. One of the set texts was Bowley’s Elements of Statistics. Bedford retired in 1919 and was replaced by a ‘locum tenens’ — Archdeacon Woodthorpe. The same course was offered in 1919, but in 1920 a new course in “ADVANCED ECONOMICS” (ie above Stage I) was offered for one hour a week.
Course C — Logical and Statistical Methods. This course deals with the scope and methods of Economics and the Statistical methods used in the Economic and Social Sciences. It covered the requirements for Honours, BCom, and Diploma in Journalism. The texts given were:
Keynes, Scope and Method of Political Economy Bowley, Elements of Statistics Bowley, Elementary Manual of Statistics W King, Elements of Statistical Methods New Zealand Official Yearbook (Latest Volume)
This course remained more or less static for the next 30 years. G C Billing BA (Adel) PhD (Lond) was appointed professor in 1947. In 1950, two new courses were offered in Honours and MA: (a) Advanced Statistical Method — “The mathematical analysis of frequency distribution. Probability and sampling. Simple, partial and multiple correlations. Significance tests. Analysis of variance and co-variance”. (b) Mathematical Economics, that included growth curves, harmonic analysis, and time series. In 1956 a course was spelt out for lower than Honours level — Elementary Statistical Method: “A survey of the main techniques used in the instructive study of economic material: measurement of central tendencies, of variability and of

138
CanterburyIn 1920 the first professor of Education, James Shelley MA (Cantab) was appointed. The following year a new course was introduced — “Experimental Education. One hour per week, with practical work by arrangement.” Again, the text used was by Rusk, with a note “This course would be of interest to practical teachers who wish to consider teaching problems from a scientific standpoint”. No mention was made of any statistical applications, and the course was part of the syllabus for “BA Advanced”. In 1928 Dr C E Beeby MA (NZ) PhD (Lond), was appointed, and the following year the course was renamed “Experimental Pedagogy” and put into both the Education II and MA and Honours courses. In 1937 a new professor, H E Field MA (NZ) PhD (Lond), was appointed, and the following year a new text by Tiegs and Crawford, Statistics for Teachers was introduced, but without a prescription. In 1940 a prescription was given — “A special series of lectures in statistical method will be arranged in connection with the course”, using the same text. This continued until 1944. For the next several years no mention is made of statistics, until 1959, when a new text is given for Education II — Connolly and Sluckin, Statistics for the Social Sciences, but with no prescription. In 1960 a new (optional) course was offered for MA and Honours in “Research Methods in Statistics — Techniques of investigation. Methodology. Statistics”, with a text by Guildford, Fundamental Statistics in Psychology and Education. The prescription for this course was widened the following year to “Philosophical bases of scientific method. An analysis of general scientific method. Experimental design. Special methods in educational research”, with the same text as previously. In 1962 the text, Non-parametric Statistics for the Behavioural Sciences, by Siegel, was added.
OtagoIn 1923 Richard Lawson MA (Melb) Litt D Dip Ed, was appointed professor of Education at Otago. In 1930, for the Diploma of Education, a course on “Experimental Psychology” was begun, without prescription. Three years later a text by Harold O Rugg, Statistical Methods applied to Education, published in 1917 by Houghton Mifflin, was introduced. This text consisted entirely of statistical methods and techniques with chapters devoted to Variability, Normal Curve, Correlation, Random Sampling, Tabular and Graphic Meathods. In 1936 a further text was added — Tiegs and Crawford, Statistics in (sic) Teachers, was added. In 1939 George Parkyn MA Dip ED, was added to the staff. He retired in 1947 to become Director of the New Zealand Council for Educational Research. In 1946 F W Mitchell MA BSc (Adel) PhD (Lond), became professor and in 1949 the first prescription relating to statistics was entered into the Calendar — “An elementary treatment of statistical methods and practical devices used in education measurements”. In 1951 new texts were added — Garrett’s Statistics in Psychology and Education, and Lindquist’s First Course in Statistics.

139
“Experimental Education”, was the same for both “Education II” and for the “Diploma of Education”. The examination seemed to change little for many years — for example, by 1946 there was only one statistical question (optional):
Write brief notes on two of the following: probable error of the mean; coefficient of correlation, the validity and reliability of a test.
AucklandThe first mention of statistics in any Department of Education appears in the Auckland Calendar. Dr A B Fitt PhD (Leipsic), was appointed to the Department in 1921 as a lecturer, became Professor in 1924, and remained in that position until 1953. In 1930, in the prescription for the Education II — Experimental Education Pedagogy — it states: “statistical methods and graphical devices employed in educational measurement”, with a text by Rusk R R, Experimental Education. This text was first published in 1919 by Longmans Green, London. Chapter 2 describes the “Methods of Experimental Education”. In this chapter, no discussion is specifically made of the testing of hypotheses, nor of the ‘t’ test, but a description of setting up a trial experiment, consisting of two groups — ‘Treated’ and ‘Control’ — is given. Methods of calculating the standard deviation of the mean, and of the correlation coefficient, are also given. However, although the 1925 Calendar for the Diploma of Education makes no specific mention of statistics, nevertheless, under the heading of “Experimental Pedagogy”, it also gives the same text by Rusk. So I suppose it can be said that lectures on statistics were certainly given by 1930, and perhaps by 1925. From 1933 until 1942 no prescription was given, although the same text remained. In 1943 a new text was given — Tiegs and Crawford, Statistics for Teachers, so presumably more statistics was put into the course, although still without a prescription. In 1949 another new text was given — Lindquist, First Course in Statistics, with a prescription “... elementary treatment of statistical methods and graphical devices employed in educational measurements” and this remained throughout the mid 1960s.
VictoriaIn 1912 J S Tennant MA, BSc (NZ), was appointed lecturer in Education, and in 1920 became Professor. In 1923 a course in “Experimental Education” was implemented for the Diploma in Education. The same text by Rusk, as was used by Auckland, was set. In 1927 W H Gould MA (NZ), was appointed professor, and the only change made to the course was to substitute the text Statistics for Teachers by Tiegs and Crawford in 1936. In 1949 a prescription for “Experimental Education” was given, “having special reference to the design of experiments, the construction and use of intelligence and scholastic tests, and an elementary treatment of statistical methods and graphical devices employed in educational methods.”

140
Mathematics, as a pre-requisite.
MathematicsThe first reference to Statistics mentioned within the Mathematics Departments of any of the universities was in 1926, at Victoria, when an optional course for one hour per week (non-degree) was offered.
AucklandAccording to John Maindonald (“Statistics at Auckland University — A Historical Note”, NZ Statistician vol 26,2) the first statistics lectures within the Mathematics Department seem to have been an optional extra-curricular course by K E Bullen in 1940, the course being based on Harold Jeffreys’ Theory of Probability. Cecil Segedin found himself finishing off the course with perhaps two lectures on sampling. Forder offered an optional Masters paper in Probability and Statistics in 1945, with Athol Tills (see Chapter 4, Actuarial), who later became a lecturer in the subject, as one of his students. (There appears to be no reference to the above in any of the Calendars).
In 1949, Frank Haight BA MSc (Iowa) PhD (NZ) (see also Chapter 6), was appointed to a lectureship. A topic, “MATHEMATICAL STATISTICS”, appears in the 1951 Calendar, consisting of “(Two papers) Distributions, correlation, characteristic function, sampling, analysis of variance, testing, statistical estimation” — with no level stated and no texts given. It became an examinable Stage I unit in 1952. Although no pre-requisite was set for this, it appears from the exam paper, to be at the third or fourth year level. In 1954 the title of the subject was reversed to “STATISTICAL MATHEMATICS”, with virtually the same prescription but with a pre-requisite of Pure Mathematics I. However, students who had obtained this pre-requisite were advised to consult the lecturer before starting the course.
Haight was on leave in 1956, returned in 1957, and finally left in 1958. The set texts from 1957 were A M Mood, Introduction to the Theory of Statistics, and P G Hoel, Introduction to Mathematical Statistics. In 1958 a prescription was given — “(a) Descriptive statistics, derived distributions, analysis of variance, the Chi-square test, the bivariate normal distribution, and (b) Statistical estimation, testing hypothesis, sequential analysis”. George Seber MSc (NZ) PhD (Manch), was appointed lecturer in 1965, and Statistical Mathematics I became Statistical Mathematics II. The first teaching of elementary statistics at the Stage I level came in 1968 with the introduction of statistics as an option for Applied Mathematics I.
MasseyMassey originally began as an Agricultural College and was a constituent college of Victoria University, Wellington. The first calendar appeared in 1928 that included, for the Second Professional Examination, a subject “Agricultural Statistics, their collection and uses” and for the MAgrSc, “The scope and methods of economic investigation
141
PsychologyIn all universities Psychology began within the Department of Philosophy, and remained so until about 1950 at Victoria, and some years later at the other universities. Although elementary statistics were apparently used in the various psychology courses from at least the late 1940s, the stated prescriptions were often very limited indeed, and in many cases no specific statistical texts were listed.
AucklandIn 1949 the first reference appears in the Philosophy II syllabus — “The place of experiment and statistical method.” In 1953 Stage III level prescribed “Psychometric Methods” and “More advanced statistical methods” with the text by Guilford, Fundamental Statistics in Psychology and Education. Psychology broke away from Philosophy and became a separate department in 1957, with the appointment of T H Scott MA PhD (McGill), as Head of Department. The course prescribed — “Experimental method in the study of behaviour; General comparative and social psychology, including a course in statistical method” with the text by Chambers, Statistical Calculation for Beginners.
VictoriaL S Hearnshaw MA (Oxford) BA (Lond) was appointed in the late 1930s as lecturer and was in charge of Experimental work. Up to 1947, the prescriptions made no mention of statistics but stated for the Stage III prescription — “A course of experiments in more advanced work ... in simple quantitative methods”. However, in that year a paper was set by the University of New Zealand for the Stage II examination, half of which was devoted solely to statistics, with questions on standard deviation, inter-quartile range, correlation, statistical significance, elementary probability etc. Two years later the Stage II prescription became, “an introduction to statistical method and its use in psychological investigation” with the text by Chambers (as above). By 1954 the course included “Psychometrics — Advanced treatment of the field”.
CanterburyIn 1949 the prescription for Stage II Psychology was “Experimental Psychology and Statistical Method”, with Chambers again as the set text. It remained so for a number of years, and by 1958 Psychology had become a department on its own with A Crowther MA PD (Cantab), as professor. A new course was offered in Honours — “Psychometrics”, with text by S Siegel, Non-parametric Statistics.
OtagoIn 1965 it was stated that in 1967, students enrolling for Advanced classes would need a pass in Mathematical and Statistical Methods or some other agreed course in
142
Numerical solution of linear and non-linear equations. Least squares methods and orthogonal polynomials.” Texts for this course were Spiegel’s Theory and Problems in Statistics and Redish’s Introduction to Computational Methods.
CanterburyIn a personal note, Graham Wright (See Chapter 1, Applied Mathematics Division) writes “John Darwin and I took a paper in Mathematical Statistics for Hons MSc in 1946 under Professor Saddler, who swore he would never teach it again.” Ewan Drummond MSc (NZ) BA (Cantab), was appointed to the staff in 1948, and in a personal letter, writes: “I didn’t get permission for any changes in the curriculum (presumably, opposition came from Saddler) until 1949 or 1950, when I started a one term statistics course for second year students based on the first course at Cambridge. It started with probability, then normal, binomial and other distributions up to ‘t’ and chi-squared tests, and I had a calculations lab spinning the wheels of several Brunsviga calculators.” Ewan left Canterbury in 1954 and joined the Mathematical Physics group at the Applied Mathematics Division in Wellington. In 1953 a degree unit, “Statistical Mathematics I”, was introduced — “Elements of probability, numerical methods, standard distribution, sampling, and testing”, with the texts by Weatherburn, Mathematical Statistics, and Yule and Kendall, Introduction to the Theory of Statistics. The lecturer for this was W R Andress MA (Cantab) BSc (Manch). In 1960 an additional text was used, Hoel’s Introduction to Mathematical Statistics. In 1963 the Stage I unit no longer existed, but courses were instituted by J C Butcher MSc (NZ) PhD (Syd), for Stages II and III — “Statistical and Numerical Mathematics”. Stage II had the same prescription and texts as at Stage I. The Stage III prescription was: “Numerical solution of ordinary Differential Equations of second and higher order (and of Partial Differential Equations), Computer Methods”, with texts — Yule and Kendall, Introduction to the Theory of Statistics, and Bennett, Milne and Bateman’s Numerical Integration of Differential Equations.
OtagoThe first (non-degree) course was inaugurated in 1938, two years after the appointment of E H Sealy MSc. Presumably this was by Sealy, since the other two members of the Department had been lecturing for a number of years with no statistics courses mentioned in the Calendar. The Calendar for that year states: “STATISTICAL METHOD (Introductory Practical Course). This course is designed to give students of Economics, Education, or other subjects, whose work entails the discussion of statistical data, an introduction to graphical, and other methods of calculating the various statistical constants involved in such discussion.” No texts were given. In 1939 Sealy left and was replaced by Theodora Marsh MSc, and the course continued until 1942. Marsh
143
with special reference to the use of statistics, but omitting the mathematical principles and proofs on which their methods were based”.
From 1932 to 1944 no prescriptions were given in the Massey Calendars, but instead, reference was made to the New Zealand University calendars. In the 1933 New Zealand Calendar no mention is specifically made of statistics, but in the Genetics paper of that year it states “biometry to calculation of correlation coefficients and regression equations”. Up until 1957, the prescriptions are very brief so the statistics content is unknown. From 1958 to 1961 there is mention of “Elementary economic statistics”, and from 1962 to 1965, a full paper in Statistics I is given as an alternative to Agricultural Engineering. For the B. Food. Tech, a full paper called “Technological Mathematics” was introduced, half mathematics and half statistics. In 1964 Professor Brian Hayman was appointed as Professor of Mathematics and began lecturing in Statistics I for BAg and BAgSc, and he was also responsible for introducing statistics to first year BSc in 1966, and thereafter for full degree programmes in statistics up to PhD level.
VictoriaD M Y Sommerville MA DSc (Edin) was appointed professor in 1915, and in 1926 offered an optional, non-degree course entitled “Course in Computing Methods” which dealt with interpolation, harmonic analysis, theory of errors, and method of least squares, the text used being The Calculus of Observations by E T Whittaker and G Robinson. This continued until 1934, the year in which Sommerville died, and was not offered thereafter.
In 1936 J T Campbell (see Chapter 2) MA (NZ) PhD (Edin), was appointed lecturer, and in 1937 he offered an optional, non-degree course for one hour per week entitled “An Introductory Course in Mathematical Statistics — some knowledge of the Calculus is desirable”. The text used was B H Camp’s Elementary Statistics. This was continued until 1942. From 1943 to 1945 Campbell was on War Service and no statistical course was offered.
Campbell returned in 1946, but it was not until 1948 that statistical courses were offered again. One hour per week was set down, but it seems that two non-degree courses were offered: an Elementary course with Yule & Kendall, Introduction to the Theory of Statistics, as the text; and an Intermediate course with Weatherburn’s First Course in Mathematical Statistics, as set text. For this latter course a knowledge equivalent to that of Stage II Mathematics, at least, was required. This was continued until 1962, in which year no course was offered, but in 1963 a Degree course was begun, entitled “Statistical Mathematics II”, with Pure Maths I as a pre-requisite. This prescription included “Probability theory. Standard Distributions. Derived distributions. Decision problems (an introduction to the theory of estimation and tests of statistical hypotheses). Finite difference calculus. Interpolation. Numerical Integration.

144
145
left in that year and no further courses were mentioned until 1947. In 1946 Harold Silverstone MA PhD (Edinburgh) was appointed (see also Chapter 2). In the 1947 annual report of the Mathematics Department, it was stated that Silverstone had given a much appreciated course in Statistics, and consideration was given to the setting up of a Statistical Laboratory and the purchase of a calculating machine. The 1947 Calendar stated: “A course will be given on the methods of Statistics and their application to experimental data. The class will meet one hour each week. Students desiring to take this class should have a knowledge of elementary mathematics. If they are including Pure Mathematics I in their degree, they should take it before they enrol in the class of Statistics.” In 1948 a higher course was offered, but students needed, as a pre-requisite, the Introductory course plus Pure Mathematics II. By 1949 the prescription had increased considerably to: “ (a) Univariate Analysis; (b) Bivariate Analysis; (c) Sampling Theory for both Large and Small samples; and (d) Practical Work. In 1952 a degree course, “Statistical Mathematics I, Two Papers”, began. Paper 1 had the same content as 1949 and Paper 2 was the mathematical theory thereof. In addition, a new “Certificate in Statistics (Otago University)” was begun with the same content as Paper 1. No statistics course was given in 1956. For the course in 1958, a pre-requisite of Pure Mathematics II was introduced. During this year Silverstone left to take up an appointment in Brisbane. In 1964 G H Jowett BA (Lond) MA (Melb) PhD (Sheff), was appointed as a Professor, and some changes were made to the courses: (1) “MATHEMATICAL STATISTICS”, with prescription: “Theory and Application of probability distributions, including the binomial, Poisson, Hypergeometric, normal, chi-squared, t, and F distributions, correlation and regression, sampling theory and statistical inference, experimental design and the analysis of variance.” (2) “STATISTICAL METHODS” — “The course provides an elementary working knowledge of the standard statistical techniques and their application to the analysis of observational and experimental data.” This was a one paper, optional course, with a Certificate in Statistics being awarded. During this year G F S Spears, the statistician in the Department of Preventative and Social Medicine, was an honorary lecturer in the Department of Mathematics, and gave Jowett a lot of help in getting these subjects going.
146
chapter 4
Early surveys, trials, and field experimentsIntroductionThe statistical works recorded in this chapter are not necessarily the first trials, surveys, or experiments that were carried out in New Zealand. They are, however, the earliest the editor was able to discover, or to persuade other scientists or statisticians etc, to contribute. Two very important scientific areas have not been recorded — that of earthquakes and of medicine. And although statistical experiments or surveys were certainly carried out, current investigators working in these fields have not been able to find time to write up any early work for this publication. The chapter does, however, show a wide range of statistical work being done in New Zealand during the fifty or so years from the 1920s to the 1970s. In general, the topics are not treated in depth and references have been kept to a minimum. Readers are referred to the original works should they require more detailed information. The dates given in the titles are generally close to the beginning of the work, and dates of publication are mostly given at the end of the article.

147
1923 ForestryE m e r i t u s P r o f e s s o r P J M c K e l v e y , S c h o o l o f F o r e s t r y , U n i v e r s i t y o f C a n t e r b u r y Graham Whyte, formerly Reader, School of Forestry, University of Canterbury
Until 1919 the administration of the Crown forests, both the indigenous tracts and the small area of exotic plantations, was under the control of the Lands and Survey Department. By that time, however, it had become widely acknowledged that a separate forestry department was necessary to manage the national forest estate. Destruction of the indigenous forests, and their replacement by grass in many places, had already proceeded past safe limits and the exotic forests showed promise. There was a clear need for an effective national forest policy and professional management of the Crown forests. So in that year a dynamic Canadian professional forester, Leon MacIntosh Ellis, arrived in New Zealand to head the new State Forest Service (later called the New Zealand Forest Service (NZFS)). Right from the start of the new Authority, the need for accurate forest data became apparent and so began a steady and systematic collection of forest statistics.
There was an early need for an accurate assessment of the timber resource in the indigenous forests so that a national timber supply strategy could be formulated. The first attempt at this, known as the National Forestry Inventory, was completed during the years 1920-1923. Various methods of assessment, including temporary sample plots, were used but there was a lot of reliance on the eye estimates of men experienced in saw-milling for estimating timber volumes per acre. More difficult was determining the number of acres that carried such volumes because of the dearth of forest maps. But the Inventory did show clearly enough that the forests could not be exploited at the then rate, beyond 1965. Initial indications were sufficient to formulate an effective forest policy for the 1920s and to persuade the Government to finance the first planting boom of exotic species, commencing in 1925.
It was realised that a more accurate assessment would have to be made but the resources and techniques for this did not become available until the end of World War II. Then, when experienced forestry staff had started to return from war time service, the Director of Forests — at that time Alex R Entrican — initiated the National Forest Survey (NFS). Priestley Thomson was the forester entrusted with the project. Thomson visited the USA on his way home from the war, to study the use there of aerial photography because it was clear that this aid had to be used. Entrican directed that the survey should be truly comprehensive and collect both volumetric

148
the field parties had to climb high to get into or out of the timber stands and so quite a lot of information was gathered about the condition of the forests on the upper slopes. The information was disturbing — depletion of the forests by deer and possums was extreme in places and there was much accelerated erosion, too putatively a consequence of the browsing of these animals. Jack Holloway, a Principal Officer in NFS and one who was responsible for the work in the South Island, concluded that the next phase of NFS must be an assessment of the condition of the protection forests. He was persuasive and persistent, convincing Entrican of the need and urgency of the work.
So began in 1956 the systematic survey and resurvey work in the important protection forest catchments of both islands. An initial survey established permanent sample plots and other permanent reference points in montane forest and scrub land and sub-alpine grassland. Subsequent surveys at five yearly intervals established condition trends and helped NZFS direct its resources towards wild animal control and any artificial revegetation in areas demanding priority. Holloway realised that, for this work in the mountain watersheds, more than expertise in forestry was required and so he built up a multi disciplinary team that included hydrologists, animal ecologists, plant ecologists, and soil scientists, in addition to foresters. By 1974 this survey and resurvey work, which had been carried out by Holloway and his team as part of the Forest Research Institute (FRI), had become a routine operation and was handed over to the NZFS conservancies to implement, with FRI assuming an advisory role. That advice on vegetation survey techniques in place today is summarised in Allen (1992 and 1993) and by the Ministry of Forestry (1995). Survey procedures and hydrology, wildlife and other aspects of the resource are scattered throughout publications too numerous to document here.
At the end of the NFS, ecological survey work continued in the North Island, much of it in the montane forests because the forest patterns there had been found to be unexpectedly complex. In fact this supplementary work carried on until 1967, by which time another 4,151 temporary 0.4ha sample plots had been recorded. These plots were designed to concentrate more on ecological features but were kept compatible with the older NFS plots so that the data of the latter could continue to be used. Another feature of this later North Island work was the establishment of about 50 permanent band transects, each 211.2 m × 20.1 m (10.5 chains x 1 chain), to record long-term changes in forest structure and condition.
All this forest survey activity in the indigenous forests and above the timber line, comprising the original NFS assessment followed by the protection forest work in both islands and the supplementary ecological work in the North Island, involved the collection of statistical data which have been used in several ways, for substantial national benefit. Resulting from this work there are now, for instance, consistent indigenous forest classifications for both the South and the North Islands and a series
149
and ecological data. Thomson produced the design for NFS that included up-to-date statistical and ecological methods.
The field-work started in 1946. It was achieved by parties of three or four men moving along east-west lines in the bush, usually one mile (1.6 km) apart, establishing and measuring one across (0.4 ha) temporary sample plots, usually at intervals of half a mile (0.8 km) along the lines. Over each plot the timber was measured and a full ecological description made, including regeneration counts and a record of the soil profile. It was possible to do three to five plots a day, depending on the topography. The parties camped at the nearest water to the last plot of the day. The field trips usually took eight to ten days. Packs were heavy in those times before helicopters and freeze-dried rations. It was a memorable experience for the NZFS trainees and university students who made up the bulk of the field parties. (Reunions have been held in 1956, 1986, 1991, and 1997.)
In those days there were few maps of the indigenous forests suitable for computation of timber volumes. There was only a small scale cadastral series that showed trig points and major tenure boundaries; no accurate drainage systems or forest edges were depicted. Accordingly, the NZFS had to produce their own maps using aerial photographs and a ‘Harvard Multiscope’, to eliminate the radial distortion inherent in each photograph. The runs of aerial photographs, which were used for field navigation and on which the lines of sample plots were marked, were ‘tied into’ the national mapping grid at selected places by the field parties finding trig points and marking them on the photographs with pin pricks.
After each summer field season the field data and runs of aerial photographs were given to experienced field staff, who delineated forest type boundaries on the photos after studying them stereoscopically. The drafting staff then produced the forest type maps. Essentially, the total volume of timber in a forest tract was obtained by multiplying the areas of the types by the relevant calculated average timber volumes per acre. The 10-year project was finished in 1955, and on time. An area of 2.8 million hectares of forest had been surveyed; 2.2 million hectares (200 maps) had been mapped at the scale of 1:15,840; 40 maps were produced on larger scales. 17,000 sample plots had been measured. It should be mentioned that the systematic pattern of sampling used — it was the only feasible, practicable way to get through the forests — had the disadvantage that, theoretically, exact sampling errors could not be computed. However, because the locations of the plots appeared from aerial photographs, not to be related to any periodicity of the vegetation pattern, and because each field party exercised no judgement in choosing their positions, it was considered justifiable to ascribe 95% confidence limits to total volumes of the types (as though the sampling was random) and, through post-stratification, the tracts.
NFS sampled the low and mid altitude forests more intensively than the montane forests, but there was a spin off for the high altitude protection forests. Frequently
150
in the emphasis laid on biometry and associated quantitative techniques given in the undergraduate and post-graduate courses at the School of Forestry, University of Canterbury. The New Zealand Forest Owners’ Association and the Ministry of Forestry publish the National Exotic Forest Description (NEFD), an annual statement of plantation forest areas and volumes. The merging of statistics and operations research to improve forest industry management has also led to New Zealand’s high regard in the eyes of international forestry practitioners.
The combination of statistics with the rapid development of computing power has been a mixed blessing in that it is becoming increasingly easy to misuse and abuse statistical techniques, and to disguise the limitations of ‘findings’ in the form of highly sophisticated and convincing looking outputs. This unacceptable trend needs to be reversed somehow and we would urge the New Zealand Statistical Association to play a leading part in this.
Lastly in this all too brief review, another invaluable statistical series is the biennial publication over the years by the NZFS and subsequently the Ministry of Forestry of key elements in the growth and development of forestry, wood production, wood imports and exports, etc (eg Ministry of Forestry, 1995). This, too, is a statistical resource that is rarely used to advantage (and never by the media). Reference to this needs to be further encouraged.
This broad overview of both indigenous and exotic forestry in New Zealand is an indication of the breadth and depth of statistical techniques that have been a major contributor to the advancement of sound forest management.
Masters, S E , Holloway, J T and McKelvey, P J, That National Forest Survey of New Zealand 1995, Volume 1, The Indigenous Forest Resources of New Zealand, New Zealand Forest Service, 1957, 107 pp.
McKelvey, Peter, Steepland Forests, Canterbury University Press, 1995, 295 pp.

151
of forest class maps at a scale of 1:250,000 conforming to those classifications and covering the whole country. The information was crucial to the creation, during the 1970s, of ecological reserves covering New Zealand indigenous forest types.
As the exotic forest estate developed to reach its current extent of 1.5 million ha, there has been a parallel, increasing need to collect relevant data, especially on the growth and yield of the various exotic tree species managed under different silvicultural regimes. Data pertaining to 14,000 permanent sample plots (some no longer in existence of course) have been documented for usage nationally, including the development of growth trends embodied in production functions called yield tables, nowadays called growth and yield models. Also, specialised statistical techniques have evolved over the years for estimating current tree size and quality, for conducting surveys at various stages of the cropping cycle and for the design and analysis of many kinds of forestry related experiments. Intensive plantation forestry and utilisation of forest products have employed many statistical techniques in a huge range of different ways. Only a few highlights can be mentioned here.
The first biometrician at FRI in Rotorua, Evan Lewis, did an amazing amount of pioneering statistical work, largely unacknowledged. He produced log assorted yield tables for unthinned, but of variable density, radiata pine crops using a series of statistically determined alignment charts. Even today, these tables can produce remarkably accurate forecasts of a crop’s harvest potential. He produced also, a series of multiple regression equations, as well as graphically constructed tables, to allow estimation of the volume and taper of trees and logs. This was not only heady stuff for the 1950s but also critical information for managing the plantation resource sensibly and sustainably.
When Evan Lewis left in the mid-1950s to become a church missionary overseas; he was replaced by Bill Warren, an early member of the New Zealand Statistical Association. Bill brought a high level of statistical rigour, and he too is remembered for a great deal of pioneering work. An outstanding example of this is the application of line intersect sampling, for assessing the amount of waste left behind after harvest. This 1963 development, which was achieved with the help of forester, Peter Olsen, is a standard technique that has been, with a few adjustments and refinements, applied world-wide, and still is today.
In addition to research, statistics has been applied widely in the forest and in the collection and dissemination of production and trade data. New Zealand foresters have a propensity to set up experiments and trials of all sorts to help rationalise their management techniques. Reliance on FRI personnel to assist with sound design, analysis, and interpretation, has gradually been replaced by a bevy of foresters steeped
152
Field experiments were conducted by the Institute in the next few years and it became clear that a more precise and extended study of apple tree nutrition was needed. A joint effort was therefore made by the Department of Scientific and Industrial Research, Department of Agriculture, the Cawthron Institute and the New Zealand Fruit Export Control Board through the Fruit Reseach Committee. In September 1930 a 14 year old orchard, planted in commercial apple varieties, was acquired. This was named the Appleby Research Orchard.
The aim of the experiments was not only to increase the general growth and vigour of the trees, especially the quality and yield of the fruit, but also to discover the effect of the various fertilisers on the storage quality. This latter effect was particularly important with exported fruit, which had lengthy sea journeys to overseas markets.
Three fertilisers were applied, Nitrogen (N), Phosphate (P) and Potash (K), in 6 different combinations — Control, N, P, NP, PK, NPK. Unfortunately, because of the limited amount of land available for the experiments, it was not possible to include every combination. The need for untreated guard row trees around each plot increased the area required. In Europe it was found that the land was deficient in Potash, but in New Zealand it appeared that this was not so. It was therefore decided to omit the two combinations K and NK. A number of apple varieties were included in the trials — Sturmer Pippin, Cox’s Orange Pippin, Delicious, Dunn’s Favourite and Jonathan. Trees were grouped into plots of four or six, and plots into blocks according to the number of treatments. The apples were then placed in cool storage. Thus, the trials were a large scale, replicated (although not completely so) experiment.
Records were made of data relating to yield, fruit-size, tree girth, and colour, for each variety of fruit. The records for Storage Quality were further divided into commercially sound fruit and different types of disease for each variety. The field records had been so accurately kept that the Chief Field Officer could identify the tree that any particular apple had come from.
The field results began to be analysed by the Applied Mathematics Laboratory of the DSIR in the late 1940s, using standard analyses of variance techniques, and computed with punched cards on Powers-Samas machines. The results obtained (particularly the effect of nitrogen on growth and yield and of phosphate on fruit quality) have had a profound effect on fertiliser practice in the Nelson district.
L W Tiller, H S Roberts and E G Bollard, “The Appleby Experiments” DSIR Bulletin 129, 1959 (155 pp)

153
1930 The Appleby experimentsEditor
These experiments consisted of a large series of replicated field trials with records kept from 1933 to 1956, and analysed during the years 1945-1958.
In the early years of the twentieth century the areas of the Moutere Hills, Nelson, presented a barren appearance, with their cover mainly of manuka, bracken and poor grasses. The year 1911, however, saw the beginning of a spectacular development — the planting of orchard trees (mainly apples) on several thousand acres of coastal strip, with promotion syndicates taking a leading part. Within the next five years some 7,000 acres were planted in fruit trees. However, growth was poor and the development of the trees was unsatisfactory. In 1920 the Cawthron Institute was founded in Nelson and charged with the task of undertaking scientific research into the problems of agriculture, with particular reference to those of the Nelson province. The Institute’s first major agricultural project was a soil survey of Waimea County, with special attention to the Moutere soils and the un-thriftiness of the orchards. They were highly deficient in phosphate, nitrogen, lime, and organic matter, and had only a moderate content of available potash.

154
illustrate the old crescendo ‘lies, damned lies, and statistics’ are due to lack of randomness in the data ….. now in the case of agricultural experiments, the only way in which you can be sure that your samples are perfectly random is to put the numbers in a hat and draw for position. That is of course never done without some form of control, for the very good reason that if you did your error would be needlessly large.” He then mentioned randomised blocks, Latin squares, and “equalised blocks” and pointed out that an alternating plot system may include an unknown fertility slope in the mean difference. “… if you have enough plots … you can estimate how much effect such fertility slope may have had … nevertheless it is better to rule out the simple fertility slope by arranging ABBAAB … BA and then you can fairly assume that the remaining soil differences are likely to be randomly distributed?
Hudson (24/5/32) reluctantly abandoned his n-1 differences, but enthusiastically took up the point about random designs having needlessly large errors. He spelt out his principles of experimentation:
1. Frequency of replication is most important.2. Close proximity of treatments being compared reduces errors.3. Randomisation increases practical difficulties and needlessly increases errors.4. Unsatisfactory random selections would be rejected anyway.5. The soil itself provides randomisation.
He complained: “Is lack of randomness so largely responsible for the crescendo …., as the fact that statistics so often say such and such a result is not significant when one’s eyes and common sense tell one that the result is a real one?”
Gosset, (6/7/32), gave an explanation of what a significant result means. “When you have got your significant result it is up to you and/or your critics to examine the figures and see how far the significance may, or may not be due to your departure from randomness.”
Hudson even wrote to Fisher. He asked about interpolation in z-tables, but at the same time he made it clear that in his experiments randomisation was impractical. Predictably Fisher, (20/4/32), responded “… systematic plot arrangements really preclude any genuine estimate of error at all and therefore any valid test of significance.” Hudson persisted “We [have] a considerable number of individuals representing varying degrees of intelligence … and for some at least it is necessary to make the layout as simple … as possible.”
In the final letter of this interchange, Hudson (3/9/32) hinted that he was working on a comparison of random and regular arrangements.
3. The Uniformity StudiesOne year later Hudson (9/10/33) sent the results of his studies to Gosset. He used uniformity data from mangolds, (Mercer and Hall, 1911), sugar beet, (Immer, 1932) and potatoes, (Kalamkar, 1932) imposing four, five or six imaginary treatments, both randomly and in a balanced fashion, using various numbers of units per plot. These

155
1931 The Hudson-Gosset Correspondence (Originally Printed in The NZ Statistician, 20(1), April 1985)G.C. Arnold, (formerly Biometrics Section, Department of Agriculture) Department of Maths and Statistics, Massey University.
The December 1977 issue of The New Zealand Statistician contained news of the discovery of a file of correspondence between crop agronomist A.W. Hudson and various English statisticians, principally W.S. Gosset. At the time of the correspondence, 1931-1939, ideas of statistical experimentation were being propagated to practical agricultural scientists. This paper describes how the correspondence reflects these ideas.
1. BackgroundAbe Wilfrid Hudson was a crop experimentalist with the Department of Agriculture at the time the correspondence began in 1931. He moved to Massey Agricultural College in 1935 as a lecturer in soil chemistry and became Professor of Field Husbandry in 1951, a position he held until his retirement in 1961. He died in 1982.
His correspondence was mainly concerned with randomisation, a practice which Hudson unwaveringly opposed. In this paper the correspondence is described in historical order, and leads up to Gosset’s row with Fisher and his resulting paper, “Student”, 1937.
2. The Initial Query It all began with a problem Hudson had been discussing with Dr Hilgendorf, a crop geneticist with the New Zealand Wheat Research Institute. They had been considering the analysis of two-treatment field experiments, where the plots were strips and treatments were applied systematically to alternate plots. In a letter to Hilgendorf, (27-7-31), Hudson said “You remember that we discussed this matter two or three years ago and could see no legitimate reason why the statistical significance of the mean difference between two alternating treatments should not be tested by comparing each plot with those on either side provided all plots were equidistant from one another.” Hilgendorf had already presented this problem to Gosset and in his reply, Gosset (27/7/31) not only pointed out that “…..you cannot cheat the Gods into thinking you have got n-1 comparisons out of a total of n plots …..”, but also suggested that the design could be improved and offered to criticise any data sets sent to him. Hudson sent three sets of results and Gosset’s assistant, E. Sommerville, analysed them. In his covering letter, (11/12/31), Gosset spelt out two assumptions, normality and randomness, behind the standard statistical analysis. Of randomisation he said “A disregard of [randomness] is much more serious; in fact nearly all the cases which

156
Gosset wrote “….. the example which he gave of the systematic arrangement advocated by ‘student’ was a case of the one arrangement which I had definitely rejected – [a proposal to divide a single drill into short lengths and treat the yields from each length as being independent] and implored him not to publish as I should hate to have to reply. I got a rudish reply …..” “So you see, I shall have, after all to write a pukka paper sometime and the worst of it is that I have mislaid ….. your experimental evidence …..” Hudson was overjoyed (3/2/37). “To say that yours of 28th November last gave me a great deal of pleasure is putting it mildly. I fairly shouted for joy ….. I am having a copy of my former letter and the accompanying data typed and as you will observe, it is being sent airmail in the hope that ….. early dispatch will expedite the launching of the offensive”.
Gosset’s final letter (30/9/37) mentioned a minor heart attack and plans for a convalescent trip on Lake Taupo for February 1938. He died 6 days later.
5. Other Points DiscussedMany of Hudson’s other queries were in the category “What after the F-test?”. In those days the F-test was the z-test and it was new. Hudson found clear difference in an experiment where the z-test was not significant. Gosset (23/9/34), was dismissive. “As to the z-test, I’m glad to say that I don’t bother with it myself ” and Gosset (28/11/36) “as I see it unless you get the variance of your treatment means significantly greater than would be accounted for by the random error they don’t think the means worth further investigation – indeed they often pay so little attention to the means that one might think that the error was what they did the experiment for …..” He did understand the multiple comparison problem though, as Gosset (undated, c.5/37) says “….. unfortunately if you have m [treatments] the probability of getting a difference between two of them is not given by the t-table and the appropriate ‘range test’ has not yet been constructed. The last comment in his last letter (30/9/37) was “Today Professor Pearson and I are going to conspire against Z which I fancy may be too closely connected with normal distribution to be strictly applicable to agricultural experiments of meagre repetition”.
Comments by Gosset disapproving of Hudson’s systematic designs have already been quoted. Included in his replies were examples of fitting fertility trends as means of rescuing the experiment. One set of Hudson’s random data showed a highly significant treatment difference. Gosset (undated, c.5/37) shows how fitting a linear fertility trend reduced the treatment mean square from 10,876 to 292 and the error mean square from 2243 to 240. However he comments “….. it does look as if it is worthwhile calculating the contribution of the fertility slope to the error in cases where there is a marked slope, not so much for the reduction of the error of the mean, I incline to think balancing is sounder* but because the apparent error is reduced as well (*there is less ‘cookery’ about it!)”
6. DiscussionsIt is interesting that Hudson had to turn to Gosset at all. There is one letter late in the file from J.T. Campbell (30/11/37), then at Victoria University, whom Hudson clearly

157
results were later published by Gosset in 1937. Hudson’s conclusions were:
a) When the number of replications of each treatment were as low as four, the real errors were considerably less under the regular arrangements in two cases and about the same as the random in the third.
b) With 8-32 replications the real errors were not markedly different, but in most cases were smaller under the regular arrangement.
c) The standard errors varied in an inverse manner to the real errors. (I find it hard to reconcile this with sweet reasonableness, but notice that Fisher draws attention to the point. It seems to me that in removing errors ‘due to treatment’ he is removing more than should be removed from ‘errors’).
d) Where the real errors from regular and random arrangements were about the same, the standard errors were about the same.
He comments “Too much reliance is being placed on statistics for the analysis and removal of errors and not enough on the actual reduction of errors by frequent replication in a common sense manner” and “if by randomisation the real errors are increased ….. what use is a valid estimate of error”. He finished by suggesting that Gosset should write an article dealing specifically with these matters.
Gosset was impressed, but not entirely in agreement. He wrote, (11/12/33): They [Hudson’s results], show that both the method of randomised blocks and that of balanced blocks are out of date. The former because the error introduced is unnecessarily large and the latter because the standard error in its turn is too large”. He suggested Latin squares and criticised Hudson’s balanced arrangements, which were 4 3 2 1 4 3 2 1 1 2 3 4 …… his improvement was 1 2 3 4 4 3 2 1 1 2 3 4 …… which balances linear fertility trends within eight strips. He sent a copy of the correspondence to Wishart: “It is more in his line than mine, and ….. he carries more guns than I do …..”
During 1934 Hudson wrote once to Wishart and several times to Gosset asking for advice on points of analysis. At the end of each there was always a comment urging publication of a paper promoting systematic experiments.
“I trust you will be able to persuade Wishart to review the whole question …. at an early date”, and “….. here’s hoping that you will take up the cudgels in a good cause if Wishart’s courage fails him” ….. “Student tells me that he forwarded some stuff of mine to you ….. Have you done anything in the matter yet?” ….. “You will gather from my persistence that I am likely to make a pest of myself until something is done about it …”
In 1935 Hudson moved to Massey College, Gosset moved to London and there was no correspondence for two years.
4. The Battle JoinedIn 1936 Gosset’s row with Fisher finally erupted. In a letter to Hudson (28/11/36)

158
Hudson gave much more weight to practical difficulties and much less weight to balance than practical experimenters of his time. However he was not alone in eschewing randomisation. Crowther (1936) says “No element in the new methods has proved a greater stumbling block to those accustomed to the older method …..” My experience is that many present day experimenters use randomisation because they have been trained to and that their understanding of the principles involved are little different from Hudson’s. They would find his views very attractive. To accept randomisation one has to admit some ignorance of one’s experimental material and Hudson is not alone in being reluctant to make this admission.
AcknowledgementsWorking with the Hudson-Gosset correspondence has been made very much simpler through the systematic organisation of the file by Murray Jorgensen of the Ministry of Agriculture and Fisheries. The correspondence itself is now lodged in the New Zealand National Archives under files numbered Ag51/1 and Ag51/2 and the assistance of archive staff is acknowledged. Also, colleagues made valuable comments on drafts of this paper.

159
had talked with, but in 1931 he and Hilgendorf apparently had no local statistician to turn to.
Perhaps the first question a New Zealand statistician would ask is, How much did Hudson influence Gosset? Clearly it was Hudson’s data which led Gosset to the power calculations which formed the essence of his 1937 Biometrika paper. Gosset said as much in his 7/3/37 letter to Hudson and in Pearson (1938) a letter Gosset wrote to an Australian is quoted which makes the same statement. Other people at that time were applying artificial treatments to uniformity data eg Tedin (1931), but Hudson was the one corresponding to Gosset, his calculations were particularly extensive, and they showed that systematic arrangements had some very marked advantages over their random counterparts. Further, the way he presented his results showed that the decreases in “real errors” were much more marked than the compensating increases in the standard errors. Of course Gosset would have replied to Fisher regardless, and if he had lived longer, something else might have led him to the ideas that he got from Hudson’s data. Nevertheless it may fairly be claimed that Hudson’s work enabled Gosset to include a strong attack on randomisation in a paper which would otherwise have been defensive.
Gosset had correspondents all around the world. The way he kept suggesting to Hudson that it was important to balance designs is typical of the patience he showed to experimenters everywhere. His views are therefore well known. He was a modeller, nowadays a respectable occupation. His view of randomisation as spelt out in the correspondence and in “Student”, 1937, is that it is a means of ensuring that the data fits an independent errors model, sufficient but not necessary. The idea that randomisation gives an experiment objectivity appeared only in a typed copy of a letter from K. Mather (now Professor Sir Kenneth Mather, Birmingham University) to Otto Frankel, a Wheat Research Institute geneticist. This letter was undated, but appears in the file about the time of Gosset’s death.

160
analysis was attempted and the amount of data was sufficiently small to permit publication of the results for each individual fish examined. The first such data on a marine fish were those of Rapson (1940) for lemon sole.
Difficulties in ageing individual fish often make separation of multimodal length distributions of the catch into a series of groups which can be assumed to be age groups an attractive alternative approach. Today the power of computers makes it easy and quick to apply sophisticated statistical techniques for this purpose and a number of useful packages have been developed (eg ELEFAN, Pauly and David 1981). In the pre-computer age a useful and practical method was developed in New Zealand by Cassie (1950, 1954). This assumed that the length of each age group was normally distributed and was based on identifying the points of inflection of a plot of the cumulative length distribution on probability paper. It provided estimates of the mean, standard deviation and relative abundance of the distinguishable groups. The same technique was also applied by its author to estimate the parameters of selection curves of trawl nets assuming that these also could be represented by the normal integral (Cassie 1955). Further development of this technique was probably overtaken by the rapid spread of computers but if this had not occurred the method would probably have gone into wide use.
Collection of the basic data on total catches by species, ports etc was begun for the marine commercial fisheries fairly early although with many deficiencies. Routine collection of any data on the size distribution of catches did not begin, even on a small scale, until the early 1960s.
For the freshwater fisheries, which are essentially all recreational, the only practicable approach to the collection of catch data seemed to be by means of a voluntary diary scheme. Such a programme was initiated in 1947 (Allen and Cunningham 1957). Only about 2% of the anglers in the country co-operated but even with this low sample rate the scheme gave useful data on quantities of fish caught, rates of catch, size of fish in various waters and distribution of species. The nature of the process and the low sample rate allowed much scope for biases and other errors.
One of the statistically interesting problems for which the scheme provided data concerns the nature of the distribution of the number of fish caught by one angler in one day. This is consistently highly skewed with a peak of zero or a small number but with a long tail. Typically it does not fit well to a Poisson or a negative binomial distribution. Empirically it has been found that in a wide variety of examples both in New Zealand and overseas it is well fitted by a normal distribution of log (n+2), n being the number of fish in the catch (Allen 1955). No rational explanation for this relation has yet been proposed.
In 1938 a major quantitative study of the trout population of the Horokiwi, a small stream near Wellington, was begun. Field work lasted to 1942 and analysis was

161
1932 FisheriesK. Radway Allen (Chief, Division of Fisheries and Oceanography, CSIRO, Australia, formerly Biologist, Marine Department, Wellington, New Zealand)
I left New Zealand in 1964. This was just at the dawn of the computer age and I actually did not see a computer until I arrived in Canada. Thus most of the time I spent in New Zealand, and about which I am writing here, falls within the first period which I have described elsewhere in relation to fisheries modelling as the theory-limited period; it has been followed by the calculation-limited and the data-limited periods; the latter being the one we are now in (Allen 1994).
Fisheries science, as distinct from fish biology, is an applied field of science concerned with finding means of rationally managing fisheries resources. In the broad sense, its principal tools have been models in which the inputs have been information about the quantities of fish caught, the composition of the catch as regards species, age-structure etc the effort required to take the catch; the biological parameters describing the growth, reproduction and so on of the species taken in the fishery; and appropriate environmental features.
In recent years models have become stochastic and highly complex and consequently require large amounts of data which can be subjected to sophisticated statistical analysis. In the period of which I am writing models were almost exclusively deterministic and input parameters were, even if uncertainty was recognised, “best estimates”. This is true even of the undoubted “Old Testament” of fish population dynamics published by Beverton and Hold in 1957.
The first paper published in New Zealand dealing quantitatively with a fisheries problem seems to be one by Percival in 1932. This compared a long time-series of data on the mean size of fish taken by one angler in the Oreti River with a number of variables thought likely to reflect fishing pressure or accessibility of fish to anglers (eg income from fishing licenses sold, registration of motor vehicles, expenditure on roads). Not unreasonably, although without any statistical analysis, it concluded that increased pressure by anglers was likely to have contributed to an observed decline in mean weight over 1888-1930.
Data on the age structure of the catch are central to a great many attempts to assess fish populations for management purposes, generally using techniques based on the models of Beverton and Holt (1957). The first published data on the age and growth of fish in New Zealand were those of Parrott (1932) who used scale-reading, including the back-calculation technique, to study trout in several rivers. No statistical

162
anglers.From these basic quantities estimates of the total amount of trout material being
produced by each age group during each year were calculated. Finally the efficiency of the whole system was examined by comparing the amount of food and the production of trout with, on the other, the quantity taken in the angling catch. The annual amount eaten was found to be between 40 and 150 times the average amount present at any one time. The annual production of trout was estimated as about 2300kg in a normal year. Of this amount anglers only took about 120kg or 5%.
The sampling errors involved in these estimates were examined as far as possible using standard methods. The approximate 95% confidence limits were estimated as being:
Trout population number ±20-30% Proportion mature ±50% Amount of food consumer ±20% Mean weight at age ±5% Total egg production ±50%
Although there have been great advances in the available collecting and analytical techniques in the fifty-odd years since this work was done, it appears to remain one of the most comprehensive quantitative studies of a fish population that has ever been undertaken. It seems regrettable that no follow-up studies have as yet been undertaken to examine the effects on the fish community of the Horokiwi of the great environmental changes that have clearly taken place in the stream since the 1930s and 1940s.
References:Allen, K. Radway, 1951: The Horokiwi Stream. A Study of a Trout Population, NZ
Mar, Dp. Fish. Bull. 10:230p + 12 Plates + 1 Map.Allen, K. Radway, 1994: A Personal Retrospect of the History of Fisheries Modelling
in Population Dynamics for Fisheries Management. D.A. Hancock (ed) Aust. Soc. Fish. Biol. Wksp Proc. Perth. 1993: 21-28.
163
completed in 1951 (Allen 1951). This attempted to estimate primarily:
the number of trout of each age group present the rate of which they grew the amount of food they ate the amount of the bottom fauna from which they derived this food the numbers and weight taken by anglers
The amounts of trout and of bottom fauna were estimated by sampling methods, respectively by catching as many fish as possible from sample areas and estimating the efficiency of capture by mark-and recapture techniques and by collecting the bottom fauna from known-area samples of stream bed and extrapolating to an estimated total area, stratifying for environmental conditions.
Growth rate was estimated both by following the modes in the length distribution over the first two years of life by regular sampling and from the growth of marked fish between release and recapture. The amount of food eaten could not be estimated directly but was calculated from the estimated numbers of fish at each age and the individual food consumption, the latter being estimated from observed growth rate combined with external data on the maintenance requirement and the efficiency of conversion. The angling catch was obtained directly from records kept by co-operating

164
9 yrs 24.33 12.26 — —
10 yrs 32.13 14.41 26.34 13.64 11 yrs 41.74 15.17 33.76 15.06 12 yrs 47.83 14.13 39.70 15.37 13 yrs 52.41 13.22 44.39 14.92 14 yrs 55.38 12.33 — —
The 1968 sample has clearly gained considerably higher scores at each level, the increase being approximately half a standard deviation in each case. Since nearly 1000 pupils in each group were tested in each age group in 1968, and 5,000 in 1936, these gains are all highly significant statistically. Viewed in another way, it can be seen that the 1968 children are more than one year of mental growth ahead of their 1936 counterparts.
Another substantial change which occurred during the period was seen in the greater divergence between the scores of boys and girls. In 1936 the mean scores for girls exceeded those for boys by a non-significant margin, of only one or two raw score points at each age level, but by 1968 the differences had increased to about four points, which was highly significant at each age level.
A third aspect of study was the difference between Urban, Town, and Rural areas. The mean for the Urban children in 1936, was higher than that for the Town, which was also higher than that for the Rural children. Although the same ranking order was maintained in the 1968 survey, the means were closer. For example the mean scores for the Urban and Rural groups in 1936 were 34.0 and 27.6 respectively, by 1968 these had increased to 37.8 and 35.4 respectively.
Differences between occupational groups were also surveyed, with six such groups being chosen. In both 1936, and 1968, the children from Professional and Technical groups show considerably higher scores than children in other groups, at each age level with a steady decrease in score through skilled, semi-skilled, and unskilled groups. Intelligence in New Zealand is distributed throughout the social status hierarchy in the same way as it occurs in other westernised countries. During the period the scores of all groups, and for all ages within each group, increased significantly. However, the unskilled groups showed a greater mean increase than those from skilled and professional groups; for example for the 11 year-olds the mean score of the unskilled group increased from 28.4 to 34.6, while the professional group increased from 43.6 to 48.1. One notable increase in this age group was the farming group which increased its score from 30.8 to 45.3.

165
1936 Changes in mental ability in New Zealand school children 1936–1968Editor
Although the status and usefulness of verbal intelligence tests is widely debated, it can be claimed that they do provide a reasonably accurate indication of the quality of those general intellectual skills and abilities which are helpful in achieving success in academic work. Their predictive validity has been widely demonstrated both here and overseas. Without pretending, then, to throw light on such controversial questions as the nature of intelligence or on the relative contributions of hereditary and environment in verbal test performance, the following findings do provide some basis for concluding that the general reasoning skills of New Zealand children have changed considerably since 1936.
The Otis Intermediate Test of Mental Ability was prepared in 1921 by Dr Arthur Otis for the measurement of scholastic aptitude or ‘verbal intelligence’, and originally designed to predict rate of progress through school. Raw scores from the test are converted to ‘Intelligence Quotients’ based on a mean of 100 and a standard deviation of 15 at each age level. The fact that over 50,000 copies of the test are sold annually suggests that this test is the most widely-used standardised group test in New Zealand.
In March 1936 the Otis Test was administered to a representative sample of 26,000 New Zealand pupils (one in every five) between the ages of ten and fourteen years. Schools were chosen at random to represent all board districts, all kinds of community, and all types and sizes of public and private schools, although some urban schools were systematically chosen in order to ensure adequate representation of each type of urban environment. Within each school, all children of the relevant age were included in the sample.
In March 1968, just 32 years later, the same test was carried out on 6,000 pupils, between the ages of nine and fifteen years. Again, the same types of community were selected.
Following is a table setting out the means and standard deviations of the two surveys.
Otis Means and Standard Deviations 1968 and 1936
1968 1936
Age Mean S.D. Mean S.D.

166
In the discussion section Elley observes that the consistent trend observed in mean scores on the Otis Test for each age group points to a definite improvement in the New Zealand public school population over the thirty two years surveyed in those verbal reasoning skills which make for success in academic schoolwork. Although the Teacher’s Guide book for the 1936 survey described the Otis as a test of a ‘child’s inborn capacity..........in no way concerned with the effects of schooling’, it is abundantly clear that success in such tests is considerably dependent on the quality of a child’s educational environment.
W.B.Elley “Changes in Mental Ability in New Zealand School Children” N.Z.J.Ed.Studies Nov 1969 V4(2)

167
1940 Notes on the State of NZ Climatological Statistics in the 1940sN. G. Robertson (Scientific Officer, Meteorological Services, DSIR)
Back in 1859 the Colonial Government decided to establish ten official meteorological stations at selected sites from Mangonui to Invercargill. The required instruments were obtained from UK and then distributed to Provincial Governments to set up and operate the stations. The official observers were required to record readings twice a day and to forward monthly returns to the Auditor-General, Wellington for inclusion in the annual published Statistics of New Zealand. In 1862 the first five official climatological stations were established at Auckland, New Plymouth, Wellington, Nelson and Dunedin. From these beginnings a network of official climatological stations gradually developed under a system by which a government department was responsible for setting standards for the meteorological instruments (usually supplying the instruments themselves) and the observational techniques, and for collecting, summarising, and archiving the data. In 1879 a separate network started up in which voluntary unpaid observers in selected localities were provided with a rain gauge in return for a monthly report of daily readings at 9am.
Responsibility for maintaining the climatological archives passed to the Geological Survey in 1867, to the Colonial Museum in 1903, then to the Marine Department in 1906. A major reorganisation occurred in 1928, when the Meteorological Office became a branch of the newly created Department of Scientific and Industrial Research. The following year a new building was erected for the Meteorological Office at Kelburn, Wellington which became the repository for all the observational data recorded over the years at official meteorological stations; by that time the number of climatological stations had grown to 40 and rainfall stations to 400. Most of the data consisted of monthly forms on which the observers had recorded their daily 9am weather observations. At a few selected stations additional instruments had been installed to provide continuous records of atmospheric pressure, temperature, rainfall, wind speed and direction, and bright sunshine. For statistical purposes much effort was put into scaling hourly and extreme values from these recordings. In 1928 the Meteorological Office began a new annual publication “Meteorological Observations for the Year .... ”, which was distributed widely throughout NZ and exchanged for similar publications by other countries overseas.
After the Great Depression of the early 1930’s there was a rapid expansion in public services in the fields of communication, transportation, electricity generation and distribution, agriculture and forestry, etc, mostly under Government control.

168
A greatly increased demand for more extensive and detailed rainfall statistics followed the Soil Conservation and Rivers Control Act of 1941, and the establishment of regional Catchment Districts. The Meteorological Service was committed to increasing the network of rainfall stations from 600 to 1000 and to equip 100 of them with recording rain gauges. Similarly the co-ordination and expansion of river flow, runoff, soil-loss statistics became the responsibility of the Public Works Department. The main objectives were:-
(a) to apply the theory of extreme values (using the technique which later became known as the “Gumbel Method”) to estimate the “return period” of extreme rainfalls, making use of available tabulations of the highest daily rainfall each year.
(b) to extract from the recording-rain gauge charts data which could be used to determine “rainfall intensity-duration-frequency” relations for duration from ten minutes up to three days.
This was a long-term project but the information, as it became available, would find ready application in problems of urban drainage, flood control of major rivers, design of bridges, culverts etc.
Water is a valuable commodity: the need to dispose of it as quickly as possible to prevent flooding must be balanced against the need to conserve it for other purposes, particularly for hydro-electric generation, for town water supply, and for irrigation, all of which were being rapidly developed immediately after WW2. An analysis of the long series of daily rainfalls was carried out to determine the occurrences and frequency of periods of abnormally-low rainfall as a rough indication of the frequency of droughts. Daily and monthly rainfalls from a few selected long-term stations were subjected to time-series analysis in the hope of developing a method of statistical forecasting, but the outcome was found to be of no practical value.
In the late 1940’s the first attempt in NZ to produce salt, on a commercial scale, by the natural evaporation of sea water began at Lake Grassmere, a shallow lake on the coast near Blenheim. The initial results from this very weather-sensitive enterprise were not promising, and we were asked to suggest a better site, preferably in the North Island where the greatest demand for the product would occur. This should be a coastal area with high evaporation and low rainfall particularly in the late summer-autumn period. The investigation showed that Lake Grassmere clearly was the site with the best potential. At that time it had been assumed that rain falling on ponds containing concentrated brine would mix with the brine and so dilute the solution. Actually there is little mixing - the rainwater remains on top of the denser brine. By redesigning the plant so that the final crystallisation ponds had level edges, and were kept full of concentrated

169
The efficient development of all these activities created a demand for new types of weather information, from up-to-date reports over air-routes to detailed weather statistics for planning large-scale new enterprises, such as the creation of a national system for generating and distributing electricity, a national roading network suitable for motor vehicles, new aerodromes and associated facilities to meet the rapid expansion of aviation services (regular commercial passenger flights began in 1934). Parallel developments in radio and telecommunications made it possible not only to receive weather reports promptly but also to distribute forecasts, warnings etc to the general public without delay. Through the International Meteorological Organisation, Geneva, (which had been active since 1880) a system was introduced for the international exchange of current weather information. Countries agreed to start short-wave broadcasts, at six-hour intervals, containing weather reports from selected stations (including ships at sea) using internationally agreed codes. During World War II, however, these broadcasts were enciphered and the information was available only to the Allied Armed Forces.
On the outbreak of war the Meteorological Office was transferred to Air Department. From 1942-1947 it was mobilised as a unit of the RNZAF, and its area of responsibility expanded to include British territories in the South Pacific from the Solomons to Pitcairn. These were days of national conscription in NZ. Teachers and scientists from other disciplines and fields were drafted and given meteorological training to meet the demand. In this period the meteorological staff grew from 36 to over 300. After the War, by international agreements through the South Pacific Air Transport Council, New Zealand retained responsibility for meteorological services in the South Pacific. Thus from about 1941 onwards, data for climatological purposes in this region (excluding French territories) was collected and processed at Lauthala Bay, Suva.
In 1947 the Meteorological Service reverted to Air Department and later to a new Department of Civil Aviation.
In the late-1930’s, when trans-ocean air services to and from NZ were first considered, it was expected that flying boats would be used, and indeed they were used regularly between Australia and NZ up until 1954. However, following the rapid war-time advancement in aviation it became obvious that the future of commercial air services would involve the use of large, fast land-based aircraft which could operate only from large and very costly aerodromes. Detailed analyses of meteorological factors were carried out to assist in first selecting the best location and secondly, designing the general layout, particularly the direction of the main runway and the possible need for a secondary runway. “Usability Factors” were calculated, involving varying limits of low cloud and visibility, occurrences of fog, wind speed and direction, runway cross-wind component, and these were used in conjunction with many other factors in reaching the final decision.

170
brine, any surface rainwater simply overflowed without interrupting the final crystallisation process. Thus a site which had simply been used as a practice bombing range by the RNZAF during the war was turned into a very successful solar-salt works.
At this point it is appropriate to mention that, up to the late 1940’s and beyond, all detailed climatological statistics had to be extracted manually from the original manuscript records, with an adding machine as the only mechanical aid. Research workers investigating weather-related problems in other fields, such as agriculture, marketing, forestry, medicine, etc, often wished to receive copies of data in the meteorological archives for correlation with the particular variables they were investigating. Generally it was either impracticable or too expensive to meet such requests. Xerox photocopiers, magnetic tapes or disks for data recording, computers for data processing were all years in the future, indeed the first transistor was only invented in 1947. However the potential for automatic data handling was realised when teleprinters were installed about this time to receive the incoming synoptic weather reports. These machines also produced a continuous punched paper tape which was later passed through a special tape-to-card converter in order to transfer the data to 80-column Hollerith cards. Half a dozen IBM key- punches were also acquired with which to begin a regular program of data entry on punched cards. As a matter of interest, a few years later the first use of these punched cards produced a detailed analysis of hourly wind data at Nandi, Fiji, using an IBM sorter-counter located in the Statistics Section of the Health Department.
Later developments saw magnetic tape replace punched cards as the medium for mass data storage, leading ultimately to the present day position, whereby anyone with a modern computer and a connection to the Internet can access, at modest cost, large amounts of climatological statistics from most parts of the world.

171
1947 Dental caries and soil typesEditor
Between 1947 and 1952 national surveys were carried out in New Zealand to broadly define the relationship between different soils and caries prevalence. The first was undertaken by R.E.T.Hewat and D.F.Eastcott. A study was made on approximately 12,000 children aged between 12-17 years, who were examined by the same dental examiner. Caries prevalence in relation to 38 different types of soils was determined and it was found that eight soils were associated with a significantly low caries rate.
A further national survey involving approximately 4,000 children aged six years in 200 rural centres, was undertaken by P.B.Cadell, the examinations being made by school dental nurses, with the results published in 1962. This survey was primarily undertaken to furnish further data on soils not adequately covered by the former survey. These results were compared with similar studies done in the United States of America, and it was remarkable that the caries prevalence between soils in both countries should be similar. From the two New Zealand studies it appeared that different soil types were having different effects on the prevalence of dental caries of children’s teeth. It was then decided to carry out a survey on the dental health of two more on less identical cities. It was hoped that such a study would make interesting and worthwhile comparisons.
Hastings and Napier were the two cities chosen. They were similar in many respects: both were situated in the eastern part of Hawkes Bay, they had similar socio-economic conditions, racial composition, educational standards and the two cities drew their reticulated water-supplies from the same artesian strata. In addition, the two cities have a common milk supply, and meats used in both are obtained from similar sources. Between September 1954, and April 1955, further dental examinations were carried out in both Hastings and Napier. Unfortunately for the study, it was found that the Hastings water had been fluoridated at an optimal level, at the same time as the study started. However, the results did show that at the start of the survey, younger children in Napier already had a considerably lower caries-experience than equivalent children in Hastings.
In 1957 Thomas Ludwig began a study, as part of his degree, Doctor of Dental Surgery (Otago University), on the relationship between Dental Caries and “Saline Gley Soils”. He had hoped to study the records of the Hastings-Napier survey, using Napier, which had this type of soil, as the “control” city. This, however was no longer feasible, since the Hastings water had been fluoridated, so he chose Palmerston North which was similar in many respects to Hastings, and is, moreover, situated in soils which

172
Palmerston North represented a reasonable substitute for Hastings. Statistical tests, namely the “X²” and “t” tests, were carried out, and are given
in a series of tables, which show that, in both 1957 and 1961 dental caries were significantly less (at the 0.1% level) in Napier, than in Palmerston North. (p 28, Tables 8,9).
The results show that Napier children had a higher resistance to dental caries than children in Hastings in 1954-55. While fluoridation in Hastings has obliterated the difference between the two cities, the comparisons between Napier and Palmerston North, show that the enhanced resistance to caries of Napier children has been maintained and appears to have extended to older children. The original finding of the difference between the children of Napier and Hastings was unexpected in view of the apparent similarity of the two cities.
The principal and, indeed, the only major difference that has been found between the two cities is that they are situated on different types of soils. While both places are situated on soils derived from similar parent materials, those at Napier are classified as “saline gley soils”, and have a recent marine history. The marine history of Napier soils is the result of a major Hawkes Bay earthquake which occurred in February 1931. This earthquake resulted in a land mass some 96 kilometres long and at least 16 kilometres wide being raised to heights of 3 metres. Much of the land has been used for residential purposes, and thus, a high proportion of Napier children were resident on the saline gley soil areas. Also, with the diminution in salinity which has occurred, a highly fertile soil was being used extensively for market and home-garden vegetable production.
The question arising from this study was “Why do Napier children have much better teeth than those of Hastings?”. It seemed that some undefined trace element (possibly molybdenum) in the Napier saline soils, conferred some protection against caries in Napier children. And this gave rise to a whole new line of research.
R.E.T.Hewat and D.F.Eastcott – Dental Caries in New Zealand, Report of an Epidemiology and Racial Study – Medical Research Council of NZ, 1956
P.B.Cadell – Prevalence of Dental Caries in relation to New Zealand Soils. Int.Soil Conf . N.Z. 1963
T.G.Ludwig – A Thesis submitted in partial fulfilment of the requirements for the Degree – Doctor of Dental Surgery, Otago University. 1964

173
are closely comparable to those that occur in Hastings. Examinations were carried out in both Napier and Palmerston North in both 1957 and 1961. Results of the examination of Palmerston North children in 1957 showed that caries prevalence was closely comparable to that among Hastings children in 1954-55 and indicated that

174
1947 Foot Measurements of New Zealand ChildrenEditor
The New Zealand Standards Institute was set up by the Government in the late 1930s to improve the quality of products manufactured in New Zealand. This Institute set up a number of committees to deal with the various products. One such was the Footwear Survey Advisory Committee. Up to this time the lasts for making children’s’ footwear had been made in England and it was becoming clear that shoes made from these lasts did not meet the requirements for New Zealand children. The Committee which was set up by the Institute to produce standards for suitable lasts included members of the medical profession, representatives of the footwear and last manufacturers and officers of the appropriate Government departments.
The design of the sample, provided by the representatives of the Census and Statistics Department was arranged to provide an adequate coverage of all children in New Zealand. A method of sampling was designed for application to State schools. From each school so selected, a predetermined number of pupils in each class was systematically sampled from the class roll and their foot measurements recorded. In addition, pre-school children were included from clinics of the New Zealand Society at Auckland, Masterton, Wellington, Christchurch and Dunedin.
An apparatus for the taking of measurements was made by the Dominion Physical Laboratory and the Applied Mathematics Laboratory was asked to undertake the analysis of the measurements.
For several reasons, all the observations were calculated in four groups, those from girls and boys separately and within each sex a further subdivision by age was made between those older and those younger than nine years of age. Means, correlations and standard deviations were computed and regressions between age, sex and the various foot measurements were calculated. A factor analysis was then made using Hotelling’s method of principal components, the results of which were plotted by Thurstone’s method of extended vectors.
References:1. Dick, I.D. 1952 : Foot Measurements of New Zealand Children NZ J. Sci. tech
B33(6).

175
1949 Aerial top-dressing measurement trialsEditor
Aerial top-dressing of hill country with fertiliser, particularly superphosphates, has been a regular practice in New Zealand since 1949. During the development stages and in the years since, the Department of Agriculture has conducted experiments to measure the spread of this fertiliser on the ground.
The first such large-scale measurement trial was carried out by the Department of Agriculture during 1949, with a loan from the RNZAF of a Grumman Avenger Aircraft. In all operations, ground staff and radio were used to guide the pilot accurately onto his lines of flight, which were spaced evenly at 2 chain intervals. The aim was to find out whether it was possible to achieve an even distribution of the superphosphate. Measurements were taken in ‘cwt per acre’, at 50 feet intervals along the line of flight. However, it was shown in this trial, and confirmed in later ones, that no matter how good the flying, the ideal spread was never likely to be achieved.
A second trial was carried out in 1950 with a light aircraft (Tiger Moth). Because light aircraft operate without the assistance of ground control, the efficiency of fertiliser distribution from these aircraft must depend to a considerable degree on the skill of the pilot. The purpose of this trial was simply to find out the type of distribution pattern that would be obtained with this aircraft, spreading each of three different fertilsers.
Trials were made with a de Havilland Beaver, in 1951 and 1953, which aimed at the comparison of different types of granulated phosphate when dropped from this aircraft. Further trials were made with a Bristol Freighter, in 1954, with a modified DC3 (Dakota) in 1955, and with both a de Havilland Beaver and a Fletcher FU24, also in 1955.
Conclusions from trialsThough the series of trials did not allow of precise evaluation, some conclusions could fairly be drawn:
(1) One of the most obvious conclusions was that no really satisfactory technique of measurement had been achieved. No definite answers could be given on the effect of granulation on fertiliser distribution because of the failure to account for all material dropped, including the fractions of large particle size.
(2) Unless special precautions are taken, a single application of fertiliser applied from an aeroplane is likely to be very unevenly distributed.
176
(3) There is probably a serious loss of the ‘dust’ fraction of materials dropped, especially with windy conditions and high flying. Though the percentage lost in this manner is not known, there is sufficient evidence to show that it can be very substantial.
(4) Granular materials are probably dropped more precisely and must be used with applications from relatively high altitudes.
(5) The data did not permit evaluation of the different makes of aircraft, types of hopper, etc, for efficiency of spread. Speed of flying may also be an important factor.
(6) Wind speed and direction in relation to aircraft height and direction of flying, appear to be of overriding importance in determining the type and efficiency of spread.
Jean G Miller and N S Mountier, “Department of Agriculture”, N.Z.J Agric., 1959, v 98, pp 369-384

177
1951 Identical twin experimentsI D Dick, AMD
The paper by Peter Whittle and myself (“Contributions to the Statistical Design of Identical Twin Experiments”, NZ Journal of Science and Technology, B33(3), pp 145-172, 1951) on the statistical design of identical twin experiments, was of high interest to MacMeekan and others using identical twin calves at the Ruakura Animal Research Station.
It was neither necessary nor appropriate to discuss in this paper the significance and importance of identical twin calves in animal research. The animal research people believed and hoped that the use of such animals would go a long way towards solving two vexed and important problems in animal experimentation and genetics. In the 1930s and 1940s (and later), there was much speculation and argument on the question of nature versus nurture — in other words, what was the relevant importance of genetic makeup as compared with environmental treatment on the animal’s development?
The other matter of very real practical importance was the hope that the use of identical twins would provide sets of very much more uniform experimental animals, and thus reduce the number of cows required if one wished to obtain results of a given accuracy. In a lot of field trials one could use only about one cow per acre and, hence, one wanted to be able to use as few cows as possible.
As far as we knew, the Swedes and the Germans were the first people to take a real interest in the use of identical twin calves. In 1938, MacMeekan saw this work but at that time the research groups were too small for swift and positive results. When MacMeekan went to Ruakura, he found that John Hancock had already embarked on a twins project. Hancock was Finnish born, with a mixture of European blood, but predominantly English on his father’s side. (For notes on Hancock, see MacMeekan’s biography by Gordon McLauchlan).
It is not known how, why, or when Hancock came to New Zealand, presumably before the outbreak of World War II. He was fluent in Swedish and, either from reading the Swedish literature, or, perhaps, having seen the Swedish work on the ground in Sweden, after his arrival in New Zealand and his appointment to Ruakura, he started preparatory work to establish what uses the twins could be put to.
He had two valuable allies — Jack Ranstead, a prominent Shorthorn stud breeder at Matangi (close to Ruakura) and Professor Dry, of Massey. Ranstead was a genetics enthusiast. At his home he had what was for many years the best genetics library in the whole of the country, universities included. Professor Dry, later the founder of the Drysdale sheep breed, did pioneering work in the development of procedures
178
of n(n-1)/2 pairs. To illustrate, for 3 treatments — A, B, and C — the fundamental group would consist of three pairs — (A,B), (B,C) and (C,A). If the fundamental group by itself is not sufficiently large to give results to a required degree of accuracy, then the fundamental group itself has to be completely replicated until the required accuracy is obtained.
The quasi-factorial design has several limitations. The number of treatments is limited to 4, 8, 16 and so on. For four treatments, a fundamental group of four sets of twins are required. If the treatments are A, B, C, and D, then the fundamental group consists of four pairs — (A,B), (C,D), (B,D) and (A,C). For eight treatments, the fundamental group consists of 12 pairs of twins.
Using incomplete block designs, the efficiency of twin utilisation falls off, the formula being nE/[2(N-1)], where E is the full efficiency given by the simple paired treatment comparisons, and N is the number of treatments being tested in the incomplete block experiment. Hence, for three treatments, the efficiency is reduced to 3/(4E).
The quasi-factorial with four treatments is not quite as efficient as the corresponding incomplete block design. Four of the six treatment comparisons in the quasi-factorial are made with the same efficiency as in the incomplete block design, but for the remaining two, the efficiency drops by 33%. For eight treatments, the efficiency of the quasi-factorial design has dropped so much as to make this design not very suitable.
Missing plot formulaeMacMeekan quickly saw the advantages of using the incomplete block designs. But because the conclusions to be drawn from them depended greatly on the symmetry of the designs, he was not prepared to use them unless formulae could be found to cope with the loss of one or more twins in the experiment. He was concerned that the loss of the results from one or more animals might render the whole experiment virtually useless. This, however, is not so, as estimates of missing values may be made for the twin designs, just as has been the case for other types of experimental designs.
It was relatively easy to find the necessary formulae for incomplete block designs. Three possibilities were considered: (1) The case of one missing animal; (2) a complete twin pair missing; and (3) two missing animals not in the same pair.
In the quasi-factorial designs, it was found too difficult to find simple solutions, but valid results could be obtained by fitting constants and doing a regression analysis.
As far as I know, the quasi-factorial designs were never used at Ruakura. We included them in our paper for the sake of inclusiveness.

179
such as nose prints, to help determine if a pair of twins were identical and not just merely fraternal. When he arrived at Ruakura, MacMeekan supported Hancock most enthusiastically. Being in the middle of the Waikato, with its high density of dairy farms, they were able to acquire many sets of twins quite quickly.
After discharge from the Army in early 1946, I returned to the DSIR. It was not long before I went to see MacMeekan at Ruakura. I had first met him at Lincoln College where he was a Professor of Animal Husbandry and I was taking his lectures on the animal husbandry. I had also been with him as one of the foundation members of the Animal Production Society of New Zealand.
Twin designs and their efficiencyI naturally saw the identical twins; they were of great interest. Their increasing use for research purposes made it highly desirable, if not imperative, to explore the possibilities of finding experimental designs which would use them as efficiently as possible. When the number of treatments is only two, no difficulties arise, as the simple and obvious method of paired comparisons is fully efficient.
Paired comparisons, however, have the serious defect of limiting the number of treatments to two. But we knew that there were various ways to surmount this limitation and in view of the results put forward by the Swede, Bonnier, and his colleagues, it was necessary that the efficiency of these possible arrangements should be closely examined.
The first requirement was to find formulae whereby the efficiency of the use of identical twins could be estimated from observational field data. The simplest way is to assume that, in a uniformity trial, the variation between twin pairs is the same as that to be expected between ordinary cows. In which case, it was shown that the efficiency would be given by the express .5 (Mb/Mw-1), where Mb and Mw are the mean squares for between and within pairs. Using Bonnier’s data on a uniformity trial of 8 pairs of twins, the formula above gave an efficiency of 25 compared with Bonnier’s estimate of 24.1, derived in a quite different manner.
Later in the paper the interesting possibility is mentioned that the twin efficiency could be deduced from a twin experiment in which treatments had been actually applied, thus dispensing with the costly uniformity trial.
Experimental designsThere are two major types of experimental design, incomplete randomised blocks and quasi-factorial designs, whereby one is not restricted to the use of simple paired comparisons should one wish to test more than two treatments simultaneously.
For the incomplete block designs, the fundamental group consists of sufficient pairs of twins to ensure that every treatment occurs once, and once only, with every other treatment in a pair. If there are to be n treatments, then the fundamental group consists

180
181
1952 Experimentation in industryL F Jackson, Emeritus Professor, Victoria University; formerly Technical Officer, Amalgamated Brick & Pipe Co and Crown Lynn Potteries, Auckland Ken Seal, formerly Chief Technical Officer, Amalgamated Brick & Pipe Co and Crown Lynn Potteries, Auckland
Experimentation has always been a part of industrial progress and invention, but systematic designs to achieve the maximum efficiency, in the sense of information gained from an experiment, was born from the needs of scientists in agriculture, who were faced with extreme variation in the conditions of their trials. The time and cost required forced them to consider ways of examining the effects of multiple factors on the outcome in a single experiment. Industrial research workers in the United Kingdom quickly absorbed some of this technology and Ken Seal had used these ideas while working at GEC and London Brick Company (see Chapter 1, A tribute to AMD). Early in his experience at Amalgamated Brick & Pipe in 1952, he approached W B Taylor, then at Plant Diseases Division of DSIR at Mt Albert, for assistance. Experimentation was well established in New Zealand in agricultural research and analysis, but had not been used in industry.
The first experiment that convinced management of the value of these methods was an analysis of mixtures of three alternative clay materials and three papa materials (a soft blue grey derivative of marine sandstones or silts) for brick making. The experiment clearly demonstrated that there was no main effect, but that there was a very strong interaction effect which meant that one of the mixes was much more suitable for brick making than for any of the others. This was later identified by conventional methods as being due to the permeability of the mixtures. This demonstration of the value of the methods was one of the factors in L F Jackson’s recruitment in 1957. H R Thompson was at DSIR and worked with Jackson on some early experiments.
After some laboratory experiments, Jackson quickly moved to larger experiments in the plant to find methods of reducing cracking in bricks. Like field experiments, the experimental conditions were variable across locations at which the product was dried and fired. So this initial experimentation was largely concerned with finding out the relative magnitude of variation associated with the drying and firing locations and environmental conditions, and assessing the error components associated with each of them, so valid inferences could be made about main effects. Since gradients across the experimental region was especially common, Latin and other square designs were often used within plots.

182
trials and firing conditions for the earthenware products (which were the main products from the pottery). These ultimately led to some simple routine procedures based on cutting carefully oriented sample pieces from fired ware and measuring their porosity. For approximately the same body compositions, the porosity is directly related to the internal surface area of the samples and correlates extremely well with long term properties of the ware and its glaze. This provided the key technical measure used in the application of a sequential control design published by Seal and Thompson, and used continuously for process control until Crown Lynn closed.
In many ceramic products the strength and thermal properties depend crucially on the proportions of particular components. This led to some early experiments that were based on points on a simplex in the mixture space, Seal (1965). George Box had identified that, for these designs, additional power was obtained by replicating one or more of the experimental points. His designs were adapted and widely used in experiments to find mixtures with desired properties as, for example, in trials for lining material for cement kilns supplied by the refractories division of the company.
It would be churlish not to acknowledge the constant support given to the efforts of the technical staff by Malcolm and Sir Thomas Clark, joint Managing Directors of Amalgamated Brick & Pipe Co Ltd, and Crown Lynn Pottery. Both companies later became part of Ceramco. Few companies of that time supported their technologists so strongly or encouraged such a level of innovation and experiment.
This initial use of experimentation led to wide use within the industry through the Pottery and Ceramics Research Association staff, and experimental designs were also used at McSkimmings in Otago, and at Temuka Potteries. It also contributed to a wide range of applications of statistics and applied probability in other aspects of the industry.
ReferencesL F Jackson, “The Use of Statistics in Clay Technology”, Australian National Clay
Journal, 3, (1962), No 10K E Seal, “The Use of Responses Surfaces in the Ceramic Industry”, Eighth
Commonwealth Mining and Metallurgical Congress, Vol 6 — Proceedings General, Paper 138, p 525-531 (1965).

183
Ken Seal had found that it seemed difficult to maintain consistency in the performance of the ‘same’ clay material and this led to very careful control of the mixing of the material. It was laid down in one direction, stripped in another direction, and then stockpiled in a process which ensured still further mixing. There was further mixing in initial processing. This had a very large impact on consistency in the plant and the description shows the process was clearly informed by ideas of orthogonality from experimental design.
With understanding of the properties of measurements, it was possible to move to large designs. Little was known about the factors influencing performance of the major item of production equipment — a brick extruder, which is a machine like a giant sausage machine. There was no reliable information about the way in which auger pitch, auger speed, die spacer characteristics, die holders, die lengths, and machine vacuum, influenced output and quality. So it became imperative to conduct experiments which found out as much as possible about the main effects and interactions with local materials. Given the limitations of computing technology available at the time, it was natural to turn to large fractional factorial experiments, aiming to estimate main effects and first order interactions. Unfortunately, changing the experimental conditions involved stopping the whole plant and making major physical changes to the equipment, so an experiment could end up using the whole production capacity for periods of up to three days.
The results of the largest of these experiments led to a reduction of 30 per cent in defective products, and a doubling of the rate of production. After that, it was possible to do experiments whenever the technical staff felt they would be beneficial. It created an environment within which technical staff were seen as a key component in management and essential to improving financial performance.
Not all the experiments had this sort of impact. Many in the Crown Lynn Pottery were on a much smaller scale, but were crucial to establishing the technology that enabled use of the local clay materials. The railway cups were legendary in New Zealand, but making their handles stick on was not trivial. And a wide range of experiments using factorial designs were carried through to explore the critical moisture content of both cup and handle, and the properties of the mixture used to attach them together.
Some of the most interesting experiments were in attempting to build standard methods of measurement that would enable comparison of results from different
184
elasticities for final wool textile products in a limited number of developed economies for which useable data was available. Important as these results were for later use, they were limited to the countries included that made up only a part of the ‘wool world’, for which an overall world model was required.
For such a model (expressed as follows in a stripped-down form) it was hypothesised that:
1. The world consumption of raw wool (denoted by CW) was a positive function of average world real income per capita (RY) and a negative function of the real or deflated price of wool (PW).
2. The supply of wool (SW) in each year was assumed to be exogenous, ie not influenced by variables at work in that year, especially current prices. Insofar as supply was influenced by prices, it was prices prevailing in earlier years, given the long lags in the sheep breeding and wool production process. This is to say that wool supply was predetermined.
In equation form, the model can be set down as:
CW = a - bPW + cRY (1) SW = predetermined
But, in any one year the wool market must clear so that:
CW = SW
so we can substitute SW for CW in equation (1), and then solve for PW thus:
PW = SW + RY (2)
All sorts of alternative functional forms can be adopted, or other peripheral variables can be added to such an equation, but as an expression of a ‘stripped down’ form, we ignore them in this paper.
As it happens, such an equation is a very realistic expression of what does happen in the wool market, with each season’s wool clip being, as it were, dumped on the international auction market with wool growers taking, as given, whatever price they can get.
Results of regression analysisThis equation was evaluated by regression analysis both in its stripped down form as presented above, as in Philpott (1953), and with various modifications and extensions and variations. Here we concentrate on the stripped down version.

185
1953 Early work on the econometrics of wool pricesBryan Philpott, Emeritus Professor of Economics, Victoria University
IntroductionEconomists, interested in empirical quantification of economic relationships, cannot have recourse to controlled experiments and, therefore, critical importance attaches to statistical analysis of data from specially commissioned cross section surveys, or from official or unofficial published time series data. Since much interest attaches to economic relationships involving prices and to responses to changes in prices, and since variation in prices usually takes place over time, time series analysis assumes a key role in Econometrics — the discipline concerned with measurement in Economics.
In the early 1950s, much interest attached to the evaluation of the international trade income and price elasticities for New Zealand’s major export products. One such study, or series of studies, was commenced in 1950 and related to the econometrics of wool prices with major accent on time series analysis.
A model of wool pricesB P Philpott commenced work in this area as a New Zealand Wool Board Bursar at Leeds University in 1950. Philpott had graduated in Economics from Victoria University and his interest in wool, apart from its importance in New Zealand, stemmed from a Massey University qualification in sheep and wool, wool classing, and his work as a wool broker in Dalgety & Co, Wellington.
The Leeds work, which culminated in his thesis (1953), was concerned with trying to establish and to measure statistically, the determinants of international wool prices. The subject was important for two reasons:
1. Wool exports made up a major proportion of New Zealand farm and export income, and knowledge about these determinants and their future development was essential to the task of gauging the future for wool.
2. The wool market, for a century, had been characterised by ceaseless and often severe and very damaging fluctuations in prices. Judgements about types of intervention set up to smooth out these fluctuations and to minimise their effects again required knowledge as to the process by which they were generated.
A lot of the research work was first devoted to an evaluation of the income and price
ab
1b
cb
-
186
production would only grow at about 0.7% pa.So, in the absence of any factor, demand growth being greater than supply growth,
excess demand for wool would drive up wool prices very substantially. But there was one other factor which had to be allowed for, ie the recent introduction in the 1950s to the market of new wool type synthetic fibres. With such a recent development, no data was available to gauge the future rate of growth of wool type synthetic fibres which, in the event, was assumed to equal 10% pa, so that the growth of both wool and wool type synthetics, at 3% pa, would be much the same as the growth in demand and, thus, real wool prices in 1976 would be much the same as in 1956.
In fact synthetic fibre growth was slightly greater at 12% pa and aggregate supply of wool plus synthetic (3.9%) was 1% pa greater than demand. With such an excess supply of 1% pa, real wool prices would be expected to fall by 1% multiplied by the price flexibility (ie the inverse of the price elasticity of = 2) so prices would be expected to fall by 2% pa.
That, in fact, was the fairly modest annual rate of price fall which did occur over the 20 years covered from 1956 to 1976.
Application to wool price stabilisation schemesThe second application of the elasticity estimates derived was to be in the analysis of stockpiling operations, such as those conducted by the New Zealand Wool Commission, aimed at ironing out the severest of price fluctuations and producing a degree of stability in the market.
This analysis was carried out in embryonic form in 1953, but in full detail in 1975 (published Philpott, 1976).
Particular attention was paid to quantifying the effects of two of the Commission’s major market interventions in the wool price slumps of 1958 and 1967. The Commission set minimum, or floor prices, at which it stood ready to and did acquire all wool that commercial buyers were unwilling to purchase. These stockpiles were then disposed of in an orderly way when the market recovered.
It was argued that in a severe recession, demand for wool would take on a two-fold nature. There would be a fall in the trade demand for wool for textile production. And if total demand for wool is to equal total supply of wool, there would consequently need to be an offsetting rise in speculative demand for surplus wool to be held as stocks, in anticipation of a future rise in prices.
To assure traders of even a reasonable profit from such speculation, wool prices would need to fall by unreasonable amounts, and, if such is the case, it was then argued that such speculative profits should be captured by a New Zealand Wool Commission acting on behalf of New Zealand wool growers, rather than accruing to overseas traders.
This argument is agreeable as far as it goes, but it carries the danger of judging
1b c
b
cb

187
As is so often the case in Economics, a major task was to assemble the necessary data on world wool supplies and prices and world real income for the 80-year period from 1870-1950, to which the analysis was applied.
The results yielded highly significant (in terms of t-tests) values for the coefficients on SW and RY, and a high R2 was secured.
From the algebra of equation (1) of the model as presented before, we note that the coefficient b viz ∂CW/∂PY representing consumption response to changes in prices, is related to the price elasticity of demand:
∂CW/∂PY ∼ CW/PY
In fact, if CW and PY are expressed as index numbers, on a base of 100 equalling their average value, then at this average level b equals the price elasticity. The coefficient c is similarly related to the income elasticity of demand viz:
∂CW/∂PY ∼ CW/RY
In the regression results (equation (2)) and at average levels, the coefficient on SW viz is the inverse of the price elasticity of demand. Likewise the regression coefficient on RY viz is in fact the ratio of the income elasticity to the price elasticity. Given the regression of b the value of c can be identified from the value of .
In the early research work, and confirmed substantially in all the later work, the values secured were:
Price elasticity 0.5 Income elasticity 0.8
The income elasticity value turned out to be quite consistent with those secured for wool textiles in individual countries, and there was a similar concordance with the price elasticity of wool textiles after allowance is made for the non raw material costs involved and their degree of fixity.
Application of results to market projectIt was earlier adduced that one of the purposes of the analysis was to provide the values of the elasticities necessary for formation of longer term projections of wool prices. In other papers, some such preliminary projections for the 20 years up to 1976 were developed.
The growth rate of world real income over the period was assumed (correctly as it turned out) to be about 3.6% pa. Which, with income elasticity value of 0.8, meant a growth in demand of 2.9% pa. Against this, it was projected that world wool
10.5

188
loss of $2m needed to be set against the wool growers’ gain. A number of other benefits to wool growers from intervention can be adduced but are not dealt with here, where we are only concerned with those overall benefits which were able to be assessed using the results of the earlier statistical analysis.
EpilogueIn the half century since the commencement of the work described, there have been enormous strides made in the methods and achievements of econometrics, especially with regard to the analysis of time series models such as that used above. If the research on the econometrics of wool prices were to be commenced today, it would probably involve the setting up of a large integrated multi-equation model covering, separately, each major wool producing and consuming country, each of the various wool type fibres, and with as much accent on the factors influencing the level of production and supply of fibres as has been given (above) to demand. It would also need to adopt all the various procedures that have been developed to handle multi-colinearity, proper specification of exogenous and endogenous variables, and auto-correlation in time series analysis.
Undoubtedly, there would be derived a much clearer and perceptive view of the forces at work in the wool market and much better, unbiased estimates of the values of significant parameters.
But for all that, it is doubtful if there would be any substantial modifications of the conclusions in favour of stabilisation schemes when evaluated in the way outlined before. Such a favourable conclusion is by no means irrelevant, given the current general debate about producer marketing boards in general, and current wool marketing problems in particular.
ReferencesPhilpott, Bryan, “Wool Prices 1870-1950”, Leeds University Thesis, 1953.Philpott, Bryan, “Economic Analysis of Market Intervention by the New Zealand
Wool Commission”, New Zealand Wool Marketing Corporation, 1976.
10.4 1
0.6

189
the success or failure of the Commission by the level of speculative profits (or losses) achieved. But the correct judgement depends on the actual overall receipts of wool growers (plus or minus any Wool Commission profits or losses) over the whole period of intervention, compared with what the receipts would have been without such intervention.
To simulate this non-intervention case requires the use of the price elasticity of demand and, in particular, the differences in the value of the price elasticity in periods when wool was being stockpiled by the Commission compared with periods when stocks are being sold off.
To simulate the prices and level of receipts in the non-intervention case, we need to know how much higher than their free market level prices were when the Wool Commission acquires stocks and so reduces supply; and how much lower than the free market level prices were when the Commission sells of its stocks and so raises supply. Such evaluations depend on the differences in the price elasticity of demand as between buying-in and selling-off periods. The evidence, from the econometric analysis discussed above where the average price elasticity was -0.5, was that, in recessions, when buying-in was underway, the elasticity, would fall to around -0.4 and therefore every 1% reduction in supply raised price by = 2.5%; and in booms it would rise to -0.6, such that for every 1% rise in supply, prices fall by = 1.66%. These were the values used in the stabilisation analysis as published.
The results of the simulations for both of the buy-in episodes referred to, were uniformly favourable to the intervention process. Thus, for the 1967 episode, a major buy-in occurred in 1966-1967 and these stocks were disposed of over the succeeding six years. The actual receipts of wool growers over this whole period exceeded those which it is estimated would have occurred under a non-intervention free market, by $13m or about 1%. In addition, the Wool Commission made a gross speculative profit of $6m. But against this, it was involved in administrative and storage costs of $8m, and so a net
190
the farms grew wheat.Typing of the soils on which the crops were grown was based on Lands and
Survey maps of farm holdings. With the help of officers of the Soil Bureau, DSIR, the 50 or so soil types occurring were arranged on the basis of origin, natural fertility, and freedom of drainage into seven groups — two of the downs and down margins, three of well-drained plains soils, and two of poorly-drained plains soils.
Disease and pest recording were done in succession by Drs Cruickshank, Thomson and Smith of the Plant Diseases Division, DSIR. As far as possible, each crop was inspected at the tillering stage (before stems appeared) and approaching ripeness. This was possible because both sowing and maturity began much earlier in North Canterbury than in the south. Reports on disease levels were presented each year to the Wheat Research Committee.
To prepare, for publication, a simplified idea of overall disease levels, each crop was given a score for ‘leaf ’ diseases (on leaf, upper stem, and ear) and ‘root’ diseases (on roots, crown, and stem base). Individual diseases and pests were scored ‘1’ for a moderate infection over the whole crop, and ‘2’ for a severe infection, and these were added for each crop. Average scores for cultivars were both lowest for Dreadnought and Fife Tuscan, as expected. An adequate separation of the effects of cropping rotations and soil groups, which are inter-related and interact in their effects on disease and yield with the distribution of rainfall, would require a much more extensive study, during which cultivars and cropping practices could have changed. However, a general statement was presented in Wright’s summary:
The factors of most importance in determining yield were soil moisture [as affected by rainfall and natural drainage as well as crop requirements], soil type and variety, probably in that order, followed by cropping rotation, bird damage and disease. Losses caused by unfavourable weather [apart from drought] poor farm practices and insect pests were slight and differences in the rate and time of sowing and fertiliser application, had little effect on yields.
In fact the total losses caused by disease in the first three seasons must have been quite small, but in the final season, losses in the main cultivar, Cross 7, were estimated at 4%.
In the final visit to each crop, we estimated the likely yield. It was gratifying that in each season our average estimates were quite close to the farmers’ returns, because of under estimating most of the better crops and over estimating some of the poorer ones.
There is a wise saying that the farmer’s boot is the best fertiliser and perhaps the plant pathologist’s and agronomist’s boots, walking the diagonals of wheat fields, make their own contribution to knowledge.
References

191
1953 A survey of wheat cropping and diseasesG M Wright Crop Research Division, DSIR (formerly AML)
Early accounts of wheat production in New Zealand were by Copland (1920) and Hilgendorf. Hilgendorf described the introduction of the header harvester, which cut and threshed the standing crop, and also the new cultivar Cross 7, the first major one bred in New Zealand; it was suitable for direct heading and had improved processing quality. Hadfield gave the next account, covering cropping generally. From farmers’ returns, the Government Statistician formerly supplied county summaries of wheat areas and yields of each cultivar, provided there had been a minimum number of crops to maintain confidentiality. And these were published by the DSIR in the New Zealand Wheat Review.
Miller reported a survey of all wheat crops grown in selected areas near Christchurch and Ashburton over three and five seasons, respectively, with a total of 621 crops. She estimated the effects of cropping rotations and soil fertility on yield, and found them to vary from season to season.
By 1952 there was concern over potential damage to wheat from some of the common diseases. These included septoria leaf blotch, to which Cross 7 had been found susceptible in and after wet seasons, and barley yellow-dwarf virus, a widespread disease of small-grain cereals and grasses. This virus had been described in California only in 1951 and was recognised in New Zealand shortly afterwards by Smith. He reported on five seasons’ study of the disease and its effects throughout Canterbury. The Wheat Research Committee recommended that a detailed study of wheat cropping practices and disease severity should be carried out, restricted by travelling costs to Canterbury, where two-thirds of the total wheat area was being grown.
Having recently transferred from the Applied Mathematics Laboratory to cereal breeding in the Crop Research Division of DSIR, I had the privilege of organising the survey. It was based on a completely random sample of 100 farms from a Department of Agriculture master sample of 550 Canterbury wheat growers, who had originally agreed to give information to the Department on their wheat growing practices. A few of our samples were no longer growing wheat, but the rest allowed us to visit their farms twice each season to examine one of their crops and to provide information on paddock history, soil preparation, and sowing, including seed treatment and fertiliser use. Their co-operation in this and in sending us the yields of their crops was greatly appreciated. Wheat production declined sharply over the period of the survey, mainly because of good prices for sheep meat and wool, and in the final season only 48 of

192
Copland, D B, Wheat Production in New Zealand, Whitcombe and Tombs Ltd, 1920.Wright, G M, NZ Wheat Review 7:25-42, 1959.
193
1957 Airline queueingHamish Thompson (AMD)
In the 1950s there was a big push by Applied Mathematics Laboratory to apply mathematical methods to industry, following the successful war time application of ‘operational research’ (OR) methods to a wide range of problems in warfare. Ken Seal, Chief Chemist of Amalgamated Brick & Pipe Co in Auckland at the time, has described separately the wide use of statistical, applied mathematical and OR methods by his firm (see Chapter 1, Applied Mathematics Division).
Hamish Thompson, biometrician at Plant Diseases Division, DSIR, Mount Albert, who was involved in much of this work, also as part of the push to promote statistical and OR applications in other business in Auckland, and among other things, undertook queuing acceptance sampling schemes for manufacturing industries. Having been engaged previously by Tasman Empire Airways Ltd (TEAL, forerunner of Air New Zealand) to advise on optimal hold space in the face of variable freight, luggage and mail demand in their projected new fleet of airliners, he became involved in 1957-1958 in a study directed at overcoming the problem of high cancellation rates and consequent loss of revenue through planes departing with some seats empty. This study, later expanded and published in OR Quarterly in 1961 as “Statistical Problems in Airline Reservation Control”, became a seminal paper influencing much subsequent research on the subject.
When intending passengers cancel seats just before departure or even do not turn up (‘no shows’), without economic penalty, an airline cannot always get replacements for them, even from waiting lists, at such short notice. Airlines compensated for this flexibility by confirming reservations in excess of the cabin capacity, ie by overbooking and relying on subsequent cancellations to keep the number of bookings at departure at, or just below, the capacity of the plane. This was obviously a problem of great economic significance, for the incremental cost of boarding an extra passenger is perhaps no more than one more meal service and the revenue from that passenger’s ticket is almost pure profit.
The official line at the time was that airlines did not engage in the practice of deliberate overbooking, but in fact it was practised everywhere in the system where the volume of traffic made it worthwhile, and was controlled by local supervisors. They set the reservation limits for the individual flights on the basis of past cancellation/‘no show’ histories as well as their own judgement. The risk with this procedure, of course, is that there will not be enough cancellations so that there will still be overbookings at departure, passengers will have to be off-loaded (‘bumped’

194
be incurred using the overbooking recommendations. This was rather a difficult question, as in those days it was virtually impossible to put an exact value on the financial penalty to the airline when an overbooked passenger had to be offloaded. At its simplest level, it merely involved hotel and other incidental expenses while the passenger awaited another flight, but the greatest contribution was considered to be loss of goodwill. The method used was to postulate a financial penalty for each passenger offloaded, calculate the expected total loss for each overbooking recommendation, and balance it against the expected loss through not overbooking (loss of revenue from empty seats), finding the marginal value of the penalty beyond which overbooking was not economic.
The results were surprising. For most of the recommendations the permissible penalty before overbooking became unprofitable was very high indeed. For a risk of 0.01 the marginal penalties ranged from about 200 to 500 times the tourist fare. This indicated that a risk of one in 100 was too low and that the 0.05 recommendations, where the marginal penalty was in the range 50-90 times the tourist fare, should be used instead. If even this penalty was considered too high, then obviously it would be safe to allow more overbookings and accept the consequent higher risks. For example, for a penalty of 10 times the tourist fare, the airline could have afforded to offload passengers once in every three overbooked flights and still be better off financially than by not overbooking. However the number of offloaded passengers would approach one per flight and consequent complaints would have mounted alarmingly.
To the best of the author’s knowledge, the more esoteric calculations were never put into practice by TEAL. What the overbooking recommendations did was to provide it with some justification for continuing a practice which airlines had been doing for years, and were to continue doing without the knowledge of the travelling public, for many more, until consumer advocate, Ralph Nader, was himself offloaded in 1972 and sued the airline involved. The case went as far as the US Supreme Court, which ruled in his favour, and thereafter the Civil Aeronautics Board laid down guidelines for overbooking and monetary compensation for offloaded passengers.
195
in US airline parlance) and loss of goodwill incurred. It was desired to keep this risk fairly small, say 0.05 or 0.01, ie once in 20 or 100 wait-listed flights. One of the objectives of the study for TEAL was to provide the supervisors with better statistical data and policies for overbooking. It is interesting to note that in those early days top management did not admit that controlled overbooking took place, but the study was done with their full support.
An examination was made of the booking records of 59 flights from Auckland to Sydney over April, May and June 1957. There were no a priori reasons why this period should not have been homogeneous with regard to bookings and cancellations, it being a period where demand for seats remained fairly steady and there appeared to be no trends or other abnormalities. For this period the cancellation rate was 40%; in other words getting on for half the bookings made were subsequently cancelled, which will give some idea of the cancellation problem. The form in which records were kept enabled groups of passengers who were confirmed bookings at three times before departure (14, 7 and 2 days) to be followed right through to departure time and the number of cancellations from each group noted.
The airline booking set up has strong analogies with processes in the physical world, like radio-active emissions and arrivals of telephone calls at an exchange, in that events occur from time to time at more or less irregular intervals. If it is postulated that bookings and cancellations are similarly random events, then the number of cancellations from a fixed number of confirmed bookings would follow the binomial distribution. The binomial model was tested on the cancellation data, and found to hold sufficiently well for smoothed cancellation rates to be calculated and used in an overbooking model. In this model, Thompson derived the joint probability distribution of oversales that would result from overbooking first class (F) and tourist class (T) cabins simultaneously, and determined the risk attached to allowing extra F and T bookings or, alternatively, how many extra F and T bookings could be allowed at different times before departure so that the risk equalled some pre-assigned value (0.01 or 0.05).
In addition, calculations were carried out on the financial losses that might
196
He eventually established Scientific Computing Service Limited at Bedford Square in London and in November 1947 produced the Centenary Edition of Chamber’s Six-Figure Mathematical Tables (2 volumes of about 600 pages each).
I met him while in England in 1949 and he told me that during the war he was Head of the Defence of London from rocket attacks by V1s and V2s. His diversion tactics proved to be very effective. Soon after the war, the scientific head of the German attack visited London and was seen to be having a long discussion with him at Reception – the main question was “how did you foil our attack?” The answer was “statistical analyses of the position of earlier rocket landings were very helpful”.
Toheroas on Muriwai BeachThe Colonial Ammunition Company owned Merediths, who were the only company at the time which had government permission to manufacture Toheroa Soup in the 1960s. They obtained their toheroas from Muriwai Beach, north of Auckland, subject to the approval of the Department of Fisheries as to the number of toheroas four inches or greater in length on the beach.
In one year the Company and the Department of Fisheries could not agree whether there were 15 million at least, which was the deadline at the time. I was asked to devise an accurate method of counting the toheroas to solve their problem.
Sampling by digging a square hole the width of a spade and counting the number over four inches long; then carefully replacing the toheroas back was carried out over the length of the beach. As the beach was quite long, Latin Squares were introduced in order to provide a random sample. The data was then analysed and the result so obtained fortunately was acceptable to both parties. Merediths were therefore able to export Toheroa Soup that year.
Non-Smoking Premiums for Life InsuranceTobacco was introduced to England as early as 1560 where pipe smoking achieved widespread popularity. Cigarettes were introduced in the 1850s and became significantly popular by 1920. Tobacco consumption reached a peak by 1945 and as a percentage of the population tobacco use gradually decreased from then onwards. Suggestions of a link between cigarette smoking and the growing number of deaths from respiratory diseases – especially lung cancer – and coronary heart disease was a contributing factor in those days.
Almost without exception, life offices deemed then that the ostensibly healthy smoker, the life in whom smoking is the only adverse feature, is acceptable for insurance without any additional premium. From available statistics it appears that a similar percentage of the population in New Zealand smoked compared with England at that time.
On 23 March 1976 the National Population Census collected information about

197
1960 ActuarialAthol Tills (Senior Lecturer in Mathematics, Auckland University and Chief Actuary, Metropolitan Life)
Normally actuarial work is associated with life insurance, pensions, superannuation, finance and investments and other related topics. As a result Actuaries are particularly interested in the analysis and interpretation of statistical evidence of prior events. This leads them to apply probability and statistical techniques to try to predict future events and trends to the best of their ability. It is very often said that you cannot predict the future, but it is the Actuary’s job to develop the best approximation from all the known facts.
During the last three quarters of this century a steadily increasing development of new techniques has been shown in New Zealand. The development of the desk calculator operated by turning a handle to the very compact computers of today has turned scientific sampling of data very often into individual analysis of all available data. Sampling techniques were so important previously and now generally only apply where it is impossible to deal with all the data.
Most actuarial work involves a combination of demographic and economic modelling and examining the resulting economic and financial effects. Considerable actuarial effort has gone into developing appropriate data for these models in such areas as mortality, disability, sickness, failure rates, investment performance and incomes. Traditionally much actuarial modelling was deterministic with the emphasis being on the best estimate, but with the growing sophistication of the computer there has been an increasing interest in the variability of results. An investigation of the impact of varying assumptions in the model now forms part of most actuarial investigations and stochastic models are becoming more common.
My own work has spanned both the actuarial and the more general statistical areas and these notes reflect my own background rather than an attempt to provide a comprehensive survey of actuarial work in New Zealand.
Dr L.J. ComrieIn 1947 Les Comrie, a computing specialist, made a return visit to New Zealand and was awarded an Honorary Doctorate at the University of Auckland. On that occasion he demonstrated at a lecture the use of the hand operated calculator on which subject he was an international authority. He was born near Pukekohe and was educated in Auckland before travelling to England, where he pursued his main interest of computing.

198
of numbers were ±1 × 10-99 to ±9.999999999 × 1099 and 0, with internal operations using 12 digit mantissa. The screen size was 54mm × 12mm.
The same Team at Metropolitan Life designed a new policy at the beginning of 1980 where a person could enter age, sex, sum assured, annual premium and choice of investment fund; then by pressing EXE the following information appeared on the screen successively:
• Surrender values for 9 years• A guaranteed maturity value at year 10• A guaranteed term• Estimated maturity value at time of guaranteed term
The above was considered by the Team to be an ideal policy at the time subject to he availability of a hypothetical pocket calculator.
J.B. O’Connor found the CASIO FX – 602P in a shop in Auckland and we were able to borrow it for a week. It was clearly the one we hoped would be available but at the time did not realise the importance of our discovery. 100 of these calculators were ordered and the policy was soon programmed to operate on it. About a year later an Actuary was visiting us from Germany and he confirmed that we appeared to be the first in the world to actually make use of this calculator in this way which was quite remarkable at the time. Incidentally the sales market responded by selling almost exactly twice as much insurance for the company as the previous year.
Retirement VillagesThese villages, which are becoming more commonplace now in New Zealand, have only just commenced in the United Kingdom, although they did start in the United States and Japan about 20 years ago.
The first one in New Zealand commenced in the early 1980s and soon after that it became necessary for actuaries to be involved in the calculation of Initial Payments or Licences and the funding of medical expenses for the elderly members of the village. In most cased the Initial Licence payment is returned on death or vacating the village, but the new occupant would probably pay a little more in view of inevitable inflation. The present value of this difference in value was an important part of the valuation of the village to the owner and it does appear that New Zealand has been probably the first to recognise the significance of this concept. This is especially so now that one group of villages, Metlifecare, is quoted on the Stock Exchange.
Various techniques for the valuation of these villages were used including stochastic methods which were necessary to assess the volatility of the results. The techniques both deterministic and stochastic were developed independently of input from overseas and it appears from overseas studies since published, that this was an

199
cigarette smoking from all people aged 15 years and over. Smoking was defined as regularly smoking one or more cigarettes a day. The results in total were as follows:
Males Females
Never Smoked 39% 57%Used to Smoke 22% 11%Smoke Regularly 39% 32%
There were sub-divisions by ethnic group and age.Acting for Metropolitan Life, a team of 3 actuaries including J.B.O’Connor,
J.R.Rogan and myself decided to explore the possibility of offering a realistic premium discount to non-smokers. Three life companies in the United States had previously offered such discounts and we were fortunate in being able to study the results of one of the company’s experience whose Head Office was in Seattle. However, the recent census information was vital to enable accurate analysis to proceed.
On 12 March 1979, Metropolitan Life became the first life insurance company to offer a significant non-smoking discount to policy holders outside of the United States. It turned out that if a person had not smoked for 2 years he would be eligible to be classified as a “non-smoker” for the purpose of offering a “non-smoker discount”. Using this definition approximately 50% of the population between the ages of 15 and 40 would qualify in New Zealand whereas in the United States the equivalent figure at the same time was 33%.
For a male aged 30 requiring a sum assured of $20,000 for whole of life with bonuses would pay an annual premium of $320 from the average life company. The annual premium for this first non-smoker policy would be $290, while for a smoker it would be $350. In the first 9 months 59% of the policy holders were non-smokers whereas the population was about 50%, which understandably indicated some degree of preference from non-smokers.
Now, all life companies offer non-smokers a preferential rate and the non-smoking population has increased significantly in the last 20 years.
Calculator TechnologyAt the beginning of 1980 CASIO produced a Programmable Calculator FX-602P which was undoubtedly the first pocket programmable calculator. 10 separate programs could be stored and, as well as this capability, data could be entered just once and immediately available were the values for the number of data entered, the mean, the sum of the data, the sum of the squares of the data, the standard deviation (n) and the standard deviation (n-1).
Its dimensions were 141.2mm × 71mm × 9.6mm with a weight of 100g. Its range

200
area where we were in the forefront of actuarial development.

201
1961 The sheep population of Campbell IslandEditor
After its discovery by sealers in 1810, Campbell Island was for many years the scene of whaling and sealing operations. In 1894 a pastoral lease was granted by the New Zealand Government, to James Gordon, and the island was more or less continuously occupied by shepherds until the sheep run was abandoned in 1931. Several thousand sheep were left behind and their descendants still remain on the island. By the late fifties they were considered a threat to native fauna and flora, and in 1961, during a five week expedition sponsored by Botany Division, DSIR, the remaining population (feral for 30 years) and its effect on the vegetation was studied.
The sheep were quarter to half-bred Merino longwool cross, and at the time of the study were mainly concentrated in three major areas above 500 ft. Although they had few parasites, no footrot and no apparent symptoms of any disease, the numbers had declined from a peak of approximately 8,500 in 1916, to 3,600 in 1928, and to less than 1,000 in 1961. One suggestion for this decline was the change in the vegetation through burning and heavy stocking. Judging by the observation of sheep grazing, vegetation and sheep rumen, the diet at the time consisted almost entirely of grasses and ferns, with only traces of herbs. Wool was of high quality during the farming peak, but in 1961 was well below the New Zealand average. Sheep farming opened up the lower areas of the island, and a side effect of this, and the falling sheep numbers, was the expansion of the nesting areas of the Royal Albatross.
The sheep were counted from vantage points covering eight relief areas of the island and, in addition, it was necessary to traverse unseen parts of these areas. At the same time, in some areas large samples of sheep counted were differentiated into immature and mature sheep, horned rams and non-horned sheep. These samples amounted to a little under half the total population. Of 30 sheep shot for inspection, five each of rams, ewes and immature sheep were examined in detail. Their age was determined from the number of adult incisor teeth erupted. Their ages were estimated as being from 18 months to over four years. Several factors were studied — distribution, flock size, ranging, mating, breed, size, teeth, age ratio and sex ratio etc.
Numbers observed over the years from 1916 to 1961 clearly showed a declining population. Although actual counts were taken in 1916, 1928, 1948 and 1961, estimates were made in the years 1924, 1938, 1942, 1944 and 1945. An exponential curve was fitted to the first and last years observed, showing that if the same trend continued, there would likely to be few, or none at all, by the end of the century.

202
ReferenceP R Wilson (Animal Ecology Division, DSIR) and D F G Orwin, Massey University,
“The Sheep Population of Campbell Island”, NZ J Sci v 7(3), Sept 1964.

203
1965 CriminologyS W Slater, Senior Lecturer Psychology, Victoria University, formerly Res. Officer, Department of Education
A pioneering large-scale cohort studyGreatly daring or foolhardy, considering the then unknown pitfalls involved, a governmental body known as the Joint Committee on Young Offenders undertook, in 1965, a major longitudinal study of the social adjustment of New Zealand boys. This was a pioneering effort of some magnitude since the sample was to be an entire age-year (every boy born in 1957 attending a New Zealand State school in 1967); and the follow up period, during which further data would be gathered for this cohort, was set at a minimum of seven years. It was a prospective study with the aim of relating outcome data, such as the later incidence of offending, to demographic and psychometric data obtained in advance of such outcomes, or lack of them — thus avoiding the contamination of hindsight and various related pitfalls which are or ought to be a statistician’s nightmare.
The Joint Committee was an inter-departmental body comprising the Chief Executives (then known as Permanent Heads) of the Departments of Social Welfare, Education, Police, Maori Affairs, Justice and Internal Affairs. It was set up in 1958 by a Cabinet directive, given a research establishment, and assigned to investigate the nature and cause of juvenile crime in New Zealand. This was following and during some of the periodic scares about juvenile offending that upset and perplexed that simpler time.
There had been a lengthy period of preparatory design, pilot studies, analysis of test items. Some of this work involved the IBM 1401 computer, made available without any fuss by Treasury officials; it was a kinder, less monetarily-obsessed age. Broad outlines of the statistical analyses to be made were clear and simple. There was to be considerable reliance on multilinear regression analysis, factor analysis of standardised variance-covariance matrices and, possibly, various forms of cluster analysis. At that early stage, none of the designers of the study (chief amount them was S W Slater, Research Officer of the Joint Committee) had encountered various other techniques that subsequently proved useful, notably the Theory of Signal Detectability, derived from electrical engineering and hearing studies. But the design was flexible enough to take these in readily, as required later.
The chief problems were political and administrative. The Committee, at Cabinet’s behest, ordered that anonymity of all the children in the study must be maintained at all times and this posed for difficulties in a follow-up study where later identification

204
inclusion of a coding of the birthday date in personal information could be shown to reduce errors, losses and dual counting to a very small and entirely tolerable figure; in the context of other likely errors, a few percent.
Another pioneering effort (for the time) involved making a critical path diagram and analysis of the course of the study. A copy of this gigantic network still survives. In the main, its diagrammed events took place, more or less as envisaged. Some of the changes came about because of the rapidity of advances in computer technology and software. When the study was planned, only the Atlas computer and Manchester University (or a few similar pygmies, as we now see them) could have completed certain of the factorial analysis in reasonable time. Shipping of data tapes to England was allowed for in the plan. Naturally, this never became necessary.
That illustrates one of the design problems and perhaps the luck of the designers. It was necessary to plan for the use of computers that had not merely been unavailable in New Zealand, but had not yet been made nor even invented.
Over the years, the very large coding tasks were completed (25,000 sample boys, each measured on approximately 500 variables) and the follow up data became available. The results may be read in the reports of the JCYO Research Unit (see reference below).
In brief, only a small amount of the variation in criterion variables, such as offending during the follow-up period, could be associated with information obtained at age ten. As would be expected by anyone experienced in multivariate analysis, or who knows the theorem of Bayes and the difficulty using even strongly predictive variables when the criterion predicted occurs with low frequency. A useful standardisation was obtained, on a very large sample by any standards, of the principal psychometric instrument used in the study, the Bristol Social Adjustment Guide.
ReferenceFergusson, D M, A A Donnell, S W Slater (1975), The Structure of the Bristol Social
Adjustment Guide, Research Report No 1, Research Unit, Joint Committee on Young Offenders, Wellington, New Zealand, R E Owen, Government Printer (110 pp)

205
would have to be by name as (for example) members of the sample say died, or appeared before the Courts, or were reported as having left the country, and so on. This problem had to be solved by inventing what might now be called by software engineers, a computer fire-wall, with matching done only in files within a computer and no association of name and follow-up data, except as momentary associations of binary numbers that no one ever could inspect.
Strangely enough, this unheard of scheme found favour both with officials and politicians, and the study went ahead in 1967. The designers knew the risks and how the whole scheme could possibly fall to pieces, in the kind of mess that was seen only a few years ago in compiling the New Zealand general electoral roles (a very much simpler set of problems). But a simple calculation in probability provided a lifeline —

206
of adequate levels of NPK fertiliser.After some preliminary tests, I visited the island in 1964 to observe the problem
in the field and to collect soil and plant samples for further studies. Field investigation showed that the problem occurred mainly on shallow soils that were formed from very old volcanic ash overlying coral limestone. Mechanical cultivation, by dicing, resulted in the mixing of the underlying coral sand and limestone with the shallow volcanic soil. The enrichment of the topsoil with limestone had the effect of diluting the nutrient content of the surface soil and, by raiding the pH, reducing the plant availability of the micro-nutrients iron, manganese and zinc. The first crop after clearing of the bush was often normal, but yields of successive crops declined markedly. Field experiments, being carried out by the Department of Agriculture, were a dismal failure; there was no response to fertiliser treatment and crop growth appeared to be dependent on the depth of soil overlying coral limestone that varied greatly over short distances.
The field evidence that crops, grown on old volcanic soils enriched with coral limestone, failed even when supplied with adequate NPK fertiliser, suggested that a micro-nutrient deficiency could be involved. Bulk samples of soils were collected and shipped to New Zealand to be used in greenhouse pot experiments. Also, leaves of crop plants were collected in the field from plants showing apparent deficiency symptoms as well as leaves from normal plants without symptoms, and analysed for both major and micro-nutrients. Analysis showed that leaves from plants with deficiency symptoms were low in zinc but had normal levels of manganese, iron and copper. Levels of the major nutrients phosphorus, potassium, calcium and magnesium were found to be abnormally high in plants that showed deficiency symptoms (Widdowson, 1966).
Greenhouse pot experiments were then carried out to confirm that zinc deficiency was a major cause of crop failure in Niue soils. The experiments were usually of factorial design, often with several rates of an applied nutrient, and were arranged in randomised blocks. The use of randomised blocks in these experiments enabled the variance in plant yield, due to lighting and temperature gradients within the greenhouse, to be removed from the error variance. The experiments were run under controlled conditions so that variability due to soil, soil moisture level, temperature and light intensity could be reduced to low levels, thereby increasing the effectiveness of the experimental treatments. The initial experiments were conducted using the tropical legume Crotalaria anagriodes, and sweet corn Zea mays, both being indicator plants that are sensitive to zinc deficiency. These experiments showed that as little as 5 kg of zinc per hectare, as zinc sulphate gave a three-fold increase in plant yield and completely overcame deficiency symptoms (Widdowson, 1966). Another experiment with sweet corn established that different sources of zinc (ZnSO4, ZnO and ZnEDTA) were equally effective in correcting zinc deficiency and more effective than foliar applications of ZnSO4 (Widdowson and Watts, 1977).
Based on the findings from greenhouse pot experiments, recommendations were

207
1966 Soil fertility in Niue Island soilsJohn P Widdowson, Scientific Officer, Soil Bureau, DSIR
I joined Soil Bureau, DSIR, in 1959, and spent the next 32 years working on soil fertility problems of soils both in New Zealand and in several Pacific Island territories. Although my earlier training in agriculture science had included a short course in statistical methods, I found when I came to Soil Bureau, that I needed some guidance in both the design and analysis of soil fertility experiments. During the 1960s, this guidance was provided by Stan Roberts of Applied Maths Division, DSIR, who was particularly helpful in coming up with the appropriate analysis of variance to handle my data. In the latter part of the 1960s, I undertook graduate work in soil fertility at Iowa State University in the mid-west and while there, was able to improve my knowledge of statistical methods. However, after I returned to Soil Bureau, I continued to seek guidance from Applied Maths staff, first with David Rhodes, then in the 1980s with John Reynolds, and finally with Elisabeth Bradford.
The role of the New Zealand Soil Bureau was to map, classify and characterise the soils of New Zealand and predict how they would change under different types of land use. During the 1950s, soil surveys were extended to a number of island territories of the South Pacific region, including the Cook Islands, Niue, Western Samoa, Fiji and Raoul Island. More detailed surveys of these island territories were carried out during the 1970s as well as a detailed survey of the Kingdom of Tonga. Besides carrying out physical and chemical characterisation of soils, an assessment was also made of the fertility of the major soils of these islands. Soil fertility refers to the capacity of the soil to provide a supply of nutrients for the growth of crop plants. A fertile soil then, is one that can provide a crop with an adequate supply of all the essential nutrients in the proportions required by plants.
The assessment of soil fertility can be made using several methods, including chemical analysis of the soil, chemical analysis of plants grown in the soil, examination of plant material for nutrient deficiency symptoms of plants grown in the soil, greenhouse pot experiments and field plot fertiliser experiments. To illustrate the experimental methods used in the assessment of soil fertility, an example is given of a soil fertility problem on the island of Niue. Following a soil survey of Niue in 1965, I was visited by the Chief Agricultural Officer from Niue who reported crop failure on some soils of Niue Island. At this time the Agriculture Department was promoting the growing of kumara and taro for export to New Zealand, and were increasing the area grown by the use of mechanical cultivation. However, it was found that after the land was cleared of bush, successive crop yields declined despite the use
208
made to the Agriculture Department in Niue for the correction of zinc deficiency in field-grown crops grown in Niuean soils. During the 1965-1968 period, field experiments were conducted in Niue in order to determine the most appropriate rate, form and method of application of zinc fertiliser for a range of crops which included taro, passionfruit, limes and other citrus and pasture legumes such as siratro, glycerine and desmodim. The field trials showed that zinc in combination with fertilisers containing nitrogen, potassium and sulphur increased the yield of most crops and overcame zinc deficiency symptoms in a range of fruit tree crops. Zinc fertilisers appeared to be more effective in correcting a deficiency in shallow-rooted crops such as pasture legumes and vegetables, and less effective in deep-rooted tree crops. This problem can be overcome by application of foliar sprays containing zinc. For soil applications it appeared, from overseas work, that zinc applied to the soil surface was not readily available for uptake by plant roots. To obtain a better understanding of the effects of placement of zinc on the availability of zinc to plants, further experiments were carried out at Soil Bureau. In factorial pot trials using eight Niuean soils, zinc uptake by sweet corn when zinc was mixed within the plant root zone, was compared with uptake when zinc was applied to the soil surface. The experiments showed that zinc added to the soil surface was not available to the sweet corn because it was strongly bound to the soil, whereas zinc sulphate mixed throughout the soil resulted in a four-fold increase in uptake of zinc by sweet corn plants (Widdowson and Watts, 1981). Recommendations made to Niue were to apply zinc fertiliser to the crop root zone, either by incorporating it with soil in the planting hole, for tree crops, or by side banding or drilling it close to the seed when sowing crops.
ReferencesWiddowson, J P, “Zinc deficiency on the shallow soils of Niue. Field investigations”,
NZ Journal of Agricultural Research, 9:44-58, 1966. See also 9:748-70Widdowson, J P; Watts, H M (1981), “Placement of Fertiliser Zinc in Niueans Soils”,
Soils with Variable Charge Conference, Massey University, NZ, Programme and Abstracts, p 137

209
1968 Birds at Auckland International AirportEditor
Numbers of birds roost close to Auckland International Airport. These numbers vary considerably from time to time and a survey was carried out in an attempt to ‘explain’ the variation by measuring certain physical factors.
Because mudflats provide favoured feeding grounds, the expanses of Manukau, Kaipara and other similar harbours in the north of New Zealand, are very attractive to shorebirds. When the mudflats are flooded at high tide, the birds have to stop feeding, and they then gather into flocks to roost on the higher shell banks and in nearby water meadows. Auckland International Airport at Mangere, on the Manukau Harbour, has a special shorebird problem because this flocking behaviour is dangerous to aircraft.
Although during the three-month season of maximum bird abundance, when at least 5,000 waders roosted in the airport itself at each high tide, most flocks were later resettled on an artificial roost near Wiroa Island — an early concept in bird control. However, as Wiroa Island is on the opposite side of the Airport from the nearest large feeding ground, a problem still existed because birds flew over the runway and its approaches on their way to and from their roost. Both to give the air traffic controllers in the tower some idea as to what to expect, and to decide how and when to apply bird scaring tactics, the investigator hoped to find some way of predicting the numbers and patterns of the daily movements of the birds.
Daily observations were taken of all birds in the vicinity at high tide, and a series of nearly continuous observations at selected times, known as ‘tidal cycles’. Each such period covered 14-15 days and corresponded with one bimonthly lunar cycle, during which the tides built up from neaps at the beginning, through to springs at mid-point, and waned to neaps again at the end. By making a 10-mile round of observations approximately once every two hours during daylight, data were gathered on numbers and times of movement. Night checks were made on the airport itself to see if flocks were present during darkness.
However, the entire study represents only about 5% of the mudflats available in the area, and the birds have considerable ‘freedom of will’ within their behavioural limitations. Although waders must roost at high tide, they are free to choose where they do so; and a 10-15 mile flight for this purpose from one side of the harbour to the other is not unusual. During the tidal cycle observations, there were more than 30 species of birds in the area, and all were tallied and plotted. This study, however, concerned only the Godwit and Knot. The smallest number seen at any one time during the period was 500, and the greatest, 8,440. An example of the variation of

210
the two hourly counts for one day was 1,000 3,250 6,290 1,170 1,300 960 1,260
A regression analysis was carried out firstly on one variable only, that of tide height, which varied by up to four metres. This accounted for 22% of the variation. Seven other variables were tried — Number of Hours before and after high water, Wind Speed, Wind Direction, Cloud Cover, Cloud Type, Temperature and Rainfall. A multivariate regression analysis was then used, but only 31% of the original variation was accounted for. It was clearly not worthwhile continuing with the field experiment in this form.
(It was noted in the paper that the computer time for all eight factors k at a time was less than three minutes — a task which would have taken some weeks on an electric hand machine; we were still getting used to the speed of the ELLIOTT 503).
H S Roberts (AMD) and E K Saul (New Zealand Wildlife Service), “Birds at Auckland International Airport”, NZ Maths Magazine, Vol 5(2), 1968
211
1974 Alcohol in the blood of New Zealand driversEditor
The problem of the car driver, influenced by alcohol, was appreciated by the New Zealand medical profession during the early 1960s and its representatives made submissions to the Parliamentary Select Committee on Road Safety. In these submissions it was stated that an analytical determination of the alcohol concentration in a driver’s blood, gave the most meaningful indication of the ability of that driver to control a motor vehicle, although previously, a medical examination had been considered sufficient. Analytical chemists, skilled in the determination of alcohol concentrations in blood and urine from deceased drivers, fully supported these submissions, while at the same time giving evidence concerning breath analysis methods for indirectly determining blood alcohol concentrations.
A 1966 Act established the proportion of 100 mg of alcohol per 100 ml of blood as the limit above which a charge of driving with excess alcohol could be laid. When a driver was apprehended, a breath test was first made, and if this gave a result equivalent to a blood concentration greater than 80 mg per 100 ml, then a blood sample would be taken. From May 1969 to January 1973, 22,113 blood samples were analysed.
Prior to the enactment of the legislation, an intensive study of the techniques was initiated to find out just how good the analytical results were, and what allowance should be made for the analytical error, once determined. The method of chemical analysis employed was the gas chromatographic procedure employing a n-propanol dilution internal standard. Replicate samples of blood were taken and it was expected that the average of repeated measurements would be close to the true value. The standard error of the gas chromatograph was very close to 2 units (mg of alcohol to 100 ml of blood) and in order to reduce the possibility of assigning an individual a blood alcohol concentration higher than was actually present, a reduction of 6 units (3 standard errors) from the estimated average reading was made.
A series of surveys was then carried out at each of the laboratories of the Chemistry Division, DSIR, (Auckland, Lower Hutt, Christchurch, Dunedin) to determine the accuracy of the analyses of blood samples circulated among the four laboratories. The analyses were carried out by using different analysts within each laboratory, measuring dilutions made up by all four laboratories. A number of Analyses of Variance was then carried out between Samples, Dilution Sets, Analysts, Laboratories and Times (time periods involved in transport of samples).
It was concluded from this study that if a sample was analysed at one laboratory

212
over one day, then a 99.9% one-sided confidence interval would amount to about 6 units, whereas with replicated readings, which included all laboratories (in which techniques varied slightly), a similar confidence interval would amount to 12 units.
ReferenceH S Roberts and H Stone, “Assessment of the Accuracy of the Gas Chromatic
Method of Alcohol Analysis of Blood” in Alcohol in the Blood of New Zealand Drivers, DSIR Information Series No 101, 1974
213
1974 LibrariesEditor
In the 1960s I was asked to prepare a series of lectures for students of the former Library School. At that time all students had university degrees, although it was rare to find a student who had attended any mathematics lectures. A few years after completing the course, a student who had become a librarian in a small district, approached me and asked how it was possible to make a comparison of the service given by her library with that of other libraries. She claimed that the yearly Census of Libraries put out by the Library Association was simply a mass of figures that no one could understand. This Census consisted of many pages of tables, with each page consisting of over a dozen columns of figures. These were divided into many different categories, eg Book-Stock, Population Served, Circulation, Finance, Staffing, etc. (More than one librarian described these pages and pages of figures as ‘inhuman’.)
My reply was that it was not feasible to make a comparison between a big city library, with its large financial resources and extensive reference section, etc, with a small town library. It was best to compare libraries in towns of comparable sizes. Also, with a number of variables operating simultaneously, it was first necessary to decide which of the variables would give the best index of service, and then compare it with each of the other variables in turn. The method chosen was to use a two way graph for each variable, dividing the graph vertically in half, finding the medians of each half and then drawing a straight line through the two medians.
The next step was to show a number of variables on one graph. As the accompanying graph shows, this was done with five variables — circulation, was plotted against bookstock; size of population represented by circle size; number of staff represented by human symbols, and finance represented by dollar signs.
This would give an overview of the situation. One could then examine any comparison more closely by referring back to the two-way regression graphs.
ReferenceH S Roberts “Profile of a Public Library”, Statistics at Work, NZ Statistical Association,
1982, pp 21-27

214

215
chapter 5
The New Zealand Statistical AssociationFormation and early beginningsFollowing are (a) the first entry in the minute book of the Association, and (b) the first recorded receipts and payments statement.
(a)

216
(b)

217
The Genesis and Activities of the New Zealand Statistical AssociationK J A Revfeim (Formerly Scientific Officer, Biometrics Section, Department of Agriculture)
Note: This was the first article printed in the New Zealand Statistician Vol 1 No 1, 1966.
International Biometric SocietyThe first record of a move to form a statistical body in New Zealand is contained in a letter dated 27 November 1947, from E A Cornish (Australian Council for Scientific and Industrial Research, Section of Mathematical Statistics based at the University of Adelaide) to I D Dick (Biometrics Section, D S I R, Wellington). Enclosed in the letter was a copy of literature “being circulated to persons in Australia likely to be interested in the formation of a local region of the International Biometric Society”. The result was the following circular that was sent to 39 persons or bodies within New Zealand.
This circular is sent to you in the hope that you will be sufficiently interested to attend a meeting to be held at Victoria University College, Wellington, sometime between 21st August and 6th September, of those interested in mathematical statistics and their applications to experimental data. This period has been chosen as it seems to clash least with other meetings, University sessions, etc.
The reason for convening this gathering are several:a) To stimulate discussion on the various applications of statistical methods that are used or
may be used in New Zealand.b) To explore the desirability, or otherwise, of arranging annually such gatherings whereby
experience may be pooled and both problems and theory of interest discussed.c) To promote, in a general fashion, the correct application of statistical methods required.The meeting will last for two days and will be under the chairmanship of Dr J T Campbell, Senior Lecturer in Mathematics at Victoria College. The emphasis will be more on discussion than on the reading of prepared papers. You are cordially invited to suggest either types of papers to be read or topics for discussion.
I would appreciate if you would inform me of what two days in the above period you would find most convenient giving, if possible a second preference and whether you would prefer me to arrange a hotel accommodation in Wellington. Finally, I would like to suggest that you mention the intention of holding this meeting to any of your colleagues or friends who may be interested in attending and whom I may have inadvertently or unknowingly neglected to circularise.
218
with draft copies of Biometric Society bylaws from Dr Turner to Mr Dick and an exchange of draft amendments, and such niceties as “How’s the chicken-pox?”
Nothing further concerning the Biometric Society was filed after the end of 1948, New Zealand statisticians seemingly having little enthusiasm towards membership of an Australian based region of society. Indeed, at the 1952 Annual General Meeting of the later formed New Zealand Statistical Association, a move that a New Zealand group of the Biometric Society be formed lapsed through a lack of interested members. Notwithstanding, several New Zealanders are, today, members of the Biometric Society and one, Dr B I Hayman, is an elected member of the Council. But no formal New Zealand group or sub-group exists.
New Zealand Statistical AssociationEarly in 1949 notice was sent out to interested persons of a conference to be held at the Carter Observatory on May 10th and 11th. The notice included a draft constitution of the New Zealand Statistical Association (Incorporated) which was duly adopted at a business session held during the conference. For papers presented at this and subsequent conferences, see Appendix A. An Executive Business Committee (see Appendix B) was elected at the same business session and empowered to finalise the legal aspects of the Constitution, which was subsequently registered on 26 April 1950. The conference became an annual event.
At the 1965 Annual General Meeting, provision was made for Corporate Membership of the Association, and at the same time, sections of the Constitution were altered in line with current practice and technology. A resolution passed in 1958 which increased the Committee representation with the above alterations in a new Constitution that was registered on 14 December 1965.
Annual conferenceThe major activity of the Association has always been the Annual Conference that has been held in the Botany Lecture Theatre of Victoria University College, the Carter Observatory Boardroom, and since 1954, in the Lecture Hall of Wellington Public Library. To these will be added, in 1966, the Shell Theatrette. Since this is a statistical history it can be recorded that the charge for hiring a room at the Carter Observatory in 1949 was 5/- and that the profit made on morning and afternoon teas was 9/6.
In 1951 Mr I D Dick advised that the Applied Mathematics Laboratory of the DSIR expected to hold a seminar on the day following the 1952 Conference and that a small number of Association members would probably be invited. An outcome of this was the omission of mathematical papers at this, and subsequent conferences, since the Applied Mathematics seminars have continued to he held in conjunction with the conference. However, the responsibilities of the Applied Mathematics Division extend beyond mathematical statistics and the seminars,
219
You will be notified later as to the exact date and topics of discussion.
Yours faithfully,I D DickConvenor
Reactions of those approached may be gauged from the following replies:
“I appreciate very much your invitation to attend a gathering of statisticians and other fowl like myself.”“If you are doing hotel bookings I should like you to make mine for me; but you had better wait until my wife makes up her mind whether she is coming.”
“I trust there will be time on the agenda for some discussion on the teaching of statistics in Universities. Such would not only be useful in itself, but would help convince the University Council that their money was being well spent. At the moment there is a rider attached to their agreement to meet my expenses — namely that the grant is for this year only.”
“Ever since the first hearing about it I had intended to be amongst those present at the gathering of statisticians in Wellington but the lambs have beaten me. Instead of the trickles we were expecting around this time there has been a flood, and as I have to make acquaintance with them as soon as possible after arrival I will be tied to these parts over the conference. I am very sorry. To adapt from Stephen Leacock, ‘I don’t know as I should have understood the speakers, but anyway I very much wanted to see them’.”
“This is just to confirm that I shall be attending the conference. It is a little later than I would have wished; however it gives me a good excuse for missing the first two days of term.”
Unfortunately, no record of the content or speakers at this 1948 conference has survived the years, although from a letter of appreciation to the organisers, the dates can be confirmed as 31 August and 1 September. (Jean Miller reports that this conference was held at the Meteorological Office, and that nothing formal was passed — Ed.) It can be assumed with reasonable confidence, that the matter of affiliation to the Biometric Society would have been raised.
On record, however, is some further correspondence of the period, the principal writers being, on one hand, Dr J T Campbell (Victoria University College), Miss Jean G Miller and Dr A A Rayner (Department of Agriculture); and, on the other hand, C I Bliss, Secretary of the Biometric Society (Connecticut, USA) and Dr Helen Turner (Sydney). Dr Turner was at this time enrolling members for an Australasian Region of the Biometric Society and the desirability of forming separate Australian and New Zealand Regions was asked. One letter (Turner to Campbell) discusses a sub-regional organisation within the Australasian Region and “would Dr Campbell automatically be the New Zealand representative” on the committee. Dr Campbell, however, appears to have persuaded Mr Dick to accept this position. The correspondence concludes

220
Besides the formal presentation of papers at the conference and the business of the Annual General Meeting of the Association, the gathering in one place of like-minded persons stimulates much informal discussion. New entrants to the circle of applied statisticians may feel as the writer of the following did:
Please allow me to say how very much I appreciated the honour of participating in the proceedings of the Annual Meeting. Furthermore I thoroughly enjoyed all the papers and I feel that the cordiality of the reception afforded me could not have been surpassed. It was a grand show.
Doubtless the introduction of a cocktail party into the Conference Programme in 1955 may have coloured the writer’s memories.
Up until 1964 summaries of papers presented were sent out to members some six months or so after the conference. The delay is partly due to the process of extracting summaries from speakers, where many stalling tactics may be brought into play.
I regret that since returning last month I have been smitten with flu — Asian, Polynesian and plain ordinary New Zealand …
I must admit that the principal reason has been my dislike of work of any description …
In 1965, summaries were sent out before the conference thereby giving some members more information on the content of the papers so that they could better select the sessions of direct interest to them. A few stalwarts, of course, attend all sessions.
Activities in educationIn February 1952 the Association carried out a survey of work performed by, and the number and status of, staff employed in statistical positions in New Zealand. At the conference in July, a discussion session was held on New Zealand’s statistical needs and opportunities, and training of statisticians.
Ten years later, in June 1962, the Association carried out a survey of work performed by, and the number and status of, staff employed, by sending to the Director of Education a letter containing proposals on the teaching of statistics in schools. These proposals arose from deliberations of the Executive Committee, augmented by Professor J T Campbell, Mr M Riske and Mr H S Roberts. These proposals were acknowledged, and in January 1964 a representative of the Association was invited to be present at a conference on Secondary School Mathematics held in Auckland.
Mr Roberts was the Association’s representative and he reported on this meeting at the 1964 Conference. He also sent, on behalf of the Association, to the Director
221
accordingly, incorporate a large proportion of mathematical physics and other non-statistical subjects. Methodological papers have, therefore, been reintroduced into the conference programme which tries to strike a balance between the theoretical and practical.
In 1965 the Operational Research Society of New Zealand cooperated with the Association in providing speakers for an additional day’s session on operational research topics. A similar joint meeting of the two bodies is planned for 1966.
The arranging of speakers for the annual conference has been a matter of varying difficulty for members of the Committee. Some papers are offered even after the circulation of a tentative programme; “… Thank you for your notice of the proposed July meeting. I wondered if there is still room on the programme for a short contribution which I would entitle ...”. On one occasion an eminent overseas statistician’s presence in the country happened to coincide with the conference, and consequently, the name of Professor S S Wilks appeared on the programme in 1956. Most speakers, however, select themselves by their activities in fields of research and application of statistics whose verity is demonstrated by the list of titles. The return of a New Zealand statistician from work or study overseas has often brought him an invitation to speak.
Soliciting on the Committee’s behalf may be carried out by ‘reliable agents’ in other countries, as witnessed by the following extract from a letter to the Secretary.
Everything is fixed up: I wrote to the management and got a nice letter back. It is perfectly all right with them that he should talk and I don’t think that you need to worry about travelling expenses or anything like that; especially if you were to see their new offices ...
Alternatively, the Secretary may send out a double purpose account.
Not only did I forget to collect some subscriptions from you when you were down in November, but I also overlooked asking you about giving a paper at the Conference in July this year …
Having settled the speakers in the programme, the next step is to ensure a good supply of listeners. This mainly falls to current members; the following are examples of approaches used with members ‘in arrears’ and prospective members.
In enclosing a copy of this year’s conference programme we would bring to your notice the pleasure we gain in having you as a member of our Association.. We can assure you that this pleasure and our funds would increase together if we could see you at some of our meetings and collect from you some of your outstanding subscriptions …
Anyone may come to any of the sessions on this programme, the only risks being the possibility of having to pay sixpence for morning and afternoon tea and small chance of being badgered into joining the Association. …
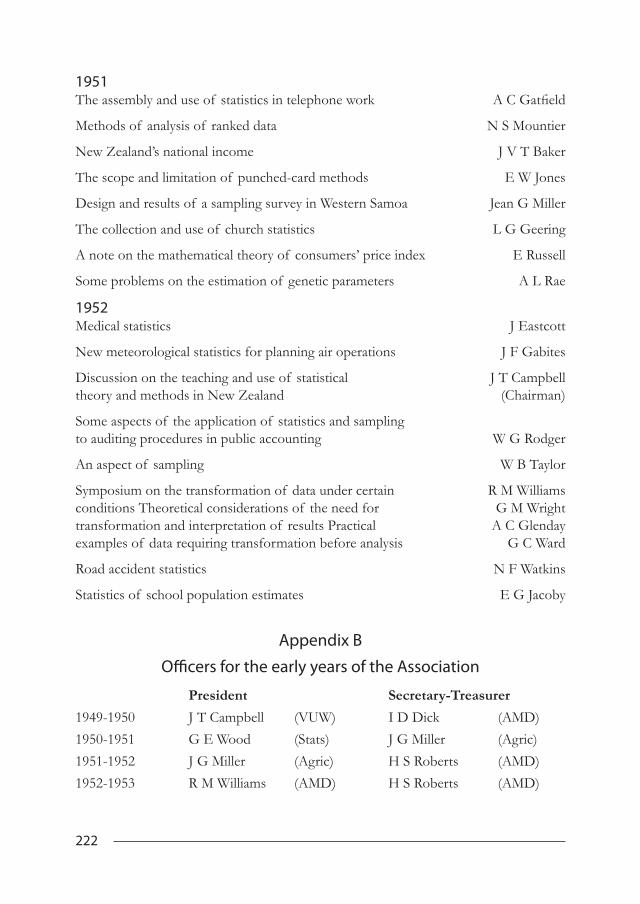
222
1951 The assembly and use of statistics in telephone work A C Gatfield
Methods of analysis of ranked data N S Mountier
New Zealand’s national income J V T Baker
The scope and limitation of punched-card methods E W Jones
Design and results of a sampling survey in Western Samoa Jean G Miller
The collection and use of church statistics L G Geering
A note on the mathematical theory of consumers’ price index E Russell
Some problems on the estimation of genetic parameters A L Rae
1952Medical statistics J Eastcott
New meteorological statistics for planning air operations J F Gabites
Discussion on the teaching and use of statistical J T Campbell theory and methods in New Zealand (Chairman)
Some aspects of the application of statistics and sampling to auditing procedures in public accounting W G Rodger
An aspect of sampling W B Taylor
Symposium on the transformation of data under certain R M Williams conditions Theoretical considerations of the need for G M Wright transformation and interpretation of results Practical A C Glenday examples of data requiring transformation before analysis G C Ward
Road accident statistics N F Watkins
Statistics of school population estimates E G Jacoby
Appendix B
Officers for the early years of the Association
President Secretary-Treasurer1949-1950 J T Campbell (VUW) I D Dick (AMD)1950-1951 G E Wood (Stats) J G Miller (Agric)1951-1952 J G Miller (Agric) H S Roberts (AMD)1952-1953 R M Williams (AMD) H S Roberts (AMD)

223
of Education, a “Proposed syllabus for probability and statistics in the pilot scheme in post-primary mathematics”. This followed an announcement in the Education Gazette of 1.8.64 that the ‘pilot scheme’ was to be introduced in certain schools in 1965.
An offer by Mr Roberts to help prepare a statistics bulletin resulted in a draft copy being sent to Association members, teachers and members of the Department of Education, late in 1964, for criticism. Finally, with Mr Roberts again the Association’s representative, submissions, including specific School Certificate and University Entrance examination syllabuses with examples of questions and answers, were presented to the February 1966 Conference on Secondary School Pilot Scheme Mathematics.
Appendix A
Conference speakers and papers1949 Some statistical aspects of pasture experiments P D Sears
Symposium on sampling Line transects in high I D Dick country vegetation studies Sampling problems Jean G Miller in pasture Sampling with insect populations A A Rayner
Factorial treatment of psychological tests C J Adcock
Confluence analysis with application to statistical problems in economics M R Fisher
Extreme value problems in meteorology C J Seelye
Statistical methods in climatology and meteorology N G Robertson
1950 Regression analysis appropriate to correlated samples A H Carter
Some statistical problems in genetics G M Wright
Agricultural survey E M Ojala
Some statistical problems in geo-physical time series I D Dick
Systematic experimental designs for use with serially correlated observations R M Williams
Statistics overseas A H Carter R M Williams
The consumer price index G E Wood

224
1953-1954 P B Lynch (Agric) N S Mountier (Agric)1954-1955 I D Dick (AMD) N S Mountier (Agric)1955-1956 I D Dick (AMD) S R Searle (Dairy Bd)1956-1957 J V T Baker (Stats) J H Darwin (AMD)1957-1958 J V T Baker (Stats) J H Darwin (AMD)1958-1959 R M Williams (AMD) T G Robertson (Agric)1959-1960 E G Jacoby (Educ) S S Kuzmicich (Stats)1960-1961 E G Jacoby (Educ) C G Gillion (Stats)1961-1962 J H Darwin (AMD) C G Gillion (Stats)1962-1963 J H Darwin (AMD) C J Thompson (AMD)1963-1964 S S Kuzmicich (Stats) E M Tate (Agric)1964-1965 S S Kuzmicich (Stats) K J A Revfeim (Agric)1965-1966 G A Vignaux (AMD) K J A Revfeim (Agric)
EditorIt can be seen from the above table that in the early years, the impetus that was given to the life of the Association, was due almost entirely to representatives from three Government Departments —Department of Statistics, Department of Agriculture, and the Applied Mathematics Division of the DSIR. In addition, it was entirely based in Wellington. The strength of the Association remained in Wellington for a number of years. One point of interest in these early years was that there were no such meeting entitled ‘Annual General Meetings’, held in conjunction with the annual conference, from 1949 until 1956. So, technically, the first AGM was held in 1957. In 1966 a new position was made — that of Editor, and in 1973 the Secretary-Treasurer’s position bifurcated into Secretary and Treasurer.
Following is a list of the Officers of the Association from 1966 to 1998.
Year President Secretary Treasurer Editor1966 G A Vignaux K J A Revfeim Secretary W G Warren1967 G A Vignaux G C Arnold Secretary W G Warren1968 H R Thompson G C Arnold Secretary W A Poole1969 B I Hayman G C Arnold Secretary W A Poole
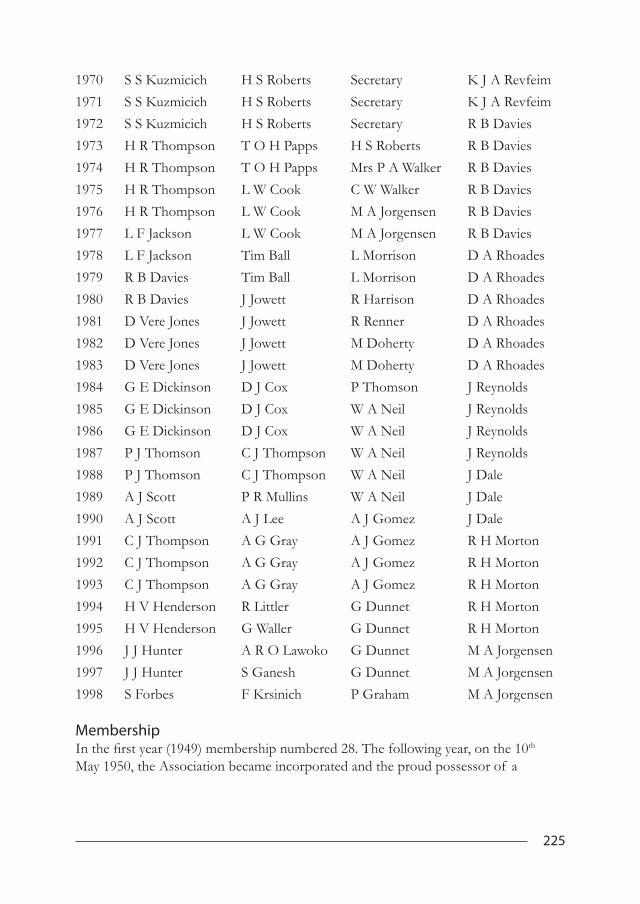
225
1970 S S Kuzmicich H S Roberts Secretary K J A Revfeim1971 S S Kuzmicich H S Roberts Secretary K J A Revfeim1972 S S Kuzmicich H S Roberts Secretary R B Davies1973 H R Thompson T O H Papps H S Roberts R B Davies1974 H R Thompson T O H Papps Mrs P A Walker R B Davies1975 H R Thompson L W Cook C W Walker R B Davies1976 H R Thompson L W Cook M A Jorgensen R B Davies1977 L F Jackson L W Cook M A Jorgensen R B Davies1978 L F Jackson Tim Ball L Morrison D A Rhoades1979 R B Davies Tim Ball L Morrison D A Rhoades1980 R B Davies J Jowett R Harrison D A Rhoades1981 D Vere Jones J Jowett R Renner D A Rhoades1982 D Vere Jones J Jowett M Doherty D A Rhoades1983 D Vere Jones J Jowett M Doherty D A Rhoades1984 G E Dickinson D J Cox P Thomson J Reynolds1985 G E Dickinson D J Cox W A Neil J Reynolds1986 G E Dickinson D J Cox W A Neil J Reynolds1987 P J Thomson C J Thompson W A Neil J Reynolds1988 P J Thomson C J Thompson W A Neil J Dale1989 A J Scott P R Mullins W A Neil J Dale1990 A J Scott A J Lee A J Gomez J Dale1991 C J Thompson A G Gray A J Gomez R H Morton1992 C J Thompson A G Gray A J Gomez R H Morton1993 C J Thompson A G Gray A J Gomez R H Morton1994 H V Henderson R Littler G Dunnet R H Morton1995 H V Henderson G Waller G Dunnet R H Morton1996 J J Hunter A R O Lawoko G Dunnet M A Jorgensen1997 J J Hunter S Ganesh G Dunnet M A Jorgensen1998 S Forbes F Krsinich P Graham M A Jorgensen
MembershipIn the first year (1949) membership numbered 28. The following year, on the 10th May 1950, the Association became incorporated and the proud possessor of a

226
Overseas, there were 34 ordinary, 3 student and 2 retired members.
Local groupsIn 1970 a request was received from Palmerston North that a conference be held at Massey University. A circular was sent out to all members to discover the interest there might be in such a venue, but only six members replied, with one offering to present a paper. With such a small response the Committee decided not to take the matter any further. The first local group to be set up appears to have been the Manawatu Statistics Group, set up by Peter Thomson and Greg Arnold in 1977. It became affiliated to the NZSA in 1980. By 1997 six local groups had been formed, with a membership as follows:
Auckland 57 Hamilton and Rotorua 64Palmerston North and Levin 33 Wellington 105Christchurch 50 Dunedin 28Overseas 47 ___ Total Individuals 384
The major achievement of Peter Thomson’s presidency was to transform the Association into a truly national body. The first regular conference and AGM to be held outside Wellington was in 1987, in Christchurch, largely due to the enthusiasm of Richard Penny (a later editor of the Newsletter), and since that time it has continued to travel round New Zealand. The first president from outside Wellington was Brian Hayman, from Massey

227
COMMON SEAL, enabling the officers of the Association to legally sign documents. (Unfortunately, the COMMON SEAL appears to be lost.) The incorporation document required 15 signatures, and those fortunate enough to be included in this group became known as “The Foundation Members of the Association”.
Foundation membersDr J T Campbell Victoria University CollegeMr P J Armstrong Biometrics Section, DSIRMr I D Dick Biometrics Section, DSIRMr A C Glenday Biometrics Section, DSIRMrs C Marshall Biometrics Section, DSIRDr R M Williams Biometrics Section, DSIRMiss O M Castle New Zealand Dairy BoardMiss E J Currie New Zealand Dairy BoardMr K Cottier Department of AgricultureMr E R Dearnley Department of AgricultureMr P B Lynch Department of AgricultureMiss J G Miller Department of AgricultureMr N S Mountier Department of AgricultureDr E M Ojala Department of AgricultureMr J V White Department of Agriculture
The membership increased slowly over the years, until by 1991 it had passed the 100 mark. However, paid up members accounted for only about 70 of these, and it was not until 1967 that fully paid up membership of 100 was achieved. In 1969 CORPORATE MEMBERSHIP was established, and six such members joined. In 1973 membership passed the 100 mark, and corporate membership rose to 11. New members continued to be enrolled — in 1976 the total membership was 305 individual and 43 corporate. Thus it took 18 years to reach 100, six more years to reach 200, and three more to reach 300. However, by 1986 the membership appears to have dropped to 253 individuals, 31 corporate and 3 life members. The reason for this drop appears to be that for a number of years the roll included many members who were neither active nor financial, and the new President, Dr P J Thomson, and a former Treasurer, Mike Doherty, went through the roll, carving off all these defunct members. In June 1998 the membership stood at 353. Within New Zealand there were 271 ordinary, 29 student, 2 life and 6 retired members.
228
PublicationsNew Zealand Statistician: 1966–1997The first issue of the New Zealand Statistician was published in March 1966. I can well remember at the 1965 Conference, Bill Warren speaking strongly in favour of the Association having its own journal. There was a great deal of opposition to this on a number of grounds, the chief being that of expense, and another that it would be a needless exercise since we were too small an organisation to attract articles of quality, either from New Zealand or overseas, and that any local author writing a worthwhile article could find good overseas journals willing to publish it. However, the Annual General Meeting finally accepted Bill’s reasoning, especially as he was prepared to edit such a journal, and the first issue saw the light of day the following year. Following is a photograph of the first issue of the New Zealand Statistician. It was small, measuring 17 cm × 21 cm, displaying on the cover our first logo — the Normal Curve.

229
University, Palmerston North.
Life membershipIn 1980 the Association instituted Life Membership. The following members have so far been appointed:
1. 1981 H S Roberts (see NZ Statistician Vol 16(1))2. 1983 J T Campbell (see NZ Statistician Vol 18(2))3. 1984 G H Jowett (see NZ Statistician Vol 19(2))
SubscriptionsWith subscriptions, the picture is different from that of membership in that subscriptions were always increasing, as shown by the table below. It began in 1949 at five shillings, and remained so until 1968, when it doubled. It reached $22 by 1986, with corporate members paying $44. Student membership began in 1979 with a subscription of $2, rising to $11 by 1986. Various libraries became interested in the journal, and in 1973 began to pay a subscription of $4, which increased to $22 by 1986.
Individuals Corporate Student Libraries1949 $0.5 1966 $1 1968 $1 $8 1975 $2 $8 $41976 $5 $12 $2 $61978 $6 $14 $3 $61979 $7 $14 $3 $71980 $10 $20 $5 $101982 $15 $30 $7.5 $151986 $22 $44 $11 $22
As the years passed, we began to feel more professional, and therefore felt that we needed to have a cocktail party, for which we charged but for which we also suffered heavy losses of around $10, which of course ate into the funds. For example, the Financial Statement for the year ending 31/3/66 showed that the administration cost $20, the conference $15, the cocktail party $6, and there was an overall gain of $3 for the year, leaving us with total assets of $95.

Front cover of the first issue of The New Zealand Statistician

231
THE NEW ZEALAND STATISTICIANPublished by the New Zealand Statistical Association Inc.Volume 1 March 1966 Number 1
EditorialThe motivation for a New Zealand Statistical Association publication and the form it might take.
For some time now I have had doubts concerning the effectiveness of the New Zealand Statistical Association. I have not been alone in my thoughts and what I now write is the product of my own thinking and ideas generated from discussion with other Association members. There has been no radical change in the Association since its founding some seventeen years ago. There has been no development, no advancement. The Association appears as a static rather than a dynamic body. Undoubtedly it must be regarded as a professional society but as such it must rank among the more tenuous in New Zealand today. Its membership is largely confined to Wellington; its activities consist of one meeting a year.
This state of affairs cannot be permitted to persist. There is a rapidly increasing demand, throughout New Zealand, for people trained in statistical method, both in government and in industry. There is an awareness that statistical reasoning is becoming an important part of everyday life. There is thus being generated a demand for statistical education in the schools as well as universities. There must be a vast potential membership of a society devoted to the teaching and application of statistical theory. Such a body does, of course, exist but to reach all those it can and should serve it must widen its activities. It must provide something for those who cannot attend its one meeting a year.
This would be the main objective of a publication. There has been some discussion whether it should be called a newsletter or a journal. I could envisage it as a little of both, although this first issue cannot in actuality be described as either. Its purpose is to put the case and to show that a publication of technically satisfactory quality can be produced at an acceptable cost. The content is, therefore, not typical of what is envisaged for future issues, should these be approved. This trial issue, however, has provided an opportunity to put on record the history of the Association and, in particular, succinct recognition of the service of past executives and of conference speakers. Our thanks must go to Mr K J A Revfeim for his extraction of this information from the Association file.
What then would be the content of future issues? Firstly, the publication, which would appear perhaps three times a year, would serve as a newsletter to members. It would carry notice of the annual conference (and, I would hope, of other meetings) and the summaries of the papers to be presented. It would contain complete transcripts of those papers which merit publication but, for various reasons, may not be in a form acceptable to established journals. One may here note, with regret, the lack of any
232
permanent record of the content of papers given at past conferences, or of the resultant discussion. Much of this work has been, of course, published elsewhere, but by no means all of it.
Two features which I would regard as most valuable are:A listing of New Zealand statisticians and their interests. Who are they? Where are
they located? What type of work are they doing? What are their current interests? One would not attempt to produce a complete list at one time; it would be built up from issue to issue, which changes in address, interests, etc, published as required. As an example I append my own listing below.
A question and answers section. A large number of the Association’s present members are not professional statisticians but people who have found statistical methods useful, if not essential, to their own work. These people may often have doubts about the validity of the method they wish, or have attempted, to apply, or they may be faced with a problem which appears to be outside the range of their statistical knowledge, or they may have a conventional problem with a twist. It would be my hope to receive questions, to refer these to an appropriate authority, and if of sufficient interest, to publish the answer. There remains, of course, the person who mistakenly has no doubt about his method — perhaps he too can here profit.
An undoubted aim would be to publish material which would be of assistance to teachers of statistics, and, in particular, to high school teachers.
There is, I feel, scope for short articles of a type which often appear in the American Statistician, but relevant to the current development of statistics in New Zealand. Such articles would be, in general, popular or semi-technical in form.
Finally, the publication would bring to the attention of Association members events of interest in the statistical world, overseas as well as within New Zealand. I feel that we could well cooperate with allied societies such as the Operational Research Society of New Zealand, the Computer Society and the several Mathematical Societies so as to bring to members’ notice any activities of these groups which may overlap with members’ interests.
It will be seen that the envisaged publication is not a scientific journal in the accepted sense. I can see no reason for the New Zealand Statistical Association’s adding to the plethora of journals of which one undoubtedly reads less than one should. But there is a very real need for the Association to make a step forward. A publication of the type described above is my suggestion towards achieving this. I am not so arrogant as to believe that it is the only way. Have I your support? Can you suggest an alternative? Or is it that you are content with things the way they are?
W G (Bill) WarrenBill edited Vol 1(1, 2) April, July 1966 and Vol 2(1, 2, 3) May, July, and November 1967. (The last named being wrongly numbered with ‘Vol 3(1)’ on the cover and

233
‘Vol 2(3)’ inside.)The editors since that time have been included in the listings given above. In 1987,
Jocelyn Dale became Editor and completely changed the format, maintaining the width of 17 cm, but increasing the length to 25 cm and giving it a hard glossy cover, but increasing the number of Normal curves of our Logo to three — Leptokurtic, Platykurtic, and one in between (name unknown — perhaps Meanokurtic). In 1995, Murray Jorgensen became Editor, and remained so until its demise at the end of 1997, when it decided to join forces with our somewhat larger Australian brother, becoming a partner in the Australian and New Zealand Journal of Statistics.
NewsletterThe Statistician had been intended as a journal both for professional publications and for news, views, and notices by and for members. It was decided in 1983 to keep the Statistician as a professional journal and to produce a second publication, a NEWSLETTER. John Reynolds, after editing the Statistician for four years, became the first editor, producing a NEWSLETTER in 1984, of size 21 cm × 30 cm — the size of which has not changed since. On the cover it carries a most peculiar LOGO: the letters ‘NZ’ made up of four horizontal grey lines, and three vertical blue lines. Following are the opening two paragraphs of the first issue:
Welcome to the inaugural issue of the New Zealand Statistical Association NEWSLETTER. For some time there has been a need for a newsletter to maintain regular contact among members of this Association. The New Zealand Statistician is usually published twice a year in May and November/December and it is the aim of this newsletter to plug the six-month gaps with two or three issues per gap.
The New Zealand Statistician will of course remain the flagship of the Association’s publications and will contain the usual mix of “scholarly” articles, news and announcements. It is envisaged that the newsletter will contain up-to-the minute notices of seminars and workshops around the country, news from regional correspondents and the occasional feature article of a light or provocative nature.
Other NZSA publicationsModel Answers No 1 (Ed H S Roberts, 36 pp, 1972) (See below, Model Answers)Statistics at Work (Ed S Gubbins, D A Rhoades and D Vere-Jones, 112 pp, 1982)Understanding Surveys (Ed V Douba and J H Maindonald, 34 pp, 1988)School Projects and Statistics (J C W Rayner, 25 pp, 1988)The Data Bundle (Mike Camden, 51 pp, 1989)History of Women through Statistics (Rebecca Forbes, 35 pp, 1995)How to Plan an Experiment (P D Johnstone, 81 pp, 1994)Women with Maths — Making a Difference (Eds H P Stott and C J Thompson, 114 pp, 1995)

234
See also “Survey and Publications Committee (SAPQC)”

235
The NZSA (1966-1970)Greg Arnold, Massey University, formerly Department of Agriculture
In the 1960s the Biometrics Section of the Department of Agriculture was the largest group of statisticians in one place outside the Department of Statistics, and it was apparently necessary to assert this status by having a member of the Section as either the President or the Secretary of the Association. At least that is how it was put to me when John Revfeim finished his two-year stint as Secretary/Treasurer. For me, in becoming the Secretary in 1966, it was a good way to get to know people and to become known. It was less clear what the advantages were for the Association.
The Committee’s main task was organising the conference. Papers were not so much called for as subpoenaed, and the last one or two gaps were filled from a vague memory of a casual contact with someone with an interesting problem. This provided an interesting mix of speakers perhaps covering a wider run of real problems than the current conferences, even if the statistical content was less sophisticated. The reward for those whose arms had been twisted was a free cocktail party ticket, that is a beer and a cheerio with tomato sauce. The real party happened afterwards.
Publishing the New Zealand Statistician had just been added to the Committee’s tasks. Most of the work fell to the editor, but the Secretary was responsible for mailing. I (or perhaps it was John) had typed the membership list onto paper tape, so the first step was to feed envelopes into the Flexiwriter at the correct spacing. The second stage was to remove envelopes with double addresses and hand write replacements. Very crude and time consuming of course, but our eight channel tape provided lower case letters, something which mainstream companies did not provide for many years.
Education in statistics was warming up. The publications branch of the Department of Education published Stan Roberts’ booklet, Social Statistics, in 1967. The new school Seventh Form Applied Mathematics syllabus was being rewritten to include statistics and a major teacher re-training exercise was under way. I do not recollect this taking much Committee time, although individual members of the Association were very much involved. Then, as now, the Association worked by endorsing and supporting initiatives of individual members when called upon. The introduction of the NZ Certificate in Statistics in the polytechnics provides an important example. John Offenberger’s enthusiasm was able to demonstrate the need, and provide professional members on the Syllabus Committee.
An example of when an initiative of the Association failed in the absence of an enthusiastic individual would be when an AGM requested that the Committee publicly
236
expose misuses of statistics. The next year the Committee reported that there did not seem to have been as many misuses as usual.
Before free markets determined the nation’s future, we had National Development Conferences (NDC). The NZSA was initially consulted on the needs for statistical training, to which the Committee gave a considered response before answering a few questions which ought to have been asked about the adequacy of the range of economic statistics for the indicative planning exercise the NDC was attempting.
One of my most difficult tasks was finding mutually convenient times for committee meetings. The Committee was small enough that everyone felt they should have the opportunity to attend, particularly since all that was involved was a lunchtime walk to the President’s office. The asymmetry introduced when Brian Hayman became President in 1967 made the task easier, because when he was able to drive from Palmerston North had to be the time of the meeting. One of these times was the day of the Wahine storm. I decided to cancel the meeting because official pronouncements were advising against lunchtime walks. Even in those days telephones were occasionally unreliable, and this was one of the occasions. Brian had left Palmerston North before I could get through to him, and no one could find our Lower Hutt member (Lester O’Brien). With the memory of Steve Kuzmicich’s reaction after he had walked up to Victoria University to a non-existent committee meeting fresh in my mind, I was somewhat concerned. Fortunately (for me), while maintaining 40 mph against a strong headwind, the windscreen of Brian’s car blew in and he had no alternative but to about turn. And Lester was too busy holding down his house roof to remember a committee meeting.
237
The Survey Appraisal and Public Questions CommitteeProfessor Stephen Haslett, Massey University, 1998 Convenor
The Committee (SAPQC) was formed about 1980. Its objects are —To raise the standard of practice and the level of public understanding of statistics in New Zealand by:(a) conducting independent appraisals of sample surveys, opinion polls and other
statistical statements in relation to their statistical validity, and to the needs of the users of the survey results;
(b) conducting examinations of statements made in the public domain and of significant public interest, that have statistical content, or whose validity depends on statistical consideration.
In making an appraisal it is usual for the SAPQC to attempt to discuss the substantive issue with all parties involved. However in circumstances where the required appraisal is focused on a particular document already in the public arena, and where the number of groups and individuals involved of affected is large, this extensive procedure is not followed.
Four or five appraisals were carried out each year, and although none were carried out in the 1996-1997 year, there has nevertheless been ongoing and regular requests for copies of past reports, particularly that on the statistical inadequacy of the New Zealand Treasury methodology for setting Social Welfare benefit levels. This suggests that appraisals addressing major public issues involving statistics, rather than assessments of ad hoc sample surveys, should be the basis for future SAPQC activities.
Appraisals undertaken since 1992
1992-1993Appraisal of the statistical basis of Valuation New Zealand’s valuation procedures — July 1992.Appraisal of the methodology used by the Commerce Commission in its report on the Telecommunications Industry; the “Telecommunications Industry Inquiry Report” — October 1992.Appraisal of Waitemata Electricity’s surveys to establish preferred ownership — February 1993.Appraisal of MRL Research Group’s surveys to establish preferred ownership of Central Power, Wellington — May 1993.
238
Appraisal of a survey of public opinion by MRL Research conducted for Central Power before establishment as a public company — May 1993.
1993-1994Assessment of eligibility for an appraisal from the New Zealand Lotteries Commission on the research report, “Gambling and Problem Gambling in New Zealand” — October 1993.Submission on the 1996 Census, especially on the need for a post-enumeration survey — October 1993.Assessment of a Massey University Department of Marketing ‘environment’ survey — November 1993.Preliminary assessment of a Christchurch City Council Enhancement Survey, requested by the Merivale Precinct Society — July 1994.
1994-1995The report for the New Zealand Council of Christian Social Services on the methodology for setting of benefit levels has been completed and made public. Of the SAPQC reports since 1992 this has received the most public interest. The central finding was that the data available for setting benefit levels is currently inadequate, and the Treasury methodology for assessing benefit levels is based on macroeconomic policy rather than on sound microdata.An appraisal of the Business and Economic Research (BERL) report on the accuracy of the costs and benefits of an amendment to the Marine Transport Act, requiring safety inspections for foreign owned yachts, was under preparation.Submission on Ministry of Health initiative “New Avenues for Crown Funded Social Science Research”, especially proposal 4, Establishment of a Social Science Research Clearing House — September 1994.
1995-1996The appraisal of the Business and Economic Research (BERL) report on the accuracy of their assessment of the costs and benefits of an amendment to the Marine Transport Act to require safety inspections for foreign owned yachts was completed in June/July 1995. Information from foreign owned yachts indicated that the extra cost of search and rescue for boats without certain types of safety equipment needed to be balanced against the cost of foreign owned yachts boycotting New Zealand if New Zealand regulations were applied to foreign owned boats. The methodology used by BERL for its cost benefit analysis was extended beyond the available data, and in a number of conclusions their analysis over-reached the limits imposed by this constraint. In particular, there was no evidence that foreign owned yachts were more prone to accidents at sea. Indeed, in terms of fatalities, there was some evidence that the opposite was true. However, BERL

239
were aware that their conclusions were tentative and stated so in their report. More important, however, there was general agreement among all parties that “improved safety standards are desirable”.
The other appraisal conducted this year was completed in December 1995, and considered the second Evening Post survey on voter preference for candidates in the Wellington mayoral election, 1995. The request for an appraisal was submitted by Ms Elizabeth Tennet. The survey was carried out by the Evening Post using polytechnic students as telephone interviewers. The difference in support between Mr Blumsky and Ms Tennet at the time of the poll was 7%, and this difference (given the response rate of 56% and a sample size of 460) was only marginally significant. There were also a number of other technical objections raised by Ms Tennet that are covered in more detail in the appraisal.
1996-1997There were no appraisals carried out by the SAPQC during July 1996 to June 1997. There have, however, been ongoing and regular requests for copies of past reports, particularly that on the statistical inadequacy of the New Zealand Treasury methodology for setting Social Welfare benefit levels. As in 1995-1996, this public interest suggests that appraisals addressing major public issues involving statistics, rather than assessments of ad hoc sample surveys, should be the basis for future SAPQC activities.
1997-1998Appraisal of “Towards a code of Social and Family Responsibility” completed.Assessment of a survey of mental health carried out as a legal requirement by North Health is currently in progress.Appraisal of DSW fraud statistics.
Formation of the SAPQCVic Duoba — Statistics New ZealandThe Committee was formed as a result of debate within the NZSA concerning surveying standards of market research companies. Professor John Deely (University of Canterbury) was a keen proponent of the idea and was the founding chairman of the Committee, which was to include members from the Market Research Society. The intention was to provide a formal mechanism for concerned persons to obtain an unbiased assessment of public surveying practices from a balanced group of experienced statisticians who had both theoretical and practical knowledge. The early years were relatively quiet. An early major statistical study commented on, was a Depo-Provera trial in New Zealand by a major overseas pharmaceutical company. However, the calm was well and truly broken when the Committee issued its report

240
on a survey carried out to ascertain support for a proposed civic center in Auckland. The report stated that the questionnaire was not sufficiently disinterested in its wording, and the newspaper reporting of an interview with a Committee member put that Committee into the headlines. There was considerable debate with the Market Research Society, and pressure to withdraw the report. However, a reassessment justified the original comments and the Committee went back to a calmer mode of operating. Following this experience, the operating rules for the Committee were tightened somewhat and the members became more aware of what can happen if procedures are not followed strictly, and if just one flamboyant word is used when talking to a reporter. However, at this juncture the Market Research Society decided to pull out of the joint sponsorship of the Committee.

241
The Education CommitteeMike Camden (Senior Lecturer), School of Engineering and Construction, Wellington Polytechnic
OriginsThe Association has been concerned with statistical education since its foundation. Examples of this concern are its inputs into polytechnic courses in the 1960s, 1980s and the early 1990s, and its sessions on statistical education at its conferences.
The AGM of June 1986, at Victoria University, set up an Education Committee with the brief that “it will encompass the entire range of statistical education activities”, but that the Seventh Form ‘Mathematics with Statistics’ course must have top priority. The Committee was also to be the visible point of contact for NZSA on Education. It was decided to have a “two tiered Committee structure with a central Committee based in Wellington and local coordinators providing liaison with schools and Maths Associations throughout the country”.
The President’s Report for 1986-1987 summarises the original setup:
The Education Committee aims to promote and raise the quality of the teaching of statistics at all levels, both within and outside the New Zealand educational system. A network of regional coordinators has also been set up to initiate and maintain such development at a local level and to coordinate with the Education Committee and the local mathematical associations.
The Convenor of the Committee was Sharleen Forbes. The initial task undertaken by the Education Committee was the provision of support for the new Seventh Form course, ‘Mathematics with Statistics’. It is currently offering assistance in the form of one-day seminars, additional resource material and regional lists of members who are willing to assist with project work and occasional talks to classes. A one-day forum on the background, maintenance and execution of the 7th Form ‘Mathematics with Statistics’ project, including assessment, was held in Wellington in early 1987. It was organised by Dr B P Dawkins. A similar exercise organised by Mr P D Johnstone, was held in Dunedin. Both were well received. The Committee has also made submissions to a number of educational reviews.
With the shift of emphasis from support for 7th Form teachers to input into national curriculum and assessment systems, the need for the regional tier faded. The central group continued to meet four to seven times a year in Wellington. It now keeps e-mail contact with members in other centers. It agreed that its purpose was “to improve the quality of statistical education for New Zealand students”.
Over the years, the Committee has worked closely with Association Presidents
242
and has received valuable input from members. It has worked with Statistics New Zealand, and values the active interest it takes in statistical education. While it has not been directly involved with Science Fairs, it sees these as an important part of the Association’s contribution to statistical education.
Sharleen Forbes was Convenor of the Committee from its foundation in 1986, until the ‘International Conference on the Teaching of Statistics (ICOTS) 3’ in 1990. At the Committee’s meeting during this conference, there was a “tumultuous round of applause” for Sharleen. Mike Camden was proposed as successor, but before this could be debated, it was discovered that dinner at the Halls of Residence was imminent, and the Committee departed in haste. Mike has been Convenor since that momentous occasion.
The Children’s CensusIn association with ICOTS 3, the Committee ran ‘The Children’s Census’, and achieved positive publicity with the large number of children who participated as well as the public. On August 1 1990, all primary schools were invited to take part in a children’s census as part of National Mathematics Week. The theme of the census was health and awareness. Completed forms from more than 600 schools were received, and the graphs of the results were produced by David Harte, and published in newspapers, giving quick feedback. Schools were invited to create displays of their own data, and a selection of these were shown at ICOTS.
Main activitiesIn its efforts to “improve the quality of Statistical education in New Zealand”, the Committee has taken action as follows:
(a) It has run regional seminars for teachers, especially in the early years.(b) It has worked towards education sessions and days at NZSA conferences.(c) It organised the 1996 NZSA Conference which had the specific focus of
“Research in the Learning of Statistics”.(d) It has arranged statistical workshops in the conferences of the NZ Association
of Mathematics Teachers. The 1991 Conference in Wellington included a Statistics Day. The 1993, 1995 and 1997 conferences included workshops organised by the Committee. These involved the participants in running up stairs or skipping, then using their pulses, skipping rates and ages, to scatter-plot themselves across the floor. The aim was to model active learning, and the planning and the carrying out of investigations that use statistical data.
(e) It made a long series of inputs into the years of work on New Zealand’s mathematical curriculum. The outcome was “Mathematics in the NZ

243
Curriculum” published by the Ministry of Education in 1992. This has a strong “strand” of statistics and probability at every stage of the school system, from Year 1 to Year 13.
(f) It has had a long involvement with the NZ Qualifications Authority. It has been represented on that body’s Mathematics Advisory Group, National Standards Body for Science and Technology, and several writing parties on Unit Standards. For the Unit Standards, our aim was to ensure that statistics kept its proper profile among the Mathematics Units, that the skills content was about statistical problem-solving in the current environment, and that the wording was accurate.
(g) Committee members were part of the planning team for ICOTS 3, in Dunedin, 1990.
(h) The Committee has been involved in several NZSA publications.(i) The Committee organised poster competitions for school students in some
years, with the posters being displayed at conferences.(j) The Committee has made a substantial input into the Ministry of Education’s
“Addendum to Level 8 of Mathematics” in the New Zealand Curriculum, in 1994.
Statistics in the New Zealand school curriculumIn the years leading up to the 1992 publication of “Maths in the New Zealand School Curriculum”, two schools of thought were converging:
1. The first was the view of the NZ Statistical Association and its Education Committee. These were that statistics was essentially about clarifying a question, planning and carrying out an investigation to answer the question, and communicating the results. We thought that students could use graphs and software, when available, to explore for the real messages in the data. We proposed a series of skills for the school years, and some principles for aligning school work with current practice and technology. Our many clients met with sympathy and agreement.
2. The second view was that of mathematics educators, whose view was that mathematics was essentially about the process of problem-solving, logical thinking and communication. They thought that students could learn those processes best by constructively building on their own experience through activities. They thought too, that the Mathematics ‘rope’, through the school years, should contain a substantial statistics ‘strand’.

244
The outcome is that New Zealand is in a leading position, with a strong ‘strand’ of statistics which progresses through the school years. This strand consists of three ‘threads’:
(a) doing investigations;(b) making and reading statistical reports;(c) using probability.
ConclusionThe years since 1986 have contained great opportunities for growth and positive change in the learning of Statistics. The Committee has aimed to make the most of these opportunities, on behalf of NZSA.

245
The NZSA (1990-1993)Jean Thompson, formerly AMD, and President of the NZSA, 1991-1993
During the three-year period that Jean Thompson was President, probably the most important external issue for the Association was the restructuring of the DSIR into Crown Research Institutes. Many submissions were made from the NZSA Executive, to Parliament, on science issues in general, recognising that statistics is an important underpinning discipline for all sciences.
Sadly, much of the advice proffered by the Association was seen as “vested interest”. Probably one of the saddest moments for the Association Executive at the time was the closing of the Applied Mathematics Division, in June 1992, the Government having decided there was no “output-oriented role” for such a unit. However, the actual closure had been foreseen for quite a time as the nurturing role of AMD had been increasingly undermined by the Government’s changing policy — firstly, charging non-government organisations, then charging other Government Departments, and finally inter-divisional charging within the DSIR. In an environment of shrinking funding such a policy could only result in the demise of AMD, so it came as no real surprise. The central, underpinning role of applied mathematics, including statistics, had been ignored.
On a brighter front, the Women’s Suffrage Centenary Celebration of 1993 provided opportunities for the NZSA to show the strength of its women members, and to publicise the part played in diverse areas of the New Zealand economy by women with statistical understanding and interests. A grant was received from the Suffrage Committee to enable the Association to construct a large portable display which used striking color, glossy photographs and vignettes of women active in statistics, to show New Zealanders at a glance the diverse part statistics plays in daily lives. The display was particularly pitched at young women to encourage them to think about a career in statistics, but had a broader appeal as well. It was moved around the country and displayed many cultures.
Later, from the material that was gathered for the display, we were able to publish a book, Women with Maths — Making a difference, that told of the lives and work of 40 New Zealand women aged from 17 to 70, for whom knowledge of statistics in particular, but also mathematics, enabled them to have diverse careers and lifestyles. A grant to help publish this book was received from the Ministry of Research Science and Technology. Top-up funding was supplied by the Association from moneys gifted by Professor J T Campbell for general educational purposes, and also from accumulated surpluses from earlier material published by the Association. Much time and effort was put into these projects, particularly by a number of key women
246
in the Association. As a small departure from recent tradition, Jean Thompson was persuaded to stay on for a third year to ensure our Association had a woman President during Suffrage Year.
In the previous period with Peter Thomson as president, Jean Thompson as Secretary and Alex Neill as Treasurer, the Association had reached out to more actively involve members outside of Wellington. The vision was to create a truly national body. Separate accounting systems were established for each of the activity areas, publications and conferences, so that the subscription could be entirely focussed on delivering the Newsletter and the Statistician, and on providing a national organisation to represent statistical interests. During 1991-1993 the executive moved to having ‘portfolios’ for specific areas of on-going interest for the Association, with the portfolio’s holder on the executive. Thus, responsibilities and tasks were more clearly defined within the executive. Where appropriate a portfolio area also had a sub-committee. The main areas were The Statistician and Newsletter, General Publications, Education and the SAPQC; the latter two of which had existed as separate sub-committees earlier. Thus the Association could achieve more, as more people than just those on the executive could, and did, get directly involved. Other portfolios were established as required such as for the Suffrage Project and to investigate Accreditation. This system continues today.
EditorOther activitiesScience fairsIn the 1960s and 1970s, the science departments of various secondary schools were running Science Fairs. The Statistical Association began to offer small prize for the best statistical exhibit.
Model answersDuring the 1970s, members of the Association had been assisting with statistical courses in the polytechnics and the setting of the examination papers. In addition, the Association published a series of Model Answers that continued until 1975.
Calculator fairsInformation about new electronic calculators coming onto the market began to appear in the New Zealand Statistician in 1968, when a review (unsigned) was published in Volume 3(3). Such reviews continued for many years. In the late 1960s I was appointed by the Government Stores Board to examine and report on hand-held calculators, and through this I soon got to know a number of sales representatives. In 1972, I offered to organise a calculator fair for the Association, to be held in conjunction with the annual conference. The first of these fairs took place on 18

247
October 1972 at the Hotel St George, Wellington. Eleven firms participated, and demonstrated 51 models ranging from a 30 gm pocket calculator to an 18 kg desktop ‘mini computer’. The display was opened by the former Minister in Charge of the Department of Statistics and Minister of Finance, the Hon R D Muldoon, and was visited by several hundred people. The price for the smallest machines ranged from $50-100, and for the largest, $2,000-5,000. Each firm paid an admission fee of $50, and with expenses of $121, the fair resulted in a substantial increase to the funds of the Association. These fairs continued in Wellington until 1985, although by this time they had moved into the fields of microcomputers and statistical software, in addition to the hand-held calculators. One such fair was held in Auckland in 1975.
25th AnniversaryTo celebrate the 25th Anniversary of the Association, a Commemorative Dinner was held in the James Cook Hotel, The Terrace, Wellington, on the 9th July 1974 at 6.00 pm. The host was the then President, Dr Hamish Thompson; a Toast was proposed by Professor J T Campbell, and was replied to by Mr I D Dick. The Dinner included cocktails, hot entree, cold buffet, followed by desserts, coffee and wines.
Overseas visitorsA number of overseas statisticians have visited New Zealand from time to time, one of the earliest being S S Wilks, who presented a paper at the 1956 Conference. R A Fisher visited in September 1959, B V Gnedenko in 1966, J W Tukey in 1979, and W E Deming in 1984 and 1986.

248
Invitation to Calculator Fair

Invitation to 25th Anniversary Dinner

250
chapter 6
GeneralFlorence Mary Harding (1910-1977)Editor
Mary Harding appears to be the first New Zealand woman to attain a PhD in Mathematics. She entered Canterbury University in 1929, gaining her BA as a Senior Scholar in 1931, and achieving MA with First Class Honours in 1932. She was then awarded two Scholarships, the Lohse (for the daughter of Clergy), and the Sir John Hartley, (a Canterbury Scholarship). Mary Harding then went to Edinburgh University, studied under A C Aitken, and graduated PhD in 1934 with a thesis entitled “Least Square Smoothing by Linear Combination”. In 1940 she was probably teaching at the prestigious Cheltenham Ladies’ College, and in 1946, at the School of St Mary and St Anne, Abbot’s Bromley, Rugeley. In 1948 she became a part-time Lecturer at the University of Adelaide, and the first woman warden of St Anne’s College, a Hall of Residence there. She returned to New Zealand in 1953, to be a warden of Helen Connon Hall and a Lecturer at Canterbury University; and was a Senior Lecturer from 1963 to 1971. The title of her PhD thesis appears to place it under the general heading of Mathematical Statistics, so I suppose that we can claim that she was also the first New Zealand woman to write a PhD thesis in Mathematical Statistics; although in her teaching she specialised in pure, and in engineering, mathematics. (This information has been derived from the University of Edinburgh Library, from Dr Robin Milne of the University of Western Australia, and from Dr R M Williams, former Director of the Applied Mathematics Division and who was also a cousin of Mary Harding. There is also an article about her in “Women Sum It Up” by Diane Farquhar and Lynn Mary-Rose, Hazard Press, Christchurch, 1989)

251
Frank A HaightEditor
Frank Haight, an American, arrived in New Zealand in 1947. At some time during 1936-1940 he had attended lectures on statistics at the University of Iowa, given by Allen T Craig. He had brought his notes, with early mimeo versions of Erich Lehmann’s notes on estimation and significance testing, with him. These provided the basis for his first lectures. He was appointed to a Senior Lectureship at Auckland in 1949, and remained in that position for ten years. Two years after his appointment, the topic “Mathematical Statistics”, which was examinable, was officially brought into the curriculum. In addition to his lectures, he began a thesis entitled “An investigation of queue stability with special reference to the traffic intensity”. He had no supervisor since there was no one in New Zealand at that time available to supervise a PhD thesis in statistics. However, Hamish Thompson of the AMD Auckland Station was the internal examiner, and Pat Moran of Australia, the external examiner. In 1957 he received his PhD in Mathematics which was the only PhD in Mathematics ever awarded by the University of New Zealand, and it was also the first PhD thesis with a statistical content produced in New Zealand. He later left New Zealand and became the Adjunct Professor in the Institute of Transportation at the University of California, Irvine. Apart from his mathematical activities, he took a great interest in chess, and played in the New Zealand Championship in the 1950s.
252
Dr Michael Cullen (1945– )Editor
Dr Michael Cullen, in addition to being Deputy Leader of the Opposition, is also an historian whose mathematical expertise enabled him to work with confidence on statistical issues where many historians fear to tread. Born in London in 1945, he attended Canterbury University from 1963 to 1967, advancing both History and Mathematics to Stage III, completing Honours in History. He then went to the University of Edinburgh on a UK Commonwealth Scholarship, where, in 1971, he completed a PhD thesis entitled “Social Statistics in Early Victorian Britain, 1830-1852”. This was later rewritten as “The Statistical Movement in Early Victorian Britain”, and published by the Harvester Press, 1974. The book is divided into two parts, Part I being a study of The Board of Trade, The General Registry Office, The Health of the Armed Services, Sanitary Statistics, Government Statistics, and Moral Statistics. Part II is concerned with the beginnings of various statistical societies, especially those of London and Manchester.

253
A note on the ‘Cold War’ period in New ZealandEditor
Not many people born after about 1940, realise the effect the ‘Cold War’, between the USA and the USSR, had on life in New Zealand. This period began not long after the end of World War II, and was accentuated by the Korean War, which began in 1949. It was known as ‘McCarthyism’ after the American, Senator McCarthy, Chairman of the ‘Un-American Activities’ Committee, which had a devastating effect on many lives in America, especially on the lives of some intellectuals. In 1949, New Zealand had a change of Government, from Labour to National. Shortly after coming into power, this latter Government passed a law, designating three Government Departments as ‘Security Departments’, namely, the Department of Foreign Affairs, the Department of Scientific and Industrial Research, and the Treasury. Under this law, the State Services Commission had the power to transfer officers from these three departments to some other department, without loss of salary or status.
This had an effect on at least two officers in the DSIR, both of whom were members of the Communist Party. One was a technician in the Nuclear Science section, Gil Deynzer, transferred as a clerk to the Social Welfare Department. The other was a statistician, Phil Armstrong, who was a member of the Applied Mathematics Division, and who was to be transferred to the Ruakura Animal Research Station of the Agriculture Department. Phil, however, decided to resign and took up teaching. I, the Editor, was appointed to Phil’s position at the end of 1950, but it took six months for an approval to be given by the Commission — an inordinately long time, so I presume that my political opinions were thoroughly investigated.
Many of these investigations were carried out by the Special Branch of the New Zealand Police, who employed anyone they wished, to inform and report back, on various Party members and their so-called ‘fellow travellers’. One such informer was a George Fraser, who worked for the New Zealand Broadcasting Corporation as a disc jockey. He later wrote a book about his experiences, entitled Seeing Red — Undercover in the 1950s, New Zealand, published in 1995 by the Dunmore Press, Palmerston North. These reports were highly secretive and were never able to be seen by any of the victims, and so, none of the information could ever be challenged; they could remain on the books for ever, and do untold damage to the person concerned. George Fraser, a Christian fundamentalist, did not want New Zealand taken over by the Communists. An interesting sidelight on the type of person employed by the Special Branch is given in a couple of sentences of his autobiography: (p 26)
254
I don’t know if I prayed that night about deliverance from the communist threat, but my mind was fertile with scenes of hordes of foul-mouthed and semi-witted British immigrants taking control of the country I loved … I wondered whether the warm Sunday night church services would be blown away by fundamental materialism espoused by foreign-led propagandists.
After some years he came to realise the damage he must have done to the lives of many New Zealanders, and sincerely regretted it.
Harold Silverstone (see Chapter 2) was a member of the Communist Party during much of the 1940s and 1950s. He was appointed as Assistant Lecturer in Mathematics at Otago University in 1946, and became Senior Lecturer in 1953. Four years later, the Mathematics Chair became vacant due to the death of Professor Gabriel. He applied for the position, but was not appointed. As a Communist he would have been investigated by the Special Branch of the Police, and in such a political atmosphere it is not surprising that Silverstone’s relatives and friends believed that his application for the Chair was unsuccessful because of his political views. Some of his friends claimed that he had actually been appointed to the Chair, and that the Government refused to confirm the appointment. However, I had serious doubts as to whether the Government had ever had the power to either confirm or cancel a University appointment. The only time I believe that this ever happened in New Zealand was when Victoria University refused to cancel the appointment of Professor von Zedlitz when asked to do so by the Government, in 1915. He had been appointed to the first chair in Modern Languages at Victoria in 1901.
Unfortunately for him, by 1915 he was no longer a German citizen as through long residence abroad, his citizenship, in German law, had lapsed, and he had not yet acquired British nationality. It was during World War I, when many New Zealanders were calling for his dismissal, that Parliament passed “The Alien Enemy Teachers Bill”, and von Zedlitz was forthwith dismissed. (See introduction to The Search For A Country, G W von Zedlitz, Paul’s Book Arcade, 1963.) According to von Zedlitz (from whom I had some private tuition in Latin in 1940), this Act applied only to him, as he told me one evening.

255
Gleanings from the New Zealand Statistician
(A gypsy had predicted that a child, soon to be born to David and Emma, would be a girl, and would die shortly after. The first prediction, that the child would be a girl, had come true). David said “If the old woman’s dictum was a real prediction we may also let it rest. That it has half come true lessens the chances for the other half.” The reader may detect a flaw in David’s logic, but it was quite good enough for Emma.
Henry James, A Problem, 1868
In my opinion a statistician should not recommend to the client that he take any specific administrative action or policy. Use of the results that come from a survey or experiment are entirely up to the client. The statistician, if he were to make recommendations for decision, would cease to be a statistician.
W Edwards Deeming — Ann Maths Stat 36, 1965
A graduate who studied statisticIn work found that fate was sadistic All things that he thoughtHe could use were for nought‘Cos the methods applied were heuristic.
There once was a BiometricianWho treated life’s work as a missionHis confounded designsMultifactored with timesCaused his balance to go in regression.
But there is something unreal, as well as repugnant, about treating air disasters on a mere statistical basis. Unreal, because, as the Swedish air-safety expert, Mr Bo Lundberg, has pointed out, it is simply the growing size and frequency of air disasters which shocks people, and this is quite unrelated to the number of miles travelled and similar considerations. Repugnant, because of the human tragedy involved in every disaster, and everybody knows that with more care and greater investment of money many lives that are now lost in air crashes could be saved!
The Observer, 4 September 1966“Let us sit on this log at the roadside,” says I, “and forget the inhumanity and ribaldry of the poets. It is in the glorious columns of ascertained facts and legalised measures that

256
Rows 10.9453 4 2.73633 121.826Cols -0.015625 2 -7.82150E-03 -0.347826Resid 0.179687 8 2.24609E-02Total 11.1094 14
Probability of F ≥ 121.826 with 4 and 8 DF is 0Probability of F ≥ -0.347826 with 2 and 8 DF is 1
We are only waiting for him to produce a correlation coefficient greater than 1, and then we will know that he is like the rest of us.
H S Roberts
(When the initial 6 was deleted from each observation, reasonable sums of squares were obtained. However, HP was still reluctant to print any estimates or analyses of residuals commonly associated with an analysis of variance.
Ed, New Zealand Statistician)
Statistics are used as a drunken man uses a lamp-post, to lean on and not to illuminate.G K Chesterton
There is no such a thing as chance. A door may happen to fall shut, but this is not by chance. It is a conscious experience of the door, the door, the door, the door.
Kurt Schwitters
When the Scots were advancing in England in 1745 people in London thronged to the Bank to obtain payment of its notes, and it only escaped bankruptcy by a stratagem. Payment was not indeed refused, but as those who came first were entitled to priority of payment, the Bank took care to be continually surrounded by agents with notes, who were paid in sixpences, in order to gain time. These agents went out at one door with the specie they had received, and brought it back by another, so that the bona fide holders of notes could never get near enough to present them. By this artifice the Bank preserved its credit and literally faced its creditors.
The Chevalier de Johnstone, A memoir of the ‘Forty-Five’When I come to “Evidently” I know that it means two hours hard work at least before I see why.
W S Gosset in a letter to R A Fisher, June 1922

257
beauty is to be found. In this very log that we sit upon, Mrs Sampson,” says I, “is statistics more wonderful than any poem. The rings show it was sixty years old. At the depth of two thousand feet it would become coal in three thousand years. The deepest coalmine in the world is at Killingworth, near Newcastle. A box four feet long, three feet wide and two feet eight inches deep will hold one ton of coal. If an artery is cut, compress it above the wound. A man’s leg contains thirty bones. The Tower of London was burned in 1841.”
“Go on, Mr Pratt,” says Mrs Sampson. “Them ideas is so original. I think statistics is just as lovely as they can be.”
O Henry
The figure of 2.2 children per adult female was felt to be in some respects absurd, and a Royal Commission suggested that the middle classes be paid more money to increase the average to a rounder and more convenient figure.
Punch
A Bill for Registering the Number of People was introduced in 1753, but met with violent opposition in the Commons as a “project ... totally subversive of the last remains of English liberty ... an abominable and foolish measure calculated to reveal our weakness to our enemies”, and though it actually passed the Commons, it received its quietus in the House of Lords.
B Williams
Readers will be pleased to know that the Applied Mathematics Division has discovered that it was unknowingly employing a statistician on its staff in the guise of, or under the name of, HP2000E. HP has indubitably qualified as a statistician by producing a negative sum of squares. He carried out an analysis of variance consisting of 5 rows and 3 columns, using one of his own programmes, ‘ANVAR3’. The following numbers were given to him:
60.8666 60.8666 60.738560.4038 62.2757 62.275762.9162 62.9162 63.172462.5319 62.5319 62.6661.1228 61.2509 60.8666He printed out the following answer:
Source Sum Sq DF Mean Sq F Ratio

258
The odds against all four players at whist while holding complete suits are 2,235,197,406,895,366,368,301,599,599 to 1. These figures are worked out by combinations and permutations, and have been checked by the Royal Statistical Society and other eminent mathematicians. They are undoubtedly correct, and may be accepted as such.
Western Morning News, Plymouth
The King of the Years ridicules the Jalno, saying to him, “What we perceive through the five senses is no illusion.” The Jalno, who represents the Grand Lama of Tibet, contests these heretical opinions; the dispute waxes warm, and at last both agree to decide the questions by a cast of the dice. Fortune, however, always favours the Jalno, who throws sixes with unvarying success, while the opponent turns up only ones. Nor is this extraordinary as at first sight might appear; for the Jalno’s dice are marked with nothing but sixes, and his adversary’s with nothing but ones.
J G Frazer, The Golden Bough, Part VI
Censusing has always been contentious, especially since its historical purpose has usually involved taxation or conscription. When David, inveigled by Satan himself, had the chutzpah to “number” Israel (1 Chronicles, Chapter 21), the Lord punished him by offering some unpleasant alternatives: Three years famine, three months of devastation by enemy armies, or three days of pestilence (all reducing the population, perhaps to countable levels). The legacy of each American census will be 10 years of contention, at least until we realise that counting noses is not the best way to enumerate many and varied people.
New Scientist, 9 April 1981
About (t) time? As we all know the usual t-test assumptions are often violated by errant data. I have just come across a reference to a modified technique that may solve all our problems. In a paper published in some (non-statistical) conference proceedings I discovered the following: “The statistical analysis of the results was done with the Student t-test for impaired data.”
Doug Altman, Middlesex
Statistics are the only tools by which an opening can be cut through the formidable thicket of difficulties that bars the path of those who pursue the science of man.
Francis Galton

259
When the money to be counted is sent to the Exchequer, one of the Tellers carefully mixes up the whole payment, so that the good and bad coins are fairly mixed for weighing. A Chamberlain then weighs out in the scale-pan enough to balance the Exchequer pound: but if the number weighing twenty shillings is more than sixpence over the pound the money is judged too bad to be received.
Richard, Son of Nigel, Treasurer of England and Bishop of London, c.1160
For example, it is absurd to demand logical demonstrations from a professional speaker; we might as well accept mere probabilities from a mathematician.
Aristotle, Nichomachean Ethics
Working with a statistician is like eating a steak with a dog under the table. You eat all the good bits yourself and give the dog the grisly bits — and he’ll bite your leg if you don’t.
G Laslett, 4th Australian Statistics Conference
“… it is of some historical interest to note that the formulas bearing the name of Gauss, Stirling, and Bessel were apparently first known to Newton, while the formulas attributed to Newton are due to Gregory. Further, Everett’s first formula is due to Laplace, and Everett’s second formula was apparently first given by Steffensen.”
F B Hildebrand, Introduction to Numerical Analysis
Sir,You report at a whist table at a function at the Royal Hotel, Plymouth, a player was dealt all thirteen trumps. The odds against this happening are 635,013,559,599 to 1. The odds against all four players holding complete suits are 2,235,197,406,895,366,368,301,559,599 to 1. (A)
Sir,The letter from A stating that the odds against four players holding the complete suits in cards are 2,235,197,406,895,366,368,301,559,599 to 1 is too ridiculous for words, as it would be humanly impossible for anyone to work out such odds. In any case he might have made the last 599 an even 600. (B)
Sir,

260
might be made as enchanting as ever, if only they could be mingled with love.Anthony Trollope, The Small House at Allingham
My son and his father-in-law jointly own a kiwi-fruit farm. Each season they both make an estimate of the expected yield. My son always makes a high estimate, and his father-in-law a low one. At the end of the season the father-in-law’s estimates are found to be almost invariably correct. When questioned about this my son replies: “Mine is actually the better estimate since I am unhappy for only three months of the year (after the results have come in), whilst he is unhappy the whole year round.
H S Roberts
It says much for the magnanimity of Pope Pius II (1458-1464), and the interest he must have had in building, that he actually praised his architect (Bernardo Rossellino) for having given him a low estimate for building a palace and a church at his country seat, Pienza, in the early 1460s. This saved the Pope from cancelling the project, or trimming it, and resulted in the creation of one of the most advanced residences of its day and a highly satisfactory church. “You did well, Bernardo, in lying to us about the expense involved in the work. If you had told the truth, you could never have induced us to spend so much money, and neither this splendid palace nor this church, the finest in all Italy, would now be standing.”
Peter Thornton, The Italian Renaisance Interior 1400-1600
261
If your experiment needs statistics, you ought to have done a better experiment.Earnest Rutherford
It actually was Efron who started Diaconis thinking about what it really meant to be random. Efron gave Diaconis an example. Suppose a wall is painted with 10-foot-wide black and white stripes. If you throw a dart at the wall, you can decide ahead of time whether it will land on a black or a white stripe. There is nothing random about it. Now suppose you start shrinking the stripes until they are only 1/10 inch wide. You would say that it is uncertain — random — whether the dart will land on a white or black one. “Brad gave me that example and then asked ‘Can you make a theory of that’?” Diaconis recalls “It was a key image and a crucial question.”
Kolata G, 1986, Science 231
Statistics were becoming dry to him, and love was very sweet. Statistics, he thought,
262
Index of names
AAitken, AC 73-75, 84, 89, 97, 105, 250Allen, Ron 41, 44Andress, WR 144Anscombe, Frank 49, 61Armstrong, Phil 30-31, 34, 55, 93, 253Arnold, Greg 227Atkinson, Alan 49-50
BBaker, John 76-77, 82, 104, 110Barber, Norman 59, 64, 99Barlow, Peter 35Bartlett, MS 30, 58, 98, 100Beaglehole, JC 132Beeby, CE (Dr) 116, 139Bedford, HD 136Bell, RJT 75, 83Belshaw, Horace (Prof) 134Benson, Cathie 28Billing, GC (Prof) 137Bliss, CI 218Bowley, AL (Prof) 18, 133Box, George 183Bradford, Elisabeth 206Brown, William 5Brownlee, KA 40Bruce, Pat 121Bullen, KE 142Burns, Eleanor 62Bush, Vannevar 48Butcher, Jim 67, 94-95Butcher, John 66, 144
CCadell, PB 171Callaghan, FR 29

263
Camden, Mike 242Campbell, JT (Prof) 37, 47, 53, 83-87, 92, 98, 103, 143, 158, 215,
218, 222, 246-47Carter, Alan 21Chung, Mary 62Clark, Malcolm 41, 183Clark, Thomas (Sir) 42, 183Clinkard, GW 18Coghlan, TA 18Comrie, Les 194Condliffe, JB (Dr) 18Cook, Len 103Copeland, CB (Dr) 18Copland, DB 190, 192Cornish, EA 215Crowther, A (Prof) 141Cruickshank, DJ (Dr) 18, 76, 190Cullen, Michael (Dr) 252
DDainty, Jack 26Dale, Jocelyn 233Danks, AJ (Prof) 136Darwin, John 29, 32-33, 42, 44, 54Darwin, LJ 49, 56,-57, 61, 93, 144Dawkins, BP (Dr) 241Deely, John (Prof) 239Deming, WE 247Denhan, Henry (Prof) 92Deynzer, Gil 253Dick, Ian 28-30, 32-33, 39, 49-50, 53, 55-58, 61, 63, 67, 85, 87, 91-98,
120, 215, 217-19, 247Doherty, Mike 223Domb, Mrs 63Drummond, Ewan 35, 36, 42, 63, 144Dry, (Prof) 84, 177-78Dudding, BP 40
EEastcott, DF 171Elder, John 66Elley, WB 168

264
Ellis, Leon MacIntosh 147Entrican, Alex 147-49Evison, Frank 64, 98Ewing, Jean 32
FFarr, Coleridge 92Fawcett, EJ 22Field, HE (Prof) 137Fisher, RA 20-21, 23, 30, 40, 154-57, 159, 247Fitt, AN (Prof) 138Forbes, George 78Forbes, Sharleen 241-42Foster, Peter 43Frankel, Otto (Sir) 47, 84, 157Fraser, George 251Fraser, Malcolm 10-11, 17
GGabriel, (Prof) 89-90, 254Gittins, John 101Glenday, Arch 31, 43, 65, 93Gnedenko, BV 245Gordon, Douglas (Prof) 90Gosset, WS 20-21, 84, 154-59Gould, WH (Prof) 139Grenander, Ulf 98Grossman, JP (Prof) 134
HHaight, Frank 142, 251Hancock, John 56, 177-78Harding, Florence Mary 249Harris, Ernie 103Harte, David 242Hartree, Douglas (Prof) 37, 60Hayman, Brian (Prof) 30, 55-56, 143, 219, 227, 236Hearnshaw, LS 141Heine, Hilda 135Heine, Volker (Prof) 66, 89Henderson, H 120, 122Henderson, Lyn 33

265
Hewat, RET 171Heywood, Jean 68Hight, James (Prof) 136Hilgendorf (Dr) 46-47, 154, 158, 190Hobson, William 4Hodgkinson, Gilbert 82Hoe, Jock 86Holland, Sidney 78Holloway, Jack, 149Hudson, AW (Prof) 20-21, 24, 46, 84, 154-59Hunter, TA 135
JJackson, Fraser (Prof) 41-42, 44, 136, 181Jacoby, Peter 86-87Johnson, JA 138Johnstone, PD 241Jorgenson, Murray 233Jowett, Geoff (Prof) 112-115, 121, 145
KKerr, Roy 66Kuzmicich, Steve 77, 103-111, 236
LLawson, Richard (Prof) 140Leadbetter, Ross 66Levy, Bruce 24Lewin, JP 76, 107Lewis, Evan 150Lindley, Dennis 100Ludwig, Thomas 171Lynch, PB 21
MMcIlraith, James (Dr) 14McLellan, Alister 89MacMeekan, CP (Dr) 56, 177-79McNabb, Alec 43-44, 63Maindonald, John 142Marsh, Theodora 145

266
Marshall, Claire 31Martyn, WJ 74Matern, Bertil 58, 98Mather, K (Prof) 30, 159Miles, (Prof) 84Miller, Jean 20, 190, 218Milne, Betty 31, 33, 55Milne, Robin (Dr) 90, 250Mitchell, FW (Prof) 140Moon, Bruce 89Moran, Pat 99, 251Mountfort, Maurie 41, 44Mountier, Neil 27, 68Muldoon, Robert 247Murphy, BE (Prof) 135Murray, Jeanette 31
NNash, Walter 12, 67, 87Neale, EP (Dr) 18Neill, Alex 246Nicholls, Jim 104Nielsen, Lawrence 77
OO’Brien, Lester 236Offenberger, John 236Olsen, Peter 151Otis, Arthur (Dr) 164
PParkyn, George 140Pearson, (Prof) 158Penny, Richard 228Philpott, BP 184
RRanstead, Jack 177Rayner, AA (Dr) 21, 218Revfeim, KJA 231, 235Reynolds, John 206, 233Rhodes, David 206
267
Richards, DJ (Prof) 74Riddett, (Prof) 84Riske, Max 119, 222Roberts, Stanley 31, 42, 62, 66, 206, 222, 235Russell, John (Lord) 4
SSaddler, (Prof) 32, 49, 92, 144Sawyer, Desmond 90Scott, TH 141Seal, Ken 52, 65, 122, 181, 182-83, 193Sealy, EH 144-45Seber, George 142Segedin, Cecil 142Shand, Tom 49-50, 106Shelley, James (Prof) 139Shields, Margaret 109Silverstone, Harold (Dr) 88-90, 145, 254Simkin, CGF (Prof) 135Slater, SW 203Smallfield, PW 21-22, 26Smith, Fairfield 60Smith, Ron 88Sommerville, E 155Sommerville, DMY (Prof) 131, 143Spears, George 89, 145
TTate, Graham 41-42Taylor, Bill 30, 40, 93, 181Tennant, JS (Prof) 139Thompson, Hamish 30, 32, 38, 41-42, 64, 93, 98, 124, 181, 183, 193-94, 247, 251Thompson, Jean 245-46Thomson, Peter 227-28, 246Thomson, Priestley 147Tills, Athol 142Tocker, AH 136Treager, Edward 14Tukey, JW 247Turner, Helen (Dr) 218
UUnwin, Bob 33, 54, 57
268
VVere-Jones, David 65-66, 83-84Vignaux, Tony 43-44Vogel, Julius 8von Dadelzen, Edward 9, 18von Zedlitz, GW (Prof) 254
WWard, Arthur (Sir) 47, 84, 86Ward, Garth 31Warren, Bill 20, 150, 229, 233Watts, Jack 78Westrate, C (Prof) 136Whale, HA (Dr) 37Whittaker, ET 75Whittle, Peter 30, 42, 85-86, 93, 97-102, 177Wilks, SS (Prof) 220, 247Williams, Bob 29, 33, 35, 37-38, 41, 54, 61, 63-64, 67, 93, 124, 250Williams, Jim 38Williams, JW (Prof) 137Wishart, John 49, 157Wodzicki, (Dr) 60Wold, Herman 58, 97-99Wood, George 3, 5, 10-12, 15, 17, 76-82Wooding, Robin 32, 63,-64, 67Woodthorpe, (Archdeacon) 136Wright, Graham 30, 32, 144, 191Wright, WM 4