a ilvl 1i 250d ci.i t fi
TRANSCRIPT

A -~A251 250D e0IlVl Ij1I EI CI.I T fi
NASA Contractor Report 187207
~ THRUST CHAMBER MATERIALTECHNOLOGY PROGRAM
FINAL REPORT
N J. S. Andrus and R. G. BordeauPratt & WhitneyGovernment Engines 8 Space PropulsionP.O. Box 109800
1, i West Palm Beach, FL 33410-9600
¾ March 1989
Prepared forNational Aeronmautics and Space AdministrationLewis Research Center21000 Brookpark RoadCleveland, OH 44135
Under Contract No. NAS3-23858
IT .
Nationial Aeronautics and 92-1421 1Space Administration1111Il!I 11
92'
FOREWORD
"•his report describes development of copper-baued materials for use in cooled rocket enginethrust chambers of an advanced Orbital Transfer Vehicle (OTV). The work was conducted byPratt & Whitney (P&W) Government Engine Business (GEB) for the National Aeronautics andSpaec Administration-Lewis Research Center (NASA-LaRC) under contract NA83-23858 TaskC.I, with Mr. John M. Kazaroff as Task Order Manager,
Included as Appendix C of this report is a material variation study previously issued asP&W report FR-19440.1.
A .... ..........................
1 4

CONTENTS
Section Page
I INTRODUCTION ..................................................................... 1
1 Background ............... ...... 12 Program Plan ................................................................. 6
II EXPERIMENTAL PROCEDURE ................................................ 11
1 Screening Effort ............................................................. 112 Powder Production .......................................................... 188 Powder Processing ........................................................... 194 Test and Characterization Methods .................................... 335 Evaluation Methods ......................................................... 37
III ALLOY SCREENING ..............................................................4 1 42
1 First.Iteration Screening Results ........................................ 482 Second.Iteration Screening Results ..................................... 59a Summary of Screening Results ........................................... 70
IV POWER METALLURGY ALLOYS AND NASA-Z .......................... 72
1 Alloy Selection ............................................................... 722 Atomization Results ......................................................... 74a Process and Evaluation of Powder Metallurgy (PM) Copper
A lloys ........................................................................... 834 Evaluation of NASA-Z .................................................... 1155 Discussion ..................................................................... 120
V ALLOY CHARACTERIZATION .................................................. 122
1 Results of Characterization Testing ..................................... 122
VI CONCLUSIONS ....................................................................... 132
APPENDIX A - THERMAL CONDUCTIVITY AND TENSILETEST RESULTS ............................................. 133
APPENDIX B - MISCELLANEOUS PROCESS STUDIES ............. 137
I Forging Trial of Powder Metallurgy Alloy ............................ 138II Production of NASA-Z Materials at Pratt & Whitney (P&W) . 138III MIT Materials ................................................................ 141
ii

CONTENTS (Continued)
Section page
APPENDIX C - NARLOY-ZT BASELINE .......... ................. 148
C.A INTRODUCTION ...................................................... 4..... 160C.2 ANALYSIS .................................................................... 161
C.2.A Marc Analysis ..................................................... 151C.2.2 Configuration ...................................................... 152C.2.C Material Properties ........................................ ...... 158C.2.D Mission Cycle ...................................................... 157
CA8 RE•SULTS ..................................................................... 160
C.8.A Baseline Properties ................................................. 161C.8.B Young's Modulus ................................................. lee
C.3.C Coefficient of Thermal Expansion .......................... 166C.8.D Yield Stream ........................................................ 169C.83 Thermal Conductivity .................... . . . 169C,8., Creep Strain ....................................................... 172C.3.0 Estimated LCF Lives .................... 176CA3MH Liner Wall Deformation ................................... 179
C.4 CONCLUSIONS ............................................................. .180
APPENDIX D - REFERENCES ................................................ 181
Wi
ILLUSTRATIONS
ft,• Ppae
1 XLR 129 Chamber With Passages Machined .................................. 2
2 XLR 129 Chamber After Electroforming and Machining ................... 2
3 Channel Wall Thinning ..... .................................................. ..... . 4
4 Microstructures in NASA.Z Test Chamber ................. 5
5 Program Logic ....................................... 9
6 Screening Flow Chart: Alloys CB-1 Through CB-25 and CB-34Through CB-37 ......................................................................... 14
7 Screening Flow Chart: Alloys CB-43 through CB-107, CB.109 throughCB.120, CB-125, CB.126, and CB.138 through CB.144 ... ......... 15
8 Screening Flow Chart: CB.108, CB-121 through CB-124, and CB.127through CB -137 ....................... 6. . I. I. . *... 6. ... .. .. .. ... . .. .. .. .. .. .. .. .. ...... .. 16
9 P&W Arc Button Melter ............................................................ 17
10 P&W Florida ME&T Melt Spin Rig .......................................... 20
11 P&W RSR Atomizer .................................................................. 24
12 P&W RSR Atomizer .................................................................. 25
13 P&W Extrusion Can Assembly .................................................... 26
14 P&W Powder Outgasser ............................................................. 27
15 P&W Extrusion Press ............................................................... . 28
16 Powder Processing Flow Chart: Alloys 993 Through 999 (SmallE xtru sions) .............................................................................. 30
17 Powder Processing Flow Chart: Alloys 993 Through 999 (LargeExtrusions) ...... ............................................... ...................... 30
18 Powder Processing Flow Chart: Alloys 1032 Through 1043 (SmallExtrusions) ............................................................................. . 31
19 Powder Processing Flow Chart: Alloys 1032 Through 1043 (LargeExtrusions) ............................................................................. 31
20 Tensile Specimens (Dimeasions in mm, ExcepL Ti reads) .......... 3A
21 High-Pressure LCF Test Rig ...................................................... 38
iv

ILLUSTRATIONS (Continued)
Figure Page
22 Collared LCF Specimens (Dimensions in mm, Except Threads) .......... 39
23 Microstructural Refinement Resulting From Electron-Beam Processingof CU-1.3%IHF (CB-35): Optical ................................................... 44
24 Microstructural Refinement in CU-1%Zr (CB-7) by Electron-BeamProcessing (Optical) ..... .6660............ .. . .............................. .. .. 45
25 Precipitates and Primary Dispersions in Electron-Beam-Processed +Cold-Worked + Overaged CU-1.0%Zr (CB-7) Alloy (TEM Replica) 45
26 Dispersions or Precipitates in Electron-Beam + Cold-Worked +Annealed Cu-l.0%Cr (CB-23): TEM Replica ................................... 47
27 Discontinuous Precipitation in a Cu-5%Ag Alloy (CB-3, Solutioned +A ged)-. SBM ............................................................................. 48
28 Microstruoture of Electron-Beam Pass in Cu-3.0%Ag-0.5%Zr Alloy(CB.4): Optical .......................................................................... 63
29 Precipitates and Dispersions in CuA3.0%Ag.0.•%,•r After Electron-BeamProcessing + Cold-Working + Annealing (CB-4): TEM Replica .......... 54
30 Microstructure of Electron-Beam Pass in Cu-0.SZr.l.0%Cr Alloy(CB-22): Optical ............... .............................. . ........ 56
31 Dispersions in Cu.l.0%Cr-0.5%Zr (CB-22) After Electron-Beam + Cold-Work + Anneal Processing: TEM Replica ...................................... B5
32 Effect of Electron-Beam Solidification on Microstructure of Cu-0.8%Zr-1.3%Hf Alloy (CB.37): Optical ..................................................... 58
33 Borides (Center) and Cu.Zr Intermetallic Phase Formed in CB-17 ArcCasting (Optical) ....................................................................... 59
34 Fine and Coarse Borides in Electron-Beam Puses ........................... 60
36 Presence of Very Coarse Bordies in Representative Cu-Zr-B (CB-26)M elt-Spun Ribbon ....................................... ............................. 61
36 Precipitate Coalescence in Cu-Y-Cr Alloy (CB-76) Electron-Beam PassAfter Cold Working + Annealing (Optical) ..................................... 65
37 Backscatter Electron Image (SEM) Showing Possible Fine Oxides inCu-Zr (Alloy 995) Powder ...................................................... 75
38 Size Analysis of Collected Powder (Runs 993 Through 999) ............. 76
39 Size Analyses of Collected Powder (Runs 1032 Through 1042) ........... 77
v

ILLUSTRATIONS (Continued)
Fpig Page
40 Structure of .80 Mesh Alloy 992 Powder (Cu-.1,%Zr-0.3%B) Showing
Borides at 1000X (Right) ..... ..... ........ ............................... 79
41 Structure of .80 Mesh Alloy 993 Powder (Cu-1,1%HF) ..................... 80
42 Structure of .R Mesh Alloy 995 Powder (Cu.0.6%Zr) ...................... 81
48 Structure of .80 Mesh Alloy 996 Powder (Cu-0.5%Zr-3.0%Ag) ............ 82
44 Structure of -80 Mesh Alloy 1035 Powder (Cu-l.0%Cr-0.6%Zr) .......... 83
45 Microstructures of Extruded and Cold-Swaged + Annealed Alloy 993 ... 86
46 Solution-Treated Alloy 993 .......................................................... 87
47 Electron Micrographs (TEM-Foil) Showing Dispersions in Alloy 993 ... 88
48 Microstructures In Solutioned + Cold-Worked + Aged Alloy 993(SCWA.211) Tensile Tested at 705'C (1300'F) ............................... 90
49 Electron Micrograph of Alloy 993 (SCWA.211) Tensile Tested at 705"C(1300oF)Note Rod.Like Precipitates ...................... 91
s0 Miorostructure of Alloy 993 Processed to Increase Grain Size
51 Microstructures of Processed Alloy 995 .......................................... 94
52 Microstructures of Solution-Treated and Processed Alloy 995 ............. 95
53 Electron Mlcrostructures of Alloy 995 (Cu-0.6Zr), as Extruded(T E M .Foil) ....................................................................... ...... 95
54 Microstructures in Solutioned + Cold-Worked + Aged Alloy 995
(SCWA.211) Tensile Tested at 708'C (1800'P) .......................... 97
85 Microstructures of Processed Alloy 996 ................. ... . .... 96
66 Microstructure of Processed Alloy 996, Showing Abnormal GrainGrowth Upon Solution Treatment ................................................ 99
57 Electron Micrographs (TEM.Foil) of As-Extruded Alloy 996 .............. 100
58 Microstructures of Solutloned + Aged Alloy 999 (SA) Tensile Tested at750"C (13008F) ................................... ................ ........ ....... 101
59 Mlcrostructures of Alloy 999 Processed to Increase Grain Size ........... 102
vi

ILLUSTRATIONS (Continued)
Figure Page
80 Microstructures, in Coarsened, Solutioned + Aged Alloy 999 (HWSA)Tensile Tested at 705*C (1300'F). Note the Recrystallization in theGags Region ........... . . .................................... 103
e1 Microstructures of Processed Alloy 1032 ...................................... 104
62 Mlcrostructures of Processed Alloy 1033 ........................................ 108
63 Microstructures of Processed Alloy 1033, After Solution Treatment ..... 109
64 Microstructures of Processed Alloy 1035 ........................................ 110
65 Microitructures of Processed Alloy 1036 ........................................ 111
68 Microstructures of Processed Alloy 1038 .................... 1..... ......... 112
67 Mlcrostructures of Tenille-Tested Alloy 1038 .................................. 113
68 Microstructures of Processed Alloy 1042 .. .............. 116
69 Mlcrostructures of Processed Alloy 1043 ........................................ 117
70 Mlcrostructures of NASA-Z ........................................... ........... 118
71 Mlcrostructures in NASA-Z Tensile Specimen Tested at 705'C (1300F) 119
72 Thermal Conductivitles of Copper Alloys Annealed at 7050C (1300"F)for 1 Hour Prior to Test ........................................................... 124
73 High.Stress Creep Results at 705'C (1300F) for NASA.Z and Alloy995 (Loaded at i - 0,1/Second) ..................................................... 125
74 Strain Control Fatigue Testing of RSR Copper in Argon, UsingCollared Strain Control Specimen, 210 kPa Argon Environment at705*C (1300"F); Mean Strain - 0, Cyclic Frequency - 0.5 Hz ........... 127
75 Inelastic Strain at NF/2 Versus Cycles to Failure for Copper Alloys(Various Cycles; True Inelastic Strain) ......................................... 128
76 Deformation Characteristics of RSR 993, RSR 45, and NASA-Z ....... 129
77a Cyclic Stress Range Effects on LCF Life (Cyclic Stress Ranges forLCF Test at A;t - 3.0%) ............................................................ 130
77b Cyclic Stress Range Effects on LCF Life (Cyclic Stress Ranges forLCF Testing at A .- 1.5%) ........................................................ 130
78 Hysteretic Energy Damage Function Versus Cycles to Failure forCopper Alloys (Various Cycles; True Inelastic Strain) ....................... 131
vii

iLLUSTRATIONS (Continued)
Figure page
79 Forged Pancake and Rolled Sheet Made From Hot-Compact~d Alloy997 Powder (Scale is 1 Inch) ...................................................... 139
80 Microstructure of Alloy 997 After Hot Compacting + Hot-Forging +Cold-Rolling + Annealing at 650'C (1200F) .................................. 140
81 NASA-Z Composition Pancake Cast + Hot.Forged at P&W (Scale is inInches) .................................................................................... 14D
82 Structure of Cu-HF-HFO2 Flake Alloy Supplied by MIT .................. 142
83 Microstructures of Processed MIT Cu.HF-HFO1 Flake Alloy, ShowingV oids ...................................................................................... 144
84 MIT Cu-HF-HFO9 Flake Alloy 705C (1300F) Compression TestSpecim en ................................................................................. 146
85 Electron Micrographs of Extruded + Hot-Swaged MIT Cu-HF-HFO9
Flake Alloy (TEM.Foil) .............................................................. 147
86 MARC 20-Node Isoparametric Brick Element ................................. 151
87 Combustion Chamber Configuration With Longitudinal Ripples OverCoolant Passages ....................................................................... 152
88 Section of Thrust Chamber for MARC Model ................................ 154
89 M ARC M odel ........... .. ... ................................. ..................... 155
90 MARC Model Boundary Constraints ............................................. 156
91 Thermal Response of Hot Spot vs Time ........................................ 157
92 Pressure Loads vs Time ............................................................. 159
93 Baseline Analysis: Peak Values and Locations ................................ 162
94 Baseline Analysis: Temperature Contour Plot ................................. 163
95 Baseline Analysis: Maximum Temperature vs Increment Number ........ 163
98 Baseline Analysis: Component Stresses vs Increment Number ............ 164
97 Baseline Analysis- Maximum Component Strains vs Increment Number 164
98 Baseline Analysis: Maximum Effective Strain vs Increment Number ... 166
99 Baseline Analysis: Deflected Shape Plot ........................................ 166
viii
ILLUSTRATiONS (Continued)
FLigure Page
100 Effective Strain vs Young's Modulus (E) ....................................... 167
101 Effective Strain vs Coefficient of Thermal Expansion (ui) ................ 168
102 Effective Strain vs Yield Stres (ay), Inside Surface Only ................. 170
103 Effective Strain vs Yield Stress (acy), Outside Surface Only ............... 171
104 Effective Strain vs Yield Strem (a,), Locations of Maximum Strain .... 172
105 Effective Strain vs Yield Strem (a.), Maximum Values Only ............. 173
106 Effective Strain vs Thermal Conductivity (k) .................................. 174
107 Total Effective Strain vs Creep Rate (e,) ....................................... 175
108 Low Cycle Fatigue Behavior of NARloy-Z and NASA-Z at 1000F. 179
109 Plastic Deformation of Liner Wall ................... ..................... 179
' ' I I I

TABLES
Tabl Page
1 Screening Alloy Systems and Expected Strengthening Phases ............. 10
2 Screening Alloys ...................................................................... 12
3 Melt Spinning Parameters ...................................................... . 21
4 Atomization Melts ..................................................................... 21
5 Selected Atomization Parameters ................................................. 22
6 Atomization Parameters (Metal Temperatures) ................................ 23
7 Melt Stock Used in Powder Making ...................... 23
8 Vacuum Melting Parameters ................................. 23
9 Copper Alloy Extrusion Conditions .............................................. 29
10 Processing Schedules for Test Materials ........................................ 32
11 Test Applications/Tests Performed .......................................... .. 34
12 Low.Cycle Fatigue Tests Performed ......... * *. .. . .......... ............ 40
13 Hardnesses of Screening Alloys (DPH Hardness) ... ......... ... ...... 49
14 Low.Mismatch Phases Added to Copper Alloys (33) ......................... 68
16 Precipitates in Some Screening Alloys .......................................... 69
16 Atomization Results .................................................................. 73
17 Chemical Analyses of Alloys ....................................................... 78
18 Powder Contamination ............................................................... 78
19 Diamond Pyramid Hardnesses of Processed PM Alloys ..................... 84
20 Averaged Tensile Properties at 705C (1300'F)" ............................. 89
21 Alloy Characterization Tensile Properties (Averaged) ........................ 125
22 Copper Strain Control Test Results .............................................. 127
23 Thermal Conductivity Results ...................................................... 134
24 Tensile Test Results .................................................................. 135
25 Yield Strengths of MIT-5, NASA-Z, and Alloy 995 at 705*C (13001F) 145
L=x

TABLES (Continued)
Table POe
26 Material Property Variations of Copper Base Alloys ........................ 156
27 Summary of Effective Strains and Strain Ranges for Variations inM aterial Properties .................................................................... 160
28 MARC Increment No, vs Mission Time for the Baseline Analysis ...... 166
29 Effect of Yield Stress on Creep Strain ............ ....... 176
30 Estimated LCF Lives Based on Effective Strain Range of MaterialProperty Variations ................................................................... 177
xi

SUMMARY
This report covers work performed at Pratt & Whitney (P&W) on development of copper.based materials for long-life, reuseable, regeneratively cooled rocket engine thrust chambers. Thework was performed to support development of a P&W expander cycle liquid hydrogen/liquidoxygen-fueled rocket engine for orbital transfer vehicle propulsion. The engine had a planned lifeof 300 cycles, so with safety factors, the thrust chamber material needed a life capabilit'v of 1200cycles, which is greater than the life capabilities of either NASA-Z or Amzirc up similarconditions.
The program approached the goal of enhanced cyclic life through the application of rapidsolidification to alloy development. Rapid solidification was used to introduce fine dispersions ofstable compounds that would strengthen and stabilize the alloys at elevated temperatures. Suchcompounds included copper-base intermetallics, copper-free high.temperature intermetallics,borides, and ellicides. Rapid solidification also allowed the refinement and control of microstruc-tures.
Candidate alloy systems were screened in subscale by the use of small arc-cast ingots.Electron beam passes were made on these ingots to produce small subscale samples of rapidlysolidified material for evaluation.
Copper alloys based on additions of chromium, cobalt, hafnium, silver, titanium, andzirconium, in various combinations, showed the most promise in the screening effort and wereprocessed by rapid solidification in bulk quantities. Promising alloy compositions were atomizedin the P&W rapid solidification rate (RSR) device to produce rapidly solidified powder. Thesepowders were consolidated to bar stock, which was further processed and evaluated. Those alloysand conditions that exhibited the best phase stabilities and softening resistances were tensiletested at elevated temperature. Those alloys with favorable tensile properties were furthercharacterized by additional tensile testing, thermal conductivity testing, and elevated-tempera-ture, low-cycle fatigue (LCF) testing.
The characterization effort indicated that, of the alloys studied, rapid-solidification-processed Cu-1.1%Hf exhibited the greatest potential as an improved-life thrust chambermaterial. This alloy exhibited LCF life about four times that of NASA-Z at 705'C (1300"F). Thealloy exhibited higher elevated-temperature tensile strengths and slightly lower thermalconductivities than NASA-Z.
Other alloys exhibited promise for use in this application. They were rapid-solidification-processed Cu-0.6%Zr and Cu-0.6%Zr-1.0%Cr. The former alloy exhibited higher thermalconductivities and LCF life than NASA-Z, but slightly lower tensile strengths, The latter alloyexhibited very high tensile strengths and thermal conductivities comparable to those of NASA.Z,but low LCF life. It seemed apparent that further work with these systems might allow thedevelopment of another well-balanced system superior to NASA-Z, providing material options inaddition to the copper-hafnium alloy noted above.
xii
SECTION IINTRODUCTION
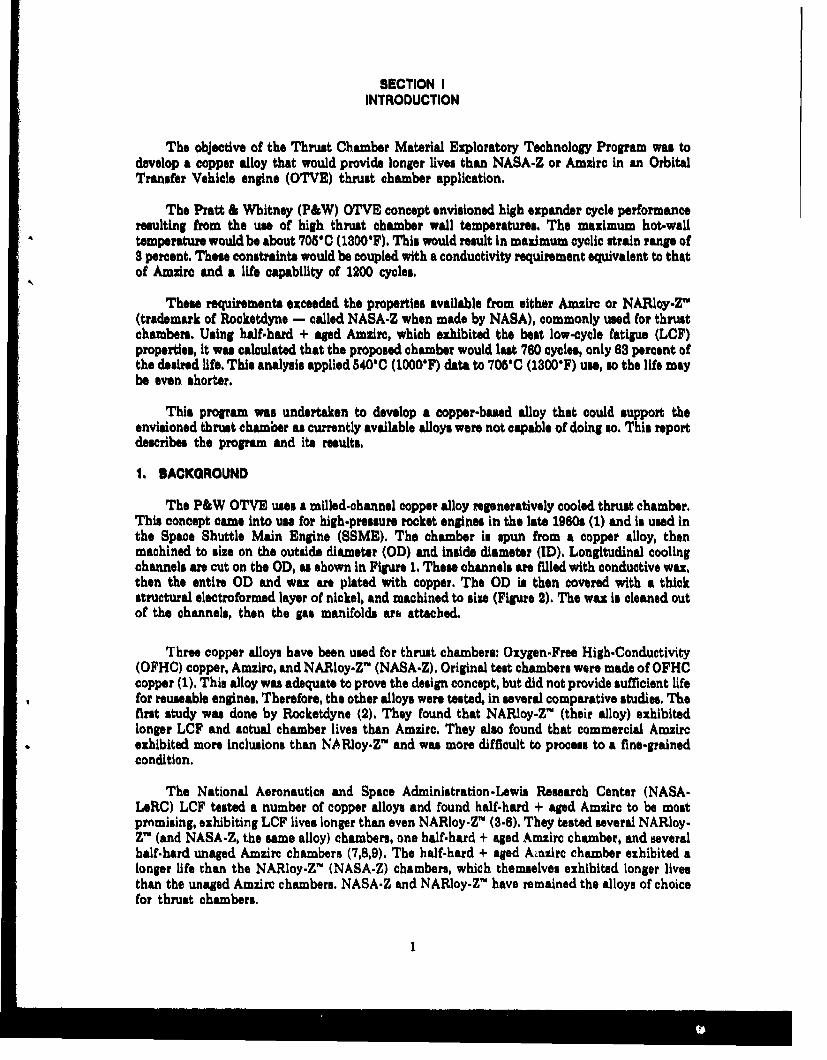
The objective of the Thrust Chamber Material Exploratory Technology Program was todevelop a copper alloy that would provide longer lives than NASA-Z or Amzirc in an OrbitalTransfer Vehicle engine (OTVE) thrust chamber application.
The Pratt & Whitney (P&W) OTVE concept envisioned high expander cycle performanceresulting from the use of high thrust chamber wall temperatures. The maximum hot-walntemperature would be about 705'C (1300'F). This would result in maximum cyclic strain range of3 percent. These constraints would be coupled with a conductivity requirement equivalent to thatof Amzirc and a life capability of 1200 cycles.
These requirements exceeded the properties available from either Amzirc or NARIoy-Z'(trademark of Rocketdyne - called NASA-Z when made by NASA), commonly used for thrustchambers. Using half-hard + aged Amzirc, which exhibited the best low-cycle fatigue (LCF)properties, it was calculated that the proposed chamber would last 760 cycles, only 63 percent ofthe desired life. This analysis applied 5401C (1000F) data to 705'C (1300F) use, so the life maybe even shorter.
This program was undertaken to develop a copper-based alloy that could support theenvisioned thrust chamber as currently available alloys were not capable of doing so. This reportdescribes the program and its results.
1. BACKGROUND
The P&W OTVE uses a milled-channel copper alloy regeneratively cooled thrust chamber.This concept came into use for high-pressure rocket engines in the late 1960s (1) and is used inthe Space Shuttle Main Engine (SSME). The chamber in spun from a copper alloy, thenmachined to size on the outside diameter (OD) and inside diameter (ID), Longitudinal coolingchannels are cut on the OD, as shown In Figure 1. These channels are filled with conductive wax,then the entire OD and wax are plated with copper. The OD is then covered with a thickstructural electroformed layer of nickel, and machined to size (Figure 2). The wax is cleaned outof the channels, then the gas manifolds are attached.
Three copper alloys have been used for thrust chambers: Oxygen-Free High-Conductivity(OFHC) copper, Amzirc, and NARIoy-Z" (NASA-Z). Original test chambers were made of OFHCcopper (1). This alloy was adequate to prove the design concept, but did not provide sufficient lifefor reuseable engines. Therefore, the other alloys were tested, in several comparative studies. Thefirst study was done by Rocketdyne (2). They found that NARloy-Z" (their alloy) exhibitedlonger LCF and actual chamber lives than Amzirc. They also found that commercial Amzircexhibited more Inclusions than NARloy-Z' and was more difficult to process to a fine-grainedcondition.
The National Aeronautics and Space Administration-Lewis Research Center (NASA-[ARC) LCF tested a number of copper alloys and found half-hard + aged Amzirc to be mostprnmising, exhibiting LCF lives longer than even NARIoy-Z' (3-6). They tested several NARIoy-Z" (and NASA-Z, the same alloy) chambers, one half-hard + aged Amzirc chamber, and severalhalf-hard unaged Amzirc chambers (7,8,9). The half-hard + aged Amzirc chamber exhibited alonger life than the NARloy-Z' (NASA-Z) chambers, which themselves exhibited longer livesthan the unaged Amzirc chambers. NASA-Z and NARloy-Z' have remained the alloys of choicefor thrust chambers.
SI I I 1 1 1 1 M ,,

Figure 1. XLR 129 Chamber With Pasaages Machined
Figure 2. XLR 129 Chamber After Electroforming and Machining
P&W has made one regenerative copper alloy chamber, of Amzirc, and tested it in theXLR-129 engine (10). Tested 16 cycles, the chamber performed well, but failed at grossmachining defects.
2
Copper alloy thrust chambers have been found to degrade or fail by four mechanisms:orange peel surface roughening, blanching, cracking at inclusions, and channel wall thinning.
Orange peel roughening was observed in Rocketdyne and NASA chamber tests (2,8). Suchphenomena are commonly a result of the deformation of large-grain-size metals, as was the casein thoe teats.
Blanching is a surface degradation condition which has been described in numerous studiesof failed NARloy-r chambers (9). It usually occurs at hot spots on the chamber walls, andusually precedes channel wall thinning and failure. Descriptions of the phenomena are unclear.Suitable explanations have not been advanced. Rockstdyne has published report& that explainthe. phenomenon as a result of cyclic oxidation/reduction of the chamber surface (11,12).
Cracking at inclusions have been observed in both Rocketdyne and NASA tests (2,7,9).These ane asmociated with either zirconia or copper-zirconium intermetallic inclusions. Littleyielding of the surrounding matrix is observed at these failures.
The most troublesome, common, and insidious failure mechanism for copper alloy thrustchambers is channel wall thinning and rupture. First documented by NASA (7,8,9), this Ischaracterized by the gradual deformation of the channel wall profile from the as-machinedrectangle, Figure 8a, to a dog-house profile, Figure 8b, to a dog-house shape with a thinned wall,Figure Be, and finally to rupture, Figure 8d. Although initial examinations of failures give theImpression that the wall has thinned and lost material, carefal measurement has revealed that nomaterial has been lost (9,12,18). Instead, material has migrated from the mid-channel wall to theweb region. In every case, this failure occurs at injector hot spots on the chamber (9).
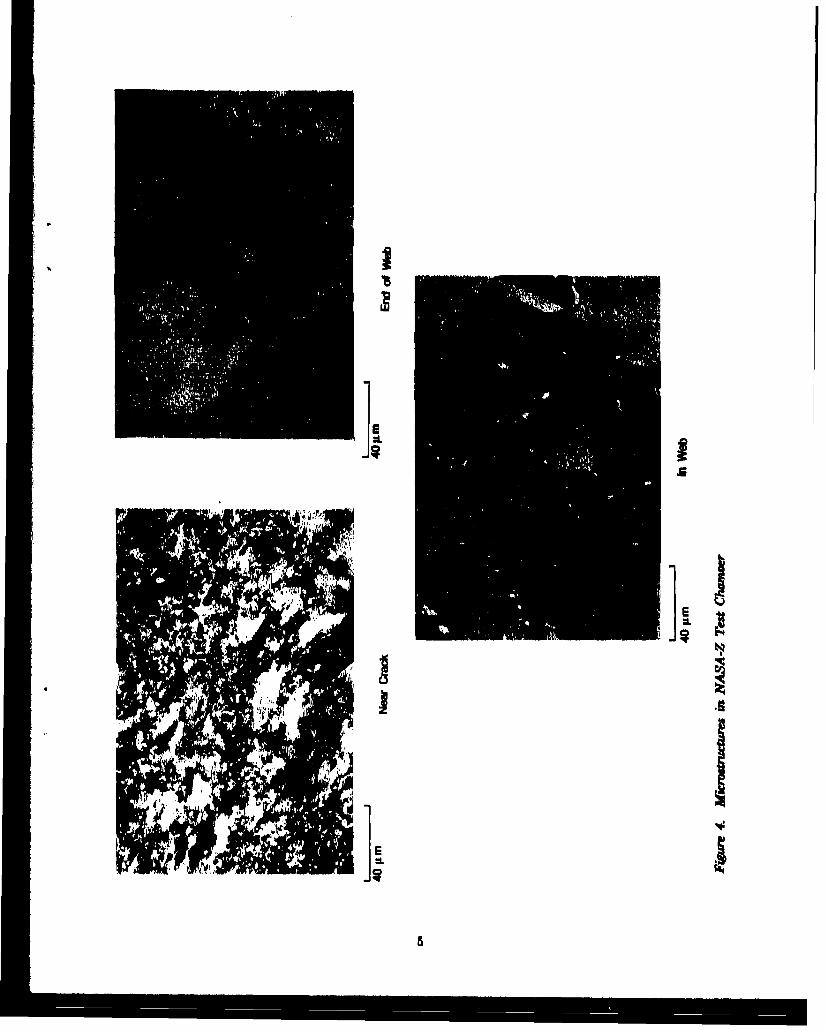
Thinning and failure are accompanied by significant changts in microstructmm (presentwork and 8). For NASA-Z, thinning is accompanied by recrystallization, as shown in Figure 4.Grains in the web are unaffected. Moving outward along the web, pains near the web/walljuncture experience some recrystallization, primarily along pain boundaries. At mid-span, themicrostructure Is completely recrystallized and reworked, with grain sizes of 20 um, and isbeginning to recrystallize again. Microhardness has not been found to vary significantly throughsuch a region in NASA-Z (8,9). However, this could be rationalized by the hardening effect of thesilver in the alloy.
Samples of thinning in Amzirc were not available. This is unfortunate since, as will later bediscussed, the silver-fe copper-zirconium alloys do not appear to be as susceptible as NASA.Zto rocrystallization - presumably due to the lower work-hardening rate produced by the absenceof dissolved silver. Hardness losses were observed in the thinned areas of half hard + agedAmsirc chambers (9), however, indicating that recrystaflization may occur also with that alloy.
The structural failure mechanism producing wall thinning and failure has been the subjectof much study and controversy (2,7,8,9,12,13), Several names have been applied to themechanisms: creep ratcheting, cyclic creep, low-cycle fatigue, thermal fatigue, and cyclic yielding.Several studies have been presented to account for the phenomenon. The most complete to datehas been one by Rocketdyne (13) that seems to predict the observed changes in wall geometrythrough a series of chamber firng. This study finds that when an SSME chamber segment isoperated at its design temperature of 540'C to 595'C (1000'F to 1100'F), no channel deformationshould occur, which has been found in practice to be the case. However, when injector hot spotsof up to 815"C (15007) are studied (here they believe creep to be a factor), the model predicts theobserved channel wall deformation and thinning. As the wall thins, the biaxial ductility of thematerial is exhauted and the wall fails.
I

as
I I9"
4
III II iiI -'Id
cij
4
'8
Ii
IA
I
II
5
Added to thin model is the belief by investigators at NASA-LeRI that the softer local hotspots absorb the circumferential strains of the remainder of the chamber (9). This proess couldincrease cyclic strains in the hot spot region to a level of about 10 percent, which is far above anydesign allowances.
L. PROGRAM PLAN
The goal of this program was to develop a copper alloy that would allow the use of theenvisioned P&W OTVE thrust chamber within the envisioned operating parameters. This wasbelieved to require enhancement of low cycle fatigue/thermal mechanical fatigue (LCP/TMF)capability, strength, and probably creep resistance. In addition, a thermal and structural analysiswas performed to identify more-detailed property requirements, determine allowable propertytradeoffs, and define specfO mochanical testing parametesl.
The alloy development effort encompassed several complemontary approaches. Lifecapability improvements were attempted through the study of stable strengthening precipitates(solutionable), the introduction of stable strengthening dispersions through rapid solidification,and the reduction of segregation and defect, through the Use of rapidly molidified powdermetallurgy. Life capability improvements were also sought through the use of ozide dispersionstrengthening in work done under a subcontract to Professor N. Grant at the MmasachusettaInstitute of Technology (MIT). Retention of high thermal conductivity was to be attainedthrough the use of low.solubility alloying additions.
The program wa structured into the following tasks and subtasks.
Task 1:
1.1 Literature Survey and MIT Subcontract
A survey of the available literature was performed to gather backgroundinformation on previous copper thrust chamber work and high-conductivitycopper alloy development, Some candidate alloy systems were chosen basedon this prior work. The results of the literature survey were presented asP&W FR.18383.1 (14).
A subcontract was Issued to Prof. N. Grant of MIT to study various oxide.dispersion-strengthened copper alloy systems for possible use in thrustchambers.
1.2 Structural Analysis
Thermal and structural analyses were performed on the OTVE thrustchamber design to establish allowable tradeoffs between material proper.ties and to identify pioerty requirements. Results are presented in Appendix C.
1.8 Alloy Screanir.i
Subocale laboratory alloy screeninj was performed to allow evaluation ofcandidate alloy systems prior to selection of alloys for atomization topowder, consolidation, -nd testing, Screening alloys were melted and castinto small buttons, worked, heat treated, annealed, and evaluated forsoftening resistance and microstructural stability. To assess the applicabili-ty of the alloys to rapid solidification, screening alloys were resolidifled bynarrow electron-beam passes, which remelted the alloys and allowed them
6
to solidify at a high rate, being quenched by the substrate. The electron-beam passes and substrates were subjected to cold rolling and anneals toallow assessment of the stabilities of the rapid soidification structures.Finally, rapidly solidified melt-spun ribbons were made of selected copper-metal-boride alloys to allow assessment of the processbility of such alloys.
TaskZ
2.1 Power Production
Alloys selected for atomization to powder for further evaluation and testingwere malted and atomized in a P&W 7-foot-diameter rotary powderatomization device,
2.2 Powder Processing and Evaluation
Powder alloys were consolidated by extrusion to bar stock and subjected tothermomechanical processing to allow evaluation of microstructural stabili.ty and softening resistance, and to provide bar stock for teat specimens.Preliminary tensile testa were conducted to allow selection of alloys forproperty characterization.
Task 8:
8.1 Characterization
The most promising powder metal (PM) alloys were characterized byelevated temperature, tensile, creep, LCF/TMF, and thermal conductivitytesting, Testing was conducted at conditions believed to adequately matchthose fbund in actual thrust chamber use.
The work was performed iteratively, with results of the screening efforts and PM alloyevaluations being used to guide further screening alloy and PM alloy selections. The logic stepsanr shown in Figure 5,
Two general iterations were made, resulting in two batches of powder alloys.
Screening alloy systems were chosen on the basis of the literature survey and previousexperience at P&W on other alloy systems. Several types of alloy systems were chosen.
One system consisted of alloys that could be expected to form precipitates or dispersions,based on the alloy addition's solubility in solid copper. These included precipitation hardeningsystems found in the literature survey. These systems were also screened as dspersion systemsby increasing the alloy content above the solid solubility limit and using rapid solidification tofinely disperse the excess primary solidification precipitates. Being above the solid solubilitylimit, these dispersions could never be completely dissolved; if dimensionally stable, they couldat as effective hardeners.
Another type of screening alloy system investigated encompassed additions that might formcompounds so stable at high temperature (high melting point or free energy of formation) that ifdispersed effectively In copper, they should remain well dispersed at high temperatures andstabilize the microstructure. These systems were comprised of boeides, ailicides, and high.temperature Intermetallic compounds.
7
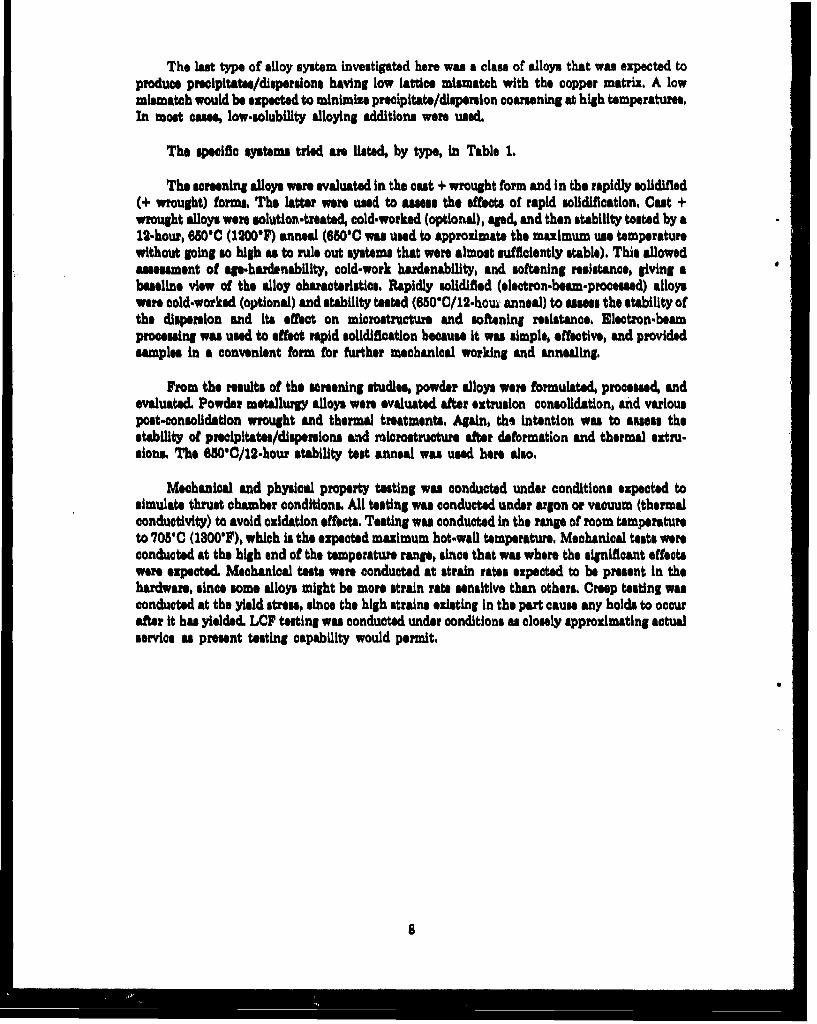
The last type of alloy system investigated here was a class of alloys that was expected toproduce precipitatea/digpersions having low lattice mismatch with the copper matrix. A lowmismatch would be expected to minimize precipltate/dlsperslon coarsening at high temperatures,In most cases, low-solubility alloying additions were used.
The specific systems tried are listed, by type, in Table 1.
The screening alloys were evaluated in the cast + wrought form and In the rapidly solidified(+ wrought) forms. The latter were used to assess the effects of rapid solidification, Cast +wrought alloys wore solution-treated, cold-worked (optional), aged, and then stability tooted by a12-hour, 650'C (1200F) anneal (680'C was used to approximate the maximum use temperaturewithout going so high as to rule out systems that were almost sufficiently stable). This allowedasseument of age-hardenability, cold-work hardenability, and softening resistance, giving abaseline view of the alloy characteristics. Rapidly solidified (electron-beam-processed) alloyswere cold-worked (optional) and stability tested (650"C/12-houw anneal) to assess the stability ofthe dispersion and Its effect on microstructure and softening resistance. Electron-beamprocessing was used to effect rapid solidification because it was simple, effective, and providedsamples in a convenient form for further mechanical working and annealing.
From the results of the screening studies, powder alloys were formulated, processed, andevaluated. Powder metallurgy alloys were evaluated after extrusion consolidation, and variouspost-consolidation wrought and thermal treatments. Again, the intention was to assess thestability of precipitates/dispersions and microstructure after deformation and thermal extru.sions. The 6S0C/12-hour stability test anneal was used here also.
Mechanical and physical property testing was conducted under conditions expected tosimulate thrust chamber conditionst All testing was conducted under argon or vacuum (thermalconductivity) to avoid oxidation effects. Testing was conducted in the range of room temperatureto 705'C (1800F), which is the expected maximum hot-wall temperature, Mechanical tests wereconducted at the high end of the temperature range, since that was where the significant effectswere expected. Mechanical taste were conducted at strain rates expected to be present In thehardware, since some alloys might be more strain rate sensitive than others, Creep testing wasconducted at the yield stress, since the high strains existing in the part cause any holds to occurafter It has yielded. LCF testing was conducted under conditions as closely approximating actualservice as present testing capability would permit.

Uteratum Related
Survoy Expersfc
sawec Scminhgj Feedback
ProoI and EvaluateScreeing MA"
rSelect and DAtomize FindbackPowderr Alloys j
IProsee and Evaluate ReutPowder Allys
Powder Alloy
Seec A"cy,
Fkmur 5. Program Look
SI
II

TABLE 1. - SCREENING ALLOY SYSTEMS AND EXPECTEDSTRENGTHENING PHASES
Cowsu,~ioroaL Soet@= Kish-Tenwe~obare DyamkmonCU-Zf (Culr) Bond.. (1.1 at%)Cu-Cr (Cr)Cu-Ag (A4 CU-Zr-B (ZzD,)Cu-Hf (CusHf) Cu-Hf-B WH80,Cu-Nb (Nb) Cu-TIl-B MalE)Cu-V (V) Cu-mm-B (MMNI)Cu-MM (cuMM) Cu-y-B (YB6)Cu-V (CY) Cu-V-B (VE,Cu-Mo (mo) Cu-Cr-s (Cr3,)Cu-Zr-Cr (Cu~Zr, Cr) Cu-Nb-B (NW6,)Cu-Zr Ag (Cu.Zr, A#) Cu-Mo.B (MOD)Cu-Zr-Hf (cuZr, CUSH* Cu-Al-B (AlIR.)CU-Zr-Nb (Cugir, Nb) Cu-sI-B (SIR)Cu-Zr-V (Co.zr, V) Cu-Ni-B (NiB,)Cu-Zr-MM (CZt, CulMM) Cu-Fe-fl (FOB)Ca zi-V (CaZxl NYV) Cu-Co-B (COIS)
CuZ-o(culza, Mo) ci-Zr.B.Ag (ErRl)Cu-Zr-Ti (Cuglr, CU1TI) Ou-TI-B-Ag (TIE,)Cu-Zr-or-Ag (CugZr, Cr, As) Cu-MM-B-Ag (mm%)Cu-Cr-TI (Cr, CUMT) Cu-TI-Cro (TIE,, Cr)Cu-Cr-V (Cr, NY.)Cu-Cr-MM (Cr, CugbmM sBWkid~ (a ax~)COOCN- (Cf, V)Cu-Cr-Nb (Cr, Nb) Cu-Nb-SI (NbSI,)Cu-Cf-Hf (Cr, Cu.Hf) Cu-Cr-SI 0180SCu-Cr-Ag (Cr, Ag) Cu-Hf-SI (11,81)Cu-Cr-Hf-Ag (Cr, CuH, As) Cu-TI-SI (TIsi,)Cu Hf-Ag (CUHf. A#) Cu-Zr-si WINS1,Cu-TIf-Ag (CuTi, Ag) ou-Y-Sl (YSI,)Cu-TI-Hf (CuTI, CuSHI)
Lo.wMkematch Compowrd., (miq% (a aL% IntermatalUa (M aL%)Cu-Hf-Fe (Hifet)
Cu-Cr-re (Cr w/Fe, <2.2%**) Cu-Hf-Mn (HfMng)Cu-Cr-Co (Cr W/Vo, <~2.2%,1) Cu-Hf-NI (HfNI,)C%%-Al-NI W44AI 1.1%) Cu-Hf-Co (HMo)Cu.Zr-Al (ZrsN, 21%) Cu-Fe-71 (FTIM)Cu-Co-V (CoV, 1.5% Cu-Fe-Nb (FeNb)Cu-NI-SI (NISSI, 8.0%) Cu-Fe-Zr (FUZ)Cu-Ag- (AlY, 0.1%) Cu-NI-Zr (NIzr)Cu Cr-Hf (Crewf, 2.%6) Cu-TI-Ai (TI1 Ai)Cu-Fea-V (FeY, 1.7%4)Cu-OON (CotY, 0.1%)
aM weainhmetal* BaOW on as copper lattice (Sa.7.IA)
Kuwdjeov-Sacha. alons Cu -c110> end Cr <111>
10

SECTION IIEXPERIMENTAL PROCEDURE
1. SCREENING EWPORT
Screening alloys having the compositions listed in Table 2 were melted, processed via theflowaheeta In Figures 6 through So and evaluated as described below.
a. S1crening Alloy Melting
Screening alloys were arc-melted under argon with a nonconsumable tungsten electrode Ina water-cooled copper hearth and cast in-situ, producing button cutings weighing 100 to 400grams. Are melting was performed in a device (Figure 9) that incorporated a 1200-amp powersupply. The procedure for arc melting was:
1. Charge hearth with elemental additions (C10100 copper wu used. Cu-15%Crand Cu.80%Zr master alloys were used in applicable alloys after CB.43).
2. Close device, pump down to 10 millitorr or less (by thermocouple gugp),backfill with Ar, pump down to 2 millitorr or less, backfill with Ar to 28 kPa(4 palg.)
3. Arc melt and mix with arc for 1 to 1-1/2 minutes, Let cool.
4. Open chamber, flip button, repeat steps 2 and S, remove button.
b. Screening Alloy Processing
Buttons were cut up and processed by conventional wrought processing and rapidsolidification processing according to Table 2 and the flow shoets in Figures $ - 8.
Conventional processing consisted of heat treatments and rolling. Solution and ap-heattreatments were performed in air-atmosphere electric furnaces. The 6501C (12001F) stability testanneals were performed in a vacuum furnace, operating at over 10-4 microns vacuum, andemploying a heatup rate of about 550"C/hr (1000F/hr) and a cooldown rate of about 330'C/hr(600'F/hr). Rolling wow accomplished on a 2-high rolling mill with 10-inch-diameter rolls. Soaksprior to hot rolling lasted about 30 minutes, and reheats about 5-10 minutes. Reductions per passwere about 20-25 percent for bot rolling, 10 percent for cold rolling. No intermediate annealswere used in cold rolling.
Rapidly solidified samples of screening alloys were prepared by traversing a 8mm (1/8-inch)thick slice of the cast or hot-rolled alloy with an electron beam. Several beam passes were madeon each alloy slice, spaced about 3mm (1/8-inch) apart. Beam pass parametars were: 100-kVbeam voltage, 10-mA beam current, and 90 inches/minute beam traverse speed. Part of thesample was cut off for as-solidified evaluation, another was out off for the 850'C stability test(optional: see flowcharts), and the remainder was clad in a piece of copper tube. This was cold-rolled (see flowcharts for reductions), and a portion of the cold-rolled sample was subjected to the650'C stability test.
11

TABLE 2. -SCREENING ALLOYS
Aim solutiomaudoe Cn omp *oe" nn m f BB
NO. so&% !F Pmess, Remarks08.1 Cu.1.OAg 790 145003.9 0u4OAj 7n0 145003.8 0u4$.OAg 790 148005.4 Cmu.0,8r.8OAg 925 1700 Vs NABA.Z oquivalnt034S C11.0.2, on5 1700 Amudre eqWUivnt03.6 00-.04br 095 1700 Vs03.7 Cu-.l21, 025 1700 V"03.16 Cu.03t4.5UAg 925 1700 NASA 1,1 eq~uivlnt33417 0u13-1.b.0. 925 1700 V. Zf3,03.-15 Cu4.IHf*0.3 025 1700 yet 113,05.19 Cu-.M0T.0,3B 925 1700 V. TLB,C2034 Chi-o.MM.o.B 570 1600 V" MmvtB03.91 ou0.,40r 925 170003.99 CU*1,OCf.0.8Zr 925 1700 V. Undimolve CrCu.m 0u.1.ocr 995 1700 V. Undlaaolvid Or03.94 Ca*0.220S.Al 92 1700013.95 COu.040r4.S.zr 925 170003.96 Or.0IZI.0,133 NA yes Znt03.97 Cu41.OfrO.138 NA Ves ZnB,.Zr0B.95 Cn~oA~.983ja NA yes Zr3,+3013.99 Ou.0.35T1-0.108 NA V. TiD,0B3.0 Ou.0J0'fl.0.163 NA Vs TiB,+T2103.81 Cu-.8,BTI.0.803 NA Vo Ti3,+R05.83 0u-00-V.0188 995 1700 Vs yfl,013.85 0u.0.fS-t0,163.1O4 995 1700 Vs ZnD,+~A103.84 CU.0.SW 995 170003485 CU-.L8Kt 695 1700 yesCam5 Cc-t.0,SHoj 925 170003.87 Cu4n.1,811.Sf 025 1700 V on03.48 Cu-1.OCn 1000 1880 Vet03.44 Cu0.0,Cr 1000 1o8003.45 (Cjj9I20 1000 183003.45 Cu.1.O0r.0.S8u ga5 1750 VsCB.47 Cu-0.4Cfr0.sk 985 1780 Vs013-45 Cu.0.4f0n.0.zr 985 1750 V.013.49 CU40,B 1040 190003.50 CU.0.9Zr*0.5Iw 055 1750 y"g0B341 C'jO.0,-r.05Hf 965 1750 yesC13-59 Cu.0.fbln.1.flf 955 1780 V.0B383 CU.0,7MM.0.93 845 185 Vo MMD,08.54 CU.017mm.0.48 645 1580 Vee MbmD
3.856 (U-1j.009B~j 570 110 Yak VS.013.57 Cu.0,6V.0.93 1080 10920 Vet VBI03859 cu-0601.0.93 1000 1830 V. crs,013.89 CU-.1.Nb.0.2B 1080 1990 Vo Nb3,03.G0 Cu.1.5Mo NA03.61 CU.1S5MOo.0.9 NA Vs MOBCB.62 CU-.0.AI-0JD 1080 1920 V. Awls~038-6 Cu.-0.4110.93 1000 1830 Vao SAD03.84 Cu.0i.2r0.I8 988 1780 Vs03.65 CU2.LOct*2.OZr 988 1780 V.08.66 CU-0.2Y 670 1600 V.03.67 CU-0.4V 570 1600 yes03.65 cu-1.OV 870 1600 V.
12

TABLE 2. - SCREENING ALLOYS (CONTINUED)
Aim SowutonButton conwptown Toingj~ XB
No. (wL% a? Proceas Rimapla03.69 Co-0.0M 845 L88o Yoe08.70 Co-L.OMM 8u5 188M Y"CD-71 Co-0.Shr-0.4Y 870 lo00 Ye08.79 Cu.0.S8r-1.OY 870 1600 YoeCB-78 can0.oAMM4w 845 1880 YoeCB-74 CU-0.uf-l.O1M 845 1880 YeC8.75 Cu.0.4Cr-0,4Y 870 1600 Ye03-76 Co.1.Or.1.oy 670 1600 Ye03-77 Cc-0.4Cr-0.4M8 845 1i80 Yoe083-76 Cu-1O0r*1IOMM 845 1580 YoeCB-79 Cu.0.4Ma 1080 1920 Ye013-60 0u4,.42t.OA4ma 98 1780 YeoCD-S1 Cu-1.IMb-0.88i 1000 1880 YeM3e CO-1.2Cf-0.281 1000 1880 Ye
03.88 Cu-.8JW-OASI 988 1750 Ye03.84 CUa-LOTI-0.88I 988 1750 yesC13-8 Co-1.7Zr0.48i 98b 1780 YeCD-SO 0'z-0.Y-0.681 870 1600 YeCB-87 ONAM 1040 1900 Yeca-." Cu-1SgNb 1040 1900 YeCB-01 Cuol.0Ct-10O4b 1000 1880 Ye0CB92 Cu-2.OCr-9ONb 10ow 180 Ye03-98 Cu-1.2V 1080 1990 Ye03-94 co-0.r48V 988 1780 Ye03-95 CWu-0.1rlOV 988 1780 YeCa-9O COAu-0.40.0V 1000 180 yes0B-97 CO-1,00r-1.OV 1000 1880 Yet08-98 Cu-OA40r-0.8Zr-1.OAg 988 1780 Ye03-99 Cu-OA0.40-.OAg 1000 1880 YuC8-100 Cu-0.M43BI-81.0Ag 988 1780 Ye TIB,+Aj08-101 cu-o.&MM-0,48-1OAj 845 1880 Ye MMD1+Ag03-100 Cu- ..OCv-0.7T1-0JD 988 1780 Ye TiBg+Cr03-104 CU4.ur-0.7N 988 1780 Ye08-106 Cu-0.Pr.-L8Nb 988 1780 yesCB-107 Co-2.2Pf.A-09 988 1750 ZftAICO-1OS Cu-1.1TI-0.2AI 988 1750 TWACD3-LOS Cu-1,40o.04V 1020 1870 yes CooVC19-110 Cu-1.4N1-0.28i 988 1780 NiSICR3-Ill ou-.6Amg-.4Y 870 1600 ASYCB-112 Cu-l.O~t-LOWf 988 1780 Cv1Hf08-118 cu-1.1le-1.Oy 870 1600 F%Y
* 03-114 Cul ~-i.c..Y 870 1600 C%Y03-118 Cu-1.4N1-0.2NI 1090 1870 NIA0M-11 0u-06GCr-8.OAI 1000 1880C13-117 Ou-0A -.31f4Og 940 172503-118 cu-0.6f0v.0.w 940 1798 Ye03.119 Cu-0.60-0.6Zr-8.OAS 940 172503-130 Cu-0.G0r-0.8Ht-8.OAM 940 1796CD-I21 Ou-0.Cv-.0.771 940 1736C13-132 Cu.-0*&-0.7TI 940 1738CO- 128 CU-0.8H-0.7T1 940 1738 yes03-194 Cu-1O0TI-8.OAa 900 1680C13-125 Cu-0.60r4.21e 1000 1880 (Cr1)
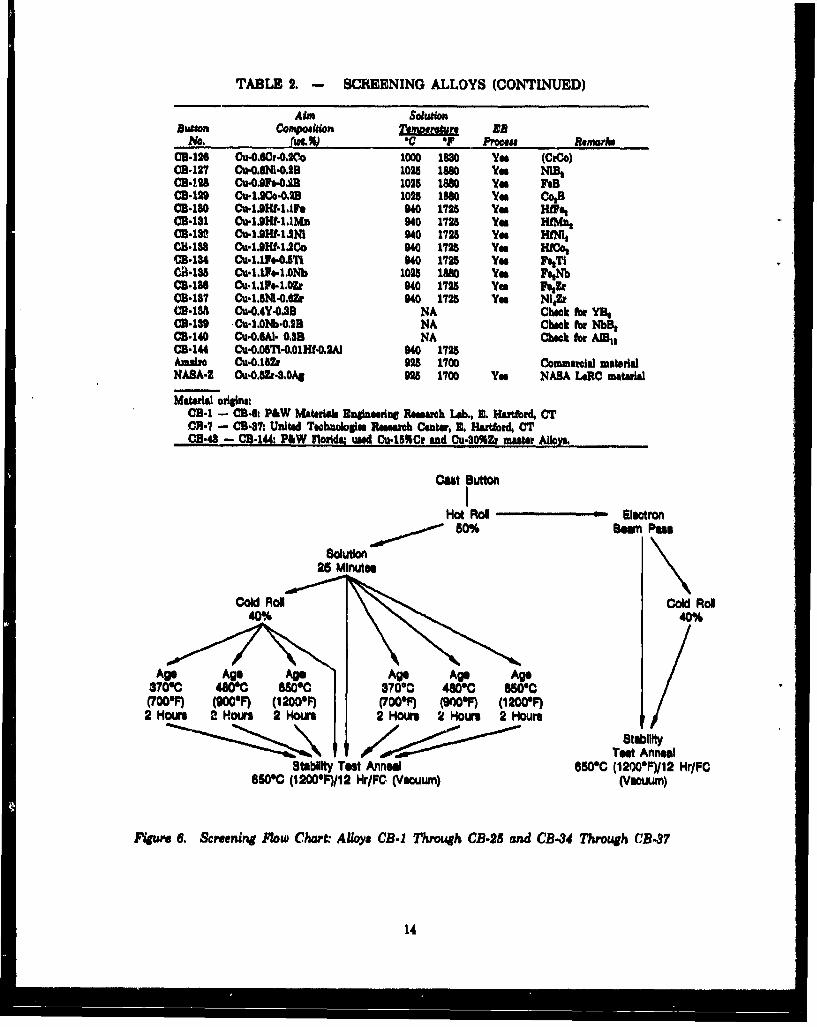
TABLE 2. - SCREENING ALLOYS (CONTINUED)
Aim SolutionBution Compoiution Tieom"zt JB
No. (wL%) C OF Proces Remara..-126 C0-0.Cfr.0.2co 1000 1830 y' (Cr¢o)
CB-127 Cu.0.ON6.0.2 1095 1880 y"I NIBMC0.129 Cu.0Ae".,2B 1025 1880 Yes FeBCB.129 Cu*1,9Co0.B 1025 1860 Ye CoBC0.180 Cu.lDHf.1.tLe 940 1728 Y" HifP
B-131 Cu.-lJHf-t.lMa 940 1728 y" HfMC11-12 Cu-LOHf.l,,NI 940 1728 ys HINI,C-.138 Cu.LHf.20Co 940 1795 yes HWIoCB.134 Cu.l1Fe.0OT1 940 1728 Ye" FeTiCAi.ISa Cu.t,•l-.,ONb 1028 1880 y'I FeNbCB.136 Cu..l1e-1,0Pr 940 1725 Yes FZrCB.137 Cu.lBNI-.O.r 940 1725 ys Ni4ZrCB-IM Cu.0.4Y.0.3B NA Check hor YB.C0.139 CU-I.0Nb.0,23 NA Chick tr MebBCB-140 Cu.0,A1. O.8B NA Chuck hor AI11CB.144 Cu-0.05T710,01"IHf.OA1 940 1728A021 Cu,0.1Zr M 1700 Commercial materialNASA-Z Cu-0.8Zr-..OAS 9 1700 ys NASA LRC material
Material originl:CB.1 -0 C34 P&W Material. Inearing RPtsaih Lab., Z. Hartford. CTCR-7 -- CB37: United Tgobnologis Rsevch Cente, Z. Hartord, CTCB.48 - CB-144: P&W norlida; oed Cu.1BCr and Cu.a0%Zr muter Alloy.
Cast ButtonIHot Rol Electron
50% Sem Pas
Solution25 Minutes
Cd Rol ,Coldd Rol40% 40%
Age Age Age Age Age Age3•7000 48106C SM0 370010 4800 560,C(7006) (900") (12000F) (70061) (9OF) (12000F)2 Hours 2 Hours 2 Hours 2 Hours 2 Hours 2 Hours
StaibilityTest Anneal
Stability Test Anneal 650"C (1200"F)/12 Hr/FCe6o9C (1200"F)/12 Hr/FC (Vacuum) (Vacuum)
Figure 6. Screening Mlow Chart. AUlys CB.1 Through CB-25 and CB-34 Through CB-37
14

Cut Button
Cold RON Eieotrof Beam Pus
oluion30 Mlnutu
Cold Rol Cold Roll40% 25%
Age4806C (9006F)
2 Hours
StabIlIty Test Anneal6506C (1200*F)/12 Hr/FC (Vaouum)
Figure 7. Screening Flow Chart: Alloys CB-43 through CB.-07, CB-109 through CB.120,CBR125, CB-126, and CB-138 through CB.144
15

Cast Button
Cold Roll Electron-Beam Pass50%
Solution30 Minutes
Cold Roll Cold Roll40%
I4800 (900-F) 480-0 (006F)
2 Hours 2 Hours
Stability Test Anneal6500C (1200"F)/12 Hr/FO (Vacuum)
igure 8. ¢Scrumning Tw Chart, CB.108, CB-121 through CB.124, and CB-127 throughCB-137
18

.4o
Flgure 9. P&W Arc Button Melter
Rapidly solidified samples of copper.zirconium-boron alloys were also prepared on a P&W-built melt spinner, shown schematically in Figure 10. This jet-type spinner employed a 200 mm.(B-inch)-diamoter by 26 mm.(1.inch)-thick copper wheel driven directly by a variable-speedmotor. Wheel speed was monitored by a digital tachometer employing a magnetic pickup. Thealloy, generally cut from an arc-melted button, was melted in a 1/2-inch-diameter tubular quartzcrucible coated on the inside with a fired AI,0 8 coating (Taycor 341 slurry, applied, dried at100'C (210T), fired 500*C (9300)/2 hr + 600'C (1110 'F)/6 hr), The crucible had a 1-mm orificeat the bottom, Heat was supplied by a 9 1/2-turn induction coil (4.7 mm or 3/16 inch OD tube)powered by a variable-power, high -frequency supply. The crucible top was covered with a fittingemploying a viewport at the end and a helium inlet port for jet pressuriration, At times, an Ircon2-color pyrometer was sighted through the viewport to monitor melt temperature, The entiredevice was enclosed in a drybox with a vacuum pump and attendant plumbing to allow inertoperation. The melt spinning process entailed:
1. Set up with charge in quartz tube,
2. Pump out drybox 30 minutes. Backfill box with helium to positive pressure.
3, Turn on wheel motor and adjust speed.
4. Turn on induction furnace, adjust power until desired melt temperature isreached.
17

5. Turn on jet ga to force melt through crucible orifice onto wheel, where itsolidifies before being flung oft
6. Turn off furnace, motor. Open drybox and collect ribbon.
Ribbons were spun using the parameters in Table 8 and evaluated as-.solidifled.
O. Soreening Alloy Evaluation
Cast + wrought screening alloys were evaluated by optical microscopy, scanning electronmicroscopy, electron microprobe, microhardnees, and x-ray diffraction. The rapidly solidifiedmaterials were evaluated by optical microscopy, scanning electron microscopy, transmissionelectron microscopy of extraction eplicas, electron microprobe, and microhardness. Melt-spunribbon was evaluated by optical microscopy and electron microbprobe. Details of these methodsare discussed later.
9. POWDER PRODUCTION
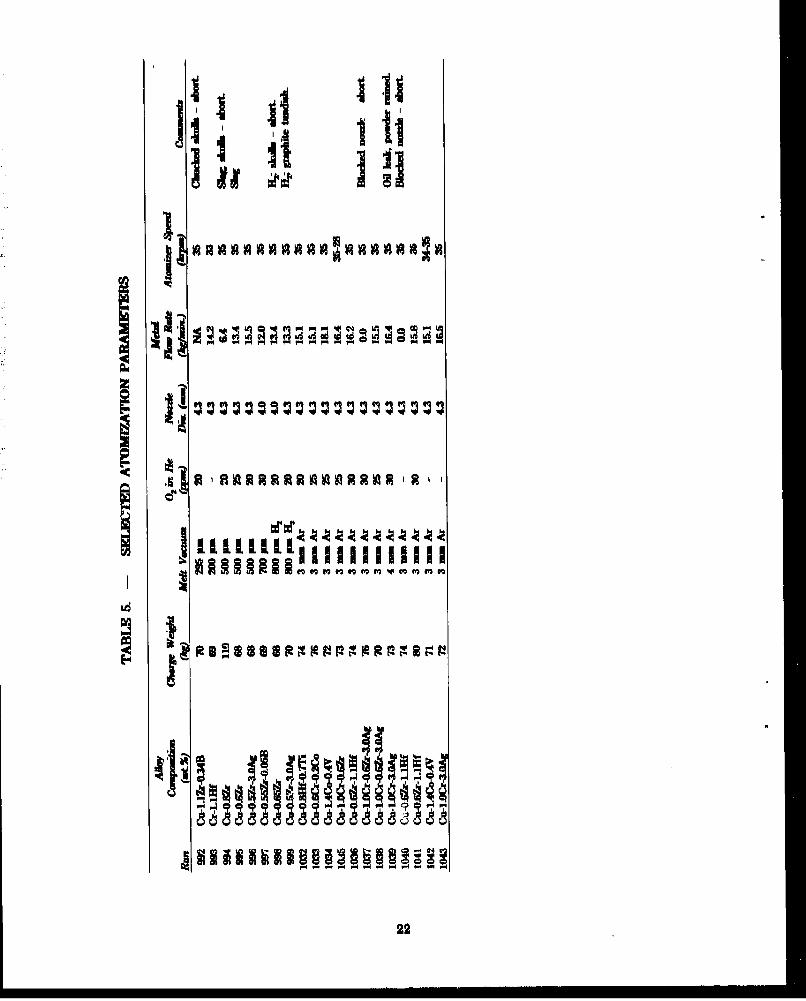
The compositions atomized and general atomization parameters ar listed in Tables 4 - 6.Atomized alloys were formulated from elemental charges, late elemental additions, and masteralloys, as shown in the table. Assays of the constituents used ar shown in Table 7.
a. Master Alloy Production
Master alloys were melted in a 41-kilogram (100-pound) capacity vacuum-lnductionmelting furnace, using a silica-stabilized alumina crucible (10 percent silica) and copper or stelmolds. Elemental additions were used and were added to the molten copper. Vacuum meltingparameter are shown In Table S.
b. Powder Production
Copper-based powders were atomized in the P&W 2-moter (7-foot)-diameter RSR device.The device Is shown in FIgures 11 and 12, This device Incorporates a 140-kilogram (300-pound).capacity induction melting furnace with late addition capability. Below the furnace Is aninduction-heated tundish and metering nozzle system that directs a stream of molten copperalloy on to the centar of the atomizer. The atomizer is a horizontal 100-mm (4-inch).diameterdisk that spins at 35,000 rpm (turbine driven). The molten metal is accelerated off of the disk inthe form of fine droplets that are then quenched and solidified by a ourtain of flowing helium gas.The resulting powder falls to the bottom of the chamber and into a collector can. The heliumflows past the collector can, into a cyclone separator where airborne peticles are removed, andinto a system of coolers and a blower to return to the atomizer device for reuse. The device isfully instrumented with thermocouples, pyrometers, speed transducers, pressure guges, closed-circuit televsion with video reorders, and high-speed movie cameras. AlumIna-10% silicacrucibles and tundishes are used.
RSR device operation entails the following steps.
1. Charp Is melted under a vacuum of about 100 microns, About 8 minutesbefore atomization begins, any late additions ar added
2. The system is filled with gaseous helium, to 14 kPa (2 poig).
3. The turbine and atomizer disk are brought up to speed and the heliumrecioulator blower Is turned on.
18
4. The metal is poured from the melt furnace into the tundish, from which itpours onto the atomizer disk. Atomization commences. Atomization con-tinues, while perameters and data are monitored.
5. When the melt Is exhausted, the turbine Is turned off, the furnace power Isshut off, and the recirculator blower is shut off.
6. The lower head is blown out with helium to flush settled powder into thecollector can. Then a ball valve at the top of the collector can is closed and
... the sealed can Is removed from the device.
7. The device is then disassembled, cleaned, and set up for reuse,
Run parameters for the copper alloys are listed in Tables 4 • 6.
a. Powder Handling
After atomisation, the powder is transferred via the sealed collector can to a helium-filledglove box. The can is attached to the glove boz and emptied into it. The powder is screened intothe desired sin fractions inside the box, using 200 mm-(SBinoh)-diameter Tyler screens. Powdernot used immediately is stored under helium in gIas Ball-type canning jas.
d. Powder Evaluation
Atomized powder wu evaluated by optical and scanning electron microscopy, electronmicroprobe, x-ray diffraction, water analysis, oil analysis, oxygen analysis, carbon analysis, andchemical analysis by Inductively coupled plasma emission spectrophotometry.
S. POWDER PROCESSING
a. Vacuum Hot Compactlon Consolldation
lamples of copper alloy powders were hot vacuum consolidated for cleanliness evaluation.This was performed in a P&W vacuum hot compaction/dlffuslon bonding press, which isessentially a small vacuum Isothermal forging press. Powder samples were poured Into a 90 mmlong X 45 mm-diameter X 1.2 mm wall thickness (3.5-inch X 1.75-Inch X 0.05 inch) austeniticstainless sl closed-bottom cylindrical can (in ak). Multiple samples were separated with shbetsof nickel foil. The top of the powder was covered with a 0,07-inch-thick stainless steel disk, andthe entire assembly was coated with a boron nitride parting compound, placed in a TZMmolybdenum die, and covered with a TZM molybdenum punch. The assembly was placed In thevacuum hot press and instrumented with thermocouples. The press was closed, pumped out tobetter than 5X10"- microns, heated for 1.5 hours to 760*C (1400*F), and held at temperatureanother 2 hours. Next, compaction pressure of 200 MPa (30 ksi) was applied gradually over 30minutes and hold another 2 hours at a temperature of 760'C (1400'F). The compaction force wasthen removed, the unit cooled (12 hours) and backfllled, and the part removed. Powder alloysamples of Alloy 992, 993, 994, 995, 996, 997, 998, and 999 were compacted in this manner.
19

Stuinless Tubes Argon for Spray
Ouartz Crucible
Wheel "W Gp .5m
Rotation
Figure 10. P&W Florida ME&T' Melt Spin Rig
20

TABLE 8. - MELT SPINNING PAR~AMETERS
Wheel
'run Agor from -- orne-J L% O CowwMet1 CB-2S melt 2400 so 102 CBR26 1420 2600 2400 69 10a CH-26 1970 2500 2500 76 11 Hold melt one minute4 08426 1540 9800 9800 76 11a C8.46 1810 92w BODO as 19 amaidnoule6 CS-IS 1660 8000 9M00 8u 12
TABLE 4. -ATOMIZATION MELTS
A110oMal ChaffeCompouition Weighi Late
Aun (VA ~ (h) Cruails chairge AddisioraMW Cu-1,lZr-.0843 70 Copper bar 6 zr
99 Cu-l.Iff SB Coppe& bar Hf9k4 CQOu-.r 110 Copper bar, ZrNB CU-016Z 66 Cu bar, VM Cu-Zr (1788)we6 Cu-0szr.8,OAg 66 Cu bar, As Z,w9 CO-018Zr-0.08 as Cu bar, B Zr
we C00.S8br 65 Cu bar Z,W2 Cu-0,5Zr.8.OA# 70 Cu bar, Ai Zr
1089 CU0SI-0.1MA 74 Cu bar 7, Hf1088 CU-0.60r-OJo 76 Cu br, VM Cu.Cr-Co (1884)1084 CU.1.4CO-0.4V 72 VM Cu-Co-V (1988. 1689)1088 0U-4,O0r-O.6Z 78 VM Cu-Cr (1640,1641) Zr1086 Cu-0,6Zr-1Lixt 74 Cu bar Zr, wi1087 CU4,O0cr-0Sr.80Ag 76 Cu bar, VM Cu-Cr (1648) Zr, Ag1086 Cu-l.OCr.0.S&r.OAg 7 Run 1087 heel Zr, A4g1089 Cu-1.OCt.S.0A# 78 Cu berVM Cu.Cr.Ag (MG)1040 Cu-0,62r-1.l~f 74 Cu bar Zr, Hf1041 Cu-.62r-1.lHf so Run 1040 heel Zr, H1049 CU-1,4co40.4V 71 VM Cu-Co-V(184S, 1649)1048 Cu-1.OCr.8AS 79 VM Cu-Cr-Ag (1664, 1668)
VM -Vamuna-Induation-melted vauter Alloy
21
iI~ a1i
.1 aI 1AI S l m l ilR$Ii
LLd
22
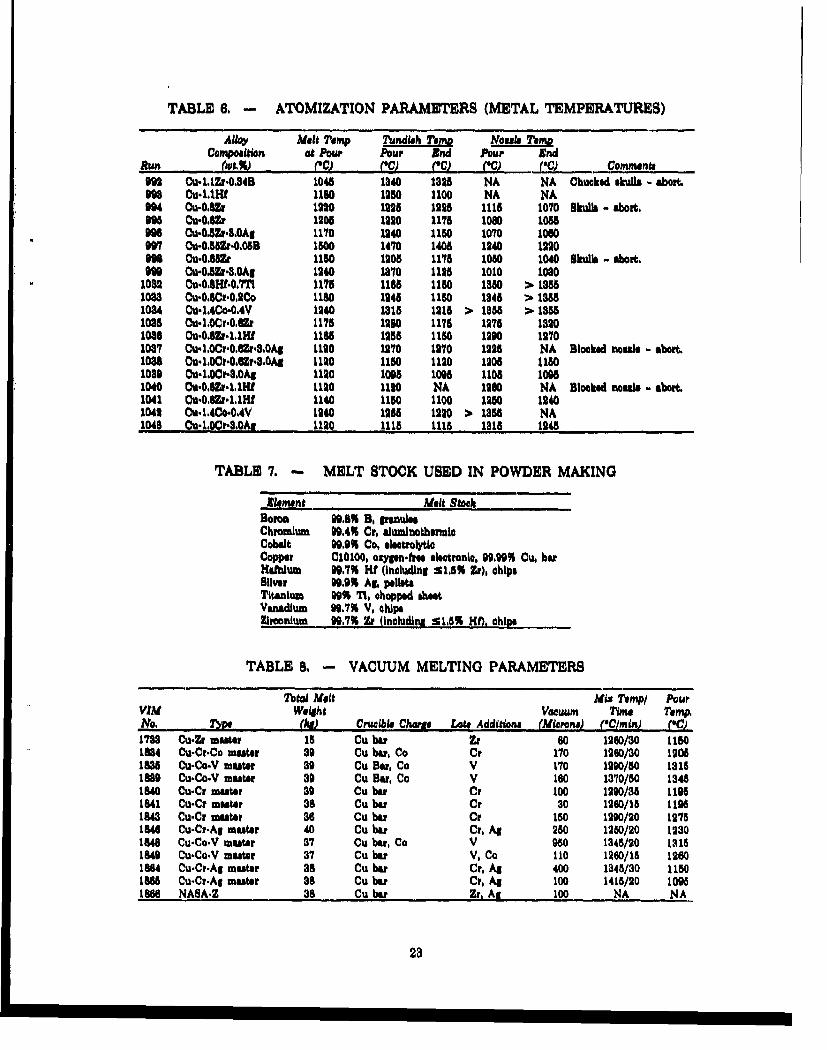
TABLE 6, - ATOMIZATION PARAMETERS (METAL TEMPERATURES)
Alky Melt Tem. p .. d.i. Noul. TrmoCompoiLton at Pour Pour End Pour End
Run (wt.%) (PC) ) ('C•) C ('PC) P comment.992 Cu.-lIZr0.,84B 1048 1840 1825 NA NA Chucked skulla - abort.M 0 u-Cl.lH 1180 1250 1100 NA NA
994 Ou-0.SUr 1220 1295 1225 1115 1070 Skulls - abort.099 Cu.0,4 1908 1290 1175 1080 1065W Cu.0.Zr.8.0A5 1170 1240 1180 1070 1060
007 ou-0,582r.0.6B 1500 1470 1405 1940 1220M 9 u.0,685 1160 1205 1175 1080 1040 skulks - abort.
9ON Cu-0.Zr.8,0Al 1240 1870 1128 1010 10801082 Ou-.0.41f.0,7Ti 1178 1165 1150 1850 > 188B1083 ou-0.SCr.0.2Co 1180 1245 1180 1345 > 18551034 Cu1.,4Co.0.4V 1240 1815 1215 > 1858 > 18581085 Cu-1.0Cr.0•r 1175 1290 1176 1275 18201086 Ou-0.$Zr.l1llf 1185 1255 1150 1290 12701087 Cu..0Cr-0.86Zr4.0A# 1120 1270 1270 1225 NA Blocked nose). - abort.1088 Ou.1.O A.0•.618,OAg 1120 1180 1120 1205 11801089 Cu-L.OCr.8,0Al 1120 1005 1095 1105 10081040 0u.0.SZr-,.L1H 1120 1120 NA 1260 NA Blocked nouue - abort.1041 0uC.0.6•r',IHf 1140 1150 1100 1250 12401042 Cu.-14Co.0.4V 1240 1265 1220 > 1858 NA1048 Cu-l,0Cr-8,0A - 1120 1115 111 1815 1245
TABLE 7. - MELT STOCK USED IN POWDER MAKING
Element Melt StockBomao 99,8% B. peanuesChromium 69.4% Cr, aluminothermioCobalt 90.9% Co, electroltCopper 010100, oxygen.ft electronlo, 99.99% Cu. berHaLfbum 99.7% Hf (including s1.5% Zr), chipsSlilver 9,9% Al. pelletaTitanium 09% 71, chopped sheetVanadium 90.7% V. chipsZimonium 99.7% Zr (including S 1,6% HQ, chips
TABLE 8. - VACUUM MELTING PARAMETERS
fTob Melt Mix TemP/ PourVIm Weight Vacuum Time Temp,No. (.h a) Crucible Charge Late Additions (MLrons) ('C/mn) (C1788 Cu.Zr mufte 18 Cu bar Zr 60 1960/30 11501884 Cu-Cr.Co master 89 Cu bW. Co CF 170 1960/30 12081838 Cu-Co-V master 39 Cu Bar, Co V 170 1290/50 31811889 Cu.Co.V muter 8a Cu Bar, Co V 160 1370/80 13451840 Cu-Cr maeetr so Cu bar Cr 100 1290/35 11981841 Cu-Cr meeter 38 Cu bar Cr 30 1960/15 11951843 Cu-Cr muter 36 Cu bar Cr 150 1290/20 12751846 Cu-Cr-Ag meeter 40 Cu bar Cr, Ag 250 1280/90 12301848 Cu-Co-V meeter 87 Cu bar, Co V 950 1345/20 13151849 Cu.Co.V muster 37 Cu bar V, Co 110 1260/15 12601884 Cu-Cr.Ag muter 38 Cu bWr Cr, Ag 400 1345/30 11501888 Cu-Cr-Ag master 38 Cu bar Cr, Ag 100 1415/20 109818 NASA-Z 38 Cu bar Zr, As 100 NA NA
23

Continuous Helium W Inert PowderRolrmulation System ProduOtion Systom
He In r
He Out,
FIgum 11. P&W RSR Atomise
24

ftuwe 12, P&W RSR Atomiser
b. Canning fbr Extrusion Consolidation
Powder was canned in nominal 3-lnch-diamneter extrusion cans for extrusion consolidation.Can configuration is shown in Figure 13. Cans were welded from either deoxidized copper(C10100 and C12200 with AWS RCu wire) or plain low.carbon steel (see Table 9 for canapplications). Cane were leak tested with helium man spectrometer leak detectors to leak ratesbetter than 10-6 om/second. (About one third of the copper cans were made and tested at P&W,the remainder were made and tested at ZAK Co., Troy, NY.)
Cans were filled and outgassed in three ways. See Table 9 for applications, alloys canned,
and size fractions used.
(1) Can Filling via Outgasar
The outgasmer used is shown in Figure 14. It is a system comprised of a heatable verticaltube through which powder is poured from a transfer can into the extrusion can, all undervacuum produced by the attached pumps. The procedure for copper alloys was:
1. With the transfer can unattached and the metering valve closed, anextrusion can was attached and the system pumped down and leak checked.
2. The transfer can was filled with 540 ml of powder in the drybox and theisolation valve was closed.
3. The transfer can was attached to the outgasser, tipped (via a hoseattachment), and allowed to pump out through the isolation and meteringvalves for 15 minutes.
25

4. The transfer can was righted and the metering valve adjusted for a powder
flow of 0.5 kg/mmn through the outgaser.
5. After the extrusion can was full, it was pumped out for another 30 minutes.
6. The filler tube was crimped 8 times and severed from the outguuer at thecenter crimp. The end was sealed further with a gas.tungsten-ac weld.
Throughout the process, system vacuum wu maintained below 5X 10⁻⁴ microns, Outgassingwas done at room temperature.
L- _____(7.100 In.)18.084 cm
Weld Weld
(5.725 In.)r Tube14.54* cm
(.810 In, Die) 14M2Weld-7.315 orn
_•,,.• -0,10 In,
Fu. 13. P&W xtawion Can Ausembly
(2) Can FiNng via Cold Putmpdown
For this method, the can was filled in the dryboz and pumped out, using the outgasaer as avacuum source, as follows.
1. An extrusion can was filled In the drybox under argon; an isolation valve wasattached to the can and closed. The assembly was attached to the outgasaer.
2. The outgasser was pumped down, the Isolation valve was opened, and thecan was pumped out for 1 hour. System vacuum was maintained below5X10"6 microns.
3. The can was sealed as above.
26

Powder Reservoir
I lodation Valve (hug
mowingPumh
CoRohghingtlan
Can
F~r.1. &WPwdr ZTae
27hVo

a. Extruslon Consolidation
Powder alloys were consolidated into barstock via hot extrusion from the P&W 700-tonLombard prim (Figure 15). Both direct extrusions and extrusions preceded by hot blank diecompactions were made. Alloys extruded, extrusion temperatures, application of precompactions,extrusion ratios, press loads, and other variable data are summarized in Table 9. Othernonvariable parameters are listed below:
*Billet preparatlon: Grit blast, then coat with DAG137 lube.*Soak furnace: air.
Liner: 80 mm (3.18-inch) diameter, heated to 260T (500'F), Fiske 604 linerlube (graphite/pesas).
*Die: Round conical, H-12 tool steel coated with zirconia, Polygraph lube(graphite/grease)
*Compaction Conditions: Hold 60 seconds at 600 tons.*Furnace-to-press transfer time: less than 15 seconds.
d. Processing of Extrusion*
Extruded powder alloys were subjected to various thermomechanical processing treatmentsfor alloy evaluation. The processing schedules are shown in Figuros 18 through 19. Air furnaceswere used for the solution and age treatments. A vacuum furnace was used for the 680*C(1200T) stability tests: vacuum levels were better thar. 10-' microns, the heatup rate was500'C/hr (1000'1/hr) and the cooling rate was 330'C/hr (600'F/hr). Swaging was performed in aFonn 4F two-die swanging machine, using a die set having Increments of 13 percent reduction inArea.
figure 15. P&W Extrwubon Preas
28

TABLE 9. -COPPER ALLOY EXTRUSION CONDITIONS
Powder Compacdon Zzfrwton ExPtnion LoddA&Wy. conmpouitdc IFacon Soask (8) Sock Ra~io Dkuwter (M 4r 7rJ (0
Bap No. (" %) (Me0Sh) (6CMhrJ M -0j (MWns BIT RUN9981 FOAMZ~ 430 650/9 650/2 Wi 96 M1 255993.2 Cu-1.lHF 430 No comp. 810/2 12:1 28 671 8189963 CU-1.1t (4,6,7) .80+230 No ooup. 650/2 90:1 18 687 5129964 CU-.1m 4830 680/9 650/9 101 95 854 $8999-5 Cu-1.lHI 4280 650/2 650/9 loll 95 808, 966996.6 Cu-1.1HI ('7) .60+230 No coup. W8/2 20.1 17 NA NA995-1 CU.0.62r 430 680/9 660/2 &1 98 889 8259952 CU.0.O8r -980 No coup. 860/9 12:1 98 889 81190-6 CU-0.6Zr -930 No comp. 680/9 90:1 18 495 403995.4 CU-0,S6r -930 No coup. 680/9 20:1 is 460 4899961 Cu-0.8Zr.3.OAg -230 650/9 W5/o &1 29 406 847996.2 Cu-0.Sr-.O.AS 4820 No coup. 650/2 12:1 98 407 8719071 CU-0.88r-.0oIB .280 No comp. 680/9 12:1 98 860 $6999-2 Cu-0.856b.0.06B -930 $60/2 860/9 Wi 98 811 97699&1 Cu.0.68Zr (7) .80 No coup, 650/9 12:1 98 864 895999.1 CU.0.8Zr.3,0Ag .980 650/9 650/2 all 2B 889 864M092 Cu.0.S6r.8,DAg -230 No comp, 650/2 19:1 98 410 871
1089-1 Co.0614f-0.7T1 -930 650/9 660/9 10:1 is 671 6111082-1 Cu-0.8Ht-M7I .930 No coup. 680/9 20.1 18 828 4741083-1 CO.0.6Cr.O.9Co -230 680/9 680/2 10:1 95 983 2551066-2 ou-06r-o0,0o -930 No coup. 650/2 90:1 1s 449 8691065.1 Cu-1,OCt0.06Z -230 650/9 6s0lo 10:1 so 8654 w0e1065.9 Cc-1,ocr-0.6Z .930 No coup. 660113 90:1 18 498 4741086-1 Cu-.0,Zrl.lHi -930 650/9 650/9 10:1 95 889 NA1036-2 Cu0o~fi 1.IiM .960 No coup. 650/9 90:1 18 425 8891061.1 Cu-1.OCf-0.6Ztg.8.Ag -230 650/9 660/9 10:1 98 460 8791068.9 CU-1.0fOAD-0,Z-.OAN .280 No comp. 680/9 90:1 18 528 4751042.1 CU1.140o.04V -230 680/9 680/9 10:1 95 818 961042-2 CU.1.40co0.4V -980 No oump. 680/9 90:1 i8 425 8751048.1 Cu-.1OrA8OAg .980 680/9 650/9 1ol1 96 889 8081048.9 Co-1.OC",Ag1 -980 No coup. 650/9 90:1 18 880 460MT.4 Cu-tli~t (1,4,7) NA No coup. 700/9 90:1 18 871 847bGT-6 CU-1.1Hf#Oxygsn NA No coup. 700/9 90:1 18 847 828
(11,9,47)PWNASZ-1 Cu-0.5Zr43,0A# Ingot No coup. $40/2 22:1 16 48m B96
1, Hydrogen reduced2. MAttWe powder8. "No coup." means no coupaction - a direc t niteuon4. M9-8, MIT-4, MIT6 snot to MIT5. steel Can6. /Tr usan breakthroug fomc7. Pumpdown Mbu. AM others throush outumseer.
e. Additional Pmcess Work
Additional processing investigation, were conducted on Alloys 993 and 999. Bcth alloyswere hot-swagpd to a 50 percent reduction in area at 870'C (18007), then solution-treated at925'C (17007) for 30 minutes and water quenched, then cold swaged to a 50 percent reduction inmarea then aged at 480*C (9007) for 2 hours and air cooled. Evaluation was by optical
microscopy.
29
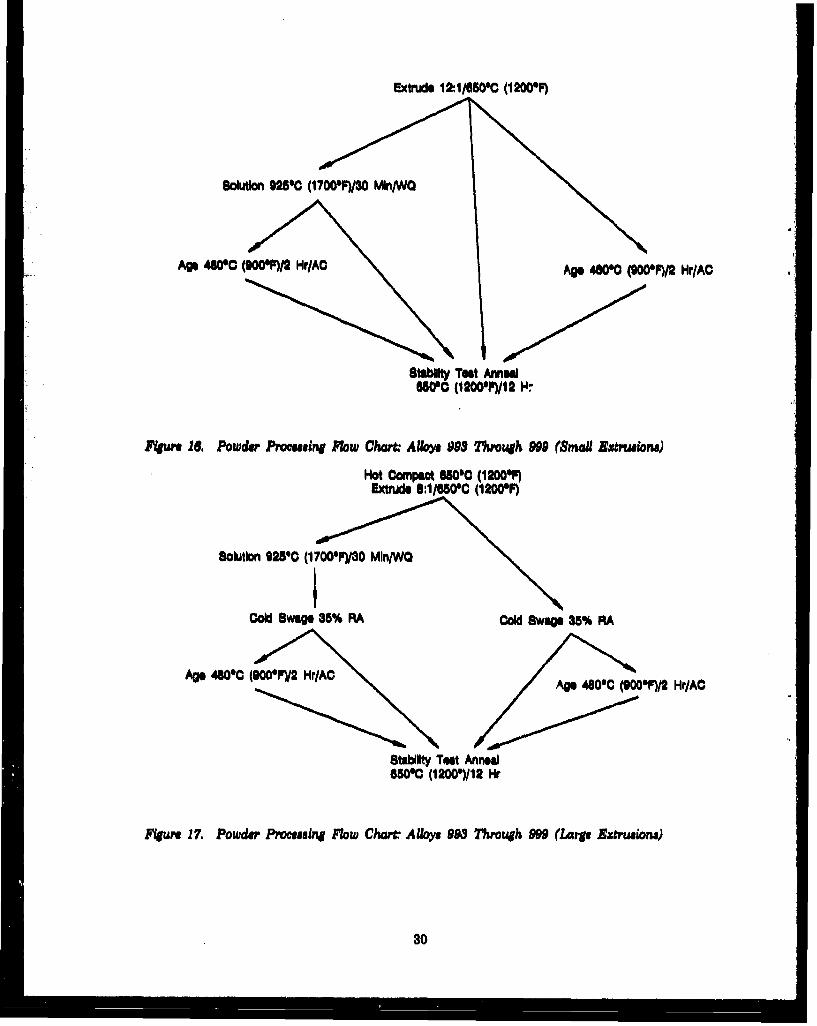
Extrude 12:1/650M (1200*F)
Solution 925C0 (1700*F)/30 MhI/WQ
Age 480.0 (W00*F)/2 Hr/AO Age 4060 (900'F)/2 Hr/AO
Stab1ty Tut Anneal650.0 (12l00.P)/1Q I4"
Fkm 18, Powder Procaeing Fow Chart AUtys 993 Through 999 (Sma ZxMm'mona)
Hot Compact M00C (12004F)Exwtrd 1111/65000 (1200011)
Solutlon 925C0 (1 700OFY3 MIn/WO
Co Swage 35% RA Cold Swage 35% RA
Age 480"(C (900.7)12 Hr/AC Age 480'C (900*F)12 Hr/AO
StabINty TeAt Anneal650°0 (12000)/12 Hr
Figure 17. Powder Promeuing Flow Chart Aly• 99 Thfrough 999 (Urge Extrusions)
so

Extrude 19:11650*0 (12006F)
Solution (H) 925*0 (1700*F)/0 MIn/WO
IAe (H4) 4800 (90IF)/2 HrlAC
"Stability Test Anneal65060 (1200P1)/112 Hr/FC
(Vacuum)
F~pu" 18. Powder Processing Flow Char. Alkoy 1032 Through 1043 (Smal Ezxtwion.)
Hot Compact 65090 (12004F)Extrude 10.1/650C (1200'F)
Solution (H) 9250C (17000)/30 MIn/WO
Cold Swage (H) 35% RA Cold Swage (H) 35% RA
Age (H) 48000 (9009F)/2 Hr/AC
Stablifty Teat Anneal6500• (1200F)/12 Hr/FC
(Vacuum)
Fture 19. Powder Procesuin Flow Chart. Aloy. 1032 Through 1043 (Large Extrusions)
f. Processing of Materials for Testing
Materials for mechanical and phyalcal property tests were processed according to theschedules in Table 10, using techniques described earlier. Processed materials were evaluated byoptical microscopy prior to specimen machining.
31
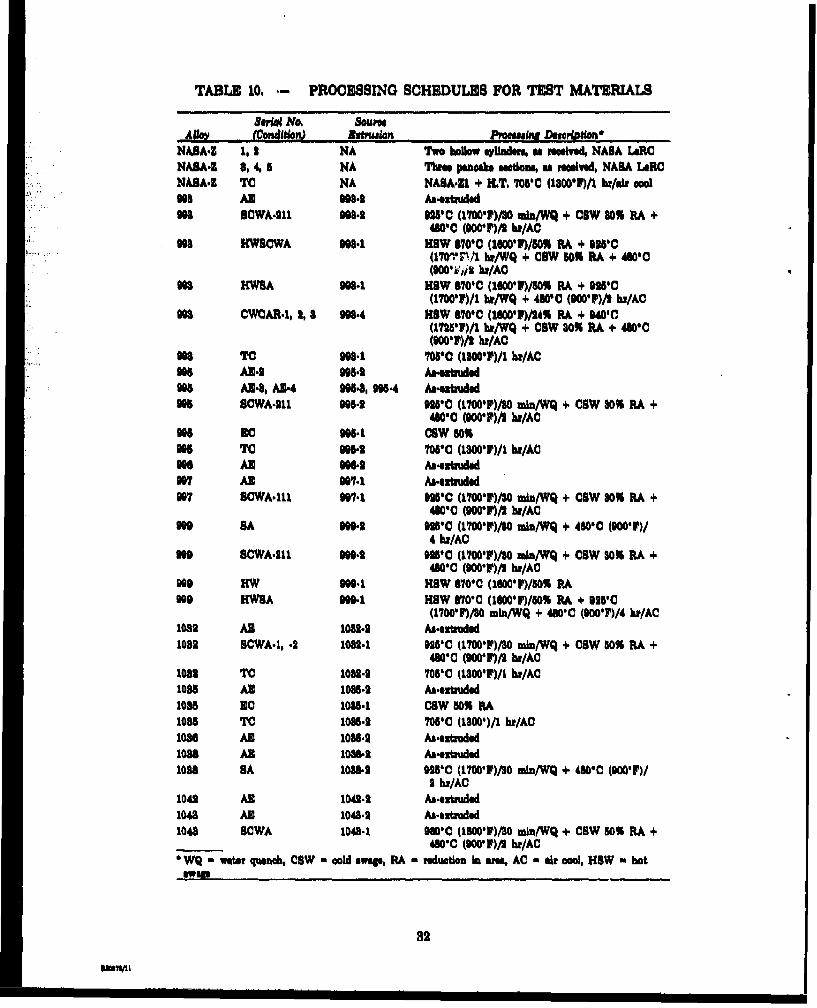
TABLE 10. *-PROCESSING SCHEDULES FOR TEST MATERIALS
Age~ (Covulition) Iglst ion PromeaiNa Dende igln*NAOA.Z 1,12 NA Two hollow ayllodesm is mosilwd, NASA L.RCNASA4 814,56 NA This pancake macdaa, as moolved,, NASA U.RCNASA.Z TC NA NAUA.Z1 + MLT. T05'C (1800*$/i hr/aix moo)
ma U -2. A&s tuidedma SCWA6.211 908.2 MhC (11001)/S MOMunW + CIW 801 BA +
480'C (0001)/S hi/ACon HW8CWA M-31 113W NOT (160017/50% PA + 92oC
(1701,171A hII/WQ + COW 601 RA +48IoC(000'Vilj8 hz/AC
"s0 HWSA W01 HO8W 870'C (160017)/50% RA + WT6(17001)/i1 ht/WQ + 480-0 (9000P)/S hi/AC
008 CWCAR.1, 9, a 998.4 HOW 670-C (160-P1)/24% RA + 640'(17251p)/i bm/WQ + COW 301 RA +406WO(9000T)/2 hz/AC
96a Tc 003.1 70VC (13001)/I WzACHs AN.9 M-2Ametrdgft AN4, AS.4 004, 9M-4 As. *jrmledd00& SCWA-211 00642 9259C (11001)/SO Wnn/WQ + COW 301 BA +
480-C (0001)/g hi/ACmac9065.1 COW 801
95 TO D06s MWO (101)ih/ACH60 AN 006 Am-extnadodon7 AS 997.1 Aasaz4buded907 BCWA-111 001.1 9256C (11001r)/SO Wu~/WQ + COW 80% BA +
480-C (9001)/S hi/ACno9 BA 0094 09251 (17001p)/SO .ln/WQ + 4600 (900-p)/
4 hz/ACO00 SCWA-211 0002 0926C (170 V01)S mln/WQ 4 COW 801 BA +
480-C (9001F)/S hr/AC909 11W 0001 HO8W V70C (1600-1)/50l BABee HWSA 990. 11W S70C (1600-F)/50% RA + 9956C
(1700*1)/SO min/WQ + 460C (9001)/4 hz/AC1089 AH 1089.9 As-extaiaded1089 BCWA.1, .2 1089.1 9256C (17001p)/SO mln/WQ + Cow 801 BA +
480C (9001)/S lw/AC1089 TO 1089.1 706-C (1800-F$/1 hz/AC1086 AN 10862 &etad1085 sC 1086.1 COW 60% RA1086 TO 1086.9 705-C (1800-)/1 hi/AC1086 AE 1086.2 Asazitruded1088 AS 1085 Aa-ztzudd1088 BA 103854 OWO- (1700-F)/SO zoin/W + 4800C (g00'F)/
9 hz/AC1049 AE 10U9-9 Ai..zuiialde1048 AE 1048.9 setue1048 BOWA 1048.1 980'C (19001)/SO .I/WQ +. COW go% BA +.
______480-C (9001)/S hi/ACWQ -water quench. CSW *cold samp, RA - reduction im area, AC a air ocol, HO8W - hotswap
82

g, Evaluation of Powder Metallurgy Copper Alloys
Wrought powder metallurg copper alloys wen evaluated by optical microscopy, scanningelectron microacopy, transmission electron microscopy, electron microprobe, x-ray diffractionanalysis, Rockwell B and F hardness, hot tensile tests, and hot compression tests.
4. T1ST AND CHARACTERIZATION METHODS
Wrought powder alloys were conditioned and subjected to tests as detailed in Table 11.
a. Tensile Testing
Tensile tstn was carried out in argon at elevated temperature and generally at high strainrates, Early tests were performed using a Tinius Olsen hydraulic tensile machine and used adeflectometer on the croashead to obtain yield data. Later tests were conducted on an MTSsrvohydraulic machine using extensometers on the specimen to collect satain data, Applicationsof the tet tpes a listed in Table 11.
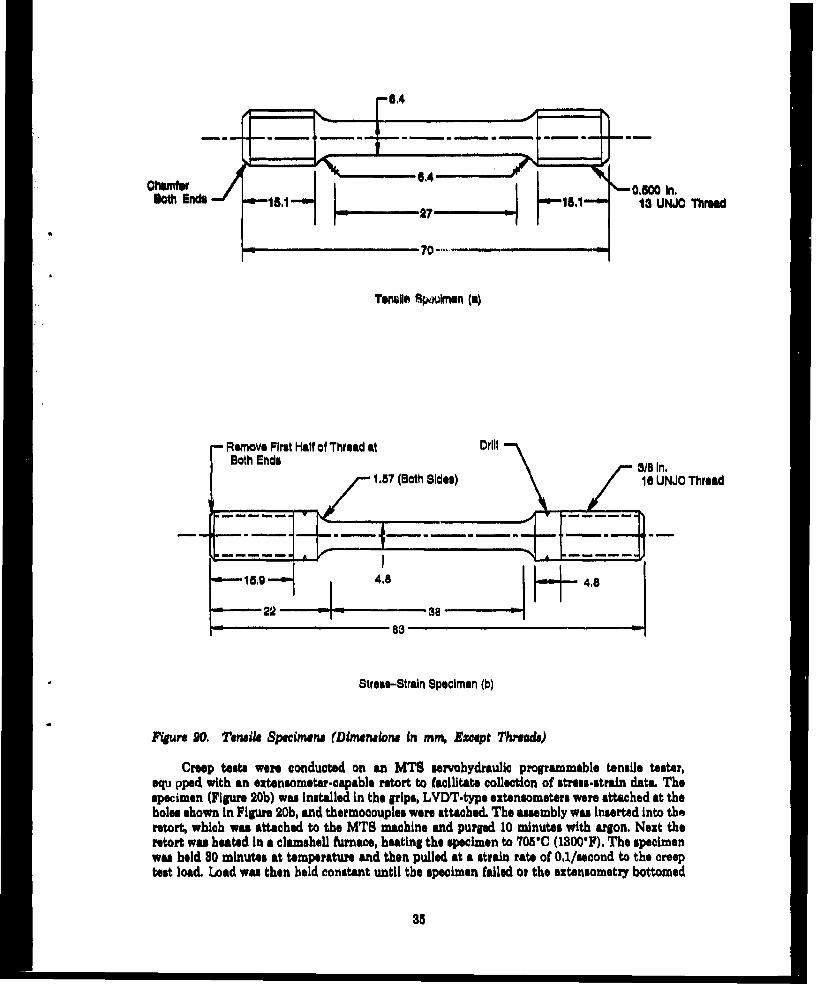
Maly teast were conducted on a conventional hydraulic tonsile testing machine equippedwith a reort to encapsulate the specimen and grips in argon, and a clamshell furnace to heat theretort and specimen within. The specimen (Figure 20a) was installed on the grips andinstrumented with thermocouples. The assembly was installed In the retort, which was thenpurgd with argon for 80 minutes. Then the retort was installed on the tensile tester and heatedwith a clamshell fornace. The specimen was heated to 7051C (1800F), held at that temparaturefor at least 80 minutes, and then pulled at a crosshead speed of 4 inches/minute, giving an initialstrain rate of 0.06/second. A defletometer connected to the crosshead was uasd to obtain straindata. Yield strength (0.2 percent), ultimate tensile strength, percent elongation In 2.5 cm(specimens were scribed), and percent reduction in are were reported.
Later tensile tests were conducted on an MTS servohydraulic programmable tensile tester,equipped with an oxtensometer-capable retort to facilitate collection of stress-strain dats. Thespecimen (Figure 20b), was installed in the grips, LVDT-typs extensometers were attached at theholes shown on Filure 20b, and thermocouples were attached. The assembly was inserted Intothe retort, which was attached to the MTS machine and purged 10 minutes with argon. Next theretort was heated in a clamshell frnace, heating the specimen to the testing temperature of540'0 (10007) or 705'C (18007). The specimen was held 80 minutes at temperature and thenpulled at strain rates of either 0.1/second or 0.0008/second. Force and strain data were collectedon an X-Y plotter. Yield strength (0.2 percent), ultimate tensile strength, percent elongation In1,8 cm (four diameters), and percent reduction in area were reported. On occasion, engineeringstreu-strain curves were plotted.
Failed specimens were examined by optical, scanning electron, and transmission electron
microscopy.
b. Creep Testing
Some of the alloys were subjected to high-stress creep testing at 705C (13007) in argon.Stress levels were equivalent to the slow-strain-rate proportional limits for the respective alloys,which were determined through tensile testing as above.
33

j @ #4 f, # ,4 M # @'IVf#4IN##101
'. 4 N '4 N1
34
Chamfer .I 0,0 in.3oth Ends 1i" 5." 1- 13 UNJC Thread
27 i
•- ' " ~~~70 .... . ..
TeneUle P*.-uimen (a)
Remove First Hall of Thread at DrillBoth Ends 3/8 In.•..•.:.:• t1.57 (Both Siesi)" "--' - •18 UN'JO Thread- -
4, 8
... 22 -- 38 -- - -- -
83
Stress-Strain Specimen (b)
Figure 20. Teriui Specimr•s (Dimetnuona in mm, Except Theads)
Creep tests were conducted on an MTS .ervohydraulle programmable tensile teoter,equ pped with an eztensometer.aapable retort to facilitate collection of stress-strain data. Thespecimen (Figure 20b) was Installed In the grips, LVDT.type extensometers were attached at theholes shown in Figume 20b, and thermocouples were attached. The assembly was inserted into theretort, which wee attached to the MTS machine and purged 10 minutes with argon. Next theretort was heated In a clamshell furnace, heating the specimen to 705'C (1300%F). The specimenwas held 80 minutes at temperature and then pulled at a strain rate of 0.1/second to the creeptest load. Load was then held constant until the specimen failed or the extensometry bottomed
35

out. Time and strain date were collected on an X-Y plotter. Percent creep versus.time plots weremade. Time to filure, percent elongation in 0.75 inches (specimens were lightly punched), andpercent reduction in area were also reported. Failed specimens were examined by opticalmicrocopy.
a. Thermal Conduotlvity Testing
Thermal conductivity characterliation was performed by the Purdue University Thermo.physioal Properties Laboratories. Conductivities were measured indirectly, by way of flashthermal diffuaivity, specifio heat, and bulk density. Conductivitles were determined at 21,99,199,299, 899, 499, 599, and 6991C, (70, 210, 390, 570, 750, 930, 1110, and 12907).
Thermal dlftifvity was measured using a pulsed Korad K2 laser. A specimen 18 mm(0.Sinch) in diameter by 6,4 mm (0,25-inch) thick was placed in a small resistance frtnace insidea vacuum chamber. A pulsed luser wu aimed through a gis port of the vacuum chamber at thefront aids of the specimen. The chamber was evacuated. The sample was then heated to the esttemperature, allowed to stabilise for 5 minutes, and ezposed to a laser pule. A thermocouple orInfrared detector was used to measure the roar face temperature rise after the laser pulse. Fromthis, the diffusivity was calculated by the controlling minicomputer.
Specific heat was measured at Purdue using a Perkin-Elmer doped silicon carbide (DSC).2differential sanning calorimeter with a sapphire reference. Specimens measured 6.4 mm(0.25-inch) diameter by 1.2 mm (0,5-inch) thick. Specific heats were plotted as a function oftemperature from 221C to 7001C (70*1 to 12900P).
Density was measured at P&W, using the buoyancy method. The sample was weighed.Then it was hung on a win from a aile and weighed in water. Then the wire without the samplewas weighed in water (immersed to the same depth as with the sample). The density wascalculated:
d a
where: d - densitya dry sampleb - weight of sample and wire in waterw - weight of wire in water
Thermal conductivity was calculated for each temperature using:
X - acpd
where: X, - thermal conductivitya a thermal diftusivitya - specific heatS- density
d. Low-Cycle Fatigue Testing
Low-cycle fatigue testing was conducted in strain control, in argon, at 7064C (13000F) at0.75 to 8 percent total strain ranges, at strain rates of 0.0075 to 0.03/second, In continuouscycling, using a triangular waveform, with sero mean strain. Testing was conductac at P&W in aspecial environmentally controlled LCF rig.
36

The rig used is shown in Figure 21. The test mechanism consisted of a conventionalhydraulic stroke apparatus connected through seals to the specimen grips inside a pressurevessel. Also inside the vessel were a removable fixed upper pip, a resistance furnace, clamp-onLVDT-type extensometers, and specimen thermocouples. The test apparatus was controlled byan MTS urvohydraulic machine controller. The test cycle was generated by a sawtoothwaveform generator. Throughout the test, tensile loads, compressive loads, and cyclic strainswere plotted on a two-pen strip chart recorder. Periodically, cycling was slowed down andhysteresis loops (stress-strain) were plotted.
fSeveral specimens were used for LCF testing. They are shown in Figure 22. The testsperfbrmed and specimens used are listed in Table 12. Testing procedure was as follows:
1. The specimen was installed in the grips and extensometer, the assemblywas installed In the rig, covered with the fumace, and topped with the endplate to anchor the top grip. Thermocouple, LVDT, trnace, and watercooling leads were connected. The pressure vessel cover was attached.
2. The vessel was evacuated and refilled with argon three times, then filled tothe specified pressure, which was maintained throughout the remainder ofthe test.
3. The furnace was turned on and allowed to stabilize at the specifiedtemperature for 0,6 hour after everything reached 705'C (13007).
4. The control system was programmed. Testing began with slow 0,17 Hzcycling of the first 4 to 5 cycles until stresses had stabilized and smoothoperation was confirmed. The strain rate was increased to the specifiedlevel and cycling continued. Periodically (20 to 100 cyless, depending onstrain range), the cyclic frequency was slowed manually and hysteresisstress.strain loops were plotted.
5. When the logarithmic plot of cyclic load versus cycles deviated by20 percent from linearity, cycling was terminated and the furnace turnedoff. When cool, the apparatus was disassembled and the specimen removed.
Evaluation of failed LCF specimens was by optical and scanning electron microscopy.
6. EVALUATION METHODS
a. Optical Microscopy
Bulk specmens for optical microscopy were sectioned and moitnted in bakelita or ,poly.They were ground on silicon carbide paper (down to 600 grit), polished with 6. wid 1-microndJamond, and final polished on a Syntron vibratory machine with a water - 0.05-micronalumina slurry for one half hour. Polished samples were etched with a fresh solution of42 percent an.monlum hydroxide/16 percent hychogen peroxide (3 percent strength) - 42percent water (all volume percent), thfm rinsed with water. Any smut that rormed was gentlywiped off the wet mount wit4 a wet cotton bail, Samples were dried with compressed air.
37
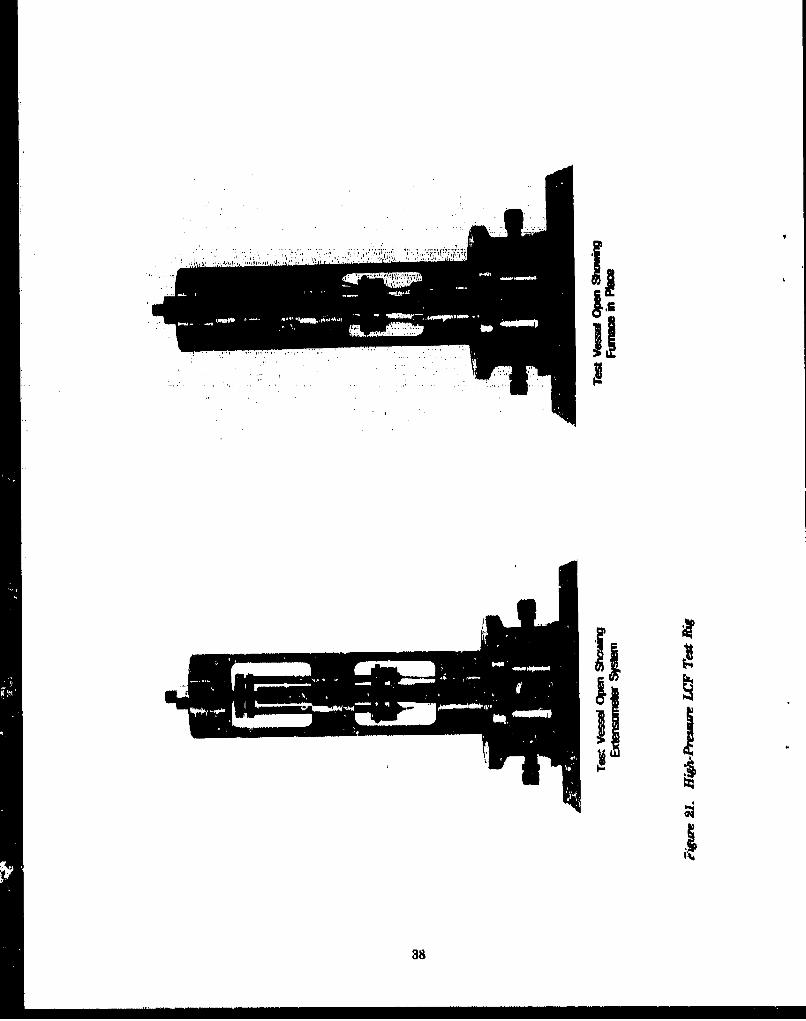
k~~-- A~. 1 'Nf...t~ -; 7 .... . . ,, .,-
t i,
iif
38
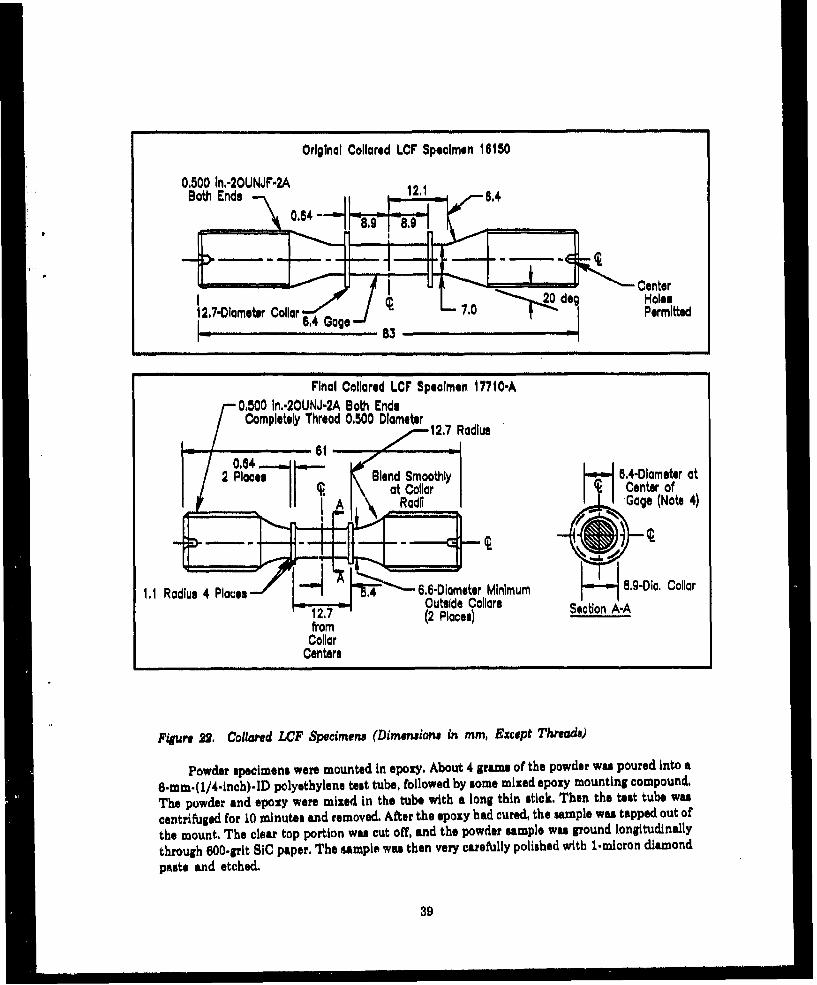
Original Collared LCF Specimen 16150
0.500 In.-2OUNJF-2A
Center200 do Holes'12.7-Diameter Collar 834 age____________ Permitted
Final Collared LCF Specimen 17710-A0.500 In.-2OUNJ-2A Both Ends
Completely Thread 0,500 Dlamete 27R adu
0.84-12 PIaco Blend Smoothly Ia'j6.4-Dlameter at
at Colla Center ofA~~~I Bln ai Gage (Note 4)
fro (2c R a cei )Colloar
Fl~~~u12, 22OoludtC pcmes(ie sidn e in lar mmio Exet hea
Powder specimens were mounted in epoxy. About 4 grams of the powder was poured into a6-mm. (1/4 -inch) -ID polyethylene test tube, followed by some mixed epoxy mounting compound.The powder and epoxy were mixed In the tube with a long thin stick. Then the test tube wasncentrifuged for 10 minutes and removed. After the epoxy had cured the sample was tapped out ofthe mount. The clear top portion wasn cut off, and the powder sample was ground longitudinallythrough 600-grit SIC paper. The sample wus then very carefully polished with 1-micron diamondpetste and etched.
39

TABLE 12. LOW-CYCLE FATIGUE TESTS PBRFORM~ED
7mtC- (IMP0) TwutAU- Candwt~n opednwn as 1.8% 0.75%
NARA-Z Aak-receled 17710-A 2 2996 CWCAR-1 16150 1996 CWCAR-2 11710-A I 1W6 All 16180 9 1 1
ON6 At 17710-A 1 1906 HWSA 17710-A 1 21069 HC 17710-A 1 21066 A 17710-A 19
optical evaluation of hot-vacuum-compacted powder samples for contamination wasconducted at 100X moqntlfetion on an etched surface. Rateable inclusions were defined as thoseexhibiting an area at 10OX magnification equivalent to that of a 3-mm-(1/8-inch) -diametercircle. Metallic and non-metallic-appearizlg inclusions were counted separately and normalized to-give the number of inclusions per square inch.
b. Scenning Electron Microscopy end Electron Microprobe
Scanning electron microscopy was conducted using ETEC Autoscan and Amray scanningelectron microscopes (SBMs), and a JEOL 738 8uperprobe mioroprobe. Specimen preparationwee as above, except for test specimen fractures, which were examined as-is or With an ethanolultrasonic cleaning. Both secondary electron end backscattared electron image modes were used.When needed, specimens were sputtered with gold (primarily powder specimens). Electronmicroprobe analyses were performed in a JEOL 733 Superprobe. Both wave-dispersive andenergy-dispersive systems were used.
a. Transmission Electron Microscopy
Carbon extraction replicas were obtained from heavily etched samples prepared asdescribed above. Acetone and acetyl cellulose replica tape were applied, allowed to dry, and thenpeeled off. The replica surface, was coated with citrbon, and then shadowed with chromium, in aDenton vacuum evaporator. The replica was trimmed and placed on a grid. The tapie wasdissolved in hot refluxed acetone and then the replica wee dried.
Foil specimens were prepared from 0.5-mm.(0.020-inch)-thick slices cut with a low-speeddiamond saw. The slices& were ground to 0.15-mm..(0.OO6..inch)-thick on 600-prit silicon carbideSiC paper, then punched out Into 3-mm disks. The disks were Jet thinned In a South BayTechnology Jet thinner uning an electrolyte of 20 percent nitric acid in ethanol, at -15'0.
Consolidated MIT flake mat~evial (Appendix 2) was thinned for transmission electronmicroscopy (TEM) by ion milling Jet-polished disks in a Gatan Dual-Beam Ion Mill. Two beamswere used, at 20-degree incidence: each beam was set to yield a 6 kV gun voltage, a 0.6 mAcurrent, and a 27-microamp specimen current. Vacuum was at 7XIO-1 millitorr.
Replica and foil specimens were evaluated in a Philips EM 400 scanning transmissionelectron microscope (STEM).
40

d. Hardness Testing
Mictohardness was determined using Zwick and Clark DMH2 testers with pyramidicalindenterm and using loads of 10 to 1000 g, Diamond pyramid hardness numbers resulted. Sampleswere mounted in epoxy.
Rockwell hardnesses were determined using a Wilson Rockwell Hardness Tester on the Band F scales. Most samples were mounted in epoxy. Rockwell hardneues were converted todiamond pyramid hadnesues using the chart for copper alloys found in Reference 15.
e. X.Ray Diffraction Analyses
Lattice parameter and phase identification studies were performed on a Philips horizontal
diffractometer with a curved graphite monochromator. Copper and cobalt x.ray tubes were used.
f. Chemical Analyses
Bulk chemical analyses wefe performed using electron microprobe techniques (above) andan inductively coupled plasma atomic emision spectrophotometer (ICP.AES), ICP.AESanalyses were performed on NASA-Z, Ammire, ar.0 Alloys 992 through 999, using milled chips forthe first two and atomized powder for the rest. Tad alloys and appropriate standard elementalswere dissolved in nitric acid (0.15 gram alloy in 20 ml concentrated acid, then diluted to 1000 ml).Silicon was dissolved by adding a bit of Hf. The solutions were analyzed in an ISA JY38ICP.AIBS. Wavelengths used were as follows.
Elemnents Wavelongth. (Nm)
Ag 328.088, 338.316Zr 339.224, 343,M0Hf 264.146, 273.884Si 251.626, 288,176Al 394.436, 396.182
Oxygen analyses were performed on NASA-Z and Alloys 992 through 999, using a LocoTC36 Nitrogen-Oxygen Determinator with 0.5-gram samples.
A carbon analysis was performed on Alloy 999 using a Leco C846 Carbon/SulfurDeterminator. Hydrogen analyses were performed on the MIT materials using a Laco RHiHydrogen Determinator.
Analyses of Alloy 992 and 993 powder water content were performed by measuring the
weight loss of drying powder in a Dupont 951 Thermogravimetric Analyzer, under helium,Sample sizes of about 50 mg were heated to 5500C at 5C/minute.
Oil analyses were performed on Alloys 992 through 999. A 50-gram powder sample waswashed three times in 30 ml of freon for ester oils, or carbon tetrachloride for mineral oils. Thesolvent was then evaporated to 25 ml and analyzed In an infrared spectrometer at wavelengths of3200 to 2800 cm-1 for ester oils and 1800 to 1650 cm- 1 for mineral oils. The results were comparedto those of standard solutions.
41

SECTION IIIALLOY SCREENING
The alloy screening study wu undertaken to evaluate the potential of a large number ofalloy systems. Alloys were chosen from several families of systems,
The fist types were those that form elemental and copper-: precipitates from solution Incopper, such as Cr, CuZr, Ag, Nb, and others having low solid solubility in copper. These alloyswere formulated at concentrations that straddled the solid solubility limits of the constituents incopper. The dilute alloys were intended to be fully solutionable and used for age-hardeningstudles. The concentrated alloys were intended for studies of the effects of rapid solidification, inwhich cane the excess insoluble constituents would form dispersions of primary precipitates thatmight be fine enough to contribute to strengthening and stabilization of the microstructure atelevated temperatures.
The second class of alloys were formulated to produce precipitates or dispersions of stablecopper-frte intermetallic compounds. Compounds wern chosen that either had high meltingpoints (and thus might be stable), or were cubic and had lattice parameters not very differentfrom that of copper (and thus might resist coarsening at high temperatures), Alloys wereformulated to produce about 2 volume percent of thes compounds. The constituents were notnecessarily of low solubility- it was believed that if stable enough in copper, the compounds mightform rather than dissolve in copper.
The third type of alloys were formulated to produce dispersions of metal-borldes uponsolidification (the metal not being copper). High-melting-point borides wen preferred. Generally,borides of metals having low solid solubilities in copper were preferred, so that any excess ofboeide former elements (due to boron losses) would precipitate rather than remain In solidsolhition and adversely affect conductivity. However, some high-solubility boeide formers, such astitanium, were evaluated in the belief that if effective, ways could be found to adjust meltingpractlces to compensate for boron losses and maintain high conductivity. Usually, alloys wereformulated to produce about 2 volume percent of borideL Alloys were foreulated withstoichiometric amounts of boron and the reactive metal, and sometimes also formulated withexcess or insufficient boron to assm off-stoichiometric effects (which were found to besignificant on earlier Fe-Al + TIBl alloy programs (16)). Alloys were evaluated in thecon-antionally cut + proeassed and the rapidly solidified ý processed conditions.
Another class of alloys was formulated to produce dispersions or precipitates of copper-freesilicides. Silicides have found use in other alloy systems as strengtheners and microstructuralstabilizers. High-melting-point sulicides composed of copper-soluble elements were chosen forthese studies. Silicide concentrations were set at 2 volume percent.
All of the screening alloys were melted under argon in a \later-cooled arc-melting device,using a tungsten electrode. Buttons were turned over and remelted at least once to promotehumogensity. Subsequent processing was tailored to allow evaluation of age-hardenability,recrystallization resistance, and adaptability to rapid solidification processing.
Rapidly solidified samples were prepared by pashig an electron beam across buttoisselections. This had been used successfully in the past to develop structures similar to rapid-solidification-rate (RSR) powder. It is superior to melt spinning because it produces s.consolidated sample upon a substrate that can be worked conveniently, whereas ribbons mustfirst be consolidated. This working step was considered important, since some rapidly solidifiedstructures become thermally tustable if deformed. Since rapidly solidified copper alloyspresumably would be hot-consolidated to make hardware, structural stability under someregimen of hot strain was important.
42

Not all of the screening alloys were electron-beam processed. Only those that were expectedto form insoluble dispersions were considered for rapid solidification. Of those, some were notprocessed because conventional processing showea that the aging precipitates had littlehardening effect: thus, primary precipitate dispersions would be no more beneficial.
Initial trials showed that rapidly solidified electron-beam passe in copper-zirconium alloysproduced structures finer than those found in atomized copper-zirconium alloys produced priorto this program. This validation served u the basis for subsequent electron-beam processing ofscreening alloys,
Electron.beam-processed structures were much finer than as-cast structures (Figure 23). Asa result, deteation of recrystallization in electron-beam-processed zones was sometimes difficult,Recrystallisation was not discussed in such cases in the following narrative.
1. FIRST-ITERATION SCREENING RESULTS
One major iteration of screening alloys (CB 1 . 37) was evaluated prior to the selection ofcompositions for the first atomization campaign. The alloy sy-t'oms examined were based on themost promising systems described In the literature survey: copper-zirconium, copper-chromium,copper-sliver, copper-hafnium, and copper-metal diboride.
a. Coppor-Zlronlum
The copper.zirconium system was chosen because it has served as the basis of zirconiumcopper (0.16 percent zirconium), one of the most sotening-resistant commercial high-conductivi.ty copper alloys available. In addition, the system served as a basis of sorts for NASA-Z andNARloy-Z".
Three concentration levels of zirconium were studied: 0.2 percent, 0.4 percent, and1.0 percent. None exhibited significant hardness or microstructural change when aged at 370 to605'C (700 to 12007) or annealed at 650OC (1200%") after solution treatment. This wasexpected. When processed by solution treatment + 40 percent cold rolling, subsequent aging at370'C (700F) and 480'C (900'F) produced Insignificant changes in hardness or microstructure.However, aging at 650'C or annealing at 650'C after any aging cycle resulted in completerecrystallization and softening. In conventionally processed material, varying zirconiumconcentration only affected grain size, reducing grain size with increasing concentration.
Significant rapid solidification and concentration effects were observed in the supersaturat-ed copper-zirconium alloys. As-solidified sumples exhibited higher hardneues than conventionalcast and solutioned materials. In addition, annealed hardnesses were higher for the rapidlysolidified + cold-worked conditions than for the cast + solutloned + cold-worked + agedconditions. Hardnesses were higher for the rapid-solidification-processed Cu-i.0%Zr alloy thanfor the Cu.0.4%Zr alloy.
The rapid-solidification-processed copper.zirconium materials exhibited finer microstruc.tures than the conventionally processed materials (Figure 24); both u-solidified and afteradditional processing. Whereas conventionally processed supersaturated alloys exhibited pri-mary precipitates of about 8 g&m (80,000 A), the rapidly solidified primary precipitates were onthe order of 1,000 to 5,000 A. Some primary precipitates or dispersions in cold-worked +annealed rapidly solidified copper-zirconium material are shown in Figure 25.
43

9944t Arx;Oi lý
44b

L-j10 JAM Are Cast 1o g.m Electron-Seam Pass
Figure 24. Microatructiural Refinement in CU.194Zr (CB-7) byp Electrun-Beam Processing(optical)
Figure 25. Precipitates and Primaiy Dispernajon in Electron-Beam-Proceaaed + Cold-Worked + Overaged Cu-l.O%Zr (CH-7) Alloy (WMu Replic'a)
45

X-ray diffraction studies supported the findings of Phillips (17) that the precipitate in thissystem was a face-centered cubic (FCC) CugZr compound. In the present study, a latticeparameter of 6.88 A wa measured for this compound.
Generally, studies demonstrated the ability of rapid solidification to disperse excesszirconium in copper-zirconium alloys, resulting in harder and somewhat more stable structuresthan then obtainable by conventional processing. However, Cu Zr dispersions in processedeletron.beam welds were coarser than desired: 1,000 to 5,0O0 1, versus the 200 to 500genorally accepted as necessary for strengthening.
Is. Copper-Chromlum
Several copper-chromium alloys were studied in the first screening Iteration. Later,additional alloys (CB 48-46) were studied for confirmation because of possible elemental losses inthe earlier alloys, The results of both sets of alloys generally agreed and are combined here.
Copper-chromium alloys were processed similarly to the copper-zirconium alloys, Whensolutioned, these alloys ap-hardened significantly at 480'C (900•F). When solutioned + coldworked, subsequent aging at 480'C produced slight hardening, but aging or annealing at 660'C(12001F) recrystallized the alloys. Only the 0,2 percent chromium alloy recrystallized (partially)at 4800C. Grain alse was finest In the 1 percent alloy.
Unlike with the copper-zirconium alloys, electron-beam processing of copper-chromiumalloys resulted in no hardness increase. But, the cold-worked electron-beam-processed materialdid not recrystallize when annealed at 650C. The rapidly solidified (electron-beam-processed)structures were much finer than the conventional structures. However, the dispersions(chromium) In the rapidly solidified materials were covaer than desired: 1,000 to 6,000 A(Figure 26).
Copper-chromium alloys were found to be highly age-hardenable in the solutionedcondition, but only slightly age-hardenable after cold working. Rapid solidification processinggreatly increased the recrystallization resistance, but not the harchies., of these alloys. As withthe copper.zirconium system, rapid solidification dispersions were coarser than desired,indicating that chromium was not sufficiently stable for use u a high-temperature dispersion Incopper.
0. Copper-sliver
The copper-silver system was evaluated because it served as the basis for NASA-Z andNARioy-Zm'; large amounts of silver can be added to copper without significantly loweringconductivity, and silver should impart precipitation hardenability, One to 5 percent silver wasadded, the higher concentrations allowing precipitation reactions. The alloys were only processedconventionally, since excessively high concentrations were needed to reach supersaturationlevels.
The alloys age-hardened only slightly. Annealing solutioned + age-hardened material didnot appreciably change hardness or microstructure. When cold-worked, subsequent aging orannealing at 480"C (9001F) or above resulted in recrystallization and softening.
46

'MI .
Figure 26, Dieprsiorna or Precipitates in Electron.Beam + Cold-Worked + AnnealedCu.s.1O%Cr (CB-23): TEM Replica
Precipitation in the 3 percent and 5 percent siliver alloys warn discontinuous, inward fromthe grain boundaries, as noted in the literature (18, 19, 20), This was most pronounced at higheraging temperatures, and is shown In Figure 27. Grain size decreased with increasing silverconcentration up to 1 percent,
These results suggested that binary copper-silver alloys would not have promise because oftheir low age-hardmnability and tendency toward discontinuous precipitation.
d. Copper-Hafnium
Several literature citations suggested that the copper-hafnium system could have promiseas a base for a thrust chamber alloy (21). Thus, copper-hafnium compositions on both sides ofthe solubility limit were evaluated (CH 34, 35). The alloys were expected to form Cu6Hfprecipitates or dispersions.
Aging of these alloys produced slight hardening. When solutioned + cold-worked, thesealloys recryst~allized only when extposed to 650'C (12000F) (where they fully softened).
47

L__jI AM
Figure 27. Diecontinuou# Precipitation in a Cu-S%Aj AUoy (CBE., Solutioned + Aged):SEM
Electron-beam passes significantly refined the microstructures (Figure 23) and hardenedthe materials somewhat, The electron.beam-procesud + cold-worked condition recrystallized at650C. Dispersions up to 4,000 A in size were formed, after annealing.
The copper-hafnium alloys were not significantly harder or more stable than copper.zirconium alloys. They responded to rapid solidification, but recrystallization resistance was notimproved. Age-hardening was not as great as expected.
e. Copper.Zlronlum.-llver
Interest in this system was based or the accepted use of NARloy-Z'T and NASA.Z(Cu-3%Ag.0,5%Zr) and on the potential of combining the benefits of zirconium and silveradditions. Two alloys, Cu.3%Ag.0.5%Zr and Cu-1,5%Ag-0.2%Zr, were made. The former waschosen because it is the same as NARIoy-Z and NASA-Z; the high zirconium level shouldproduce an insoluble dispersion upon rapid solidification; the silver might allow precipitationhardening, The latter composition was chosen because it seemed sensible to lower silverconcentration to avoid any chance of discontinuous precipitation (seen in the binary copper.silver alloys), and to determine the need for the high zirconium level in the conventionallyprocessed form of the alloy.
After solutioning, both alloys exhibited some age-hardenability, with the NASA-Zcomposition hardening more (Table 13). Only 650'C (1200T) aging or annealing recrystallized(and softened) the solutioned + cold-worked (+ aged) alloys.
48
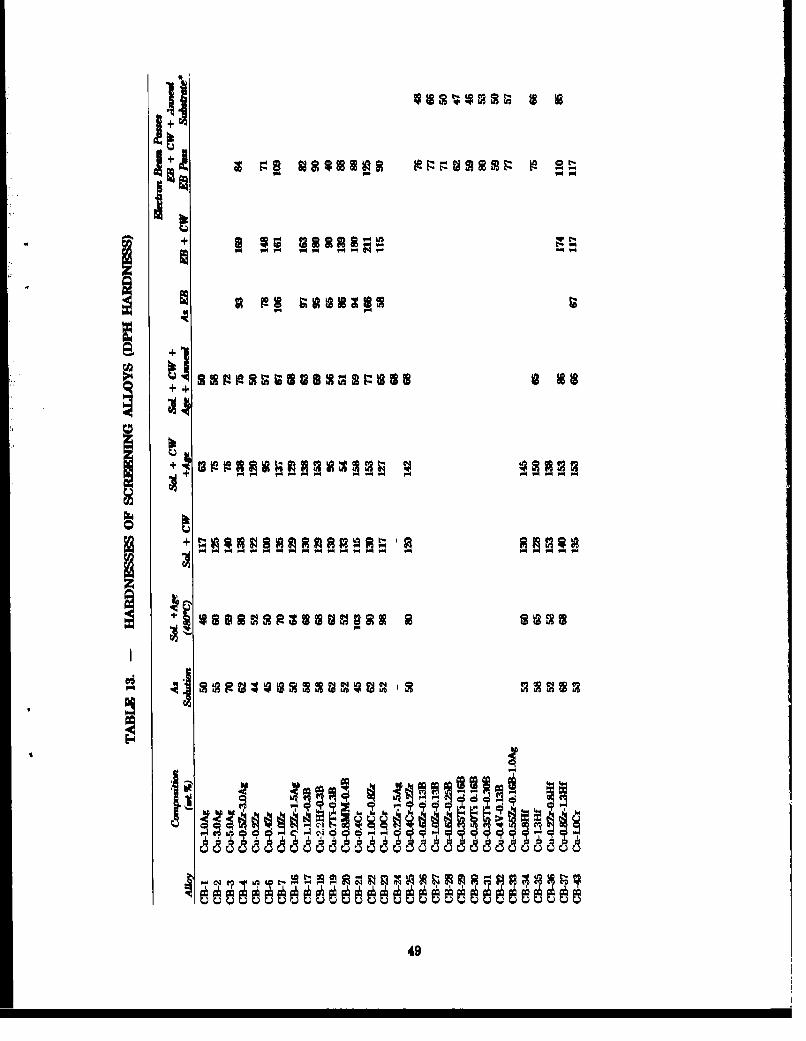
+ ie - r- m t
+
499
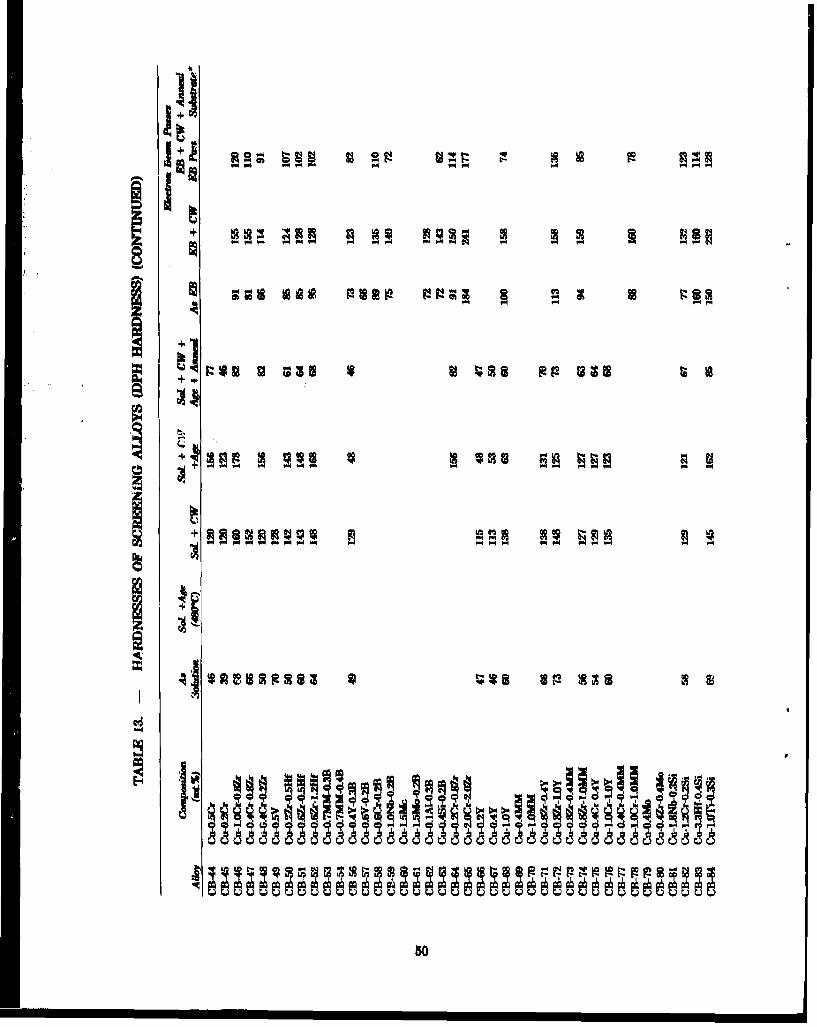
cnP4 W4
I
+~
05
iI
III
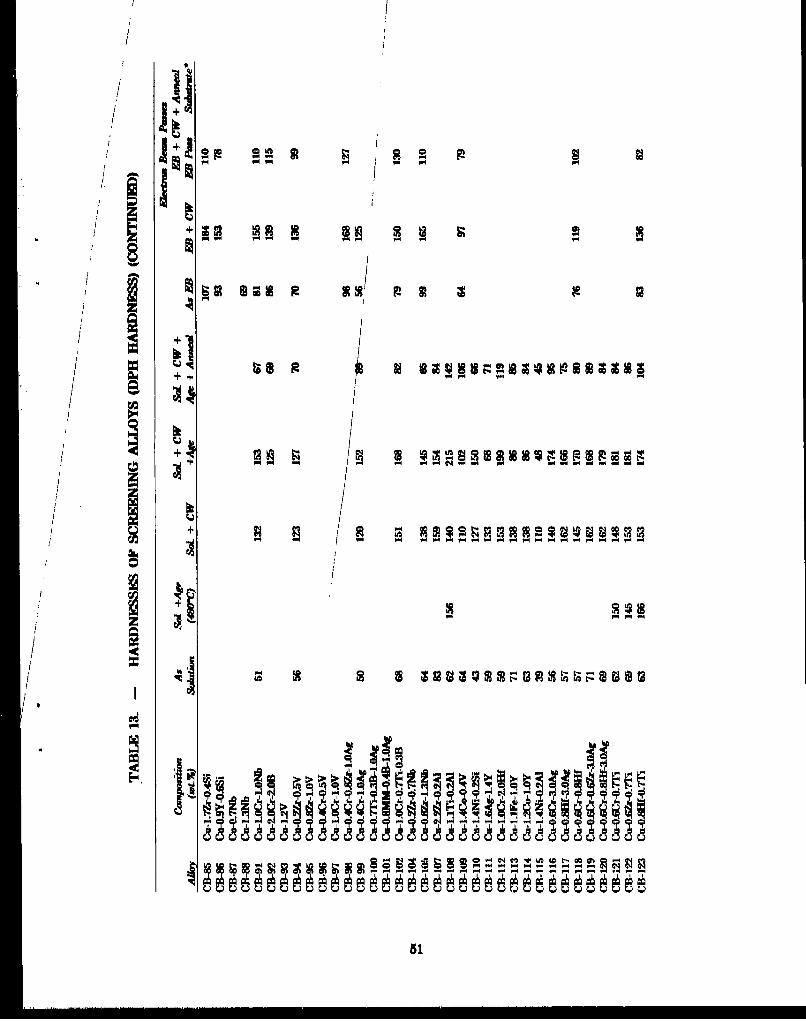
ptSwla919
:: :: :Iro
51

III S
IP-��-�-----
! �
I0
�
N
.1
52
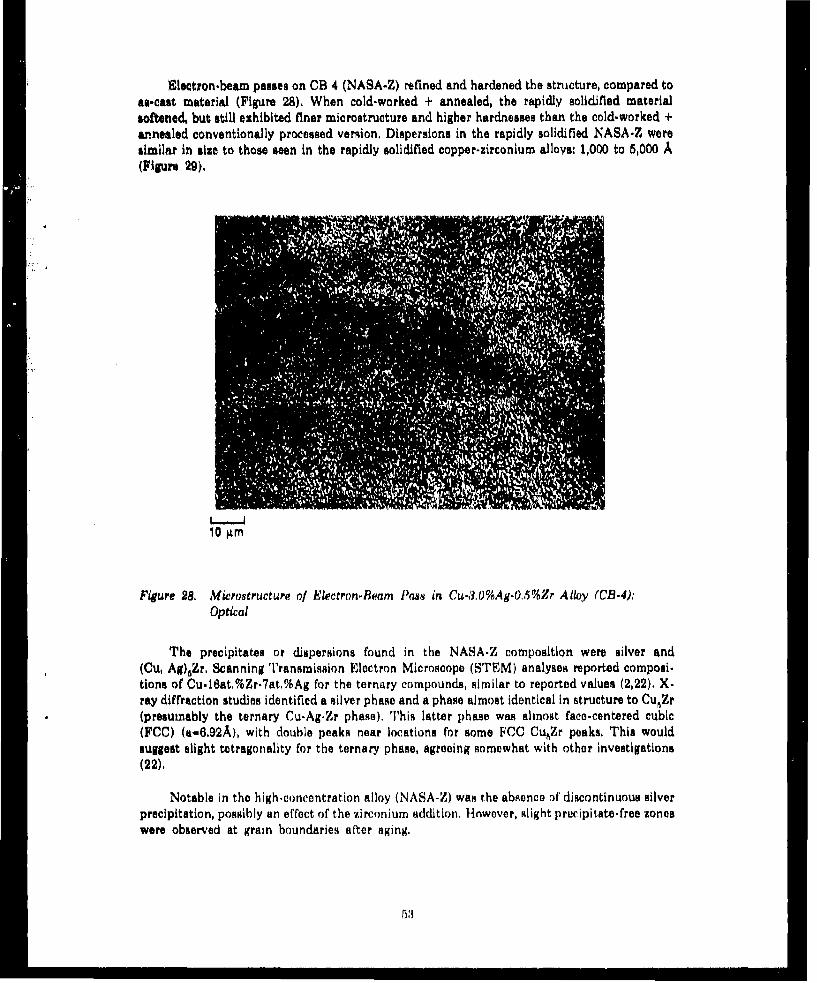
electron-beam passes on CB 4 (NASA-Z) refined and hardened the structure, compared toas-ecast material (Figure 28). When cold-worked + annealed, the rapidly solidified materialsoftened, but still exhibited finer microstructure and higher hardnesses than the cold-worked +annealed conventionally processed version, Dispersions in the rapidly solidified NASA-Z weresimilar in size to those seen in the rapidly solidified copper-zirconium alloys: 1,000 to 5,000(Figure 29),
10 gm
Figure 28. Microstructure of Electron-Beam PIss in Cu-.3,0%Ag.O-5%Zr Alloy (CB-4):Optical
The precipitates or dispersions found in the NASA-Z composition were silver and(Cu, Ag)5Zr, Scanning Transmission Electron Microscope (s'l'EM) analyses reported composi.tions of Cu-16at,%Zr-7at,%Ag for the ternary compounds, similar to reported values (2,22). X-ray diffraction studies identified a silver phase and a phase almost identical in structure to CuZr(presumably the ternary Cu-Ag-Zr phase). This latter phase was almost face-centered cubic(FCC) (a-6.92A), with double peaks near locations for some FCC CuZr peaks. This wouldsuggest slight tetragonality for the ternary phase, agreeing somewhat with other investigations(22).
Notable in the high-concentration alloy (NASA-Z) was the absence of discontinuous silverprecipitation, possibly an effect of the zirconium addition. However, slight precipitate-free zoneswere observed at grain boundaries after aging,
53

2 pnm I Am
Figure 29. Precipitates and Dispersions in Cu-3,0%A9-O,5%Zr After Electron.BearnProcessing + Cold-Working + Annealing (CB&4): TEM Replica
Higher concentrations of zirconium and silver refined grain size in conventionally-processed forms. Some abnormal grain growth was observed in the dilute alloy; none wasobserved in the NASA-Z button.
Rapid-solidification processing war found to refine and harden copper.zirconium-silveralloys. The age hardenabilities of the alloys were not great, and they recrystallized easily at660'C (1200F). Therefore, their superiority to copper-zirconium alloys was not obvious.
f. Copper-Zirconium-Chromium
The copper.zirconium-chromium system has been noted in the literature as having superiortemperature resistance and as being very age-hardenable (23, 24, 25). Several compositions wereinvestigated: two in the first iteration (CB 22 and 25) and five in the second iteration (CB 46, 47,48, 64, 66) for confirmation (chromium losses were suspected In the first lot; all are discussedhere), The alloys were formulated to straddle the solubility limits of the copper-zirconium andcopper-chromium binary systems (0.15 percent zirconium and 0.65 percent chromium (26, 27)),in various combinations,
Conventionally processed solutioned alloys were found to be age-hardenable, increasing onaverage from diamond pyramid hardness (DPH) 55 to DPH 85 (Table 13). The cold-workedforms age-hardened only slightly. More significant, however, was the tendency for these alloys toresist recrystallization at 650'C (1200'F) after solution + cold work i- age. Only partialrecrystallization and softening was observed, especially for the second-iteration lot of alloys.Stoichiometric effects (Zr:Cr ratio) were not significant.
54
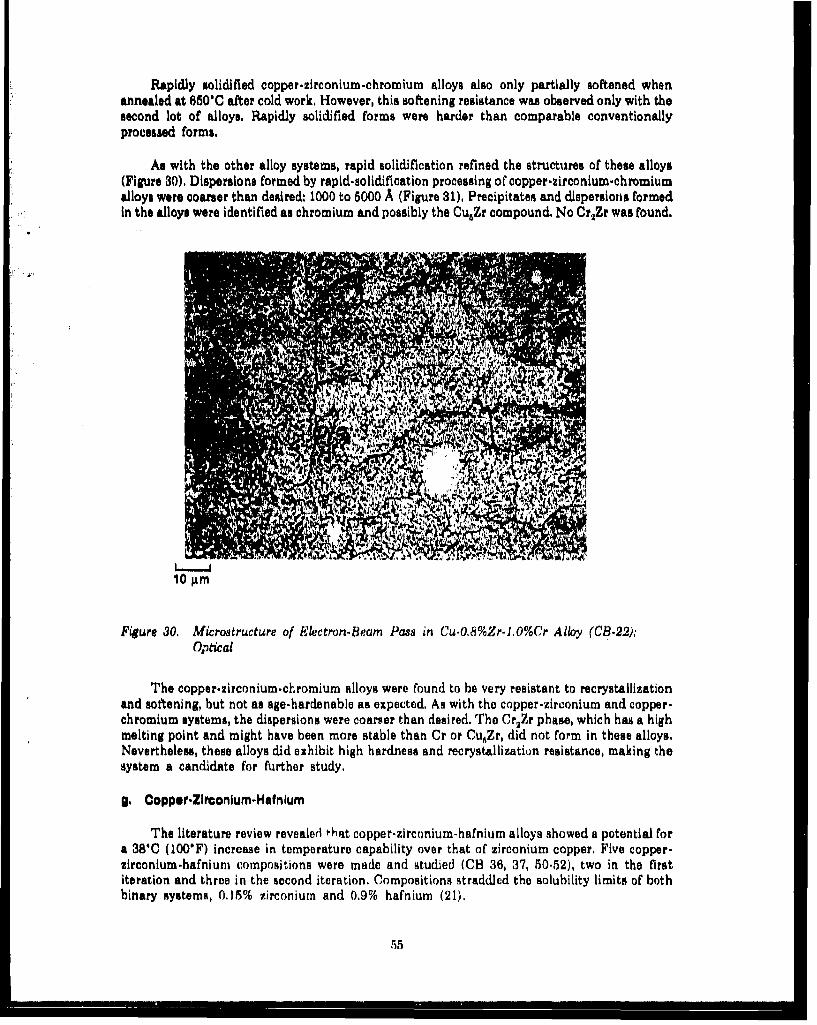
Rapidly solidified copper.zirconium -chromium alloys also only partially softened whenannealed at 650'C after cold work, However, this softening resistance wu observed only with thesecond lot of alloys. Rapidly solidified forms were harder than comparable conventionallyprocessed forms.
As with the other alloy systems, rapid solidification refined the structures of these alloys(Figure 30), Dispersions formed by rapid-solidification processing of copper-zirconium.chromiumalloys were coarser than desired: 1000 to 5000 A (Figure 31), Precipitates and dispersions formedin the alloys were identified as chromium and possibly the Cu5Zr compound. No Cr 2Zr was found.
10 Am
Figure 30. Microstructure of Electron-Beam Pass in Cu-O,8%Zr-1,O%Cr Alloy (CB-22):Optical
The copper.zirconium.chromium alloys were found to be very resistant to recrystallizationand softening, but not as age-hardenable as expected. As with the copper-zirconium and copper-chromium systems, the dispersions were coarser than desired. The Cr2Zr phase, which has a highmelting point and might have been more stable than Cr or CuZr, did not form in these alloys.Nevertheless, these alloys did exhibit high hardness and recrystallization resistance, making thesystem a candidate for further study.
g. Copper-Zlrconlum-Hafnlum
The literature review revealed that copper-zirconium-hafnium alloys showed a potential fora 38'C (100'F) increase in temperature capability over that of zirconium copper. Five copper-zirconium-hafnium compositions were made and studied (CB 36, 37, 50-52), two in the firstiteration and three in the second iteration. Compositions straddled the solubility limits of bothbinary systems, 0.15% zirconium and 0.9% hafnium (21).
55

2 pim
Figure 31. Dispersions in Cu-l.O%C~rO.05%Zr (CB-22) After Electron-Beam + Cold-W'w.4 +Anneal Processing. TEM Replica
The age hardenability expected from the literature review was not realized with thesealloys, They were only slightly more age-hardenable than the copper- zircoonium alloys, goingfrom DPH 52 to DPH 58 (CBa 3(i), Theit resistance to recrystallization was about the same asltha~t of copper.zirconiurn alloys, After solution + cold work, the alloys recrystallized only at680*C (1200*F).
This system did respond well to rapid solidification. The rapidly solidified regionsi weremuch harder and liner in mnicrostr-ucture than the cast regions (Figure 32). C old-worked electron-bw..n passes did not appear to recrystallize when annealed at 650'C, and softened only slightly,providing much better resistance than that of the copper -zirconium system. However, thedispersions were relatively coarse,
The precipitates and dispersions forming in these alloys were found to be about 13at.%I-i+Zr-- 87&t.% Cu. probably Cu,(Zr, HO) (i.e.. CuZr with hafnium substituting for some of thezirconium),
h. Copper + Borldem
Pratt & Whitney has extensive experience in enhancing properties of iron-aluininidesthrough the additions of TiB2 dispersions by rapid solidification, Such dispersions have beenabout 200 to 1000j A in size, depending on processing, and have been '%ery effentive h stabilizingmnicrostructures tit elevated temperatures. Application of this concept to copper alloys wasundertaken through the study of TiB2, HfB,, ZrB2, and miaichmetal-R, (MMB.) dispersions in
56

copper. The TiB, composition was a direct outgrowth of the iron-aluminide work. The HfB, andZrB, compounds were used because of the low solubilities of hafnium and zirconium in copper,allowing retention of conductivity In the event of boron louses. The MMB6 compound was used toevaluate another type of reactive metal borids.
Boride-containing buttons (CB 17 to 20) were melted from copper, boron, and stolchiomet-rio amounts of the appropriate reactive elements. Resulting microstructures consisted of coppermatrices containing randomly dispersed coarse I - 5 pm borides and, in all cases but Cu.TiBl, athird phase comprised of the reactive metal and copper (CuZr, CuHf, CuMM), Figure 33.(Evidently, some boron was lost through melting.) The presence of ZrB,, TiBE, HIB,, MMB&, andCuMM was confirmed by x-ray diffraction,
Conventional processing of theme a&loys revealed low recrystallization resistance (except inalloys with an exces of hafnium or zirconium). However, the as-cast boride dispersions were toocoarse to impart softening resistance. The coarse MMBG borides appeared very unstable.
Rapid-solidification (electron-beam) and subsequent processing of diboride-containingalloys resulted in dispersions such as those shown in Figure 84. The boride dispersions weretrimodal: a fine 200 to 500 A fraction, a 1000 to 3000 A fraction, and a very coause 1 pm fraction.The coarse dispersion was believed to be a result of incomplete borids dissolution duringelectron-beam processing (i.e. borides left over from buttons). The fine dispersion was believed todemonstrate the fundamental stabilities of the diborides. All diborldes exhibited essentially thesame stabilities,
Hardening and stabilizing effects of the dispersions were slight. The minimal effects wereattributeW to the nonideal dispersions.
Efforts were made to establish whether the coarse borides formed In the melt or uponsolidification. These efforts involved the use of melt spinning to melt the alloys in a controlledfashion, and to rapidly solidify the alloys. Melt spinning allowed melt temperatures to bemeasured via an infrared thermometer, whereas the arc melting and electron-beam processes didnot allow realistic melt temperature determination. Melt spinning was believed to givesolidification rates as high as powder atomization or electron-beam processing. It was believedthat the presence of very coarse borides in the ribbon would result from solubility problemsrather than formation during solidification, and that variance of the melt temperature and dwelltime (maore easily controlled in this device) might yield clues to the elimination of this problem.Sections of CB 26 (Cu-0.6%Zr.0,13%B) were melted in the device and spun off a copper disk inthe form of ribbon, using the parameters listed in the procedures section (Table 3).
Evaluation of the ribbons (Figure 35) showed the existence of coarse borides, with littledependence on varying melt temperatures from 1093% to 1650"C (2000 to 3000F). The boridesappeared as coarse as those seen in the arc-melted buttons, and thus were believed to havenucleated in the melt. It appeared that melt temperatures nearer the melting points of theborides would be necessary for their solution in copper.
Electron-beam and melt.spinning trials indicated that slight amounts of MB2 borides couldbe dissolved in mIten copper, be finely dispersed by rapid solidification, and resist coarsening atelevated temperat.es. However, boride additions on the order of 2 volume percent wouldnucleate borids. in the melt. The only methods that might avoid this problem were 1) high melttemperatures above 1650'C (3000'F), and 2) late additions of boron and/or the reactive metalimmediately prior to rapid solidification.
57

IV
IL
*~ Cx r-. . A 6, *%.,
58

10 g.m
Figure 33, Borides (Center) and Cu-Zr Intermetallic Phase Formed in CB-17 Arc Casting(Optical)
2. SECOND.ITERATION SCREENING RESULTS
The second iteration of screening alloys had several goals: to produce more homogeneouschromium-containing alloys; to find dispersable intermetallic compounds that, through onemechanism or another, were stable and rliiely dispersed throughout processing and use; and tofind borides that could be finely dispersed via the RSR process and remain finely dispersedthrough processing and use.
Improvement of chromium-containing button quality was attained with better processcontrol in a new arc-melting device. Also, the use of carefully prepared copper-chromium masteralloys (about 15 percent chromium) greatly minimized chromium sgregation during arc melting.These techniques were used on the second-iteration chromium-containing alloys di.icussen in thelast section.
5 i9

Fine Vey CoarseCu + HfBW Cu + TiB,
(TrM Repllca) (SEM)
Figure 34. Fine and Coasae Borides in B1ectron.Beam Passes
Two approaches were taken for the application of intermetallic phases as strengtheners incopper. One approach was the use of untried (or previous!y uncombined) elements or Cu-Xcompounds that precipitate from solid or solidifyring copper, in manners similar to those ofchromium and zirconium. New systems used additions of vanadium, mischmetal, yttrium,titanium, and niobium to either copper or first.iteration alloy systems, The approach involvedadditions to form copper-free intermetallics that would, by virtue of high melting points or lowlattice mismatches with copper, be stable at elevated temperatures, The specific compounds aredescribed later.
A number of alloys were formulated to produce metal borides of various stabilities (based onboride melting point) in an attempt to find borides that were dispensable by rapid solidificationyet stable in copper at elevated temperatures.
Finally, some alloys were formulated to produce high-temperature silicides that mightstrengthen copper by remaining stable in copper at elevated temperatures.
60

JI'r
10 AM
Agure 35. Presence of Very Coarse Bordias in Repreasntative Cu-Zr-B (CB.26) Melt.SpunRibbon
For the second Iteration of screening alloys, processing was abbreviated by eliminating thesolution + aged (and subsequent) conditions, so as to accommodate the large numbers of alloysbeing evaluated. Significant age-hardenability was discerned from the results of a post-cold-work480C (900T') aging step. This was believed valid, insofar as those alloys that would be useful atB50'C (1200'F) or higher should be able to resist recrystallization during a 480'd age followingcold work. Results of the second alloy screening iteration are described below.
a. Copper.Niobium
The copper-niobium phase diagram allows for solid-state precipitation reactions similar tothose of copper.chromium. Based on this, copper.niobium alloys (CB 87 and 88) were formulatedstraddling the niobium solubility limit of 1 percent niobium (27).
When conventionally processed with cold work, the alloys recrystallized upon aging at480C (900F). The recrystallization resistance was so low that hardnesses were not measured.
In the rapidly solidified + cold-worked conditions, the 1.3 percent niobium alloyrecrystallized upon annealing to such an extent that the weld could no longer be found. The as-solidified hardness was low,
Niobium did not show potential as a hardener of copper, at least alone or at theconcentrations investigated,
61
d. Copper-Niobium-Zirconiuum
Mandinlo ot al (28) found that niobium additions helped strengthen and stabilizezirconium copper. For the present program, copper.niobium-zirconium alloys (CB 104 and 105)were made straddling the binary solubility limits of 1 percent niobium and 0.15 percentsimonium,
When conventionally processed, the alloys were no more stable than zirconium copper.Both alloys recrystallized and softened when annealed at 660'C (1200F) after solutioning + coldwork + agin. Alloy CB 105 age-hardened very slightly at 480C (9001F) after cold working.
Rapid solidification refined the structure, and hardened the material orom DPH 65 to DPH99. The electron-beamr.procned material softoned when annealed at 6O0"C after cold work.These alloys did not appear to ofher advantages compared to copper-zirconium alloys.
o. Copper-Niobium-Chromium
Copper-nIobium-chromIum alloys were also made (CB 64 and 65), straddling the binarysolubility limits of I percent niobium and 0.68 percent chromium.
When processed, performances wore very similar to copper-niobium-zirconium alloys:recrystallization and softening occurred upon 650C (1200'%) anneal (after solution + cold work+ ago), The cold-worked alloys age-hardened somewhat when annealed at 480'C (9007P).
When rapidly solidified, the alloys were finer and harder than comparable conventionallyprocessed alloys. After cold working, the alloys softened when annealed at 6501C. The stabilitiesof these alloys were about the same as those of copper-zirconium alloys.
d. CopperVsnaldum
Other investigations indicated that copper.zirconium.vanadium alloys might provide animprovement over zirconium copper (29). The copper-vanadium phase diagram suggestedprecipitation hardenability similar to that of copper-chromium. Thus, copper-vanadium alloyswere formulated, straddling the solid solubility limit (CB 49 and 98). When processedconventionally, with cold work, these alloys recrystallized at 650*C (1200F) and sometimes at4801C (900F). The 1.2 percent vanadium alloy (CB 93) oxidized catastrophically during solutiontreatment (it appeared that intordendritic vanadium oxidized and llqulfled, promoting furtheroxidation). Therefore, this system was not investigated further.
o. Copper-Zirconlum-Vanadlum
The copper-ziconium.vanadium alloys did not exhibit the catastrophic oxidation observedduring solution treatment of the copper-vanadium alloy. Two alloys were melted (CB 94 and 95),again straddling the binary solubility limits (0.15 percent zirconium and 0.7 percent vanadium(s0)).
When processed conventionally, the alloys did not exhibit age hardnabillty in thesolutioned + cold-worked condition, but did not soften during the 480'C (900'F) agingtreatment. The alloys recrystallized completely upon subsequent annealing at 650'C (1200,F).
In the rapidly solidified conditions, Alloy CB 95 was harder than in comparable cut +wrouSht conditions. However, the cold-worked alloy softened and recrystallized at 650'C.
The copper-zirconium-vanadium alloys resisted softening and recrystallization U well s,but no better than, copper-zirconium alloys. No benefits could be attributed to the vanadium
62
additions. The catastrophic oxidation observed with the copper-vanadium alloys was not seenwith the copper-zirconium.vanadium alloys. However, the possibility of oxidation reinforced theconclusion that vanadium additions to copper-zirconium alloys are not beneficial.
L. Copper-Chromlum-Vanadlum
Copper-chromium-vanadium alloys were formulated (CH 96 and 97), with concentrationsstraddling the binary iolubiUty limits of 0.65 percent chromium and 0.7 percent vanadium.
In the cost + solutioned + cold-worked + aged conditions, the alloys erystallized uponsubsequent annealing at 6500C (1200F) thereby exhibiting behavior equivalent to that ofcopper-chromium alloys.
As with the other alloy systems, electron-beam processing refined the alloy structures. Thecold-worked electron-beam passes recrystallized after the 650'C anneal, which again wasequivalent to copper-chromium alloys.
Overall, these ternary alloys exhibited softening and recrystallization esistance no betterthan that of copper-chromium alloys, so there were no obvious benefits derived from vanadiumadditions to the copper-chromium system.
9. Copper-MIsohmetal
When added to copper, the rare earths form Cu;X precipitates that might contribute tohardness or temperature resistance, CB 69 and 70 were mischmetal alloys (mimchmetal is a mixof lanthanum, cerium, and other rae earths). These alloys were melted and processed to evaluatethe effects of ran earth additions on copper.
The alloys were conventionally processed and found to recrystallize at 48000 (900'F) aftercold working (hardness was not measured). When electron-bum processed, the alloys wererefined, but they recrystallized during the 8504C (12000F) test anneal.
The addition of mlah metal did not appear to produce the softening resistance imparted byother additions such as zirconium, chromium, or hafnium. The CuGMM phase (whose presencewas confirmed for the copper-mischmetal-boron alloy) appeared to be a weak hardener of copperalloys.
h. Copper-Mlschmetal-Zlroonlum
Copper-mischmetal-zirconium alloys (CB 73 and 74) were formildated to straddle the binarysolubility limit of 0.15 percent zirconium, at 0.4 percent and I percent mischmetal.
When processed conventionally, cold-worked material recrystallized and softened uponexposure to 650'C (1200F). Cold-worked material did not age harden. Rapidly solidified samplesexhibited finer and harder microstructures than conveiionally processed conditions. Electron-beam-processed + cold-worked material fully recrystallized and softened when annealed at680'C. These results were similar to those of copper-zirconium alloys, leading to the conclusionthat the copper.zirconium system did not benefit from the addition of mischmetal.
I. Copper-Mlschmetel-Chromlum
This system was suggested by Nishlyama at al (31), who found that mischmetal adtlitionsImproved the softening resistance of chromium-copper. Based on these results, two copper-misch-metal-chromium alloys (CB 77 and 78) were formulated, at high and low concentrations.
63
When processed conventionally with solution treatment and cold working, the alloys(CB 77 and 78) recrystallized during subsequent aging at 4806C (900'F), whereas the copper.chromium alloys recrystallized at 660"C (1200F).
Electron-beam processing refined the structure substantially. However, the alloys alsorecrystalllred and softened when annealed at 650'C after elecron-beam processing and cold work.The addition of mischmetal to the copper-chromium system did not appear to be beneficial.
j. Copper-Yttrum
Yttrium forms a CulY precipitate that might produce hardening in copper, Alloyscontalning 0. percent, 0.4 percent, and 1.0 percent yttrium (CB 68, 67, 68) wen evaluated todetermine the strengthening effects of this precipitate. Conventionally processed alloys werefound to recrystallize and soften when aged at 480'C (9001F) after solution + cold work, however,The electron.biam processed alloys were harder, but fully softened and recrystallized whenannealed at $50C (12001F) after cold work, In general, these alloys performed no better thancoppor.mischmetal alloys, and much worse than copper-zirconium and copper-chromium alloys,
k. Oopper-Ytt#um-Zlmonlum
Addition of zirconium to copper-yttrium alloys (CB 71 and 72, with compositions straddlingthe binary solubility limits) brought the properties up to the levels of copper-zirconium alloys.Cold-worked conventionally processed forms of the alloys tasither age-hardened nor softened at4801C (9001F). They recrystallized and softened only at 6606C (12000F). Electron-beamprocessing hardened and refined the alloys, Annealing after rapid solidification + cold workingrecrystallized and partially softened Alloy CB 72. Hardness of the electron-beam-procesedalloys were slightly higher than those of copper.zirconium alloys, However, benefits of yttriumadditions to the copper-zirconium system were not sigpificant.
I. Copper-Yttrum-Chromium
To complete the study of yttrium systems, chromium was added to copper-yttrium alloys, Inamounts straddling the binary solubility limits (CH 75 and 76). These alloys did not eshibit Age.hardening in the solutloned + cold-worked + aged condition. They recrystallized only at 650"C(1200*F). Electron beam processing refined the microstructures. However, subsequent coldworking + annealing produced considerable disperslon coalescence (Figure 86). This phenome-non eliminated the alloy from further consideration.
m. Copper-Molybdenum, Copper-Molybdenum-Zlroonlum, Copper-Molybdenum-Boron
Work at MIT on dispersion of molybdenum in copper (32) prompted in-house trials,Available phase diagrams suggested that small amounts of molybdenum could be dissolved inmolten copper and dispersed upon solidification. These trails were not successful. Apparently,temperatures sufficient to dissolve molybdenum in copper could not be attained during arcmelting. The resultant buttons were not evaluated.
n. Copper-Chromium-Hafnlum
Both the copper-chromium and copper.hafnium systems were evaluated earlier. Theircombination was evaluated with alloy CB 118, formulated with chromium and hafnium levelsslightly above their binary solubility limits,
64

.4.I
'4iIIK
� 'ii4 III
II� I
When conventionally processed, the alloy hardened significantly when aged after cold work.The cold-worked + aged alloy softened and recrystallized upon annealing at 850'C (1200F).
Rapid solidification hardened the alloy and refined ita structure. Cold working furtherhardened the alloy and subsequent annealing at 650'C only slightly softened the alloy.
Microprobe analysis revealed a precipitate composed of about 89at.%Cu.lat.%Cr-10at,%Hf. The structure of the precipitate was not determined.
Theme results were at least as good as those for copper-chromlum alloys, and better thanthose for copper-zirconium and copper-hafnium alloys. It was not clear whether the effects ofcombining chromium and hafnium were additive or synergistic,
o. Copper-Chromium-.ilver
The copper-chromium-ailver system also wu a combination of systems that showedpromise as binaries, Alloys (CB 99 and 116) were formulated at high and low chromium andsilver concentrations.
When processed conventionally, both responded in similar manners. Both hardened uponcold working, further hardened upon subsequent aging at 4801C (900F), and partiallyrecrystallizd upon a fAuthr anneal at 680*C (1200F). The more-concentrated alloy (CB 116:high silver) was slightly harder in all conditions.
Only Alloy CB 99 was electron-beam processed (116 was used to examine age-hardening bysilver). As solidified, electron-beam-processed CB 99 was quite soft. Cold working hardened theweld, but subsequent annealing recrystallized and softened the weld, This may be attributable tothe moderate chromium content.
The copper-chromium-silver alloys exhibited much higher hardness and better recrystalli.zation resistance than the copper-silver alloys. The discontinuous precipitation seen with thebinary copper-silver alloys was not observed with these ternary alloys. Compared to the copper.chromium alloys, these ternary alloys exhibited equivalent hardneases but possibly lowerrecrystallization resistance, especially in the rapidly solidified condition.
p. Copper-ChromIum.Zlrconlum-Silver
To address the effects of combining the three baseline systems, two alloys (CB 98 and 119)were formulated from the copper-chromium.zirconium-silver system. The most significantdifference between the two alloys was the silver concentration and resultant ability to precipitatesilver (the alloys contained 1 percent and 3 percent silver, respectively).
Both alloys responded similarly to conventional processing, recrystallizing only at 650'C(1200'F). Aged hardness of the alloy containing 3 percent silver was almost identical to that of anequivalent silver-free alloy (CB 46). Apparently, the silver had little effect.
Only one alloy was electron-beam processed: CB 98 (lower silver was not expected tobenefit from rapid solidification). This alloy hardened as a result of rapid solidification, furtherhardened upon cold working, and was only slightly softened by a subsequent 650'C anneal. Itshardnesses were very similar to those of a similar silver-free alloy (CB 46).
In general, these quaternary alloys were very similar to their silver-free counterparts.
q. Copper-Hatnium-Silver
Another ternary combination of promising binaries was copper-hafnium-silver. One alloy,CB 117, was formulated from this system to investigate precipitation hardening when hafniumand silver were combined.
When processed conventionally, the alloy did not harden or soften when aged aftr coldwork. It softened upon subsequent annealing at 6500C (1200'F), Because the silver addition wasnot expected to enhance the response of the hafnium addition to rapid solidification, the alloywas not electron-beam procesed. In general, this alloy ezhibited properties equivalent to those ofthe copper-hafnium alloys.
r. Copper.Chromlum-Hafnium-Sliver
Another combination alloy system was copper-chromium-hafnium-silver. One alloy,CB 120, was studied. It responded to processing similarly to the silver-free variant (CB 118), age.hardened at 480'C (900'F) and recrystallizing and softening when annealed at 650'C (1200,F).There were little hardness differences between the ternary alloy and the silver-free binary alloy,
Since silver was not expected to respond much to rapid solidification, this alloy was not
electron-beam processed.
a. CopperTitanium.X
Titanium is a potent age hardener of copper. However, due to its high solubility, it lowersconductivity to unacceptably low levels. Nevertheless, it was deemed worthwhile to investigateadditions of titanium with other elements (zirconium, hafnium, chromium, silver - CB 121 -124) to increase hardness while determining if the secondary additions would lower titaniumsolubility.
The first system, copper-titanium-chromium (CB 121), exhibited high age-hardmnability,even after cold work (Table 13). When solutioned and cold worked, it recrystallized only at 6&0C(1.200F). The copper.titanium-zirconium alloy (CB 122) responded in an identical manner.
The copper-titanium-hafnium and copper-titanium-silver alloys (CB 123 and 124) respond.ed to conventional processing in the same way as the latter two alloys. However, their annealed,recrystallized hardnesses were much higher. Suspecting that part of this hardness was due tospinodal titanium aging during the vacuum furnace cool, the two alloys were reannealed at 650"Cand water quenched, This lowered the copper-titanium-silver hardness considerably, but loweredthe copper-titanium-hafnium alloy hardness only slightly.
Electron-beam processing of the copper-titanium-hafnium alloy increased its hardness,Cold working further hardened the electron-beam zone, but subsequent annealing recrystallizedthe zone and softened it to the as-solidified hardness.
Microprobe analyses indicated that the coarser precipitates in the CB 123 alloy were78.5at.%Cu-l.5at.%Ti.18at.%Hf (probably a Cu6Hf structure).
Of these titanium-containing alloys, only the copper-titanium-hafnium alloy exhibitedsuperior hardness after annealing. However, it still tecrystallized after a 650"C (1200'F) anneal.Also, sufficient titanium may have remained in solution in the alloy to decrease its thermalconductivity to unacceptably low levels.
67
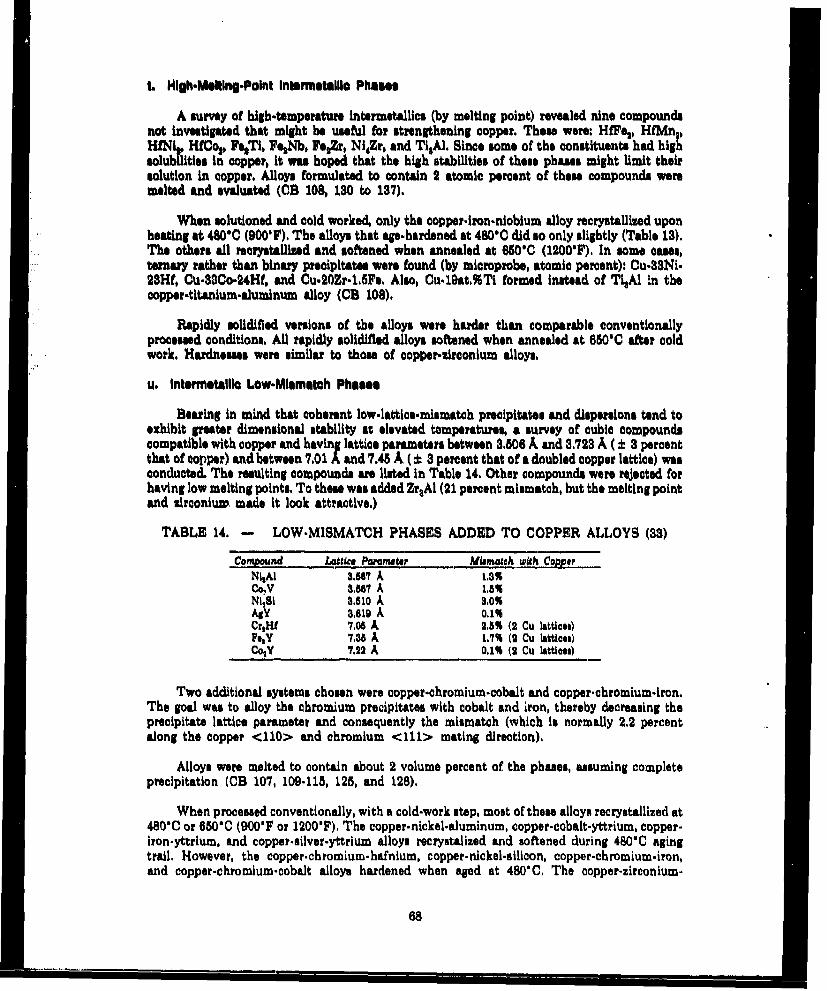
t. High.Melting.Point Intsrmetalllo Phases
A survey of high.temperature intermetallics (by melting point) revealed nine compoundsnot investigated that might be useful for strengthening copper. These were: HfFi., HfMn3 ,HfNit, HfCo%, FPeTi, FeNb, FeZr, Ni4Zr, and TiAl. Since some of the constituents had highsolubllities in copper, it was hoped that the high stabilities of these phases might limit theirsolution in copper. Alloys formulated to contain 2 atomic percent of these compounds weremelted and evaluated (CB 108, 130 to 187).
When solutioned and cold worked, only the copper.-ron.nioblum alloy recrystallized uponheating at 4800C (900F). The alloys that agehardened at 480"C did so only slightly (Table 13).The others all recrystallized and softened when annealed at 650'C (1200'F). In some cases,ternary rather than binary precipitates were found (by microprobe, atomic percent): Cu-33Nt-2$Hf, Cu-3OCo-24Hf, and Cu.20Zr.15Fe. Also, Cu.19at,%Ti formed instead of Ti$Al in thecopper-titanium.aluminum alloy (CB 108),
Rapidly solidified versions of the alloys were hurder than comparable conventionallyprocessed conditions. All rapidly solidified alloys softened when annealed at 650'C after coldwork. Hardnesses were similar to those of copper-zirconium alloys,
u. Intermetallio Low-Mismatch Phases
Bearing in mind that coherent low-lattice.mismatch precipitates and dispersions tend toexhibit greater dimensional stability at elevated temperatures, a survey of cubic compoundscompatible with copper and having lattice parameters between 3,506 A and 3.723 A (± 3 percentthat of copper) and between 7.01 A and 7.45 A (± 3 percent that of a doubled copper lattice) wasconducted. The resulting compounds are listed In Table 14. Other compounds were rejected forhaving low melting points. To these was added ZraAl (21 percent mismatch, but the melting pointand zirconium made It look attractive.)
TABLE 14. - LOW-MISMATCH PHASES ADDED TO COPPER ALLOYS (33)
Comound Lattite Parmator Misatch with Coppe,NI1AI 3.567 A 1.3%CoV 3,887 A 1,6%Nissi 3.510 A 3,0%AY 3,819 A 0o1%CrHf 7.08 A 2,5% (2 Cu attices)FesY 7.35 A 1.7% (2 Cu lattices)CY 7.22 A 0,1% (2 Cu lattices)
Two additional systems chosen were copper-chromium-cobalt and copper-chromium-iron.The goal was to alloy the chromium precipitates with cobalt and iron, thereby decreasing theprecipitate lattice parameter and consequently the mismatch (which is normally 2.2 percentalong the copper <110> and chromium <111> mating direction).
Alloys were melted to contain about 2 volume percent of the phases, assuming completeprecipitation (CB 107, 109-115, 125, and 128).
When processed conventionally, with a cold-work step, most of these alloys recrystallized at480"C or 650"C (900'F or 1200'F). The copper.nickel-aluminum, copper-cobalt-yttrium, copper-iron-yttrium, and copper-silver-yttrium alloys recrystalized and softened during 480&C agingtrail, However, the copper-chromium-hafnium, copper-nickel-silicon, copper-chromium.iron,and copper-chromium-cobalt alloys hardened when aged at 480*C. The copper-zirconium-
68

aluminum alloy recrystallized at 6601C The copper-niokel.-aillcon, copper-.cobalt-.vanadium,copper-.chromlum--hafnlum, copper-chromium-iron, and copper-chromium-cobalt alloys partiallyrecrystallized at 650'C.
Precipitates that formed in these alloys were Identified in several cases (by electronmicroprobe), in Table 15.
TABLE 15. - PRECIPITATES IN SOME SCREENING ALLOYS
Mayr PAnned A.bW2Agysyasom ftyklitate Preodbitatos
CB 107 Cu-Zr-Al Zram CU- lOatZrCB 109 OR-Ca.V C08V COEVCB III Cu.Ag-Y AsY Cu-Iat,%Y-lIat.WAlCE 112 Cu-Cr-Hi CrtHt Cr, CuliCB Ila Cua-F#-Y FY CU.1at'%Fe-12At.%yCB 426 Cu-Cr-Co CrOW/co) Cr
Consequently, only in the copper-chromIum-cobalt and copper-cobalt-vanadIum alloys woreanything near the desired precipitates observed. The copper-cobalt-varadium alloy generated acobalt-vanadium precipitate where Co3V was desired. The copper-chromlum-cobalt alloygenerated a chromium precipitate (no cobalt was detected) where a chromium precipitatecontaining a small amount of cobalt was desired (cobalt may exist in the precipitate, atundetectable levels).
The copper-chromium -cobalt and copper-cobalt-vanadIum alloys appeared most promisingand were subjected to electron-beam processing. Neither alloy was hardened by rapidsolidification, Upon subsequent cold work + anneal at 650'C (1200'F), the rapidly solidifiedcopper-cobalt-vanadium alloy recrystallized ind softened, The copper..chromluzi-cobalt alloy didnot recrystallize nor soften,
v. Brides
Both the first-iteration screening and fIrst-Iteration powder metallurgy efforts demon-strated that HiB3, ZrBg, TiB3 , and MMB 6 borides were insoluble in molten copper at practicaltemperatures and therefore unprocessable to diapersions by rapid solidification processesavailable at P&W. Ultimately, tnn more boride systems (CB 53 to 63, CB 127 to 129, and CB 138to 140) were evaluated, looking for one that was soluble in the copper melt, yet insoluble andstable in solid copper to act as an effective diapersion. These systems were expected to formMMB,, YBO, VB2, CrB2, NbB3, A1B13, SIB, (Cr,TI)B3, NIB2, FeB, and CoE33
Of the systems Investigated, MM-B3 (retried), V-B, and Cr-B appeared to precipitate boridesIn the melt during arc melting, When subjected to electron-beam p uses, those borides did notappear to dissolve.
The other systems, AI.B3, Nb-B, Y-B, Si-B, NI-B, Co-B, and Fe.-B, appeared to precipitatebonides (unidentified) only upon solidification of the arc melts. Moreover, they appeared toredissolve and reprecipitate upon electron-beam processing. However, the etfeetiveness of theresulting dispersions was no greater than that of zirconium additions. Softening and recrystalli-zation resistance of the rapidly solidified sections of these alloys was no greater thaim that ofcopper-zirconium electron-beam passes. In addition, the dispersions in the copper-yttrium-boron, copper- niobium -boron, copper-alum inu m-boron, and copper-siilcon-boron alloys under-went considerable coalescence when annealed at 650*C (1200'F) after cold work.
69
Other borids-forming alloys containing third additions (Zr-B-Ag, Ti-B-Ag, MM-B-Ag, Cr-Ti-B) were melted (CE 33, 100, 101, 102, respectively), to determine if the third elementsincreased boeide solubilities in the liquid alloy. Bornde precipitation still occurred in the liquid.
This completed the investigations of borinds in screening alloys. Of the 14 boeidesinvestigated, none were founci that were both dispersable by rapid solidification and stable atelevated temperatures in copper.
w. Sliloldes
Silicides are another clan of high-temperature phases often employed as strengtheners inalloys, A review of phase diagratms of silicon and copper-compatible elements revealed thepossible applicability of Nb-SI, Cr-Si, Hf-Si, Ti-Si, Zr-SI, and Y-Si additions. Alloys wereformulated to produce the following stolcaiometries and phases: NbgSis, CraSi, Hf4Si2 , TiaSis,Zr3Si1, and YSi2, all at 24t.% concentrations (CB 81 to 86).
In most cases, the alloys produced ternary Cu-Si-X silicides: Cu SiNbA (by microprobe),Cu^HfSi, (x-ray diffraction), CujTi2 SI (microprobe), Cu 4Zr8 Si9 (i-ray), Cu8YSi, (micro.probe). Only the coppcr-chromium-siiicon alloy (CB 82) produced a binary silloide: the expectedCr5 Si (miroprobe).
In the conventionally processed conditions, all of the alloys recryntalized and softened at650"C (1200'%), and the yttrium and niobium-containing alloys recrystallized at 480*C (900,F);results no better than those of copper-zirconium alloys.
In the electron-beam processed, rapidly solidified conditions, the alloys --Ore harder thantheir conventionally processed conditions. However, they all underwent softening and recrystalli-zation during the post-cold-work 660'C anneal. The Cu.Cr5Si alloy softened the least. Therapidly solidified copper-hafnium-silicon and copper-titanium-silicon alloys softened considera.bly, but since they started out very hard, they still exhibited high hardnesses, The high initialhardness of the rapidly solidified hafnittm-containing alloy may have resulted from the hiigh3.3 percent hafnium concentration, The high initial and cold-worked hardnesses of the titanium-containing alloy may have resu!ted from Rpinodal hardening by the titanium. The softeningresistances of all but the rapidly solidified copper-chromium-silicfn alloys were no better thanthat of copper-zirconium alloys.
3. SUMMARY OF SCREENING RESULTS
For the most part, those alloy systems that contained zirconium, chromium, and hafniumexhibited the beat resistance to recrystallization and softening. Generally, alloys containingehromium exhibited the highest age-hardenability. Zirconium additions imparted good recrystal[lization resistance, but little age-hardening. Hafnium additions also imparted good recrystalliza-tion resistance, but, contrary to what was expected from the literature, age-hardening responsewas slight.
The effects of silver additions were not significant. Age-hardening was expected, but littlewas found. Ternary additions to copper-silver suppressed the discontinuous precipitationobserved in the binary tilloys. Silver additions (id not appear to increase the recrystallizationresistance of other copper-x alloy systems.
The other alloying additions expected to precipitate e!emantally or as copper-basedcqmpounds had little beneficiai effects. Mischmetal and yttrium additions were inferior tozirronium, chromium, and hafnium additions. The ternary alloys confaining mischmetal andyttrium were found to be no better than ccnpei-zirconium. Molybdenum was, within the
70

processing limit& used, insoluble in copper. Vanadium additions did not improve the alloys either,and appeared to promote catastrophic oxidation in some alloys. Niobium did not appear to beany more effective as a hardener than chromium.
Of the titanium alloys that exhibited high hardnesses, only one was found in which thehardness was not spinodally produced by slow cooling, and which might be considered stable in arocket engine environment, This was the copper-titanium-hafnium alloy, which produced acomplex ternary precipitate.
The alloys formulated to produce high-temperature intermetallic phases tended instead toform ternary compounds containing copper. Their properties were not promising.
The addition, of low-mismatch compounds generally did not improve softening orrecrystallization resistance (compared to copper-zirconium alloys). In many cases, the expectedcompounds did not even form; ternary compounds containing copper formed instead. Twoexceptions were copper.cobalt-vanadium and copper-chromium-cobalt, which exhibited goodsoftening and recrystallization resistanece. The former appeared to form cobalt-vanadiumprecipitates. In the latter alloy, cobalt was not detected in the chromium precipitates. However,cobalt level# were low and possibly hard to detect.
The inability to find a useable boride for dispersion strengthening was a majordisappointment. Some diborides were very stable at elevated temperatures, but they were noteffectively dispersed by the processes employed. Other borides were processable to finedispersions, but were not stable.
Only one of the silicon-containing alloys looked promising. copper-silicon-chromium. Thisalloy formed a binary chromium-silicide believed to be Cr3Si. This alloy was slightly moreresistant to recrystallization and softening than copper-chromium alloys. The remaining silicon-containing alloys produced ternary copper-containing silicides and were not promising.
Based on hardness, age-hardenability, softening resistance, and recrystallization resistance,the following alloy systems exhibited the best potential for further study-
Copper-ChromiumCopper-HafniumCopper-ZirconiumCopper-Silver-ChromiumCopper-Silver-Chrom hum-ZirconiumCopper-Silver-HafniumCopper-Silver.ZirconiumCopper-Chromium-CobaltCopper-Chromium-HafniumCopper-Chromium -ZirconiumCopper-Cobalt-VanadiumCopper-Hafnium-TitaniumCopper. Hafnium.Zirconium
71
SECTION IVPOWER METALLURGY ALLOYS AND NASA-Z
1. ALLOY SELECTION
Based on the alloy screening results, compositions were selected for atomization. Alloyswere atomized in two lots. the first lot after the first screening iteration, and the second lot afterthe second screening Iteration.
At the end of the first screening Iteration, the copper-hafnium, copper-zirconium, copper-zirconium-silver, and copper-zirconium-boron systems were selected for atomization. Copper-zirconium and copper-hafnium had exhibited good recrystallization and softening resistance. Thepowder metallurgy copper-uirconium-silver alloy would allow comparison with convontionallyprocessed NASA-Z. And finally, even though problems were expected with boeide dispersion, thestabilities of borides were so great that their use had to be investigated.
Other first-iteration screening systems were not atomized. The copper-hafnium-zirconium
system did not appear appreciably better than either binay system. Only two copper-zirconium.chromium alloys had been studied, and they appeared no better than copper-zirconium (laterones performed better). Also, the literature had suggested that alloys containing chromium wereless ductile than copper-zirconum alloys (14).
Powder alloys had to be prioritized because when the atomizer is converted to a differentsystem, such as from nickel to copper, the first few runs are expected to contain contaminationfrom the prior alloy system. Such runs are said to wash the atomizer (via dilution) ofcontaminants. Usually, three such wash runs are needed to flush out the system. Depending onthe expected use of the powder, wash run powders may be discarded or used for experiments. Forthis program, wash runs were used to make compositions of secondary Interest or higher risk,with the expectation that, even contaminated, the powders would yield valuable information.
The systems chosen from the first screening iteration were prioritized, and compositionlevels were chosen. The alloys of primary interest were:
Cu-0698ZrCu-0.55%Zr-0.17%BCu.0,5%Zr-3.0%Ag
The zirconium level in the copper-zirconium alloy was set moderately above the solubilitylimit, to produce a dispersion of primary Cu Zr precipitates. The copper-zirconium-boron alvoywas formulated to produce 1 volume percent borides, with a little extra boron for melting losses.The third alloy was formulated to the NASA-Z composition.
Wash heat alloys were:
Cu-i.lZr-0.34%BCu-1.l%HfCu-O.SZr
The first alloy was formulated to produce 2 volume percent borides, with a little eztraboron, and to assess the processability of zirconium diborides. The second alloy, copper-hafnium,was run as a wash heat because it was riskier than copper.zirconium. Its composition was setabove the solid solubility limit to produce a dispersion of primary CusHf precipitates. The lastalloy was chosen to assess zirconium concentration effects.
72

As atomization progressed, alloy formulations were changed somewhat to those in Table 16.The differences from those proposed were a change in boron level for the primary copper-zirconium-boron alloy (997), and the repetition of two primary alloys at Cu.0.65%Zr (998) andCu-0.5%Zr.3.0%Ag (999). The boron level for Alloy 997 was dropped because numerous verycoarse boridea were observed in the boron-containing wash alloy, indicating a very low solubilityof ZrB2 in molten copper. The two duplicate runs were part of an effort to reduce the incidence ofvery fine oxides in the powder. These two runs emplcyed reducing conditions in the atomizationdevice to inhibit oxidation of the zirconium in the melt, In addition, Run 998 employed a smallzirconium increase to compensate for zirconium losses observed with Runs 994 and 995,
TABLE 16. - ATOMIZATION RESULTS
Charge Poured .80 Mesh Main Lower Wal &Alloy Weight Weight Collected Collector Chamber Ceiling Depoist
Run Comtposition (wtN) (09) (Ow) (hA) (kh) (Wg) (09) Comments992 Cu-1lP-0,343 70 45 NA 6 23 9 Late abort - skulls.993 Cu-l,lHf 69 64 29 35 11 8994 Cu.0,S8r 110 68 12 14 27 16 Late abort - skulls.995 Cu-OeZr 68 64 23 24 2 24996 Ou-0,br.3,OAS 68 64 23 43 9 8997 Ou.0,58Zr.0,05B 69 68 34 87 14 11998 Cu.O,65Zr 69 86 NA 6* 8 23 Late abort - skulls.999 Cu.0SZr-3,OAg 70 68 48 49 a 2
1032 Cu-O0Hf-0,7Ti 74 M8 23 24 4 271033 OuCOu Cr.O,2Ce 76 71 31 34 7 221034 Cu1.,4Co-0,4V 72 66 2 2 31 26 Collector clogged.1038 Cu-1,0Cr-O&,Zr 73 68 39 41 2 161038 Cu-0,6r-lIHf 78 69 10 11 1 531087 Cu.,OCr.06Z•.3,OAg 76 6 0 0 0 0 Abort - nossle clog,1038 Cu.1,0Cr.06,Zr.3,OAI 70 68 19 20 2 371039 Cu.I,OCr.3,OAg 73 67 0 0 NA 0 Oil leak - powder ruined,1040 Cu-0,6Zr-lIHt 74 10 0 0 0 0 Abort - nogile clog.1041 Cu-0,6Zr-I,IHf 80 75 13 14 4 501042 Cu-1,4Co-0,4V 71 86 21 22 8 291043 Cu.1,OCr-3,0Ag 72 68 NA 30 0 29
Air Exposed
After the remainder of the screening effort was finished, additional alloy systems wereidentified for possible atomization. They were:
Copper-salver-chromiumCopper-.slver-chromium-zirconiumCopper.silver-hafniumCopper-cobaltochromiumCopper-cobalt-vanadiumCopper-chromiumCopper-chromium-hafniumCopper-chromium-siliconCopper-chromium-zirconiumCopper-hafnium-titaniumCopper-hafnium-zirconium
73
From these, three high-risk systems were chosen for atomization as wash heats andformulated as:
Cu-1.4%Co-O.4%VCu-O.8%Cr-0.2%CoCu-.8%Hf-0.7%Ti
Another four systems were chosen for primary runs and formulated as:
Cu-0.$%Zr-I,0%CrCu-0.6%Zr-1.0OCr-3,0%AgCu-O.8%Zr-1.l%HfCu-1.0%Cr-3,0%Ag
Notably absent wee copper.chromium-hafnium, which was believed to be too similar tocopper.chromium.zirconium to merit a trial at that time; copper-silver-hafnium, which was verysimilar to copper.silver-sirconium; copper-.chromium, which was the least promising of the series;and copper-chromium-silicon, which was considered to be a high-risk alloy and reserved for somefuture (unrealized) wash run.
These alloys were atomized as formulated above. Some were repeated to compensate for bad
runs.
2. ATOMIZATION RESULTS
High-conductivity copper alloys atomized easily ir, the Pratt & Whitney (P&W) rapid-solidification-rate (RSR) atomization device, forming spherical powder quite similar to that ofother alloy systems. Some unique problems were encountered, but none were unsurmountable.
One such problem was that the copper powder, being soft, bonded weakly to the atomizerwall upon impact. For some atomization runs, substantial portions of the powder were depositedon the wall of the device, significantly reducing the yields of collected powder. Process andequipment constraints were such that the most expedient remedy was to melt large heats(150 pounds) to ensure that collected powder yields were adequate for use.
Other problems involved introduction of alloying additions without lose or reaction in themelt. For zirconium, late additions, crucible charging, and copper.zirconium master alloy chargeswere tried. Late additions were found to work best, minimizing slag formation and zirconiumlosses. Late additions were also used for hafnium and, later, silver additions. Attempts were madeto minimize oxidation in the melt and subsequent formation of fine oxides in the powder(Figure 37) by bubbling hydrogen through the melt (Runs 998 and 999) and using a graphitetundish (999). These methods did not produce noticeable improvements and were discontinued.
Production of bonide-containing powder wu complicated by reaction and formation ofborides in the melt. Attempts to resolve this by increasing melt temperature were hindered bypower limitations and the tendency for the melt to splash at high power levels. The highest melttemperature attained, 1S00C (2730'F), was not adequate to prevent borids formation.
74

10 Am
Figue 37. Bachacatter Electron Image (SEM) Showing Possible Fine Oxides in Cu.Zr(Alloy 995) Powder
Since chromium was somewhat difficult to melt in copper (due to a miscibility gap), allalloys containing chromium were pre-melted as master alloys in a separate VIM furnace that wascapable of higher temperatures than the atomizer furnace.
Additional difficulties encountered in atomization were generic in nature and consisted ofturbine (disk drive) oil seal leaks, plugging of the atomizer nozzle, and unstable atomization atthe rim of the disk (requiring atomizer shut-down or causing large splats that reduced powderyield or clogged the atomizer outlet).
When the wall deposition phenomenon was ignored, yields were acceptable, Yields ofcollected .80 mesh powder and areas of loss are listed in Table 16. Wall deposition was the mostconsistent source of losses, This phenomenon was not found to depend upon any controllableprocess parameters, Another significant source of loss was the infrequent tendency for the finepowder to sit in the bottom head of the device rather than flow into the collector can, At leastonce, this was aggrivated by wall deposits falling off and clogging the atomizer outlet. Powderflow can be assured by using blowdown nozzles to flush out the lower head.
The powders produced for this program were finer than those typically produced by theRSR process. Size fraction analyses are shown in Figures 38 and :39. The fineness of thesepowders were attributed to the high atomizer speeds used. Fine powder was intentionallyproduced, as it was expected to solidify more rapidly. The large, very coarse fractions exhibitedby Runs 994, 996, and 998 re-ulted from unstable atomization and splashing off the disk. Eventhose runs exhibited a larger-than-normal fine fraction, however,
7 5

100
go.8,0 0
70
60
Cumulam CeWeight - 50
Legend:40 4 0 gg3 rm
Q 993 35 krpm
996 35 krpm
20 7997 35 krpm998 35 krpm
10 999 35 krpmo-- Nickel 24 krpm
O . I . I , ,I I , I I I I l'~ Io microns 100 200
Tyler Mesh 325 200 140 120 100 80Powder Size
Figure 38. Size Arnlysaj of Collected Powder (Run. 998 Through 999)
a. Chemical and Contamination Analysis of Powdem
Chemical analyses were performed on a number of the alloys. The results are listed inTable 17. Analyses were made by inductively coupled plasma-atomic emmision spectroscopy(ICP-AES) and by electron microprobe (wavelength-and energy-dispersive). The ICP.AESmethod was considered reliable. ICP-AES was not used with the second powder alloy series dueto budgetary constraints. Some of the microprobe results were unreliable. Overall, powder alloycompositions were close to aim compositions. Some zirconium losses were observed when it wasadded to the charge instead of as a late addition. Boron looses always occurred.
76
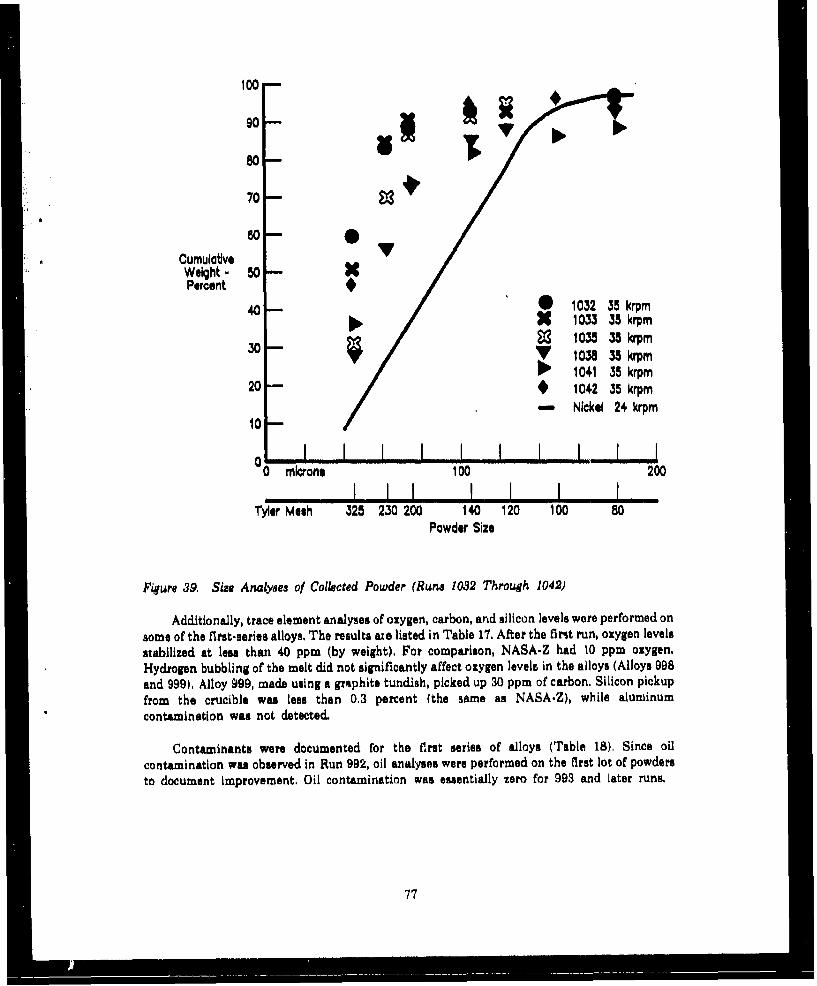
100 -
90
80 570
80 0CumulativeWelIht - 50-Percent
40 1032 35 krpmX 1033 35 krpm
30 - M 1035 35 krpmV 1038 35 krpm
1041 35 krpm20 - 1042 35 krpm
- Nickel 24 krpm10.-
000 microns 100 200
I. . I, , , I I ,, i , , I ,, I ,
Tyler Mesh 325 230 200 140 120 100 80Powder Size
Figure 39. Size Analyses of Collected Powder (Run., 1032 Through 1042)
Additionally, trace element analyses of oxygen, carbon, and silicon levels were performed on
some of the first-series alloys. The results awe listed in Table 17, After the first run, oxygen levels
stabilized at less than 40 ppm (by weight). For comparison, NASA-Z had 10 ppm oxygen.
Hydrogen bubbling of the melt did not significantly affect oxygen levels in the alloys (Alloys 998
and 999), Alloy 999, made using a graphite tundish, picked up 30 ppm of carbon. Silicon pickup
from the crucible was less than 0.3 percent (the same as NASA.Z), while aluminumcontamination was not detected.
Contaminants were documented for the first series of alloys (Table 18), Since oil
contamination was observed in Run 992, oil analyses were performed on the first lot of powders
to document improvement. Oil contamination was essentially zero for 993 and later runs.
77
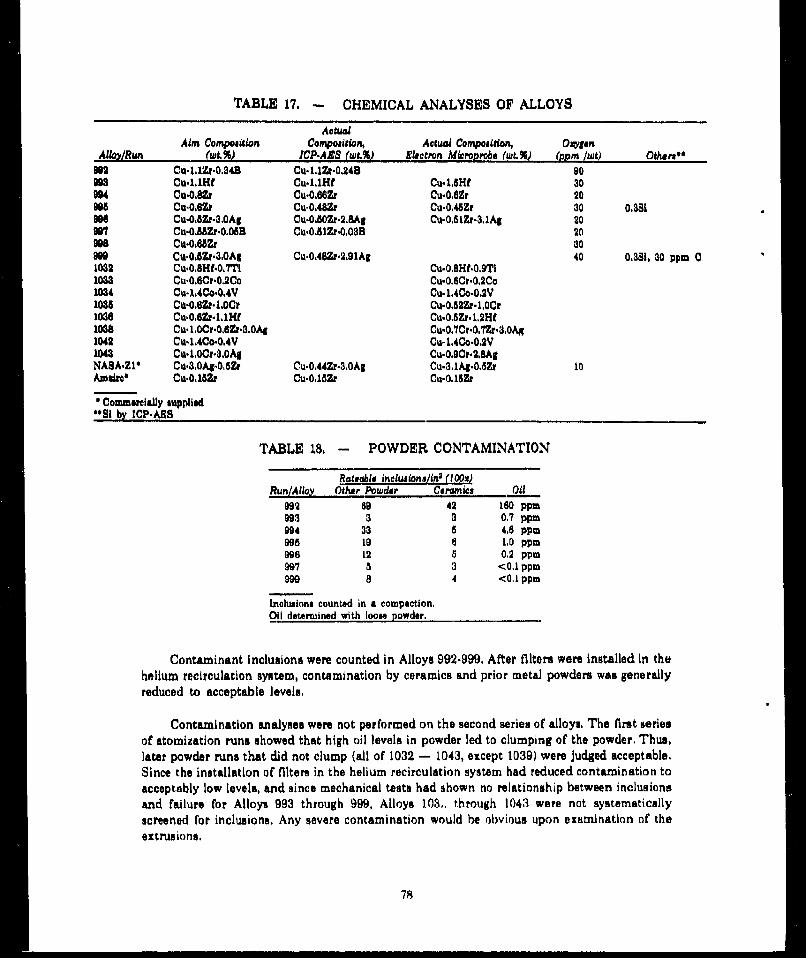
TABLE 17. - CHEMICAL ANALYSES OF ALLOYS
ActualAim Compoaition Compoaition, Actual Compo,ition, Oxylen
Allcy/Run N.( %) IZP.AS (wt.%) Electron M'croprob (w%) (ppm /wt) oth.r,,"992 Cu-1.1Z'0.34B Cu.1,1Zr-0,24B 90lea Co.,IHt Cul.lHf Cu-I.SHf 30994 Cu0.0,r Cu.0.66Zr Cu-0,6Zr 20Des Cu-0,6Zr Cu-0.,4Zr Cu*.O4SZr 30 0.381ag6 Cu.0,8Zr.3,0Ag Cu.0.B0Zr.2.SAI Cu-0.SlZr-3.lA1 20997 Cu.0,b-0.06B Cu.0,5lZr.0,03B 2099s Cu.0,.5Zr 30999 Cu.0,8Zr.,30AE Cu-0,48r-2.O91AC 40 0,.381, 30 ppmC1032 Cu,0.MHf.0,TT! Cu-.0,Hf.0.,TI1033 Cu-0,6Cr.0.2Co Cu.0.6Cr.0,2Co1034 Cu- 1.4Co.0,4V Cu-1,4Co-0,2V1035 Cu-O.6Z-LoCr Cu-0.52Zr-l,0Cr1036 Cu.0.6Zr..1IHf Cu.0.5Zr.1,2Hf1038 Cu.,0Cr.0,6Zr-3.0A1 Cu-0.7Cr.0.7Zr-3,0Ag1042 Cu-.A4Co-0,4V Cu-1,4Co-0,2V1043 Cu.LoCr.3.OAl Cu.0.9Cr.2,SAgNASA.Z1* Cu.3.0Ag-08Zr Cu.0.44Zr•.3.0Ag Cu.3lAgA.0.SZr 10Amuiro' Cu.0.lSzr Cu-0,18zr Cu.0.l6zr
* Commercially supplied"Si by lCP.A•S
TABLE 18. - POWDER CONTAMINATION
Rateable inclwsion!ZWn (IOxRun/Al~oY Other Powder Ceramics Oil
992 69 42 180 ppm993 3 a 0.7 ppm994 33 5 4.6 ppm995 19 6 1,0 ppm906 12 5 0.2 ppm
997 5 3 <0.1 ppm999 8 4 <0.1 ppm
Inclusinns counted in a compaction,Oil determined with loose powder,
Contaminant inclusions were counted in Alloys 992-999, After filters were installed in thehelium recirculation system, contamination by ceramics and prior metal powders wan generallyreduced to acceptable levels.
Contamination analyses were not performed on the second series of alloys. The first seriesof atomization runs showed that high oil levels in powder led to clumping of the powder. Thus,later powder runs that did not clump (all of 1032 - 1043, except 1039) were judged acceptable.Since the installation of filters in the helium recirculation system had reduced contamination toacceptably low levels, and since mechanical tests had shown no relationship between inclusionsand failure for Alloys 993 through 999, Alloys 103. through 1043 were not systematicallyscreened for inclusions. Any severe contamination would be obvious upon examination of theextrusions,
78

b. Powder Mlorostructuree
Microstructures of RSR-atomized high-conductivity copper alloys resembled those of manyother RSR systems studied earlier. Powders were fine spherical particulates, exhibitingsecondary dendrite arm spacings of 1-5 gm. Figures 40-44 illustrate the microstructures ofseveral of the allays (those not shown had micriistructures similar to that of Alloy 995), Allexhibited fine dispersion of the alloying elements, with the exception of Alloys 992 and 997,which also exhibited coarse 1-10 gim ZrB,, particles (Figure 40). These were believed to haveformed in the melt,
With few exceptions, the RSR process was well-suited to the atomiz~ition of fine, spherical,rapidly solidified, high-conductivity copper alloy powders. While some difficulties wereencountered In powder making, all could be resolved if production quantities were needed,
AN*
Pt,
3N. rr
50 AiM 10 AiM
Figure 40. .Structure of -80 Mesh Alloy 992 Powder (('u-Il%Zr-O.3% B) Showing Buridesat 1OOKiX (Right)
79

kiY
OY"
20 gm 10 gm
Figure 41, St,-ucture of -80 Mesh Alloy 993 Powder (Cu-1.)%HF)
SO

aLJ
50 A~m 10 AM
Figure 42. Structure oIf -80 Mesh Alloy 995 Powder (Cu-0.6%Zr,)

50 Jm 10 pm
Figure 43, Structure of -80 Mesh Alloy 996 Powder (Cu.0.5%Zr-3,0%Ag)
82
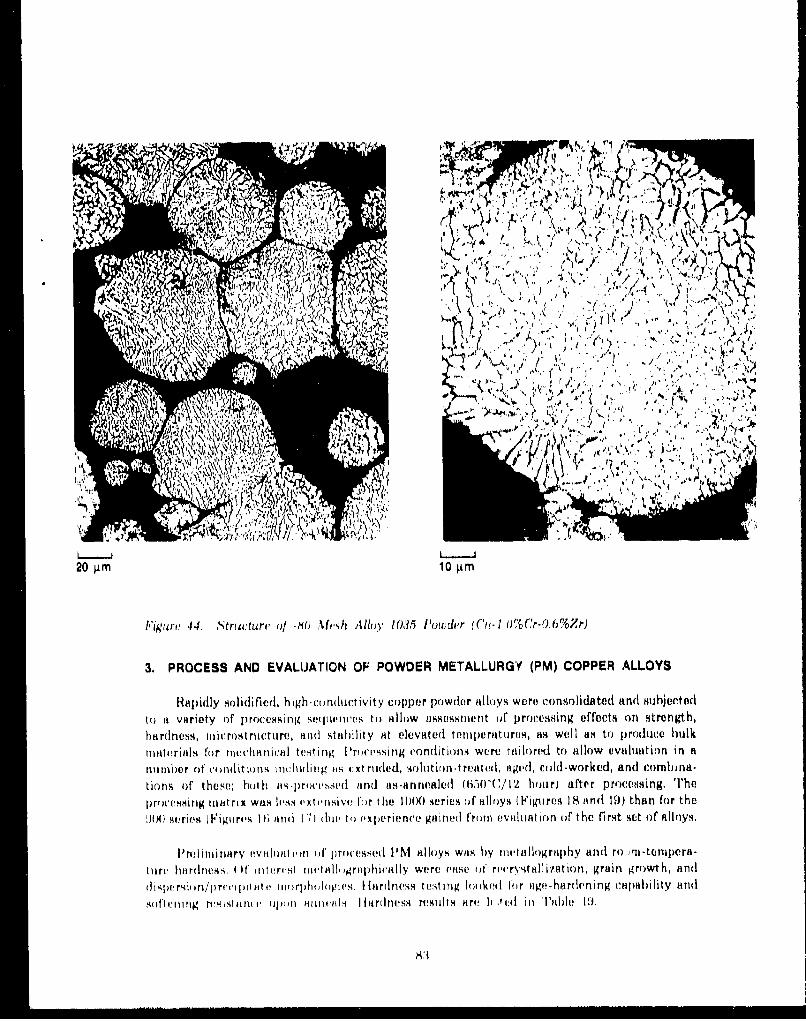
j*
A ~ r-v4.
toU
A'
IIA
20 g±m 0A
I'iglurv -14. N'triucture' of -80J %Iv~h tAlloy 1035 I'owd!'r (Cu.-I/,V-Cr-0.6o71Zr)
3. PROCESS AND EVALUATION OF POWDER METALLURGY (PM) COPPER ALLOYS
Rapidly solidified, high-condluctivity copper powder alloys were c'onsolidated andi muhjected
to it variety of processing sequpwrws to allow assessmienlt of' processing effects on strength,
hardness, microst ructure, anl stahi lity tit elevated temperatures, as well as to produce bulkmatvrinls for mouchinical tes ing. lt roct"'Si og condlitions were tauilored to allow evaluation in anumber of' condit ions inclfuding ois ext rrcled, 4olution -treatod, aged, cold-worked, and cornhrna.
tions of these: hot h wi- prociissvrd rind as-an nealed (610"C/1 2 hour) aftpr processing. 'U'he
p)ro(essiiing iat ri xwas EMS eixtrutsive, for thle 1000series of alloys (Figrnrcr limorin 19) than or the!)X) series F~igur~is 11; anid I', doe~ to oxperience gainedt f'rom evaualmtion of the rirAst.-t of alloyq.
l'rel iminarv e!vnolout on 1) pr'ucessed PMN alloys, wits by metallography and ro rn-temperfl-
tort, hardness. ( )f intru(res minvoilli graphically were viase ot' rcryitalli'zation, grain growth, andm trpiihioiopies. F larrinecss tustirW looked h'r rigo-hardmeing cap~ability and
soft .o umug rusis utoim upin muuincils I fardnesis results are hi ri(.d in Pal'uhl1.

TABLE 19. - DIAMOND PYRAMID HARDNESSES OF PROCESSED PMALLOYS
E+CW+ E+CW÷ E+S+ E÷S+ E+S+ E+S+ E+S+Alloy- AR E+N .E+CW A (A)+N E+S A A4N CW CW+A CW+A÷N
993 94 82 188 114 66 60 63 89 118 108 8s995 92 80 118 96 68 55 53 52 108 106 51996 106 76 146 96 84 70 80 62 126 134 72997 92 74 126 102 72 54 58 56 106 106 60999 98 88 126 122 74 61 64 63 118 134 74
1032 106 100 156 - 86 78 146 76 146 168 1221033 88 74 114 - 60 50 61 54 106 112 861035 122 108 142 - 108 70 98 66 126 146 721086 102 98 132 - 96 78 82 72 130 130 731088 130 98 158 - 91 80 160 78 154 160 881042 94 98 118 - 98 61 68 69 102 69 661043 138 88 154 - 88 76 106 76 142 142 76
AE, - - ExtrudedN - 650*C (1200'F)/12 hr annealedS - SolutionedA A A".e 480'C (900*F)/2 hrCW - Cold worked
Results of theme studies were used to select alloys and material conditions for preliminarytensile testing. Tensile testing was performed at 705'C (1300F) (the projected maximum walltemperature) at strain rates approaching 0,1/second (projected chamber strain rate). Tensileresults were evaluated to rank alloys for characterization.
a. Conaclldadton
Powder metallurgy copper alloys were consolidated by hot extrusion at 650'C (1200,F) inevacuated copper cans. Extrusion conditions and results were summarized in Table 9.
Whenever sufficient powder existed, the -230 mesh powder fraction was canned forextrusion consolidation. Coarse powder fractions were not studied because: 1) Little coarsepowder was produced, 2) the types of dispersions produced in these alloys were not expected to besensitive to subtle solidification rate differences, especially after consolidation; and 3) becausefine powder was so easily produced, the ability to use coarser powder could be addressed later, ifneeded, when alloys were chosen for hardware fabrication.
Extrusion of P&W powder alloys was done exclusively at 680'C (1200F), The intentionwas to minimize temperature while accomplishing full consolidation. The works of Grant, et al(34, 35) suggested 680"C. Initial trials with Alloy 993 indicated that this temperature wassatisfactory, so it was used for the remainder of the program. The Massachusetts Institute ofTechnology (MIT) specified the temperatures used for their extrusions,
Extrusion ratios were chosen to produce bar stock of sizes suitable, after additionalprocessing, for test specimens. Generally, two ratios were used per alloy. Early extrusions weremade at 8:1 and 12:1 ratios. The 8:1 extrusion billets were hot-compacted prior to extrusion toensure complete consolidation during extrusion. The larger (8:1) extrusions were to be subjectedto additional working, whereas the smaller (12:1) extrusions were intended only for heattreatment. As experience showed that smaller extrusions could be used for these purposes, laterextrusions were made at 10:1 and 20:1 extrusion ratios,
84

All extrusions were fully consolidated. No problems were encountered with the extrusion
efforts. Resulting microstructures are addressed in the next section.
b. Alloy Prooesing and Behavior
Powder metallurgy copper alloys were processed by various combinations of extrusion, hotwork, cold work, solution treatment, and aging to assess the effects of these processes onmicrostructure, hardness, and tensile properties. Processed conditions were subjected to annealcycles at 650'C (1200F) for 12 hours to assess their stability at elevated temperatures. Resultsare discussed below for each alloy,
(1) Alloy 992: Cu.I..IZr.O.34%D (aim)
Alloy 992 powder was not consolidated. It was oily, due to an atomizer oil meal failure, andexhibited massive borides fromed by reaction in the melt. Alloy 997, which contained less boronand exhibited fewer massive borides, was consolidated and evaluated instead.
(2) Alloy 993: Cu-.I.IMfE
Powder metallurgy Cu-1.1%Hf exhibited good recrystallization and softening resistance ina variety of conditions. Its responses to processing are detailed below:
(a) As-Extruded Conditions - As extruded, Alloy 993 exhibited a warm-worked fibrous structure with an extremely fine grain size (1 gm) and adiamond pyramid hardness (DPH) of about 95 (Figure 45). Transmissionelectron microscopy (TEM) showed precipitates to be about 1000-6000 A.Aging at 480'C (900'F) or annealing at 650'C (1200'F) produced noobservable changes in the fibrous microstructure, but the latter softenedthe material slightly, to about DPH 85.
(b) Extruded and Cold-Worked Conditions - Cold working of the extrudedstructure resulted in a similar, though harder (DPH 138), fibrous structure.An aging temperature anneal did not recrystallize the cold-workedmaterial, but did soften it slightly (to DPH 114). Anneals at 650"Crecrystallized these materials almost completely, to grain sizes of 5-10 l.tmand hardnesses of about DPH 70 (Figure 45).
(a) Extruded + Solutioned (+Aged) Conditions - Solution treatment at925'C (1700'F) completely recrystallized the extrusions to grain sizes of5-10 pm and a hardness of DPH 60 (Figure 46)). Aging at 480'C (900"F)only slightly hardened the material, to DPH 63, with no apparent change inmicrostructure. Annealing as-molutioned or aged forms at 850"F (1200,F)produced no apparent microstructural or hardness change (about DPH 55to 60).
(d) Extruded + Solutioned + Cold-Worked Conditions - Cold workingsolutioned material produced an elongated grain structure and increasedhardness significantly (to DPH 118). Subsequent aging at 480*C did notchange the microstructure and only slightly softened the material(DPH 108). Annealing cold-worked or cold-worked + aged materialsfurther softened the material (DPH 86) but did not appear to causerecrystallization.
85

E,~, YCL
t+
A :L]E
86

~~' N~' L A vi';-
IV
20 gm
Figure 46. Solution-Treated Alloy 993
Dispersions in PM Cu-1,1%Hf were coarser than desired: 1000 to 3000 A (Figure 47). TheTEM microstructure of as-extruded bar was essentially strain-free (Figure 47), withgrain/subgrain sizes of about 0.5 to 2 4m. Dispersion composition determined by scanningtransmission elect;on microscopy (STEM) was Cu4 .Hf, reasonably close to Cu,5 Hf, cited in theliterature (35).
Of the conditions seen, the as-extruded and the solutioned + cold-worked + aged were
hardest and most resistant to recrystallization at 650°C (1200'F). They also represented twosignificantly different material conditions: as-extruded being ultra-fine-grained, fibrous, over-aged and warm-worked; solutioned + cold-worked + aged being fine-grained, equiaxed, aged, andcold-worked. For these reasons, both conditions were chosen for preliminary tensile testing.
Results of tensile testing are shown in Table 20, The solutioned + cold worked + agedmaterial exhibited higher strengths and lower elongations than the as-extruded material. Bothfailed by localized ductile necking (to 96 percent reduction in area). No internal voids were foundin the failure region.
Microstructures of failed tensile specimens indicated at least partial recrystallization in thegage section (Figure 48), Nickel alloy powder inclusions were surrounded by smooth cavitation,unassociated with the failures. Failures were essentially crack-free. Shear zones were evident.
87

2 gm 1AM
Figure 47, Electron Micrographs (TEM-Foil) Showing Dispersions in Alloy 993
Dispersions coarsened during tensile testing at 705'C (1300F) to about 2000-8000A,(Figure 49). Finer, often rodlike copper-hafnium precipitates were also observed. Energy-dispersive spectra of the latter, determined using STEM, yielded a composition of Cu•6Hf -reasonably close to Cu,,Hf, considering the presence of background matrix copper.Grain/subgrain sizes were about 1.2 gm.
In an effort to increase the elevated temperature strength of Alloy 993, process studies wereundertaken, with a goal of increasing grain size. Generally, grain growth upon solution treatmenthad been observed to be limited by prior particle boundaries. A way had to be found to force grainboundaries past these prior particle boundaries, It was found that 8706C (1600'F)/50 percenthot-working + solution-treatment at 940°C (1725'F) coarsened grain size to about 80 MLm(Figure 50),
Additional Alloy 993 was processed for tensile testing: hot-worked + solutioned + aged(HWSA), and hot-worked + solutioned + cold-worked + aged (HWSCWA), They were tensiletested at 705'C (1300'F), Results are listed in Table 18. The cold-worked condition exhibitedhigh strengths, but low elongation, The solutioned + aged condition was weaker than any otherAlloy 993 condition tested.
88
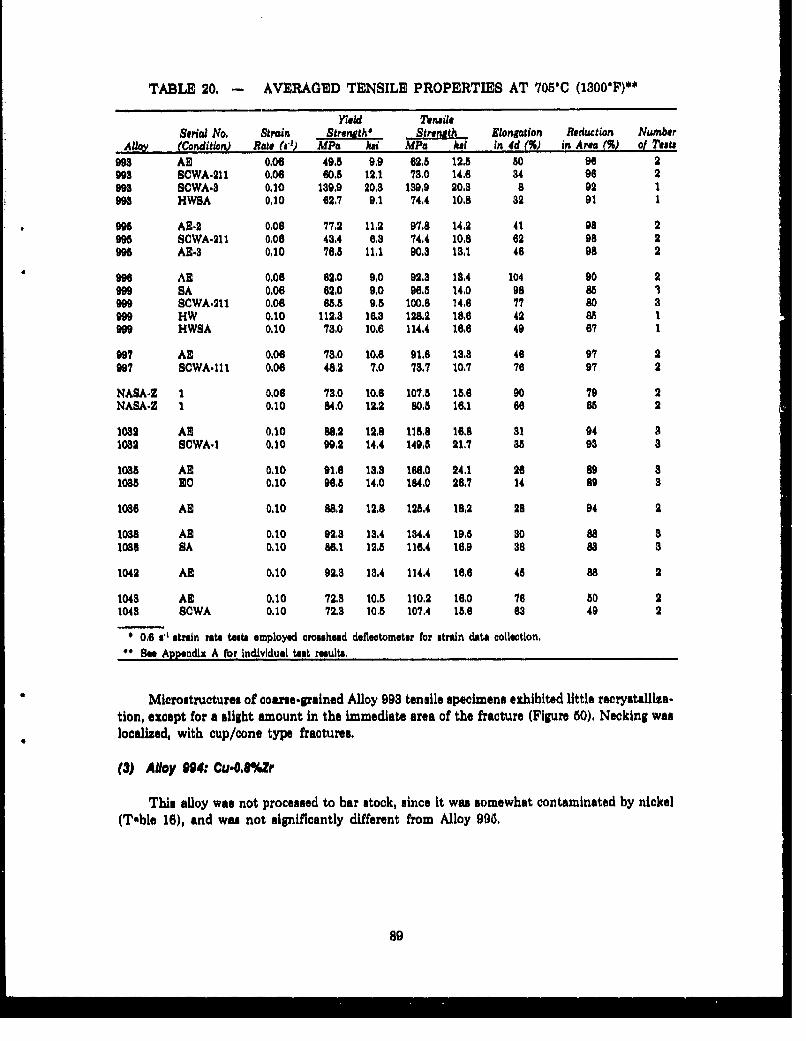
TABLE 20, - AVERAGED TENSILE PROPERTIES AT 7056C (1300*F)**
Yield TensileSeria No. Strain Stronath" Strenmth Elongation Reduction Number
Alloy (Conditio Rate (6,9 MPa Ahi MUPa h in 4d in Area M%) of Tetat993 AS 0,06 49,5 9,9 62.5 12.5 50 96 2993 SCWA-211 0.06 60.5 12.1 73.0 14.6 84 96 2993 SCWA-. 0.10 139.9 20,8 139,9 20,3 8 92 1993 HWSA 0,10 62.7 9.1 74.4 10.8 32 91 1
995 A^.2 0,08 77,2 M112 97.8 14.2 41 98 2995 SCWA-211 0.06 43.4 613 74.4 10.8 62 98 2995 AE- 0.10 76,8 11,1 90.3 13,1 46 98 2
996 AE 0.06 62,0 9,0 92.3 13,4 104 90 2999 SA 0,06 62,0 9,0 96,5 14,0 98 85 1,99 SCWA.211 0.06 65,5 9.5 100.8 14.6 77 go a999 HW 0,10 112,3 16.3 128.2 186 42 85 1999 HWSA 0.10 73,0 10,6 114.4 16,6 49 67 1
*997 AS 0,06 73.0 10.6 91.6 3,3s 46 97 2997 SCWA-111 0106 48.2 7.0 73.7 10,7 76 97 2
NASA-Z 1 0,06 730, 10,6 107.5 18,6 90 79 2NASA.Z 1 0,10 84,0 12.2 80,5 16.1 B6 65 2
1032 AS 0,10 88,2 12.8 115.8 16.6 31 94 a1032 SCWA.1 0,10 99.2 14.4 149,5 21.7 38 93 8
1035 AS 0.10 91.6 13.3 168.0 24,1 26 89 a1085 EC 0,10 96,5 14,0 184,0 26,7 14 89 3
1036 AS 0,10 88,2 12,8 125,4 18,2 28 94 2
1038 A, 0.10 92,3 13.4 134.4 19,5 30 88 31088 SA 0.10 86,1 12,5 116.4 16,9 38 83 3
1042 AR 0.10 92,3 13,4 114.4 16,6 48 88 2
1043 AS 0.10 723, 10.5 110,2 16,0 76 50 21043 SCWA 0.10 72.3 10.5 107.4 15,6 68 49 2
S0.6 &' sttain rate taost employed crosmhud deflectometer for strain data collction,Sea Appendix A for Individual teat reaulta,
Microstructures of coarae.grained Alloy 993 tensile specimens exhibited little recrystalllza-tion, except for a slight amount in the immediate area of the fracture (Figure 50), Necking waslocalized, with cup/cone type fractures.
(3) Alloy 994: Cu.O.#%Zr
This alloy was not processed to bar stock, since it was somewhat contaminated by nickel(Table 16), and wa- not significantly different from Alloy 995.
89

.404
.17
Aj ",ii A L*K~..')1
TSPIGIW7
A. ~ 1 A
100 ALm Grip Region 100 AMl Fracture
Figure 48. Microstructures in Solutioned + Cold-Worked + Aged Alloy 993 (SC WA -211)
Tensile Tested at 705oC (1300"F)
(4) Alloys 995 and 998: Cu-O.601Zr and Cu-O.650/Cr
Powder metallurgy Cu-Zr alloys also exhibited fairly good recrystallization and softeningresistance, although not quite as good as that of Cu-Hlf alloys. The responses of Alloys 995 and998 to processing were idential, and thus are discussed as one alloy: 995.
(a) As-Extruded Form - Extruded Alloy 995 exhibited a warm-worked fibrousstructure with an extremely fine grain size (1 pm) (Figure 51) and ahardness of DPH 92. Exposure to an aging temperature of 480*C (900*F)produced neither microstructure nor hardness (DPH- 94-96) changes.However, exposure to stability testing at 650*C (12006F) slightly softenedthe materials to about DPH 85 and recrystallized about 25 percent of themicrostructure (Figure 51).
1b) Extruded ý- Cold-Worked Conditions - Cold-working of the extrudedmicrostructure resulted in a similar fibrouzi structure (optional), but didincrease hardness significantly, to DPH 1 18, Annealing at the 480'Ctemperature did not change the optical microitructure, but did tioften the
90

material significantly, to DPH 96, Further annealing at 650"C recrystal.lized the alloy (Figure 51), and softened it to DPH 68.
(a) Solutioned + Aged Conditions - Solution treatment at 9250C (1700*F)recrystallized the extrusion (Figure 62) resulting in grain sizes of 5-10 4mand hardnesses of DPH 55-60. Aging at 480"C (and/or annealing at 650'C)neither hardened the alloy nor changed its microstructure.
(d) Solutioned + Cold-Worked Conditions - Cold-working of solutionedAlloy 995 hardened it to DPH 106 and produced a cold-worked microstruc-ture (Figure 52), Annealing at 6506C recrystallized (Figure 52) and softened(DPH 51) the alloy.
As-extruded umples of Alloy 995 were evaluated using TEM, Dispersions were somewhatcoarse (about 1000-3000A) (Figure 53). Grains/subgrains were about 0,5 g.m to 1 4m in size, andexhibited little strain,
2 gm
Figure 49. Electron Micrograph of Alloy 993 (SCWA-211) Ternile Tested at 7051C(1300YF), Note Rod-Like Precipitates
The only worked form of Alloy 995 that exhibited any stability at 650'C (1200'F) was theas-extruded condition. Likewise, it was the only form of the alloy that remained hard after 650'Cexposure. For these reasons, the as-extruded condition was chosen for preliminary tensile testing.A solutioned + cold.worked + agpd condition was also chosen for testing because that was thecondition of Amzirc (commercial Cu.O,15%Zr) that has shown highest elevated-temperaturestrength.
91

100 Atm
Figure 50. Microstructure of Alloy 993 Processed to Increase Grain Size (HW + S)
The tensile tests (Table 18) revealed that the as-extruded condition was stronger and lessductile than the solutiwumd I cold-workod I annealed condition, This correlated with the bettersoftening resistance of the former condition. As with Alloy 993, failure was by localized smoothnecking. Little void formation or cracking was observed.
Microscopy of failed Alloy 995 tensile specimens (Figure 54) revealed little recrystallization(at least littlo change from trh input microstructure), Cavitation was observed around nickelparticles, but was ductile and uninvolved with failure. Transinisdion electron micrulicopy did notreveal significant changes in the microstructure of as-extruded material after testing.
(5) Alloys 996 and 999: Cu.OV5%Zr-3%.4g
Alloys 996 and 999 are powder versions of the NASA-Z (and NARloy-Z") composition, andwere made to assess the effects of rapid solidificazation and powder metallurgy on NASA-Z.NASA-Z and NARloy-Z' are used in the solutioned + aged condition. However, the powderversions were subjected to the same processing matrix as the other alloys to allow study ofprocessing effects.
(a) As-Extruded Conditions - As-extruded microstructures were at least50 percent recrystalized, with grain sizes of 2-5 pm (Figure 55). Hardnessesranged from DPH 94 to 106. Annealing at 480'C (900*F) produced nochang2s in microstricture or hardness. Annealing at 650°C (1200*F)produced fully recrystallized microstructures (Figure 55) with grain sizes of1-6 4m and hardnesses of OPII 70 to 88.
92
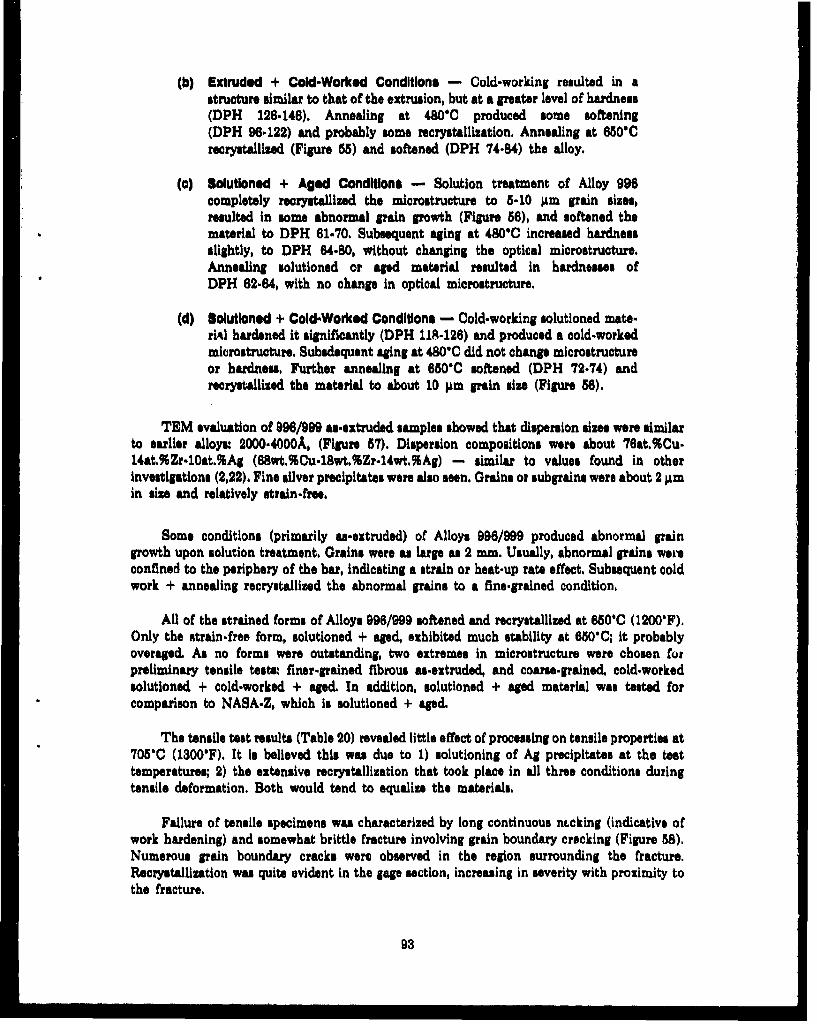
(b) Extruded + Cold-Worked Conditions - Cold-working resulted in astructure similar to that of the extrusion, but at a greater level of hardness(DPH 126.146). Annealing at 480'C produced some softening(DPH 96-122) and probably some recrystallization. Annealing at 650'Crecrystallized (Figure 55) and softened (DPH 74-84) the alloy.
(a) Solutloned + Aged Conditions - Solution treatment of Alloy 996completely recrystallized the microstructure to 5-10 ipm grain sizes,resulted in some abnormal pain growth (Figure 56), and softened thematerial to DPH 61-70. Subsequent aging at 480'C increased hardnessslightly, to DPH 64-80, without changing the optical microstructure.Annealing solutioned or aged material resulted in hardnesses ofDPH 62-64, with no change in optical microstructure.
(d) Solutioned + Cold-Worked Conditions - Cold-working solutioned mate-riod hardened it significantly (DPH 11-126) and produced a cold-workedmicrostructure. Subsdequent aging at 480'C did not change microstructureor hardness, Further annealing at 650'C softened (DPH 72.74) andrecrystallized the material to about 10 pim grain size (Figure 56).
TEM evaluation of 996/999 as-extruded samples showed that dispersion sizes were similarto earlier alloys: 2000.4000A, (Figure 57). Dispersion compositions were about 76at.%Cu-14at.%Zr-10at.%Ag (68wt.%Cu.lgwt.%Zr.14wt.%Ag) - similar to values found in otherinvestigations (2,22). Fine silver precipitates were also seen. Grains or subgrains were about 2 iimin size and relatively strain-free.
Some conditions (primarily as-extruded) of Alloys 996/999 produced abnormal paingrowth upon solution treatment. Grains were as large as 2 mm. Usually, abnormal grains wereconfined to the periphery of the bar, indicating a strain or heat-up rate effect. Subsequent coldwork + annealing recrystallized the abnormal grains to a fine-grained condition.
All of the strained forms of Alloys 996/999 softened and recrystallized at 650'C (1200'F).Only the strain-free form, solutioned + aged, exhibited much stability at 650*C; it probablyoveraged. As no forms were outstanding, two extremes in microstructure were chosen forpreliminary tensile tests: finer-prained fibrous as-extruded, and coarse-pained, cold.workedsolutioned + cold-worked + aged. In addition, solutioned + aged material was tested forcomparison to NASA-Z, which is solutioned + aged.
The tensile test results (Table 20) revealed little effect of processing on tensile properties at705"C (13000F). It is believed this was due to 1) solutioning of Ag precipitates at the testtemperatures; 2) the extensive recrystallization that took place in all three conditions duringtensile deformation. Both would tend to equalize the materials.
Failure of tensile specimens was characterized by long continuous nLcking (indicative ofwork hardening) and somewhat brittle fracture involving grain boundary cracking (Figure 58).Numerous grain boundary cracks were observed in the region surrounding the fracture.Recrystallization was quite evident in the gage section, increasing in severity with proximity tothe fracture.
93

E
4111
94
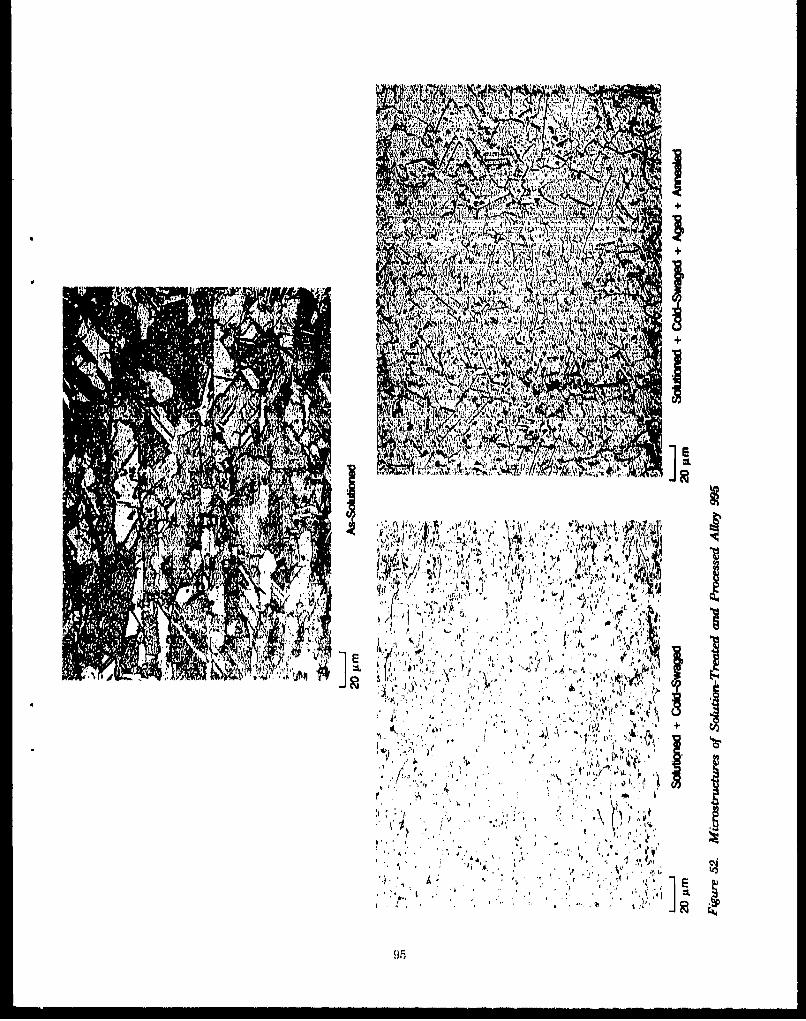
WA W
~AJ.
Ar
AltA
`TY 141
2;.. dif
Vt

2 gm 1 Jim
Figure 53. Electron Microstructures of Alloy 995 (Cu-.,6Zr), as Extruded (TEM-Foil)
Later in the program, additional processing work was done with Alloys 996/999 to producecoarser-grained material for testing. The intention was to increase elevated-temperature tensilestrengths to those of NASA-Z, and to duplicate the NASA-Z microstructure for LCF testing toestablish whether powder metallurgy NASZ-Z could be used instead of cast + wrought NASA-Z,Bars of Alloy 999 were hot-worked 50 percent at 870C (1600°F), producing the workedmicrostructure in Figure 59. Solution treatments produced recrystallization and grain growth to40-80 pra grain sizes (NASA-Z is 60-100 pm) (Figure 59), Tensile specimens were plepared byhot-working and hot-work + solution + age. Tensile properties of each are listed in Table 20, Thehot-worked + solutioned + aged properties were roughly equivalent to those of NASA-Z. Thehot-worked verision was significantly stronger than NASA-Z, evidently because of strainhardening.
Both conditions exp.rienced considerable recrystallization and grain refinement during the705*C (1300'F) tensile tests (Figure 60). Failure was like that of the other Alloy 996/999specimens: grain boundary cracking, with uniform necking and elongation.
(6) Alloy 997: Cu-O.55%Zr-O.O5%6
Alloy 997 was formulated to contain about 0,35 volume percent ZrB2, an well as 0.2 percentexcess zirconium, which would form CuZr primary and agin'g precipitates. As noted earlier, thepowder exhibited a few coarse diborides. Any fine borides were expected to act as a dispersionstrengthener, stabilizing the microstructure and retaining cold work at elevated temperatures,
96

...... .....
•, , • ,..,. .- . :. .. ,,p •
100 AM Grip Region 100 AM Fracture
Figure 54, Microstructures in Solutioned + Cold-Worked + Aged Alloy 995 (SCWA-211)Ten.sile Tested at 7050C (13000Y)
Effects of processing on the alloy were nearly identical to those observed for Alloys 995/998(Cu-Zr). See the Alloys 995/998 narrative for a description, and consult Table 19 for the exacthardnesses observed.
Electron microscopy of extruded Alloy 997 did not reveal any fine borides, just a Cu-Zrdispersion similar to that in Alloy 995.
To evaluate the effect of the small boron addition to Alloy 997, the conditions of Alloy 997chosen for preliminary tensile testing (as-extruded and solutioned I- cold worked I- aged) werethe same as those used for testing of Alloy 995 (copper-zirconium).
Tensile test results were almost identical to those of Alloy 995 (Table 20), also supportingthe absence of a fine beoide dispersion, Fracture modes were similar to those of Alloy 995: thecoarse borides did not embrittle the alloy.
97

I,4.I
11�
II
98
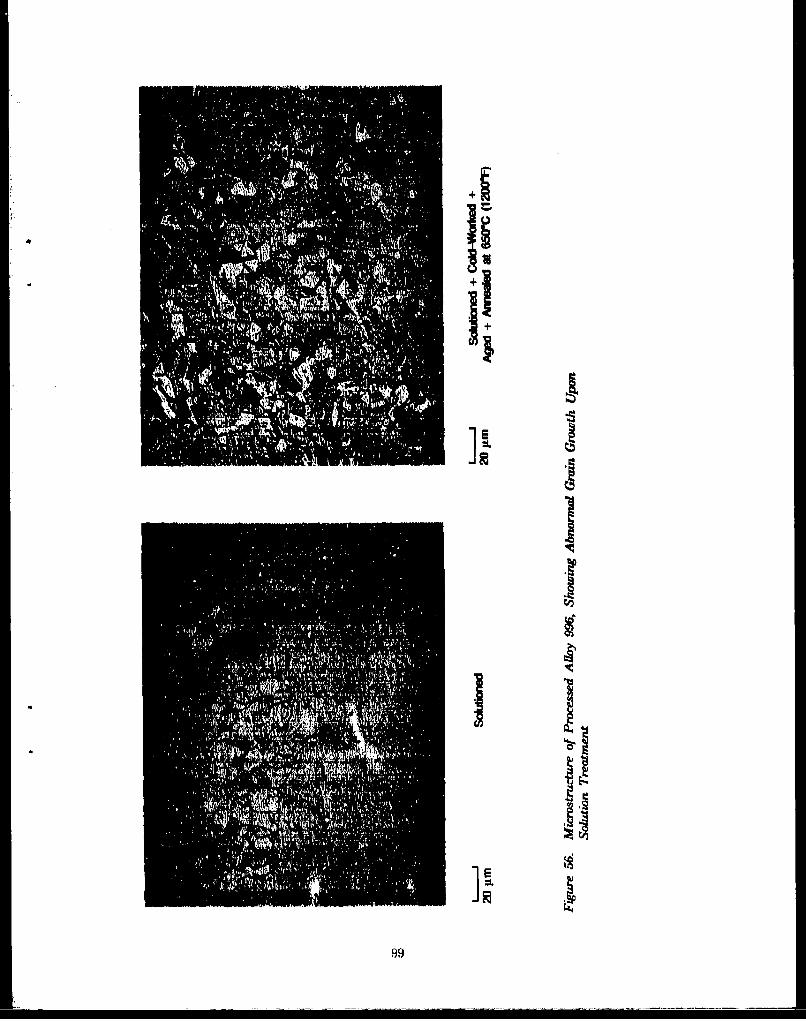
11* I
II
III
I�I
99

2 gm IJMm
Figure 57, Electron Mwcrograph~a (TEM-Fo il) of Asa-Extruded Ailoy 996
(7) Alloy 1032: Cu0.7%TlI..%H
Alloy 1032 exhibited significant age hardenability, and good microstructural stability at650'C (12007) after certain processing sequences. Specific results of' processing are detailedbelow,
(a) As-Extruded Conditions - The as-extruded microstruzcture was partiallyrecrystallized, fibrous, with grain sizes of less than 5 gm (Figure 61).Annealing at 650'C (1200*P) changed neither hardness (DPH 100) normicrostructure.
(b) As-Extruded + Cold-Worked Conditions - Cold working increasedhardness to TJPH 155, and subsequent annealing at 650'C recrystallized(Figure 61) and softened (DPH 85) the alloy.
(c) Solutioned + Aged Conditions - Solution treatment at 925'C (1700*F)completely recrystallized (Figure 61) and softened (DPI- 80) the alloy.Grain size was 5410 ýtm, Aging at 480'C (900'F) hardened the alloy to DPH146, but subsequent annealing at 660*C overaged and softened the alloy toDPA 76.
(d) Solutioned + Cold-Worked Conditions - Cold working of solutionedAlloy 1032 hardened it to DPH 132 and produced a cold-worked micro-structure. Subsequent aging at 480'C further hardened the alloy to l)PH168. Further annealing at 650'C overaged the material, reducing thehardness to DPH 122, but did not produce recrystallization (Fi1gure 61),
100
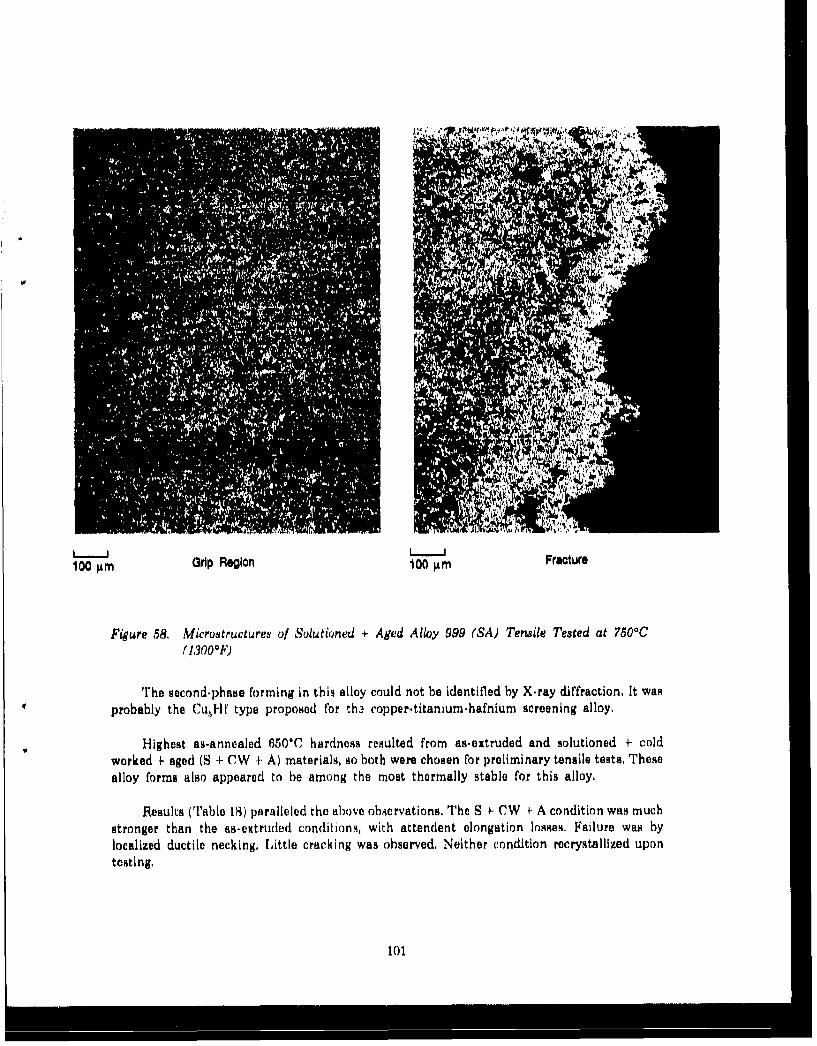
to L
100 gm Grip Region 10o ýrm Frioture
Fig ure 58. Microstructures of Sohstiorted + Aged Alloy 999 (SA) Termite Tested at 7.500C(130011F)
rhe second-phase forming in this alloy could not be identified by X-ray diffraction. It wag
probably the Cu~l-lf type proposed for th2 copper- titanium -hafniu m screening alloy.
Highest as-annealed MOT0 hardness resulted from as-extruded and solutioned +- coldworked +- aged (S + CW + A) material.4, go both were chosen for preliminary tensile tests, Thesealloy forms also appeared to be among the most thermally stable for this alloy,
Results (TIable 19) patralleled the above observations. The S i- CW i- A condition was muchstronger than the as-extruded conditions, with attendent elongation losses. Failure was bylocalized ductile necking. L.ittle cracking was observed, Neither condition recrystallized upontesting.
101

IL4.102

...... ...
~ >* 'i03
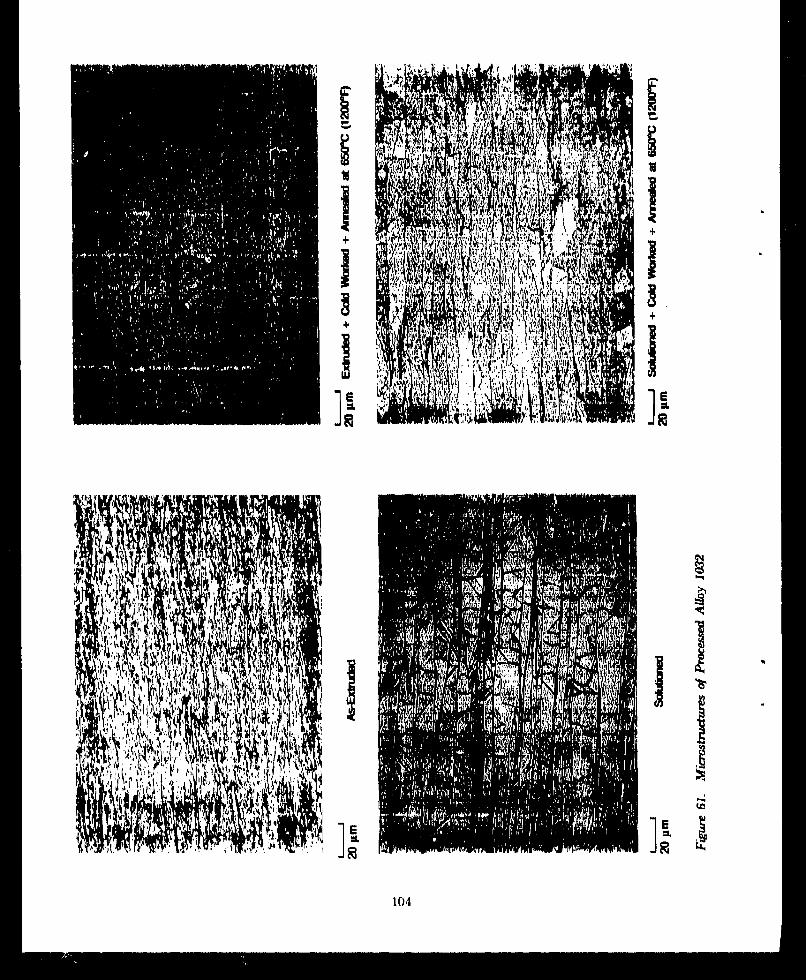
~IN
104

(8) Alloy 1033: Cu..0%Cr-O.2%Co
Alloy 1038 wu expected to form chromium-.bamd precipitates that were more stable thanthose found in conventional copper.chromium alloys. Partial substitution of cobalt for chromiumin the precipitates was expected to decrem lattice.to.precipitate mismatch and increase thestability of the precipitates at elevated temperatures. As it turned out, however, this alloy did notexhibit very good high.temperature stability.
(a) As.Extruded Conditions - This alloy exhibited a coarser as-extrudedmicrostructurs than smen for most other alloys (Figure 62). Grains wereelongated, recrystallized, and about 3.4 pm in sizn Hardness was DPH 80.Annealing at 6506C (1200F) softened the alloy slightly (DPH 74), andappeared to produce large, overaged precipitates (Figure 82).
(b) Extruded + Cold-Worked Conditions - Cold working hardened theextrusion to DPH 114. Subsequent annealing at 6506C (1200F) recrystal-lizd (Figure 62) and softened the alloy (DPH 60),
(a) Solutloned + Aged Condltions - Solution treatment softened (DPH 50)and recrystallized (grain sie 5.10 pm) the alloy (Figure 83). Subsequentaging only slightly hardened the alloy, to DPH 61. Further annealing at6601C softened the alloy to DPH 55,
(d) Solutloned + Cold-Worked Conditions - Cold working the solutionedalloy increased the hudness to DPH 96, Subsequent aging slightlyhardened the alloy to DPH 110. However, the alloy recrystallized(Figure 63) and softened (DPH 56) upon annealing at 650'C.
Analysis confirmed the presence of cobalt and chromium in the alloy. However, cobalt couldnot be found In the large chromium precipitates (microprobe). Because of the low chromiumconcentration, chromium X-ray diffraction peaks could not be detected to determine whether thecobalt was alloying in the chromium phase and changing its lattice parameter.
This alloy did not exhibit much stability or hardness retention at elevated temperatures, soit was not selected for preliminary tensile tests.
(9) Alloy 1035: Cu-1.0%Cr-0.%Zr
Alloy 1035 exhibited age hardanability and, In some cues, very good softening resistance at650"C (12006F). It benefitted from precipitates of Cr and CuaZr. Responses to processing aredescribed below:
(a) As-Elxtruded Conditions - As.extruded Alloy 1035 exhibited a warm.worked ultra-flne-gralned (1 pm) fibrous microstructure (Figure 64).Hardness was DPH 115. Annealing at 650*C (1200F) had essentially noeffect.
(b) Extruded + Cold-Worked Conditions - Cold working hardened theextrusion to DPH 142, with little optically discernable microstructuralchange. Subsequent annealing at 650'C softened the alloy back to DPH110, with no observable recrystallization.
(a) Solutioned + Aged Conditione - Solution treatment recrystallized thealloy to 5.10 pm grain sizes (Figure 64), Hardneu dropped to DPH 70,
105

Aging at 480*C (900'F) increased hardness substantially, to DPH 100.However, additional annealing at 650°C overaged the alloy, softening it toDPH 65.
(d) Solutloned + Cold-Worked Conditions - Cold working solutionedmaterial Increased hardness to DPH 120. Subsequent aging at 480'Cincreased hardness to DPH 144, with no change In microstructure,Additional annealing at 650'C (1200'F) recrystallized (Figure 64) andsoftened (DPH 72) the alloy,
The alloy conditions exhibiting highest softening resistance at 650'C were the as.extrudedand extruded + cold-worked conditions. Both were chosen for preliminary tensile testing.
Results (Table 19) showed that both alloys exhibited roughly equivalent strengths at 70BC(13000P). However, the cold-worked condition exhibited lower elongations than the as-extruded(warm-worked) condition.
Tensile failures were by localized ductile necking, little cracking was observed. The as.extruded condition did not recrystallize upon testing. The extruded + cold-worked conditioncoarsened slightly upon testing.
(10) Alloy 1036: Cu.O.MZr-.1 .fH
Alloy 1036 represented a combination of the Cu.Zr and Cu-Hf systems - both of whichgave promising results earlier In the program as Alloys 993 and 995. The ternary alloy exhibitedslightly more resistance to softening at 650C0 (1200F) and generally higher post-anneal (650'C)harbnesses than either of the binary alloys. Processing effects are described below,
(a) As-Extruded Conditions - Like the binaries, Alloy 1036 extruded to awarm-worked, fibrous, ultra-fine-grained microstructure (Figure 65).Hardness was DPH 110. Annealing at 680'C produced little change(hardness was DPH 100),
(b) Extruded + Cold-Worked Conditions - Cold working the as-extrudedmicrostructure hardened it to DPH 130, The microstructure did not changeobservably. Subsequent annealing softened the alloy to DPH 100, but didnot recrystallize it,
(a) Solutloned + Aged Conditions - Solution treatment resulted in softening(DPH 75) and reorystallization to a fine-grained (5-10 pm) equiaxedmicrostructure (Figure 65). This form of the alloy did not age-harden at480"C (900'F), or soften further upon annealing at 650"C.
(d) Solutloned + Cold-Worked Conditions - Cold working hardened thesolutioned alloy to DPH 130. Subsequent aging at 480'C had no effect.However, the alloy recrystallized (Figure 65) and softened to DPH 70 uponannealing at 850'C.
This alloy did not age-harden, which was not surprising, since Alloys 993 and 995 did notage harden either. Since the as-extruded and extruded + cold-worked conditions equally showedthe most promise for high-temperature use, the as-extruded condition was chosen for preliminarytensile tests.
The tensile strengths obtained (Table 20) were not particularly high. Failure was bylocalized ductile necking-, no cracking was observed. The fine fibrous microstructure was notchanged by testing.
106

(11) Alloy 1033: Cu06%Zr-3.0%4g-1.0%Cr
Alloy 1038 served as a chromium-containing extension of the copper.zirconium-silver(NASA.Z) system. It exhibited the high age-hardenability found in many other chromium-containing alloys, as well as the predisposition toward recrystallization found in high-silveralloys such as NASA-Z. More-detailed processing effects are described below.
(a) As-Elxtruded Conditions - Alloy 1038 extruded to a warm-worked,fibrous, ultra-fine structure (Figure 86) (DPH 130). Annealing at 880*C(1200'F) softened (DPH 98) and recrystallized the alloy (grain size 2-8A~M).
(b) Extruded + Cold-Worked Conditions - Cold working increased thehardness of the extrusion to DPH 160. Subsequent annealing at 8501 Crecrystallized (Figure 66) and softened (DPH 90) the alloy.
(a) Solutloned + Aged Conditions - Solution treatment of the extrusion at02510 (17007) recrystallized the microstructure to equiaxed 5-10 lumgrains (Figure 66) and softened the alloy to DPH S0, Aging at 480C(9007) hardened the alloy to DPH 160, but subsequent annealing at 850O0(1200'P) overaged and softened the alloy to DPI! 78.
(d) Solutioned + Cold-Worked Conditions - Cold working the solutlonedalloy hardened It to DPH 154. Subsequent aging at 4809C did not impartsignificant additional hardening (DPI! 160). Annealing (after age) at 650"Csoftened (DPH 90) and recrystallized the alloy (Figure 68).
The forms chosen for preliminary tensile testing were as-extruded, and solutioned + aged.All of the post-anneal alloy forms had exhibited recrystallized microstructures and mostexhibited hardnesses in the DPI! 90 range. As there was minimal difference in post-annealhardnessas, variety In microstructure and imput hardness became the criteria, so the fine-grainedas-extruded and coarser hardsned + solutioned + aged forms became candidates for testing.
Strengths of the two conditions (Table 20) were essentially equivalent: the as-extrudedmaterial was slightly stronger and more ductile, With the addition of silver, failure moderesembled those of copper-zirconium-uilver alloy.~ diff~se necking and cracking at the failure. Thealloy also recrystallized In the neck region (Figure 67).
107
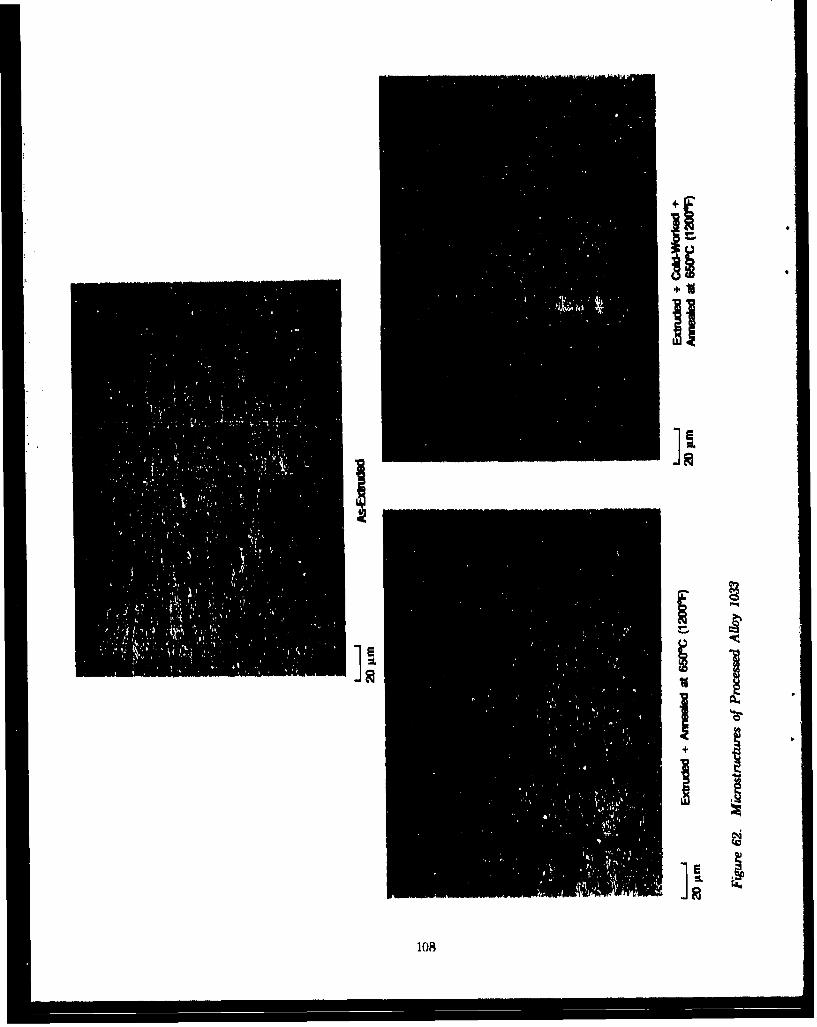
ii
I
Ii
11I+ *1I .1
108

1091

LJI. Il--•i hl.'4,
110 -.

iii
IV
ilif

4 A% ' t
A 'p 'n* '' A
¼ Al
N~I.- ZL', P
U , ; JMj ii 1 , 4.V
..,rk .w .e ~~' .! t' ..~ .Vj.4L
112w *ILr

idi
113a
(12) Aloy 1042: Cu-..4%CoO.4%V
Alloy 1042 was originally a wash-heat composition. Since the wash heat (No. 1034) did notproduce sufficient powder for use, another run was made (No. 1042). This alloy exhibited no age.hardenability and good properties only in conditions having fibrous (as-extruded type)microstructures.
(a) As-Elxtruded Conditions - The alloy produced an ultra-flne-gpained,fibrous, warm-worked microstructure upon extrusion (Figure 68). Anneal-ing at 650*C (12001F) did not change microstructtre or hardness(DPH 100).
(bM Extruded + Cold-Worked Conditions - Cold working of the extrusionincreased hardness somewhat (DPH 120). Annealing at 650C (12001F)softened the cold-worked alloy slightly (DPH 100), but recrystallizationwas not apparent,
(a) Solutioned + Aged Conditions - Solution treatment resulted in a soft(DPH 60) fine-pralned (5 ým) recrystallized material (Figure 68). Nochanges were produced by subsequent aging or anneals,
(d) lolutioned + Cold-Worked Conditions - Cold working of solutionedmaterial produced hardening (DPH 100). Subsequent aging at 480'C(900'%) softened (DPH 70) and recrystallized the alloy (Figure 68). Furtherannealing at 650"C (1200F) produced no further changes.
Because of the low alloy concentrations used, phases could not be detected or studied bycursory X-ray diffraction.
The Alloy 1042 exhibited highest resistance to softening and was hardest in the as-extrudedand extruded + cold-worked conditions. Since both conditions were very similar, the as-extrudedform was chosen for preliminary tensile tests. This alloy condition exhibited average strengths atthis temperature, (Table 20). Failure was by localized ductile necking. Little mlcrostructuralchange was observed upon testing.
(13) Alloy 1043: Cu-1.O%Cr-3.0%Ag
Alloy 1043 wu formulated to combine the age hardening capabilities of chromium andsilver additions. The alloy was found to be quite susceptible to recrystallization, which was notsurprising, since NASA-Z, which also contains 3 percent silver, is susceptible to recrystallization.Specific responses to processing are described below.
(a) As-Extruded Conditions - Alloy 1043 extruded to a fine, fibrous, warm-worked structure (Figure 69) with a hardness of DPH 130. Annealing at650"C (1200'F) softened (DPH 90) and recrystallized the material.
(b) Extruded + Cold-Worked Conditions - Cold working the extrusionhardened It slightly (DPH 150). Subsequent annealing at 6500C recrystal.lized and softened the material to DPH 90 (Figure 69).
(a) Solutioned + Aged Conditions - Solution treatment recrystallized(Figure 69) and softened (DPH 75) the extrusion. Subsequent aginghardened the alloy to DPH 110, but further annealing softened it back toDPH 75.
114

(d) Soluloned + Cold-Worked Conditions - Cold working increased thehardness of solutioned material to DPH 140. Subsequent aging at 480"C(900*F) produced no Increase in hardness, Further annealing at 650*Crecrystallized the material and softened it to DPH 75 (Figure 69).
Alloy 1043 wu found to age harden in a manner similar to other Cu-Cr-X alloys. It also wasfound to be most stable in the s-extruded condition. Therefore, preliminary tensile test materialconditions were chosen with these histories: as-extruded, and solutioned + cold-worked + aged.
The results (Table 20) did not show much difference in properties between the twoconditions. As with the other two silver-containing alloys (NASA.Z/996/999 and 1088), this alloyfailed by diffuse necking and cracking. Voids and cracks (at grain boundaries) were observedaround the failure. Recrystallization was evident in the neck region, as with other silver-containing alloys.
4. EVALUATION OF NASA-Z
NASA-Z is NASA-LeRC's version of NARloy-ZTu. The primary differences between the twoalloys are melting source (AMAX for NASA-Z), melting conditions (NASA-Z under argon,NARloy.Z' in vaccum), end processing (NASA-LeRC overuees processing (forging + heat treatof NASA-Z),
Five pieces of NASA.Z were supplied for this program, Two were hollow cylindricalforgings, named NASA-Z1 and NASA-Z2. The other three were apparently either pancakesections or billet slice sections, named NASA.Z3, 4, and B. NASA-ZI and 2 were originallybelieved to be equivalent. However, test specimen blanks revealed the presence of very large(> 2mm) grains in NASA.Z2, Figure 70). These were absent from NASA-Zi (Figure 70).Additional material was requested and supplied as NASA-Z, 4, and 5, Microstructures of themeforgings were similar to NASA-Zi.
The microstructure of NASA-Z typically exhibited 50-100 gam equiaxed grains. The gainboundaries, and to some extent Interiors, exhibited coarse primary Cu-Zr-Ag precipitates(Figure 70). Also evident were annealing twins, and intragranular etch attack suggestive of fineprecipitates from the aging treatment.
Preliminary tensile tests were done on NASA-Z with the first iteration of powder alloys, ata strain rate of 6 percent per second. The results (Table 20) exhibited very high elongations andrelatively low reductions of area. Failure was by grain boundary cracking (Figure 71) explainingthe low reductions of aea. Extensive grain deformation and recrystallization were observed inthe test specimens - indicative of a high level of work herdenlng. This behavior was observedonly in NASA.Z and other silver-containing alloys, and was believed to result ftom silver solidsolution or precipitate hardening (although precipitate hardening was never found to be morethan slight).
Also evident in NASA-Z tensile specimens was surface roughening, believed to result fromits larger grain size. Fine-grained PM alloys (even Cu-3%Ag-0.5%Zr) did not exhibit suchroughening.
116

f J4
I It 1
5 ~j~4~i"?PTO
fit
10114
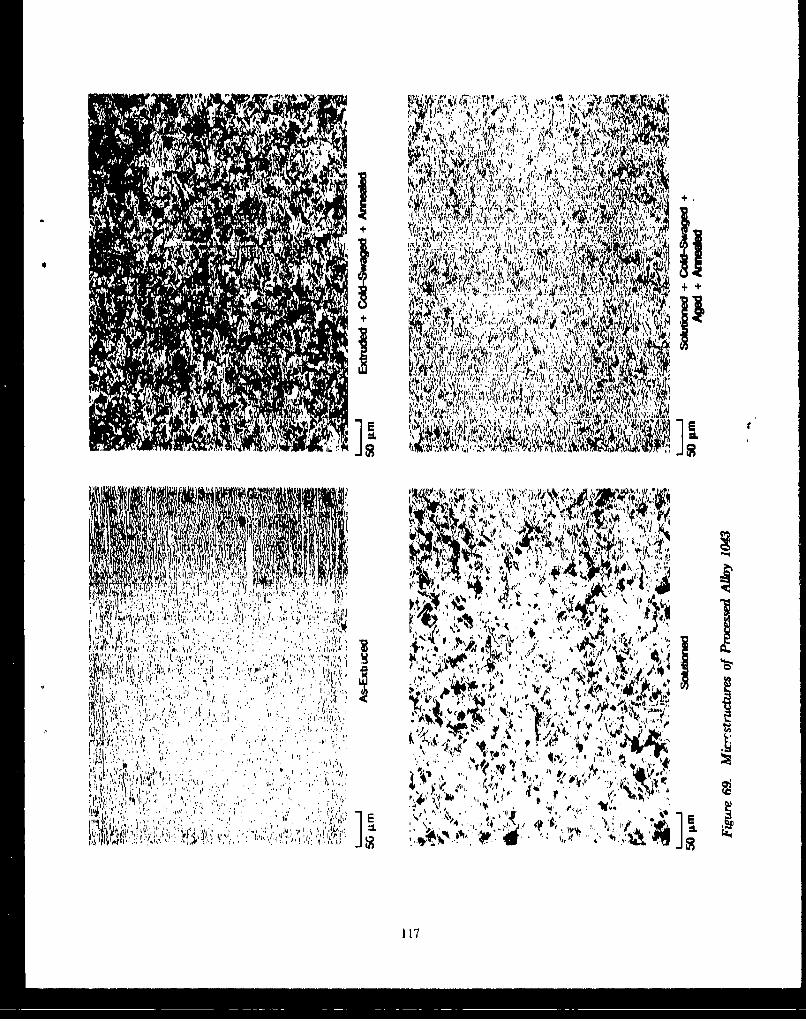
" ',p : 1 V 2 b '7 4 . %4 4
jjr~$$if4 4& 4
tAQ~ ~ŽTIM':i T y x 4 t
Gov , 1,g12)' 1~ " tA ý
"If 4, ' s, 4 4 't O ¾ k Ct'j I
W.1I2?
-~~~~~~
+~/t ~.1; 1A
A~ ~ ~~~~~~f T.,
tt!<'~~ 'L
.Pl4
~j~r 4 Mt¾ b ~ j '4aAy.
P~ ~ t e J;'
I/ j
A&V
4 V ttit
4'4
Al, I
riMj
Ii '4117

I
I NN
IIi
118
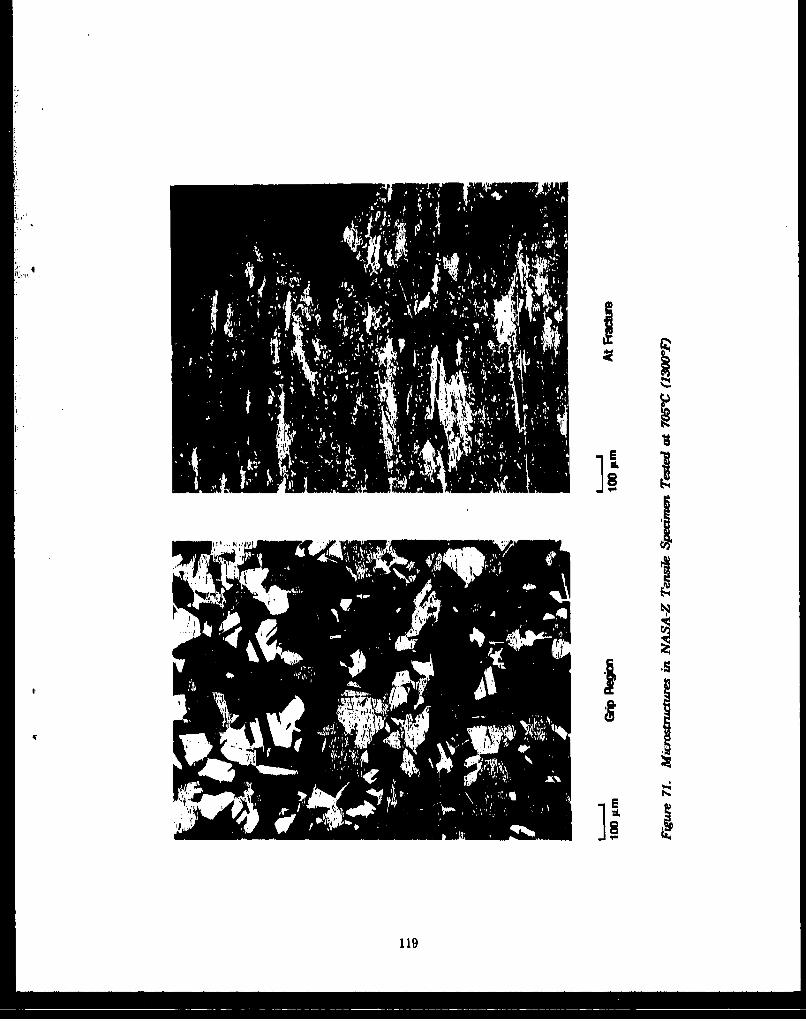
IIi I
2 Iub
z
IN
11 1
119

Tensile tests at 10 percent per second strain rate (for characterization) yielded somewhatdifferent properties (Table 20) but similar structural phenomena. The significantly lowerelongation may have resulted hrom a localized furnace gradient found later.
5. DISCUSSION
Overall, the second-iteration alloys were stronger than the first.iteration alloys. Strengthswere also dependent on processing, as evidenced by the twofold increase observed with Alloy 993when processed differently.
The strongest alloys at 705'C (1300F) were
993 Cu-,11%Hf1082 Cu-0,7%TI-0.8%Hf1085 Cu-0.6%Zr-1.0%Cr
Moderately strong alloys. were
990/999 Cu-0,•%Zr-3.0%Ag1036 Cu.0,8%Zr-0.7%Hf1088 Cu.0.6%Zr-1.0%Cr.3,0%Ag1042 Cu-1,4Co-0.4%V1043 Cu.1.0%Cr-8.0%Ag
Weakest were
995 0u.0,6%Zr997 Cr-0,58Zr.0,05MB
Those alloys based on chromium, hafnium, zirconium, and silver additions performed best.Therefore, novel superior systems were not found, The novel systems, such as copper-cobalt-vanadium, boeides, and copper.cobalt-chromiun, were inferior to more conventional systems.One system, Cu + ZrB,, was completely unsuccessful.
NASA.Z exhibited properties near the midpoint of the PM alloy property range, The mostsignificant difference between it and the PM alloys was its large grain size. This appeared topromote the surface roughening observed on tested NASA.Z tensile specimens and absent onother alloy specimens.
Processing was instrumental in demonstrating equivalence between conventional NASA-Zand powder metallurgy NASA.Z (Alloys 996/999). Early tests of powder metallurg NASA.Zshowed it to be weaker, but more ductile, than conventional NASA-Z. Additional processingwork resulted in materials (999 HW and 999 HWSA) with strengths roughly equivalent to orhigher than those of conventional NASA-Z.
Microstructures of the alloys were all fairly similar. Those that did not contain Ag extrudedto warm-worked structures and had a greater tendency to stay that way. Addition of silver tendedto Increase susceptibility to necrystallization during extrusion, sometimes during processing, andduring testing, possibly by increasing the strain hardening coefficient.
Those alloys not containing silver failed by smooth localized necking (to nothing). Silver.containing alloys failed by diffuse necking and grain boundary cracking. The diffuse neckingimplied a greater degree of strain-hardening during testing, while the grain boundary cracking
120
indicated a grain boundary weakness that may have been related to precipitate-free zones (seenin NASA.Z) or dynamic recrystallization at grain boundaries (seen in NASA-Z tensile tests),
The dispersions formed In the powder metallurgy alloys were not as fine as were desired foreffective strengthening. About an order of magnitude too coase, they resulted from theinstabilities of the compounds used. However, attempts (during screening) to find more stabledispersions were unsucceasul. By the start of the second powder Iteration, extremely finedispersions were no longer expected from the available systems, However, benefits from thereduced segregation produced by rapid solidification were still expected. Such benefits would bemost evident in fatigue testing (covered in a later section) and in hardware manufacture.
121

SECTION VALLOY CHARACTERIZATION
After evaluation, several alloys were selected for characterization, along with NASA-Z.Characterization consisted of thermal conductivity testing, tensile testing, creep testing, and low.cycle fatigue (LCF) testing at up to 705'C (1800'F) which was the maximum anticipated OrbitalTransfer Vehicle (OTV) chamber temperature,
Theme properties were identified by preliminary design studies as having the greatest effecton thrust chamber performance and life, Thermal conductivity testing was tailored to producethermal conductivities over the entire range of room temperature to 705'C. Tensile testing wasperformed at 540'C (1000F) and 7056C at a high strain rate to simulate the loading experiencedin thrust chamber use, Creep testing was conducted at 705'C at the alloy yield stress to producepost-yield creep rates to predict thrust chamber hold behavior. Low-cycle fatigue testing wasperformed at 705'C under strain control with a simple, fully reserved no-hold cycle (a more.sophisticated test was not defined), LCF strain rates were high to simulate thrust chamberconditions. LCF strain ranges ran from 0.75 percent to 3 percent. All tests were conducted in avacuum or in argon to prevent oxidation.
Four developmental alloys were chosen for characterization, along with NASA.Z. Thesewere Alloys 039, 995, 1032, and 1035. Alloys 993, 1032, and 1085 were chosen for their highstrengths. Alloy 998 was chosen because of its similarity to Amuirc, which has demonstratedbetter LCF performance than NASA-Z, As characterization progrmesed, Alloy 1032 was found tohave very low thermal conductivities and was dropped from the characterization effort. Alloy996, processed to a grain simz equivalent to that of NASA-Z, was LCF tested to determinewhether it could be processed to yield properties equivalent to its conventionally-processedcounterpart, NASA.Z (this would allow the fabrication of chambers from powder mealurgyNASA-Z),
The alloys were characterized in the following conditions:
998 Cu-1.1%Hf Hot-worked + solutioned + cold-worked (80%) + aged995 Cu.0.BZr As-extruded996 Cu-0.5%Zr.3%Ag Hot-worked + solutioned + aged
1032 Cu-0.7%Ti-1.1%Hf Solutioned + cold-worked + aged1035 Cu-0,8%Zr.l.0%Cr AM-extrudedNASA-Z As-supplied by NASA LeRC
Conditions were chosen based on preliminary tensile tests (last section). Alloy 993 wasprocessed to the type of condition shown to produce highest strengths, but cold-worked less toincrease ductility somewhat. Alloy 995 was tested us-extruded, because that was found earlier tobe its strongest condition. Alloy 996 was hot-worked + solutioued + aged to produce a conditionthat was microstructurally similar to NASA-Z, Alloy 1082 was solutioned + cold-worked + agedbecause that condition exhibited significantly higher tensile strengths and elongations than theas-extruded condition. Alloy 1038 wu tested as-extruded, because this condition exhibitedsignificantly higher ductilities than the slightly stronger extruded + cold-worked condition.
1. RESULTS OF CHARACTERIZATION TESTING
a. Thermal Conductivity
Thermal conductivity was measured from room temperature to 705C (13006F) by thermaldifusivity measurements at the Purdue Thermophysical Properties Laboratories. The diffuMivity
122

method was selected because it allowed the use of a relatively small specimen. Purdue wasselected because of its experience in measuring both specific heat and thermal diffusivity, whichae required to calculate thermal conductivity.
Prior to testing, all specimens were annealed (before machining) at 705'C (1300 F) for onehour followed by air cooling. This was done to simulate prior exposure to the 705*C usetemperature.
The results for Alloy 993, 996, 1032, 1035, and NASA-Z are shown in Figure 72 (numericalresults are tabulated in Appendix A). The results are computed from Purdue diffusivity andspecific heat data, and Pratt & Whitney (P&W) density measurements (995 and NASA-Zdensity measurements were temperature-corrected using data from (37)).
Thermal conductivity results for Alloys 995 and NASA-Z were in reasonable agreementwith those of NARloy-Z' and Amairc obtained from the literature. Alloy 995 had the highestconductivities, while Alloy 993 had conductivitiss about 5 percent lower than those of NASA.Z.Alloy 1035 was essentially equivalent to NASA-Z. However, Alloy 1032, containing titanium,exhibited such low conductivities that it was dropped from the characterization effort.
b. Tensile Results
The selected alloys were tensile tested at 540"C (1000'F) and 705'C (1300'F) in argon,using a strain rate of 10 percent per second to approximate thrust chamber conditions. Tensilestrength, 0,2 percent yield strength, elongation, and reduction in area were reported.
Alloys 993, 995, 1035, and NASA.Z were tested. Complete resulta are tabulated in Table 20.At 705'C, Alloy 1035 exhibited the highest strengths. Far lower in strength were NASA.Z andAlloy 993, then Alloy 995, NASA.Z exhibited the highest elongation but lowest reduction in area.At 540*C, Alloy 993 was strongest, closely followed by Alloy 1035, and then NASA.Z and Alloy995. The powder alloys again exhibited significantly higher reductions in areas than NASA.Z.Strength variations were observed with Alloy 993 at 540'C and attributed to grain size variations,finer being stronger. Temperature gradients later found in the retort may have affected strengthsand elongations somewhat, but should have done so consistently.
Additional tensile tests were performed on Alloys 995 and NASA-Z at low strain rates toproduce proportional limits for use in specifying creep tests, The results (Table 21) showed thatthese materials were very strain.rate-sensitive at 705'C. Tensile strengths dropped by up to37 percent with the decrease in strain rate.
a. Creep Test Results
Creep rates were measured at 705'C (1300'F), at the proportional limits of the alloys. Thiswas intended to measure creep rates at the yield points, so as to determine creep resistance in thehold portion of the chamber cycle. Tensile tests were carried out at a stain rate of 0.0005 persecond to determine the proportional limits, and creep tests were conducted at the respectiveproportional limit stresses at 7050C. Creep test loads were applied at a strain rate of 0.1 persecond.
123

Temperature - OF
I I I I I I4001 200 400 G00 Boo 1000 1200
00003• 00 0- o
150
Thermal ThermalConductivity - 200 ConductIvIty-
W/m, $0 Btu/ft, hr, OF
100
100 0SLegend 50
0 993
S1035S
0 I ,, t , i , I I I0 100 200 300 400 5oo o00 708
Temperature - 00
Figure 72, Thermal Conductivities of Copper Alloys Annealed at 705"C (1300F) for 1Hour Prior to Test
124
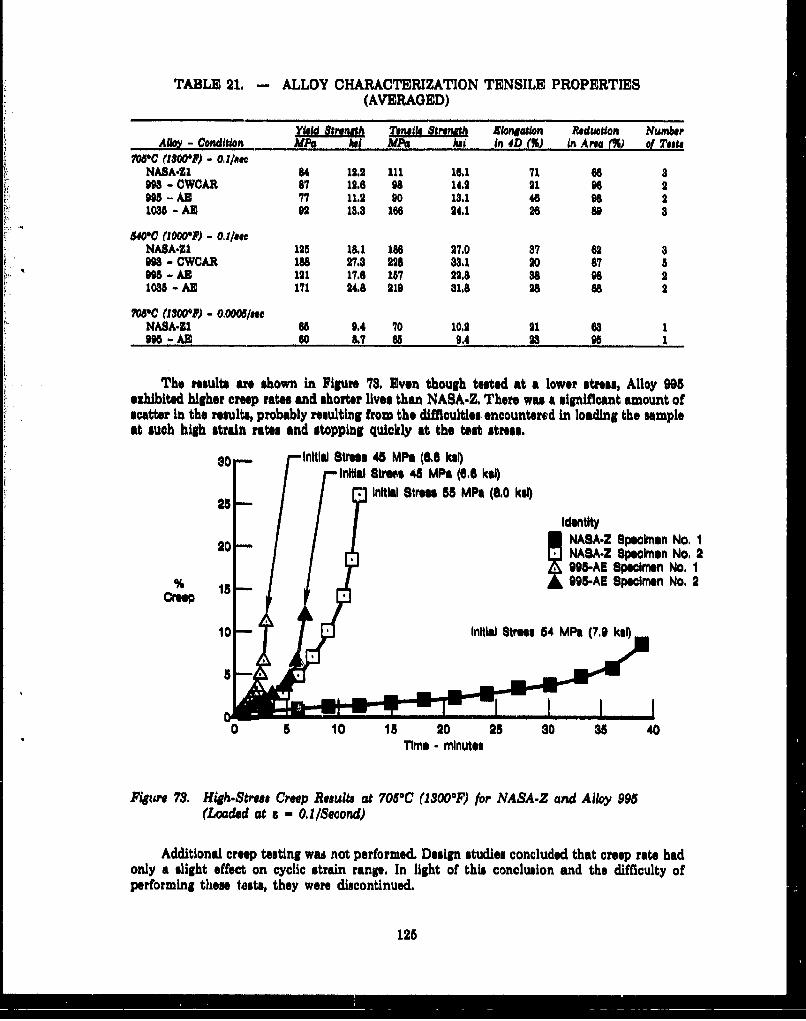
TABLE 21, - ALLOY CHARACTERIZATION TENSILE PROPERTIES(AVERAGED)
Yield Tensile Steuth Zloation Reduction NumberAby• - Condition MPa Iai MPG hi in QD (M) in Area M') of Tests
700C (0oISo) - 0,0/40NABA.Zl 84 1232 111 16.1 71 66 8099 - MWOAR 87 12.8 96 14.2 21 g6 2905 -A E 77 11.2 s0 18.1 46 98 2108-5A3 92 18.3 166 94.1 26 so 8
540C0 (0000F) - 0.1/80eNABA.Z1 125 18. 16 27,0 87 62 8998 - CWCAR 1M 27.8 928 88a. 20 87 5098 - AS 191 17.6 187 22.8 88 98 21088 - AE 171 24.8 219 1),8 28 as 2
708'C (100OF) - 0,0008/meNASA.Z1 68 9.4 70 10,2 91 68 1998 - AS 60 8.7 6 9.4 23 98 1
The results are shown in Figure 73. Even though tested at a lower stress, Alloy 995exhibited higher creep rates and shorter lives than NASA.Z, There wu a significant amount ofscatter in the results, probably resulting from the difficulties encountered in loading the sampleat such high strain rates and stopping quickly at the test stress.
so initial Stress 45 MPa (6.6 ksl)Initial Streus 45 MP (6.6 ksi)
InitWi Stress 55 MPa (6.0 ksq)
Identity0NASApZ pecimen No. I20 NASA.Z Speolmen No, 2
995-AE Specimen No. 1% 15995-AE Specimen No. 2
Creep 1
10 inltla Strem 54 MPa (7.9 kar
0 5 10 15 20 25 30 35 40Time - minutes
Figuire 73. High-Stres Creep Results at 705°C (1300*F) for NASA-Z and Alloy 995(Loaded at a - 0.1/Second)
Additional creep testing was not performed. Design studies concluded that creep rate hadonly a slight effect on cyclic strain range. In light of this conclusion and the difficulty ofperforming these tests, they were discontinued.
125

d. Low-Cycle Fatigue Testing
Low-cycle fatigue testing of Alloys 993, 995, 1035, and NASA-Z was conducted as part ofthe characterization effort. Alloy 996 was also tested to allow comparison of its properties withthose of its counterpart, NASA-L Alloy 1082 was tested as well, as part of the specimenconfiguration trials.
Low-cycle fatigue testing was performed at 705'C (1300'F) under strain control in a210 kPa (80-petg) inert argon atmosphere. Tests were preformed using fully reversed cycles (noholds) at a frequency of 0.6 Hz.
Because copper alloys had not been LCF tested previously at P&W, some developmentwork was neceesary before valid tests could be performed. This work included test machineselection and modification, specimen design and revision, and trial testing.
The LCF tests were performed in i P&W high-pressure hydrogen LOF machine becausethis device allowed testing of a high-conductivity material under strain control in a controlledatmosphere. This was the most appropriate test rig available at P&W. As trial testing progressed,modifications to the linear variable displacement transformer (LVDT) extensometer wereneeded, adding cooling to alleviate the overheating ezperienced in early testing (attributed to theuse of a low-.presur argon atmosphere Instead of high-pressure hydrogen),
Specimen configurations had to be established and modified also, to accommodate the highplastic strains encountered in this testing effort, Initially, the specimen was configured as shownin Figure 22. The cylinderical gap section allowed simple calculation of strain, while the collarsallowed the solid attachment of the extensometry needed for the high strain ranges and strainrates planned for this testing effort. As trials progressed, a new specimen evolved (Figure 22)with smaller-diameter collars to avoid collar deformation, a shorter gaap length to minimizebuckling, and a slightly increased shoulder diameter to avoid failure outside the collar.
Strain rates of 0.1/second were initially planned, However, testing was actually conducted at strainrates produced by a cyclic frequency of 0.5 Hz: 0,0075 to 0.03/second (depending upon strain range), asthis was the fastest the LCF rig could be run in a precisely controlled manner.
Trial tests established a failure criterion somewhat more sophisticated than completefracture. Since the specimen could not be observed, fracture could not be seen when it occurred.Specimens removed from initial trials were destroyed because testing had continued for severaladditional cycles after fracture. In addition, the extensometry could not accommodate thecollisions of the post-fracture specimen halves. It had been observed during testing that the cyclicstres range dropped due to softening at a rate that was linear when plotted logarithmically. Asfailure began, the stress dropped at an Increasing, nonlinear rate. Concurrently, cusping appearedon the stress-strain hysteresis loops, at stress ranges generally corresponding to 20 percentdeviations from the linear relationship. Since cusping generally indicates the presence ofcracking in the specimen, failure (Nt) was defined as the point at which at 20 percent deviationfrom the linear (log) cyclic stross-versus-cycles relationship occurred. All values of Nf werecalculated in this manner. Cycling of the specimens was terminated after Nt was reached andbefore complete fracture occurred, avoiding damage to the specimens and the extensometry.
Results of the LCP testing are listed in Table 22 and plotted as strain range venus life in Figure 74.Alloy 993 exhibited the longest life, followed by Alloy 995. NASA-Z exhibited sipnlflcandy shorter LCFlife, about 25 percent of Alloy 993 at 3 percent strain range. Alloy 996 fatigue life was close to that ofNASA-Z. Alloy 1035 exhibited the shortest fatigue life, Presentation of the data as plastic strain rangeversus life, Figure 75. looked essentially the same as total strain range versus life.
126

TABLE 22, - COPPER STRAIN CONTROL TEST RESULTS
Initial Stire Nf#2 StraeSpeoimne strain item BEon Cycles to Specimen
Material Number ant ( MPG 401 MPO lot Faure Corn/mation9.6 1 1.5 145 21 88 12 ON 16180998 2 1.6 181 lB a 19 1100 16180996 8B 8.0 188 20 108 15 260 16180
so5 Sc 8.0 146 21 9 14 869 16180sea SID 0.75 146 21 88 12 4200 16150
995 33 1,6 145 21 so 18 800 161501062 82A 1.5 920 82 186 20 920 17710.A1069 82B 1.6 284 4 188 20 760 17710.A1069 32C 8.0 241 38 168 28 860 17710-A
1 8I Ili 1.5 158 2• 14 1705 17710.A996 8K 8.0 188 20 108 15 475 17710.AD9o 98A 1.6 1I8 27 96 14 1420 17710.A.98 988 8.0 162 22 103 15 615 17710.ANASA.4 Z4A 1.6 166 94 168 28 481 17710.ANASA44 84B 8.0 188 27 179 26 142 17710.ANASA'Z6 26A 1.6 171 26 173 25 280 17710.A-ASAN.Z6 688 8.0 207 80 218 81 198 17710.A1085 85A 1.8 817 46 269 88 210 17710-A
s106 863 1.6 810 45 286 87 200 17710.A1068 880 8.0 296 43 285 87 102 17710.Aon6 "OA 1.5 186 27 198 98 246 17710.A
04 13. 1.5 179 26 152 32 410 17710.AoW B 8.0 200 29 214 81 112 17710.A
(All tasts 7051C (1800"F) 0m 0, cylo freq. -0.5 O f, 210 kPa (80 pal) Aron environment)
Legend
0 NASA-Z
Total Strain (>996Range - %..9_-..W•_e -(M ean)_
•:9 -_ _wS. (M.sa.__NASA-Z Material (Mean)
106(Mean)
0.5III10 100 1,000 10,000
Cycles to Failure, N,
Figure 74. Strain Control Fatigia Teting of RSR Copper in Argor4 Uing Collared StrainControl Specimen, 210 hPa Argon Environment at 706"C (1300F);Mean Strain - 0, Cyclic Frequency - 0.5 He
127

Examination of the LCF specimens (shown in Figure 76) revealed that Alloys 993 and 995failed by formation of gross shear bands and yield instabilities along those shear zones. On theother hand, NASA-Z failed by formation of numerous cracks. These failures resembled thou ofthe tensile tests, where the 998, 995, and other silver.free alloys failed by localized, very ductilenecking, whereas the NASA-Z and other silver.containing alloys failed by uniform necking andcracking (usually along grain boundaries).
Legend
A995SNAGA-Z
', •@1032
0.001 SO oc1~i
10 100 1.000 10.000Cycles to lure, N,
Figure 75. Inelastic Strain at NPF12 Versus Cycles to Failure for Copper Alloys' (VariousCIles;s True Inelastic Strain)
Cyclic stress ranges are plotted in Figures 77a and 77b, and show that NASA.Z wascyclically stable while Alloys 993, 995, and 1035 all softened somewhat, Evident from this datawus the tendency for the alloys that exhibited lower cyclic stress ranges to exhibit longer lives.Alloy 1035, which wus strongest in tensile testing and exhibited the highest cyclic stress ranges,exhibited the shortest cyclic life, Alloy 993 softened during testing to reach one of the lowestcyclic stress ranges and exhibited the longest life.
This phenomenon was evaluated through the analyses of hysteretic damage, When thetensile hysteretic energy at NW/2 (area In the tensile portion of the cyclic stress-strain hysteresisloop) was plotted versus specimen life (Figure 78) the trend for life to increase with decreasinghysteretic energy was very obvious. This seemed to suggest that life would increase even furtherwith softer materials. However, that wuis not the case In earlier tests at Mar-Test, where oxygen-free, high-conductivity (OFHC) copper exhibited significantly lower lives than NARloy-Z' andAmzire (3, 4, 6).
128

RSR 993, 1.5% As, Nt " 1420 RSR 995, 1.5% As, N, - 1705
R$R 998, .0% As, N, - 616 R$R 995, 3.0% A., N, - 475
U . . MIW ............. .....NASA-Z4, 1.5%,A&, N, - 485 NASA.Z5, 1.5% As, Nf - 260
NASA-Z4, 3.0% As, Nf - 142 NASA-Z5, 3.0% As, N, - 198
Figure 76, Deformation Characteristics of RSR 993, RSR 995, and NASA.Z
129

40
2000
20 KsI
MPG
100
p~ip" 7a Cyou. Stw8Rn fJto C? 14 (cyclic sowsa now$ for WFp not at
40
RSR 996 so
200 Nmsme *2~ ALSA.ZS
RunGamP 20 k sI
S8R 995
1000
1000
10 eycles
FiguW 77b. Cyclic Stream RaE*Ee~ta on LCF Lift (CyclIC Stream Ranjos for LCF no ting
1.30

10 Legend
-- NASA Z4- NASA Z5
-RSR 993
ASIR 995i~% ,,RSR gBS
AW • MPa 1 ,-RSR 1032
~~ ~RSPI$ 1036Data Mean
01l010 , lilill , ' ' 111111 , , , 111lll100 1,000 10,000
cycles to Failure
Pion 78. Hyster•tic Eneniy Damage Funcdon Versus Cycles to Failure for Coppsr Albrs(Var'ious Ccles.; T~uw Inelastic strain~)
Based on LOP testing, Alloy 998 ezhibited the greatest potential for use In a long-lifereuseable thrust chamber. Alloy 995 was almost as good. Alloy 996, which was a powdermetallwiy version of NASA.Z, had LOP life about as good as that of NASA.Z, demonstratingthat NASA-Z composition thrust chambers could be made via powdur metallurgy with no lifedebit.
131
SECTION VICONCLUSIONS
The goal of this program was to develop rapidly solidified powder metallurgy (PM) high-conductivity copper alloys that would last longer than NASA-Z in thrust chamber applications.The intention was to use rapid solidification to introduce highly stable dispersions to strengthenand stabilize copper at temperatures up to 705"C (13004F). Highly stable phases such as borides,Wsicides, and high-temperature intermetallics were studied, as well as more conventional, lessstable copper-based and elemental dispersoids. The high-stability phases were found to be eitherunprocameable in copper or of no more benefit than zirconium additions. The more conventionalphases based on zirconium, chromium, hahfium, and silver additions were the most beneficial.
Based on the best available test, low-cycle fatigue (LCF) Alloy 993 (Cu-.l,%Hf) exhibitedthe best potential as an improvement over NASA-Z, with 705'C LCF lives four times those ofNASA-Z at a 3 percent strain range, Alloy 993 also exhibited higher strengths than NASA-Z,with thermal conductivities only slightly less than those of NASA-Z.
Alloy 995 (Cu-0.6%Zr) also exhibited LCF lives greater than those of NASZ-Z, along withbetter thermal conductivities, but with slight strength debits,
Alloy 1035 (Cu.0.6%Zr-1.0% Cr), which exhibited very high strengths, exhibited low LCFlives at 7051C (slightly lower than NASA-Z). Thermal conductivities were equivalent to those ofNASA-Z,
Finally, LCF tests showed that powder metallurgy NASA-Z (Alloy 996) could be equivalentto cast + wrought NASA-Z, so with some development work, NASA-Z chambers could be madevia powder with no life debits,
Thus, the result of this program was, among other things, the identification of rapidlysolidified Cu-1,1%Hf as an alloy showing great potential for use in reuseable, long-life thrustchambers. To bring this alloy into use, concentration effects need to be determined, processingwork needs to be done to better control microstructure, some LCF testing should be done onother processed conditions, and more sophisticated cyclic tests should be developed andperformed.
Other tasks suggested by this program are:
# Development of more-valid cyclic tests,
* More cyclic cesting of other conditions of Alloy 995 to see if its life can beimproved, as well as testing of Amzirc for comparison.
* More work with the copper-zirconium-chromium and copper-chromium-based systems to find a way to exploit the strength levels obtainable withchromium while improving LCF resistance,
* More study to develop a better understanding of silver effects, so as to supportfurther alloy development and to support present and future use of NASA-Z.
, More work aimed at introduction of stable dispersoids into copper, eitherthrough rapid solidification, internal oxidation, coreduction, or mechanicalalloying.
132

APPENDIX ATHERMAL CONDUCTIVITY
ANDTENSILE TEST RESULTS
133

TABLE 23. - THERMAL CONDUCTIVITY RESULTS
2260 1004C 2008C 3006C 400"C 5006C 6006C 7000CAlloy Unit" (•30F) (212F) (392'F) (5•20F) (782F) (832'F) (IZ12'F) (1292P)
NASA-Z Watts 334.8 335,3 336.1 303.5 332.8 328,7 324.2 317.6BTU 19315 193,8 194.3 192.8 192.4 190,0 187,4 188.6
993 Watts 327,1 327,5 322,6 316.6 309,7 302.1 296.5 293.4BTU 189,5 189,3 186,5 183.0 179.0 174.6 171.4 169.6
599 Watt. 370.0 370,9 388.7 388.1 359.5 354.8 346,9 337.7BTU 213.9 214.4 213.1 209.9 207,8 205,1 200.5 195.2
1032 Watts 81,0 93,2 107,4 122.7 133.0 140.3 147,9 156.6"BTU 46.8 53,9 62.1 70.9 76,9 81.1 85,8 90,5
1035 Watts 349,1 340,6 337,3 334.6 338.8 329,4 322,8 317,3PTU 201.8 196,9 195.0 193,4 194,1 190,4 186,6 183.4
Units. watts/m, 0 and BTU/ft, hr, I.Speimmne annoalod 704C0 (100O!)/1 hr/AC prior to toot.NASA4Z and 995 resulta con'ected for thermal expansion,
134
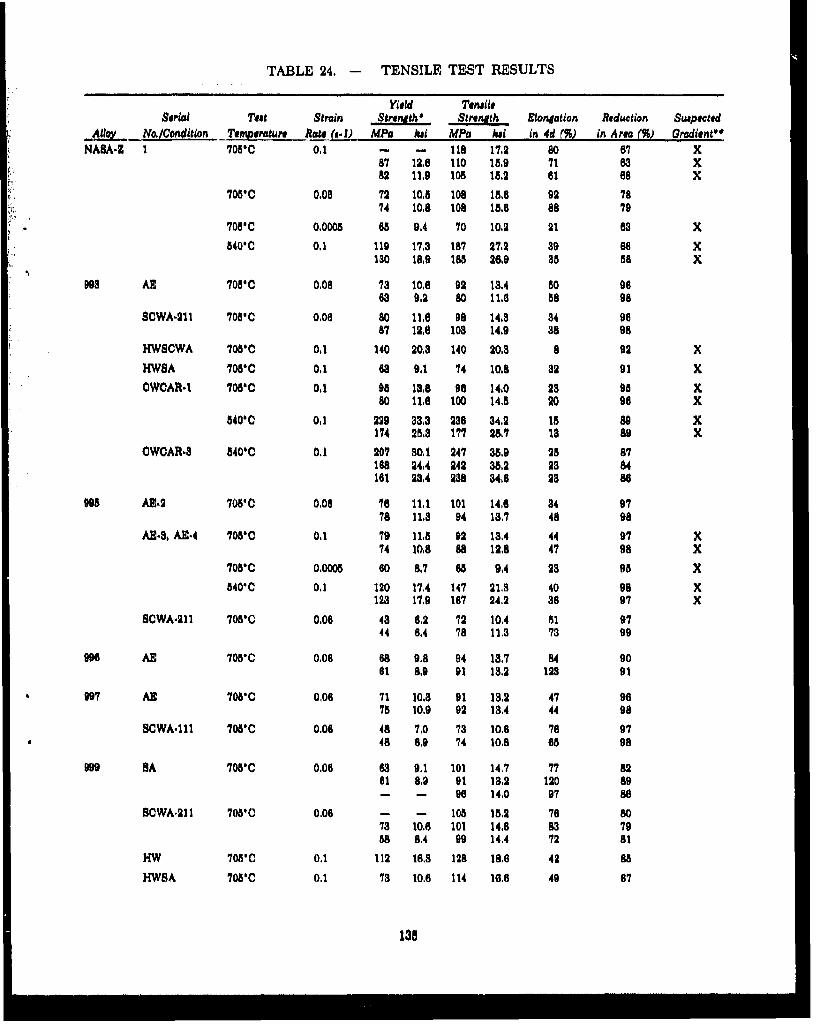
TABLE 24. - TENSILE TEST RESULTS
Yield TerPaileserial Tet Strain Strength Strength Elongation Reduction Suspected
SAlloy No6,Condition Temperature Rate (a.]) MPa Aei MPa kui in 4d M,) in Area M-) Gradient**NASA.Z 1 705oC 0.1 - - 118 17.2 so 67 x
87 12,6 110 15,9 71 63 x82 11,9 105 15.2 61 88 X
708"C 0.08 72 10,5 108 15,6 92 7874 10,8 108 15,6 88 79
7058C 0.0005 685 9.4 70 10,2 21 63 X5400C 0,1 119 17,3 187 27,2 39 66 X
130 18,9 185 26.9 38 58 X
D93 AH 708*C 0,08 73 10,8 92 13.4 80 9663 9.2 so 11.0 88 98
SCWA-211 7085C 0106 80 11,6 98 14,8 34 9687 12,6 103 14.9 88 98
HWSCWA 7085C 0,1 140 20.3 140 20,3 8 92 X
HWBA 708'C 0,1 68 9,1 74 10.8 32 91 XOWOAR-1 708"C 0,1 98 13,8 96 14.0 23 98 X
80 11,6 100 14,5 20 96 X
8401C 0,1 229 33,3 238 34,2 15 89 X174 25,3 177 25.7 13 89 X
CWOAR-3 8401C 0.1 207 30,1 247 35.9 25 87188 24,4 242 35.2 23 84181 23,4 238 34,6 23 86
"9a5 AI2 705'C 0.06 16 11,1 101 14.6 34 9778 11.3 94 13.7 48 98
A•-., AE.4 7080C 0.1 79 11,8 92 13,4 44 97 X74 10,8 88 12,8 47 98 X
708"C 0,0005 60 8.7 8 9,4 23 98 X
5401C 0,1 120 17.4 147 21.3 40 98 X123 17,9 187 24,2 38 97 X
SCWA-211 70VC 0,06 43 8.2 72 10,4 81 9744 8.4 78 113 73 99
996 AE 705"C 0,06 68 9.8 94 13,7 84 9061 8,9 91 13.2 123 91
997 Al 708C 0,06 71 10.3 91 13.2 47 9675 10.9 92 13.4 44 98
SCWA-111 705'C 0.06 48 7,0 73 10.6 78 9748 6,9 74 10.8 68 98
999 SA 708'C 0,06 63 9.1 101 14,7 77 8261 8.9 91 13,2 120 89- - 96 14,0 97 as
SCWA-211 70810 0,06 - - 105 15.2 76 8073 10,6 101 14,8 83 7988 8.4 99 14.4 72 81
HW 705'C 0.1 112 16.3 128 18,6 42 85HWSA 705'C 0.1 73 10.6 114 16.6 49 87
138

TABLE 24. - TENSILE TEST RESULTS (CONTINUED)
Yield TensileSerial Teat Strain Strength -Strength Elongation Reduction Suspected
Aloy Mo./Condition T'emperature Rate 04.i) MPa hai MPa hi in 4d (NJ in Area (M) Graint"
1032 AE 70850 0,1 83 12,0 114 16,5 32 94 X94 13.7 118 17.2 8H 94 X- - 116 16,8 27 94 X
BCWA.1 7056C 0.1 94 13,7 182 22.0 18 92 X100 14,8 149 21,6 45 94 X103 14,9 147 21.4 43 92 X
1085 AH 705'C 0.1 97 14,1 166 24.1 31 90 X83 12,0 168 23,9 24 88 X96 13.9 168 24,4 23 89 X
540C0 0,1 158 23,0 218 31,7 28 87184 26,7 220 31.9 28 88
EC 708'C 0,1 103 14,9 183 26.6 11 88 X91 13,2 180 26,1 9 81 X
1- - 90 27.5 22 90 X
1086 AR 70580 0,1 86 12,5 128 18.6 28 94 X91 18,2 123 17,8 28 94 X
1088 AE 705B0 0,1 99 18,3 1,6 19,7 33 88 X98 13,5 136 19,7 32 88 X92 13,4 182 19,1 24 88 X
SbA 705'0 0,1 H 19,5 116 1619 48 83 XM8 12A4 120 17,4 34 81 X86 12.5 114 16,3 33 84 X
1042 AE 708'C 0,1 96 1t,0 112 le,3 45 Ma88 12,8 117 17,0 45 88
1048 AS 708*C 0.1 68 9,9 110 18,9 85 5976 11,1 110 16,0 67 41
SCWA 705*C 0.1 76 11,0 111 16.1 68 4689 10,0 103 181A 68 52
0,6 I'1 strain rate tests employed crolshead daflectometer for strain data collection,* Some tests wer conducted before k thermal gradient was found in the ftroace.
138
APPENDIX BMISCELLANEOUS PROCESS STUDIES
137

I. FORGING TRIAL OF POWDER METALLURGY ALLOY
Dovelopment of a powder-metallurgy copper thrust chamber requires that the powder-metallurgy alloys be processable into forms from which chumbers can be made. A small study wasundertaken to determine whether hot-compacted rapid solidification rate (RSR) copper powdercould be hot-forged and then cold-worked without workability problems, The powder was hot-compacted because that process resembled hot isostatic pressing (I1P), which would be mostappropriate for consolidation of large thrust chamber preforms. Forging was performed becauseHIP or hot compaction would not be expected to work the microstructure sufficiently prior touse, Cold working was evaluated because some chambers are cold-spun to shape. Alloy 997 (-40mesh) was used because it was available.
The powder was hot-compacted as described in the earlier Procedure section. A 2.5 cm-diameter by 4.6 cm-long cylinder was machined and then forged Isothermally (the only methodavailable at Pratt & Whitney) at 760'C (1400F), using a strain rate of 0.1/minute, to a totalupset of 85 percent (6 mm thick). The resulting pancake is shown in Figure 79. No crackingoccurred.
The pancake was then cold cross rolled 60 percent (2.6 cm thick). Again, no problems orcracking occurred (Figure 79). The resulting microstructure (Figure 80), was very fine grainechless than 10 Imn grain sine.
This study demonstrated the feasibility and ease of processing powder, via HIP
consolidation, into useable thrust chamber performs,
II. PRODUCTION OF NASA-Z MATERIALS AT PRATT & WHITNEY (P&W)
Initial supplies of NASA-Z provided by NASA Lewis Research Center (LeRC) were limited.When it became evident that testing needs exceeded these supplies, an effort was made toproduce conventional NASA-Z at P&W (This was called PWNASZ to differentiate it from [ARCmaterial).
The alloy (Cu-0.5%Zr-3.0%Ag) was a vacuum.-induction melted (VIM No. 1866 - see theearlier Procedure section for specifics) and cast into two cylindrical ingots (10 cm diameter by 22cm). The pipe was cut off the ingots, which were then machined into right cylinders for hotworking.
One cylinder, PWNASZ-1 (85 mm diameter by 110 mm long) was pancake forged to 17 mmthick in an isothermal forging pres at 845"C (1550'F) and a strain rate of 0.1/minute. Theresulting pancake, shown in Figure 81, was free of cracks and looked very good.
The other rylinder, PWNASZ-2 (74 mm diameter by 125 mm), was hot-extruded at 845'C(1550F) and 22:1 extrusion ratio into a 16 mm-diameter bar (see the Procedures section forother data). It also worked well without cracking, but the extrusion was not very straight.
Upon completion of hot-working, additional NASA-Z was supplied by NASA L[RC, so thePWNASZ was not processed ftrther.
138

I4
E,6
139

20 j.im
Figure 80. Mi,.rcstrwfturia of Alloy 997 After Hot Compacting + Hot-Forging +Cold-Rolling
+ Annealing at 680*C (12000F)
Figure 81. NASA-Z Composition Pancake Cast + Hot-Forged at P& W (Scale i9 in Inches)
140

III. MIT MATERIALS
Two of the alloys produced by the Massachusetts Institute of Technology (MIT) wereconsolidated at P&W. The alloys were canned and consolidated by hot extrusion. Two extrusioncans were filled with the following alloys:
MIT-4: -75+45-micron-diameter Cu-1.1%Hf powder. Powder made at P&W(run 993), screened at MIT to size fraction, hydrogen-reduced at MIT.
MIT-.: Attrlted Cu-Hf-O flakes. Powder made at P&W (993 - Cu-1.1%Hf).MIT screened 75-micron size fraction, attrited powder 12-30 hours InSzeovarl attritor in ethanol to produce flakes and oxidize hafnium tohafnia, dry-ball milled under argon for 30 hours (to apheroidize),reduced in hydrogen.
The extrusion cans wore filled using the following hot pumpdown technique-
1. The extrusion can was filled with the particulate in the drybox, capped,transferred to the outgasser, uncapped, and quickly attached,
2. The system and filled can were pumped out for 2 hours cold. Systemvacuum levels were about 6X10⁻⁶ microns, Meanwhile, a thermocouple wasaffixed to the can, the can was wound with nlchrome heater tape, and theassembly was wrapped with insualtion.
3. After the 2-hour cold pumpdown, the heater was turned on, with an upperlimit of 4508C (840F). Pumping continued through heating. The followingsteady-state can outer diameter temperatures were reached after abouta hours:
MIT-4: 415'C (789-F)
MIT-B: 450'C (8407)
4. Hot pumping continued, while maintaining a system vacuum of about5X10"'0 microns. When a total pumping time of 24 hours had been reached,filler tube was crimped, and the heater was turned off. The filler tube weldseal was made after the can had cooled.
Both alloys were extruded at 700'0C (12907), with an extrusion ratio of 20:1 (other specificsof the extrusion process can be found in the Procedure section).
The first alloy, MIT-4, extruded to a microstructure typical of Alloy 993 (Cu-1.1%Hf).
The second alloy, MIT-5, was a copper-hafhium alloy that had been attrited in ethanol topromote oxidation of some of the hafnium to produce a fine dispersion of hafrila. The resultingflakes had been dry-ball milled to agglomer•te them so they would pack better in an extrusioncan. The particulates supplied by MIT are si own in Figure 82. They exhibited a layered structurepresumed to result from the flakes, and holes.
141

142
Extrusion of the flake alloy resulted in the structure shown in Figure 83. Voids andelongated structures (believed to have been prior particulates) were evident. The voids werebelieved to have resulted from incomplete consolidation (due to the holes in the particulates anddue to the poor packing efficiency of the coarse particulates) or entrapped gasses. Hot swaging 50percent at 760'C (1400F) closed many of the voids (Figure 83).
However, annealing at 870*C (1600F) appeared to reopen some of the voids, indicatingpossible entrapped gases. Hydrogen analyses revealed a hydrogen concentration of 20 ppm (wt).This was much greater than the solubility limit given by Elliot (27), so hydrogen entrapment mayhave caused the voids.
The MIT-5 flake alloy bar was hot.swaged 50 percent at 700'C (1400F) and subjected to--------- 705'C (1300F) compression tests. Compression testing was used because it might be loss
sensitive than tensile testing to the void defects.
Compression test specimens were 6 mm.diameter by 19 mm-long right cylinders. Tests wereconducted on an MTS servohydraulic programmable tensile tester, equipped with specialeztensometer.capable compression test gipps. The specimen and linear variable displacementtrransformer (LVDT).type extensometers were attached to the grips, and thermocouples wereattached to the specimen. The assembly was heated in a clamshell furnace, heating the specimento 708*C (1$001F), The specimen was held 80 minutes at temperature and then compressed at astrain rate of 0.001/second. Force and strain data were collected on an X.Y plotter. Yieldstrength (0.2 percent) was reported. Four tests were performed.
Results of the compression tests are shown In Table 25, along with the slow.strain.ratsyield strengths found earlier for NASA.Z and Alloy 998. The yield strengths for the flake alloywere much lower, A tested specimen is shown in Figure 84. All of the compression specimensexhibited bending of the prior particles and decoheosion between the particles. Recrystalliuationwas not evident.
A fine dispersion was seen in the flake alloy by transmission electron microscopy (TEM),Figure 85. It could not be conclusively identified, although electron diffraction patternssomewhat resembled those of hafnia.
This was a cursory evaluation of the MIT materials, since full evaluation of these materialswas part of the MIT effort.
143
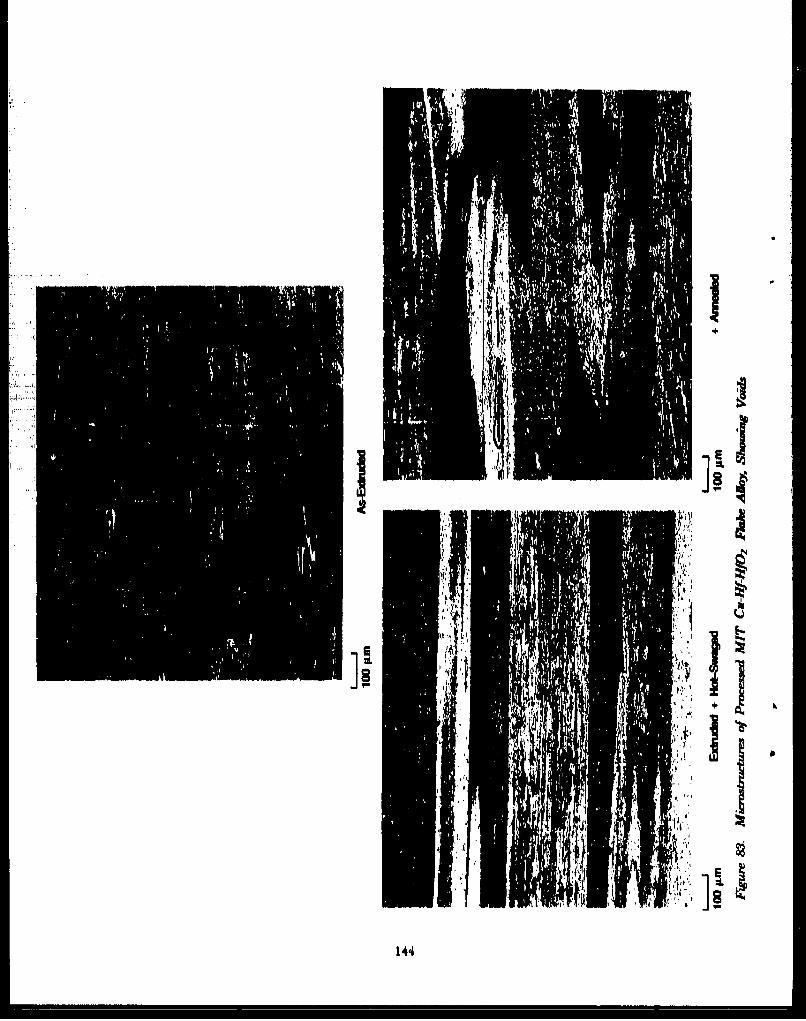
I8
144
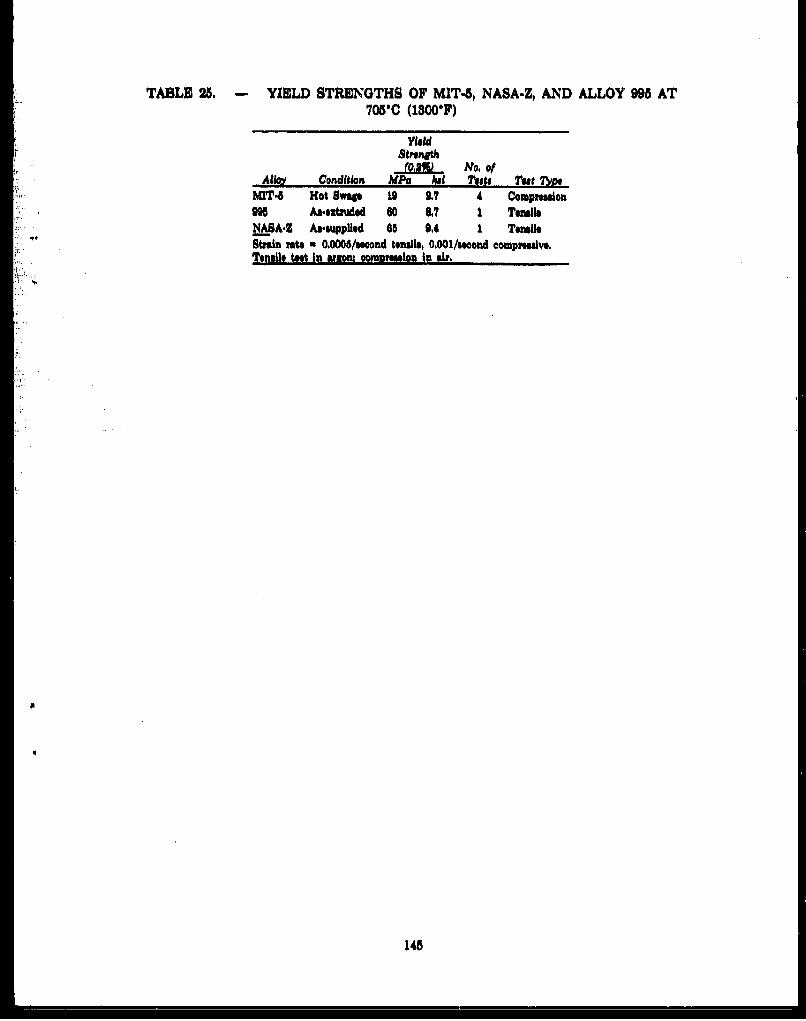
TABLE 25. - YIELD STRENGTHS OF MIT-5, NASA-Z, AND ALLOY 995 AT7065C (13007)
*. Y ield
( No. ofAlloi Condition MPa 11 Teant nat nix
.hT-B Hot Swage 19 9.7 4 Compressionon As.eztrudnd 60 8V7 1 TensileNASA.Z As.supplied 68 0.4 1 TensileSta rate a 0,0006/saond tensile, 0.001/seond Compresslve,
S.... Tonsils test In uzon comprmssion In air.
•4""
145
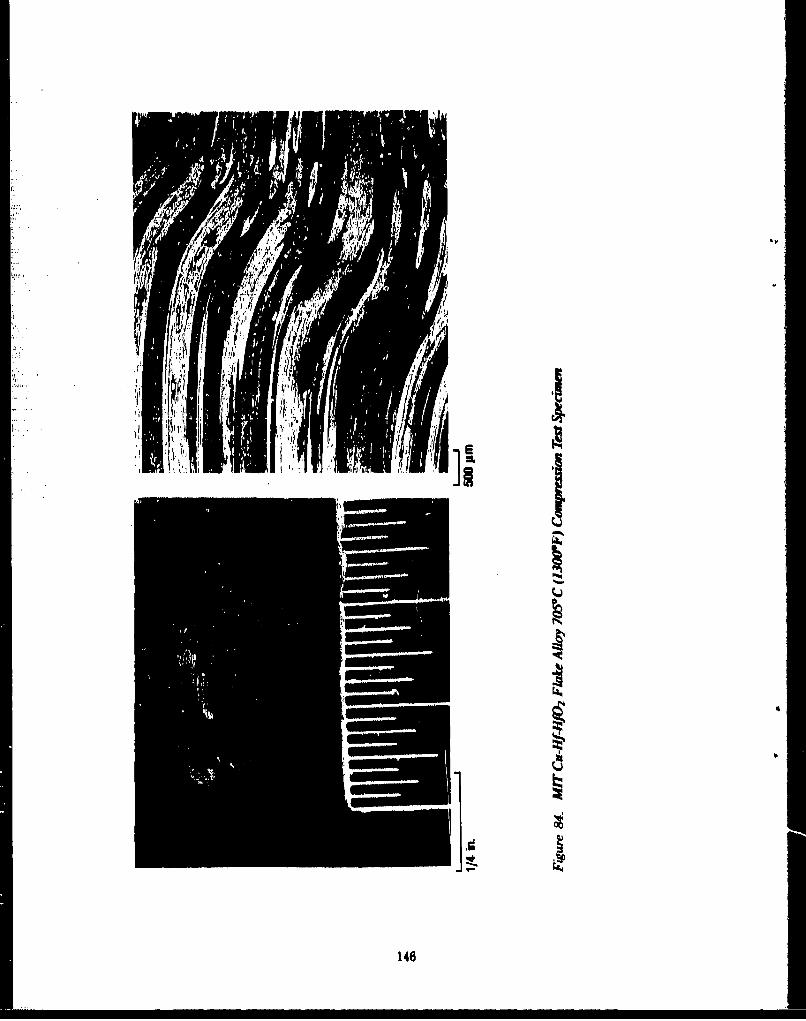
"JI-IAI
148
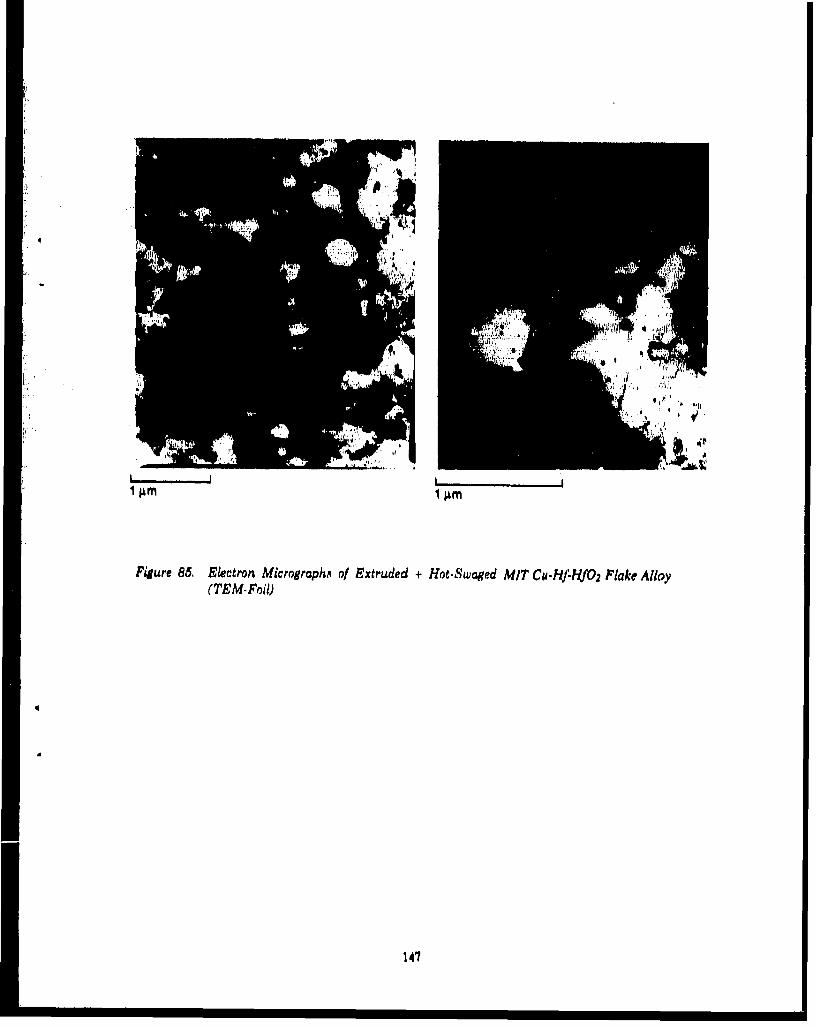
Figure 85, Electron Micrographs~ of Extruded + Hot-Swaged MIT Cu-H-li'H-fO2 Flake Alloy(TEM-Fail)
141

APPENDIX CNARLOY-Z" BASELINEMATERIAL PROPERTY
VARIATION STUDY
pp
.14
FOREWORD
This document presents an asesment of the impact of variations in candidate materialproperties in a thrust chamber liner for use in an advanced Orbital Transfer Vehicle (OTV)rocket enline. The work was conducted by Pratt & Whitney/Government Products Division(P&W/OPD) of the United Technologies Corporation (UTC) for the National Aeronautics andSpace Administration - Lewis Research Center (NASA.LeRC) under Contract NASS-26.0C. with Mr. J. M. Kaamoff as Task Order Manager.
.-.4 Mr. J. R. Brown was the Program Manager for this effort, and Messrs. M. B. Combs,J. S. McPherson, and J. H. Moon, were the principal investigators. Mr. M. I. Combs was theauthor of this report.
149

SECTION CA1INTRODUCTION
The deign and development of a durable, reusable rocket propulsion system for an OrbitTransfer Vehicle (OTV), as currently planned by NASA, requires the Identification anddevelopment of a suitable material for use in the rocket engine combustion chamber liner. Such amaterial must be able to withstand prolonged engine operation at high temperatures and highpressures, a welI u the cyclic effects of multiple starts and multiple thrust levels.
Current OTV rocket engine design concepts ae based on those developed under theAdvanced Expander Cycle Engine Point Design (Contract NAS-88487). The most promisingmaterials to date for the OTV application include copper alloys such as aopperzirrconium,copperasilver, or a aopper.silver.sirconium system similar to NARloy.Z, a proprietary alloydeveloped by Rocktdyne (Re. 87), The thermal conductivity of copper allows sufflcient heattransfer to cool the chamber for increased life while heating the fuel for improved engineefficiency.
NARloy.Z has demonstrated longer chamber life capability than other copper bas alloys,but its high.temperature LOF properties fall short of those desired by Pratt and Whitney for theOTV application. Test chamber results indicate that most cracks initiate from inclusions in thematerial (Ref. 37). The current program (under Contract NAS-231888) has as Its goal thedevelopment of a rapidly solidified alloy that satisfies the OTV thrust chamber material propertyrequirements. It. t believed that rapid solidification and selective alloying will reduce oreliminate undesirble inclusions and will produce fine, stable dispersions for LCF propertyenhancement,
The purpose of the study presented in this report Is to determine the impact of variations ofmechanical material properties on thrust chamber strain range, using NARIoy-Z as a materialbaseline. Some tradeoffs in material properties may be necessary in order to achieve the requiredproperties for the OTV thrust chamber application, Since strain range is directly related to LCFlife, the impact on strain range is an indication of the impact on life. However, the chemistrychanges that may be required to achieve the desired properties may affect the LCF capability.While strain range can be predicted, the LCP capability of an alloy cannot be predicted. The LCPcapability of candidate materials will be evaluated by thermal-meohanical specimen tests.
180

SECTION C.2ANALYSIS
"The effect of the variations in material properties on strain range was analyticallydetermined with a computer modal of the thrust chamber wall. The analysis used a MARC three.dimensional (80D) finite element model of the area of the thrust chamber where strains werepredicted to be maximum. Temperatures and pressures were Incremented through transientconditions simulating start-up to maximum thrust to shutdown, The analysis began with abaseline model using NARloy-Z properties for the coolant tube pasageo and an electroformed"nickel close-out, Subsequent analyses varied the material properties of the coolant passage, oneproperty change at a time, to determine the effects of individual property chanes on strainrange.
"C.&.A Marc Analysis
Thrust chamber strains and maximum strain locations were determined using a three.dimensional (3.D) elastic-plastio MARC analysis. MARC is a general purpose finite elementanalysis program whose capabilities include non-linear analysis (ILe., plasticity, creep, large.displacement), as well as heat transfer, buckling, etc. The model consisted of 20-nodeisoparametric brick elements with 27 Internal Integration points (MARC element 21, Figure 88).The analysis was stepped through a series of temperature and pressure Increments, simulatingthe transient conditions of a mission cycle from start-up to maximum thrust to shutdown. Thesolution of each increment became part of the cumulative history of the mission cycle before thenext increment was applied, as required for elastic-plastic analysis. Stress-strain behavior wasapproximated using o piecewise linear (tangent stiffness) approach. An initial elastic solutionwas scaled to the yield point where the elastic.plastic solution begain. In general, load incrementsabove the yield point were kept at 10 percent or less of the load at the yield point to prevent driftfrom the yield locus.
S 20 ARC Element Type 21 -1 1: 20 Nodes (8 Vertex Nodes,
12 Mldlide Nodes)e Isoprametrlo (2nd Order)
s O e 27 Integratlon Points0 e Each Edge May Be Parsbollc
y 13
14 2
Figure 88. MARC 20-Node Isopapametric Brick Element
181
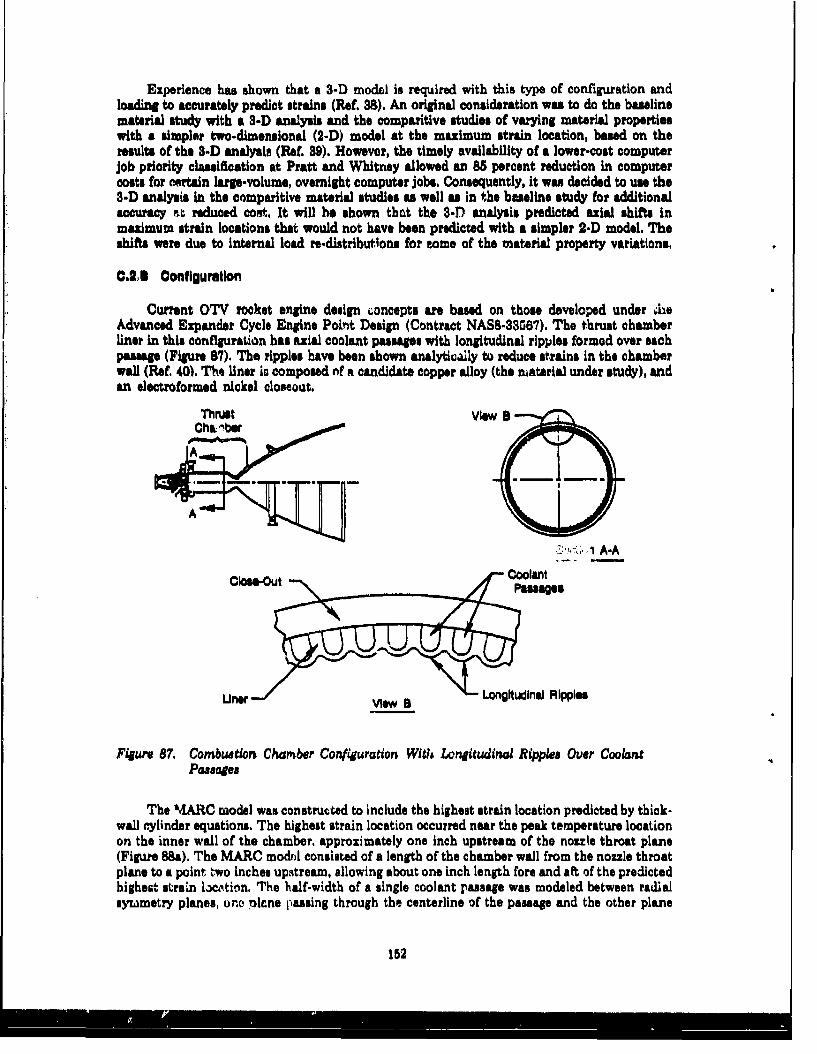
Experience has shown that a 3-D model is required with this type of configuration andloading to accurately predict strains (REf. 3$). An original consideration was to do the baselinematerial study with a 3-D analysis and the comparitive studies of varying material propertieswith a simpler two-dimensional (2-D) model at the maximum strain location, based on theresults of the 3-D analysis (Rae 39). However, the timely availability of a lower-cost computerjob priority classification at Pratt and Whitney allowed an 85 percent reduction in computercosts for cortain large-volume, overnight computer jobs. Consequently, it was decided to use the3-D analysis in the comparitive material studies as well as in the baseline study for additionalaccuracy t reduced cost, It will be shown that the 3-TD analysis predicted axial shifts inmaximum strain locations that would not have been predicted with a simpler 2-D model. Theshifts were due to internal load re-distributions for come of the material property variations.
0.24 Configuration
Current OTV rocket engine design concepts are based on those developed under ýheAdvanced Expander Cycle Engine Point Design (Contract NAS8-33367). The thrust chamberliner in this configuration has axial coolant passges with longitudinal ripples formed over eachpassage (Figure 87). The ripples have been shown analytically to reduce strains in the chamberwall (Ref. 40). The liner is composed mf a candidate copper alloy (the material under study), andan electroformed nickel closeout.
Thrust View a
User V Longitudinal Ripple
Figwre 87. Combustion ChaClber Configuration Witi longitudinaJ Ripples Over CaoletPasPases
The MARC model was constructed to include the highest strain location predicted by thick-wall cylinder equations. The highest strain location occurred near the peak temperature locationon the inner wall of the chamber, approximately one Inch upstream of the nozzle throat plane(Figurs 88a). The MARC modr& consisted of a length of the chamber wall from the nozzle throatplane to a point two inches upstream, allowing about one inch length fore and aft of the predictedhighest saraeIn lackition. The half-width of a single coolant passage was modeled between radialsytametry planes, ono plcne passing through the centerline of the passage and the other plane
152

pasing through the centerpoint between passages (Figure Pub). The size of the elements wasvaried no that areas of high temperature/high strain gradients consisted of more elements (a finermesh), and areas of nearly-constant temperature consisted of fewer elements (Figure 89), savingcomputer time and cost without loss of accuracy. Each side was constrained to move parallel tothe radial symmetry plane defining it (Figure 90).
C.2.C Material Properties
The thrust chamber liner consisted of a machined copper alloy coolant passage (thecandidate material under study) and an electroformed nickel closeout. NARIoy-Z (Cu-3%Ag-0.5%Zr) was chosen as the basis for the material properties of the copper alloy in this study sinceit has demonstrated longer chamber life capability than other copper allk)Y tested to date(Ref. 37). NARIoy-Z Is a proprietary alloy developed by Rocketdyne, The properties for NARloy-Z were obtained from industry literature on copper base alloys (Refs. 37, 41, and 42). Theproperties for the electroformed nickel close-out wore obtained from industry data used in thedesign study described in Roe 40.
A baseline analysis was fint done using NARIoy.Z properties for the candidate material.Subsequent analyses varied the candidate material properties from the baseline, one propertychange at a time, to determine the effect of each property change on strain rangs, The amountsof the changes were based on a study of the variability of material properties in current copperbase alloys. Based on the literature survey, the material properties of copper alloys can vary fromthose of NARloy-Z by the amounts shown in Table 26, as follows.
153

2.0 In.
Highest Strain Oowair Nea AUeK ;OfHighest Metal Temperature
a. Length of Model lIftludes Predicted Areaof Higheet Metal Temperature
Electroformed 2.25 dog
Radl Symetr Plae&&(Candidate Material)
b. IHulf.Wldth of Coolant Passage ModeledBetween Radial Symmetry Planes
Figusre 88. Section of Thrust Chamber for MARC Model
IN4

Section A-A.
Detail View ofTypuica Cross-Seotlon
Model Composed ofThres-01mmnslonal (3-0)Brick Elements
z
Figure 89, MARC Model

VVew V A
S ;
K1
VViewBw A
Table 26. Materkia Property Variains of Copper BEu Alloy
xW y
VvaritonMin..r•u Proper7 Ae.haue to NAR/o..Z
Young's Modu1um (3) -30%$ to .81%1Coer. oV Thermal E~sp, uioa (a) -8% to +8%Yield Stres (or) -88% to +168CoeI, of Thermal Coniductivity (k) -18% to ÷+O0%Crosp Stl, ln Rata(s, ) 0,2X to 8,0×
Using the value. in Table 28 agu ideilnes, a MARC analysis was performed for each of thematerial property changes listed below to determine the isolated effect of each change on thrustchamber strain range. The analyses of the following property changes did not Include creepeffects:
* Baseline (NARIoy-Z), with no creep * +50% o• +85%E *-B+1% ar*-90%E
• +10 a,* -15% k• -10% a
The remaining MARC runs included creep, yuming ten minutes hold time at full throttle,to determinethe .effet of chanese in creep strain rate, se follows:
SBaseline (NARIoy.Z), with creep
* 5.0K~<* 0.2x g,
The baseline run and all varying material property runs involved only one cycle to obtainthe relative effecti of property changes on total strain range In the chamber wall, Actual
156

materials may land to harden or soften with time; however, the strain range is not expected to besignificantly different from that predicted in the MARC analyses, The mean strain may vary, butsinces the determination of LCF l&ifIs more dependent on strain range than on mean strain, it isfelt that the analysis of on@ cycle was sufficient for the purpose of comparison without loss ofaccuracy.
Creep Is a complicated phenomenon that is very dependent on time-related properties.Hardening and softening characteristics that affect crep ratcheting after several cycles can onlybe determined by specimen tests of candidate materials, Thermal-mechanical tests with crep.dwell should also be done to evaluate the effect on LCF capability.
The effect of the cyclic strain rate is another parameter that can only be evaluated bytesting. The LCF specimen tests will address this parameter; however, the high cyclic strain ratee~pected In an actual rocket thrust chamber during real mission usage may not be achieved Inspecimen tests due to laboratory equipment limitations.
0.11.0 Mission Cycle
The model was subjected to a loading cycle simulating the conditions of an OTV missionfrom tA&A-up to mazimum thrust to shutdown. Figure 91 illustrates the nature of the cycle by thethermal response of the peak temperature location in the chamber wall vs time, The Initialcooldown phase of the cycle occurred as fuel flowed through the coolant passages prior toIgnition. The cooldown was assumed to lower the temperature of the thrust chamber from 704Fto a uniform -1008F. The acceleration, set to begin at time 0, brought the engine to fUl throttlein 1.022 seconds. The engine was held at full throttle until the thermals approached steady state,at 7.987 seconds into the cycle.
10 min Dwell TmeFull for Creep
Throttle Study-State Analysis
1200Decal for1000 Non..CreepAnalysis
Boo Decal for
--11 Cooldown (Pre-Ignftloti)
0~im 1 2e 60 810 91 11 o l 612
Figure 91. Thermal Reuporase of Hot Spot us Timt
157

At the tandy-state point (7.997 smonds), two courses were taken in the remainder of theanalysis. For all material property studies except creep strain rate, the engine was immediatelydooelerated to shutdown. The deceleration required 1.912 seconds to shutdown (9.899 secondsinto the cycle), and an additional 2.411 seconds following the shutdown for thermals to approachsteady state. For the creep strain rate study, the engine was held at full throttle for an additional10 minutes after the steady-state point to exercise the creep option in the MARC analysis. Theengine was then decelerated following the 10.minute hold in the same manner as describedabove.
To simulate the transient conditions of the mission cycle, the analysis was stopped througha series of temperature and prosseue load increments, comesponding to specific timepointethroughout the mission. Individual temperatures were calculated and assigned dirctly to eachintegration point for each element of the MARC model. These temperature values weregenerated for each increment through the mission by means of in-house heat transfer decks. Thesame temperature values were used for all material variation studies except that of thermalconductivity, for which separate heat transfer analysse were required for new temperature values.
The fuel pressure inside the coolant passage was assumed to increase linearly with timeduring the Aint 1,022 seconds of the acceleration, from 0 psi to 3900 psi. The combustion pessureIn the thrust chamber (outside the coolant passage) was assumed to respond similarly, from 0 psito 1580 psi. Both pressures remained constant during full.throttle, and decreased linearly withtime to 0 psi at deceleration. Figure 92 shows the response of the pressure loads with time.
188

dog 00
1591

SECTION C.3RESULTS
Output orom the MARC analysis included strsses, strains, deflections, and temperatures.MARC provided output data for every integration point of every element in the model, and foreach increment throughout the mission. The voluminous output from each MARC run wasstored on magnetic tape for interactive graphios post.procssalng. Plots of stresses, strains, andtemperatumr via MARC post.prooessing utilities were used to determine the critical values andlocations In the model, and to observe their behavior as a function of time.
The output parameter of prime consideration was the effective, or Von Mises, strain. Theeffective m•rain is used in structural analysis to evaluate the elastic.plastic and creep behavior ofmaterials, The effctive strain is a meuure of the effect of multi.axial strains in terms of a single,equivalent uniaaial tensile strain, based on the distortion energy theory. The effective strain wucalculated within MARC using Equation (1), as follows:
(1) £ 2/ (-/S(m + 2 +•'÷ 2 + 1/2 ( '÷2 + y, I + &.'))
where a, i•, and as ra component strains in the X, Y, and Z directions,
and say, s•., and an ar shear strains in the XY, YZ, and XZ planes,
The results of the material property study are given in Table 27, which summarizes theeffect of the individual property changes on the maximum effective strain and strain range. Thematerial property with the greatest effect on strain was the coefficient of thermal expansion (a).Details of the baseline analysis and the individual property changes are presented in theparagraphs following Table 27.
Table 27. Summary of Effective Strains and Strain Ranges for Varlatiorg in MaterialProperde.
R.OWWO Mat RelaSvoeMate•w' Ma. To nff. 3tron 7o
1ff.ly A# strun B.ustng ~ Rev Boiling 06)Bueine 0.0388W - 0,03962 -
(NARIoy.Z)
4,35% 3 0.08H24 +1.0 0.040 +1.7-20% E 0.03881 -1.0 0.03883 -2,0
+10% a 0,04000 +11.7 0.04484 +12.4-10 a 0.03164 -11.8 0.08498 -11.5
+50% or 0.03879 -0.3 0.03M8 +0.1-50% a, 0,03837 ÷6.9 0.04148 +0
+10% k 0,00483 -3.8 0.08847 -2.9-15% k 0,03819 +A,4 0.04154 +4.8
Baotlinew/ctesp 0.03610 +0.6 0,0399M +0.8
5,0X 0, 0.o0615 .0,8 0.04008 +1.00.2X , 0.03604 +0.4 0.039 30.
160
CA.A Banellne Properties
The aint results studied were for the NARloy.Z baseline material properties. Figure 98shows the locations of peak values of strain and temperature. The peak temperature occured onthe combustion side of the liner at approximately 0.89 inch upstream from the nozzle throatplane, and the maximum effective strain range occured on the coolant side of the liner atapproximately 1.48 inches upstream from the nozzle throat plane.
Figure 94 shows the distribution of metal temperatures at full throttle through the cross.section at the highest temperature location. The metal temperature ranged from approximately400F in the nickel closeout to over 13007 in the copper liner. The temperatures shown inFigure 94 are baed on nodal values extrapolated from the Integration point values by the MARCpost-proeaor, The temperatures actually used for analysis comparisons were those assineddirectly to the element integration points, as given in the MARC output data.
Stresss• and strains wore caused mainly by the large thermal gradients in the chamber wall(Figure 94), In addition, the coefficient of thermal expansion for the copper liner wassignificantly higher than that for the nickel close-out, Consequently, the hotter copper liner hada tendency to expand radially outward, but was restrained by the cooler nickel close.out. Theradial restraint resulted in a high compressive hoop load in the liner (Figure 96), which was themajor LCF driver in the thrust chamber cycle,
Figures 95 through 98 are history plots of metal temperatures, stresses, and strains forcritical locations, The time scales are expressed in increments, which correspond to thetemperature and pressure load increments discuseod in Section C.2.D. Each increment representsa specific time point in the mission cycle, Table 28 lists the Increment numbers and theircorresponding minion time points for the baseline analysis.
The effective strain range was calculated from the cyclic maximum and minimum values ofeffective strain. Since the effective strain is always a non-negative value (Equation 1), theparameters used to calculate the effective strain were examined to determine if the actual strainswere tensile or compressive. In Figure 98, the effective strain initially peaked at increment 3. InFigure 97, the hoop component of strain was positive (tensile) at Increment 3. At increment 24,the effective strain (Figure 98) peaked again, but the hoop strain (Figure 97) was negative(compressive). The other components of strain exhibited similar sipn reversals at peak values ofeffective strain (Figure 97). Based on the behavior of the component strains, the resultant valueof the effective strain range was the sum of the values of effective strain at increments 3 and 24(Figure 98), not the zero.to.peak value of increment 24 (the highest peak).
The maximum strain range location occurred inside the coolant passage in the radius of thedomed wall (Figure 93), Both the radial and the hoop strains were large in this location, as seenin Figure 97. The radial strain was the result of the compressive hoop load forcing the dome tobulge outward (i.e., toward the chamber centerline). Figure 99 shows the deflected shape of across.section of the model at full throttle for the maximum strain location. The magnitude of thedeflections ar exaggerated for clarity.
161

Y
x
MAxImum EffectIveStrain - 0,03588
Maximum Temperalure - 1332 OF
x
z
MAxImum EffectlveStrain Range - 0.03962
,4*
Figure 93. Beline Analysis: Peak Values and Locations
162

1) 4.039+22) 4.554+23) 5.068+2
I4) 5.583+25 8) 8.098+26) 8.612+2
* ' 8) 7.641+2S09) 8.166+2
10) 8.871+211) ,t185+2
6 12) 9.700+213) 1.021+3
r 14) 1,072+3I 15), 1.124+3
18) 1.175+3" 17) 1.227+3
Is) 1.278+3iS 19) 1,330+31, 20) 1,381+3
Fgure 94. Baseline Analysis: Tempenraue Contour Plot
1500 Y
1250 1 ziwL
1000
Tempeature.
goo500
-250
0 10 20 30 40 50Inorement No.
Figure 95. Baseline Analysi: Maximum Temperature us Increment Number
163

40 X.Duwtw Stros•Y-DWlo Stres
0 Z.Dkirtton Stress
Stress -(kit)
.20
-40 o 00 10 20 30 40 s0
Increment No.
Figure 96. Bwelru Analyais Component Streams vs Increwnt Number
0.02 + X.DiretloIn Strain
0.01
0
Strain
-0.01
.0202
.0.03 1 1 00 10 20 30 40 50
Increment No.
Figure 97. Basuline Analysis: Maximum Component Strains us Increment Number
164

"0.04
0.031
1f 0.02
"0.01
0 10 20 30 40 500..Inomnent No.
Fture 9, BateUne Anarysiv Maximum Effaet Stain us Increment Number
TaM e 28. MARC Increment No, us Mission Time for the BaOeUne Anayab
MARC 71m. MA.C Tie.Ine No. (see) Commeny. Incr No. (sgo) Com.j.nu
Initial - Pm.lgnition 22 0.9757State Cooldown 23 1.0220 Mull Throttle
0 - 24 7.0670 Steady.StateI - (SBurt De461)2 - 25 6.0670a 0.O000 Start Aml 26 &16504 0.1201 27 8.24405 0.1901 29 8.31106 0.2608 29 640507 0.3203 30 6,47506 0.3695 31 8&57409 0.416 32 .6470
10 0.4632 33 6.780011 0,8092 34 6.646012 0.5843 3a 8,934013 0.5916 36 9.036014 0,6392 37 0.133015 06669 39 9,247016 0.7293 3s 9.353017 0.7691 40 9.48401i 0.6074 41 9,611019 0.8597 42 9.789020 0,8941 43 9,8900 End Decal21 0,9425 44 12.3100
165

-- 1- Original Shape .....--- eOflctod Shape
Figvure 9. Baseline Analysis: Deflktd Shape Plot
C.3.- Young's Modulus
Variations in Young's Modulus had only a nominal effect on strain range as compared toother property changes (Table 27). The m(fect of Young's Modulus wt determined by increasingIts value 35 percent and decreasing its value 20 percent from the baseline. The changes inYoung's Modulus were made independently, the other properties were left unchanged. Fiaure 100Is a plot of the values of maximum effective strain and strain range as a f nction of Young'sModulus. The location of the maximum effective strain remained the same through the range ofvalues for Young's Modulus, but the location of the maximum effective strain range shifted
slightly upstream when Young's Modulus was decreased 20 percent.
C.3,C Coefficient of Thermal Expansion
Among the material properties studied, the coefficient of thermal expansion (a) had thegreatest influence omn thrust chamber strain range. The effect of changes in a was determined byincreasing and decreasing its value 10 percent from the baseline. The changes were madeindependently, with the other properties left unchanged.
Figure 101 is a plot of the values of maximum effective strain and strain range as a functionof a. The correlation was essentially linear, with small changes in a producing significantchanges in strain. This indicated the strong influence of thermal effects on thrust chamberstrains. As the a of the copper liner was decreased, the tendency of the copper to expanddecreased proportion-tely, reducing the thermal fight in the chamber wall. This in turn reducedthe comprassive hoo.p loads. Similarly, when a was increased, the compressive hoop loadsincreabod.
106

122-25
122-2650.
1 23427
0.045 -
0.044 - Maximum Strain RangeMaximum Strain
0.043'-
0.042 -Elem. - 1.P.:
0.041 -,, ,, 122-26
0.040 - 122-25
0.039 -- ,g** .Iq$
Efleative 0.038
Strain -(In./In.) 0.037 -
0 91-10.036 - 123-27
0_0_ _ 122.260.035--
C.034 -
0.033 -
0.032
0.031
0.030 I I I I I I I I I I-60 -50 -40 -30 -20 -10 0 10 20 30 40 50 60
Percent from Baseline E
Figure 100. Ellective Strain va Young a Modulus (E)
167
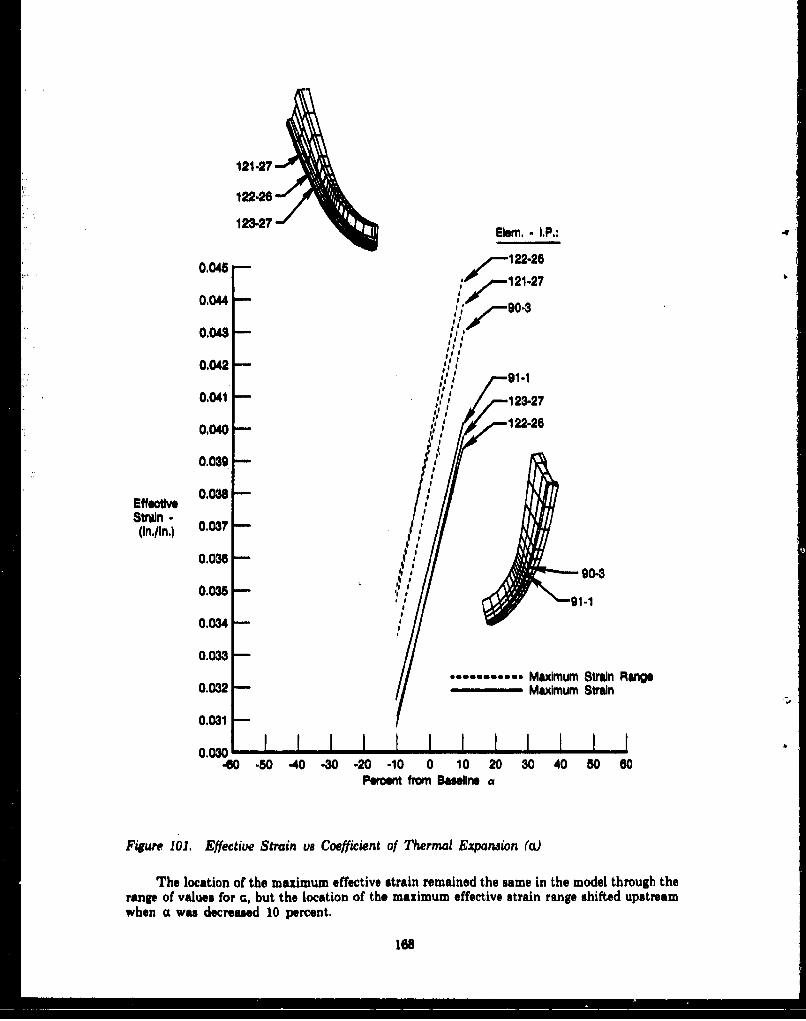
121-27
122.26
123-27 Elem. - IP.:
0,045 - o 122-26
0.00 121-27
1 90.30.048 - loo
0.042 ' 9-I1-1
0.041 - i123-270,04 m r 122-26
0.039 -
e 0.038
Str~in(In./in.) 0.037
0.036 '
90-30.035 I, h' 91-1
0.034 "
0.033*&meanness*.Maximum Strain Rang"
0.032 - Maximum Strain
0.031
0.030 I I I I I I I I I I I60 -50 -40 -30 -20 -10 0 10 20 30 40 50 60
Paent from Baseline a
Figure 101. Effective Strain vs Coefficient of Thermal Expanaion (od
The location of the maximum effective strain remained the same in the model through therange of values for G, but the location of the maximum effective strain range shifted upstreamwhen ca was decreased 10 percent.
168
C.A.D Yield Stre
Variations in yield stress had a moderate effect on strain range, compared to other propertychanges (Table 27). The effect of yield stress was determined by increasing and decreasing itsvalue 50 percent from the baseline. The changes were made independently, with the otherproperties left unchanged.
Figures 102 and 103 are plots of the maximum effective strain and strain range as afunction of yield stress. The strain on the inside surface decreased as the yield stress of thematerial was decreased from the baseline (Figure 102). However, the strain on the outside surfaceincreased as the yield stress was decreased (Figure 103), and the outside surface became themaximum strain location of the model at the lower value of yield stress. The maximum strain onthe outside surface occurred in the fluted radius between the longitudinal ripples (Figure 104).For the baseline properties, the stresses on the outside surface were near the yield point. Whenthe yield stress was decreased 50 percent, the outside surface material yielded under the hoopload, allowing higher compressive strain values and relieving the compressive strain on the insidesurface.
As the yield stress was increased 50 percent from the baseline, the material on the outsidesurface behaved elastically, resulting in higher stiffness and lower compressive strain values(Figure 103). Consequently, more compressive hoop load was forced into the inside surfacematerial, producing slightly higher strain values. But again, the higher yield stress resulted inhigher stiffness and the compressive strain values on the inside surface did not increasesignificantly over those of the baseline properties (Figure 102). Load redistributions within themodel may be observed as maximum strain locations shifted axially from one point to another asthe yield stress was varied (Figures 102 and 103).
The plot in Figure 105 is a condensation of Figures 102 and 103, showing only themaximum values of strain from both the inside and outside surfaces of the model through therange of yield stress values.
C.A.E Thermal Conductivity
Variations in thermal conductivity had a substantial effect on strain range. However, withonly a small range of thermal conductivity values considered, the overall impact was onlymoderate compared to other property changes (Table 27). The effect of thermal conductivity wasdetermined by increasing its value 10 percent and decreasing its value 15 percent from thebaseline. The changes were made independently, with the other properties left unchanged.
Changes in thermal conductivity were simulated by reassigning new temperature values tothe MARC model. The new temperature values were calculated with in-house heat transfer decks(Section C.2.D) using the adjusted values of thermal conductivity in the heat transfer analyses.
Figure 106 is a plot of the maximum effective strain and strain range as a function ofthermal conductivity. The effect of a lower thermal conductivity was slower heat transfer and ahigher temperature on the outside surface of the copper liner. The higher temperature increasedthe tendency of the copper liner to expand, increasing the compressive hoop strains in the liner.Conversely, the effect of a higher thermal conductivity was a lower temperature and lowercompressive hoop strains in the liner.
169

121.25 Ol122-25 Iel ufo 7 ~
122-26123-27
0.045
0044M ..-...... Maximum StraIn RangeMaximum ftran
0,043-
0.042 -
0.041Elem. - I.P.:
0.040 -. l - 121-25
0.030 .Ipvw9- - 10 122-26
0.038Strain-
(In/in.) 0.037
0.038 122-26/ 122-25
0.035• 123-27
0.034
0.033
0.032 -
0.031
0.030 I I I I I I I I I I-60 -50 -40 -30 -20 -10 0 10 20 30 40 50 60
Peroont from Baseline o y
Figure 102. Effective Strain va Yield Stress (a), Inside Surface Only
170
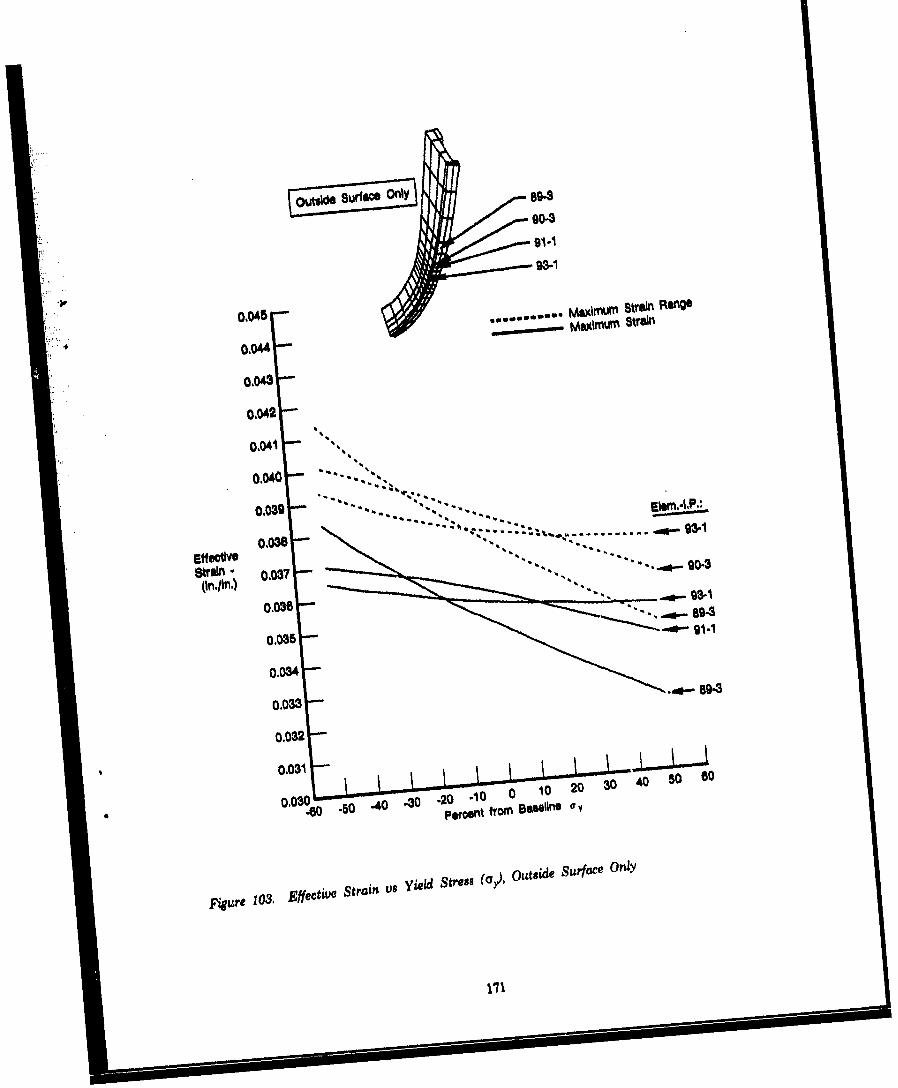
urO nly
90-3
91.1
93.1
S0,045•"". . . Maximum Strain RIMPi -- ~maximum tn
0.044
0.04$
0,042
0 .04 0 "" " .
0.040
. . . ...... 23,
o.036 -" '."-.e
0,03"Effective -, , ". ,,
Btrainf- 0,037"",.. ~. g0-89
0.035 " '
0.034 "0.038
o.032f"
0.031
o.030 20 -0 .10 0 10 20 30 40 50 60
0 peroent from BSo lns Od
Fig•re 103. Effective Strain us Yield Stre.s (0, Otitside Surface Only

0.04 0.04 -
* Efl. * Eff.
0.03 t 0.03 ,n,.50 0 s0 -50 0 s0
% ey
Outside Surface Inside Surface
Figure 104. Effective Strain vs Yield Stress (a), Locations of Maximum Strain
C0.F Creop Strain
Variations in creep strain rate had only a very slight effect on strain range. The effects ofcreep were determined by exercising the creep option in MARC, with a ten-minute hold at full-throttle steady-state conditions. A creep analysis was first done for the baseline material,assuming NARIoy-Z creep characteristics. Additional analyses were done for changes in thecreep rate, assuming rates which were both one-fifth and five times that of the baseline material.Figure 107 is a plot of the maximum effective strain and strain range as a function of the creepstrain rate.
C.&F.1 Bneeline Creep Strain v Baseline Without Creep
The creep analysis indicated that creep strain had an insignificant impact on the overalleffective strain, at least under the conditions assumed for this study. Ten minutes of creepresulted in only a 0.8 percent increase in the effective strain range (Table 27). The creep strainwas expected to be larger than it wai, considering the high metal temperatures on the surface ofthe copper liner. Creep usually becomes more significant with higher temperatures. However, inthe case of the copper liner, the higher temperatures also resulted in very low yield stresses, andtherefore lower plastic stresses in the chamber wall which were approximately equal to the yieldstress. Stresses significantly higher than the yield point would require unrealistically highamounts of strain, which would not occur in a deflection-controlled situation such as the OTVthrust chamber. Therefore, even though the temperatures were high, the lower yield stress in thechamber wall resulted in smaller creep strains since creep is a stress-driven phenomenon.
172

121-25
122-26t • -- 91-1
0045 - MIx. Vaus OnlyI
0.044 - Maximum Strain RangeMaximum Strain
0,043 Elem,- I-P,:
0,042 - 89
0.041 F e/--122-26
0,040 -... . 121-25
0,039 -
Effective 0.038 -Strain.(In./in.) 0,037 -91.1
0,036 ---- 2
0.035
0.034
0.033
0.032
0.0810,0300.03o0 I I I I I I I I I I I
-60 -50 .40 -30 -20 -10 0 10 20 30 40 50 60Peroent from Baseline r y
Figure 105. Effective Strain us Yield Stress (a,), Maximum Values Only
173

1222 9-112S-27
0.045
0.044 - -------- Maximum Strain RangeMaximum Strain
0.043n
0.042
0.0411 -
0.040 -\ \
0.039 Elrm. - I.P.:
01038 -- 122-26Effective 0.,03 - '%,• ',,,.12
Strain - 0.03(in./in.) 0037 - •..o-1
0.036
0.035- 01-1
0.034 - • 123-27
0.033 122-26
0.032I
0.031
0.030 - - 1 -1 -I I - 1 11 00, -.50 40 -30 -20 -10 0 10 20 30 40 50 50
Percent from Baseline k
Figure 106. Effective Strain us Thermal Conductivity (k)
174

122-260.045 90-3
0.044
0.043
.0.042 Max Strain
0,041 ELEM-IP.:
0.040 - -.. -,., --. +-2226
0,0-9- - - - (Baseline w/o Creep): Eft 0,088 -
Strain(In,/in.) 0.037
0.0360,05 0 i-i122-26
0,034 Ma Strain
0.033
0.032
0.031
0.03I I I0.2 0.5 1 2 5Factor x Bassline e o
Fgure 107. Total Effective Strain v# Creep Rate (ed
The chamber geometry used for this study was not optimized for heat transfer characteris-tics, although the design was felt to be adequate for the comparitive purposes of this materialstudy. Consequently, metal temperatures were higher than would normally be allowed for a high-life design. A more optimized chamber design would have lower metal temperatures, and thus ahigher yield stress, A higher yield stress would allow more stress for a given strain, and wouldproduce more creep strain.
To test the effect of yield stress on creep strain, an additional MARC analysis was doneusing baseline creep characteristics with a 50 percent higher yield stress (instead of lowering thetemperatures, the yield stress was increased to save the time and cost of a new thermal analysis).The results of this MARC analysis confirmed that a higher yield stress would produce more creepstrain. For the baseline yield stress and creep properties, the maximum creep strain was 0.001537in./in. But with a 50 percent higher yield stress, the creep strain increased to 0.003618 in./in., or2.4 times that of the baseline yield stress. The overall effective strain increased 2.7 percent withcreep and the increased yield stress, is indicated below in Table 29. Pertinent values fromTable 27 are repeated in Table 29 for comparison.
175
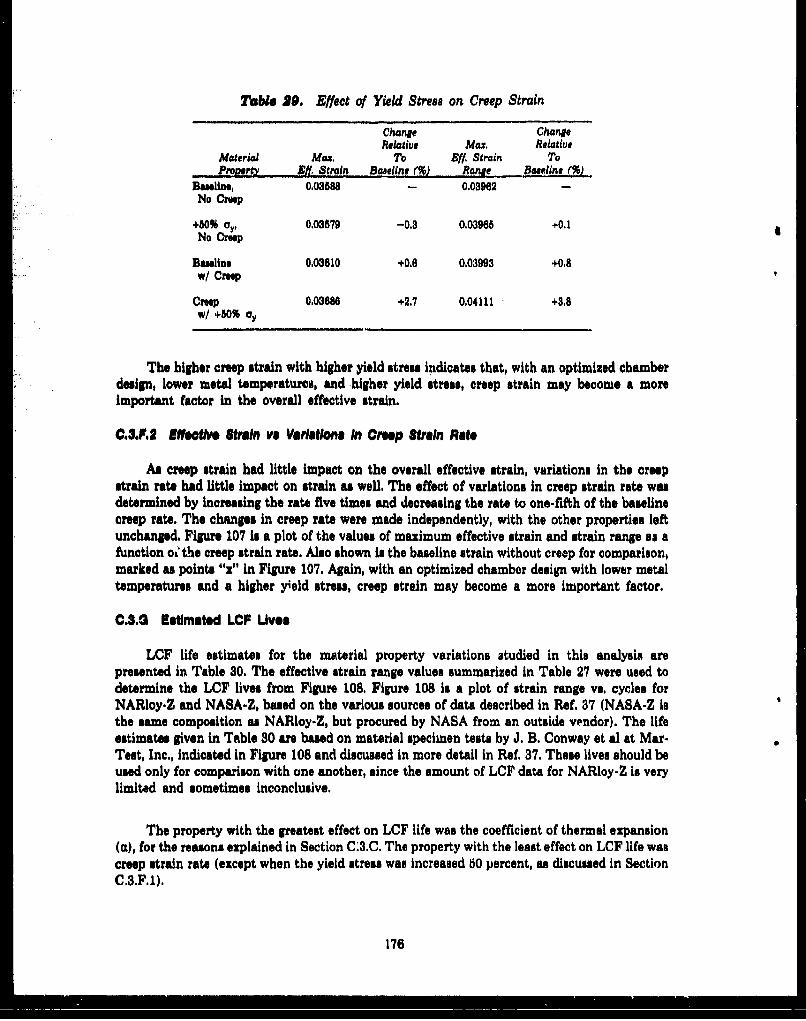
Table 29. Effect of Yield Stress on Creep Strain
Change ChangeRelative Max, Relative
Material Max, To Eff, Strain TOPronerty El, Strain Baeline (M) Ranse Baaeline (%)
Baseline, 0.03588 - 0.03962 -
No Croep
+50% ay, 0.03879 -0.3 0.03965 +0.1No Creep
Baseline 0.03610 +016 0.03993 +0.8W/ Creep
Crep 0,03686 +2,7 0,04111 +3S8W/ +80%
The higher creep strain with higher yield stress indicates that, with an optimized chamberdesign, lower metal temperatures, and higher yield stress, creep strain may become a moreimportant factor in the overall effective strain.
C.&FJ.2 ffeotiv Strain vs Varlations In Creep Strain Rate
As creep strain had little impact on the overall effective strain, variations in the creepstrain rate had little impact on strain as well. The effect of variations in creep strain rate wasdetermined by increasing the rate five times and decreasing the rate to one-fifth of the baselinecreep rate. The changes in creep rate were made independently, with the other properties leftunchanged. Figure 107 is a plot of the values of maximum effective strain and strain range as afunction ol the creep strain rate. Also shown is the baseline strain without creep for comparison,marked as points "x" in Figure 107. Again, with an optimized chamber design with lower metaltemperatures and a higher yield stress, creep strain may become a more important factor.
C.3.0 Estimated LCF Uves
LCF life estimates for the material property variations studied in this analysis arepresented in Table 30. The effective strain range values summarized in Table 27 were used todetermine the LCF lives from Figure 108. Figure 108 is a plot of strain range vs. cycles forNARloy-Z and NASA-Z, based on the various sources of data described in Ret. 37 (NASA-Z isthe same composition as NARIoy-Z, but procured by NASA from an outside vendor). The lifeestimates given in Table 30 are based on material specimen tests by J. B. Conway et &i at Mar.Test, Inc., indicated in Figure 108 and discussed in more detail in Ref. 37. These lives should beused only for comparison with one another, since the amount of LCF data for NARloy-Z is verylimited and sometimes inconclusive.
The property with the greatest effect on LCF life was the coefficient of thermal expansion(a), for the reasons explained in Section C.3.C. The property with the least effect on LCF life wascreep strain rate (except when the yield stress was increased 60 percent, as discussed in SectionCU3.F.1).
176

Table $0. Estimated LCF Lives Based on E#ective Strain Range of Material PropertyVariations
Max. Cyclic ChangeEft. Strain Max. Life Relatiue
Materil Range (from Temp. (from ToProperty Table Ic- 1) (7F) Fik 111.16) Boasline (%)
Baseline 0.03962 1059 87(NARloy-Z)
+38% E 0.04029 1089 84 -3,4-20% 2 0.038M3 1051 91 +4,6+10% a 0.04454 1059 68 -21.8
-10% a 0.03493 1044 114 +31.0
+50% Cy 0.03965 1019 87 0.0-80% oa 0,04148 1153 79 -9.2
+10% k 0.03847 1036 92 +5.7-15% k 0,04154 1100 78 -10.3
Bmlinew/ CreMp 0,03993 1089 85 -2.3
bOx , 0.04003 1059 85 -2.3O,2X 14 0.03983 1089 86 -1.1Basline CreMp 0.04111' 1019 80 -8.0
W/+50% a.,
*From Table 111.3,
The LCF data in Figure 108 was for NARIoy-Z and NASA.Z at 10000F. The locations ofmaximum effective strain range in the MARC analysis occurred inside the coolant passage wherethe temperatures were near 1000F, as listed In Table 30 (with the exceptions of the -50 percentay run, in which the maximum effective strain range occurred on the combustion side of the liner,and the -15 percent k run, which produced higher temperatures due to slower heat conduction).Although the maximum overall temperature in the MARC analysis was over 1300'F (Figure 93),this temperature occurred on the combustion side surface of the liner away from the maximumstrain range location. Test data indicated that temperature had little effect on LCF life at higherstrain ranges. But at lower strain ranges, temperature became more significant, with lowertemperatures resulting in higher lives.
Conway's data was based on cycles to failure. Test data from D. Fulton (Figure 108) wasbased on cycles to initiation of failure, but gave higher life predictions than Conway's data.However, Fulton's date was for a faster cyclic strain rate (0.1/nec), whereas Conway's data usedin Table 30 was for a slower cyclic strain rate (0.002/Bec). Other test data from Conway alsoindicated that faster cyclic strain rates resulted in higher LCF lives (Figure 108). While the lifeestimates quoted in Table 30 are based on a cyclic strain rate of 0.002/sec, the actual thrustchamber strain rate during OTV operation may be faster, In the baseline analysis, the effectivestrain approached 0.03559 in approximately one second, which is a significantly faster rate than0.002/sec. (approximately six seconds more were required for the strain to reach 0.03588 as thetemperatures approached steady state).
177

Used for LCF Life Estimate (Table 30):
0 NARIoy-Z, Continuous Cycle, ,002/sec;(J. B. Conway, Mar-Test, Inc,, see Ref. 1)
Additional Data:
A NARIoy-Z, Continuous Cycle, .05/2sc;
.A NARIoy-Z, Continuous Cycle, .01/sec;NAR004/ea; (J. B. Conway, Mar-Test Inc.,NARloy-Z, Continuous Cycle, .see Ref. 1).
r NARIoy-Z, Tensile Hold, 300 sec.;
i NARIoy-Z, Compressive Hold, 300 sec.;
* NASA-Z, Continuous Cycle, .002/sea;(J. Kazaroff, NASA Lewis Research Center, see Ref. 1),
NARIoy-Z, Continuous Cycle, .10/mac;(D Fulton, Rockwell International Corp., see Ref. 19.
10
PercentTotal 1
Range
10 100 1,000 10,000
Cycles to Failure
Figure 108. Low Cycle Fatigue Behavior of NARIoy-Z and NASA-Z at 10001F
Lives quoted for the creep analyses in Table 30 were based only on changes in the effectivestrain range resulting from creep rate variations, and did not include the effects of dwell time,However, test data indicated that cycles with compressive hold periocs resulted in higher livesthan those with no hold periods or those with tensile hold periods (Figure 108). The OTV thrustchamber strains that drove LCF life were mainly compressive (Section CA3,A).
Since the relationship between strain range and cycles in Figure 108 is logarithmic, thehigher values of strain range produced smaller differences in LCF life for varying test conditions.
178

The strain ranges determined in this analysis (and used for the life estimates in Table 30) wererelatively high, and the effects of material property changes were not as pronounced on LCF lifeas they would have been with lower strain ranges. A more optimized chamber design with lowertemperatures and lower strain ranges may show greater differences in LCF life.
C.$.H Uner Wall Deformation
The cycling of plastic strains in the liner wall resulted in a physical thinning of material inthe arch of the coolant passage at cycle shutdown. Figure 109 illustrates the thinning mechanism
5 on the NARloy-Z baseline material. A cross-section of the liner wall near the location of themaximum effective strain range was examined. Figure 109a shows the original shape of thecoolant passage before the material was cycled,
(A) (B) (C)Original Plastic Deformation Plastic DeformationShape at Full Throttle' at Shutdown'
* Deflections Exaggerated 1 Ox
Figure 109. Plastic Deformation of Liner Wall
At full throttle, compressive thermal loads in the hoop direction caused the arch of the linerwall to expand radially (Figure 109b). Since only the plastic strains act to permanently deformthe liner wall, the deflections shown in Figure 109b include only the effect of plastic strains. Theelastic and thermal strains have been subtracted out. The deflections are exaggerated for clarity.
Figure 109c shows the deformed shape at cycle shutdown. Again, the deflections shownwere due to plastic strains only, since the temperature was a uniform 70'F and no external loadswere applied, The material in the arch of the liner, which had yielded at full-throttle, was drawnthinner at shutdown as the surrounding material contracted.
The effects of thinning in the chamber liner have been observed in previous industryexperience. Test chamber results and analytical predictions of thinning were correlated in astudy done by Lockheed, Inc. (Ref. 43) for different chamber liner materials in a flat-wallconfiguration.
179

SECTION C.4CONCLUSIONS
Within the ranges expected, variations in candidate material properties will not have asignificant impact on thrust chamber liner strain range.
The coefficient of thermal expansion had the most significant effect, with lower valuesgiving lower strain ranges and higher life. However, lowering the coefficient in reality requiresmore alloying with the copper, which reduces the thermal conductivity. And in turn, reducing thethermal conductivity results in higher strain ranges and lower life, off-setting the benefits of thelower coefficient of thermal expansion. Increasing the thermal conductivity would lower thestrain range, but requires less alloying, which compromises the strengthening effects of alloying.The remaining properties did not have a significant effect on strain range.
The chamber geometry used for this study was not optimized for heat transfer characteris-tics, although the design was felt to be adequate for the comparitive purposes of this materialstudy. A more optimized design may result in lower temperatures, which would reduce thethermal fight between the copper liner and the nickel closeout, and would reduce the strainrange. The creep strain rate may be a more significant factor for an optimized chamber geometry,as lower temperatures result in higher yield strength and more creep strain.
Significant chamber life improvements should be sought through the following:
a An optimized chamber configuration for improved heat transfer capabilitiesand enhanced structural characteristics,
6 Candidate materials with improved fatigue life capability, includingcreep/LCF interaction,
* Better fatigue life definition of candidate materials (i.e., strain range vs. cyclesto failure under more applicable strain rates and loading conditions),including creep/LCF interaction.
ISO

APPENDIX 0REFERENCES
l81

REFERENCE$
1. Goalwin, D.S., A High-P resure Regeneratively Cooled Thrust Chamber,VoL 1: Analyasi, Test and Evaluation, Rocketdyne, Aug. 1969 (AFRPL-TR-68-226-Vol. 1).
2. Fulton, D., Inatigation of Thermal Fatigue In Non-Tubula RegenerativelyCooled Thrust Chambers, VoL 2, Rockwell International Corporation, May1978 (AFRPL-TR.73-10-Vol. 2).
8. Conway, J. B., at al., High Temperture Low Cycl Fatie of Copper-BaeAlloys in Argon, Part I. Preliminary Results of 12 Alloys at 100F (938C),Mar-Test, Inc., Jan. 1973 (NASA CR 121259).
4. Conway, J. B., at al., High Tenpeyature Low Cycle Fatigue of Copper-B.aeAlloys in Argon, Part 2, Zirconium Copper at 482, 08, and 593"C, Mar-Test,Inc., August 1978 (NASA CR 121280).
5. Conway, J. B., at al., Hih Temperature Low Cycle Fatigu of Copper-BaseAlloys in Argon, Part 3: Zirconium Copper, Thermal-Mechanical StrainCycling, Hold Time and Notch, Mar-Test, Inc., Dec. 1973 (NASA CR121261).
6. Conway, J. B. at al., High Temerature, Low Cycle Fatigue of AdvancedCopper Base Alloys for Rocket Noszsea; Part 1 - NARloy Z, Mar-Test, Inc.,May 1974 (NASA OR 134627).
7. Hannum, N.P., at al., Experimental and Theoretical Inveatigation of FatigueLife in Reusable Rocke Thruat Chambers, AIAA Paper 76.685, Palo Alto,CA, July 19'l1.
8. Quentmeyer, R.J., Experimental Fatigue Life Investigations of CylindricalThrust Chambera, AIAA Paper 77-893 (AIMA Conf., Orlando, 1977).
9. Private Communications with NASA Lewir. Research Center, Cleveland,
OH.
10, 240 K Staged Combustion Testing, Pratt & Whitney, 1 June 1971.
11. Newburn, F. and Romine, D., Internal LUtter PAM 2112-2014, NorthAmerican Rockwell, 22 March 1972 (From Marshall Space Flight Center).
12. Moeller, C.E. and McKown, R.D., Internal Letter MPR 76.2304, RockwellInternational, 8 December 1976 (from Marshall Space Flight Center).
13. Andrus, J. S., and Bourdeau, R. G., Thrust Chamber Material ExploratoryTechnology Program - Literature Review of Copper Baae Alloy#, Pratt &Whitney, 20 May 1984 (P&W No. FR.18383-1, NASA Contract NAS3-23888).
14. Small, L., Hardness Theory and Practice, Part 1, 1960, Service DiamondTool Co., Pg. 484 (Also in ASTM Standard 0140, Table 4).
182

15. Bourdeau, R. G., Development of Iron Aumtinidea, Pratt & Whitney, May
1987, (P&W No. FR-1S807, AFWAL-TR.-7-4009).
16, Phillips, V. A., Metallorphy, Vol. 7, No. 2 pp 137-165, April 1974.
17. Jones, F. W., et al., Proceedings of the Royal Society, A, Volume 181, pp 154-168, 1942.
18 Raty, R. and Miekk.oja, H, M., Philosophical Magaxine, Vol.18, pp 1106-1125, 1968.
19 Raty, R., The Role of Lattice Defects in Precipitation Proce.sse in CopperSiver Alloys, Helsinki University of Technology, Laboratory of PhysicalMetallurgy, Otanlemi, Finland, 1971.
20. Saarivirta, M. J., Metal Industry, Vol. 103, No. 19, pp 685.688,7 Nov. 1963.
21. Shih, C., High Temperature Low Cycle Fatisue Mechaniums for a Nichel-Ba•e and a Copper.Bae Alloy, University of Cincinnati, June 1982, (NASAContractor Report 3548).
"22. Nagal, T., et al., Transactions of the Japan Institute of Metals, Vol. 14, No.8, pp 462.469, Nov. 1973.
28. Henml, Z. and Nagal, T., Transactions of the Japan Institute of Metals, Vol10, pp 305-313, 1969.
24. Novikov, A. I. and Rounberg, V. M., Physics of Metals and Metallography,Vol. 37, No. 1, pp 192-194, 1974.
25. Hansen, M. and Anderko, J., Constitution of Binary Alloys, Second Edition,McGraw-Hill, New York and London, 1958.
26. Elliot, R. P., Constitution of Binary Alloys, First Supplement, McGraw HillBook Co., N.Y., 1965.
27. Mandingo, F. N., and Breedis, J. F., U. S. Patent 4,198,248, 15 Apr 1980.
28 Tigeot, J., Revue de Metallurgis (Paris), Vol. 69, No. 9, pp 773-784,September 1967.
29. Shunk, F. A., Constitution of Binary Alloys, Second Supplement, McGraw-Hill Book Co., N.Y., 1969.
30. Nishlyama, S. and Miyake, Y., CDA.ASM Conf. on Copper, Cleveland, OH,Oct 16-19, 1972, Copper Development Assn, N.Y. (prsprints).
31. Private Communications with Drs. N. Grand and I. Vcok of MassachusmetaInstitute of Technology, Cambridge, MA.
.32. Donnay, J. D. H., at al., Crystal Data, Determinative Tables, 24d ed., Vol. 2and 4, National Bureau of Standards and JCPDS, 1973 (V1) and 1978 (V2).
33. Satin, V. K. and Grant, N. J., Metallurgical Transactions, Vol. 3, pp 875.878, April 1972.
183
84. Sauin V. K. and Grant, N. J,, Powder Metallurgy International Vol. 11, No.4, pp 153-157, Nov. 1979.
85. Moffat, W. G., The Handbook of Binary Phase Diograrm, General ElectricCo., Schenectady, N.Y., June 1980.
36. Esposito, J. J. and Zabora, EL F., Thrust Chamber Life Predictiom, VoL 1:Mechanical and Physical Properties of High Perlrmance Rocket NouleMaterials, Boeing Aerospace Company, March 1975 (NASA CR184806).
37. Thrust Chamber Eploratory Technol Program - Literature Review ofCopper Base Alloys, prepared by Pratt & Whitney Government ProductsDivision under Contract NAS.-23868, May 20, 1984 (FR.18383-1).
88. 3-Dimensional Thrust Chamber Life Prediction, Boeing Aerospace Compa-ny, March 1975 (NASA CR-134979).
89. Orbit Transfer Rocket Engine Technology Program - Monthy TechnicalProgram Report No. 13, 1 through 81 August 1984, prepatd by Pratt &Whitney Government Products Division under Contract NAS3-23858,September 20, 1984 (FR-17808.13).
40. Orbit Transfer Vehicle (OTV) Advanced Expander Cycle Engine PointDesign Study - Final Technical Report prepared by Pratt & WhitneyGovernment Products Division under Contract NAS8-33567, Mauch 15,1981 (FR.14615, Volume II).
41. Thrust Chamber Life Prediction, Vol. II - Plug Notsle Centerbody andCylinder Life AnaLysis, Boeing Aerospace Company, May 1975 (NASA CR-134822).
42. Investigation of Thermal Fatigue in Non-Tubular Regeneratively CooledThrust Chambers, Vol. 1, Rockwell International Corp., May 1973(AFRPL-TR.73.10 - Vol. 1).
43. Structural Analysis of Cylindrical Thrust Chambers - Final Report, VolumeI and Volume II, Lockheed Missiles and Space Company, Inc. (NASA CR.159522 and NASA CR-165241, respectively).
184

1___Report ____No.__2. J ov7 mmjt A ccssion No. 3. Recipient's Catalog No.
7TeAuhnoogys Prga. Performing Organization CoeprN.
J.8. Andrus and R.O. Bourdeau FR-2067210. Work Unit No.
9. Performilng Organization Name and AddressUnited Technooies Coipuln I ontratorGat oPaul A Whitney11CotatrGanN.P.O. Box ISICO NA83*23888, Task C-1
Wes Pam Des, F an1013. Type of Report and Period Covered12. Sponsoring Agency Name and Address Final Report Aug 1983 -Aug 1986
National Asauiona~ and Stpao Adminiatiation 1,Sosrn gnyCdLawis Reaeumh Centel 4 pnoin gnyCdClevlad. Ohio 40138-191 _____________________
16. Supplemientary Notes
Task Order Mg?.: Mr. John Kazaroff, NASA Lewis Researcb Center
16. Abstract
This report covers work performed at Pratt & Whitney on development of copper-banedmaterials for Iong-lifit, roaumable, regeineratively cooled rocket engine thrust chambers. Theprogram approached the goal of enhanced cyclic life through the application of rapidsolidification to alloy development, to introduce fine dispersions to strengthen and stabilize thealloys at elevated temperatures. After screening of alloy systems, copper-besd alloys containingCr, Co, Hf, Ag, Ti, and Zr were processed by rapid-solidification atomizastion In bulk quantities,Those bulk alloys showing the most promise were characterized by tensiale testing, thermalconductivity testing, and elevated-temperature, low-.cycle fatigue ([IC) testing. Characterizationindicated that Cu- 1. 1% Hf exhibited the greatest potential as an improved-llf thrust chambermaterial, exhibiting LCF life about four times that of NASA.Z. Other alloys (Cu. 0.6% Zr, andCu- 0.6% Zr. 1.0% Cr) eh~ibted promise for use in this application, but needed moredevelopment work to balance properties.
17'. Key Words (Suggested by Authors)) 18, Distiribution Statement4Highoconduotlvity copper alloys, NASA.Z, thrust Unclassified - Unlimitedchamber mater~al, rapid solidification, powdermetallurgy, dispersion strengthening, low-cycle Subject Categories: 20 and 26fatigue, and thermal conductivity.
19. Secuirity Ciassif . (of this resport) * 20. Security Ciassif. (of this page) 21. No. of Pages 2.Prie
'For sale by the National Tecnnical lrnlormation Service, Springfield, Virginia 22161
N.&5AM*110~ee I'MI6 )1