a kentucky resources to meet the energy needs of … savings and renewable energy production. ......
TRANSCRIPT

Kentucky Resources to Meet the Energy Needs of the 25x’25 Initiative (UK-AEU 94) Page 1
AEU-94
A White Paper on
Kentucky Resources to Meet the Energy Needs of the 25x’25 Initiative
1
by – Donald Colliver2, James Bush2, Alison Davis3, Mike Montross2, Robert Fehr2,Richard Gates2, Greg Halich3, and Sue Nokes2; College of Agriculture, University of Kentucky The purpose of this paper is to present the results of an analysis of the current energy usage in Kentucky, projected energy usage in 2025, and the potential for options for energy savings and renewable energy production.
1.0 Current Energy Usage The official energy statistics from the U.S. Government are published by the Energy Information Agency4. Presented in Figure 1 is a national overview of the sources of energy and where this energy is used.
Figure 1. National Energy Flows, 2006 (Quadrillion Btu)5
1 University of Kentucky, College of Agriculture, Research Manuscript Number 08‐05‐038, revised 7‐24‐08 2 Biosystems and Agricultural Engineering Department, University of Kentucky 3 Agricultural Economics Department, University of Kentucky 4 US Energy Information Administration, http://www.eia.doe.gov/ 5 US EIA http://www.eia.doe.gov/emeu/aer/pdf/pages/sec1_3.pdf
Kentucky Resources to Meet the Energy Needs of the 25x’25 Initiative (UK-AEU 94) Page 2
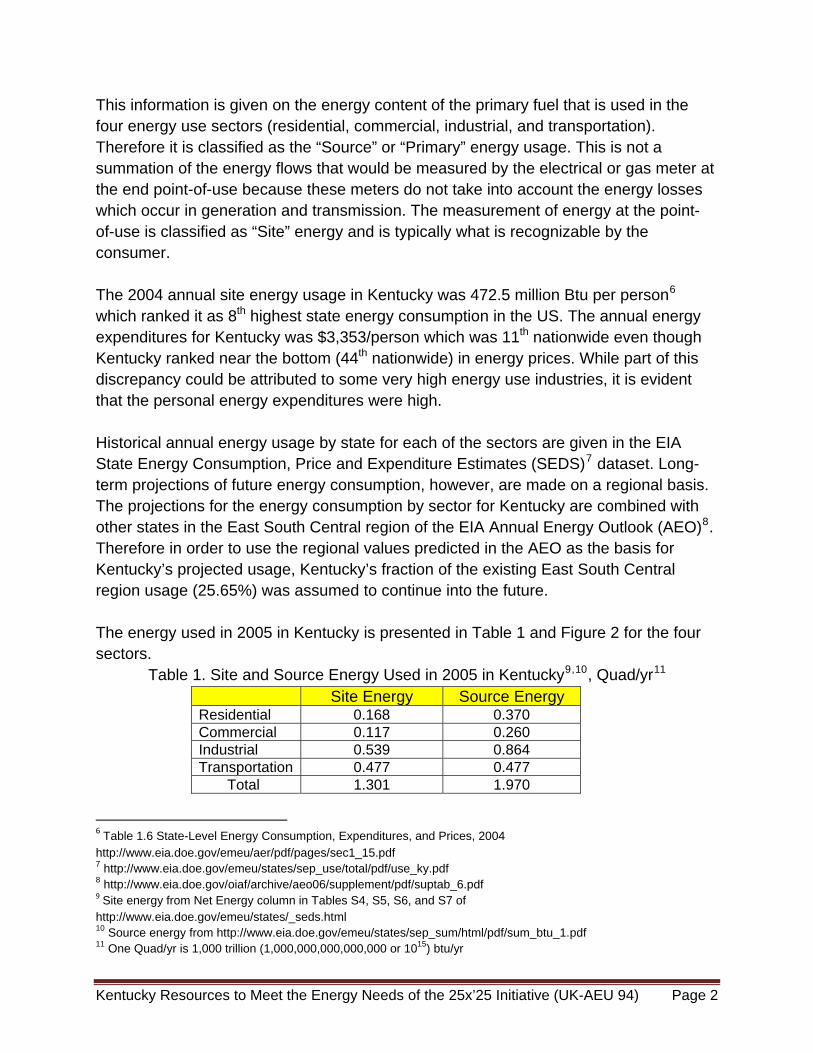
This information is given on the energy content of the primary fuel that is used in the four energy use sectors (residential, commercial, industrial, and transportation). Therefore it is classified as the “Source” or “Primary” energy usage. This is not a summation of the energy flows that would be measured by the electrical or gas meter at the end point-of-use because these meters do not take into account the energy losses which occur in generation and transmission. The measurement of energy at the point-of-use is classified as “Site” energy and is typically what is recognizable by the consumer. The 2004 annual site energy usage in Kentucky was 472.5 million Btu per person6 which ranked it as 8th highest state energy consumption in the US. The annual energy expenditures for Kentucky was $3,353/person which was 11th nationwide even though Kentucky ranked near the bottom (44th nationwide) in energy prices. While part of this discrepancy could be attributed to some very high energy use industries, it is evident that the personal energy expenditures were high. Historical annual energy usage by state for each of the sectors are given in the EIA State Energy Consumption, Price and Expenditure Estimates (SEDS)7 dataset. Long-term projections of future energy consumption, however, are made on a regional basis. The projections for the energy consumption by sector for Kentucky are combined with other states in the East South Central region of the EIA Annual Energy Outlook (AEO)8. Therefore in order to use the regional values predicted in the AEO as the basis for Kentucky’s projected usage, Kentucky’s fraction of the existing East South Central region usage (25.65%) was assumed to continue into the future. The energy used in 2005 in Kentucky is presented in Table 1 and Figure 2 for the four sectors.
Table 1. Site and Source Energy Used in 2005 in Kentucky9,10, Quad/yr11 Site Energy Source Energy
Residential 0.168 0.370 Commercial 0.117 0.260 Industrial 0.539 0.864 Transportation 0.477 0.477 Total 1.301 1.970
6 Table 1.6 State-Level Energy Consumption, Expenditures, and Prices, 2004 http://www.eia.doe.gov/emeu/aer/pdf/pages/sec1_15.pdf 7 http://www.eia.doe.gov/emeu/states/sep_use/total/pdf/use_ky.pdf 8 http://www.eia.doe.gov/oiaf/archive/aeo06/supplement/pdf/suptab_6.pdf 9 Site energy from Net Energy column in Tables S4, S5, S6, and S7 of http://www.eia.doe.gov/emeu/states/_seds.html 10 Source energy from http://www.eia.doe.gov/emeu/states/sep_sum/html/pdf/sum_btu_1.pdf 11 One Quad/yr is 1,000 trillion (1,000,000,000,000,000 or 1015) btu/yr
Kentucky Resources to Meet the Energy Needs of the 25x’25 Initiative (UK-AEU 94) Page 3
Figure 2a and 2b. 2005 Distribution of Site and Source Energy Usage by Sector in KY The significant differences in the percentages of each sector between the site and source usage is mainly due to the differences in the type of energy used in the sectors. Electricity is a large fraction of the residential and commercial sectors use. Electricity has the largest difference between site and source energy with a 3.2 conversion between source and site energy for 2005 in KY. Therefore when the site energy is converted by sector to source energy it becomes a larger fraction of the total.
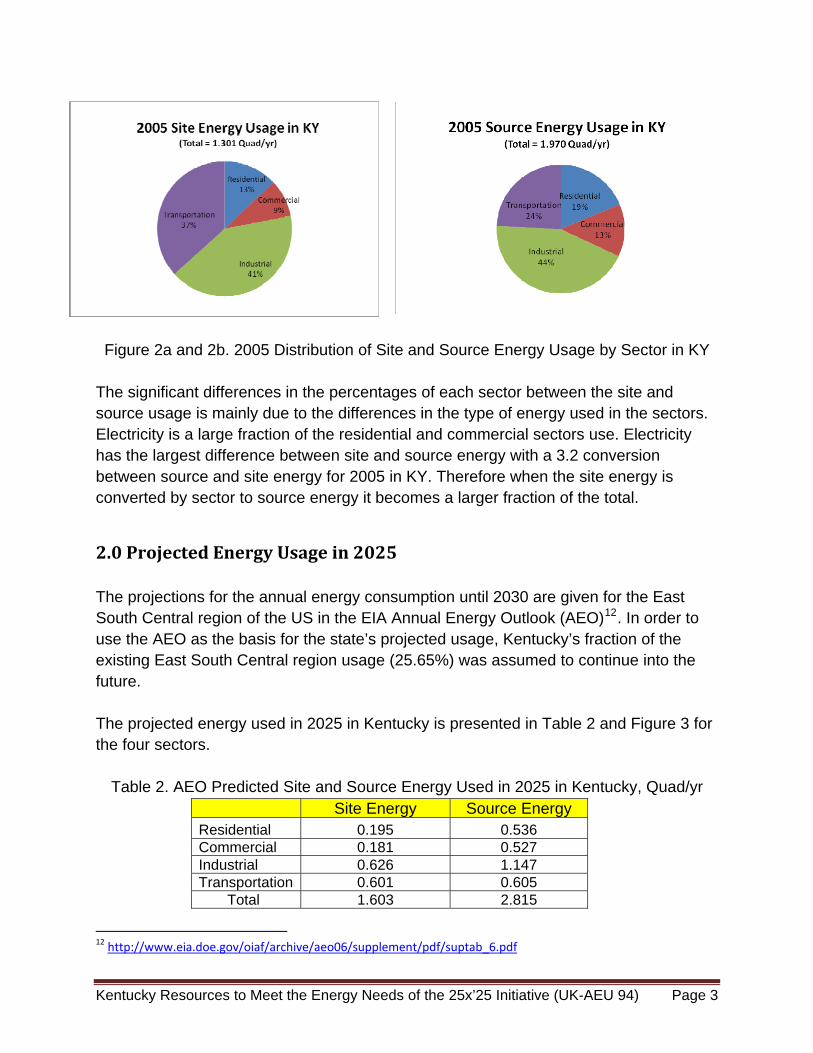
2.0 Projected Energy Usage in 2025 The projections for the annual energy consumption until 2030 are given for the East South Central region of the US in the EIA Annual Energy Outlook (AEO)12. In order to use the AEO as the basis for the state’s projected usage, Kentucky’s fraction of the existing East South Central region usage (25.65%) was assumed to continue into the future. The projected energy used in 2025 in Kentucky is presented in Table 2 and Figure 3 for the four sectors.
Table 2. AEO Predicted Site and Source Energy Used in 2025 in Kentucky, Quad/yr
Site Energy Source Energy Residential 0.195 0.536 Commercial 0.181 0.527 Industrial 0.626 1.147 Transportation 0.601 0.605 Total 1.603 2.815
12 http://www.eia.doe.gov/oiaf/archive/aeo06/supplement/pdf/suptab_6.pdf
Kentucky Resources to Meet the Energy Needs of the 25x’25 Initiative (UK-AEU 94) Page 4
Figure 3a and 3b. Distribution of Predicted 2025 Site and Source Energy by Sector
It should be noted that there are significant differences within the EIA data regarding the current site energy usage of the different sectors. This greatly impacts the estimates for future energy usage. For example, the EIA Annual Energy Outlook (AEO) indicates that the national commercial energy use intensity (EUI) is 114.8 kBtu/sqft-yr13 whereas the EIA Commercial Buildings Energy Consumption Survey (CBECS)14 indicates the national commercial EUI is 91.0 kBtu/sqft-yr. This is a difference of about 21%. Similar differences occur in the residential sector. Repeated attempts with the EIA15,16, other DOE personnel17 and researchers in the national laboratories18 who use these data have not been able to resolve or explain these differences. It was indicated however that the federal energy guidelines are based upon the CBECS values. Therefore for this analysis, the 2025 predicted values were the current CBECS values increased by the predicted increase given in the AEO.
13 http://www.eia.doe.gov/oiaf/aeo/excel/aeotab_5.xls cell B18 14 http://www.eia.doe.gov/emeu/cbecs/cbecs2003/detailed_tables_2003/2003set14/2003excel/c1a.xls 15 Personal Communication. EIA Contact Center. Paul Holberg 16 Personal Communication. Erin Bodecker. EIA 17 Personal Communication. Drury Crawley. US DOE. 18 Personal Communication. Mark Halverson PNNL and Brent Griffith NREL.
Kentucky Resources to Meet the Energy Needs of the 25x’25 Initiative (UK-AEU 94) Page 5
3.0 Potential of Energy Efficiency Options for Energy Savings The energy savings potential for implementation of a number of energy efficiency options in the residential, commercial and transportation sectors are given in the following section. The industrial sector was not included in the scope of this analysis.
3.1 Residential
This section estimates the energy savings potential of Kentucky’s residential sector in 2025. Energy savings are calculated relative to a base case home constructed in 2007. They represent the impact of all improvements made during the 18 year period, 2008 through 2025.
Energy savings are allocated to one of three areas:
1. Base Case improvement in energy efficiency over time, 2. Improvements made to the existing housing stock, and 3. Improvements made to new housing construction. The Base Case represents a general policy toward energy efficiency that encourages the adoption of a more efficient technology when items such as appliances and HVAC equipment are replaced. The Base Case is consistent with the EIA’s projection of relatively flat residential energy use per capita19 even though additional energy using devices are adopted in the home. Improvements to existing housing stock and new construction represent more aggressive, targeted programs for energy efficiency. 3.1.1 Total Housing Units and Growth
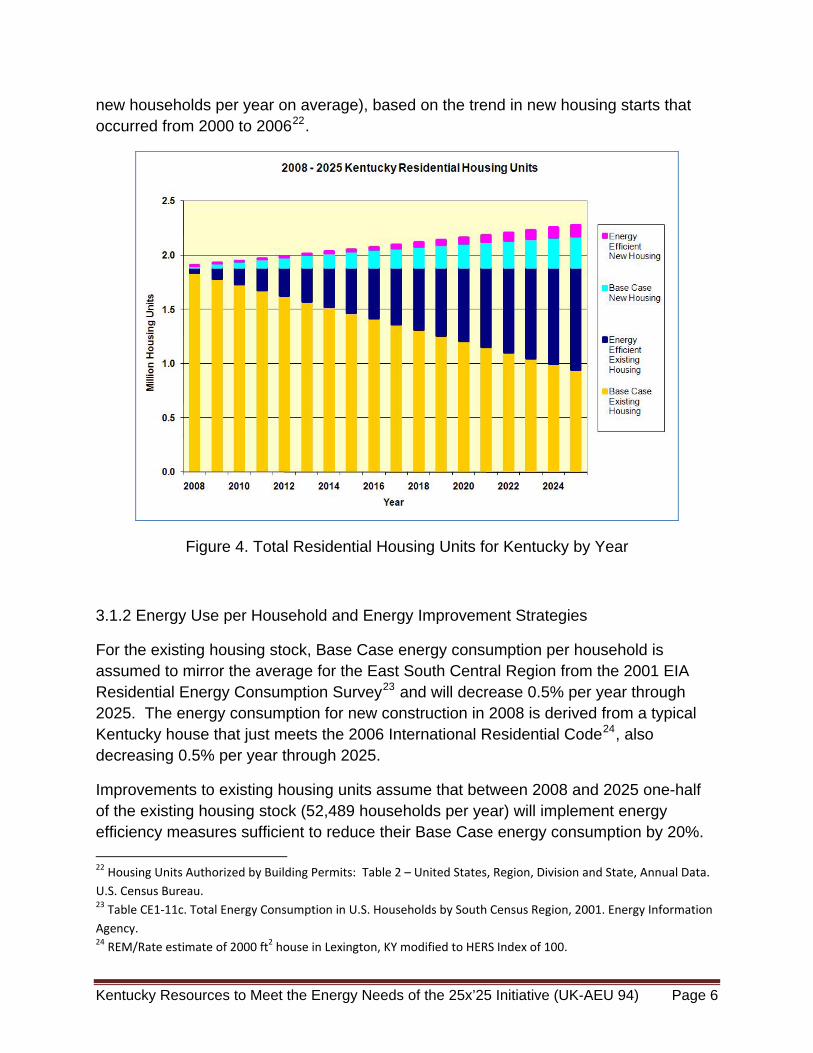
Total residential housing units20 for Kentucky by year are presented in Figure 4. The number of housing units is expected to increase from 1.91 million in 2008 to 2.28 million in 2025. The existing housing stock, based on 2006 U.S. Census data21, accounts for 1.89 million units and is assumed constant during the period. The analysis assumes that 388,191 new housing units will be constructed between 2008 and 2025 (21,566
19 Figure 27: Annual Energy Outlook 2007 with Projections to 2030. Energy Information Agency. 20 A residential housing unit includes single family residences, apartments, condominiums, manufactured houses and units in low‐rise residential complexes but does not include high‐rise residential units. 21 Table 1: Annual Estimates of Housing Units for the United States and States: April 1, 2000 to July 1, 2006 (HU‐EST2006‐01). Population Division, U.S. Census Bureau.
Kentucky Resources to Meet the Energy Needs of the 25x’25 Initiative (UK-AEU 94) Page 6
new households per year on average), based on the trend in new housing starts that occurred from 2000 to 200622.
Figure 4. Total Residential Housing Units for Kentucky by Year
3.1.2 Energy Use per Household and Energy Improvement Strategies
For the existing housing stock, Base Case energy consumption per household is assumed to mirror the average for the East South Central Region from the 2001 EIA Residential Energy Consumption Survey23 and will decrease 0.5% per year through 2025. The energy consumption for new construction in 2008 is derived from a typical Kentucky house that just meets the 2006 International Residential Code24, also decreasing 0.5% per year through 2025.
Improvements to existing housing units assume that between 2008 and 2025 one-half of the existing housing stock (52,489 households per year) will implement energy efficiency measures sufficient to reduce their Base Case energy consumption by 20%. 22 Housing Units Authorized by Building Permits: Table 2 – United States, Region, Division and State, Annual Data. U.S. Census Bureau. 23 Table CE1‐11c. Total Energy Consumption in U.S. Households by South Census Region, 2001. Energy Information Agency. 24 REM/Rate estimate of 2000 ft2 house in Lexington, KY modified to HERS Index of 100.

Kentucky Resources to Meet the Energy Needs of the 25x’25 Initiative (UK-AEU 94) Page 7
Examples of these types of measures include better air sealing, added insulation and/or improved HVAC systems.
Improvements to new housing construction assume that a growing portion of new housing starts will consume 15% less energy than their peers. This is equivalent to today’s criteria for ENERGY STAR certification. It is assumed that the adoption rate of these new energy efficient houses increases by 2.8% per year which results in one-half of all new housing starts in 2025 exceeding new Base Case performance by 15%. A summary of these energy consumption assumptions is presented in Table 3.
Table 3. Energy Consumption per Household, (site energy, million Btu/yr)
Year Existing Housing Stock New Housing Construction
Base Case millionBtu/yr
Energy EfficientmillionBtu/yr
Base Case millionBtu/yr
Energy EfficientmillionBtu/yr
2007 76.4 na 72.8 na 2008 76.0 60.8 72.4 61.6
: : : : : 2025 69.3 55.4 66.0 56.1
3.1.3 Residential Energy Savings Potential
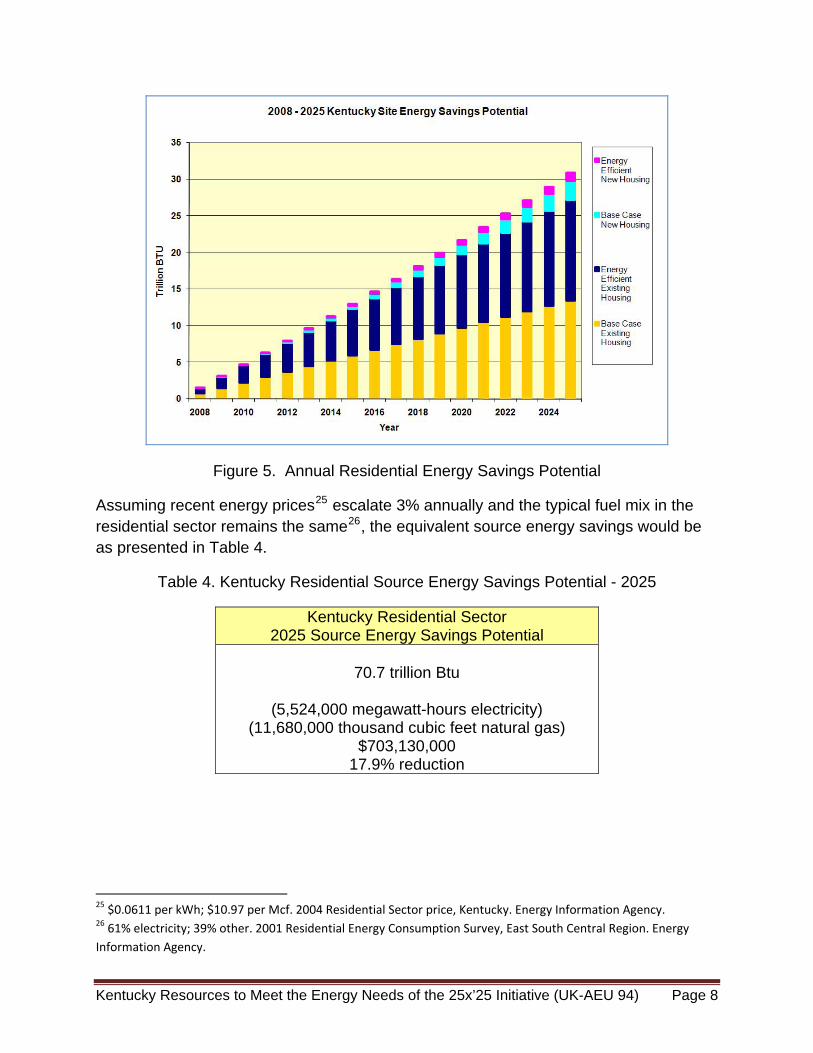
Kentucky households could reduce site energy consumption by 30.9 trillion btu (tbtu) in 2025. Energy efficiency improvements to the existing housing stock account for 88% of the reduction (27.2 tBtu). Improvements to new housing construction account for 12% (3.7 tBtu). Annual savings for the 2008 to 2025 period are presented in Figure 5.
Residential energy consumption in 2025 would be 172.6 tBtu if the housing stock operated at 2007 levels of efficiency and there were no improvements in energy efficiency. Energy improvements strategies have the potential to reduce energy consumption in 2025 to 141.7 tBtu.
Kentucky Resources to Meet the Energy Needs of the 25x’25 Initiative (UK-AEU 94) Page 8
Figure 5. Annual Residential Energy Savings Potential
Assuming recent energy prices25 escalate 3% annually and the typical fuel mix in the residential sector remains the same26, the equivalent source energy savings would be as presented in Table 4.
Table 4. Kentucky Residential Source Energy Savings Potential - 2025
Kentucky Residential Sector 2025 Source Energy Savings Potential
70.7 trillion Btu
(5,524,000 megawatt-hours electricity)
(11,680,000 thousand cubic feet natural gas) $703,130,000
17.9% reduction
25 $0.0611 per kWh; $10.97 per Mcf. 2004 Residential Sector price, Kentucky. Energy Information Agency. 26 61% electricity; 39% other. 2001 Residential Energy Consumption Survey, East South Central Region. Energy Information Agency.

Kentucky Resources to Meet the Energy Needs of the 25x’25 Initiative (UK-AEU 94) Page 9
3.2 Commercial
3.2.1 Total Building Area and Growth
The total area of commercial buildings in Kentucky by year is presented in Figure 6. The estimated total area is the area of the post-2003 era buildings plus the area of the new construction after that time. Based upon the energy use fraction of the east south central region there were approximately 886 million square feet of commercial building space in Kentucky in 200427 or 214 sq ft per person. It is assumed that the building area per person in the future will remain the same. Therefore the total building area will be proportional to the population and will increase at the same rate as the state’s population as estimated by KSDC28. It is also assumed that the life of a commercial building (or the life between extensive major renovations) is 50 years. Assuming the existing building stock (i.e. 2003-era buildings) was uniformly constructed over the previous 50 years, 2% of the 2003-era buildings will be replaced each year. Therefore the new buildings constructed each year will be a combination of the increase in building size due to population growth and the replacement of 2003-era buildings. The long-term effect of the current building stock on the total building inventory in the future can be seen from Figure 6.
0
200
400
600
800
1,000
1,200
2000 2005 2010 2015 2020 2025
Million Square Feet
Building Construction
2003 era bldg
New construction per yr
Total Post‐2003 Era Bldg sq footage
Estimated Total Building area (MMft2)
Figure 6. Area of Commercial Buildings in Kentucky
27 Table A4 Census Region and Division, Floorspace for all buildings. CBECS. 28 KSDC, Historical and Projected Household Populations, Number of Households, and Average Household Size. State of Kentucky.

Kentucky Resources to Meet the Energy Needs of the 25x’25 Initiative (UK-AEU 94) Page 10
3.2.2 Energy Use Intensity (EUI) and Optional Strategies for Change over Time The results of four different strategies to conserve energy are indicated in the EUIs presented in Figure 7. Note that these are “site” EUIs in all cases. Conversion to source energy will be considered later.
Option 0 (Base Case) : EIA Projected Increase in EUI - The EIA Annual Energy Outlook EUI long-term projections for the commercial sector increased over time due to the projected increase in use of electronic equipment despite anticipated improved efficiencies in equipment. Option 1: EUI remain constant over time – This option assumes that any increases in equipment are off-set by improved efficiencies in all equipment and new buildings will have the same EUI as existing buildings. Option 2: EUI for 90.1 code – This option assumes that existing buildings will have the same EUI as they currently have and all new buildings will be built and operate at the energy levels given in Standard 90.1-2004 – the basis for the commercial model energy codes29 Option 3: EUI decreased by 30% every five years on new buildings – This option assumes that existing buildings will have the same EUI as they had in 2004 and all new buildings will be built and operated at the energy levels given in Standard 90.1; and the levels given in Standard 90.1 are reduced by 30% in 2010 and a further 30% reduction every five years thereafter. This option is roughly based upon the Zero Energy Building by 2025 goals of the USDOE, ASHRAE, AIA, and Architecture 2030 and the mandate given for federal buildings in the 2007 Energy Act.
29 2004. ASHRAE. ANSI/ASHRAE/IESNA Standard 90.1‐2004 Energy Standard for Buildings Except Low‐Rise Residential Buildings.

Kentucky Resources to Meet the Energy Needs of the 25x’25 Initiative (UK-AEU 94) Page 11
Figure 7. Energy Use Intensities Based on Varying Assumptions 3.2.3 Projected Total Commercial Energy Use With Energy Efficiency Optional
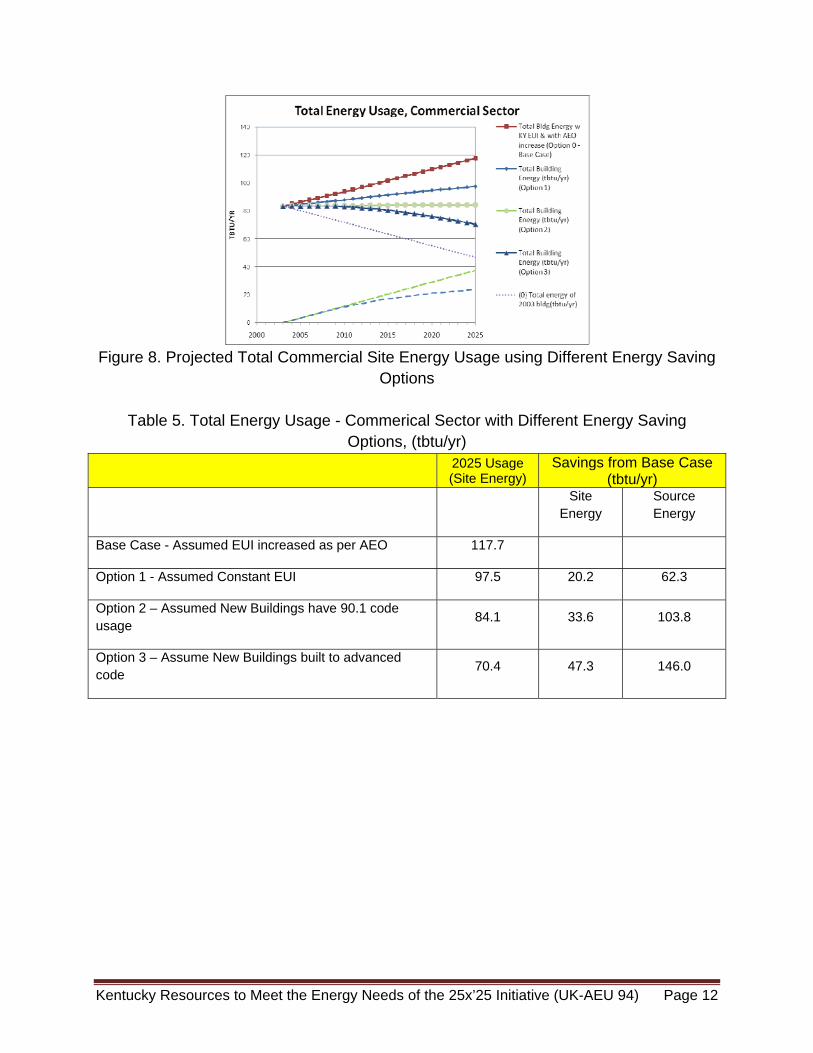
Strategies The total projected commercial energy uses with the different EUI strategies are presented in Figure 8. The amount of site and source energy savings in 2025 using the different energy efficiency optional strategies are presented in Table 5. It can be seen that by applying the existing building codes and assuring that the buildings are built and operated to code and that additional equipment is offset by increases in energy efficient can save 33.6 (site) and 103.8 (source) tbtu/yr. Using an strategy of implementing aggressive building codes can save 47.3 (site) and 146.0 (source) tbtu/yr. The small effect between these two significantly different measures illustrates the importance of implementing strategies which will mainly impact the existing building stock.
Kentucky Resources to Meet the Energy Needs of the 25x’25 Initiative (UK-AEU 94) Page 12
Figure 8. Projected Total Commercial Site Energy Usage using Different Energy Saving
Options
Table 5. Total Energy Usage - Commerical Sector with Different Energy Saving Options, (tbtu/yr)
2025 Usage (Site Energy)
Savings from Base Case (tbtu/yr)
Site Energy
Source Energy
Base Case - Assumed EUI increased as per AEO 117.7
Option 1 - Assumed Constant EUI 97.5 20.2 62.3
Option 2 – Assumed New Buildings have 90.1 code usage 84.1 33.6 103.8
Option 3 – Assume New Buildings built to advanced code 70.4 47.3 146.0

Kentucky Resources to Meet the Energy Needs of the 25x’25 Initiative (UK-AEU 94) Page 13
3.3 Transportation
The energy usage in the transportation sector in Kentucky is significant. However federal guidelines and requirements take precedence over state laws or initiatives. Therefore, we will only present the effects of the requirements of the 2007 Energy Independence and Security Act30. The act requires the Department of Transportation to set tougher fuel economy standards, starting with model year 2011, until the standards achieve a combined average fuel economy for model year 2020 of at least 35 miles per gallon (mpg). The standards apply to the total fleet of passenger and non-passenger automobiles manufactured for sale in the United States for that model year, up to a gross vehicle weight of 10,000 pounds. Currently, passenger automobiles must achieve an average of 27.5 mpg, while "light trucks"—a category that includes pickup trucks, sport utility vehicles, and minivans—must achieve 22.5 mpg, bringing the average for cars and light trucks to about 25 mpg.
The effect of this increase in transportation energy efficiency will be significant. It is estimated that 62 tBtu could be saved in 2025 if we improve the fuel economy of light duty vehicles from 28.9 mpg (the projection used in 2006 AEO) to 35.0 mpg (the requirement of the 2007 Energy Independence and Security Act)
4.0 Potential Renewable Energy Options
4.1 Biofuels Renewable Liquid Fuel Production from KY Agricultural Resources Liquid fuels from starch sources and grasses (corn stover, hay, switchgrass, and wheat straw) were considered due to their conversion ease. Wood residues are harder to convert to ethanol and for this analysis are assumed to be used for combustion purposes for electricity production only. Kentucky’s gasoline consumption was 2,320 million gallons per year during 2004 and ethanol contains 70% of the energy content of gasoline. The fuel production and costs are based on current prices and available land resources. The IMPLAN31 computer model was used to evaluate the potential impact in the three regions of the state. The regions were summed together to provide a state level impact on value-added to the state due to construction investment, annual value-added revenue, increased state taxes, jobs created during construction, and new jobs created for operating plants producing ethanol.
30 http://www.eere.energy.gov/news/archive.cfm/pubDate=%7Bd%20%272008%2D01%2D02%27%7D 31 http://www.implan.com
Kentucky Resources to Meet the Energy Needs of the 25x’25 Initiative (UK-AEU 94) Page 14
Overall, Kentucky could replace up to 21% of its gasoline consumption in 2004 using current land resources and costs. Construction of plants to produce this amount of biofuel would result in 130 million dollars of value-added benefits in Kentucky. On an annual basis, ethanol production would be expected to add up to 355 million dollars per year to the state economy and create 2,244 new permanent jobs. Tax revenue would increase by 3.1 million dollars per year. The total investment in the ethanol plants would be close to 600 million dollars with a resulting ethanol cost of $1.55/gal. On an equal energy basis compared to gasoline, this would be the equivalent of $2.21/gal (neglecting any road and sales taxes).
Table 6. Overall potential impact of ethanol production in Kentucky.
Cost ($ thousands) Jobs
Value-added due to construction 130,390 2,244
Value-added (per year) 355,520 1,832
State taxes (per year) 3,070
Percent gasoline displaced1 21.2%
1Percent of 2004 gasoline consumption displaced
Ethanol from Corn
The simplest product to convert to ethanol is the starch from corn grain. Based on statistics from USDA32, Kentucky produced, on average, approximately 1.4% of the nation’s corn crop over the past five years. During the previous year, 5.4 billion gallons of ethanol were produced33 using approximately 20% of the US corn crop. Assuming Kentucky would produce 1.4% of the ethanol, approximately 63 million gallons per year of ethanol could be produced from 32 million bushels of corn each year. However, increased ethanol consumption will result in greater production of corn that will be converted into ethanol. This was estimated using corn’s demand elasticity which estimates how much of a demand reduction will likely occur for corn’s use as food, animal feed, and other uses, given that the price of corn increases as ethanol plants expand. This decrease in demand is assumed to be transferred to corn-based ethanol production. Estimates for increases in additional corn acreage due to conversion from fallow ground, hay ground, and other row crops are also used in this analysis. Three
32 USDA National Agricultural Statistics Service – http://www.nass.usda.gov 33 Renewable Fuels Association ‐ http://www.ethanolrfa.org/industry/outlook/

Kentucky Resources to Meet the Energy Needs of the 25x’25 Initiative (UK-AEU 94) Page 15
scenarios (low, medium, and high corn price) were investigated, however, only the mid-level estimate is discussed. The base price for corn used in this analysis is $3.75 per bushel. This reflects an average price at which corn could be purchased during the last half-year (2007). Under this scenario, a corn price of $5.00/bu could be supported and Kentucky would produce an additional 44 million bushels of corn per year that would be converted to ethanol. This would result in a total ethanol production of 186 million gpy. The majority of the corn production is in the western portion of the state and it is assumed all plants are located in Western Kentucky. The additional corn production would support approximately three additional ethanol plants with a capacity of 48 million gpy (since there is currently one plant in Western Kentucky). Table 7 summarizes the impact of increased corn production and ethanol production within Kentucky. Additional corn and ethanol production could displace 6.7% of Kentucky gasoline consumption. This would require an ethanol selling price of $1.96/gal or the equivalent of $2.57/gal on a btu basis relative to gasoline.
Table 7. Overall impact of increased corn and ethanol production in Kentucky.
Cost ($ thousands) Jobs
Value-added due to construction 16,737 332
Value-added (per year) 83,240 722
State taxes (per year) 1,001
Percent gasoline displaced1 6.7
1Percent of 2004 gasoline consumption displaced
Ethanol from Switchgrass and Crop Residues
The initial production of ethanol from lignocellulosic materials would probably be done by converting crop residues and hay other than alfalfa or “other-hay”. Other-hay has a lower value than alfalfa hay. Kentucky has 2.15 million acres of land in other-hay with an annual yield of 2.3 ton/ac34. A significant land source in Kentucky for renewable energy production could originate from other-hay crop land. The scenario investigated was 25% of the other-hay land would be converted to switchgrass. It was assumed that switchgrass would have the same price as hay or farmers would not produce it.
34 USDA‐NASS ‐ National Agricultural Statistics Service ‐ www.nass.usda.gov

Kentucky Resources to Meet the Energy Needs of the 25x’25 Initiative (UK-AEU 94) Page 16
Three scenarios were investigated and the lower end estimate would see an increase in hay prices from 50 to $63/ton due to increased demand for land being used for ethanol production. In addition, this could result in a higher income per acre for farmers since the expected yield from switchgrass is 8 ton/ac. Delivery of biomass to the production plant was estimated at $20/ton resulting in a feedstock price of $83/ton at the plant gate. This assumed a net increase in hay acreage of five percent due to the increased demand for hay. Agricultural residues such as corn stover and wheat straw could also be collected to produce ethanol. Kentucky has averaged 1.1 million acres of corn and 0.3 million acres of wheat. An upper limit of residues that could be sustainably collected would be on the order of 1 ton/ac for corn stover and 1.25 ton/ac for wheat straw. This would result in an additional 1.5 million tons of material a year that could be collected with an average ethanol yield of 80 gal/ton. The total near-term production of ethanol from cellulosic crops would be 121 million gpy. If 25% of the other-hay crop land was converted to switchgrass production with a yield of 8 ton/ac, 4.51 million tons/yr of switchgrass would be available for ethanol production. Under this scenario switchgrass alone could produce 361 million gpy of ethanol (or 253 million gpy of gasoline equivalent). When combined with 186 million gpy from corn grain and 121 million gpy from agricultural residues, Kentucky could displace up to 21.4% of the gasoline consumption in 2004. Table 8. Overall impact of diverting 25% of the other-hay acreage to switchgrass and collecting agricultural residues for cellulosic ethanol conversion.
Cost ($ thousands) Jobs
Value-added due to construction 113,650 1,912
Value-added (per year) 272,280 1,110
State taxes (per year) 2,070
Percent gasoline displaced1 14.5%
1Percent of 2004 gasoline consumption displaced
Biodiesel from Oilseeds
Production of biodiesel requires fats or oils as a feedstock. In the US, these fats are provided primarily by soybeans. If Kentucky consumed 25% of the soybean crop for biodiesel production, 1.35% of the diesel fuel could be displaced. Alternative oilseed

Kentucky Resources to Meet the Energy Needs of the 25x’25 Initiative (UK-AEU 94) Page 17
crops have been investigated that utilize winter canola in a double-crop rotation with sunflowers. This has the advantage of increasing the oil yield per acre. If 25% of the soybean acreage and 25% of the wheat acreage was converted to a canola/sunflower double crop rotation 8.1% of the diesel fuel could be displaced. Development of new cropping systems (canola, sunflower, algae, etc.) will be required to significantly impact the distillate fuel consumption in Kentucky. Biofuels Summary An analysis done on the converting some of Kentucky’s agricultural resources into renewable energy35 indicated a significant amount of energy could be obtained by converting corn, switchgrass, corn stover, and wheat straw to ethanol and vegetable oil to biodiesel. A summary is presented in Table 9. The total potential production is 65.6 tBtu/yr if corn, corn stover, wheat straw, switchgrass, and vegetable oil are converted.
Table 9. Potential Ethanol and Biodiesel Produced in Kentucky from Biomass Fuels,
Million Gal/yr
tBtu/yr
Corn 186 14.1 Switchgrass 361 27.4 Corn Stover + Residues 121 9.2 Vegetable Oil to Biodiesel 107 14.9 Total 65.6
4.2 Solar Water Heaters
The amount of energy saved by installing a 32 or 64 ft2 solar collector on new houses is presented in Figure 9a. These are two popular sizes of heaters installed. The three lines are based upon the number of solar heaters installed: 10-, 20-, or 30% of the estimated 388,191 new homes built between 2008 and 2025. This represents 38,819, 77,638, and 116,457 houses respectively for the 10-, 20- and 30% market penetration.
The range of site energy saved was between 0.32 and 0.96 tBtu/yr for the 64 ft2 heater. The summary of energy savings table assumes 64 ft2 and 20% market penetration.
35 Nokes S., A. Reum, M. Montross, and G Hallick. 2007. Study of the Economics of Converting Some of Kentucky’s Natural Resources into Renewable Energy. Biosystems and Agricultural Engineering Department. University of Kentucky.

Kentucky Resources to Meet the Energy Needs of the 25x’25 Initiative (UK-AEU 94) Page 18
Figure 9a. The Site Energy Savings due to Installation of Solar Water Heaters on New Houses between 2008 and 2025
Using solar to heat water rather than electricity or gas also reduces the amount of CO2
produced. This reduction is presented in Figure 9b for the use of 32 and 64 ft2 solar water heaters replacing electrical water heating and various levels of market penetration. There was a reduction of between 0.10 to 0.31 million metric tons of CO2 production when a 64 ft2 solar heater was used to offset the need for electric water heating.
Figure 9b. Reduction in CO2 Produced Due to Using Solar Water Heating

Kentucky Resources to Meet the Energy Needs of the 25x’25 Initiative (UK-AEU 94) Page 19
The number of jobs created36 would be approximately 840 new jobs if a 20% market penetration was assumed.
4.3 Solar Photovoltaics The amount of energy saved by installing a solar photovoltaic (PV) system on new houses is presented in Figure 10a. The range of PV system sizes analyzed were 2 to 8 kW. The size of PV installed is typically based upon the amount of funding available; and these sizes still will not provide all the energy used in the house. The three lines are based upon the number of PV systems installed: 10-, 20-, or 30% of the estimated 388,191 new homes built between 2008 and 2025. This represents 38,819, 77,638, and 116,457 houses respectively for the 10-, 20- and 30% market penetration.
The range of site energy saved was between 0.32 and 0.96 tBtu/yr assuming 2 kW systems are installed and from 1.3 to 3.9 tBtu/yr for 8 kW systems. The summary of energy savings table assumes 6KW and 20% market penetration.
Figure 10a. Electrical Energy Savings by Using Residential PV Systems
The number of jobs created to install the 20% market penetration of photovoltaics would be approximately 1075 new jobs.
Residential PV systems also reduce the peak electrical demand when they are connected to the grid. The maximum electricity provided by the PV systems on the peak winter and peak summer day are presented in Figure 10b using 10-, 20-, and 30% of the new market penetration. The summer and winter peak generation are nearly the same but the winter generation is somewhat greater due to the higher PV efficiencies in the cooler temperatures. The range of electricity generated by installation of 2kW 36 It is assumed that it would take 4 man‐days to install a solar water heating system and 5 man‐days to install a solar PV system.
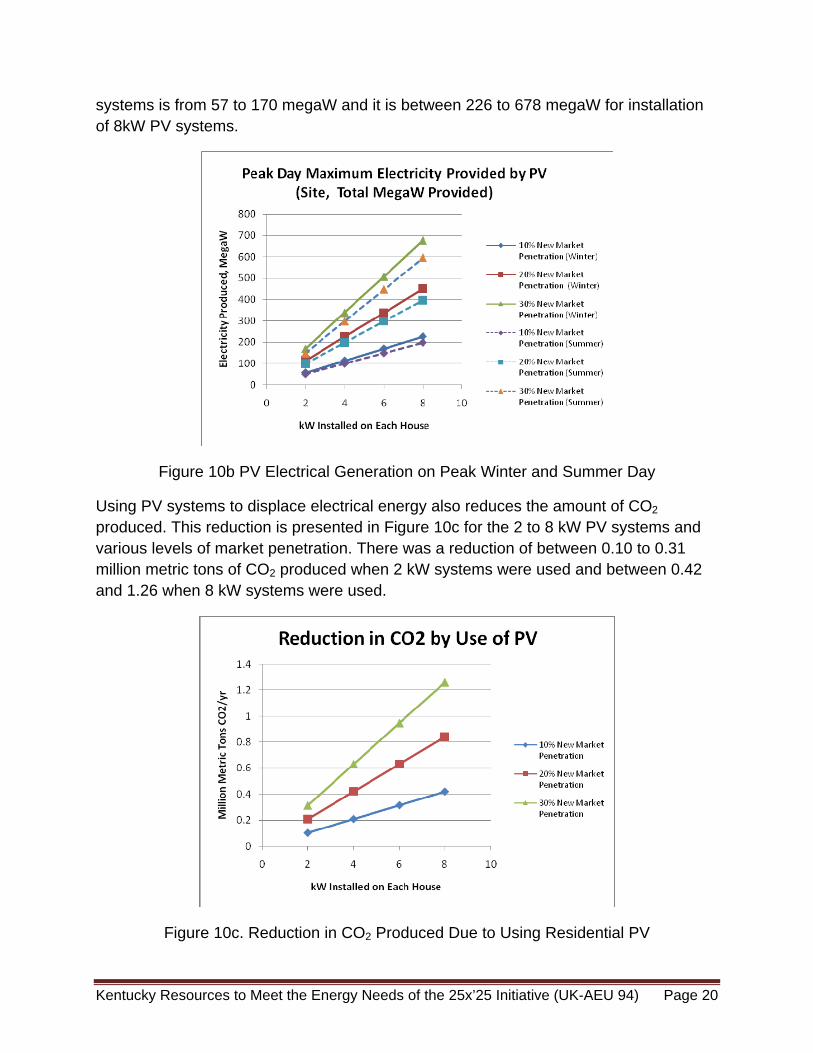
Kentucky Resources to Meet the Energy Needs of the 25x’25 Initiative (UK-AEU 94) Page 20
systems is from 57 to 170 megaW and it is between 226 to 678 megaW for installation of 8kW PV systems.
Figure 10b PV Electrical Generation on Peak Winter and Summer Day
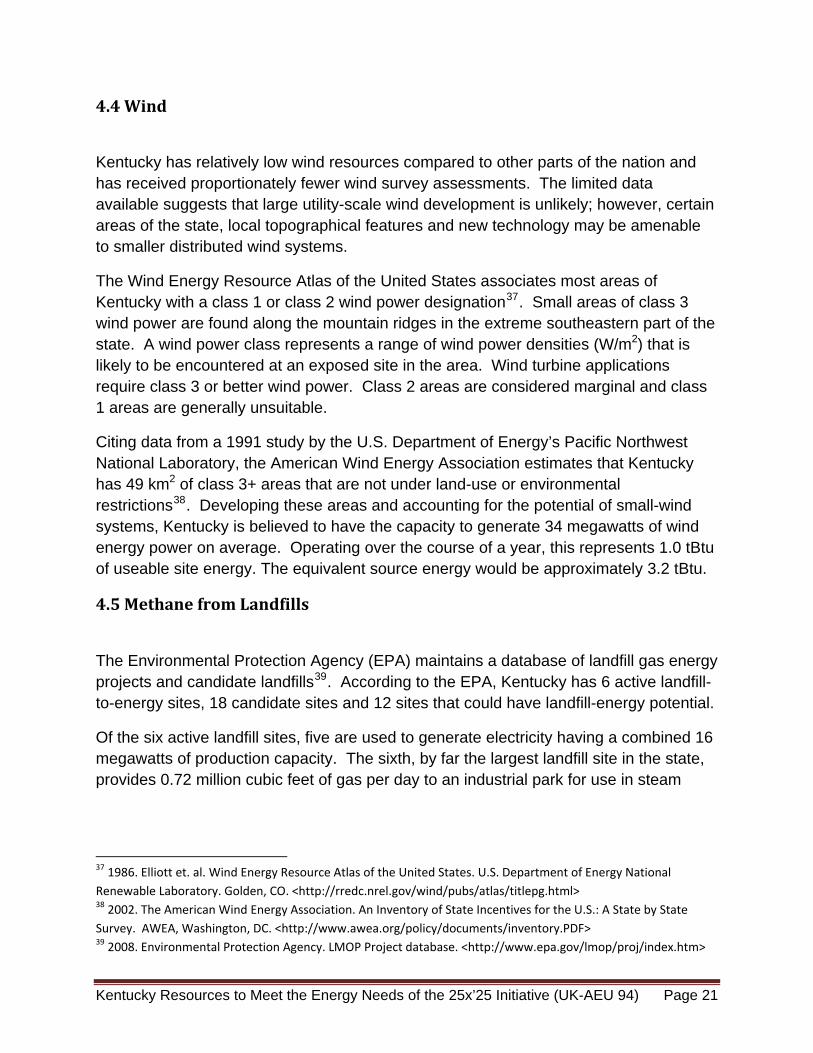
Using PV systems to displace electrical energy also reduces the amount of CO2
produced. This reduction is presented in Figure 10c for the 2 to 8 kW PV systems and various levels of market penetration. There was a reduction of between 0.10 to 0.31 million metric tons of CO2 produced when 2 kW systems were used and between 0.42 and 1.26 when 8 kW systems were used.
Figure 10c. Reduction in CO2 Produced Due to Using Residential PV
Kentucky Resources to Meet the Energy Needs of the 25x’25 Initiative (UK-AEU 94) Page 21
4.4 Wind
Kentucky has relatively low wind resources compared to other parts of the nation and has received proportionately fewer wind survey assessments. The limited data available suggests that large utility-scale wind development is unlikely; however, certain areas of the state, local topographical features and new technology may be amenable to smaller distributed wind systems.
The Wind Energy Resource Atlas of the United States associates most areas of Kentucky with a class 1 or class 2 wind power designation37. Small areas of class 3 wind power are found along the mountain ridges in the extreme southeastern part of the state. A wind power class represents a range of wind power densities (W/m2) that is likely to be encountered at an exposed site in the area. Wind turbine applications require class 3 or better wind power. Class 2 areas are considered marginal and class 1 areas are generally unsuitable.
Citing data from a 1991 study by the U.S. Department of Energy’s Pacific Northwest National Laboratory, the American Wind Energy Association estimates that Kentucky has 49 km2 of class 3+ areas that are not under land-use or environmental restrictions38. Developing these areas and accounting for the potential of small-wsystems, Kentucky is believed to have the capacity to generate 34 megawatts of windenergy power on average. Operating over the course of a year, this represents 1.0 of useable site energy. The equivalent source energy would be approximately 3.2 tBtu
ind
tBtu .
4.5 Methane from Landfills
The Environmental Protection Agency (EPA) maintains a database of landfill gas energy projects and candidate landfills39. According to the EPA, Kentucky has 6 active landfill-to-energy sites, 18 candidate sites and 12 sites that could have landfill-energy potential.
Of the six active landfill sites, five are used to generate electricity having a combined 16 megawatts of production capacity. The sixth, by far the largest landfill site in the state, provides 0.72 million cubic feet of gas per day to an industrial park for use in steam
37 1986. Elliott et. al. Wind Energy Resource Atlas of the United States. U.S. Department of Energy National Renewable Laboratory. Golden, CO. <http://rredc.nrel.gov/wind/pubs/atlas/titlepg.html> 38 2002. The American Wind Energy Association. An Inventory of State Incentives for the U.S.: A State by State Survey. AWEA, Washington, DC. <http://www.awea.org/policy/documents/inventory.PDF> 39 2008. Environmental Protection Agency. LMOP Project database. <http://www.epa.gov/lmop/proj/index.htm>
Kentucky Resources to Meet the Energy Needs of the 25x’25 Initiative (UK-AEU 94) Page 22
boilers – approximately half of the methane collected at the landfill40. The 18 candidate and 12 potential sites have a total of 53.4 million tons of waste in place.
Assuming that all of the methane at the largest landfill can be utilized and that the waste available for energy projects in the future will approximate the tonnage held currently, landfill methane recovery could provide 2.0 tBtu of site energy in 2025. The energy potential presented in Table 10 assumes methane contains 506 btu/ft3 and that 1 million tons of waste in place is equivalent to 0.8 MW of electricity generating capacity.
Table 10. Landfill Energy Potential (tBtu/yr)
Landfill Sites Utilization 2008 2025
5 active Electricity 0.48 (16 MW)
0.48 (16 MW)
1 active Direct 0.13 (0.72 million scfd)
0.27 (1.4 million scfd)
18 candidate + 12 potential Electricity 0 1.3
(42.7 MW) Total (Site) 0.6 2.0 Total (Source)41 1.7 5.9
4.6 Biopower from available forest resources – creating electricity
Kentucky has a large potential for producing woody material for renewable energy. Antares Group has estimated for KY a potential 4.18 million dry tons per year (mdt/yr) from forest thinning42 (1.21 mdt/yr), forest residues43 (1.95 mdt/yr), urban wood44 (0.34 mdt/yr), and mill residues45 (0.67 mdt/yr). Assuming an energy content of 8,000 btu/dry lb, the woody material identified by the Antares Group study could produce 66.9 tBtu/yr. This neglects the potential of utilizing CRP land and underutilized farm land for short rotation woody groups that would increase the potential for forest products.
40 Personal communication. Louisville Air Pollution Control District. 41 Source energy includes a 3.2:1 conversions factor for electricity. 42 Antares assumed fuel removal projects are limited to only 85% of forest lands, 60% of North American forest land is accessible with conventional logging equipment, and a 30 year recovery cycle. 43 Antares assumed conventional logging operations only allow for 60 to 65% of logging residues to be collected and land clearing projects only allow half of other removals to be recovered. 44 Antares assumed only 38.9% of the wood was available for fuel production. 45 Antares has assumed that only 35% of primary mill residues would be available for a biofuels project.

Kentucky Resources to Meet the Energy Needs of the 25x’25 Initiative (UK-AEU 94) Page 23
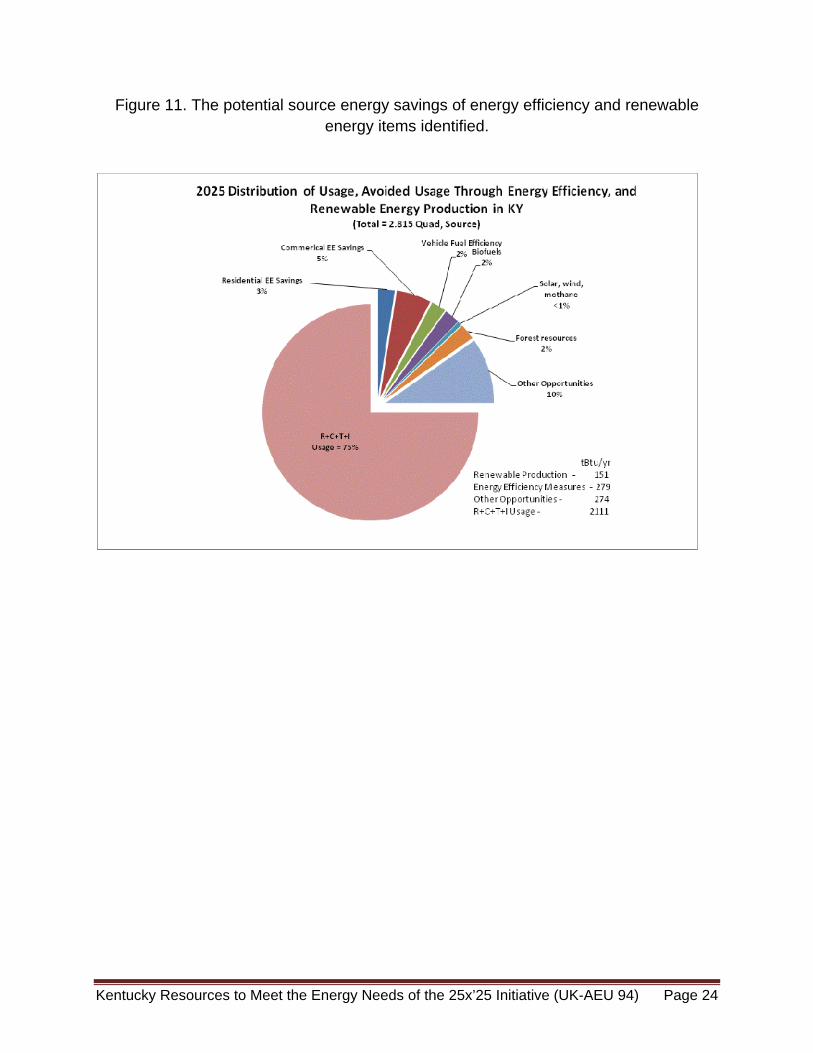
5.0 Summary of Energy Savings
Based upon the finding in the previous sections, the estimate of the energy savings potential for energy efficiency and renewable sources are summarized in Table 11. The total energy savings potential from renewable energy resources, biofuels and energy efficiency in the residential, commercial and transportation sectors in Kentucky amounts to approximately 15% of the total estimated source energy used in Kentucky in 2025. The industrial sector was not investigated in this analysis.
Table 11. Summary of Potential Source Energy Savings, tBtu
2025 Energy Savings Potential, tBtu Residential EE 70.7 Commercial EE 146 Light duty vehicle fuel economy 62 Biofuels 65.6 Residential Solar Water Heating . 2.0 Residential Photovoltaics 6.3 Wind 3.2 Landfill Methane 5.9 Forest Resources 66.9 Total
428.6
Kentucky Resources to Meet the Energy Needs of the 25x’25 Initiative (UK-AEU 94) Page 24
Figure 11. The potential source energy savings of energy efficiency and renewable energy items identified.

Kentucky Resources to Meet the Energy Needs of the 25x’25 Initiative (UK-AEU 94) Page 25
APPENDIX – CONVERSIONS
KY Fraction of Energy Use in the East South Central Region Site Source Residential 0.2555 0.2407 Commercial 0.2559 0.2418 Industrial 0.2611 0.2853 Transportation 0.2418 0.2418 All Sectors 0.2525 0.2589 Conversions All masses are in dry (0% moisture) basis. Ethanol assumed 70% of energy content of gasoline. All volumes of fuel reported as gallons of gasoline equivalent. Available Land Resources Crop production in each county estimated using the average of 2002‐2006 data from USDA‐NASS Cellulosic ethanol from crop residues Ethanol yield of 80 gal/ton Sustainable removal rate of 1.0 and 1.5 ton/ac for corn and wheat stover. Five year average of 1,097,000 acres of corn harvested Ethanol from corn stover = 1.0 ton/ac*(1,097,000 ac)*(80 gal/ton)*(0.7 gal gas/gal
ethanol) = 61,457,760 gal of gasoline equivalent Switchgrass to ethanol Ethanol yield of 80 gal/ton Production rate of 8 ton/ac/yr One quarter of other hay ground converted to switchgrass Additional five percent of pasture land converted to hay production Total switchgrass acreage of 564,000 ac Ethanol from switchgrass = 6 ton/ac*(564,000 ac)*(80 gal/ton)*(0.7 gal gas/gal ethanol) = 252,672,000 gal of gasoline equivalent Source to Site Electricity Conversion46 Source to site ratio = 1 + (Electrical system energy losses/retail electricity sales) Ratio for KY = 3.20 (value used in this paper) Residential = 3.197 Commercial = 3.198 Industrial = 3.196 Electricity produced on site avoids thermal generation and transmission losses. 1 Btu site energy = 3.2 Btu equivalent source energy. Applies to electricity generated by wind, solar PV, and landfill methane. It’s assumed that solar hot water is displacing electrical water heating and therefore applies to solar water heating.
46 http://www.eia.doe.gov/emeu/states/_seds.html