a literature review on cold soaked fuel frost formation
TRANSCRIPT
A Literature Review on Cold Soaked Fuel Frost Formation and Sublimation
Pekka Koivisto
Trafi Research Reports Trafin tutkimuksia
Trafis undersökningsrapporter 6/2015
Trafi Research Reports 6/2015
1
A Literature Review on Cold Soaked
Fuel Frost Formation and Sublimation
Pekka Koivisto, Aalto University, Department of Applied Mechanics
Finnish Transport Safety Agency Liikenteen turvallisuusvirasto Trafi Trafiksäkerhetsverket Trafi Helsinki Helsingfors 2015 ISBN 978-952-311-072-4 ISSN 2342-0294

Trafi Research Reports 6/2015
2
FOREWORD
This research report is a literature survey on studies of Cold Soaked Fuel Frost, which is an important subject in aviation safe-ty. It forms part of the third year studies in the Icewing project initiated by the Finnish Transport Safety Agency, Trafi.
The research was performed by the team of Arteform Oy, headed by MSc Juha Kivekäs.
Helsinki, September 15th 2015
Erkki Soinne
Chief Adviser, Aeronautics
Finnish Transport Safety Agency, Trafi
Trafi Research Reports 6/2015
3
Index Abstract
1 Background and objective ............................................................... 5
2 Types of Frost ................................................................................. 6
3 Frost Formation Literature .............................................................. 7
3.1 Characteristics of Frost Growth .................................................. 7
3.2 Frost Growth on Simple Geometries as a flat plate ...................... 10
3.3 Frost Growth on Aircraft at Ground ............................................ 14
4 Frost Sublimation Literature ......................................................... 16
5 Conclusions ................................................................................... 22
References......................................................................................... 23

Trafi Research Reports 6/2015
4
ABSTRACT
This literature review is a part of Icewing 3 –project in which the wing aerodynamic properties are studied when subjected to either de/anti-icing fluids or Cold Soaked Fuel Frost (CSFF). The litera-ture review serves as an introduction for frosting phenomena and sublimation phenomena of frost. The published literature consider-ing specifically aircraft Cold Soaked Fuel Frost is very scant and does not include analysis on frost growth or sublimation at all. Therefore this survey refers mostly on studies considering refrig-eration industry.

Trafi Research Reports 6/2015
5
1 Background and objective
Icewing 3 -project includes wind tunnel tests with flat plate model covered with Cold Soaked Fuel Frost. This literature review serves as an introduction for the-oretical and experimental studies published on frost formation and sublimation of frost. The main objective is to get an insight of state of the art on the topic.
In the focus of interests regarding Icewing 3 –project’s frost research is subli-mation of frost in an airstream. Unfortunately the studies published for the needs of refrigeration industry do not include air speed values even close to the ones relevant in aircraft CSFF sublimation.

Trafi Research Reports 6/2015
6
2 Types of Frost
The term Cold Soaked Fuel Frost is in general use only in the aircraft and airline industry. Even the term cold soaked frost is clearly unidentified on e.g. refriger-ation industry. That is probably due to the fact that the frost forming in refrig-eration and heat exchanger process is actually always cold soaked frost.
As a “counterpart” frost type the so called hoar frost is a generally adopted term in the frost research as the process is somewhat different to the cold soaked frost where the cooling of the object forming frost realizes in a different way. In case of CSFF the skin of the object is cooled below the frost point via conduction cooling due to the cold soaked fuel whereas in hoar frost the object is cooled below ambient temperature to the frost point due to radiation.
In practice the difference in occurrence of either CSFF or hoar frost is related to ambient temperatures. CSFF may build up even at quite high temperatures above freezing point. This is due to the fact that the frost point (temperature when frost forms) is always higher or equal to the dew point (liquid drops form). Hoar frost builds up normally only at ambient temperatures close to the freezing point of water (0˚C). Though there is very few published studies found by the author on the difference between these two frost types, the hoar frost is said to be different in structure from the cold soaked frost1. Also the density of the frost is reported to be lower in the hoar frost than in the cold soaked frost.
This study will focus on the so called cold soak frost formation. Also the very few references regarding sublimation of frost are considering cold soaked frost.
Trafi Research Reports 6/2015
7
3 Frost Formation Literature
Frost growth has been studied by numerous researchers starting as early as the middle of 20th century. Most of the research until last decade primarily focused on understanding the characteristics of the frost layer and its growth on flat plates. Since mid 1980s the focus of frost research has changed to geometries applicable to heat exchangers. Frost growth models for geometries such as a flat plate and a tube were developed. Most researchers started with the basic differential equations for heat and mass transfer and solved them analytically with the use of heat transfer coefficients obtained from experiments. According to Sankaranarayanan2 review of frost growth research can be classified into three broad groups:
1. Characteristics of frost growth: This group deals with the determination of the physical properties of the frost layer like density, conductivity, porosity etc. Every publication in this group is aimed in developing a correlation for the re-quired quantities based on the experiments.
2. Frost growth on simple geometries such as a flat plate: The rate of the frost growth and factors affecting the frost growth are the major questions answered in this group of publications. Both experimental and numerical approaches are undertaken by researchers.
3. Frost growth on heat exchanger geometries: Geometries that are applicable for heat exchangers are considered in this group. The approach taken is mostly semi-analytical with support from experimental data.
In the following mainly the two first groups are considered. In addition to this one reference is found on frost formation on ground aircraft (chapter 3.3). Un-fortunately this paper considers a model for hoar frost.
3.1 Characteristics of Frost Growth
Yonko and Sepsy3 worked on the thermal conductivity of the frost layer. They presented both analytical analysis and empirical correlations. Empirical correla-tion for thermal conductivity was presented as function of the frost density. The correlations were developed based on the experiments performed by the au-thors. They also presented different correlations from previous researchers. As the correlation for frost conductivity contained only frost density, the spread in the experimental data was explained by the authors to be a result of difference in the macroscopic structure of the frost. To support their argument, authors demonstrated that two frost layers of same thickness but different internal build up had different thermal conductivities using a simple compound wall approach. The authors did not provide any theoretical evidence regarding the effects of macroscopic structures.
Brian et al.4 conducted experiments to determine the characteristics of the frost layer. Properties of frost layer such as density and conductivity were correlated as functions of the stream variables such as humidity, Reynolds number and time since the start of frosting. An experimental set up with a copper plate maintained at cryogenic temperatures was used and humidified nitrogen gas was blown so that forced convection was dominant. Authors observed that the whole process could be divided into two parts. In the first part, the frost layer grows gradually and as a result decreasing heat transfer rates and increasing frost surface temperatures are gained. In the second part heat transfer rate and frost surface temperature remains constant even though frost thickness in-
Trafi Research Reports 6/2015
8
creases. This observation is quite different from the expected behavior since it is expected that thicker frost decreases the overall conductivity and heat trans-fer rates should drop. The authors supported this claim by arguing that in the second part the density of frost increases (increasing conductivity) which will compensate any increase in resistance due to thickness. Results reported were measured during the second part. Uniform thickness was assumed to exist on the test apparatus, which was measured using a micrometer. The density was measured indirectly from the thickness data and the weight of the frost. The au-thors also reported the temperatures of frost layer at different heights from the plate. It was shown that the rate of change of temperature at layers near to the cold plate is high and in the outer layers the temperature change is less. The frost thickness was found to increase with increasing humidity and decreasing Reynolds number. The authors also found that an increase in density resulted in an increase in conductivity. Models for frost density and frost conductivity were also proposed which showed good agreement with the measured data.
An experimental study to relate frost thermal conductivity to the type of frost was done by Hayashi et al.5 . The facility was designed to vary the plate tem-perature (0 to -25˚C), air absolute humidity (0.0045 to 0.01) and air velocity (1 m/s to 6 m/s). The objective was to classify the frost formation types and then to correlate the frost characteristics (conductivity and density) based on these frost formation types. Classification was based on the photographic observa-tions made during different times of frost formation. The authors classified frost formation into four major groups based on the plate surface temperature and concentration difference between air and the surface. Each group was then clas-sified into subgroups depending on the shape of the frost at its initiation. Au-thors noticed a parabolic relation between frost density and time at all the measured surface temperatures. However, the rate of change of frost density in the initial stages was remarkably different for different frost formation types. Experimental results were published for the conductivity of frost as a function of density. An expression for the effective thermal conductivity of frost was pre-sented based on the structural analysis of frost. The authors did not present the method used for data reduction for thermal conductivity neither did they pre-sent any uncertainty in the heat flux.
Hayashi et al.6 used the same experimental setup used in Ref. 5 to develop a frost growth model. From the photographic observations, they classified the to-tal time for frost growth into three periods: Crystal growth period (1), Frost lay-er growth period (2) and Frost layer full growth period (3). The authors sug-gested that the second period called “frost layer growth period” is the most im-portant of the three. The analysis was based on frost deposition on a cylinder. This approach was a result of the assumption that frost columns existed at the beginning of frost layer growth period. Considering the frost pattern after crys-tal growth period as hollow cylinder, the frost growth during frost layer growth period was treated as a three dimensional diffusion problem. The model pre-sented in the study cannot be effectively used in a simulation program since many parameters (heat and mass transfer related coefficient) used by the au-thors are obtained from experiments they performed. The authors presented plots showing the variation of frost height with time. It was observed that the results are improved by accounting for the variation in the frost density. Based on the experimental data a correlation of the frost density was presented as a function of surface temperature.
Auracher7 attempted to quantify the effects of all modes of heat transfer occur-ring in a frost layer. The objective was to come up with an expression for the thermal conductivity considering the radiation, convection, conduction and dif-fusion. The experimental setup in Ref. 7 was designed to isolate the effects of each of the mechanism. Each mechanism is separately analyzed and an order of magnitude analysis performed to determine the contribution. Effects of radiation

Trafi Research Reports 6/2015
9
on the conductivity of the frost was found to be negligible (about 1% of the ef-fective thermal conductivity). Natural convection could occur inside the frost layer depending on the geometry and the temperature of the frost layer. How-ever, it was noted by the author that in order to have significant contribution from natural convection the temperature gradient needs to be high which nor-mally does not happen inside a frost layer. Thus it was argued that the natural convection inside the frost layer can be neglected. It was concluded that the thermal conductivity is affected mainly by diffusion and conduction.
A model to determine the thermal conductivity of the frost was developed by Shahin8. The analysis in Ref. 8 deals with the frost forming during early crystal-lization stage. The work was motivated in part to confirm the hypothesis that thermal conductivity of frost is not a function of density alone, at least in the early stages. It was the opinion of the author of Ref. 8 that the characteristics of frost is highly dependent on the temperature of the surface at which frost formed. While frost is made up of ice crystals and void spaces trapped in be-tween the crystals, for modeling purposes it was divided into columns of packed ice and air. A one dimensional heat transfer and mass diffusion was assumed in the frost layer. In developing the model, a new parameter called volumetric ra-tio, which is the ratio of volume of ice to the total volume (ice and air void) was introduced. An energy and mass balance on the control volume containing frost (ice crystal and air surrounding) was formulated. The formulation presented is similar to the heat conduction equation. The coefficient term for temperature gradient is then defined as the conductivity of frost (ice and air void). It could be seen that the equation obtained for conductivity takes a form of volume av-eraging of the conductivities of ice and air with an additional term. This addi-tional term accounted for added density due to the diffusion of water vapor into the frost layer. From the resulting equation, an expression for the local frost conductivity is obtained. With the local frost conductivity, an expression for ef-fective thermal conductivity of entire frost layer is derived by integrating it for the thickness of the layer. The model showed that the effective thermal conduc-tivity of the frost layer is higher when the temperature at which frost formed was higher. Results were also reported for different air temperatures, air hu-midity ratios and Reynolds number. From the numerical results the authors concluded that the frost conductivity depends on all frost layer properties and not the density alone. This was especially true in early growth stages. It should be noted that the development of model is based on a structure of layer which exists only in the early stages of frost initiation and as such the efficiency of the model in later stages of frost growth is hypothetical. Yun et al.9 took a different approach in developing the heat and mass transfer correlations related to the frost growth. The correlations for density, thermal conductivity, heat and mass transfer coefficients were developed based on the frost surface roughness. Experiments were carried out at a controlled air tem-perature and humidity to obtain various quantities such as the frost thickness, frost weight, rate of heat transfer etc. They defined surface roughness as a “dif-ference between hill and valley of frost”. Roughness of a frost layer was meas-ured using a precision micrometer. A correlation was presented for calculating the roughness value as a function of time. Roughness correlation had a high error (+/-20%) associated and was a function of time alone. In order to efficiently use the roughness data, authors used the modified Prandtl mixing-length approach. Turbulent boundary layer thickness along with roughness value was used to correlate the friction factor. The friction factor values were used to correlate heat transfer coefficients. In addition to roughness value (in form of friction factor) Reynold's number and Prandtl number were also used in the heat transfer correlations. As a summary it may be concluded that a lot of effort has been done in the past to determine the frost characteristics such as density and conductivity. Most of
Trafi Research Reports 6/2015
10
the work was based on experimental approach to calculate density and theoreti-cal modeling to correlate the conductivity. A general concept adopted is that the frost density is a function of frost surface temperature and frost conductivity is a function of density. Though it is generally accepted that the frost density is a function of the frost surface temperature and the frost conductivity is a function of the frost density, no consensus exists on what the form of correlation should be.
3.2 Frost Growth on Simple Geometries as a flat plate
The first attempt for a frosting model which can handle changes in environmen-tal parameters was done by Jones and Parker10. Authors expressed the time rate of change of frost density and frost thickness in terms of environmental pa-rameters, frost surface temperature and spatial rate of change of the surface temperatures. The temperature and spatial change of the temperature at frost surface were obtained by application of heat balance at the surface. The model behaved very well under different conditions. Since the resulting equations are singular when the frost density and thickness are zero, which happens during initiation of frost growth, model will depend heavily on initial assumptions of frost density and thickness. These guessed values can be improved by perform-ing a parametric analysis. Parametric analysis was performed by varying frost thickness and frost density within ranges and checking against numerical stabil-ity. It was found that the initial value of frost thickness can be as small as 0.02 mm. Schneider11 conducted frosting experiments using a cylindrical tube. The exper-iments covered a range of Reynolds number, air temperature, air relative hu-midity and surface temperature. The objective of the experiments was to devel-op correlations for thickness of frost layer as a function of the experimental var-iables. The author presented three different correlations based on different as-sumptions. It was observed from the experiments that the frost thickness was not dependent on the Reynolds number. The data presented by the author also showed that the frost thickness is not influenced by the difference in vapor pressure between air and frost layers. These observations were in direct contra-diction to previously published studies which claimed that the frost growth is significantly affected by parameters such as Reynolds number and vapor pres-sures in air and frost surface. Östin and Andersson12 studied experimentally the frost growth on flat plates under forced convection. The experimental variables that were controlled were the plate temperature, the air relative humidity and the air velocity. The meas-ured variables included the frost thickness, the frost mass and the surface tem-peratures. The average density was calculated using the measured values for thickness and frost weight. The authors measured thermal conductivity of frost by solving a one-dimensional transient heat conduction equation. It was ob-served and reported that the plate temperature had negligible effect on the frost mass, while the thickness increased with decreasing plate temperature. As the relative humidity changed however it was noted that both frost mass and frost thickness increased. However for all cases the frost mass and the frost thickness increased with the time. A preliminary check for the experimental da-ta, using a simple model available in literature showed the data to be within +/-10% from the simple model predicted ones. There were two interesting obser-vations made in Ref 12. First observation was that there are two obviously dif-ferent trends for increase of the frost density with time. It was observed that the frost density increased linearly with time for a while and stayed constant for some time. After that the density again started to increase linearly. The region
Trafi Research Reports 6/2015
11
where frost density did not change was called as “plateau”. Second interesting observation was regarding the frost thermal conductivity. It was reported that the frost thermal conductivity increased with frost thickness until some thick-ness after which there was a sudden increase in thermal conductivity. The thickness where conductivity increased suddenly coincided with the “plateau”. Both these observations were attributed to the possible melting and refreezing of frost layer, which happens when the frost surface temperature reaches the triple point of water. A numerical model based on volume-averaging technique was proposed by Tao, Besant and Rezkallah13 to determine the frost density and the frost thickness. The model is useful only in frost layer growth period as defined by Hayashi et al.5, and cannot be applied during the initiation stage. The model relied on de-termining the volume fraction of ice and air-water vapor mixture using the gas relationships. The authors suggested that the densification (increase of frost density with time) is dependent on the frost structure during early growth peri-od; this is consistent with other studies. The temperature and density at differ-ent frost depths were reported to vary almost linearly with time. Temperature shows even better linearity. Temporal variation of heat flux was reported for two different plate temperatures. It was shown that for lower plate tempera-tures the heat flux drops faster. The frost surface rises sharply for low plate temperatures thereby reaching the triple point temperature quickly. Results consistent with other researchers for the frost thickness were also reported. The value used by many authors for diffusivity of water vapor in air was questioned by the authors and they suggested that the effective diffusivity could be as much as 7 times higher. Le Gall et al.14 presented a method to model the frost growth in the period after the initial crystal growth phase. In order to accomplish this, the governing equations were solved using “Local Averaging Technique'” method. In such a method the total domain of solution is divided into different control volumes. Any property is calculated for that control volume and for the whole volume an average volume is calculated by weighing the local property with the local vol-ume. Frost layer was assumed to be a 1-dimensional pseudo homogeneous me-dium. Their study contained both theoretical and experimental components and they also attempted to validate the model using experimental data from other researchers. Authors used the frost condition at the end of initial crystal growth phase as an initial condition for their model. Frost layer was assumed to be fully grown when the frost surface temperature reaches the triple point of water. This assumption is used and reported by previous researchers. It was noted by the researchers that a significant error could result from a bad estimate of diffusion coefficient. It was argued by the authors that use of diffusion coefficient ob-tained from Fick's law results in gross errors. The reason for this discrepancy was identified as the complex mechanism and effects of heat transfer and mass transfer on each other. Fick's law simplifies the problem by assuming that heat transfer does not affect the accompanying mass transfer. A correction term (termed as Diffusion resistance factor) was introduced to the value of diffusion coefficient obtained by Fick's law in order to match the experimental observa-tions. Na and Webb15 developed governing equations for frost growth based on a con-trol volume approach. Following an earlier paper by the same authors (Na and Webb16), the frost surface is considered to be supersaturated. Air is said to be supersaturated at frost surface when the local vapor pressure is higher than the saturation vapor pressure at the surface temperature. This necessarily means that the water vapor is highly unstable in its gaseous state and condenses very fast. Experiments were performed to correlate thermal conductivity of frost. Frost thickness was determined by measuring with a micrometer. Data was tak-en at intervals of 10 - 30 minutes. Thermal conductivity was expressed in
Trafi Research Reports 6/2015
12
terms of weighting factor as defined by Sanders17. Weighing factor was defined as a numerical value which is used to calculate the thermal conductivity given the maximum and minimum values. In order to predict the varying thermal conductivity, the weighing factor needs to be varying as the frost grows. Weigh-ing factor was determined from the experimental data and presented as correla-tions against frost base surface temperature. In order to solve the governing equation they used an initial condition for frost density as specified by Jones and Parker10. The authors compared the prediction of the saturated model and the super saturation model against the experimental data. It was reported that the saturated model over predicts the frost growth rate by 50%. Lee and Ro18 proposed two models to predict growth of frost on a flat plate; one in which water vapor was assumed to be saturated at frost layer, while in the second model water vapor at frost surface was assumed to be super-saturated. The authors presented a detailed treatment of governing equations along with a computational procedure to solve the equations. It was observed that the solu-tion to governing equations was affected by the initial value of frost thickness and frost density. The dependence on frost density was found to be more signif-icant than frost thickness. The authors reported that satisfactory results could be obtained by using an initial frost thickness value as low as 0.02 mm. It was reported that no initial value of frost density resulted in a good match to exper-imental data. This observation was in line with most other researchers where an agreement on acceptable initial guess is not available. Also presented were the effects of the environmental parameters such as air humidity ratio, plate tem-perature, air temperature and air velocity. Results consistent with previous works were obtained. While the simple model (saturation model) gave accepta-ble results, the authors presented the effect of using a detailed model with dif-ferent degrees of super saturation. It was observed that as the degree of super saturation degree varied from 0 to 1, the error due to results from the model decreased first and then increased. Thus it was clear that the correct value of degree of super-saturation needs to be used to obtain the benefits of the de-tailed model.
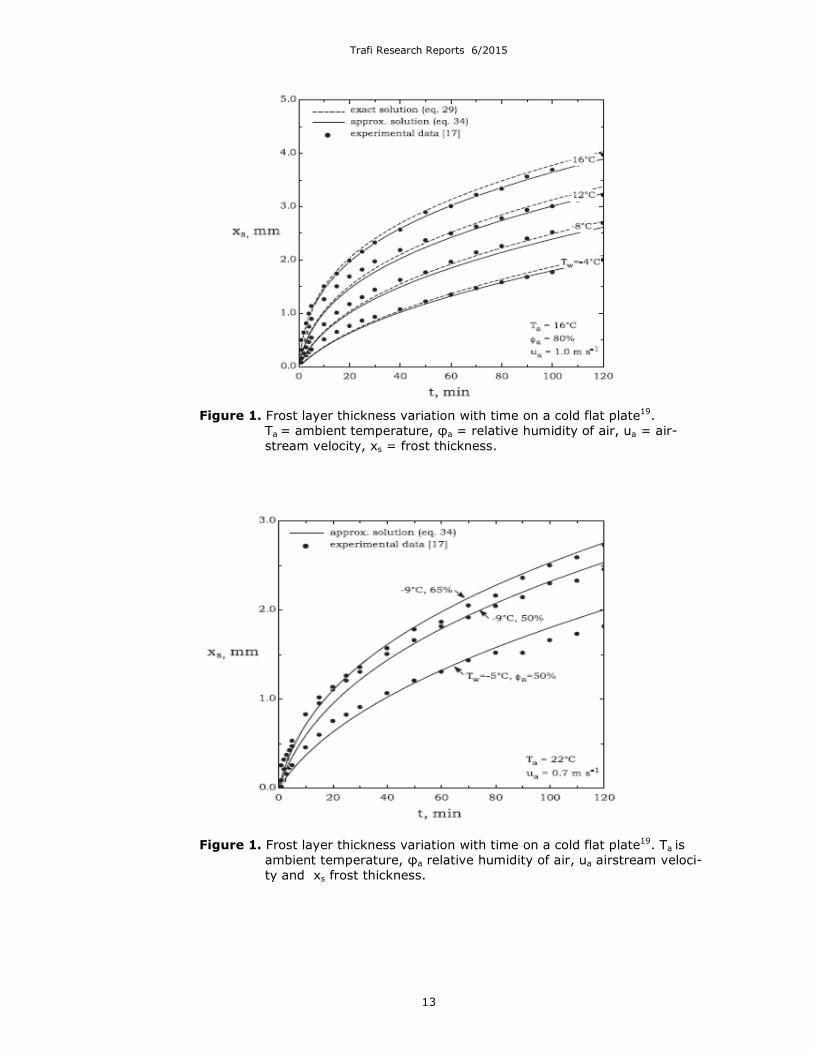
Hermes19 has developed an algebraic simulation model to predict the frost growth and densification on flat surfaces. The model was put forward based on macroscopic heat and mass balances in the frost layer, which were written ac-cording to a dimensionless formulation and solved analytically to obtain an al-gebraic expression for the time evolution of the frost thickness as a function of the Nusselt number, the super saturation degree and the air-to-surface temper-ature difference. The model predictions for the frost thickness were compared with experimental data obtained elsewhere. As in most previous papers there is a low speed airstream (0.7 -1.0 m/s) over the frost layer assumed. Figures 1 and 2 give a perception on the magnitude of frost forming under the conditions given.
Most of the work referred above is done for flat plates with a few studies availa-ble for frost growth on cylinders. While dealing with frost growth model on flat plates or cylinders, the split between the theoretical modeling and experimental approach seems equal. In theoretical modeling most researchers discretize gov-erning partial differential equations. The discretized equations are then solved using finite difference or finite volume approach. Only a few papers are pub-lished which provide closed form solutions for governing equations. It is noted and accepted in the literature that the phenomenon is too complex to be pre-sented in a closed form solution.
Trafi Research Reports 6/2015
13
Figure 1. Frost layer thickness variation with time on a cold flat plate19.
Ta = ambient temperature, φa = relative humidity of air, ua = air-stream velocity, xs = frost thickness.
Figure 1. Frost layer thickness variation with time on a cold flat plate19. Ta is ambient temperature, φa relative humidity of air, ua airstream veloci-ty and xs frost thickness.

Trafi Research Reports 6/2015
14
3.3 Frost Growth on Aircraft at Ground
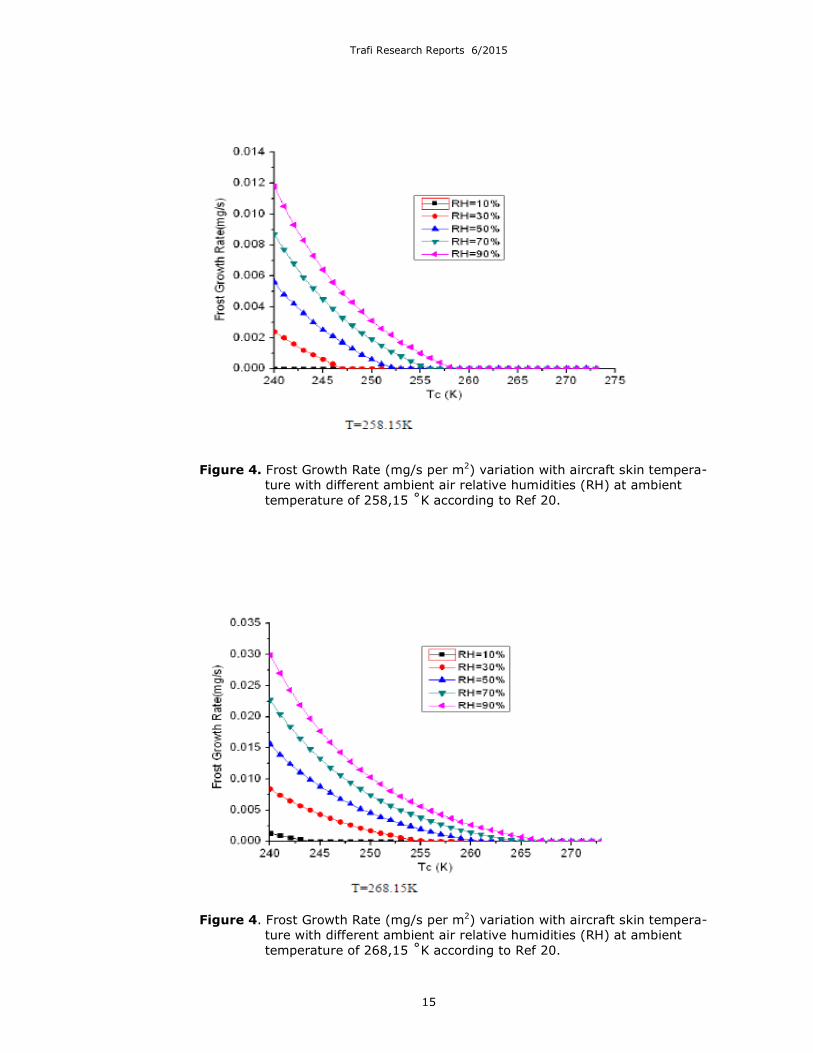
Liwen et al20 has developed a mathematical model to describe (hoar) frost for-mation on an aircraft at ground. The mathematical model was based on frost formation physics together with the mass and energy balance equation devel-oped by Mason21. It can be used to forecast the (hoar) frost formation on an aircraft at ground. The model developed by Mason21 predicts the ice crystal growth for a cloud icing and simulates thus the hoar frost instead of cold soaked frost. Figures 3, 4 and 5 illustrate the calculated frost growth rate (mg/s) varia-tion with aircraft skin temperature in three different ambient temperature condi-tions according to Ref. 20. Note that though it is not explicitly mentioned any-where in the text of Ref. 20 (!) the growth rate is according to the equations given in Ref. 20 calculated per square meter.
As the frost formed is presented in mass values it is most probable that Ref. 20 is aimed to serve the planning of de-icing fluid amount for hoar frosted air-crafts.
Figure 3. Frost Growth Rate (mg/s per m2) variation with aircraft skin tempera-ture with different ambient air relative humidities (RH) at ambient temperature of 248,15 ˚K according to Ref 20.
Trafi Research Reports 6/2015
15
Figure 4. Frost Growth Rate (mg/s per m2) variation with aircraft skin tempera-ture with different ambient air relative humidities (RH) at ambient temperature of 258,15 ˚K according to Ref 20.
Figure 4. Frost Growth Rate (mg/s per m2) variation with aircraft skin tempera-ture with different ambient air relative humidities (RH) at ambient temperature of 268,15 ˚K according to Ref 20.

Trafi Research Reports 6/2015
16
4 Frost Sublimation Literature
The amount of published studies on frost sublimation found by the author of this study is extremely scant. There were only two experimental studies discov-ered that had any relevance for the Icewing 3 project. These were the studies by Neuman et al22 and Inaba and Inai23. From these two only the last one in-cluded data directly beneficial for the Icewing 3 project studies. The first one gave some insight for the basic phenomenon of sublimation though it consid-ered snow sublimation instead of frost sublimation.
According to Neumann et al22 “The sublimation of ice or snow is driven by an imbalance between the saturation vapor pressure (or vapor density) at a given temperature, and the vapor pressure in the immediate vicinity of an ice surface. If the former exceeds the latter, ice or snow sublimates to eliminate the imbal-ance.” In their experimental study they attempt to directly measure the subli-mation rate of a snow sample under forced convection in the laboratory. Neu-mann et al’s methodology relied on precise measurement of the vapor density of an air stream prior to, and after passing through a snow sample of sieved snow grains with coincident measurements of the sample temperature and air-flow rate. They use the data to generate an estimate of the mass transfer coef-ficient for snow sublimation as a function of Reynolds number. What makes the results poorly accessible for the case of frosted flat plate in airstream is that air is blown at very low Re-numbers through the snow not above it. However some of the results are worth reviewing here.
As the sublimation (or condensation) rate S (kg s-1) is driven by the difference between the local vapor density (ρv) and the saturation vapor density (ρsat) we can write:
S = V * hm *as * (ρsat – ρv) (1)
where V is the volume undergoing sublimation, as is the specific surface area of snow, and hm is the mass-transfer coefficient.
Neumann et al plot all their measured values of hm as a function of a modified Re-number:
Re = dp*(v/υa)*(1-φ),
where dp is mean snow particle diameter, v is the air velocity, υa is air kinematic viscosity and φ is a dimensionless porosity factor. They get a linear relationship as follows:
hm = 0.566 Re + 0.075 [*10-3 m/s] (2)
Though without any real usefulness for the problem of a flat plate frost under high airspeed equations (1) and (2) give an impression of sublimation rate for a snow with a volume of V that is subjected to a very slow airflow through it. In addition to this it is noteworthy that sublimation is a function of Re-number only not e.g. of the temperature in the test chamber.
The study of Inaba and Inai23 is much more relevant for the Icewing 3 objec-tives than any other above. They study the possibility to remove frost from a flat plate using airflow over it and some additional radiation heat. The objective is to find a defrosting method for a cold heat exchanger plate without the diffi-culties brought up with melting water in the process. Frost exposed to the flow-ing air, whose temperature is below the triple point (0.01°C, 0.6105 kPa), sub-
Trafi Research Reports 6/2015
17
limates. Defrosting by means of frost sublimation avoids thus the problem of melted water.
Though Inaba and Inai are using some radiation heat in addition to the airflow the heat energy applied is one of the parameters varied. One of the values of radiation heat energy applied is zero. This is the case of greatest interest and value for Icewing 3 project. The airstream velocities are quite small (max 12 m/s) however approximately at the order of magnitude of Icewing 3 interests.
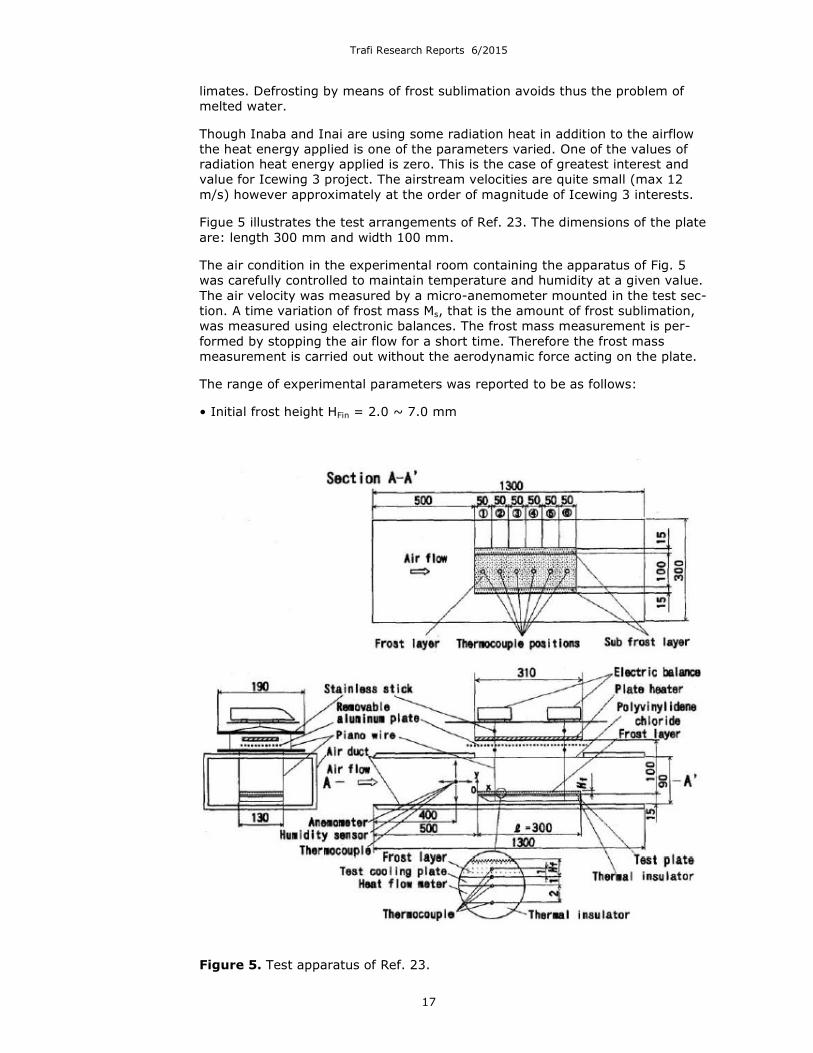
Figue 5 illustrates the test arrangements of Ref. 23. The dimensions of the plate are: length 300 mm and width 100 mm.
The air condition in the experimental room containing the apparatus of Fig. 5 was carefully controlled to maintain temperature and humidity at a given value. The air velocity was measured by a micro-anemometer mounted in the test sec-tion. A time variation of frost mass Ms, that is the amount of frost sublimation, was measured using electronic balances. The frost mass measurement is per-formed by stopping the air flow for a short time. Therefore the frost mass measurement is carried out without the aerodynamic force acting on the plate.
The range of experimental parameters was reported to be as follows:
• Initial frost height HFin = 2.0 ~ 7.0 mm
Figure 5. Test apparatus of Ref. 23.

Trafi Research Reports 6/2015
18
• Frost density ρ = 90 ~ 180 kg/m3
• Air flow velocity U = 0.3 ~ 12.0 m/s
• Air temperature T = -20.0 ~ -2.0°C
• Relative humidity φ = 50 ~ 90%
• Radiant heat intensity qr = 0 ~ 900 W/m2
Also the roughness of the frost layer before and after the time intervals of the test were measured. As an example of the test cases without radiant heat there are photos before and after 10 min of airstream (8m/s) application in Figures 6 and 7.
The initial frost height HFin is 2.0 mm and the surface roughness of the frost lay-er R is 0.5 mm. The surface roughness R of the frost layer is defined by a verti-cal distance between the top and bottom of the frost surface roughness. The
Figure 6. Initial sectional shape of the frost layer.
Figure 7. Sectional shape of the frost layer in condition air velocity U = 8 m/s, sublimation time t = 10 min, air temperature T = -5°C, relative hu-midity φ = 60 percent, frost density ρf = 130 kg/m3 and radiant heat intensity is 0 W/m2.

Trafi Research Reports 6/2015
19
surface roughness R is determined by the average value of 10 measuring points of R from the sectional enlarged photographs of the frost layer. Figure 7 shows sectional shapes of frost layers after 10 minute sublimation time. A surface roughness R of the frost layer decreases from 0.5 mm at the initial condition to 0.2 mm, and the frost height decreases from 2 mm to 1.3 mm. The surface temperature of the cooling plate Tw (-6.0°C) is lower than the moist air flow temperature T because of the frost sublimation.
Figure 8 shows the time history of the amount of frost sublimation Ms, for vari-ous radiant heat intensities qr under the experimental conditions of T = -5.0°C, φ = 60 percent, U = 8.0 m/s, HFin = 2.0 mm, and ρf = 130 kg/m3.
The arrow symbols in Fig. 8 show defrost completion time when the length (X direction in Fig. 5) of the frost layer reaches 99 percent of the test cooling plate length (300 mm) due to frost sublimation. The frost sublimation rate is large at the beginning of frost sublimation. This is explained by the fact that the surface roughness of the frost promotes air flow turbulence intensity over the increased sublimation surface area, since the surface roughness is larger at the beginning of frost sublimation. Also the frost sublimation is promoted by an increase in the radiant heat intensity. However, the promotion rate by the radiant heat intensi-ty is not so large since the convection heat loss from the frost surface, whose temperature rises with the radiant heat q, to the air flow is increased with an increase in qr. After the time shown in arrow symbols, the variation of the amount of frost sublimation with time decreases abruptly according to a de-crease of a frost length.
Figure 9 indicates the time history of mass flux mAf under the experimental con-ditions of q= 0 and 280 W/m2 and U = 2.0 and 8.0 m/s. The mass flux mAf is defined as follows:

Trafi Research Reports 6/2015
20
Figure 8. The time history of the amount of frost sublimation Ms, for various radiant heat intensities qr
mAf = ∆Ms / S*∆t
where S is the cooling (flat plate) surface area and ∆Ms is the amount of frost sublimation at time interval of ∆t. The variation of mass flux mAf with time is larger under the high air velocity condition of U = 8.0 m/s as compared with that under the low air velocity condition of U = 2.0 m/s. In particular, the mass flux mAf increases abruptly at the beginning of frost sublimation under the con-dition of U = 8.0 m/s. As mentioned above, this abrupt increase of mass flux is caused by a large surface roughness of frost layer at the beginning of frost sub-limation. This tendency cannot be seen under the low-velocity condition of U = 2.0 m/s. In the case of U = 2.0 m/s, the velocity and vapor concentration boundary layers developed at the vicinity of the frost surface are thicker than those in the case of U = 8.0 m/s. That is, the effect of surface roughness of frost layer in the case of U = 2.0 m/s is suppressed due to the thicker boundary layers.
The last part of Ref. 23 is a data reduction in non-dimensional form. This leads to the following comment on non-dimensional mass transfer (mass transfer co-efficient):

Trafi Research Reports 6/2015
21
Figure 9. Time history of the mass flux of frost sublimation.
The mass transfer coefficient for radiant heat flux of qr = 0 W/m2 shows higher values by 25 to 30 percent than that of the Colburn's analogy24, which can ap-ply to the mass transfer of the smooth surface. This result is explained by the fact that the surface roughness of the frost layer brings turbulence promotion of air flow in the boundary layer and the increase of sublimation surface area.
Though Inaba and Inai’s paper is probably the only relevant one regarding the objectives of this study it lacks all the measured data at airstream velocity of 12 m/s which however were reported to be the maximum speed during the tests. It also lacked any other airstream and plate temperature data other than -5˚C (air temperature) and -6˚C (flat plate surface). This data may have been included to the non-dimensional results however without the illustrative connection to real parameters such as the sublimation mass or mass flux with time vs. air-stream velocity.

Trafi Research Reports 6/2015
22
5 Conclusions
This literature review was aimed to gain some basic theoretical and measured information related to the frost formation and especially the frost sublimation. The review revealed that although there is a vast amount of studies regarding the frost formation the frost sublimation literature is next to nothing. One re-vealing fact is that the two studies found considering sublimation included alto-gether only a couple of further references on the subject.
Considering the future studies of frost sublimation of Icewing 3 project the re-search is going to be started practically from scratch.
Trafi Research Reports 6/2015
23
References
1. Adrian, P., Brightwell J.: Operating Boeing 737-NG with Cold – Soaked Fuel Frost”, Presentation given at EASA Annual Safety Conference at Cologne, Germany, 15-16th October 2013. 2. Sankaranarayanan, K.P.: “Study of Frost Growth on Heat Exchangers Used
as Outdoor Coils in Air Source Heat Pump Systems”, Dissertation for PhD at Oklahoma State University, Dec. 2010
3. Yonko, J, D. and Sepsy, C, F.: “An investigation of the thermal conductivity of frost while forming on a at horizontal plate.”, ASHRAE Transactions 73(2), 2043{2053. (1967) 4. Brian, P., Reid, R. and Brazinsky, I.: “Cryogenic frost properties”,
Cryogenic Technology 5, 205-212. (1969) 5. Hayashi, Y., Aoki, A., Adachi, S. and Hori, K.: “Study of frost properties
correlating with frost formation types”, Journal of heat transfer 99(2), 239-245, 1977
6. Hayashi, Y., Aoki, K. and Yuhara, H.: “Study of frost formation based on a theoretical model of the frost layer”, Heat transfer. Japanese research 6(3), 79-94. 1977
7. Auracher, H. “Effective thermal conductivity of frost”, Heat and Mass Transfer in Refrigeration and Cryogenics pp. 285-301. (1987), 8. Shahin, A., Z., “Effective thermal conductivity of frost during the crystal growth period”, International Journal of Heat and Mass Transfer 43(4), 539 - 553(2000). 9. Yun, R., Kim, Y. and Min, M, K.: “Modeling of frost growth and frost
properties with airflow over a at plate”, International Journal of Refrigeration 25(3), 362-371. (2002)
10. Jones, B. W. and Parker, J. D.: “Frost formation with varying environmental parameters”, American Society of Mechanical Engineers (Paper) 97(2)(74-HT-52), 255-259, 1974
11. Schneider, H. W. :“Equation of the growth rate of frost forming on cooled surfaces”, International Journal of Heat and Mass Transfer 21(8), 1019-1024. (1978)
12. Ostin, R. and Andersson, S., “Frost growth parameters in a forced air stream”, International Journal of Heat and Mass Transfer 34(4-5), 1009-1017. (1991)
13. Tao, Y., Besant, R. and Rezkallah, K., “A mathematical model for predicting the densification and growth of frost on a at plate”, International Journal of Heat and Mass Transfer 36(2), 353{363. (1993) 14. Le Gall, R., Grillot, J. and Jallut, C., `Modelling of frost growth and
densification', International Journal of Heat and Mass Transfer 40(13), 3177 -3187. 1977
15. Na, B. and Webb, R. L., “New model for frost growth rate”, International Journal of Heat and Mass Transfer 47(5), 925-936. 2004 16. Na, B. and Webb, R. L., “Mass transfer on and within a frost layer”, International Journal of Heat and Mass Transfer 47(5), 899-911. 2004 17. Sanders, C. T., “The influence of frost formation and defrosting on the
performance of air coolers”, PhD thesis, Technische Hogeschool, Delft, 1974.
18. Lee, Y. and Ro, S., “Analysis of the frost growth on a at plate by simple models of saturation and super saturation”, Experimental Thermal and Fluid Science 29(6), 685 - 696. 2005
19. Hermes, C.J.L.: “An analytical solution to the problem of frost growth and densification on flat surfaces”, Int. J. Heat and Mass Transfer 55(2012), pp7346- 7351

Trafi Research Reports 6/2015
24
20. Liwen, W, Dandan, X. and Zhiwei, X.: “A Mathematical Model for Frost For- mation on Ground Aircraft”, Applied Mechanics and Materials, Vol. 141 (2012) pp 147-151 21. B. J. Mason: The Physics of Clouds (Oxford University Press, 1971) 22. Neumann, T.A. et al, “Sublimation rate and the mass-transfer coefficient
for snow s sublimation”, International Journal of Heat and Mass Transfer 52 (2009) 309–315
23. Inaba, H. Imai, S., “Study on Sublimation Phenomenon of Horizontal Frost Layer Exposed to Forced Convection Air Flow and Radiant Heat”, Transac-tions of the ASME, 694 / Vol. 118, August 1996
24. A.P. Colburn, A method of correlating forced convection heat transfer data and a comparison with fluid friction, Transactions of the American Institute of Chemical Engineers 29 (1933) 174–209.