a local-state government spatial data sharing partnership ... · a local-state government spatial...
TRANSCRIPT

A Local-State Government Spatial
Data Sharing Partnership Model to
Facilitate SDI Development
by
Kevin McDougall
August 2006
A thesis submitted to The University of Melbourne in fulfilment of the degree of
Doctor of Philosophy
Centre for Spatial Data Infrastructure and Land Administration
Department of Geomatics, Faculty of Engineering The University of Melbourne, Melbourne, Victoria 3010, Australia
Produced on archival quality paper

ii

iii
Declaration
This is to certify that the thesis has not been submitted for a higher
degree to any other university or institution. The text does not exceed
100,000 words.
Parts of this work were published in refereed conference proceedings
and journals as listed in Appendix 1.
________________
Kevin McDougall

iv

v
Abstract
In the past decade efforts to develop spatial data infrastructures (SDIs) have migrated from
the initial “top-down” national approaches to “bottom-up” and cross jurisdictional efforts
at the sub-national level. Although national SDI developments are fundamental to
building the SDI culture and policy, it is sub-national and local SDI development that will
deliver the immediate benefits to citizens and the community. In countries which have
highly decentralised federations of states such as Australia, United States and Canada, the
challenge is how to co-ordinate the literally thousands of often small local government
jurisdictions which are important contributors to state and local SDIs.
In recent years, a number of co-operative spatial data sharing partnerships between local
and state government have emerged in various countries around the world. These
partnerships are relatively new initiatives that have been established to facilitate more
effective sharing of spatial data between organisations, but also as a mechanism to
contribute to SDI development. To maximise the benefits from these partnerships it is
essential to understand the factors that contribute to their successful operation and
sustainability. Therefore, the focus of this research is to understand these collaborative
arrangements so that future data sharing initiatives can be improved and sustained.
Existing data sharing models and typologies have focused on understanding the
motivations, mechanisms and frameworks for data sharing. Research gaps exist in the
understanding of the structure and operations of large coordinated data sharing
partnerships, particularly their management and sustainability in a dynamic political,
economic, legal and social environment.
A mixed method research approach, combining qualitative case studies and quantitative
surveys, was successfully utilised to develop a generic spatial data sharing partnership
model. Three inter-jurisdictional partnerships, including the quantitative analysis of the
perspectives of over 100 local governments, were investigated during the research. The
perspectives of both the partnership managers (state government), and partnership
contributors (local government), were integrated through a novel approach which
triangulated the different sources of evidence in order to construct the final model. The
model was successfully evaluated using the original case study data. Finally, the model’s
potential contribution to SDI development and its applicability to other jurisdictional
environments and sectors was discussed.

vi
The research concluded that large formal data sharing initiatives are effective mechanisms
for coordination of data sharing activities and hence facilitate SDI development. However,
greater efforts are required in respect to the performance measurement and monitoring of
these partnership ventures to enable the accurate assessment of their outcomes. The
qualitative case studies found that the jurisdictional and institutional environments have a
significant influence on partnership outcomes and should be carefully considered during
the establishment and operation of these initiatives. The quantitative analysis of local
governments identified significant differences among the three state partnership initiatives
which resulted from differing state government policy, LGA resource and technical
capacity, training, organisational size and geographical remoteness.
The partnership model successfully described and assessed the multi-dimensional nature of
inter-jurisdictional data sharing initiatives. The model recognised the context of the
collaboration, the collaborative process and the outcomes of collaborative initiative.
Moreover, the model was used to effectively determine the strengths and weaknesses of
the partnerships and hence identify their success and sustainability.
It is expected that spatial data sharing initiatives, particularly formal partnerships, will
continue to grow as their benefits become more widely accepted. The success of future
SDI development efforts will therefore rely heavily on collaborative processes which
engage sub-national governments and the private sector to deliver relevant, citizen-based
spatial data for the benefit of society.

vii
Acknowledgements
Completion of a PhD is by its very nature both an individual and a collaborative effort. I
therefore wish to acknowledge and thank the many people who have contributed to this
dissertation in a variety of ways. Firstly, my sincere thanks to Professor Ian Williamson
and Dr Abbas Rajabifard who provided their expert advice, encouragement and support
during my candidature. Your efforts in creating and fostering an active and inclusive
research environment were very much appreciated.
I also wish to thank the staff and postgraduate students from the Department of Geomatics
for their timely assistance and support during my frequent visits to Melbourne. From the
administrative side thank you to Nghiem Tran, Colleen Birmingham, Lillian Cheung and
Sarah Stewart for taking care of the administrative arrangements during my stays. In
particular, to my past and present fellow researchers in the Centre for Spatial Data
Infrastructure and Land Administration, thank you for your friendship and support during
my candidature especially Matthew Warnest, Daniel Steudler, Lisa Ting, Daniel Paez,
Mary-Ellen Feeny, Kate Dalrymple, Jude Wallace, Andrew Binns, Rohan Bennett, Saeid
Moshen Kalantari Soltanieh, Jessica Davies, Hossein Mohammadi, Serryn Eagleson,
Christian Claussen and Mal Park.
Thanks are also due to the visiting staff to the Department who provided their invaluable
advice and research perspectives, especially Professor Ian Masser, Professor Mike
Worboys, Don Grant and Paul Kelly. To my fellow colleagues at the University of
Southern Queensland, thank you for your support during my many absences inter-state
which allowed me to undertake this research. To Dr Frank Young and Dr Armando Apan,
thank you for your useful comments and advice on my draft dissertation. Many thanks
also to Diana Carrigan for her proof reading and comments.
My research would of course not been possible without the valued contributions from the
many people in both state and local governments in Queensland, Tasmania and Victoria.
In Queensland, particular thanks goes to Tim Barker, Graham Stanton, Kevin Landy, Rob
Duffy, Geoff McMahon and Steve Jacoby; in Tasmania, thanks to Todd Baker, Mike
Varney and Hector Beveridge; and in Victoria, John Gallagher and Bruce Thompson.
Finally, I would like to thank my family and friends for their continued support and
encouragement throughout my studies. Of course special thanks goes to my beautiful wife
Jude and two lovely daughters Sammy and Katie for their sacrifices in supporting my
studies through travel and my many absences from home.

viii

ix
Table of Contents
DECLARATION .................................................................................................................................III
ABSTRACT........................................................................................................................................V
ACKNOWLEDGEMENTS....................................................................................................................VII
TABLE OF CONTENTS.......................................................................................................................IX
L IST OF FIGURES.............................................................................................................................XII
L IST OF TABLES.............................................................................................................................XIV
L IST OF ACRONYMS........................................................................................................................XV
OPERATIONAL DEFINITIONS......................................................................................................... XVII
CHAPTER 1 INTRODUCTION .................................................................................................. 1
1.1 BACKGROUND TO RESEARCH........................................................................................... 3
1.2 RESEARCH FORMULATION................................................................................................ 4
1.3 JUSTIFICATION FOR RESEARCH......................................................................................... 6
1.4 RESEARCH APPROACH..................................................................................................... 8
1.5 STRUCTURE OF THE THESIS............................................................................................ 10
1.6 DELIMITATION OF SCOPE AND KEY ASSUMPTIONS......................................................... 12
1.7 CHAPTER SUMMARY ......................................................................................................13
CHAPTER 2 SPATIAL DATA AND SDI IN CONTEXT .......... ............................................... 15
2.1 INTRODUCTION .............................................................................................................. 17
2.2 SPATIAL INFORMATION DEVELOPMENTS IN AUSTRALIA – A BRIEF HISTORY .................. 17
2.3 FROM DATA TO INFORMATION INFRASTRUCTURES......................................................... 30
2.4 SPATIAL DATA INFRASTRUCTURES................................................................................. 33
2.5 SPATIAL DATA SHARING ................................................................................................ 43
2.6 CHAPTER SUMMARY ......................................................................................................53
CHAPTER 3 COLLABORATION, PARTNERSHIPS AND THE GOVER NMENT
ENVIRONMENT......................................................................................................................... 55
3.1 INTRODUCTION .............................................................................................................. 57
3.2 COLLABORATION ........................................................................................................... 57
3.3 PARTNERSHIPS – MODELS AND EXPERIENCES................................................................. 76
3.4 THE GOVERNMENT ENVIRONMENT................................................................................. 81
3.5 CHAPTER SUMMARY ......................................................................................................88
CHAPTER 4 RESEARCH DESIGN AND METHODS............................................................. 91
4.1 INTRODUCTION .............................................................................................................. 93
4.2 CONCEPTUAL DESIGN FRAMEWORK ............................................................................... 93
4.3 SELECTION OF RESEARCH APPROACH AND RESEARCH DESIGN....................................... 95

x
4.4 RESEARCH METHODS................................................................................................... 103
4.5 ETHICAL CONSIDERATIONS.......................................................................................... 112
4.6 CHAPTER SUMMARY .................................................................................................... 113
CHAPTER 5 RESULTS OF PARTNERSHIP CASE STUDIES AT STATE GOVERNMENT
LEVEL........................................................................................................................................ 115
5.1 INTRODUCTION ............................................................................................................ 117
5.2 THE STATE OF V ICTORIA – THE PROPERTY INFORMATION PROJECT.............................. 118
5.3 THE STATE OF QUEENSLAND –THE PROPERTY LOCATION INDEX .................................. 130
5.4 THE STATE OF TASMANIA – THE LAND INFORMATION SYSTEM TASMANIA ................... 139
5.5 CASE STUDY COMPARISON........................................................................................... 148
5.6 CHAPTER SUMMARY .................................................................................................... 154
CHAPTER 6 RESULTS OF PARTNERSHIP CASE STUDIES AT LOCAL GOVERNMENT
LEVEL........................................................................................................................................ 157
6.1 INTRODUCTION ............................................................................................................ 159
6.2 DESCRIPTIVE STATISTICS AND SUMMARIES .................................................................. 159
6.3 ANALYSIS OF VARIABILITY AMONGST THE STATES ...................................................... 184
6.4 FACTOR AND REGRESSION ANALYSIS ........................................................................... 187
6.5 CHAPTER SUMMARY .................................................................................................... 194
CHAPTER 7 MODEL DEVELOPMENT AND DISCUSSION........ ...................................... 195
7.1 INTRODUCTION ............................................................................................................ 197
7.2 MODEL DEVELOPMENT................................................................................................ 197
7.3 THE DATA SHARING PARTNERSHIP MODEL .................................................................. 201
7.4 MODEL APPLICATION AND EVALUATION ...................................................................... 210
7.5 POTENTIAL IMPACT ON SDI DEVELOPMENT ................................................................. 216
7.6 GENERALISATION OF THE PARTNERSHIP MODEL........................................................... 218
7.7 CHAPTER SUMMARY .................................................................................................... 220
CHAPTER 8 CONCLUSIONS AND IMPLICATIONS ............. ............................................. 223
8.1 INTRODUCTION ............................................................................................................ 225
8.2 RESEARCH A IM AND OBJECTIVES................................................................................. 225
8.3 CONCLUSION ON RESEARCH PROBLEM ......................................................................... 228
8.4 SIGNIFICANCE OF RESEARCH TO THEORY AND PRACTICE.............................................. 228
8.5 RECOMMENDATIONS FOR FURTHER RESEARCH............................................................. 230
8.6 FINAL REMARKS .......................................................................................................... 230
REFERENCES................................................................................................................................. 233
APPENDIX 1 – PUBLICATIONS RELATING TO RESEARCH................................................................. 249
APPENDIX 2 – SEMI STRUCTURED INTERVIEW QUESTIONS............................................................ 253
APPENDIX 3 - LOCAL GOVERNMENT QUESTIONNAIRE................................................................... 257
APPENDIX4 – OPEN ENDED QUESTIONNAIRE RESPONSES.............................................................. 273

xi
APPENDIX 5 – INTER-STATE DIFFERENCE ANALYSIS ..................................................................... 293
APPENDIX 6 – FACTOR ANALYSIS ................................................................................................. 301
APPENDIX 7 – CORRELATION ANALYSIS........................................................................................ 307
APPENDIX 8 – MULTIPLE REGRESSION ANALYSIS.......................................................................... 311
xii
List of Figures
FIGURE 1.1 RESEARCH APPROACH.....................................................................................................9
FIGURE 1.2 STRUCTURE OF THE THESIS AND RELATIONSHIP TO OBJECTIVES..................................... 11
FIGURE 2.1 ANZLIC COMMITTEE STRUCTURE (ANZLIC 2005) ...................................................... 26
FIGURE 2.2 RELATIONSHIP BETWEEN LAND PARCEL, PROPERTY AND STREET ADDRESS.................... 28
FIGURE 2.3 DATA , INFORMATION, KNOWLEDGE AND WISDOM (CLARKE 2004A).............................. 30
FIGURE 2.4 PRODUCT-BASED AND PROCESSED-BASED SDI MODELS (RAJABIFARD ET AL. 2002)....... 36
FIGURE 2.5 NATURE OF RELATIONSHIPS BETWEEN COMPONENTS OF SDI (RAJABIFARD ET AL. 2002)39
FIGURE 2.6 HIERACHICAL NATURE (RAJABIFARD ET AL. 2002) ....................................................... 40
FIGURE 2.7 MODEL FOR SPATIAL DATA SHARING BASED ON THEORY OF PLANNED BEHAVIOUR (WEHN
DE MONTALVO 2002) ............................................................................................................. 49
FIGURE 3.1 COLLABORATION PROCESS (PREFONTAINE ET AL. 2000)................................................ 72
FIGURE 3.2 POPULATION DISTRIBUTIONS OF AUSTRALIAN LOCAL GOVERNMENTS (UNESCAP 2003)
.............................................................................................................................................. 83
FIGURE 3.3 VERTICAL FISCAL IMBALANCE (AUSTRALIAN GOVERNMENT 2006) ............................... 84
FIGURE 4.1 CONCEPTUAL DESIGN FRAMEWORK............................................................................... 94
FIGURE 4.2 RESEARCH DESIGN......................................................................................................102
FIGURE 4.3 STATES CHOSEN FOR CASE STUDIES (1) V ICTORIA, (2) QUEENSLAND AND (3) TASMANIA
............................................................................................................................................ 104
FIGURE 4.4 INTERNAL VALIDITY OF THE MIXED METHODS APPROACH............................................ 112
FIGURE 5.1 GEOGRAPHIC LOCATION OF THE STATE OF V ICTORIA .................................................. 118
FIGURE 5.2 PUBLIC SECTOR EMPLOYEES V ICTORIA 1983-2005 (AUSTRALIAN BUREAU OF STATISTICS
2006C) ................................................................................................................................. 119
FIGURE 5.3 INCREASED USE OF THE DSE MAPBASE BY LGAS ( JACOBY ET AL 2002) ..................... 123
FIGURE 5.4 DATA EXCHANGE PROCESS UNDER PIP (ALEXANDER TOMLINSON P/L 2006)............... 125
FIGURE 5.5 GEOGRAPHIC LOCATION OF THE STATE OF QUEENSLAND ............................................ 130
FIGURE 5.6 PUBLIC SECTOR EMPLOYEES QUEENSLAND 1983-2005 (AUSTRALIAN BUREAU OF
STATISTICS 2006C)............................................................................................................... 131
FIGURE 5.7 GEOGRAPHIC LOCATION OF THE STATE OF TASMANIA ................................................. 140
FIGURE 5.8 PUBLIC SECTOR EMPLOYEES TASMANIA 1983-2005 (AUSTRALIAN BUREAU OF
STATISTICS 2006C)............................................................................................................... 141
FIGURE 5.9 LIST GOVERNANCE AND REPORTING STRUCTURE (TWINN 2001) ................................. 147
FIGURE 6.1 ICT CAPACITY SELF ASSESSMENT................................................................................ 161
FIGURE 6.2 ACCESSIBILITY/REMOTENESS INDEX OF AUSTRALIA (GISCA 2006)............................ 162
FIGURE 6.3 LOCATION OF GIS UNIT .............................................................................................. 163
FIGURE 6.4 LENGTH OF TIME THE LGA HAS HAD A GIS................................................................ 164
FIGURE 6.5 ARE RESTRICTIONS PLACED ON THE USE OF SPATIAL DATA TO EXTERNAL
ORGANISATIONS?.................................................................................................................. 166
FIGURE 6.6 ATTITUDE TO COST RECOVERY.................................................................................... 166

xiii
FIGURE 6.7 USE OF WEB MAPPING................................................................................................. 168
FIGURE 6.8 MAKING SPATIAL DATA ACCESSIBLE FACILITATES BUSINESS....................................... 169
FIGURE 6.9 MOST COMMON SPATIAL DATA SOURCED FROM STATE GOVERNMENT AGENCIES......... 170
FIGURE 6.10 SOURCE OF PROPERTY DATA REQUESTS BY NUMBER OF LGAS.................................. 171
FIGURE 6.11 AVERAGE LEVEL OF COMPLETENESS OF SPATIAL DATA BY DATA THEME.................... 172
FIGURE 6.12 LEVEL OF INTEGRATION OF GIS WITH OTHER SYSTEMS IN LGAS............................... 174
FIGURE 6.13 QUALIFICATION OF GIS STAFF IN LGAS.................................................................... 175
FIGURE 6.14 LEVEL OF COLLABORATION OF LGAS WITH OTHER ORGANISATIONS.......................... 176
FIGURE 6.15 RANKING OF BARRIERS FOR LGA PARTICIPATION IN DATA SHARING.......................... 177
FIGURE 6.16 RANKING OF DRIVERS FOR LGA PARTICIPATION IN DATA SHARING ........................... 178
FIGURE 6.17 EXISTING FORMAL AGREEMENTS USED BY LGAS FOR COLLABORATION.................... 179
FIGURE 6.18 VALUE OF THE DATA SHARING ARRANGEMENT TO THEIR ORGANISATION................... 180
FIGURE 6.19 HAS THE DATA SHARING PARTNERSHIP IMPROVED DATA QUALITY? ........................... 181
FIGURE 6.20 IS THE DATA SHARE OF EQUAL BENEFIT TO BOTH ORGANISATIONS? ........................... 181
FIGURE 6.21 PERSPECTIVE ON THE VALUE OF EACH PARTNER’S CONTRIBUTION............................. 182
FIGURE 6.22 OVERALL LEVEL OF SATISFACTION WITH DATA SHARING PARTNERSHIP..................... 183
FIGURE 6.23 FACTOR AND REGRESSION ANALYSIS PROCESS.......................................................... 187
FIGURE 7.1 MODEL DEVELOPMENT PROCESS................................................................................. 198
FIGURE 7.2 CLASSIFICATION OF ISSUES......................................................................................... 200
FIGURE 7.3 SPATIAL DATA SHARING PARTNERSHIP MODEL............................................................ 201
FIGURE 7.4 JURISDICTIONAL AND INSTITUTIONAL RELATIONSHIPS................................................. 202
FIGURE 7.5 OUTCOMES COMPONENT OF MODEL............................................................................. 209

xiv
List of Tables
TABLE 2.1 DEVELOPMENT PARALLELS BETWEEN NII S AND NSDIS.................................................. 35
TABLE 2.2 DIFFERING PERSPECTIVES OF SDI................................................................................... 37
TABLE 2.3 COMPONENTS OF SDI (AFTER WARNEST 2005)............................................................... 38
TABLE 2.4 DATA SHARING TAXONOMY (CALKINS & WEATHERBE 1995, P. 71) ............................... 47
TABLE 2.5 SUMMARY OF DATA SHARING MODELS.......................................................................... 50
TABLE 2.6 SUMMARY OF EMPIRICAL RESEARCH FINDINGS FOR DATA SHARING AND SDI
DEVELOPMENT........................................................................................................................ 51
TABLE 3.1 A COMPARISON OF COOPERATION AND COORDINATION PROCESSES (MULFORD AND
ROGERS, 1982, P.13) .............................................................................................................. 59
TABLE 3.2 COLLABORATION CONTINUUM (DEDEKORKUT 2004, P. 5) .............................................. 67
TABLE 3.3 INTERDEPENDENCE, STRUCTURE AND POTENTIAL FOR CONFLICT (KUMAR & VAN DISSEL
1996, P. 287) .......................................................................................................................... 70
TABLE 3.4 THE COLLABORATIVE PROCESS (GRAY 1989, P. 57)...................................................... 71
TABLE 3.5 CRITICAL SUCCESS FACTORS IN COLLABORATION FOR PUBLIC SERVICE DELIVERY
(PREFONTAINE ET AL 2000) .................................................................................................... 73
TABLE 3.6 COMPARISON OF HIERARCHICAL ORGANISATIONS AND PARTNERSHIPS (BERGQUIST ET AL.
1995, P. 20) ............................................................................................................................ 80
TABLE 3.7 AUSTRALIAN STATISTICS 2005 (SOURCE: ABS 2006) .................................................... 82
TABLE 4.1 M IXED METHOD DESIGN TYPES (CRESWELL ET AL. 2003, P. 224) .................................. 101
TABLE 4.2 RESPONSE RATE AS A PERCENTAGE OF LGAS ............................................................... 110
TABLE 4.3 RESPONSE RATE AS A PERCENTAGE OF THE NUMBER OF PROPERTIES............................. 110
TABLE 5.1 ASSESSMENT OF DETERMINANTS FOR INITIATING DATA SHARING PARTNERSHIP............ 149
TABLE 5.2 COMPARISON OF THE PERFORMANCE OF THE PARTNERSHIPS......................................... 150
TABLE 5.3 CONTRIBUTION OF PARTNERSHIPS TO SDI DEVELOPMENT............................................. 152
TABLE 6.1 STRUCTURE OF THE LGA QUESTIONNAIRE................................................................... 160
TABLE 6.2 LARGEST, SMALLEST AND MEDIAN SIZE OF LGAS IN SURVEY....................................... 161
TABLE 6.3 VARIABLES THAT ILLUSTRATE SIGNIFICANT INTER-STATE DIFFERENCE (P <0.05).......... 185
TABLE 6.4 FACTOR ANALYSIS COMPONENTS AND INITIAL VARIABLES............................................ 189
TABLE 6.5 BIVARIATE CORRELATIONS OF FACTOR COMPONENTS...................................................190
TABLE 6.6 RESULTS OF MULTIPLE REGRESSION MODELLING ....................................................... 193
TABLE 7.1 IDENTIFICATION OF SIGNIFICANT ISSUES AND THEIR SOURCE ........................................ 199
TABLE 7.2 IMPACT OF INSTITUTIONAL AND JURISDICTIONAL ENVIRONMENTS ON DATA SHARING
PARTNERSHIPS...................................................................................................................... 211
TABLE 7.3 ASSESSMENT OF THE COLLABORATIVE PROCESS COMPONENT....................................... 214
TABLE 7.4 ASSESSMENT OF PARTNERSHIP OUTCOMES IN EACH STATE............................................ 215
TABLE 7.5 OVERALL ASSESSMENT OF PARTNERSHIPS.................................................................... 215

xv
List of Acronyms
ACT AUSTRALIAN CAPITAL TERRITORY
AGI ASSOCIATION OF GEOGRAPHIC INFORMATION
ALGA A USTRALIAN LOCAL GOVERNMENT ASSOCIATION
ALIC A USTRALIAN LAND INFORMATION COUNCIL
ANZLIC A USTRALIAN NEW ZEALAND LAND INFORMATION COUNCIL
ASDD AUSTRALIAN SPATIAL DATA DIRECTORY
ASDI AUSTRALIAN SPATIAL DATA INFRASTRUCTURE
AUSLIG AUSTRALIAN GOVERNMENT LAND INFORMATION GROUP
CEO CHIEF EXECUTIVE OFFICER
CISP COMPUTER INVENTORY OF SURVEY PLANS
COAG COUNCIL OF AUSTRALIAN GOVERNMENTS
DCDB DIGITAL CADASTRAL DATA BASE
DNR DEPARTMENT OF NATURAL RESOURCES
DNRM&W DEPARTMENT OF NATURAL RESOURCES, M INES AND WATER
DPIWE DEPARTMENT OF PRIMARY INDUSTRIES, WATER AND ENVIRONMENT
EUROGI EUROPEAN UMBRELLA ORGANISATION FOR GEOGRAPHIC INFORMATION
FGDC FEDERAL GEOGRAPHIC DATA COMMITTEE
GDP GROSS DOMESTIC PRODUCT
G-NAF GEOCODED NATIONAL ADDRESS FILE
GI GEOGRAPHIC INFORMATION
GIS GEOGRAPHIC INFORMATION SYSTEM
G2G GOVERNMENT TO GOVERNMENT PARTNERSHIPS
B2B BUSINESS TO BUSINESS
G2B GOVERNMENT TO BUSINESS
HSR HIERARCHICAL SPATIAL REASONING
INSPIRE INFRASTRUCTURE FOR SPATIAL INFORMATION IN EUROPE
IOR INTER-ORGANISATIONAL RELATIONS
LAMIS L OCAL AUTHORITY MANAGEMENT INFORMATION SYSTEMS
LGA LOCAL GOVERNMENT AUTHORITY
LICC LAND INFORMATION COORDINATION COMMITTEE
LIS LAND INFORMATION SYSTEM
LIST LAND INFORMATION SYSTEM TASMANIA
LMAG L AND MANAGEMENT ADVISORY COMMITTEE
MAV M UNICIPAL ASSOCIATION V ICTORIA
NII NATIONAL INFORMATION INFRASTRUCTURE

xvi
NMD NATIONAL MAPPING DIVISION
NSDI NATIONAL SPATIAL DATA INFRASTRUCTURE
NT NORTHERN TERRITORY
PIP PROPERTY INFORMATION PROJECT
PLI PROPERTY LOCATION INDEX
PSMA PUBLIC SECTOR MAPPING AGENCY
OGDC OFFICE OF GEOGRAPHIC DATA COORDINATION
QLIC QUEENSLAND LAND INFORMATION COUNCIL
QVAS QUEENSLAND VALUATION ASSESSMENT SYSTEM
QSIC QUEENSLAND SPATIAL INFORMATION COUNCIL
QSIIC QUEENSLAND SPATIAL INFORMATION INFRASTRUCTURE COUNCIL
RAVI DUTCH COUNCIL FOR REAL ESTATE INFORMATION
SDI SPATIAL DATA INFRASTRUCTURE
SIS SPATIAL INFORMATION SYSTEM
SLA SERVICE LEVEL AGREEMENT
SLIC STATE LAND INFORMATION COUNCIL
VAR VALUE ADDED RESELLER
VGIS VICTORIAN GEOGRAPHIC INFORMATION STRATEGY
VFI VERTICAL FISCAL IMBALANCE

xvii
Operational Definitions
The following brief operational definitions of terms which are used commonly throughout this thesis are provided to clarify the context in this research.
Establishment and Direction Setting
The process of initiation of a data sharing partnership which includes the goal setting, organisational alignment, negotiation and development of partnership agreements.
Governance The people, policies and processes which may exist within a data sharing partnership or organisation to manage, plan and monitor the operation.
Institutional Environment The operating environment of individual government agencies or organisations which can include the staffing, finances, policies, leadership, business activities, organisational structures and historical developments.
Jurisdictional Environment
The political, economic, social, geographical and environmental dimensions of a State or Local Government jurisdiction.
Mature SDI Partnership The stage at which the data sharing partnership has established operational procedures and processes for the routine exchange of data and which is contributing to the development of a SDI.
Motivations This term has been used to indicate the potential benefits that may be seen by organisations or individuals for collaborating to share data or resources.
Partnership Management The processes required to overview and direct the operations of a data sharing initiative.
Partnership Operation and Maintenance
This refers to tasks which are required to be undertaken during a data sharing initiative. Some of these tasks include the data exchange process, communication, resourcing and project management.
Partnership Sustainability The long term operation of a data sharing initiative which allows it to move from a project based enterprise to an ongoing and resourced program.
Performance Monitoring The assessment of the performance of a data sharing partnership over a period of time. Normally the progress is measured across a series of indicators which are based on an initial benchmark.
SDI Development The process of establishment and ongoing maintenance of a spatial data infrastructure which supports the wider utilisation of spatial data by government, private sector and the community in general.
Success This term has been used to indicate a generally positive outcome from a data sharing initiative. The cessation of a partnership may not necessarily indicate failure. Moreover, it may indicate that other avenues may now need to be pursued. Therefore, success may need to be viewed across a number of dimensions.

xviii

Chapter 1 - Introduction
1
1 Chapter 1 Introduction
Chapter 1
Introduction

A Local-State Spatial Data Sharing Partnership Model to Facilitate SDI Development
2

Chapter 1 - Introduction
3
1.1 Background to Research Accurate, up-to-date, relevant and accessible spatial information at the local level is
critical to the delivery of many government services, particularly emergency services such
as police, fire and ambulance. The development of sub-national spatial data infrastructures
(SDIs) which support these services increasingly depends on the effective co-operation and
exchange of information between government jurisdictions and industry. However, in
countries with decentralised systems of government, the sharing of data between
jurisdictions, and hence SDI development, continues to be problematic. This thesis
addresses this problem by investigating the effectiveness of local-state government spatial
data sharing partnerships as a means of facilitating sub-national SDI development.
Geographic information systems (GIS) are now widely utilised and integrated in many
areas of our society. Governments, businesses and the community now rely on spatial
information for practical decision making on a daily basis (1995a). With the dramatic
growth of GIS during the 1980s and 1990s, the focus slowly began to shift from the
management of technology to the management of information. Organisational efforts were
directed towards improving information management in line with the concept of “gather
once, but use many times”. As the advantages of a single point of entry for intra-
organisational information were realised, attention turned to improving the flow of inter-
organisational information (Lee 2003). Both government and the private sector recognised
that the duplication of effort and disparate data holdings was becoming an increasing
burden on their operations. Unlike technological barriers which are being continually
resolved, it is “institutional inertia” which is proving to be the more formidable challenge
(Craig 1995).
This challenge began to be addressed in the early 1990s by shared or multi-participant GIS
projects in Europe and the USA (Masser & Campbell 1994; Nedovic-Budic 2000) and
other regions such as Asia and Australia (Masser 2002). The recognition by many
countries that information should be considered as an infrastructure led to the concept of
geospatial or spatial data infrastructures (ANZLIC 1996; Coleman & Nebert 1998; Masser
1998b; National Research Council 1993).
Australia, like other countries around the world, began to take positive steps towards
building its SDI through national policy development and co-ordination efforts.
Progressively, the national SDI initiatives in Australia were followed, or often preceded,
by state government SDI initiatives. As the state governments’ understanding of SDI
A Local-State Spatial Data Sharing Partnership Model to Facilitate SDI Development
4
matured, they soon realised that building some of their fundamental data sets relied heavily
on the contributions from jurisdictions such as local government.
In Australia, the delivery of emergency services, such as police, fire fighting and
ambulance is a state government responsibility. Accurate and relevant information such as
address, vehicular access, location of services, property ownership, climate and
topography is critical for emergency response teams. However, rarely do all of these data
sets reside within the one organisation or jurisdiction. Hence, co-operation and data
sharing amongst these organisations is critical. Although there is a history of good co-
operation between jurisdictions during emergencies, at other times the sharing of data
between jurisdictions has been problematic.
With local government being a custodian of a number of strategic spatial data sets, it has a
crucial role to play in the development of the state and national SDIs. In recent years, a
number of co-operative partnerships between local and state government have begun to
emerge. These partnerships are relatively new arrangements that have been established to
facilitate the improved sharing of spatial data and to realise the full potential of the SDI.
To maximise the benefits from these partnerships it is important to understand the factors
that contribute to their successful operation and sustainability. Therefore, the focus of this
research is to understand these collaborative arrangements so that future data sharing
initiatives can be improved and sustained.
The Internet and the release of on-line tools such as Google Earth has transformed the
“Digital Earth” concept, described by former US vice-president Al Gore in 1998, into a
reality (Butler 2006). However, the limitations on information portals such as Google
Earth are unlikely to be of a technological nature. Instead, it is far more likely that these
information portals will be limited by people and organisational issues.
1.2 Research Formulation
1.2.1 Statement of Research Problem
Accurate and reliable spatial information, particularly property related information,
supports many operational and strategic decisions both within government and the
business community. The completeness and accuracy of many state spatial databases rely
on the exchange of information between jurisdictions, especially local government.
However, for a variety of technical, institutional, political and economic reasons, the
exchange of this fundamental spatial information between local and state jurisdictions has
proven to be problematic. The limited sharing of spatial information between jurisdictions

Chapter 1 - Introduction
5
is having a detrimental affect on the development of spatial data infrastructures at local,
state and national levels and hence the efficient delivery of government and community
services.
Therefore, the research problem to be investigated in this thesis is as follows:
Because existing local/state government spatial data sharing partnership models in
Australia do not adequately consider a range of technical, institutional, political and
economic factors, their potential for contributing to the development of local, state and
national SDIs is limited.
1.2.2 Aim, Research Questions and Objectives
In recognising the research problem the central aim of the research is to:
Develop a spatial data sharing partnership model which more effectively supports the
sharing and maintenance of spatial information between local and state jurisdictions
within Australia and hence contribute to SDI development.
In considering the research problem and aim a number of key research questions emerged,
namely:
1. Can the understanding of existing theory on data sharing, collaboration and
organisations be applied to existing local/state government data sharing models to
improve their operation and sustainability?
2. How can these partnership models be more rigorously described and classified?
3. What are the motivations and barriers for the participation of local and state
government in spatial data sharing partnerships?
4. What are the factors that contribute to the successful establishment, management
and operation of local/state SDI partnerships?
5. Can the varying organisational characteristics, capacities and attitudes of local
government be related to their partnership participation or outcomes?
6. Can a generic model be developed which can guide future local/state spatial data
sharing partnerships?
Using these research questions as the basis for exploring the operation of local-state
government partnerships, the following objectives were formulated to achieve the research
aim.

A Local-State Spatial Data Sharing Partnership Model to Facilitate SDI Development
6
1. Review existing theory and practice in spatial data sharing, spatial data
infrastructures and inter-organisational collaboration. Specifically, review the
spatial information developments in Australia including the state and local
government environments.
2. Describe and classify a number of existing local/state government spatial data
sharing partnerships in Australia including their political (jurisdictional),
institutional and operational dimensions.
3. Empirically assess the impact of the organisational characteristics, capacities and
attitudes in local government to the differing spatial data sharing partnership
outcomes.
4. Identify the critical factors or issues that influence data sharing partnership efforts
between local and state government and utilise these findings to develop a generic
partnership model.
5. Evaluate the partnership model and assess its wider application including its
potential contribution to SDI development.
1.3 Justification for Research In Australia, there have been no systematic studies to investigate the factors that influence
the sharing of spatial information between local and state government. Although some
attempts have been made to understand the reasons for sharing spatial data and the
collaboration mechanisms between Australian jurisdictions, they have been limited
(Warnest 2005). Researchers in the UK, Europe and the USA have made significant
progress in examining the sharing of spatial information amongst governments, but the
research has rarely progressed beyond the identification of impediments. Craglia &
Signoretta (2000) identified in their case studies of local municipalities that there was very
little development of SDI at a local level and, because of the heterogenous nature of this
level of government, efforts could not be easily replicated. In addition, most research has
attempted to treat the sharing of all spatial data sets equally. It is now recognised that
some information, such as property information, is fundamental to the operation of
government, industry and the community as a whole, and priority should be given to
improving the management of this data (ANZLIC 1996).
In the research recommendations of Warnest (2005), the author highlights the increasingly
important role of local government and its information when he says “Local level
government is an authoritative source of spatial information including property, address
and local roads information. The role of local governments is also expanding as
community services increase and tasks such as environmental management and

Chapter 1 - Introduction
7
enforcement are vested with local authorities. Local governments contribute to the
community’s spatial information assets and benefit greatly from State and National SDI.”
(Warnest 2005, p. 229).
Organisational, technical, legal and economic issues continue to impede the integration of
spatial information in heterogeneous data sharing environments (Masser 1998a; Masser &
Campbell 1994; Nedovic-Budic & Pinto 2001; Onsrud & Rushton 1995a). Although
research has identified that these inter-organisational issues remain a priority, there have
been few systematic evaluations of the mechanisms and factors that facilitate the inter-
organisational efforts (Nedovic-Budic & Pinto 2001). In particular, the vertical integration
of multiple levels of data across multiple levels of government continues to be a major
impediment to a fully robust National Spatial Data Infrastructure (NSDI) (Harvey et al.
1999). Masser (2005, p. 265) identifies “there is a pressing need for more research on
nature of data sharing in a multilevel SDI environment”, particularly with respect to the
organisational issues.
Partnerships are considered to be essential for SDI development because they provide the
mechanism to allow organisations to work together to achieve SDI goals and to share the
implementation responsibilities and eventual partnership benefits (Wehn de Montalvo
2001). Experience in several countries, including Australia, has identified a number of
problems with establishing partnerships at every level of government. These problems
include poor structure of the partnerships, lack of awareness of the benefits of the
partnership, lack of clear responsibilities of each partner, fear of losing of control of data,
funding and buy-in (Wehn de Montalvo 2001). Although these issues have been
identified, the key problem remains “how to package these research insights into a
coherent and effective program or set of guidelines” (Nedovic-Budic & Pinto 2001, p.
296). Kevany (1995) also identifies that one of the most important areas of research is to
establish a base set of factors for both successful and unsuccessful data sharing
environments which can be applied to future initiatives.
From a practical and “real-life” perspective, the improvement in government databases at a
state government level will contribute to improvements in national databases such as the
geocoded national address file (G-NAF). Deficiencies in key existing databases such as
those held by Telstra, Australia’s national telecommunications organisation, were recently
highlighted on the front page of The Australian Newspaper which cited an internal Telstra
report identifying: “Details of up to 500,000 Australians are incorrectly recorded on
Telstra's triple-0 database, raising fears emergency services could be sent to wrong
addresses…. duplication of records, obsolete product codes, a shortage of internal

A Local-State Spatial Data Sharing Partnership Model to Facilitate SDI Development
8
expertise and a lack of quality control as key problems with Telstra's database.... more
than 40 per cent of Telstra's records, which are used by emergency services, fall below the
"target data" standards… and could result in a "critical" situation.” (The Australian
Newspaper, 14 March 2006, p. 1).
This research will provide a better understanding of the existing partnership arrangements
between local and state government through the development of a generic model which
can improve future data sharing initiatives. This model may also have application to other
jurisdictions e.g. state and federal government. A model that better recognises each
jurisdiction’s needs should also have a greater chance of being sustainable. The benefits
from such a model will be the improved accuracy, reliability and completeness of spatial
information which impacts all sectors of the government, business and community.
1.4 Research Approach This thesis follows a mixed methods research approach which integrates the qualitative
exploration of spatial data sharing partnerships, and the quantitative evaluation of
partnership participants, to develop a comprehensive data sharing partnership model. The
research questions identified by the background studies were found to be difficult to
answer by a single approach. A case study strategy was identified as a suitable method for
addressing the “why” and “how” questions, but not the most effective approach for
quantifying organisational characteristics and attitudes. In contrast, a quantitative
approach provides a suitable process to measure the organisational characteristics,
capacities and perspectives, particularly when a large number of organisational units are
being investigated.
The use of mixed methods can also minimise the weakness of a single approach through
the complementary utilisation of the strengths of other methods. The case study approach
provides the opportunity to investigate the partnership arrangements in greater depth whilst
the quantitative study provides the opportunity for greater breadth.
Finally, the opportunity to investigate and present a greater diversity of views is important
in validating the research findings. Divergent findings are valuable in that they lead to the
re-examination of the conceptual framework and underlying assumptions of each of the
two components (Teddlie & Tashakkori 2003). The diversity and divergence of
perspectives between state and local government is well known but also reflects the reality
within these jurisdictions and hence the partnership arrangements.

Chapter 1 - Introduction
9
The research approach consists of a four stage process that culminates in the development
of a new framework to describe and analyse partnership models. Figure 1.1 illustrates the
research approach utilised. Stage one consists of the identification of the research problem
and objectives. It also includes a review of existing literature across the areas of SDI,
spatial data sharing, collaboration, intergovernmental relations and partnerships. The
existing theory is utilised to refine the research questions and the framework for
investigating the partnerships.
Figure 1.1 Research approach
Stage two entails the case study analysis of three existing state/local government spatial
data sharing partnerships. In addition to having a partnership initiative in place, states
were selected on the basis of a variety of characteristics including geographic area,
population and the number of local governments. The three states selected represent
almost 50% of Australia’s population base, approximately 35% of the total number of local
governments and about 25% of the geographic land area, thereby providing a contrasting
mixture of local governments, geography and institutional arrangements.
A semi-structured interview technique is utilised to collect data about each of the
partnerships at state government level. Documentation in the form of partnership
agreements, internal reports, research papers and consultancy reports are utilised to
describe the partnership arrangements. A comparative assessment is then undertaken to
compare the partnership structures and operation.

A Local-State Spatial Data Sharing Partnership Model to Facilitate SDI Development
10
The third stage of the methodology involves the use of an online questionnaire to over 100
local governments. The purpose of the questionnaire is to assess the factors that influence
the success or otherwise of the data sharing partnerships from a local government
perspective. The questionnaire uses a SDI framework to investigate the organisation’s
capacity in regard to spatial information policies, data holdings, skills, access
arrangements and standards/technology. In addition to the SDI framework, the
questionnaire also examines the organisational setting, preferences for collaborating and
perspectives on the existing partnership arrangements. The results of the questionnaire are
then analysed to identify key success factors that may influence the participation of local
governments in data sharing partnerships.
In the final stage, the results of the case studies and the questionnaire analysis are
integrated to develop a generic spatial data sharing partnership model. The mixed
methods approach facilitates the blending of the case study and questionnaire results to
establish the framework of the final partnership model. The model is then evaluated and
its wider application and contribution to SDI development is discussed.
1.5 Structure of the Thesis The thesis is structured in four main parts. Part one is the introduction and consists of the
statement of the research problem, research aim and objectives. The research problem is
justified and an overview of the research approach is presented. Part 2 contains the
background chapters that review theory and practice. Part 3 consists of the research
methodology, case studies analysis and the results of the questionnaires. Part 4 is the
synthesis which includes the model development, evaluation, discussion and conclusions.
Figure 1.2 illustrates the structure of the thesis and its relationship to the research
objectives.
In Chapter 1, the background to the research problem is presented. The importance of
spatial data sharing to the process of building sub-national SDIs is identified. The overall
aim of the research is stated and the objectives to achieve this aim are presented. An
overview of the research approach is provided and the scope and delimitations are
discussed.
Chapter 2 examines the historical developments of land and spatial information in
Australia with particular reference to the developments at a local and state government
level. The emergence of state and national data access and pricing policies are described
in the context of the gradual development of spatial data infrastructures. Existing research
and approaches to spatial data sharing are reviewed to understand some of the

Chapter 1 - Introduction
11
organisational, technical, economic and legal issues that are limiting the wider process of
data sharing.
Chapter 1
Background to Research
Research Problem, Aim and Objectives
Research Approach and Delimitations
Chapter 2
SI in Australia
SDI Concepts
Spatial Data Sharing
Objective #1
Chapter 3
Collaboration Theory
Partnerships
Local/State Government Environment
Objective #1
Chapter 4
Research Design
Research Methods
Chapter 5
State Government Case Study
Analysis and Results
Objective #2
Chapter 6
Local Government
Questionnaire Analysis and
Results
Objective #3
Chapter 7
Model Development
Model Evaluation and
Generalisation
Discussion
Objectives #4&5
Chapter 8
Conclusions
Research Achievements
Significance
Further Work
Objectives #1-5
INTRODUCTION
BACKGROUND
Literature Review and
Theory
DESIGN, ANALYSIS
&RESULTS
SYNTHESIS
Development, Validation, Discussion &
Conclusions
Figure 1.2 Structure of the thesis and relationship to objectives
Chapter 3 introduces the concepts of collaboration and partnerships. Collaboration theory
and the processes that influence collaboration are investigated. Partnerships and a range of
emerging partnership typologies and classifications are explored. The government
environments across local and state governments are examined, particularly their influence
on collaborative relationships.

A Local-State Spatial Data Sharing Partnership Model to Facilitate SDI Development
12
Chapter 4 describes the research design and methods. A mixed methods approach is
selected and justified as the basis to describe and classify existing spatial data sharing
partnership models and to measure the factors that influence the participation of local
governments in these partnerships. The selection of case studies and the design of the
questionnaire are detailed. Methodological issues including validity and ethical
considerations are discussed.
Chapter 5 describes and analyses three partnership case studies using a framework drawn
from SDI theory and organisational collaboration. The common elements in each
partnership are compared to formulate a generic classification for local/state government
partnership models. The characteristics of the models are later utilised in chapter 7 to
propose a generic model for local/state data sharing partnerships.
Chapter 6 reports on the results of the empirical analysis of the questionnaire which was
distributed to over 180 local governments within the three state government jurisdictions.
The results describe the capacities and perspectives of local governments which are
participating in spatial data sharing partnerships. A variety of organisational
characteristics and attitudes are compared across the three states to identify factors that
contribute to differing partnership outcomes.
Chapter 7 draws together the qualitative case study results and the quantitative local
government survey results to formulate a generic model for establishing and sustaining
sub-national data sharing partnerships. The model is evaluated through a critical review
process which utilises some of the original case studies and jurisdictional feedback. The
application of the model and its possible utility for other jurisdictions is discussed.
The final chapter, Chapter 8, presents the research achievements and conclusions. The
significance of the research findings to theory and practice are examined and
recommendations for further research are provided.
1.6 Delimitation of Scope and Key Assumptions The focus for this research is existing local/state government spatial data sharing
partnerships within Australia which have been specifically established for the exchange of
property related information. Australia consists of six state jurisdictions and two
territories. The two territories, the Australian Capital Territory (ACT) and the Northern
Territory (NT) have significantly different governance and responsibilities than the six
states and assume more of a local government role in their own right. Therefore, the two
territories were not considered as suitable case studies. When the research commenced the

Chapter 1 - Introduction
13
three chosen case study states were the only states with established formal partnerships in
the selected research area.
Although many other spatial data sharing arrangements have existed or continue to exist
between local and state governments, most are informal arrangements that have been
established on a project basis over a short timeframe. These initiatives cover a variety of
spatial information ranging from engineering and infrastructure data, environment data,
natural resource information and social statistics. In general, these data sharing
arrangements have not been sustained, were informally based and limited history and
documentation was available. As this research is focused on sustainability of formal data
sharing arrangements, this diverse group of data sharing activities was excluded from the
research.
In contrast, property related information such as property values and address have become
fundamental data sets at local, state and now national levels. The efforts by a number of
the state governments in recent years to establish formal and sustained data exchange
arrangements provide an excellent framework for this research. This information is also
seen as critical to delivery of a wide range of government services, particularly emergency
services.
Due to the sensitive nature of some of the ongoing partnership negotiations, distribution of
the questionnaire was arranged through the state government agencies which managed
each partnership. This resulted in a slightly differing contact approach to local
governments in each state, however this was assessed as having a minimal impact on the
results or response rate.
During this research, the partnerships, organisational structures and political arrangements
have continued to change. The dynamic nature of these settings is an important
consideration, however continuous update and revisiting of the case studies was not
practical. The descriptions and documentation is therefore valid at the time of data
collection only, and it should be recognised that changes may have taken place since this
time.
1.7 Chapter Summary This chapter has laid the foundations for the research and served to introduce the central
problem, the aim and objectives of the research. The research problem was justified and
the research approach was briefly described and justified. The thesis structure has been
outlined and some delimitations of the work have been discussed.

A Local-State Spatial Data Sharing Partnership Model to Facilitate SDI Development
14
The next chapter provides a background to the areas of spatial information development
within Australia, spatial data infrastructures and the sharing of spatial data.

Chapter 2 – Spatial Data and SDI in Context
15
2 Chapter 2 Spatial Data and SDI in Context
Chapter 2
Spatial Data and SDI in Context

A Local-State Spatial Data Sharing Partnership Model to Facilitate SDI Development
16

Chapter 2 – Spatial Data and SDI in Context
17
2.1 Introduction This chapter examines spatial information developments across local, state and federal
government in Australia, the progress of information infrastructures including spatial data
infrastructures and the advances in spatial data sharing theory. The development and
evolution of spatial information systems in Australia, more commonly termed land or
geographic information systems, provides an important perspective of developments which
have resulted in the current jurisdictional and institutional arrangements. The more recent
treatment of spatial information as an infrastructure and the emergence of SDI concepts
and models are then examined. Finally, the process of spatial data sharing is explored to
provide an understanding of the models, typologies and issues that have developed in
recent years.
2.2 Spatial Information Developments in Australia – A Brief History
2.2.1 Definitions
Throughout this dissertation, and this chapter specifically, the terms land information
systems, geographic information systems and spatial information systems will be utilised
and discussed. It is therefore useful to clarify this terminology and to put in context their
historical development and contemporary usage.
A land information system (LIS) is described in literature as an information system that is
specifically related to parcels of land (Grimshaw 2000). Traditionally, these systems have
been closely linked with land administration systems including the computerisation of the
cadastral maps that underpin these systems. The focus of these systems was generally
narrow, and they were primarily developed to support the land administration and mapping
activities within government agencies.
Geographic information systems (GIS) are considered to be an expansion of the
functionality and scope of land information systems. The Chorley Report in the UK
provides a useful definition of a GIS as “A system for capturing, storing, checking,
manipulating, analysing and displaying data which are spatially referenced to the earth”
(Department of Environment 1987, p. 132). Many other authors have developed similar
definitions which broaden the context to geography and the earth more generally. For the
purpose of this research the definition by Carter that a GIS is “An institutional entity,
reflecting an organisational structure that integrates technology with a database, expertise
and continuing financial support over time” (Carter 1989, p. 3) provides an important
focus on the organisational context of GIS.
A Local-State Spatial Data Sharing Partnership Model to Facilitate SDI Development
18
In recent literature, spatial information systems (SIS) are perceived to provide a further
dimension to GIS by not constraining the information to the geographic context of the
earth’s surface or near earth’s surface (Goodchild 2001).
Property related information is perhaps best described as a subset of the land information
and includes that range of data that support the management of land parcels and property.
It usually includes the cadastral parcels, land title information, address, property
information and land valuation data. This information is used by all levels of government
and the private sector to manage a range of property services and transactions.
This research has focussed on spatial data sharing partnerships which deal primarily with
property related information. Hence, some background on the developments relating to
spatial information in Australia generally, and property related information specifically,
are reviewed.
2.2.2 Overview and Context
Australia, like many developed countries, has progressively established a capacity to build,
manage and distribute its spatial information across the government and non-government
sectors. The purpose of this review is to provide an historical summary of the important
developments in the areas of land and spatial information in Australia across the three
levels of government – local, state and federal.
2.2.3 Spatial Information Developments in Local Gov ernment
Local government in Australia is a system of government established under state
government legislation and is governed by a council, elected directly by, and accountable
to, the various communities which they serve. Local government authorities (LGAs), or
councils as they are commonly termed, are multifunctional and provide a wide range of
services through a single administrative structure for the governance and good
management of towns, cities and communities (Hullick & Cooper 1993).
Responsibilities of local government vary from state to state but extend well beyond the
traditional perspective of the “three Rs” of roads, rubbish and rates. Most local
governments control or oversee land development and planning, parks, community
facilities, environmental compliance, water supply, sewerage and community health
amongst other responsibilities. The land related information and mapping that supports
their decision-making is typically at a detailed level or large scale (1:100 to 1:5000).

Chapter 2 – Spatial Data and SDI in Context
19
Local government in Australia was an early adopter of land information and geographic
systems, both as a user of the early digital map products such as the digital cadastral data
bases (DCDB) and also a prominent information contributor (McDougall & Perret 1987;
Williamson & Blackburn 1985). Many of these developments were driven by the need for
improved land use planning (Nash & Moll 1976) and better financial management of the
organisation and their assets (Cushing et al. 1975).
By the late 1970s, many local governments in Australia had computerised records of their
properties for the purpose of rating and taxation, however these systems constituted
financial management systems rather than spatial information systems. Early efforts to
build more “spatially” orientated systems focussed on the classification and geocoding of
land and planning information. These developments enabled key data sets such as address,
zoning, land ownership and planning applications to be more effectively managed in a
geographic as well as financial context.
Even at this early stage of land information systems development, the problems of dealing
with the complex nature of address, property and land parcels were recognised, and the
concept of a unique property identifier was considered (Moyer & Fisher 1973). The local
government developments in Australia parallelled efforts in other countries such as the
United Kingdom, where the development of systems such as the Local Authority
Management Information Systems (LAMIS) were undertaken by local governments in
conjunction with mainframe computer vender ICL (Mayr 1992).
In the late 1970s and early 1980s, advances in computing enabled the use of graphical
interfaces through mini-computers, and then personal computers, to be more widely
deployed in local government (Bomberger 1983). The development of computerised local
government planning schemes and zoning maps were some of the first significant products
to be generated from land information systems. Traditional computer applications for
planning began to make way for more spatially demanding and accuracy specific
applications such as engineering infrastructure, transport planning, property management
and facilities management (Bomberger 1983).
Although local governments in Australia provide a multitude of services, other essential
services such as gas, electricity and water are now primarily managed by quasi-
governmental instrumentalities or private companies. These organisations, along with
local governments, have significant holdings of spatial information.
A Local-State Spatial Data Sharing Partnership Model to Facilitate SDI Development
20
In the late 1980s to mid 1990s with the maturing of GIS software and the affordability of
computer systems, GIS was adopted widely across both large and small local governments
(Wadlow 1989). This period was characterised as a time of system consolidation and data
collection. It also coincided with the completion of many of the state government
cadastral data bases which became a critical base data set for most local governments.
However, some local governments in Australia decided to build and maintain their own
digital cadastral mapbase for reasons of accuracy, data reliability or cost. This period also
coincided with one of the lowest points in the relationship between local and state
governments with respect to sharing and exchange of spatial information as issues such as
copyright and ownership of information began to emerge.
Trends on adoption and diffusion of GIS and geographic information technology have
been explored in the USA (Budic 1994; Budic & Godschalk 1994; Warnecke 1995), the
UK (Campbell 1993; Masser 1993; Masser & Campbell 1995) and Europe (Masser &
Campbell 1996). Although GIS technology has been adopted widely across local
government in Australia, there is little documented evidence on its growth or diffusion
within this sector of government in Australia. A number of studies have examined GIS
implementation within individual local governments from a technical perspective
(Arrowsmith & Williamson 1990), but no systematic efforts have explored the
institutional or organisational impacts of this technology in Australian local governments.
With an estimated 70-80% of all local government transactions having a land or
geographic component (Somers 1987), the spatial information holdings within local
governments began to grow rapidly. The size and structure of the local government GIS
units also grew and developed rapidly as the appetite for spatially related information
expanded beyond the traditional engineering and planning departments. The local
government GIS were becoming corporate information systems and their deployment grew
from a few dozen specialist users to hundreds of users across the LGAs. GIS had become
a tool and the information that it provided to the organisation went from being “nice to
have” to being “critical” (Mayr 1992).
Perhaps one of the most significant data sets to be adopted and used widely across local
government in the 1990s was the digital orthophoto. The result of its incorporation within
many local governments saw an exponential growth in the number of GIS users and the
recognition of the power of spatial information by Chief Executive Officers (CEOs) and
managers.

Chapter 2 – Spatial Data and SDI in Context
21
The late 1990s and the early 2000s saw the improvement in cost efficiency of GIS
technology and greater utilisation of the spatial information within local government. GIS
now supports many activities including front counter enquiries, land planning, asset
management, local health, environmental compliance and animal registration amongst
others. Web mapping introduced spatial information to a broad base of LGA users and also
improved community access to basic land and spatial information. Local governments
have continued to be leaders in the application of spatial information and technology
through the use of web mapping applications and location based services.
2.2.4 Spatial Information Developments in State Gov ernment
The Land Information Era (1970s-1980s)
Australia is a federation of states which includes six states and two territories. The State
Governments have primary responsibility for the delivery of education, health, emergency
services, resource management and transport programs, amongst others. The majority of
state services are funded through grants handed down from the federal government and
supplemented by a range of state government taxes and levies. State governments are also
responsible for land administration activities including land titling and registration, land
management, land planning and land valuation.
Because of the federated nature of the Australian government system and the rights (or
lack thereof) of the various state government members with respect to income generation,
a major focus for generating jurisdictional income has been land (Hart 1991). The land
transactions (buying, selling and transferring) generate significant state government
revenues through stamp duty, land tax and rates. The state land management and
administration agencies are supported by a range of medium scale mapping (1:10,000 to
1:50,000) in themes such as cadastre, topography, roads, vegetation, soils, minerals and
fauna.
As with local government, each state government has similarities and differences. One
major similarity across the states and territories is their heavy reliance on cadastral or land
parcel data (Grant & Williamson 2003). In the late 1970s and early 80s, Australian state
governments were challenged by the significant institutional and technical issues as they
computerised their land related records. The development of these state databases also
identified the need for a national approach to land information management (Grant &
Hedberg 2001).
These early digital cadastral databases provided the impetus for the development of land
and geographic information systems in many government jurisdictions. Through the

A Local-State Spatial Data Sharing Partnership Model to Facilitate SDI Development
22
1980s, the multipurpose cadastre concept spurned major topographic and cadastral
mapping “megaprograms” to support land administration at the local, state, and federal
levels (Coleman & Nebert 1998; Dalrymple et al. 2003). With the advent of more
powerful mini and mainframe computers, and the development of more effective data base
structures, a number of state government agencies proposed the development of centralised
land information systems or land “hubs”.
In addition to bringing together the various disparate sets of land administration data
(aspatial component), the land information systems initiated the development of
comprehensive digital cadastral bases (spatial component). Paper-based cadastral index
maps had been used by state government agencies to manage land related activities since
the late 1800s. The conversion of these paper “working” maps into digital cadastral data
bases was a logical progression and critical to the role of managing land related data
(Bullock 1978).
State Land Information Coordination Era (1980s-1990 s)
In the early 1980s, state governments operationalised their LIS visions through the
conversion of their cadastral map holdings. By 1990, most state and territory governments
had made substantial progress towards completing their capture programs with the states of
Queensland, South Australia, Western Australia, ACT and NT nearing completion, whilst
Victoria, New South Wales and Tasmania had made limited progress (Hesse & Williamson
1990). In New South Wales and Victoria the progress of building these data bases was
slowed due to the separate organizational responsibilities for maintaining cadastral
mapping across the urban and regional areas. The subsequent capture and conversion of a
range of other spatial data sets including topography, drainage, roads, vegetation and soils
enabled the expansion of GIS technology to most areas of government, and progressively
to the private sector.
These early efforts to compile a single authoritative cadastral map base highlighted the
need for a coordinated and cooperative approach. In 1985, New South Wales moved to
create the State Land Information Council (SLIC) to provide an integrated approach to
land data management. In a similar approach, Queensland established its Queensland
Land Information Council (QLIC) in 1991 after a statewide review of information
technology and the delivery of government services. The QLIC was established to provide
more effective policy advice on land information management and facilitate an integrated
and coordinated approach to the development of the state’s land information system (Eden
& Barker 1992).

Chapter 2 – Spatial Data and SDI in Context
23
By the early 1990s, state-wide land information systems were showing significant promise
and advancement due to data bases becoming on-line and operational, advances in data
base technology and communications making integration more feasible and a rapidly
growing demand for integrated data sets by the users (Eden & Barker 1992).
The Cost Recovery Era (1990s)
State government agencies devoted significant resources to computerisation and
integration, resulting in some improvements in efficiencies, but with a relatively small
return on their investment. During the early 1990s Australia suffered a period of economic
downturn which was characterised by government policies to reduce the size of the public
sector and outsource activities to the private sector. This “downsizing” approach gave
little consideration to the re-engineering of functions or processes (Grant & Williamson
2003).
Government budgets at this time were under significant pressure and cost recovery policies
forced many state governments to market their data in an attempt to recover some of their
development costs. Because state governments held copyright and ownership of the digital
cadastral data bases (DCDBs), a monopoly effectively existed with state governments
being the sole supplier of this data. Users such as local government were therefore forced
to pay relatively high costs for accessing this data. Access fees of approximately $1.00 per
parcel per year were not uncommon for users during the early 1990s. Most cost recovery
efforts during this period were generally unsuccessful and created significant discontent,
particularly amongst local government users, the private sector and even other state
agencies.
By the mid 1990s, a number of state governments recognised that cost recovery strategies
were not working and in fact were proving to be a high disincentive to information usage.
In 1993, the Queensland Government endorsed a policy on the “Transfer of Land Related
Data” which was designed to enable the land related data to be made available to agencies
and other governments at the “cost of transfer” (Eden & Baker 1994). However, when the
policy was implemented in 1994, there were no guidelines to determine what was the “cost
of transfer” and little progress was made in reducing the pricing and hence access to data.
During this period, it was recognised that a significant investment had been made in the
consolidation and conversion of spatial information. Spatial information was now
considered to be an infrastructure, in a similar way that road networks or electricity
distribution systems were considered to be essential infrastructure. However, unlike these

A Local-State Spatial Data Sharing Partnership Model to Facilitate SDI Development
24
physical infrastructures which could be accurately dissected and valued as assets,
quantifying the value of spatial information presented a greater challenge.
Spatial Information as an Infrastructure (2000s)
Although the development of state spatial data infrastructures had begun in the late 1970s,
it was not until the late 1990s that most state governments began to use the terminology of
information infrastructure. The maturity of state government pricing and access policies
and the guiding efforts provided by the national coordination body, the Australian New
Zealand Land Information Council (ANZLIC), saw a very positive period of consolidation
and direction setting by the state agencies. The early 2000s saw the first real efforts by
state agencies to facilitate community access to previously internal data products, albeit
very cautiously. The provision of public access to state government data highlighted a
number of deficiencies in existing data maintenance processes and the institutional
arrangements that were in place.
The fundamental importance of establishing a single authoritative data base or index of
property information was recognised by state government jurisdictions as a priority
(Jacoby et al. 2002; QSIIS Information Office 2000). However, historical bureaucratic
structures needed to be re-engineered and relationships with other state agencies and
jurisdictions such as local government needed to be rebuilt. Inter- and intra-jurisdictional
partnerships began to emerge as a mechanism to build and sustain spatial data sharing and
support the state SDIs (Grant & Williamson 2003).
As the state SDIs began to develop, some state jurisdictions encouraged the private sector
to retail and add value to spatial data through licensing agreements which protected the
original investment of the government. The private sector also began to participate in
activities such as data capture which could be achieved more efficiently than government.
This enabled governments to focus their diminishing resources on more strategic activities
(Grant & Williamson 2003).
2.2.5 National Spatial Information Developments
The Australian Federal Government pursues a number of strategic and operational
initiatives with respect to land and property information on a national level. The federal
government also holds and manages commonwealth land, pertaining to a variety of
national government operations including defence, telecommunications, post, airports and
resource management. Some of these services such as telecommunications and airports
have progressively been fully or partially privatised in recent years.
Chapter 2 – Spatial Data and SDI in Context
25
In the 1970s, two main operational federal government surveying and mapping agencies
existed: the Australian Survey Office and the Division of National Mapping. The task of
the Division of National Mapping was to support national development of Australia
through a comprehensive national mapping program at 1:250,000 scale and later at
1:100,000 and 1:50,000 scales in cooperation with the state governments. In 1987, the
two agencies were merged to form the Australian Surveying and Land Information Group
(AUSLIG). In September 2001, AUSLIG was replaced by the National Mapping Division
(NMD) within Geoscience Australia. Like its state counterparts, AUSLIG experienced a
gradual process of downsizing and outsourced a number of operational functions,
particularly the traditional survey processes. AUSLIG was one of the first Commonwealth
Government agencies directed to move to a cost recovery model through the sale of digital
topographic mapping (Hart 1991).
The coordination of state land information efforts was recognised as a critical activity and
in 1986, the Australian Land Information Council (ALIC) was formed. The council was
renamed to the Australian New Zealand Land Information Council (ANZLIC) in 1991
after New Zealand, which was represented on the council from 1987, became a full
member (ANZLIC 2005). Although the language and terminology which describe
ANZLIC’s activities have changed, it is clear from its objectives that ANZLIC was
developing the Australian Spatial Data Infrastructure (Clarke et al. 2003). Since 2005,
ANZLIC has been referred to as the Spatial Information Council to better reflect its current
mission and vision.
The Council comprises representatives from each of the state and territory leading spatial
data agencies and the federal government spatial information agency, Geosciences
Australia. It also has strategic linkages with a number of committees and associations
including the Australian Emergency Management Committee, Natural Resource
Management Ministerial Committee and the Australian Local Government Association.
ANZLIC has two Standing Committees, one on SDI and the other on Land Administration
(See Figure 2.1). There is also an Intergovernmental Committee on Surveying and
Mapping (ICSM) which is responsible for the development of national geodetic,
topographic and cadastral standards.
ANZLIC has worked effectively as a national coordination body for the development of
standards and policy, however with the declining operational capacity of the national
mapping agency and the growing demand for national spatial data sets, it realised that
other interventions were required (Clarke et al. 2003). In 1993, the Public Sector Mapping
Agencies Australia (PSMA) was formed as an unincorporated joint venture between the

A Local-State Spatial Data Sharing Partnership Model to Facilitate SDI Development
26
nine state and federal mapping agencies. In 2001, after consideration of the growth and
operation of the PSMA consortium, the public company PSMA Australia Limited was
established.
Figure 2.1 ANZLIC committee structure (ANZLIC 2005)
The achievements of the PSMA, initially through ANZLIC, and now in its own right have
been significant and include the compilation of national data sets including topographic
mapping, cadastral land parcels (CADLite), transportation, administrative boundaries and
the Geocoded National Address File (G-NAF). Two of these national data sets are of
particular interest to this research, namely the cadastral land parcels data set, but especially
the geocoded national address file which relies heavily on the capture and exchange of
information between local and state governments.
The planning for a national geocoded address file began in 1995. After a pilot study in
1996, cost estimates were compiled to extend the work to a national level. Further
feasibility studies and testing identified the need for a national address file and a national
standard for street addressing (Paull 2003). The national street address standards were
completed in 2003, PSMA put the G-NAF project to tender in mid 2003, and the first
version of G-NAF was completed in 2004. G-NAF is Australia’s first authoritative
geocoded address index for the whole country, listing all valid physical addresses in
Australia (PSMA 2005). It contains approximately 12.6 million physical addresses, each
linked to an unique geocoded address.

Chapter 2 – Spatial Data and SDI in Context
27
2.2.6 Property Information as a Fundamental Dataset
The development of spatial data infrastructures over the past decade or more has led to
discussion of which fundamental data sets should be given priority for development.
Australia, like many other countries, has assessed its spatial data holdings and priorities
from a number of perspectives to identify where limited resources should be devoted.
ANZLIC, the national co-ordinating body for SDI, defined fundamental datasets as
“datasets which are collected as primary data sources, and from which other information
is derived by integration or value-adding” (ANZLIC 1996, p. 11). It also noted that in
deciding on the fundamental datasets from a national perspective, two key issues for
consideration should be (i) the identification and prioritisation of datasets and, (ii) the
production and integration of these datasets.
The role of a national coordinating body such as ANZLIC is to facilitate the development
of the Australian Spatial Data Infrastructure by development of policies, standards and
institutional frameworks which promote a national approach to SDI development.
However, the national priority of fundamental data sets is often different to the priorities of
state and local government. State government agencies through the process of building
their state level SDIs have assessed their own priority of datasets.
In 1992, the State Government of Victoria commissioned a consultant to develop a
strategic framework for GIS development in the state. The study, which took over 18
months to complete, assessed 61 information products comprising up to 270 datasets
(Jacoby et al. 2002). One output of the study was the assessment of the State’s datasets
against a number of criteria, including their frequency of use and potential contribution to
downstream benefits. By virtually all measures, the digital cadastral mapbase and the
associated property information was identified as the highest priority.
In 2002, the Queensland Spatial Information Infrastructure Council (QSIIC) commissioned
a study to identify the spatial information priorities for the State of Queensland.
Qualitative interviews were conducted with 22 organisations with emphasis on “non-
traditional” users of spatial information (McDonnell-Phillips Pty. Ltd. 2002). The report
identified that the most commonly used datasets were the road network, the street address,
the cadastral lot (land parcel), and the Australian Standard Geographic Classification
boundaries (census districts, administration boundaries). In each of these states, property
related information including the digital cadastral mapbase and street address were
identified as being key priorities in building the spatial information infrastructure for the
state.

A Local-State Spatial Data Sharing Partnership Model to Facilitate SDI Development
28
2.2.7 Emergence of Property Information Partnership s
The development of the digital cadastral data bases (DCDBs) by most Australian states
during the 1980s and 1990s facilitated the widespread adoption by local governments and
utility companies of GIS for property management. The DCDBs represent a digital view
of the individual land parcels which form the basis of property ownership in Australia.
Typically, the land parcel is the smallest land unit capable of title registration and transfer
through the state land administration systems. These land parcels are usually very
accurately defined by cadastral surveying processes, and subsequent titles are registered
through the Torrens System of land titling.
In Australia, a property is usually described as land that is under common occupation for
the purposes of rating, billing or habitation (Jacoby et al. 2002). Therefore, properties are
used as key identifier by local governments, postal services, utilities (water, gas, electricity
and telephone) and electoral authorities. It is also the property, rather than the land parcel,
that is allocated a corresponding street address. Although there is a strong correlation
between parcels and properties, it is not simply a one-to-one correspondence. In urban
areas, approximately 75% of land parcels also comprise of a single detached dwelling
(house) which provides a one-to-one correspondence. However, in other cases, for
example, in an apartment block or shopping complex, the relationship is one land parcel to
many properties. The reverse can also occur, such as in rural areas where one property
may be comprised of many land parcels. Figure 2.2 provides a graphical depiction of the
relationship between land parcels, properties and street address.
Figure 2.2 Relationship between land parcel, property and street address
The management of land administration and titling is a state government responsibility
which includes the mapping of land parcels. The management of the property and address
datasets are primarily the responsibility of local government. In Australia, both local and
Bridge Road 14 12 18 20 22
Lot
27 Lot
28 Lot
29 Lot
30 Lot
31 Lot
32
Street Address
Property
Parcel/Plan
DP156743 DP156743

Chapter 2 – Spatial Data and SDI in Context
29
state governments have continued to duplicate the capture of some of these datasets in
order to undertake their business activities. The resultant duplication in the collection and
maintenance of this data by both jurisdictions is costly, inefficient and creates significant
data quality issues. The issue of accurate property and street address information in
particular, was elevated in priority as services such as police, ambulance and fire services
began to question the quality and currency of their databases.
To rectify this deficiency, a co-operative approach was required to integrate the data from
both state and local governments. In the late 1990s, state governments around Australia
began to investigate mechanisms to build more accurate and authoritative databases and
reduce duplication. Data sharing partnerships emerged as the preferred model to reduce
inefficiencies and improve the quality of the property related datasets.
2.2.8 Summary
The review of land and property information developments in Australia has identified
activities at three levels of government. The development of land and geographic
information systems at the local government level has been innovative and concentrated on
improving the delivery of services to the community. The majority (80%) of local
government activities relate to land and property related data. Their heavy reliance on
spatial data is evidenced by the rapid diffusion of GIS technology through the local
government sector. LGAs rely on the provision of some data sets from state governments,
and the early cost recovery approaches caused rifts between local and state levels. Local
government is an efficient and business driven user of land and spatial information.
The state government land and property information system developments have focussed
on traditional land administration functions and the integration of the often disparate
functions across the state government. The development of the digital cadastral data bases
in each state was a key achievement of the state governments and these data have
continued to be a focal point of inter-jurisdictional exchange. Although the state
government data sets were relatively mature, it was only in recent years that efforts to
provide community access have occurred. National initiatives in land and property related
information have mainly been directed towards coordination of state and territory activities
through the development of national policies and standards. The establishment of
ANZLIC has been instrumental in a coordinated national approach to SDI and the
development of national data sets such as G-NAF and CadLite. Finally, it was described
how data sharing partnerships emerged in the mid 1990s as the preferred model for the
exchange of property related information.

A Local-State Spatial Data Sharing Partnership Model to Facilitate SDI Development
30
2.3 From Data to Information Infrastructures
2.3.1 Introduction
This section of the chapter examines the concept of information infrastructures. In the first
instance the context of information will be examined with respect to other terminology
such as data, knowledge and wisdom. The development of the term information
infrastructure is discussed and the growing importance of information to society and its
operation is identified.
2.3.2 From Data to Wisdom
The distinction between what is considered to be data, information, knowledge and
wisdom is not always black and white and might better be viewed as a continuum. Data is
considered to be the facts created through research, gathering or discovery (Clarke 2004a).
Information on the other hand has context. Data is turned into information by organising
and integrating it to enable conclusions and decisions to be made (Ackoff 1989).
Knowledge is built from experience, but there is no guarantee that knowledge can be
transferred, and it is not static like information. Wisdom is seen to be at the higher end of
the spectrum of understanding (see Figure 2.3) and brings with it a personal context that is
not easily transferable.
Figure 2.3 Data, information, knowledge and wisdom (Clarke 2004a)
As illustrated in Figure 2.3, data and information deal with the past. They are based on the
gathering of facts and adding context. On the other hand knowledge can be considered to
deal with the present, whilst wisdom may be seen as combination of past experience and
the ability to apply understanding to the future. In the context of the classic information
pyramid popularised by Ackoff, data is considered most prolific, being at the base of the

Chapter 2 – Spatial Data and SDI in Context
31
pyramid, whilst wisdom is far less common as it distils understanding from data,
information and knowledge.
2.3.3 Information as an Infrastructure
The consideration of information as an infrastructure began to take form in the late 1980s
and was somewhat pushed to the fore when, in September 1993, the Clinton
administration released a statement elaborating its National Information Infrastructure
(NII) agenda (Executive Office of the President 1993). Its objectives were to:
a) promote private sector investment;
b) extend the concept of “universal service”;
c) promote seamless user interaction;
d) improve the management of radio frequencies;
e) act as a catalyst to promote technical innovation;
f) protect intellectual property rights;
g) coordinate the other levels of government; and
h) provide access to government information.
The term information infrastructure refers to the communications networks and associated
software that support interaction among people and organisations (Clarke 2004b). The
Internet was a primary driver for the recognition of information as an infrastructure. An
information infrastructure is considered to encompass the present information networks
(including the Internet, and the underlying long-distance and short-distance
communications technologies) and likely future facilities (Clarke 2004b). A useful
definition of infrastructure in the context of information is given by McGarty as “a
shareable, common, enabling, enduring resource that has scale in its design, is sustainable
by an existing market, and is the physical embodiment of an underlying architecture”
(McGarty 1996,p. 235). The definition recognises that information is not only sharable but
has both enduring and enabling characteristics.
The term global information infrastructure gained popularity, particularly in the USA, as it
was seen to more adequately describe the global inter-connectedness of the information
network. From 1994-1996, the U.S. Advisory Council on National Information
Infrastructure developed principles, policies and recommendations for the development of
the ‘information superhighway’.
The advisory council identified that there were six main elements to a National
Information Infrastructure, namely:

A Local-State Spatial Data Sharing Partnership Model to Facilitate SDI Development
32
a) people;
b) information content;
c) hardware and other physical components;
d) software and other electronic information delivery platforms;
e) standards, codes, regulations, and other policies; and
f) financial resources. (Carbo 1997)
These elements are similar to those conceived for spatial data infrastructures which will be
discussed in more detail later in this chapter.
Other countries around the world were also considering their position on the impact of the
internet, and by the mid 1990s, the governments of a number of developed countries had
articulated their strategies including: The Information Society: Agenda for Action in the
UK (House of Lords 1996), Building the Information Society: Moving Canada into the
21st Century (Government of Canada 1996), Europe and the Global Information Society –
The Bangemann Report (Bangemann 1994) and Networking Australia’s Future (DCITA
1995).
The foci of most of these initiatives were to highlight the importance of the physical
infrastructure, identify and establish policies to make government information more
accessible, recognise issues of security, privacy and copyright and to establish an action
agenda to build this infrastructure. Importantly, most of the initiatives recognised that the
information infrastructure was more than just the physical elements and included data,
education, support, policies and legal frameworks.
2.3.4 Growing Importance of Information in Society
The world has become far more consumer driven and information is a commodity that
society is consuming at an ever increasing rate. However, information is significantly
different to other commodities. It can be replicated at almost no cost so an individual
could in theory consume society’s entire information output (Dyson et al. 1995).
Information now supports a growing number of activities in our society including the
financial markets, day to day business transactions, shopping, transport, education,
resource management, environmental monitoring and public health.
Increasingly, information has become both strategic and critical. Governments and
industry rely on access to timely and accurate information for decision making and
strategic planning. In the wake of recent terrorist threats, access and availability of
information on government buildings, power stations, hospitals and water supply is being

Chapter 2 – Spatial Data and SDI in Context
33
reassessed. However, the benefit of information to the community in times of natural
disasters and emergencies has neutralised the urge by governments and agencies to restrict
the access to this information.
Information has many dimensions and perspectives in society including the concepts of
ownership and rights which are embodied in various forms of law and policy on
intellectual property, copyright and privacy. These concepts are increasingly important as
society begins to develop its information infrastructures. Clear and enforceable ownership
rights are essential for markets to operate (Dyson et al. 1995), and in the context of
information this provides a challenge for governments to define and identify the value of
information to business and society in general.
2.3.5 Summary
This section has positioned information in the context of data, knowledge, wisdom and
understanding. Worldwide trends in the recognition of the importance of information and
the infrastructures that facilitate its access and use are clear evidence of the value that is
placed on this often intangible resource. Globally, the development of national
information policies and strategies led to the re-appraisal of the value of information to
society. The next section of this chapter will investigate the spatial dimension of these
information infrastructures and trace their evolution, components and dimensions.
2.4 Spatial Data Infrastructures
2.4.1 Evolution of Spatial Data Infrastructures
The evolution of the spatial or geographic data infrastructure concept can be traced back to
the late 1980s when discussion on information infrastructures and the information
superhighway was occurring. In 1987, The British Government Committee of Enquiry on
the Handling of Geographic Information, chaired by Lord Chorley, identified the advent of
GIS as ‘the biggest step forward in handling geographic information since the invention of
the map” (Cited in Masser 2005, p. 3). Although the recommendations by the Chorley
Report, including the establishment of an independent geographic information
management agency were rejected, it set the scene for subsequent discussion on SDIs in
the UK, including the formation of the Association of Geographic Information (AGI) in
1989 and the National Geospatial Data Framework initiated in 1996 (Masser 2005).
In the United States, the concept of a National SDI initially began in the academic
communities around 1989 (Tosta 1999), and soon after in government with the formation
of the Federal Geographic Data Committee (FGDC) in 1990 by the Office of Management

A Local-State Spatial Data Sharing Partnership Model to Facilitate SDI Development
34
and Budget. During the early 1990s, the FGDC developed coordination strategies,
standards and best practice with the objective of building “a national digital spatial data
resource” (Reichardt & Moeller 2000). A major study by the National Research Council
in early 1990 further supported the development of a National Spatial Data Infrastructure
(National Research Council 1993). The NII agenda proposed by the Clinton/Gore
administration in 1993 was followed by the issuing of Executive Order 12096 in April
1994, which called for:
a) the establishment of a National Spatial Data Infrastructure as a key component of
the National Information Infrastructure;
b) the development and use of a National Geospatial Data Clearinghouse;
c) use of a national distributed framework of data for registering and referencing
other themes of geospatial data; and
d) FGDC-endorsed standards for data content, classification and management for use
by Federal government and available to all other geospatial data producers and
users. (Reichardt & Moeller 2000)
In Canada, the Canadian Council on Geomatics requested that Geoplan Consultants
prepare a plan for an integrated spatial data model for the country in 1995 (Masser 2005).
This resulted in the recommendation by the Council to ask the federal Inter-Agency
Committee on Geomatics to guide the creation of the Canadian Geospatial Data
Infrastructure in late 1996 and the establishment of the government funded
GeoConnections in 1999.
In Europe, the European Umbrella Organisation for Geographic Information (EUROGI)
was set up in November 1993, as a result of a study commissioned by the Directorate-
General, Information Society and Media of the European Commission to develop a unified
European approach to the use of geographic technologies (EUROGI 2005). The activities
of EUROGI are financed by the member countries which contribute to the total budget for
the annual work plan in a challenging organisational, political, legal and technological
environment. In 2002, the Commission began preparing an initiative to stimulate the
availability of geographic information, INSPIRE (INfrastructure for SPatial InfoRmation
in Europe).
In Australia in the early 1990s, a number of state government agencies promoted the
proposition that land and spatial information should be considered as an infrastructure
(Davies & Lyons 1991; Kelly 1993). Australian efforts towards a National Spatial Data
Infrastructure were promoted by ANZLIC in 1996, through a position paper on “Spatial

Chapter 2 – Spatial Data and SDI in Context
35
Data Infrastructure for Australia and New Zealand” (ANZLIC 1996). Coordination efforts
by ANZLIC activated this vision through the development of policy, standards and
metadata toolkits.
The parallel development of different countries’ national information infrastructures and
the national spatial information infrastructures are shown in Table 2.1. This table
illustrates that most of the national spatial data infrastructure initiatives closely followed
the national information infrastructure initiatives or were occurring around a similar
timeframe. Although most of these initiatives have been in existence for only a decade,
many have already made substantial progress towards national data sets and
clearinghouses.
Table 2.1 Development parallels between NIIs and NSDIs
Country/Region National Information Infrastructure (NII) National Spatial Data Infrastructure (NSDI)
United States The National Information Infrastructure (NII) agenda, 1993
Federal Geographic Data Committee (FGDC) in 1990, NSDI as part of EO 12096 in 1994
United Kingdom Information Society: Agenda for Action in the UK (House of Lords 1996)
Chorley Report, 1987, British National Geospatial Data Framework (1996)
Europe Europe and the global information society – The Bangemann Report, 1993
EUROGI, 1993 and INSPIRE 2002
Canada Building the Information Society: Moving Canada into the 21st Century (1996)
Canadian Geospatial Data Infrastructure recommendation in 1996 and formation of GeoConnections in 1999
Australia Networking Australia’s Future (DCITA 1995)
ANZLIC’s position paper on ASDI, 1996
SDI developments are now occurring in over half of the countries around the world and
have resulted in a variety of initiatives, models and progress (Rajabifard et al. 2003).
2.4.2 SDI Diffusion, Generations and Models
As with the diffusion of geographic information technology, SDIs continue to evolve and
change form. Masser (1999) identified those countries which were the early adopters of
the SDI concept as the first generation of national spatial data infrastructures. The author
examined these early adopters in terms of the driving force behind the initiatives and their
main characteristics. He identified two basic drivers, namely:
a) The growing importance of geographic information in the coming age of digital
technology, and
b) The need for some form of government intervention to coordinate data acquisition
and availability.
Masser’s first driver agrees with the findings of the previous discussion on information
infrastructures which identified the importance of information technology to society

A Local-State Spatial Data Sharing Partnership Model to Facilitate SDI Development
36
generally. The second driver, namely the need for coordination, continues to be a critical
component of any inter-jurisdictional initiative.
Countries that developed the first generation of SDIs had a limited knowledge about the
different dimensions and issues relating to the SDI concept (Rajabifard et al. 2006). The
major objectives of these initiatives were to promote economic development, to stimulate
better government and to foster environmental sustainability (Masser 1998b). Masser
(1999) also argues that the second generation of SDIs will see the restructure of existing
SDI frameworks within existing countries and the emergence of new frameworks as other
countries begin to develop their own SDI frameworks.
Crompvoets et al. (2004) characterise the second generation of SDIs by the change in
focus of some of the early adopters (Australia, Canada and USA) including the updating of
strategies and conceptual models. These authors believe that the second generation of SDI
developments, commencing around 2000, fall into two groups: those first generation
countries that are gradually updating and modifying their initiative and those countries that
that have recently decided to design and develop their SDI.
The generational developments of SDI may also be examined from the context of either a
product based model versus a process-based model (Rajabifard et al. 2002; Williamson et
al. 2003). Figure 2.4 illustrates the concept of these two models.
Figure 2.4 Product-based and processed-based SDI models (Rajabifard et al. 2002)
The product-based model represents a key aim of SDI initiatives, namely to link the
existing and upcoming databases of the respective political/administrative levels of the
community as illustrated in part A of Figure 2.4 (Rajabifard et al. 2002). The first
generation of SDIs focussed on the delivery or generation of a product, particularly to
justify early efforts and resourcing.

Chapter 2 – Spatial Data and SDI in Context
37
The process-based model represents another important objective of SDI development,
namely to define a framework to facilitate the management of information assets
(Rajabifard et al. 2002). The second generation of SDIs are more process-based and are
distinguished by their leverage of experiences, expertise, social capital of SDI
development and development of clearinghouse systems with the use of the data and the
users driving the development (Crompvoets et al. 2004).
2.4.3 Definition and Components of SDI
Like the national information infrastructure visions espoused by governments in the early
to mid 1990s, SDI has developed in all shapes and sizes (Masser 1999). SDI is viewed
differently by different stakeholders. Not only do the views of the various sectors
(academia, government, business) vary, but the levels of government hold different views
and perspectives. Rajabifard & Williamson (2001) examined the definitions of SDI from
three key agencies, namely Australian and New Zealand Land Information Council
(ANZLIC), the Federal Geographic Data Committee (FGDC) and the Dutch Council for
Real Estate Information (Ravi). Although these definitions have some commonalities,
they illustrate the differing understanding of SDI. The result is a degree of fragmentation
in SDI as each organisation pursues differing goals. Table 2.2 illustrates the range of SDI
definitions and perspectives.
Table 2.2 Differing perspectives of SDI
Source SDI Definition
Brand (1998) A Global Spatial Data Infrastructure is one that encompasses the policies, organisational remits, data technologies, standards, delivery mechanisms and financial and human resources necessary to ensure that those working at the global or regional scale are not impeded in meeting their objectives.
ANZLIC (1998) The Australian Spatial Data Infrastructure comprises a distributed network of databases, linked by common policies, standards and protocols to ensure compatibility.
Coleman and McLaughlin (1998)
A Global Geospatial Data Infrastructure encompasses the policies, technologies, standards and human resources necessary for the effective collection, management, access, delivery and utilization of geospatial data in a global community.
Executive Office of the President (1994)
The Executive Order defines the NSDI in the following terms: National Spatial Data Infrastructure (NSDI) means the technology, policies, standards and human resources necessary to acquire, process, store, distribute, and improve the utilization of geospatial data.
Groot (2000) SDI encompasses the networked geospatial databases and data handling facilities, the complex of institutional, organisational, technological, human and economic resources which interact with one another and underpin the design, implementation and maintenance of mechanisms facilitating the sharing, access to, and responsible use of geospatial data at an affordable cost for a specific application domain or enterprise.
Rajabifard & Williamson (2001)
Viewing the core components of SDI as policy, access network, technical standards, people (including partnerships) and data, different categories can be formed based on the different nature of their interactions within the SDI framework.

A Local-State Spatial Data Sharing Partnership Model to Facilitate SDI Development
38
Table 2.2 illustrates that most of the definitions emphasise the core elements that comprise
a SDI include data, people, access mechanisms, standards and policies. In addition
Rajabifard and Williamson (2001) and Groot (2000) emphasise the need for data sharing
and partnerships.
2.4.4 SDI Components
The elements that comprise an information infrastructure, as identified by Carbo (1997) in
section 2.4.3, parallel those put forward by various authors in Table 2.2. The key SDI
components of data, people, policy framework, standards and access/distribution
technology are summarised in Table 2.3.
Table 2.3 Components of SDI (after Warnest 2005)
DATA Fundamental datasets are themes of spatial information regarded as primary in supporting the key functions of a country or jurisdiction, providing the common spatial reference and context which underpins many other forms of business information. An individual agency may consider fundamental data in terms of the most important strategic spatial information that supports its business functions and processes. Themes commonly considered fundamental can include geodetic control, cadastre, administrative boundaries, geographic names and localities, street address, transportation, elevation, hydrology and orthophoto imagery. The list is not definitive and is dependent on the priorities of the responsible agency within each jurisdiction.
PEOPLE Includes the users, providers, administrators and custodians of spatial data and also value-added re-sellers. Users can be corporate, small or large business or individuals, public or private. The broad application of SDI beyond the traditional mapping and land administration role means users and administrators of spatial information have very different qualifications and professional backgrounds.
INSTITUTIONAL FRAMEWORK/ POLICY
Includes the administration, coordination, policy and legislation components of an SDI. The institutional framework is reliant on successful partnerships and communication between agencies within and between jurisdictions.
STANDARDS Consistent standards and policy are required to enable the sharing, integration and distribution of spatial data; hence standards for data models, metadata, transfer and interoperability of storage and analysis software. Policy particularly needs to be consistent for the pricing and access to spatial data within and between jurisdictions.
ACCESS AND DISTRIBUTION TECHNOLOGY
Consists of the access and distribution networks, clearinghouse and other means for getting the spatial information or datasets to the users. Technology also involves the acquisition, storage, integration, maintenance, and enhancement of spatial data.
These SDI components and their inter-relationships may be viewed in a number of ways.
Rajabifard and Williamson (2001) suggest that the fundamental interaction between people
and data is governed by the dynamic technological components of SDI, namely the access
network, policy and standards (see Figure 2.5).
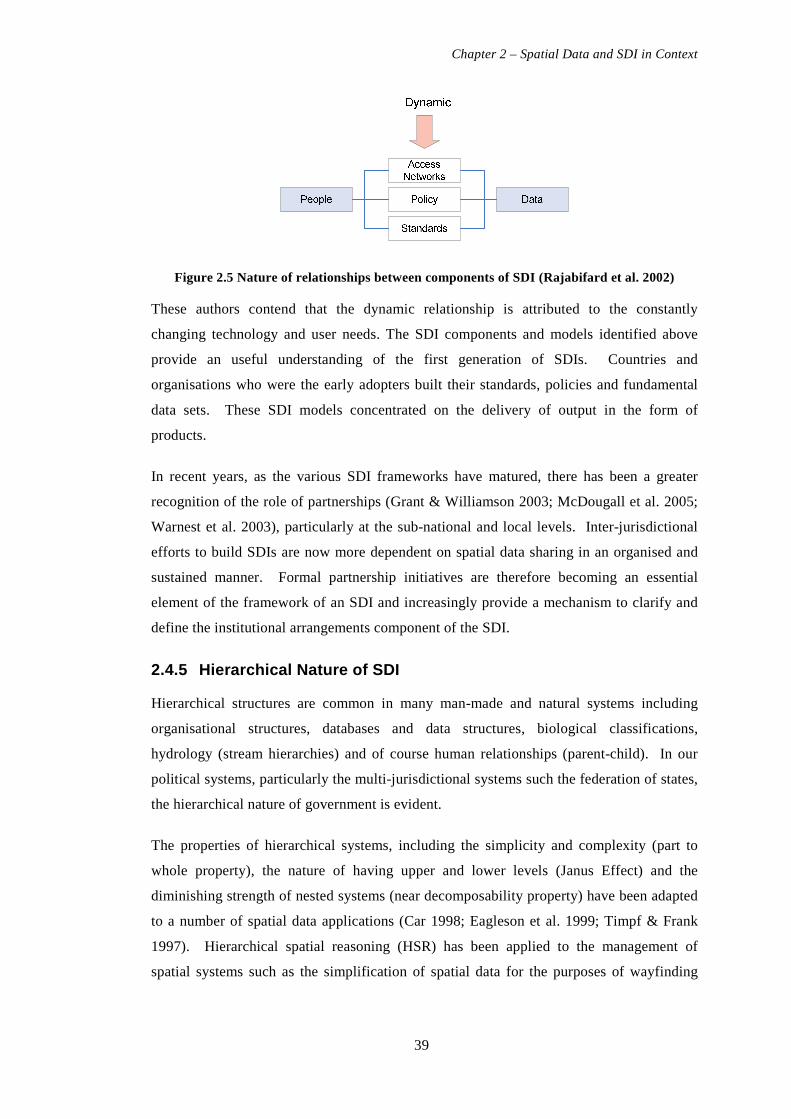
Chapter 2 – Spatial Data and SDI in Context
39
Figure 2.5 Nature of relationships between components of SDI (Rajabifard et al. 2002)
These authors contend that the dynamic relationship is attributed to the constantly
changing technology and user needs. The SDI components and models identified above
provide an useful understanding of the first generation of SDIs. Countries and
organisations who were the early adopters built their standards, policies and fundamental
data sets. These SDI models concentrated on the delivery of output in the form of
products.
In recent years, as the various SDI frameworks have matured, there has been a greater
recognition of the role of partnerships (Grant & Williamson 2003; McDougall et al. 2005;
Warnest et al. 2003), particularly at the sub-national and local levels. Inter-jurisdictional
efforts to build SDIs are now more dependent on spatial data sharing in an organised and
sustained manner. Formal partnership initiatives are therefore becoming an essential
element of the framework of an SDI and increasingly provide a mechanism to clarify and
define the institutional arrangements component of the SDI.
2.4.5 Hierarchical Nature of SDI
Hierarchical structures are common in many man-made and natural systems including
organisational structures, databases and data structures, biological classifications,
hydrology (stream hierarchies) and of course human relationships (parent-child). In our
political systems, particularly the multi-jurisdictional systems such the federation of states,
the hierarchical nature of government is evident.
The properties of hierarchical systems, including the simplicity and complexity (part to
whole property), the nature of having upper and lower levels (Janus Effect) and the
diminishing strength of nested systems (near decomposability property) have been adapted
to a number of spatial data applications (Car 1998; Eagleson et al. 1999; Timpf & Frank
1997). Hierarchical spatial reasoning (HSR) has been applied to the management of
spatial systems such as the simplification of spatial data for the purposes of wayfinding

A Local-State Spatial Data Sharing Partnership Model to Facilitate SDI Development
40
(Car 1998), understanding human cognitive processes (Timpf & Frank 1997) and the
aggregation and interpolation of administrative boundaries (Eagleson et al. 1999).
From a SDI perspective the parallels with political and administrative systems can be seen
in the SDI development (Chan & Williamson 1999). Rajabifard et al. (2000) proposed that
these hierarchical systems of SDIs should be viewed from two perspectives: an umbrella
view from the global level looking down and a building block view where each level of
development supports the higher levels of development.
Figure 2.6 Hierachical nature of SDI (Rajabifard et al. 2002)
A useful perspective with respect to this research is the authors’ view of the relationship
between the different levels of SDI from the corporate to the global level and the
corresponding level of data detail. In particular, the linkage and relationship of the data
flows as illustrated in Figure 2.6. Sub-national SDIs rely on collecting detailed
information from the local level to support the delivery of state government services and to
support state planning.
However, although the properties of hierarchical systems might be essential for the
development of a consistent database or data structure, the absence of a strict hierarchical
structure does not necessarily inhibit SDI development and implementation (Masser 2005).
For example national bodies such as FGDC work directly with local governments without
reference to the state level.
2.4.6 Sub-National SDI and the Private Sector
As described earlier, the first generation of SDI initiatives progressed through national
government agencies by a process of policy and standards development. However, the
focus in recent years has moved from the national to sub-national levels involving state
and local governments. This section will briefly highlight some of the issues and progress
in this area of SDI development.
Global SDI
Regional SDI
National SDI
State SDI
Local SDI
Less detailed data
Global Planning
Regional Planning
National Planning
State Planning
Local Planning
More detailed

Chapter 2 – Spatial Data and SDI in Context
41
In the United States, the complexity of building the sub-national framework data cannot be
under-stated. Co-ordination efforts must encompass many federal agencies, the 50 states,
the private sector and the numerous counties, municipalities, townships and special
purpose districts. In the 2002 Census of Governments, there were over 87,000 local
government units identified in the USA (US Census Bureau 2002). These local
government agencies spend significantly more on geographic information related activities
than US Federal Government agencies (Harvey et al. 1999). Individual state co-ordination
bodies have generally shouldered the majority of the SDI coordination responsibilities,
although individual groups of local authorities have also initiated collaborative efforts. In
addition, the FGDC has encouraged the development of SDIs at sub-national levels
through partnerships and collaboration.
A report on the state wide leadership and coordination of geographic information
sponsored by the National States Geographic Information Council identified that as of
2001, 46 of the 50 US states had geographic information co-ordinators (Warnecke et al.
2003). Although the existence of coordinators can be considered an important component
of the institutionalisation of spatial infrastructure activities, it does not guarantee that
coordination activities will be resourced and activated. Harvey and Tulloch (2006) have
identified that although local government is a key adopter of GIS, it has not necessarily
adopted the SDI concepts and strategies of the first generation of national and state SDI
initiatives.
In Australia, state governments play a significant role in policy development and the
building and managing of spatial data infrastructures. Each of the Australian states and
territories has established a coordination agency or group to reflect each of their mandates
and state goals with respect to spatial data infrastructures. The state government agencies
are active in pursuing SDI development with most activity generally focussed on
delivering product outcomes. Each state has an overarching policy to facilitate SDI
development which usually includes encouraging the active participation of the private
sector in their SDI vision.
Many of the state government activities are project based. A significant number of project
activities focus on proto-typing of infrastructure developments, capacity building,
information access and partnering arrangements (Grant & Williamson 2003). In most
states the interface between state and local government has been identified as an important
linkage in achieving the vision and goals of the government. Most of these state SDI co-
ordinating bodies have emerged from within the previous “Land Mapping Agencies” and

A Local-State Spatial Data Sharing Partnership Model to Facilitate SDI Development
42
continue to have a strong focus on their core jurisdictional responsibilities relating to
cadastral land management and land administration (Warnest 2005).
In countries such as Australia, Canada, the USA and Germany which are organised
federally, the state or provincial level may actually perform more core mapping activities
than their central mapping agency counterpart (Rhind 1997). By contrast in non-federated
countries, central government maintains the primary responsibility for national mapping as
observed in France, Russia, India, Sweden and the United Kingdom.
Like their national counterparts, sub-national governments are increasingly outsourcing
their traditional data capture and management activities to the private sector. In Canada,
the Alberta Environment Protection outsourced the updating, storing and distribution of its
digital map base by establishing a new company, Spatial Data Warehouse (SDW). The
not-for-profit company, owned by a consortium comprised of different levels of
government and the utility sector, underestimated the efforts required to maintain the data
sets, and in 1998 set up a joint venture arrangement with a private sector firm to manage
the data (Masser 2005).
The private sector’s role in SDI development in Australia is ongoing. Initially, the private
sector’s involvement began in the mid 1990s as a data collector when government mapping
services were outsourced. Progressively private businesses are now specialising not only
in the collection but also in the on-going maintenance of government databases. More
recently however, the private sector involvement has included marketing and value-adding.
This engagement has brought with it challenges for government to balance their control of
their information investments with the need to encourage spatial business opportunities
(Grant & Williamson 2003).
2.4.7 Building SDIs and the Role of Partnerships
From a national perspective the development of coordinating bodies and associated
policies was important, however the real complexity of SDI development is in their
construction. The application of the key principles of SDI development within varying
political, institutional, economic and social environments has presented significant
challenges for SDI implementers. These challenges have included factors such as lack of
awareness, cultural diversity, differences in administrative systems, geographic variations
and differing responsibilities (Rajabifard et al. 2003).
Partnerships are critical to the development of SDIs and can be both inter-jurisdictional
and intra-jurisdictional (Grant & Williamson 2003). Inter-jurisdictional partnerships

Chapter 2 – Spatial Data and SDI in Context
43
primarily occur between agencies in levels of government such as local-state, state-
national. Intra-jurisdictional partnerships involve any parties at the same level of
government that share a common goal of creating, maintaining, utilising and distributing
spatial information for the delivery of government services. They have emerged as
structures which facilitate the interactions required to share information and hence to build
SDIs. While much of the focus of partnerships for SDI development continues to be in
government, the complete vision of SDI development will only be realised through the
cooperation and collaboration between the public and private sectors (Grant & Williamson
2003).
Significant efforts have been made to promote the development of partnerships through the
identification of their role (Lambert & Garie 1999; National Research Council 2001) and
the publication of best practice guidelines and success stories (Johnson et al. 2001;
National Research Council 1994). Partnerships will be explored in further detail in chapter
3.
2.4.8 Summary
SDI development is now part of government and private sector activities in over half the
countries around the world. SDI development has moved from national levels and policy
making to sub-national levels where the focus is the generation of products. Different
models to represent SDI have emerged which reflect the differing goals of SDI developers
around the world. SDI development may also mirror the underlying hierarchical
jurisdictional structures, although it is expected that hierarchical models can over simplify
the underlying political and institutional complexities. The critical role of partnerships in
facilitating SDI development was also identified.
2.5 Spatial Data Sharing Sharing of spatial data is critical to the development of comprehensive and inclusive SDIs.
Sharing of data is more often about people and organisations than the data itself. The little
rhyme taught to children that “sharing is caring” is not so much about the dispute over the
toy, but more about learning to interact with others. This section of the chapter will
examine the motivations, barriers, frameworks and experiences in sharing spatial data.
2.5.1 Data Sharing Perceptions – What is Data Shari ng?
Sharing can mean different things to different people. The Oxford Thesaurus associates
the word “shared” with terms such as “reciprocal, reciprocated, common, joint, a

A Local-State Spatial Data Sharing Partnership Model to Facilitate SDI Development
44
cooperative effort collaborative, collective, combined, mutual, united, concerted,
coordinated” (Oxford Reference Online 2006).
Calkins and Weatherbe (1995, p. 66) defined spatial data sharing as “the (normally)
electronic transfer of spatial data/information between two or more organisational units
where there is an independence between the holder of the data and the prospective user”.
The authors further explain that this transaction could be routine or non-routine, may be
internal or external to the organisation, but importantly it is an “arm’s-length exchange or
transfer”.
2.5.2 Why Share Data?
It would seems quite wasteful that publicly funded organisations cannot readily co-operate
to share resources or information (Onsrud & Rushton 1995a). However, the reality is that
it is easier for individual public sector agencies to work within their sphere of influence
than outside of it. Historical bureaucratic structures carry with them a significant
“organisational inertia” which is reinforced by departmental silo structures, traditional
public service systems and an increasingly complex legislative framework that is difficult
to change.
The reason to share spatial information was clearly summarised by the Mapping Sciences
Committee of the National Research Council in 1993, namely:
“The principle of a spatial data sharing program is to increase the benefits to society
arising from the availability of spatial data. The benefits will accrue through the
reduction of duplication of effort in collecting and maintaining spatial data as well as
through the increased use of this potentially valuable information. The exposure of these
data to the wider community of users may also result in improvements in the quality of
data. This will eventually benefit the donor and other users” (National Research Council
1993, p. 89)
The sentiments expressed by the Mapping Sciences Committee as they put forward a
framework for building a national spatial data infrastructure reflect the true role of
governments, namely a service for the common benefit of society. Onsrud & Rushton
(1995a) argue that the value and utility of geographic information comes from its use, and
that the more that geographic information is used, the greater becomes society’s ability to
evaluate and address the wide range of pressing problems to which the information may be
applied. Another perspective is that the objective of spatial data sharing is to create
“connections” among widely dispersed databases (Calkins & Weatherbe 1995). However,

Chapter 2 – Spatial Data and SDI in Context
45
spatial data sharing is most commonly advocated on the basis that there are tangible
benefits through improved efficiencies (Azad & Wiggins 1995).
The role of government agencies, particularly those such as mapping and surveying, has
changed dramatically in the past 10-15 years as identified earlier in this chapter.
Production and service based agencies have been downsized and their operations
outsourced to private enterprise. The focus of governments is far more business orientated
and budget driven in contrast to the traditional “public good and service” perspective. The
reasons for sharing public information have remained the same, but it is the imperatives
and business needs that have become the new focus.
Development of data sharing cultures is important to successful implementation of
geographic information technologies and advancement of GIS (Onsrud & Craglia 2003).
There is also no doubt that the lack of information exchange among local, state and federal
government and the private sector remains a significant impediment to more effective and
efficient use of GIS throughout society (Pinto & Onsrud 1995). The reality is that data
sharing is easier to advocate than to practice (Azad & Wiggins 1995).
The value of information can increase when it is shared. Kelly (1995) identified that
spatial information is increasingly valuable for making decisions and solving problems in
private sector economic development, environmental management, emergency response
and public health and safety. However, the author also notes that although the value of the
application and sharing of spatial information is often self evident, better quantitative
measures are required to measure the benefits and costs.
Although GIS technology has been rapidly adopted by many organisations, the propensity
to share this information or to make the information publicly available has been
disappointing, particularly with respect to the coordination efforts at state government
level (Warnecke et al. 2003). Nebert (2004) also identifies that the value of geographic
information will be more readily realised through improved coordination, common
conventions and technical agreements.
2.5.3 Data Sharing Issues – Barriers and Motivation s
The issues that impact on the sharing of spatial information are broad-ranging and include
organisational/institutional issues, technical and technological issues, economic factors,
legal considerations and political issues. Several contributions have been made to
understand these issues and why organisations may or may not engage in spatial data
sharing (Craig 2005; Dangermond 1995; Harvey 2001; Masser & Campbell 1995;

A Local-State Spatial Data Sharing Partnership Model to Facilitate SDI Development
46
Nedovic-Budic et al. 2004a; Obermeyer & Pinto 1994; Onsrud & Rushton 1995b; Wehn de
Montalvo 2002). Many investigators consider these issues to fall under two categories
namely: barriers (constraints) or benefits (which motivate).
The underlying premise for sharing data is that it will eventuate in a range of benefits for
the organisations involved. The primary benefits or drivers for data sharing as introduced
in the previous section, include cost savings through lack of duplication of data collection
and maintenance efforts, improved data availability, and enhanced organisational
relationships through promotion of cross organisational relationships (Nedovic-Budic &
Pinto 2000).
Another important benefit of data exchange may also be the improvement in the quality of
the data sets, particularly where there are multi-organisational efforts to contribute to a
common or shared data base. Reduction in risk can also be seen as a benefit (Evans 1997)
if organisations are prepared to both contribute to the costs or development time for a
shared initiative.
The issues of cost recovery, copyright and legal liability have done little to encourage
organisations to provide access to spatial information (Rhind 1992). The majority of issues
relating to spatial data sharing are considered to be related to an organisational framework
in one form or another. For example the legal issues are primarily related to the
perspective of an individual organisation with regard to their organisation’s liability as a
result of sharing. Economic issues are also related to organisational budgets rather than
external funding in a large proportion of data sharing initiatives.
2.5.4 Data Sharing Frameworks and Models
The Mapping Science Committee of the National Research Council developed a generic
data sharing model to encompass all levels of government and the private sector. The
model involved a number of key components including data producers, data development
agreements, cost-sharing agreements, state level data advisors, quality assurance programs,
data and metadata standards, and users (National Research Council 1993). Although very
generic, this model identified a number of key issues including standard agreements,
quality assurance and technical standards.
One of the early efforts to describe a classification framework for data sharing was
undertaken by Calkins and Weatherbe (1995) with the development of a taxonomy for
research into spatial data sharing. The four primary components of the taxonomy were the
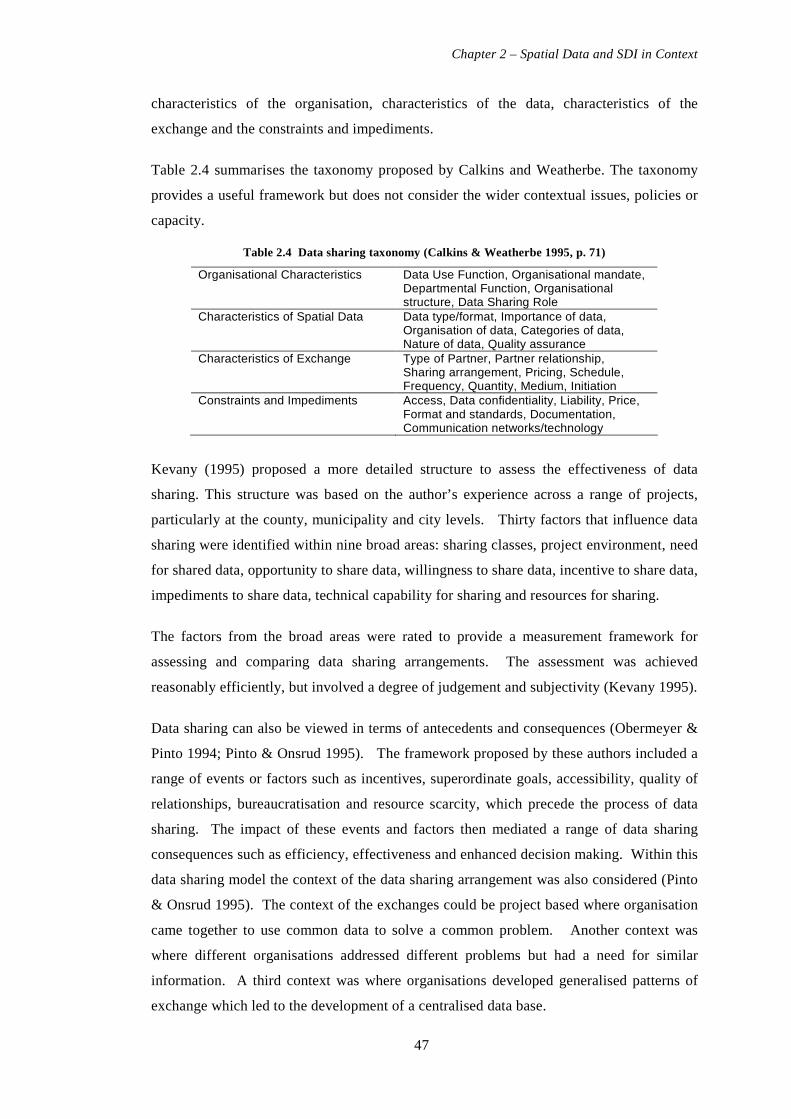
Chapter 2 – Spatial Data and SDI in Context
47
characteristics of the organisation, characteristics of the data, characteristics of the
exchange and the constraints and impediments.
Table 2.4 summarises the taxonomy proposed by Calkins and Weatherbe. The taxonomy
provides a useful framework but does not consider the wider contextual issues, policies or
capacity.
Table 2.4 Data sharing taxonomy (Calkins & Weatherbe 1995, p. 71)
Organisational Characteristics Data Use Function, Organisational mandate, Departmental Function, Organisational structure, Data Sharing Role
Characteristics of Spatial Data Data type/format, Importance of data, Organisation of data, Categories of data, Nature of data, Quality assurance
Characteristics of Exchange Type of Partner, Partner relationship, Sharing arrangement, Pricing, Schedule, Frequency, Quantity, Medium, Initiation
Constraints and Impediments Access, Data confidentiality, Liability, Price, Format and standards, Documentation, Communication networks/technology
Kevany (1995) proposed a more detailed structure to assess the effectiveness of data
sharing. This structure was based on the author’s experience across a range of projects,
particularly at the county, municipality and city levels. Thirty factors that influence data
sharing were identified within nine broad areas: sharing classes, project environment, need
for shared data, opportunity to share data, willingness to share data, incentive to share data,
impediments to share data, technical capability for sharing and resources for sharing.
The factors from the broad areas were rated to provide a measurement framework for
assessing and comparing data sharing arrangements. The assessment was achieved
reasonably efficiently, but involved a degree of judgement and subjectivity (Kevany 1995).
Data sharing can also be viewed in terms of antecedents and consequences (Obermeyer &
Pinto 1994; Pinto & Onsrud 1995). The framework proposed by these authors included a
range of events or factors such as incentives, superordinate goals, accessibility, quality of
relationships, bureaucratisation and resource scarcity, which precede the process of data
sharing. The impact of these events and factors then mediated a range of data sharing
consequences such as efficiency, effectiveness and enhanced decision making. Within this
data sharing model the context of the data sharing arrangement was also considered (Pinto
& Onsrud 1995). The context of the exchanges could be project based where organisation
came together to use common data to solve a common problem. Another context was
where different organisations addressed different problems but had a need for similar
information. A third context was where organisations developed generalised patterns of
exchange which led to the development of a centralised data base.

A Local-State Spatial Data Sharing Partnership Model to Facilitate SDI Development
48
Azad and Wiggins (1995) proposed a typology based on inter-organisational relations
(IOR) and dynamics. The authors argue that spatial data sharing across multi-agencies is
fundamentally an organisational affair and that the organisational concept of autonomy is a
critical issue in data sharing. Specifically, they argue that the process of sharing results in
the loss of autonomy and greater inter-organisational dependence, which in turn conflict
with each organisation’s goals. The typology classified organisations into three types
based on the inter-organisational dynamic as being one way, mainly one way or two way.
This typology extended the work of Oliver (1990) on organisational behaviour which
classified the reasons for IOR into six areas namely: necessity, asymmetry, reciprocity,
efficiency, stability and legitimacy. The authors also examined the level of IOR intensity
and the stages of inter-organisational relations which they propose were “powerful
explanatory concepts to disentangle the complex dynamics of geographic data sharing”
(Azad & Wiggins 1995, p. 33). The model proposed by Azad and Wiggins is somewhat
weakened by lack of justification of the initial premise that data sharing leads to the loss of
autonomy and independence (Wehn de Montalvo 2003a).
Another framework to understand organisational data sharing is put forward by Nedovic-
Budic and Pinto (1999) and draws on the Kevany model (1995) which is largely
experienced based. The conceptual framework draws on a broader literature base to derive
four theoretical constructs namely: inter-organisational context, motivation, coordination
mechanisms and outcomes. The theoretical foundations of this framework provide a very
useful basis for further development and assessment of spatial data sharing initiatives.
The authors have extended the understanding of the conceptual framework through a
number of empirical investigations including mechanisms and motivations for data
exchange (Nedovic-Budic et al. 2004a) and also the exploration of the organisational
issues with respect to GIS interoperability (Nedovic-Budic & Pinto 2001).
Sharing by its very nature is a human behaviour (Wehn de Montalvo 2002) and therefore it
should be explored from a human behavioural context. Wehn de Montalvo (2003a)
investigated the theory of “planned behaviour” as an organising framework for the
willingness to share spatial data. The model maps the process of data sharing based on a
belief structures and the predictive power of intentional behaviour. The basic model as
shown in Figure 2.7 consists of five components: a particular behaviour consideration, the
intention to act, and three determinants of intention (Wehn de Montalvo 2003a). These
determinants identify the willingness to share based on attitude, social pressure and
perceived control.
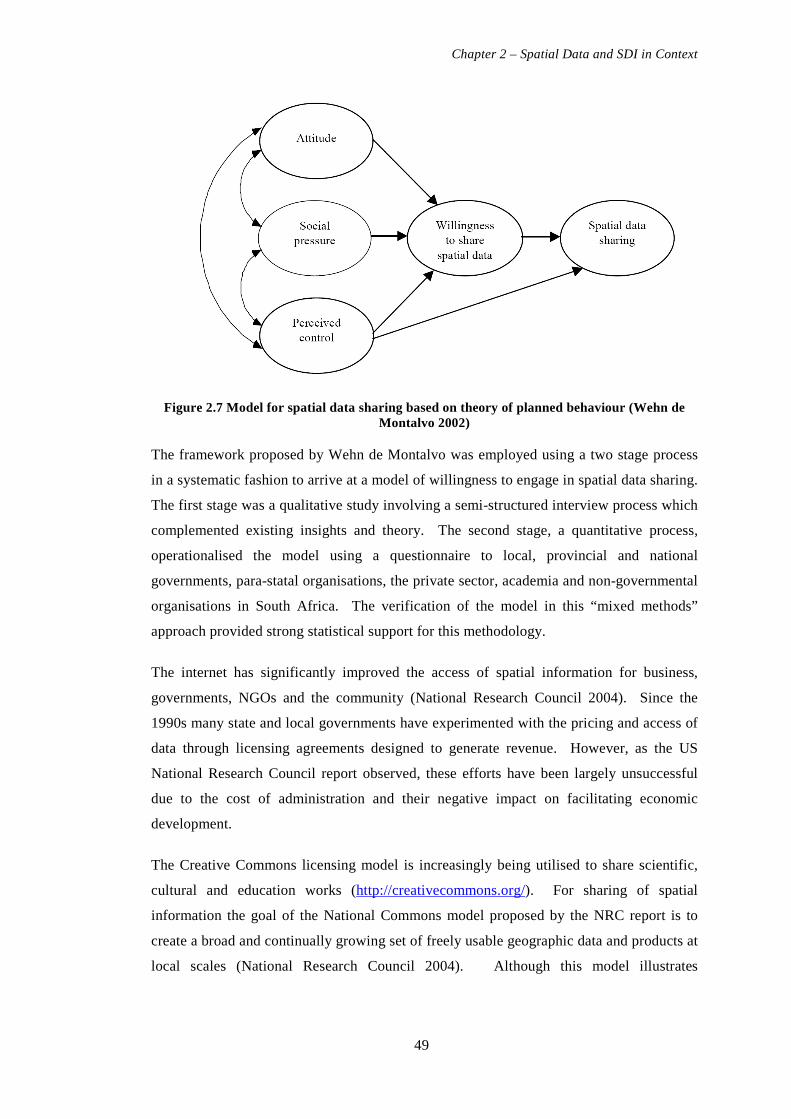
Chapter 2 – Spatial Data and SDI in Context
49
Figure 2.7 Model for spatial data sharing based on theory of planned behaviour (Wehn de Montalvo 2002)
The framework proposed by Wehn de Montalvo was employed using a two stage process
in a systematic fashion to arrive at a model of willingness to engage in spatial data sharing.
The first stage was a qualitative study involving a semi-structured interview process which
complemented existing insights and theory. The second stage, a quantitative process,
operationalised the model using a questionnaire to local, provincial and national
governments, para-statal organisations, the private sector, academia and non-governmental
organisations in South Africa. The verification of the model in this “mixed methods”
approach provided strong statistical support for this methodology.
The internet has significantly improved the access of spatial information for business,
governments, NGOs and the community (National Research Council 2004). Since the
1990s many state and local governments have experimented with the pricing and access of
data through licensing agreements designed to generate revenue. However, as the US
National Research Council report observed, these efforts have been largely unsuccessful
due to the cost of administration and their negative impact on facilitating economic
development.
The Creative Commons licensing model is increasingly being utilised to share scientific,
cultural and education works (http://creativecommons.org/). For sharing of spatial
information the goal of the National Commons model proposed by the NRC report is to
create a broad and continually growing set of freely usable geographic data and products at
local scales (National Research Council 2004). Although this model illustrates
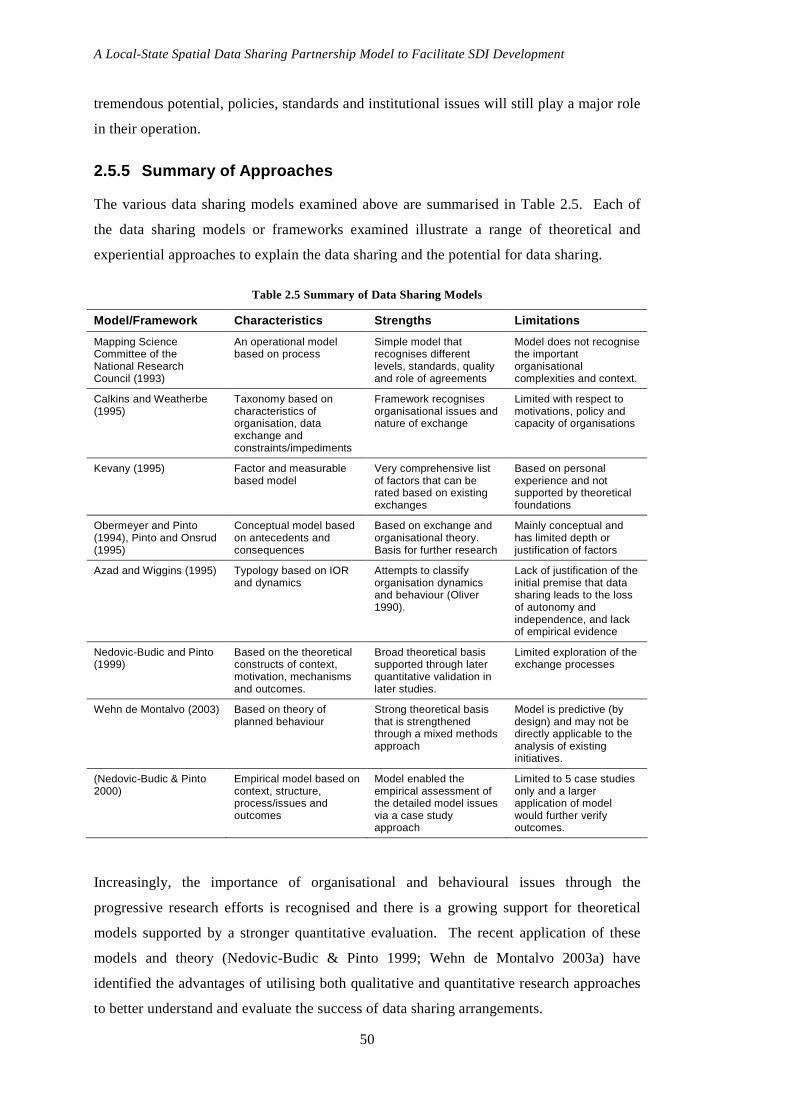
A Local-State Spatial Data Sharing Partnership Model to Facilitate SDI Development
50
tremendous potential, policies, standards and institutional issues will still play a major role
in their operation.
2.5.5 Summary of Approaches
The various data sharing models examined above are summarised in Table 2.5. Each of
the data sharing models or frameworks examined illustrate a range of theoretical and
experiential approaches to explain the data sharing and the potential for data sharing.
Table 2.5 Summary of Data Sharing Models
Model/Framework Characteristics Strengths Limitat ions
Mapping Science Committee of the National Research Council (1993)
An operational model based on process
Simple model that recognises different levels, standards, quality and role of agreements
Model does not recognise the important organisational complexities and context.
Calkins and Weatherbe (1995)
Taxonomy based on characteristics of organisation, data exchange and constraints/impediments
Framework recognises organisational issues and nature of exchange
Limited with respect to motivations, policy and capacity of organisations
Kevany (1995) Factor and measurable based model
Very comprehensive list of factors that can be rated based on existing exchanges
Based on personal experience and not supported by theoretical foundations
Obermeyer and Pinto (1994), Pinto and Onsrud (1995)
Conceptual model based on antecedents and consequences
Based on exchange and organisational theory. Basis for further research
Mainly conceptual and has limited depth or justification of factors
Azad and Wiggins (1995) Typology based on IOR and dynamics
Attempts to classify organisation dynamics and behaviour (Oliver 1990).
Lack of justification of the initial premise that data sharing leads to the loss of autonomy and independence, and lack of empirical evidence
Nedovic-Budic and Pinto (1999)
Based on the theoretical constructs of context, motivation, mechanisms and outcomes.
Broad theoretical basis supported through later quantitative validation in later studies.
Limited exploration of the exchange processes
Wehn de Montalvo (2003) Based on theory of planned behaviour
Strong theoretical basis that is strengthened through a mixed methods approach
Model is predictive (by design) and may not be directly applicable to the analysis of existing initiatives.
(Nedovic-Budic & Pinto 2000)
Empirical model based on context, structure, process/issues and outcomes
Model enabled the empirical assessment of the detailed model issues via a case study approach
Limited to 5 case studies only and a larger application of model would further verify outcomes.
Increasingly, the importance of organisational and behavioural issues through the
progressive research efforts is recognised and there is a growing support for theoretical
models supported by a stronger quantitative evaluation. The recent application of these
models and theory (Nedovic-Budic & Pinto 1999; Wehn de Montalvo 2003a) have
identified the advantages of utilising both qualitative and quantitative research approaches
to better understand and evaluate the success of data sharing arrangements.

Chapter 2 – Spatial Data and SDI in Context
51
2.5.6 Status of Empirical Research on Spatial Data Sharing and SDI
Much of the research on data sharing and SDI development has been theoretical based but
has provided limited empirical evidence on the importance or otherwise of the various
factors that impact on the success of data sharing initiatives. Table 2.6 below summarises
the outcomes from a range of empirical research on data sharing and SDI development.
The table identifies both the concepts examined in each research study and the key
findings from the empirical analysis.
Table 2.6 Summary of empirical research findings for data sharing and SDI development
Author Concepts Examined Key findings (Nedovic-Budic & Pinto 2000)
Information sharing in an inter-organisational environment. Utilised case study approach to examine context, structure, process/issues and outcomes of data sharing.
Coordination and implementation issues including attitude, responsibilities, perception of fairness (trust), commitment, teamwork, negotiation process and persistence were identified as critical. High data dependence is conducive to a good fit but requires organisational change, management support and funding.
(Harvey & Tulloch 2006)
Evaluation of foundations of SDI through local government data sharing by comparing data sharing processes, issues and practices across five domains.
Symbiotic relationship between local and state government must be better understood. Policy development must reflect the business needs of local government. Trust and individual attitudes are important. SDI development at local level is inconsistent and not well understood.
(Nedovic-Budic et al. 2004a)
Examined the properties of data sharing and motivations for cooperative arrangements.
Organisations collaborate for different reasons but for common missions or goals. Resources are a strong motivator for external interactions but standards adoption is still limited. Formal mechanisms (contracts) predominate through policies and mutual rules. Clearinghouse development is more likely to only internal. Internet is becoming a growing facilitator for communications and relations
(Tulloch & Fuld 2001)
Investigation of framework data for building the NSDI, particularly the production at local government level.
Low level of active or sophisticated data sharing was reported. Growing importance of internet for clearinghouses is identified. Inter-organisational issues continue to be major challenge. Benefits of sharing include efficiency, effectiveness and equity. Less structured chaordic approaches have potential but not proven. Jurisdictional coordination variation at state level including political, legal, economic and governance arrangements create challenges for NSDI.
(Crompvoets et al. 2004)
Assessed world-wide development of national spatial data clearinghouses. Empirical observation of developments of clearinghouse implementation, growth, usage, data sets, people, policy and standards.
The methodology of the survey approach provided objective results. Decline in clearinghouse activity reflect resourcing issues and greater demand on application services. Key success factors were stable funding, web services, clarity of purpose, good communication channels, user friendly access and trust.
Many of these findings agree with the previously reviewed theoretical literature on data
sharing and SDI development. Factors and issues that appear to re-occur include the
growing importance of the internet connectivity, resourcing, trust and institutional
frameworks, particularly policy.

A Local-State Spatial Data Sharing Partnership Model to Facilitate SDI Development
52
2.5.7 Successful Data Sharing Initiatives
There have been many successful data sharing initiatives but few have been sustained over
long time frames. Two successful and sustained data sharing initiatives that deserve
mention include the New York State (NYS) Geographic Information Systems
Clearinghouse (www.nysgis.state.ny.us) and the MetroGIS.
The NYS Geographic Information System Clearinghouse was originally developed as a
metadata repository to provide one central location where state agencies and local
governments could list the GIS data sets they held. It now not only identifies GIS data
holdings but, in some cases, allows users to access and download this data. The NYS GIS
Coordinating Body, operating under the auspices of the NYS Office of Cyber Security and
Critical Infrastructure Coordination, coordinates, promotes and facilitates the development,
effective use, and sharing of geographic information (NYS GIS Cooperative 2005). In
October 2005, there were over 500 members in the cooperative including over 200 local
governments, 56 counties, 81 state members, 18 national members and over 100 not-for-
profit agencies (NYS GIS Cooperative 2005).
The MetroGIS initiative established in 1995, is a multi-participant, geodata collaborative
serving seven counties in the metropolitan area of Minnieapolis-St Paul in Minnesota and
covering approximately 3000 square miles (Johnson & Arbeit 2002). An important first
stage of this collaboration was the development of a mission and implementation strategy
through an intensive consensus building process. This was followed by the implementation
of a number of strategic projects which assisted in the clarification of the form and
function of the collaboration. A number of the key success factors include focus on
organisational self-interest, strategic policies, secure champions, broad support base and
consensus, common business needs focus, and documentation and promotion of benefits
and understanding (Johnson 1997).
Much of the success of MetroGIS’s data sharing efforts is related to the organisational
structure and active membership. The structure and governance of MetroGIS recognises
clear goals, a governance and decision making policy board, coordinating committee and
advisory teams, a suitable legal structure, adequate funding and staffing, a business
information focus, suitable technology and the role of data custodians.
2.5.8 Summary
This section examined the background to spatial data sharing and considered a number of
topologies and models for sharing data. Some of the motivations and barriers for sharing

Chapter 2 – Spatial Data and SDI in Context
53
have also been identified. This literature provides a useful theoretical framework, but a
number of research gaps exist, particularly in understanding the components of formal data
sharing partnerships, partnership operations and the measurement of partnership
performance.
2.6 Chapter Summary The investigation of the developments of spatial information in Australia identified
progress within and across the three sectors of government and the private sector. It was
found that many of the initiatives in spatial information management and policy have
emerged from the traditional land administration and mapping agencies. The literature
review confirmed the importance of property related spatial information to the activities of
both state and local government and the private sector. Spatial information policy in
Australia has developed progressively through national initiatives from ANZLIC and
individual state government agencies. Although an overall national approach to SDI
policy has been adopted, it is the individual state governments which have had the greatest
impact on policies relating to the access and pricing of spatial information.
The impact of the Internet and information use within our society began to be recognised
by governments in the early 1990s which resulted in a number of information
infrastructure initiatives around the world. The concept of spatial information
infrastructure was conceived around this time also and the parallel developments between
SDI and mainstream information infrastructures were identified. The differing models and
understandings of SDI were explored and the common components which comprise a SDI
were clarified. Finally, spatial data sharing literature highlighted the organisational and
institutional issues which continue to be the significant challenges for improving sharing
outcomes. The role of partnerships in data sharing was identified as important in building
the SDI, but research gaps exist in describing the partnership elements, operations and
performance.
The next chapter will examine these organisational and institutional factors in greater
depth by investigating collaboration theory, partnerships and the government environments
in which collaborations occur.

A Local-State Spatial Data Sharing Partnership Model to Facilitate SDI Development
54

Chapter 3 – Collaboration, Partnerships and the Government Environment
55
3 Chapter 3 Collaboration, Partnerships and the Government
Environment
Chapter 3
Collaboration, Partnerships and the
Government Environment

A Local-State Spatial Data Sharing Partnership Model to Facilitate SDI Development
56

Chapter 3 – Collaboration, Partnerships and the Government Environment
57
3.1 Introduction The development of SDI relies heavily on both intra- and inter-jurisdiction cooperation
and the establishment of partnerships (Grant & Williamson 2003; Warnest 2005; Wehn de
Montalvo 2001). The foundation for cooperation often begins as an informal relationship
between individuals before being established more formally through individual
organisational units and the organisations as a whole. In the case of inter-jurisdictional
cooperation, the basis for the cooperation may be driven by a range of political imperatives
or government policies.
Chapter Two examined the historical development in the spatial information industry in
Australia, the concept and development of SDI, and the theory and developments in the
sharing of spatial information. The theory and models of spatial data sharing emphasised
the importance of developing an improved understanding at the organisational level of the
motivations and barriers for organisational cooperation. The term collaboration will be
used throughout this chapter to better describe cooperative efforts which facilitate spatial
data sharing partnerships.
This chapter explores the concepts of collaboration within an organisational context to
understand the behaviour, the stages of development and the differing models of
collaboration. Partnerships as a mechanism to formalise collaboration will also be
examined to understand their purpose, structure and operation. Finally, the role and
function of the government jurisdictions will be reviewed to understand the historical
intergovernmental relationships and the influences they have on partnership development
and operation.
3.2 Collaboration Information and communication technology has dramatically lowered the transaction cost
of collaborating and it is increasingly clear that isolationism is no longer a viable option
for many organisations (Lank 2006). The changing structure of national and state
government agencies in Australia resulting from downsizing and out sourcing of many
production functions, has created more tightly resourced government environments and
hence a change of attitude with respect to collaboration. As identified by Schermerhorn
(1975, p. 848) “Organisations will seek out or be receptive to inter-organisational co-
operation when faced with situations of resource scarcity or performance distress”.
Strategic alliances and other forms of inter-organisational co-operation have grown
dramatically since the mid 1980s and are now one of the most important new
organisational forms (Child et al. 2005).

A Local-State Spatial Data Sharing Partnership Model to Facilitate SDI Development
58
3.2.1 Defining Inter-organisational Cooperation, Co ordination and Collaboration
Although inter-organisational coordination has been examined by both scholars and
practitioners, few efforts have been made to define the phenomenon (Mulford & Rogers
1982). There is a growing range of terms used to describe a collaborative initiative
including: alliance, partnership, network, coalition, co-operative, collective, forum,
association, community, and consortium (Lank 2006). It is therefore useful to initially
examine the terms most commonly used to describe these inter-organisational relations,
namely: cooperation, coordination and collaboration.
The Oxford English Dictionary Online (2005) provides the following definitions for these
terms:
Co-operation “The action of co-operating, i.e. of working together towards the same end,
purpose, or effect; joint operation”;
Co-ordination “Harmonious combination of agents or functions towards the production of
a result”;
Collaboration – from collaborate “To work in conjunction with another or others, to co-
operate”.
In essence, the terms are very similar with a common theme of working together to achieve
a common goal or production of a result. However, it is perhaps more interesting and
informative to explore the usage of the terms within an organisational context to gauge
their meaning. The terms of cooperation, coordination and collaboration are often used to
describe inter-organisational relationships (IOR). Many authors have examined the issue
of IOR in an attempt to identify the determinants that either encourage or discourage these
relationships (Gray 1985; Mulford & Rogers 1982; Nedovic-Budic et al. 2004a; Oliver
1990; Schermerhorn 1975). Although there are similarities in the drivers or motivations
for establishing an inter-organisational relationship, different environments usually have
their individual motivating factors.
Cooperation between organisations is usually seen as the first stage in the development of
more significant organisational relationships. For example organisations may agree to
cooperate with each other for the purposes of establishing a common standard to reduce
duplication or costs. Schermerhorn (1975, p. 847) defines inter-organisational cooperation
as “the presence of deliberate relations between otherwise autonomous organisations for
the joint accomplishment of individual operating goals” . In the example given above the

Chapter 3 – Collaboration, Partnerships and the Government Environment
59
process may facilitate improved standardisation of data within each organisation, however
they may well choose to continue to limit the data for their own business activities.
Inter-organisational coordination is generally seen as more formal than inter-organisational
cooperation, generally requires resources and relies on the interdependence of the
organisations (Dedekorkut 2004). It also usually results in the loss of the autonomy by one
or more organisations in order to accomplish their respective or shared goal. Mulford and
Rogers (1982) distinguished coordination from cooperation through their intended
outcomes. The authors define inter-organisational coordination as “the process whereby
two or more organisations create and/or use existing decision rules that have been
established to deal collectively with their shared task environment” (Mulford & Rogers
1982, p. 12). They also distinguish coordination as being either managed or unmanaged.
In the early stages of building spatial databases it was recognised that coordination of
effort in data capture between government agencies was important from both an economic
and data quality perspective. Often these coordination efforts were sporadic and usually
based on projects e.g. a mapping project over areas of common geographical interest.
Mulford & Rogers (1982) compared cooperation and coordination through the comparison of
rules, goals, linkages, resources and threats to autonomy (see Table 3.1).
Table 3.1 A comparison of cooperation and coordination processes (Mulford and Rogers, 1982, p.13)
Criteria Cooperation Coordination
Rules and formality No formal rules Formal rules
Goals and activities emphasised
Individual organisational goals and activities
Joint goals and activities
Implications for vertical and horizontal linkages
None, only domain agreements
Vertical and horizontal linkages can be affected
Personal resources involved Relatively few – lower ranking members
More resources involved – higher ranking members
Threat to autonomy Little threat More threat to autonomy
In Table 3.1 it can be seen that cooperation is generally seen as less formal, involving less
resources and less threatening as the organisational goals and domains are not
compromised. On the other hand, coordination requires more formal rules, joint goals,
commitment to resources and as a result, generally poses a threat to autonomy.
Collaboration between organisations may be seen as an extension and/or the inclusion of
both cooperation and coordination. Gray (1989, p. 5) describes collaboration as “the
process through which parties who see different aspects of a problem can constructively
explore their differences and search for solutions beyond their own limited vision of what
is possible”. Although much of the literature on collaboration concentrates its focus on
A Local-State Spatial Data Sharing Partnership Model to Facilitate SDI Development
60
private sector applications, the view of collaborative efforts in the public sector is very
important.
Collaboration for public service delivery is defined by Prefontaine et al. (2000, p. 6) as
“the reciprocal and voluntary support that two or more distinct public sector agencies, or
public and private administrations, including non-profit organisations (NPOs), provide
each other in order to deliver a public service, i.e. one that is part of the government
mission”. This definition emphasises the need for reciprocal support from both agencies
and the common goal of delivering a public service. Care is needed that the application of
business management principles to government priorities and operations do not override
the traditional tenet of “public service or public good”.
Lawrence et al. (2002) defined collaboration as a cooperative, inter-organisational
relationship that relies on neither market nor hierarchical mechanisms of control but is
instead negotiated through an ongoing communicative process. For the purpose of this
research the definition used by Gray is adopted with the understanding that collaboration
should be seen as a continuum that involves both co-operation and co-ordination as
identified by Mulford and Rogers (1982).
3.2.2 Why Do Organisations Collaborate?
The understandings from current literature as to why organisations collaborate are broad
ranging and often reflect the individual environment or domain being investigated. A
range of literature identified that the likelihood of collaboration increases during a time of
crisis or difficulty i.e. resource shortages (Gray 1985; Halpert 1982; Mulford & Rogers
1982; Oliver 1990; Schermerhorn 1975).
Schermerhorn (1975, pp. 848-9) suggested that organisations will seek out or be receptive
to inter-organisational cooperation when “faced with situations of resource scarcity or
performance distress, the cooperation per se takes on a positive value, or a powerful
extra-organisational force demands this activity”. Schermerhorn also argues that once the
decision to co-operate is made, there are a range of other considerations or costs associated
with inter-organisational co-operation including organisational image, resource
requirements, domain considerations and support capacities that need to be considered.
Oliver (1990) proposed six critical contingencies of relationship formation as generalisable
determinants of collaboration across organisations as necessity, asymmetry, reciprocity,
efficiency, stability and legitimacy. These determinants are the causes that prompt or
motivate inter-organisational relations. Each determinant may be enough to prompt the
Chapter 3 – Collaboration, Partnerships and the Government Environment
61
cause of a relationship in its own right or may interact or act together with other
determinants. These contingencies are predicated on two key assumptions: (i)
organisations will make a conscious and intentional decision to collaborate for explicitly
formulated purposes and, (ii) that the contingencies reflect an upper management
perspective of the determinants of co-operation (Oliver 1990).
Dedekorkut (2004) identified motivations for collaboration between organisations to
include: pursuing commonly or mutually beneficial goals and interests, reducing
environmental uncertainty, mutual interdependence, legitimacy, fragmented jurisdictional
structure, meeting necessary legal or regulatory requirements and resource scarcity. This
list provides a useful starting point to discuss these motivations in context of inter-
governmental partnerships for sharing of information.
1. Organisational Goals : Having a common goal or interest is a strong motivator,
particularly when other motivating factors are involved e.g. cost savings (Lendrum
2000). An important condition for collaboration based on common goals is that
the organisational domains or environments are not sensitive to the proposition
that there may be some loss of autonomy or power (Gray 1985; Oliver 1990).
Oliver categorises this factor as reciprocity which is theoretically rooted in
exchange theory and is characterised by willingness for balance, equity and mutual
support. Within the government jurisdictions being investigated in this research,
the organisational goals of each domain such has local and state government are
likely to be different. As a primary motivator, it is perhaps likely that
collaboration will occur if there is a common business need.
2. Environmental Uncertainty: This factor is described by Oliver (1990) as the
stability contingency. Within an organisation or agency it describes the
uncertainty which has been generated by resource scarcity, lack of knowledge
about the fluctuations within the environment and uncertainty about opportunities
for future exchanges (Gray 1985; Oliver 1990). Through collaboration,
environmental uncertainty can be reduced to achieve greater reliability by
establishing improved horizontal and vertical coordination, building expertise and
improving the organisation’s reputation (Schoorman et al. 1981). Environmental
uncertainty has traditionally been less evident in government agencies than in the
private sector. However, a range of government policies at national, state and
local levels have significantly changed the state and local government
environments. The downsizing at national and state levels has created shortages in

A Local-State Spatial Data Sharing Partnership Model to Facilitate SDI Development
62
capacity and led to the devolution of responsibilities to jurisdictions such as local
government (Commonwealth Government of Australia 2003).
3. Mutual Interdependence: In turbulent environments increased inter- and intra-
organisational interdependencies lead to increased collaboration and building of a
collective capacity (Gray 1989; Mulford & Rogers 1982). This interdependence
could be created by resource scarcity (Alter & Hage 1993) or the need to act on an
organisational goal (Halpert 1982). Gray (1989) identifies that local, state and
federal agencies are dependent on each other for information, policy decisions,
environmental management, social imperatives and economic management. In
Australia, state and local government agencies share the majority of
responsibilities for the management of property related information, so therefore
mutual interdependence should be a reasonably strong motivator.
4. Legitimacy: Oliver (1990) suggests institutional environments impose pressure
on organisations to justify or legitimise their activities and outputs. These
pressures can be motivated by the need to improve their reputation, image, prestige
or congruence with prevailing norms. For example, the prestige of having a
respected individual siting on an organisation’s board may assist in the perception
of improved influence or governance (Schoorman et al. 1981). In the context of
local and state government collaboration, the inclusiveness of stakeholders in the
membership of councils or committees has increased in recent years. Good
examples of this inclusiveness in the Australian environment have been the
inclusion of local government in the membership of state spatial industry councils
such as the Victorian Spatial Council and the Queensland Spatial Information
Council. In turn, this inclusiveness has the capacity to initiate more significant
efforts for collaboration. Lank (2006) suggests that it is much more powerful to be
able to say “we” rather than “I”. When seeking to influence governments or other
organisations it is important to legitimise the group’s role by appearing as a
cohesive force.
5. Fragmented Jurisdictional Structure: Rogers and Mulford (1982, p. 39)
describe fragmentation as “a division of responsibilities among multiple, separate
agencies, each having a unique purpose, but lacking a coherent policy purpose”.
Fragmentation within jurisdictions refers to the somewhat dysfunctional behaviour
that occurs within various levels of government due to efforts to protect “turf” or
the categorical funding by governments (Rogers & Mulford 1982). The result of
fragmentation is a decline in government service, increased inefficiencies,
Chapter 3 – Collaboration, Partnerships and the Government Environment
63
unresponsiveness and the inefficient use of scarce resources. Attempts to reconcile
these structures therefore often motivate jurisdictions to seek more cohesive
structures through collaboration. In the case of state and local government
jurisdictions, the impact of fragmentation is difficult to assess as it is often
disguised as reforms or restructures. An example of fragmentation is the
devolution of responsibilities such as tax collection or environmental monitoring to
local governments.
6. Meeting Necessary Legal or Regulatory Requiremen ts: In some cases
organisations have no choice but to collaborate. For example, in the UK local
councils are required to establish local strategic partnerships which bring together
key organisations serving a community (local government, police, fire, voluntary
organisations, local businesses) to define and deliver a community strategy (Lank
2006). Oliver (1990) notes that organisations often establish linkages with other
organisations in order to meet a necessary legal or regulatory requirement. The
collaboration may be mandated through legislation, regulation, higher authorities
or professional regulatory bodies. The demands from these extra-organisational
forces are often a powerful reason for organisations to pursue collaboration
(Schermerhorn 1975). However, as noted by Halpert (1982), these organisations
are often vulnerable to more powerful organisations in a hierarchical system, in
which case collaboration may result in the loss of autonomy and, consequently,
power. The parallels of this motivating factor to the exchange of property
information between local and state government are strong, particularly where
legislative frameworks demand the exchange of property related information.
7. Resource Scarcity: Often a response to shortages of resources is to encourage
improvements in efficiencies and hence cost savings. These efficiency
contingencies are generally internally focussed rather than externally orientated
and will cause organisations to be receptive to inter-organisational collaboration
(Oliver 1990; Schermerhorn 1975). Collaboration is seen by many as not only a
means to improve the quality of public service delivery systems but also as a way
to improve the efficiency of government (Whetten 1982). Resources can be
considered as economic resources such as money, staff, equipment; and non-
economic resources such as authority, legitimacy and prestige (Mulford & Rogers
1982). This distinction becomes important during collaboration as both forms of
resources may be used strategically. Resource scarcity may also operate against
collaboration and encourage organisations to exert power or influence to control

A Local-State Spatial Data Sharing Partnership Model to Facilitate SDI Development
64
scarce resources (Oliver 1990). The benefits of reducing the duplication and effort
required to maintain large amounts of spatial data can be a powerful motivator for
state and local governments to collaborate.
Although collaboration may be facilitated by an individual motivating factor or
determinant, the decision for organisations to interact will more commonly be based on
multiple influences (Oliver 1990). It follows that different organisational settings may
extend or reduce these factors, including the way the factors interact.
3.2.3 Consequences of Collaborating
As identified in the preceding section, organisations are motivated to collaborate for a
variety reasons. The results of collaboration lead to a range of consequences or outcomes
which may be in the form of tangible or intangible benefits, costs which may be both
positive and negative, or changed risk environments.
Risks and Costs
Kumar and van Dissel (1996) examined the risks associated with collaboration of
information resources as viewed from strategies of pooled, sequential or reciprocal
interdependency. The pooled interdependency is metaphorically similar to the concept of
the “village commons” where land was set aside for the common use by everyone in the
village. Continuing this analogy, the authors identified that shared information resources
could lead to risks of overgrazing, contamination, poaching, and stealing (Kumar & van
Dissel 1996). In an information systems context, this would translate to the degradation of
information services through overuse of a resource by a single organisation, contamination
of the data base through lack of quality data by some users, misuse of pooled resources by
individual organisations and stealing of organisation specific information.
In sequential interdependencies or supply-chain approaches to information resources, the
risks are more closely aligned to the concept of “transaction costs” which relate to the cost
of managing the transaction or collaboration (Kumar & van Dissel 1996). Three major
sources of transaction risk include transaction-specific capital risk, information
asymmetrics and loss of resource control. The transaction-specific capital risk refers to the
risk of specific or individual activities such as isolated software development which can
consume resources at the expense of wider organisational goals. Information asymmetrics
is characterised by unequal participation or contribution by different organisations which
can then result in conflict. Loss of resource control often occurs as resources are
transferred to another organisation which may then result in loss of power and information
capital.

Chapter 3 – Collaboration, Partnerships and the Government Environment
65
In reciprocal or networked interdependencies the exchanges and transaction risks are much
more varied and complex (Kumar & van Dissel 1996). In these more complex and
multiple party environments, the risks include misunderstanding of the organisational
cultures, structural uncertainties, incompatible technology platforms and loss of control.
Many of the identified risks are directly relevant to the area of spatial data sharing between
government jurisdictions.
Schermorhorn (1975) identified that inter-organisational co-operation is potentially
associated with a set of costs which may be incurred by participating organisations.
Perhaps one of the most common costs associated with collaboration is a loss of autonomy
(Alter & Hage 1993; Gray 1989). This loss of autonomy or control can be reflected in a
variety of ways including loss of controls over outcomes, goal displacement or the ability
to effect a decision in the collaborative domain. Collaboration may also have
unfavourable ramifications with respect to the image or identity of the organisation (Alter
& Hage 1993; Schermerhorn 1975). For example being linked to a failed collaborative
project may impact negatively on the reputation of the organisation.
Organisations involved in inter-organisational collaboration may also incur costs through
the direct expenditure of scarce organisational resources which could be in the form of
money, staff time or information (Alter & Hage 1993). Other costs could include loss of
technical superiority, loss of stability, increased conflict over the domain or delays in
solution due to problems in coordination.
Benefits
Just as there are costs and risks to collaborating there are also benefits which will flow.
Often these are simply the positive outcomes from the process of collaboration. Alter and
Hage summarised from organisational literature the benefits of inter-organisational
collaboration as:
• opportunities to learn, adapt and develop new competencies;
• gain resources – time, money, information, legitimacy;
• sharing the risk can reduce the organisation’s exposure;
• gaining influence over the domain rather than a loss of autonomy may enable new
opportunities;
• ability to manage uncertainty through a wider support base;
• combined efforts create the ability to solve problems more rapidly and efficiently;
and
• improved reputation through association in successful efforts.
(Alter & Hage 1993, pp. 36-7)
A Local-State Spatial Data Sharing Partnership Model to Facilitate SDI Development
66
Many of these benefits can be generalised to explain some of the impacts with spatial data
sharing partnerships, however it would be expected that other benefits such as improved
data quality, access to other organisational data sets and improved communication
channels could also be evident.
3.2.4 Strategies and Theories for Collaboration
Strategies for collaboration refer to alternative plans or approaches available for
structuring inter-organisational planning and action (Mulford & Rogers 1982). Strategies
will vary from organisation to organisation and different strategies may be needed for
public and private sectors. Wood and Gray (1991) assert that there is no single theory that
explains the pre-conditions, processes and outcomes of alliances and collaborations.
Strategies for collaboration can be founded on a variety of approaches such as economic
theory, game theory, strategic management theory or organisational theory (Child &
Faulkner 1998).
Mulford and Rogers examined three managed coordination strategies namely: a mutual
adjustment strategy, alliance strategy and a corporate strategy across six dimensions.
Table 3.2 illustrates cooperation and the three coordination strategies mapped against the
six dimensions of focus, actors, formalisation, resources, power and goals. This
progression from less organisational inter-dependence (co-operation) to greater inter-
dependence within the coordination strategies was described by Dedekorkut (2004) as a
collaboration continuum.
Mulford and Rogers (1982) classified cooperation as having independent goals, few rules
or resources, no loss of autonomy and generally involving the lower ranking staff within
the organisations. Mutual adjustment focuses more on the agencies, common goals tend to
be of a temporary nature and there are few rules or resource commitments. Alliances tend
to be more structured and established at the administration or professional staffing levels.
Rules between the organisations are negotiated in more detail, additional levels of
resources are set aside, more collective goals and joint decision making is required. At
the corporate stage of coordination there are formal agreements, usually signed off by a
CEO, resource commitments are significant, the focus of power is centralised and the
collective goals of the venture are emphasised.

Chapter 3 – Collaboration, Partnerships and the Government Environment
67
Table 3.2 Collaboration Continuum (Dedekorkut 2004, p. 5)
Managed Coordination Strategies Dimensions
Cooperation Mutual
Adjustment Alliance Corporate
Actors Lower ranking members (subordinates)
Professionals or staff members at the supervisory level
Administrators (agency heads) or professionals
Administrators
Formalisation No formal rules Few rules Negotiated rules High formality
Resources Minimal resources committed
Few resources committed
Medium level of resource commitment
Resource commitment high
Focus of power
Decentralised power, largely independent; little threat to autonomy
Decentralised power but interdependent
May or may not use central administrative unit
Centralised power
Focus of control
Informal trade offs and reciprocity in the absence of rules
Reliance on informal norms and benefits for agencies
Interagency system decisions may have to be ratified
Interagency systems decide regulations that represent collective interest
Goals Vague, individual organisations’ goals
Primary focus on agency goals
Agency goals and collective goals
Collective goals stressed
Wood and Gray (1991) identified that resource dependence, micro-economics and strategic
management theories are effective in explaining some of the preconditions and outcomes
of collaboration, but do not effectively describe the actual process of the collaboration.
Other theories such as political, institutional or negotiated order theories focus on process
but do not adequately examine the determinants or outcomes.
Economic Strategies
From an economic theory perspective, cooperative strategy is explained through a range of
theories including market-power theory, transaction-cost analysis, resource-base theory,
transaction-value theory and agency theory. Market-power theory is a strategy by which
firms attempt to improve their competitive success by securing stronger positions within
markets (Cousins 2001). A collaborative strategy may provide a mutually beneficial
opportunity for organisations to modify the position that they occupy within the industry
and enable them to increase their market power (Child et al. 2005). This strategy may be
initiated through either an offensive or defensive coalition. The offensive coalition is
intended to develop and extend the competitive advantage of that organisation whilst the
defensive coalition would seek to stabilise a position to reduce a declining market.
Market-power theory provides several useful insights into the initiation of collaborations.
However, the theory does not readily explain the processes through which co-operative

A Local-State Spatial Data Sharing Partnership Model to Facilitate SDI Development
68
strategies may evolve over time nor the importance of trust within the relationship (Child
et al. 2005).
Transaction-costs are those costs that are incurred in arranging and managing transactions
across markets (Child et al. 2005). In the case of collaborations these may include the cost
of negotiation, drawing up contracts, managing the cooperation and monitoring the
outcomes. Transaction-cost economics, which was proposed by Williamson (1975),
differentiates between the economics of conducting transactions in the external market as
opposed to internalising the transaction which may then be governed by hierarchical
organisational structures. It provides a useful perspective of cooperative relationships with
respect to partner’s motives and the character of the transaction. However, the theory
deals only in terms of economic efficiency and does little to explain other dimensions of
the collaborative process such as trust (Child et al. 2005).
Resourced-based theory examines organisations as bundles of resources which are capable
of generating economic returns in a marketplace. Only strategic resources that meet the
specific conditions of being valuable, rare, inimitable and non-substitutable can generate
competitive advantage (Barney 1991). These resources, which may be human, physical or
organisational, are seen as critical assets for organisations from both a strategic and
operational perspective. This is especially true in rapidly changing, technology intensive
industries, but the model is applicable to a wide range of industries and settings (Child et
al. 2005).
Organisational and Management Perspectives
Organisational and management perspectives contribute to co-operation and collaborative
strategy. These strategies include resource dependency theory, game theory, and strategic
management theory amongst others. One theory that has received significant attention is
the theory of resource dependence (Pfeffer & Salancik 1978; Whetten 1982). Resource
dependency theory identifies that in a time of shrinking resources, organisations will
cooperate to reduce environmental uncertainty. It is suggested by Pfeffer and Salancik
(1978) that the survival of an organisation depends on its ability to acquire and maintain
resources. In order to survive, organisations must transact with other elements of their
environment and outside of their environment in order to acquire these resources which
leads to intra- and inter-organisational co-operation.
Strategic management theory is founded on the view that prospective collaborators need to
achieve a fit between their respective organisational strategies in order to make a positive
impact of achieving each organisation’s objectives. The motives for collaboration from
Chapter 3 – Collaboration, Partnerships and the Government Environment
69
the strategic management perspective include resource dependency, reducing transaction
costs and spreading the financial risk (Child et al. 2005). Literature also identifies the
need to secure a “cultural fit” between co-operating partners so that they can work together
on the basis of trust and understanding. The theory therefore emphasises the importance of
partner selection in establishing an alliance rather than a selection based on a more
simplistic economic approach. It draws together the cultural organisation perspectives, the
strategic goals and the careful selection of partners in order to achieve successful
collaboration.
Game theory is concerned with predicting the outcomes of games between two or more
players (actors) whose interests are interconnected or interdependent. More specifically, it
is the strategies adopted by a player to a game and the impacts on the eventual outcomes
which are of interest to co-operative strategy. The dilemma that develops within two
person games (termed the Prisoner’s Dilemma by Albert Tucker) revolves around the
choice between cooperative and competitive strategies (Child et al. 2005). This process is
paralleled to real life strategies of co-operation where the decision initially is to co-operate
in order to gain an advantage in a marketplace. These decisions may change progressively
as the alliance develops and one or both actors may change from co-operation to
competition.
Axelrod (1997) identified that a better outcome is generally achieved through a process of
continued co-operation rather competition. The theory provides a useful perspective on
the tensions that exist between co-operation and competition and may be used as a general
predictor of outcomes. However, the theory is limited in a number of dimensions that
make it difficult to apply to co-operating organisations in real life situations. The
treatment of the organisations as individual actors does not adequately address the
complexity of organisations that exist in reality. In addition, many co-operative strategies
are accurately represented by a network of interactions where the decisions to co-operate
or to compete may not be so categorical.
3.2.5 Typologies / Models
Thompson (1967) identified that organisational technologies and environments are major
sources of organisational uncertainty. Through the process of collaboration a degree of
organisational interdependence is created. Thompson distinguished three ways in which
organisations may become dependent on each other. The first is pooled interdependence
where organisational units share a discrete contribution but are otherwise independent.
This form of interdependence could be a contribution of resources to a pool or in the case
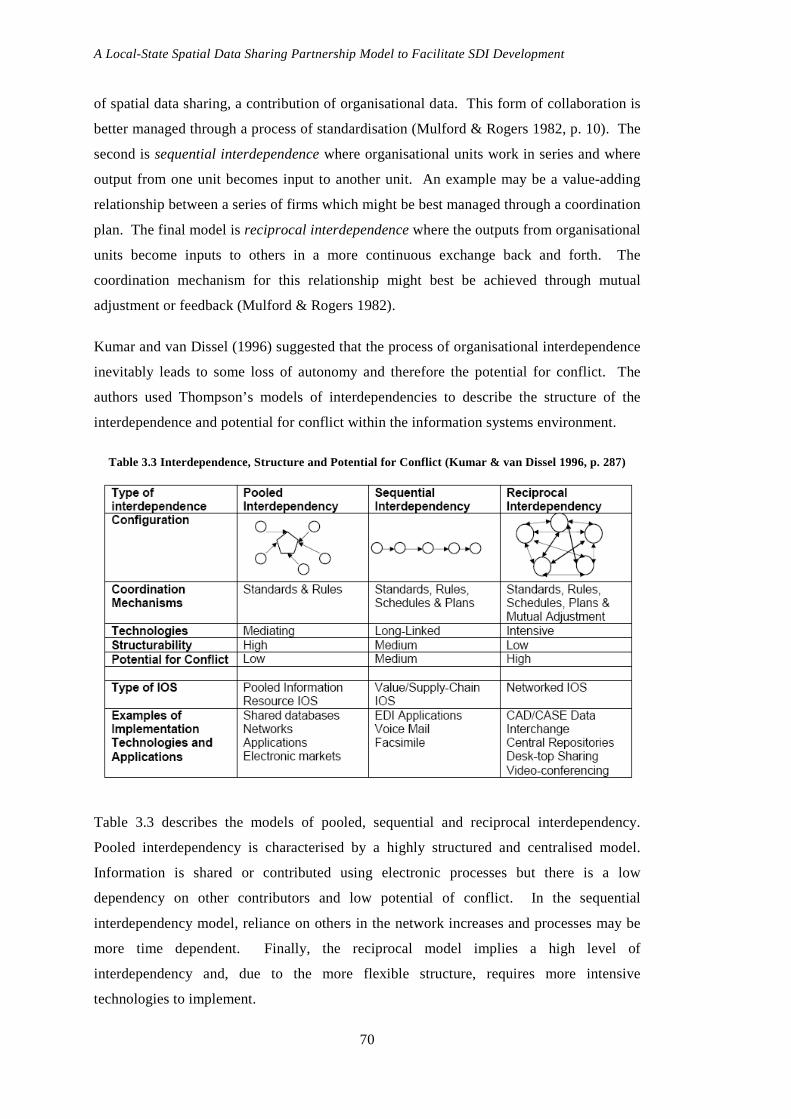
A Local-State Spatial Data Sharing Partnership Model to Facilitate SDI Development
70
of spatial data sharing, a contribution of organisational data. This form of collaboration is
better managed through a process of standardisation (Mulford & Rogers 1982, p. 10). The
second is sequential interdependence where organisational units work in series and where
output from one unit becomes input to another unit. An example may be a value-adding
relationship between a series of firms which might be best managed through a coordination
plan. The final model is reciprocal interdependence where the outputs from organisational
units become inputs to others in a more continuous exchange back and forth. The
coordination mechanism for this relationship might best be achieved through mutual
adjustment or feedback (Mulford & Rogers 1982).
Kumar and van Dissel (1996) suggested that the process of organisational interdependence
inevitably leads to some loss of autonomy and therefore the potential for conflict. The
authors used Thompson’s models of interdependencies to describe the structure of the
interdependence and potential for conflict within the information systems environment.
Table 3.3 Interdependence, Structure and Potential for Conflict (Kumar & van Dissel 1996, p. 287)
Table 3.3 describes the models of pooled, sequential and reciprocal interdependency.
Pooled interdependency is characterised by a highly structured and centralised model.
Information is shared or contributed using electronic processes but there is a low
dependency on other contributors and low potential of conflict. In the sequential
interdependency model, reliance on others in the network increases and processes may be
more time dependent. Finally, the reciprocal model implies a high level of
interdependency and, due to the more flexible structure, requires more intensive
technologies to implement.

Chapter 3 – Collaboration, Partnerships and the Government Environment
71
The models of pooled and reciprocal interdependence are of particular interest with respect
to spatial data sharing partnerships between local and state jurisdictions. These models
support the notion of standardisation, formal agreements and the need for mutual
adjustment in an often dynamic environment. An understanding of the technologies,
structure of collaborative arrangement, the type of inter-organisational systems (IOS) and
the potential for conflict is also important in the often heterogeneous environment of local
government.
3.2.6 Process of Collaboration
From the literature it is evident that the process of collaboration is often difficult to
describe within a “one size fits all” process, however there are a number of common issues
that re-occur and conform to a sequence of events. Gray (1989) proposed that the
collaborative process could be examined as a three phase process which would include
problem setting, direction setting and implementation. Table 3.4 illustrates the details of
this process.
Table 3.4 The Collaborative Process (Gray 1989, p. 57)
Phase 1: Problem Setting Common definition of problem Commitment to collaborate Identification of stakeholders Legitimacy of stakeholders Convenor characteristics Identification of resources
Phase 2: Direction Setting Establishing ground rules Agenda setting Organising sub-groups Joint information search Exploring options Reaching agreement and closing the deal
Phase 3: Implementation Dealing with constituencies Building external support Structuring Monitoring the agreement and ensuring compliance
Gray argues that the phases may vary from collaboration to collaboration and that some
stages may need to be extended whilst others can be reduced. The first stage normally
requires a clear identification of the problem (or opportunity) as the first step. This is
followed by a more detailed investigation of the context of the problem including
identifying the stakeholders, resources, timing, possible outcomes and levels of
participation before any agreement to proceed further. The second phase enters a more
detailed level of planning to establish the ground rules, sharing of strategic information,
identifying the steps to build the collaboration, project planning and finally a formal

A Local-State Spatial Data Sharing Partnership Model to Facilitate SDI Development
72
agreement to proceed. The final phase is the implementation stage which is the putting
together of the plan, building the support systems and monitoring the implementation
process.
Prefontaine et al. (2000) described the collaborative process as six end to end stages that
include start-up, search for partners, setting-up, implementation, operational management
and cessation (see Figure 3.1). The authors identified that each stage of the process
requires specific conditions to ensure success. Each of the stages also includes continual
processes of negotiation, evaluation, decisions and actions which reflect the evolution of
the relationship of the organisational participants.
Figure 3.1 Collaboration process (Prefontaine et al. 2000)
The figure also emphasises the stages of negotiation, commitment and execution which
represent the maturing of the collaborative process. The stages do not necessarily indicate
the completion of a process, but that continuous re-assessment needs to be undertaken to
ensure that the overall collaborative effort is meeting its objectives.
3.2.7 Collaboration and Success
Gray (1989) described collaboration as a temporary forum within which consensus about a
problem or issue can be sought, mutually agreeable solutions invented and collective
actions taken to address the problem. Importantly, the author found that “Understanding
how this process unfolds is critical to successfully managing the kinds of multi-party and
multi-organisational relations described. If collaboration is successful, new solutions
emerge that no single party could have envisioned or enacted” (Gray 1989, p. 16).
However, both definition and the measurement of success is not easy and in some areas
such as natural resource management standard economic indicators may not be applicable
(Dedekorkut 2004).
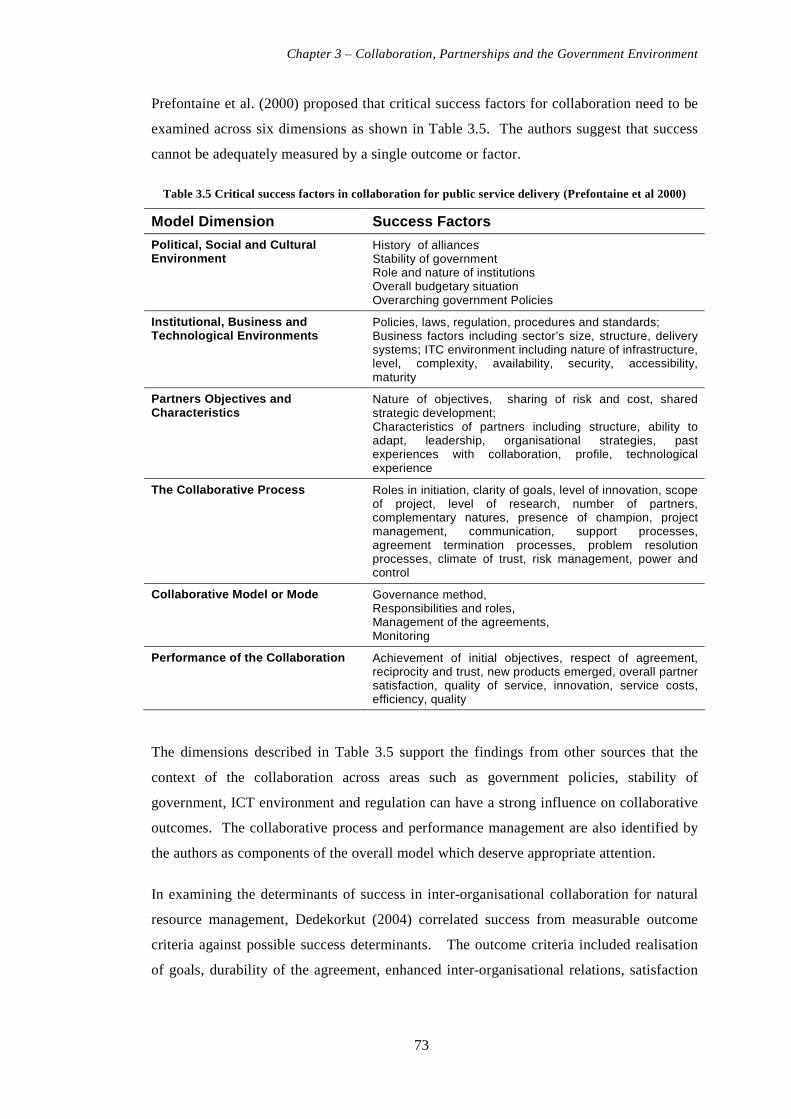
Chapter 3 – Collaboration, Partnerships and the Government Environment
73
Prefontaine et al. (2000) proposed that critical success factors for collaboration need to be
examined across six dimensions as shown in Table 3.5. The authors suggest that success
cannot be adequately measured by a single outcome or factor.
Table 3.5 Critical success factors in collaboration for public service delivery (Prefontaine et al 2000)
Model Dimension Success Factors
Political, Social and Cultural Environment
History of alliances Stability of government Role and nature of institutions Overall budgetary situation Overarching government Policies
Institutional, Business and Technological Environments
Policies, laws, regulation, procedures and standards; Business factors including sector’s size, structure, delivery systems; ITC environment including nature of infrastructure, level, complexity, availability, security, accessibility, maturity
Partners Objectives and Characteristics
Nature of objectives, sharing of risk and cost, shared strategic development; Characteristics of partners including structure, ability to adapt, leadership, organisational strategies, past experiences with collaboration, profile, technological experience
The Collaborative Process Roles in initiation, clarity of goals, level of innovation, scope of project, level of research, number of partners, complementary natures, presence of champion, project management, communication, support processes, agreement termination processes, problem resolution processes, climate of trust, risk management, power and control
Collaborative Model or Mode Governance method, Responsibilities and roles, Management of the agreements, Monitoring
Performance of the Collaboration Achievement of initial objectives, respect of agreement, reciprocity and trust, new products emerged, overall partner satisfaction, quality of service, innovation, service costs, efficiency, quality
The dimensions described in Table 3.5 support the findings from other sources that the
context of the collaboration across areas such as government policies, stability of
government, ICT environment and regulation can have a strong influence on collaborative
outcomes. The collaborative process and performance management are also identified by
the authors as components of the overall model which deserve appropriate attention.
In examining the determinants of success in inter-organisational collaboration for natural
resource management, Dedekorkut (2004) correlated success from measurable outcome
criteria against possible success determinants. The outcome criteria included realisation
of goals, durability of the agreement, enhanced inter-organisational relations, satisfaction

A Local-State Spatial Data Sharing Partnership Model to Facilitate SDI Development
74
of the collaboration, and resource and time efficiency. The determinants of success were
organised in terms of member factors, process factors and resource factors.
The member factors included inclusion of stakeholders, incentives, commitment and
leadership. The process factors included the ripeness of the issue, decision making
structure, availability of mediators, organisation and centralisation of the collaboration,
and relationship of parties. Finally, the resource factors encompassed funding and political
support. Dedekorkut found that the major determinants of successful collaboration in
natural resource management were availability of funding, inclusion of stakeholders, the
level of commitment, agreement on ground rules, political support, existence of trust and
maintaining interpersonal relationships.
3.2.8 Measuring Performance of Collaborations
Measuring the performance of collaborative ventures using traditional market processes
such as market value and profit are often not applicable and considerably more difficult
(Child et al. 2005). The assumption that success is only attached to co-operative strategies
that are continuous or ongoing is also problematic. Many partnerships or joint ventures
have a limited timeframe due to the nature of the co-operation but do not necessarily fail
because they have come to an end. Termination of an alliance or a joint venture is an
observable event and its likelihood can be related to the environmental conditions that
were occurring at the time. However, if the original objective has been obtained and the
co-operative venture dissolves, then this could still be deemed a success.
The authors also examined performance of an alliance or partnership from two
perspectives: firstly, the health of the alliance as an “operational unit” and its performance
as part of a system; secondly, as viewed from a “goal performance” perspective where the
extent by which each partner’s objectives have been realised. The authors suggest that the
operational unit perspective is best applied to more formal and well integrated
collaborations such as joint ventures where the whole system environment can be
monitored and measured as an independent entity.
On the other hand, many alliances or partnerships are formed for a particular purpose
which might only comprise a small part of their business activities. In these situations the
organisational units, budgets, and management remain separate which makes the
performance management of the co-operative system difficult, if not impossible. Alliances
often result in financial benefits such a licensing fees, royalties or management fees which
are often not incorporated into financial statements of the organisation, and are difficult to
uncover (Geringer & Herbert 1991). In addition, the performance of the organisation as a

Chapter 3 – Collaboration, Partnerships and the Government Environment
75
whole will often not reflect the performance of the partnership or alliance. In this case, the
assessment of joint goals and outcomes is a more appropriate method of assessing the
performance of the collaboration.
However, if objective performance measures are not readily available or are of
questionable reliability, Child et al. (2005) suggests that subjective measures may suffice.
For example, measures such as the satisfaction level of participants may be a useful
measure of performance. Geringer and Herbert’s (1991) finding that objective and
subjective measures are often highly correlated, especially measures associated with
satisfaction support Child’s position. Performance can also be seen as having both
positive and negative effects across many areas. For example learning outcomes may have
a positive impact such as building an understanding between the organisations, or a
negative impact such as organisational learning to the advantage of one party over the
other (Child et al. 2005).
Factors such as the external environment, initial collaborative conditions and the evolution
of the collaborative process are seen as important to the success of the collaboration.
External factors such as government policy and regulation often construct false
environments for collaboration and may not have clear economic or strategic foundations.
The initial conditions upon which the collaboration was established such as the extent of
equity in ownership and shared control are more likely to indicate success (Killing 1983).
Harrigan (1988) identified that complementary resource inputs and industry alignment lead
to longer lasting co-operative strategies. Although the initial conditions of a collaboration
can be linked to performance and success or failure, the ability of collaboration to evolve
and adapt to changed circumstances is also important (Child et al. 2005). Therefore, the
evolutionary process of the collaboration and adapting to change is in itself an important
outcome.
Increasingly government agencies are adopting performance models used by large private
sector corporations. Government agencies are now expected to be accountable for both
their use of public expenditure and delivery of service. In the United States, the
Government Performance and Results Act of 1993 requires government executives to
focus on defining missions, setting goals, measuring performance, and reporting
accomplishments (General Accounting Office 1998).
3.2.9 Section Summary
This section has defined collaboration in context with cooperation and coordination. The
motivations and consequences of collaboration were explored and often found to be
A Local-State Spatial Data Sharing Partnership Model to Facilitate SDI Development
76
conflicting. Approaches to collaborative initiatives vary significantly and might be
focused on economic or resource approaches or organisational strategies. Collaboration
strategies generally require a structured process and can be influenced by a range of
contextual factors. Importantly, the process of collaboration was explored and provided a
useful insight into the stages of collaboration and its possible outcomes. Finally, the
concepts of successful collaboration and collaboration performance highlighted the need to
assess collaborative initiatives across a number of dimensions.
3.3 Partnerships – Models and Experiences
3.3.1 Introduction
As identified in the earlier sections of this chapter the process of collaboration may lead to
a variety of outcomes and models. Partnerships are emerging as a preferred model for
inter-organisational collaboration, particularly to facilitate the exchange of spatial data
across jurisdictional boundaries. Partnerships or alliances are generally at the higher end
of the collaboration continuum as identified in Table 3.2. These arrangements usually
operate through formal agreements and have specific goals. The purpose of this section is
to more clearly define partnerships, identify the various models which have emerged and
identify their common components and characteristics.
3.3.2 Partnerships Defined
There are many definitions of partnerships which have been put forward in the literature
ranging from operational to strategic in their perspectives. Lendrum (2000) provided a
broad definition of partnering from a more strategic perspective as:
“The co-operative development of successful, long term strategic relationships, based on
mutual trust, world-class and sustainable competitive advantage for all the partners;
relationships which have a further separate and positive impact outside the partnership/
alliance.” (Lendrum 2000, p. 7)
The definition is a useful starting point to position partnerships in relation to other
collaborative arrangements. Firstly, the term co-operative development infers that there is
a shared vision, some common goals and importantly the development of a level of trust
within the inter-organisation relations. The author indicates that the terms “successful,
strategic and long-term” are also important to emphasise and further clarify the scope and
objectives of the relationship. Inclusion of the word successful in the definition infers that
the performance of the partnership will be measured and monitored through some form of
performance indicator, either hard (economic) or soft (achievement of goals). The length

Chapter 3 – Collaboration, Partnerships and the Government Environment
77
of the agreement is less definitive, but the terms of the agreement need to be long enough
for each organisation to grow and evolve within the partnership. Ledrum suggests a
minimum of five years, but also identifies the most successful partnerships as those that
work on the basis of “no contract and no term”.
Importantly, this definition implies that partnerships need to be strategic from the outset,
with a view to evolving over time and taking advantage of collaborative opportunities.
Mutual trust is correctly defined as a critical and essential element of partnerships which is
supported by most other literature. The term “world-class” is taken to represent the need
to incorporate world best practice by looking outside the immediate arrangement in order
to learn from successful world-wide initiatives.
The definition also identified the need for sustainability of the venture to ensure that the
initial efforts are not wasted but are converted into a sustaining operation. Finally, it states
that the partnership should have a separate and positive impact on the operations outside of
the actual partnership. These positive impacts would be a clear indication of the value of
the partnership and could be used more widely as a model for further co-operative
approaches.
3.3.3 Partnership Agreements and Models
Partnership agreements may comprise informal or formal agreements. Informal
agreements may consist of a letter of intent, a heads of agreement or memorandum of
understanding. In each case the intent is to establish a non-legally binding framework that
provides each party defined objectives over a specified period of time (Gerdes 2003). On
the other hand, formal agreements may take many forms including licensing and
distribution agreements, marketing agreements, or master agreements. Gerdes identified
that licensing and distribution agreements are common, and generally consist of five
critical components, including:
1. a licensing grant – what is being licensed and its limitations of use;
2. performance measurements – defining how objectives are to be achieved and
measured;
3. performance level – defines the standard of expected or minimum performance;
4. licensing payments – usually based on the above; and
5. guarantees – to ensure continuity. (Gerdes 2003, pp. 142-7)
Most partnerships are managed through a written contract or formal agreement and do not
involve the formation of a legal entity such as a joint venture. The nature of the formal

A Local-State Spatial Data Sharing Partnership Model to Facilitate SDI Development
78
agreement may be influenced by the size of the partnership, complexity, organisational
culture, level of organisational turbulence, maturity of partners, and the nature of the
product or service (Bergquist et al. 1995).
Partnership models can take a myriad of forms but can be broadly categorised into
government to government partnerships (G2G), government to business (G2B) and
business to business (B2B). Other partnership variations exist including government to
community or citizen (G2C) and linkages between the academic sector and the other
sectors, but these are not examined. Often initial partnerships may progress to more
formal legal entities such as alliances or joint ventures.
3.3.4 Government Partnerships
Public-Private Partnerships
G2B partnerships have become increasingly more common over the past two decades. The
recessions of the 1980s, and a more conservative approach to public policies, caused a
review of government strategies to investment in public infrastructure (Walzer & York
1998). Government service delivery has included some component of private sector
involvement in the form of contracting out service components, shared delivery or
outsourcing of activities (Webb & Pulle 2002).
Many of these have progressed to further private sector involvement including
corporatisation and full privatisation. Another model of G2B partnerships can be seen in
the public-private partnership (PPP) model. The National Council for Public-Private
Partnerships define a PPP as:
“a contractual agreement between a public agency (federal, state or local) and a private
sector entity. Through this agreement, the skills and assets of each sector (public and
private) are shared in delivering a service or facility for the use of the general public. In
addition to the sharing of resources, each party shares in the risks and rewards potential
in the delivery of the service and/or facility.” (National Council for Public Private
Partnerships 2005)
The underlying premise for the establishment of these partnerships is that private sector is
more efficient at building and running many traditional government services. These PPPs
generally have three basic ingredients, namely:
1. they are intended to be long term agreements which may include the design,
building and operation of infrastructure;

Chapter 3 – Collaboration, Partnerships and the Government Environment
79
2. an established procedure for managing the partnership exists, usually in the form
of a written contract; and
3. there is an agreed economic development outcome expected by all parties.
(Walzer & York 1998, p. 49)
The sharing of risk and benefits also enable governments to fund projects such as bridges,
freeways, airports and tunnels with the assistance of the private sector, hence reducing the
upfront cost (Webb & Pulle 2002). The majority of PPPs in Australia currently exist
between the state government and private companies rather than the national or local
governments. As many of these partnership endeavours are relatively immature, it has
been difficult to gauge their success, and the perspectives of success from the public sector
can be quite different from the private sector. Increasingly, methods of evaluation should
not only incorporate both public and private partners, but also the community stakeholders
who are usually the key users of the PPP outcome (Lichfield 1998).
Government to Government Partnerships (G2G)
Around the world the use of partnerships within and across governments are prolific, and
include the sharing of facilities, sharing of information, joint delivery of services, e-
business and e-governments services, environmental management, planning, and
infrastructure development. In the United Kingdom, the government has encouraged
partnerships to improve efficiencies and intergovernmental relations between the central
and local governments. For example, the Central and Local Government Information
Partnership was set up to enable central and local government to work together to develop
efficient and effective non-financial statistical information (CLIP 2005). The
Leicestershire E-Government Partnership was established by nine local authorities in
Leicestershire to deliver e-government services such as planning, GIS, tourism information
and a youth portal (Leicestershire County Council 2006).
In Canada, Infrastructure Canada coordinates federal efforts on cities and communities and
supports infrastructure investments across the country, through partnerships that meet local
community needs (Infrastructure Canada 2006). In Australia, many of the state
government agencies have established partnership strategies both across state government
agencies and between state and local government. Examples of these include:
• Government of Western Australia State-Local Government Partnership
Agreement;
• South Australian Government State-Local Government Relations Agreement;

A Local-State Spatial Data Sharing Partnership Model to Facilitate SDI Development
80
• Tasmanian Government Department of the Premier State and Local Government
Partnership Agreements; and
• A Protocol establishing roles and responsibilities of the State Government and
Local Government in the Queensland System of Local Government.
(DLGRP 2006)
Dollery (2005, p. 8) examined the effectiveness of the different state partnership strategies
between Australian state and local governments and found that “the State of Tasmania
undoubtedly leads the field in terms of its whole of government approach to engaging
municipalities”. In 1999, the Tasmanian Government partnership strategy was initiated to
improve the delivery of government and have a positive influence on the government’s
social, economic and environmental strategies. Part of the Tasmanian partnership
strategy’s effectiveness was the “whole of government” approach, high level support and
well developed protocols (Dollery 2005).
3.3.5 Hierarchical Organisations and Partnerships
Partnerships operate differently from conventional organisational structures as they tend to
operate horizontally across organisations rather than vertically in the typical hierarchical
structures of government. Bergquist et al. (1995) examined the dimension of partnerships
and hierarchical organisations and identified a number of differences in their operation.
Table 3.6 highlights the differences across seven dimensions namely shared direction,
structure, systems, culture, operations, competency and leadership.
Table 3.6 Comparison of hierarchical organisations and partnerships (Bergquist et al. 1995, p. 20)
Dimension Hierarchical Organisations
Partnerships
Shared Vision Company focus Industry or market focus
Structure Pyramidal Flat or networked
Systems Top down or bottom up Interactive
Culture Paternalistic Collaborative
Operations Productive Adaptive
Competency Function-driven Process-driven
Leadership and management
Position-based Initiative or team based
As can be seen in Table 3.6, partnerships are not organisationally focussed but are more
process or product focussed. In terms of operation, partnerships are dynamic, and often
will be in conflict with the conventional hierarchical operations and leadership.

Chapter 3 – Collaboration, Partnerships and the Government Environment
81
Partnership decision making is related to the particular partnership process and often needs
to be more responsive than existing government structures.
3.3.6 Section Summary
Partnerships are a particular form of collaboration that are usually formalised through a
partnership agreement. Within governments, partnership initiatives are flourishing both in
government to government relations and public-private partnerships. However, the
functioning of partnership operations within hierarchical bureaucratic structures does
provide a level of conflict with respect to efficiencies and sustainability.
3.4 The Government Environment
3.4.1 Introduction
Partnerships operate within, and are influenced by, government jurisdictional
environments. Australian state and local governments vary in their roles and
responsibilities from those of other countries which have a system of federated states.
Some important characteristics of these jurisdictional environments include their size,
legislative framework, fiscal arrangements and inter-governmental relations. These
historical relationships and jurisdictional responsibilities are particularly important in the
development of collaborative initiatives such as partnerships.
3.4.2 Federalism in the Australian Context
The constitutional framework and system of government within a country determine how
traditional government services such as health, education, transport, and social services are
delivered. A system of federated states, such as Australia, is a decentralised model of
government where the delivery of primary services is undertaken at the lower tiers of
government. In countries such as Australia, United States and Canada which encompass
large landmasses, the decentralisation of government has enabled the delivery of services
to be adapted to meet geographic, social and regional needs. Federal government involves
complicated constitutional arrangements that are intended to provide an overall national
structure to a group of regions which otherwise might have been separate national entities
(Solomon 1988).
At the heart of federalism is the issue of control. The federal government influences the
state’s roles and powers through both legislative and financial control. The distinguishing
features of the federal forms of government can be summarised as:

A Local-State Spatial Data Sharing Partnership Model to Facilitate SDI Development
82
a) “the national government has full authority on behalf of the federation to deal with
other nations;
b) the functions of government are distributed between the national government and
the regional governments through the constitution and cannot be altered by either;
c) power is distributed in such a way that both national and regional governments
have a direct impact on citizens; and
d) a judicial authority exists to act as an umpire to ensure that neither the national or
regional governments step outside their powers as prescribed by the constitution”.
(Solomon 1988, p. 13)
Australia became a nation in 1901, after the separate British colonies joined in a federation
of states under the Australian constitution. These six states, New South Wales, Victoria,
Queensland, South Australia, Western Australia and Tasmania, together with two
territories, Northern Territory and Australian Capital Territory, cover the entire continent.
The formation of local governments in Australia began around the middle of the nineteenth
century in each of the colonies, well before the Australian Constitution was put in place.
However, local government has no recognition in the constitution and are creations of each
of the state governments (United Nations Economic and Social Commission for Asia and
the Pacific 2003). The lack of constitutional recognition, and hence power, is a significant
limitation from the perspectives of local governments.
3.4.3 Local and State Government Environment in Aus tralia
To understand the complexity of building the local-state partnerships across Australia, it is
useful to understand some of the demographic and jurisdictional statistics. Australia
comprises of six states and two territories with a total land area of approximately
7,692,000 square km (see Table 3.7).
Table 3.7 Australian statistics 2005 (Source: ABS 2006)
State Area (km 2) % of Total Area
Population (million)
No. of Local Governments
New South Wales 801,000 10.41 6.74 152
Victoria 227,000 2.96 4.98 79
Queensland 1,731,000 22.5 3.88 125
Western Australia 2,529,000 32.89 1.98 144
South Australia 983,480 12.79 1.53 76
Tasmania 68,400 0.89 0.48 29
Northern Territory 1,349,130 17.54 0.20 68
Australian Capital Territory 2,360 0.03 0.32 -
Australia Total 7,692,000 100.0 20.1 673

Chapter 3 – Collaboration, Partnerships and the Government Environment
83
The majority (77%) of Australia’s 20.1 million people is located in the eastern states
(Queensland, Victoria and New South Wales) although these three states represent only
approximately 36% of the total land area. Although the majority of land management is
undertaken by the state governments, it is local government that services the general
community with respect to day-to-day property management issues. In September 2005,
there were 673 local governments (councils) consisting of cities, towns, municipalities,
boroughs, shires, districts, and in the Northern Territory, a number of rural Aboriginal
communities.
Local governments provide a variety of services to the community, although these can vary
significantly from state to state and between urban and regional councils. Their
responsibilities may include the management of health, sanitation, road construction and
repair, water supply, sewerage, drainage, museums, planning and development, building,
parks and land services such as valuation. In recent times, some of the state governments
have devolved further duties to local government including environmental management
and monitoring. Other recent structural changes include the incorporation or privatisation
of business units in areas such as the provision of water and sewerage. Compared with
many countries, local government in Australia has a relatively narrow range of functions.
For instance, it does not take general responsibility for the provision of services such as
education and policing (United Nations Economic and Social Commission for Asia and the
Pacific 2003).
The size of local governments in Australia reflects the diversity and often complexity of
this tier of government. As shown in Figure 3.2 approximately 36% of local governments
are populated by less than 3,000 people and almost three quarters have a population of less
than 30,000 people.
Figure 3.2 Population distributions of Australian Local Governments (UNESCAP 2003)

A Local-State Spatial Data Sharing Partnership Model to Facilitate SDI Development
84
Many of these sparsely populated local governments are located in the rural areas of
Australia and provide critical infrastructure including roads, housing, water and sanitation.
There were however, many relatively small local governments in highly urban areas which
created obvious inefficiencies. This led to the amalgamation of many of these local
governments in Victoria, Tasmania, Queensland and New South Wales during the past 20
years.
3.4.4 State and Local Government Fiscal Dependency
A significant difference that exists between the tiers of government in Australia is their
level of revenue and expenditure. Federal fiscal arrangements in Australia are
characterised by a significant difference between the relative revenue and expenditure
responsibilities of the Commonwealth and the States, often referred to as vertical fiscal
imbalance (VFI) (Australian Government 2006). In drafting the Australian Constitution, it
was intended that the state and federal governments would be financially independent.
However, since federation the states have become increasingly reliant on the Federal
Government for funding and increasingly subject to its dictates about how revenues will be
spent (Summers 1985).
As Figure 3.3 illustrates, the federal (commonwealth) government collects significantly
more revenue than it expends. This contrasts with the states and local governments which
rely on the federal government to top up their funding base through commonwealth grants.
Figure 3.3 Vertical fiscal imbalance (Australian Government 2006)
Although this vertical fiscal imbalance has created tension between the states and federal
governments in particular, there has been limited success by the states in effecting changes
to redress this situation (Dollery 2002). State governments rely on a redirection of 13% of
federal funds whilst local government outlays consume the whole of their revenue. The
relatively low level of funding to local government is reflected in the facilities and staffing
Chapter 3 – Collaboration, Partnerships and the Government Environment
85
in some local jurisdictions, and in particular, in the development of their information
technology infrastructure.
In addition to the vertical imbalance there is also a horizontal fiscal imbalance that exists
at state and local levels. This horizontal imbalance is primarily the result of each
jurisdiction’s ability to generate revenue due to the number of geographic and
demographic factors (Dollery 2002). This imbalance is particularly evident between the
highly populated urban local governments and those in rural and remote areas where the
additional burden of service delivery over sparse areas is compounded. The federal
government attempts to address both these forms of fiscal imbalance through
commonwealth grants schemes which attempt to equalise the relative funding differences.
Prior to 1974, the state governments were the main source of additional financial
assistance for local government (Commonwealth Grants Commission 2001). This changed
in 1974, when the Commonwealth introduced a program of untied financial assistance
through the States to local government which was aimed at providing local government
with access to the nation’s finances. The funding arrangements continue to receive
attention with a review of Commonwealth funding arrangements by the Commonwealth
Grants Commission in 2000-2001 and the announcement in June 2002 by the
Commonwealth Minister of Local Government for an Inquiry into Local Government and
Cost Shifting. Although there are many similarities amongst the 673 local government
organisations across Australia, there are also many differences in terms of composition,
governance and responsibilities.
Although some financial contributions are provided by the state and federal governments,
the majority of local government income is generated through property tax (rates) and
charges for others services. However, the margins for the management of local
government finances are small which leaves local government vulnerable to the changing
economic and political environments.
3.4.5 Australian State and Local Government Represe ntative Organisations
The Council of Australian Governments (COAG) is a forum to initiate, develop and
implement national policy reforms requiring cooperative action between the three levels of
national, state/territory and local government. Its objectives include dealing with major
issues by agreement and cooperating on structural reform of government and on reforms to
achieve an integrated, efficient national economy and a single national market. It
comprises the Prime Minister, State Premiers, Chief Ministers of the Australian Capital

A Local-State Spatial Data Sharing Partnership Model to Facilitate SDI Development
86
Territory and the Northern Territory and the president of the Australian Local Government
Association (Department of Foreign Affairs and Trade 2006).
In each of the states, local governments are represented by their state local government
association which interacts with state and federal governments on behalf of their members.
At a national level, the state associations are represented by the Australian Local
Government Association (ALGA). Its key activities include representation of local
government on national bodies and ministerial councils, providing submissions to
government and parliamentary inquiries, raising the profile and concerns of local
government at the national level and providing forums for local government to guide the
development of national local government policies (Australian Local Government
Association 2005).
In addition to the local government associations, voluntary groupings of local governments
have formed called Regional Organisations of Councils (ROCs), which undertake a range
of activities. The majority of ROCs consists of between five and fifteen councils and
provide a number of benefits including:
a) a forum for councils to discuss common issues;
b) development of common policy on housing, infrastructure, and records
management;
c) coordination of activities across the jurisdiction e.g. tourism;
d) resource sharing and joint purchasing, and
e) acting as regional lobbyists. (Dollery 2005)
3.4.6 Inter-governmental Relations and Collaboratio n
As identified earlier, the relationships between the federal and state governments in
Australia have often been strained. The reason for this tension is most commonly the
result of conflicts over jurisdictional power, and more often than not, the funding
arrangements controlled by the federal government. Although the inter-governmental
relations (IGR) have ebbed and flowed, recent decades have seen a general strengthening
of relations between the tiers of government due to the expansion of roles and the growth
in complexity (Galligan 1989).
Intergovernmental relations operate at two levels: namely the primary level relations
between the central government and its constituent regions, and secondly the relations that
operate among the sub-national units of the federation (Cameron 2001). These inter-
jurisdictional relations operate both formally and informally. Some of the formal

Chapter 3 – Collaboration, Partnerships and the Government Environment
87
structures such as ministerial councils have been identified previously, whilst informal
meetings and events can result in co-operative agreements or letters of intent. Cameron
(2001) identifies that IGR may vary along three dimensions, namely:
1. the degree of institutionalisation – which may be highly institutionalised and
formal or more ad hoc and informal;
2. the extent to which it is decision making in character – IGR may be simply sharing
of information between jurisdictions or involve more detailed action such as policy
adjustments including formal decision making; and
3. the degree of transparency – IGR may be practiced behind closed doors or
embedded in a process open to public scrutiny.
Agreements to co-operate may be formal or informal but should be entered into on a
voluntary basis for the mutual benefit of all who participate (Opeskin 2001). These formal
agreements may be:
1. commercial contracts between governments for leasing of premises or purchase of
goods;
2. written undertakings to provide resources;
3. inter-governmental agreements in which parties may adopt a particular policy
without legislation; or
4. agreements that parties use their best measures to implement a law whose term has
been agreed. (Opeskin 2001)
Cooperative and Coordinate Federalism
Intergovernmental relations within a federal system may be further classified as either
cooperative federalism or coordinate federalism. Cooperative federalism refers to the
process where functions are shared across levels of government whilst in coordinate
federalism the functions can be neatly allocated to just one level of government (Reeve et
al. 2000). More commonly in Australia, the cooperative federalism model reflects the
sharing of roles and responsibilities across the three levels of government. The complexity
of intergovernmental relations grows at the state-local because of the numbers involved.
In the United States, the fiscal relationship between the 50 states and more than 85,000
local government units, means that complexity is unavoidable (Liner 1989). Canada has a
similar level of complexity with over 4,500 municipalities and local governments within
10 provinces.
Devolution of Responsibilities
Since the 1970s, there has been a progressive trend within federated countries to devolve
responsibilities from the federal level to the states. In turn, the states have shifted

A Local-State Spatial Data Sharing Partnership Model to Facilitate SDI Development
88
responsibilities to the local governments. The difficulty that has occurred in almost all
cases of devolution is that a commensurate level of funding has not followed with the new
responsibility. In Australia, a recent review of the operation of the Commonwealth Grants
Commission identified that local government was heavily impacted by the cost shifting
from state governments (Commonwealth Government of Australia 2003). The major areas
of cost shifting identified in the review included the transfer of assets without appropriate
funding support, failure to provide indexation for fees and charges under state legislation,
increased regulatory and compliance requirements, and withdrawal of support for
established programs (Commonwealth Government of Australia 2003).
In recognition of the problems caused by cost shifting by both federal and state
governments, an agreement was recently signed by the Federal and State Ministers of
Local Government and Planning to improve intergovernmental relationships with local
government. The agreement is intended to result in improved relationships between the
three spheres of government, the promotion of more effective and efficient government,
greater transparency in financial arrangements and effective consultation with local
government (LGPMC 2006). This agreement and recent trends in intergovernmental
relations marks another advance in the concept of cooperative federalism.
3.4.7 Section Summary
The system of government and the jurisdictional environments have the potential to
significantly influence institutional arrangements and hence partnerships. As with other
countries, the Australian state-local government environments are highly heterogeneous
and complex in nature. Intergovernmental relations between the three levels of
government are characterised by legal and fiscal dependencies. These dynamic
relationships continue to evolve through periods of devolution and political change.
3.5 Chapter Summary This chapter has reviewed the three key areas of collaboration, partnerships and the
government environment. The three areas were found to be linked and inter-related. The
government environment plays an important role in shaping the economic and legal
structures from which collaborative initiatives emerge, and within which they operate. The
motivations and consequences of collaboration were found to recur across organisations
and have provided the basis for understanding data sharing partnerships and models. The
processes of establishing and measuring partnerships were highlighted as often complex.
The literature review found that the evaluation of collaborative initiatives and partnerships
needed to be extended beyond the assessment of the collaborative outcomes and should

Chapter 3 – Collaboration, Partnerships and the Government Environment
89
encompass all stages of the collaboration. For partnerships to operate effectively within a
typical government bureaucracy, consideration needs to be given to the possible
conflicting roles of the organisation and the partnership.
The next chapter discusses the research design and methodology to address the issues
identified in chapters 2 and 3.

A Local-State Spatial Data Sharing Partnership Model to Facilitate SDI Development
90

Chapter 4 – Research Design and Methods
91
4 Chapter 4 Research Design and Methods
Chapter 4
Research Design and Methods

A Local-State Spatial Data Sharing Partnership Model to Facilitate SDI Development
92

Chapter 4 – Research Design and Methods
93
4.1 Introduction The previous chapters of this dissertation described the context of the research in relation
to the areas of spatial data sharing and SDI developments (chapter 2), collaboration,
partnerships and intergovernmental relations (chapter 3). This chapter outlines the
research design and methods which were used to answer the research questions and to
achieve the research aim (section 1.2.2, p5). The first part of the chapter investigates the
conceptual research framework by reviewing the research problem and questions, and then
explores the possible research methods available to answer these questions. The chosen
research approach is then justified and the final research design presented. The research
methods utilised for the development of the final model are detailed and issues relating to
validity are discussed. Finally, the ethical considerations relating to the research are
described.
4.2 Conceptual Design Framework
4.2.1 Important Contributions from Theory and Pract ice
In chapters 2 and 3, theory and practice across the areas of SDI, spatial data sharing,
collaboration and partnerships were reviewed. The government environments and the
progress of spatial information development in Australia were also investigated. In the
existing theory on spatial data infrastructure and information infrastructures there was a
consensus on the various components that contribute to an information infrastructure.
Therefore, in order to examine the contribution of partnership initiatives to the
development of SDI it was considered important that the measurement of these
components in the partnerships be considered during the design.
The review of spatial data sharing and collaboration theory identified a number of gaps in
research, including the limited understanding of the contribution of spatial data sharing to
SDI development, the need to more effectively describe the operations and management of
data sharing partnerships and the development of improved mechanisms to measure the
performance of data sharing efforts. Collaboration and partnership theory also provided an
improved understanding of the determinants for collaboration which can assist in
understanding why and how the partnerships came into being. Finally, the jurisdictional
and institutional environments can have a strong impact on how the partnerships develop
and succeed, so the research design incorporated an investigation of a range of contextual
factors.

A Local-State Spatial Data Sharing Partnership Model to Facilitate SDI Development
94
4.2.2 Relationship between the Research Design and Research Questions
From the review of literature, the research questions, originally stated in chapter 1 p. 5,
were clarified as follows:
1. Can the understanding of existing theory on data sharing, collaboration and
organisations be applied to existing local/state government data sharing models to
improve their operation and sustainability?
2. How can these partnership models be more rigorously described and classified?
3. What are the motivations and barriers for the participation of local and state
government in spatial data sharing partnerships?
4. What are the factors that contribute to the successful establishment, management
and operation of local/state SDI partnerships?
5. Can the varying organisational characteristics, capacities and attitudes of local
government be related to their partnership participation or outcomes?
6. Can a generic model be developed which can guide future local/state spatial data
sharing partnerships?
In Figure 4.1 the conceptual design framework illustrates the relationship between the
research problem, aim and objectives, research questions, methods and validation.
Figure 4.1 Conceptual design framework

Chapter 4 – Research Design and Methods
95
The first and second research questions are primarily qualitative in nature and seek to
explain the nature of the local/state SDI partnerships under investigation. The next three
questions are more quantitative in nature and seek to identify and measure a number of
issues or factors. To address the final research question requires the blending of both
qualitative and quantitative approaches to better guide the development of a generic
framework or model.
4.3 Selection of Research Approach and Research Des ign
4.3.1 Overview
At an early stage of the research design it became evident that both qualitative and
quantitative approaches should be examined. On one hand, there was a need to understand
the different partnership models within a variety of settings and on the other to quantify
the factors that contribute to the success of these arrangements. This section examines the
context of both qualitative and quantitative methods and their relationship to the research
problem and questions which have been formulated. A mixed method approach is then
proposed as a suitable research approach to answer the research questions identified. The
overall research design incorporating the mixed methods approach is then presented.
4.3.2 Qualitative Methods
Qualitative research methods examine the how, what and why of various phenomena. Put
simply, qualitative methods involve a researcher describing the characteristics of people
and events without comparing events in terms of measurements or amounts (Thomas
2003). Denzin & Lincoln described the qualitative approach as:
“the studied use and collection of a variety of empirical approaches including case study,
personal experience, introspection, life story, interview, observational, historical,
interactional, and visual texts – that describe routine and problematic moments and
meanings”. (Denzin & Lincoln 1994, p. 2)
Qualitative research has strengths that derive primarily from its inductive approach, its
focus on specific situations or people, and its emphasis on words rather than numbers
(Maxwell 1996). Maxwell identified five particular research purposes where qualitative
studies are especially suited including:
1. understanding the meaning, for participants in the study, of the events, situations,
and actions;

A Local-State Spatial Data Sharing Partnership Model to Facilitate SDI Development
96
2. understanding the particular context within which participants act, and the
influence that this context has on their actions;
3. identifying unanticipated phenomena and influences;
4. understanding the process by which events and actions take place; and
5. developing casual explanations.
In the context of this research, the use of a qualitative approach was considered to be the
most appropriate method to investigate the data sharing partnerships and the participants
that act within those partnerships. Qualitative methods also provide the opportunity to
understand the context within which these data sharing partnerships operate, especially the
government to government environments and the issues of authority, autonomy and
hierarchy. Equally important was the need to describe the processes and events which led
to the current partnerships, particularly the reasons for their initiation, their operating
framework and their stages of development.
Qualitative research strategies have developed and emerged over time, and include
ethnographies, grounded theory, case studies, phenomenological research, narrative
research, and action research. For this research it was decided that a case study strategy
would be a suitable approach. The case study approach and justification for this choice are
detailed below.
Justification for Case Study Approach
The case study strategy has been used widely across many disciplines including the
investigation of organisational issues and information systems development and operation.
Benbasat et al. (1987) proposed a suitable definition of the case study approach for
understanding information systems and provides a useful description of the approach for
investigating ICT and data sharing partnerships.
“A case study examines a phenomenon in its natural setting, employing multiple methods
of data collection to gather information from one or a few entities (people, groups, or
organisations). The boundaries of the phenomenon are not clearly evident at the outset of
the research and no experimental control or manipulation is used.” (Benbasat et al. 1987,
p. 370).
The authors advocate the case study approach in the information systems area because the
field is characterised by constant technological change and innovation, and researchers can
study the innovations put in place by practitioners rather than providing the initial wisdom
for the ideas.
Chapter 4 – Research Design and Methods
97
Yin (1993) suggests the case study approach as the method of choice when the
phenomenon under study is not readily distinguishable from its context. Examples of such
complex interactions and its context include advanced technologies, community
organisations, inter-organisational partnerships and management information systems. The
author also identifies that case studies are suitable “when how or why questions are being
posed, when the investigator has little control over events, and when the focus is on the
contemporary phenomenon within some real-life context” (Yin 1994, p. 1).
Hamel (1993) suggests that goals of a case study are to reconstruct and analyse a case from
a sociological perspective.
Qualitative approaches such as case studies have often been viewed as being inferior to
quantitative approaches, suitable primarily for either stand-alone descriptions of
phenomena or as exploratory research preliminary to the real research of generating
hypotheses and testing them statistically (Benbasat 1984). Although similar comments
were common in early case study approaches, frameworks now exist which provide both a
rigorous (Yin 1994) and scientific approach (Lee 1989) for the development of case
studies.
In this research, the case study approach was selected to examine a number of spatial data
sharing partnerships in different jurisdictions. The case study approach was deemed to be
suitable for investigating these partnerships for a number of reasons:
1. firstly, the data sharing partnerships could be studied in their natural settings and
provided the opportunity to learn from current approaches and practice (Benbasat
et al. 1987; Maxwell 1996);
2. secondly, the case study approach enabled the “how” and “why” research
questions, specifically the nature and complexity of spatial data sharing
partnerships to be investigated (Benbasat et al. 1987; Yin 1994);
3. thirdly, the case study approach provided a suitable framework for analysis and
classification of the data sharing partnerships (Lee 1989; Yin 1994); and
4. finally, the case study approach provided a high level of data currency as well as
data integrity (Bonoma 1985).
Williamson and Fourie (1998) advocated the use of a case study methodology to more
rigorously research cadastral reform. They argued that a useful technique for the authors
was to utilise a case study approach that linked humankind issues (in an anthropological
context) with an existing knowledge base.

A Local-State Spatial Data Sharing Partnership Model to Facilitate SDI Development
98
Case studies can be exploratory, explanatory or descriptive (Yin 1993). Exploratory case
studies by their nature discover new theory. The hypotheses are developed progressively,
and often after the completion of the data collection. However, they are sometimes
criticised for lacking rigour and structure. The exploratory or descriptive approaches such
as the example described by Williamson and Fourie (1998), provide an useful framework
by which the cases can be described and classified. This thesis has adopted the descriptive
and explanatory approach for analysing and describing the data sharing partnerships as it
allows a more rigorous framework by which to classify the partnerships.
4.3.3 Quantitative Methods
Quantitative research uses numbers and statistical methods to explain and validate
phenomena. Quantitative methods focus on “measurements and amounts (more or less,
larger or smaller, often or seldom, similar or different) of the characteristics displayed by
people and events that the researcher studies” (Thomas 2003, p. 1).
The design approach and application of quantitative methods may differ significantly from
a qualitative approach, but they may also converge. For example, both methods may
utilise the use of theories as the basis for their design. For quantitative studies, a theory
can help define the research questions, which then define the research variables or factors,
and finally the instruments to measure these variables. This deductive approach becomes
a framework for the entire study and an organizing model for the research questions and
data collection procedures (Creswell 2003).
Quantitative research may use a variety of strategies including the conduct of surveys or
experiments. In the case of a survey or questionnaire, a number of target variables relating
to the research questions are firstly defined and then data is collected via an appropriate
method, analysed and presented. Experiments consist of treating objects in a defined way
and then determining how the treatment is influenced under a variety of conditions
(Thomas 2003). The strength of quantitative strategies lies in their ability to efficiently
include a large number of participants through instruments such as surveys, and then the
ability to analyse those variables comprehensively and quickly using computing methods.
It also provides the potential to assist in identification of key factors, correlations and
possible trends.
4.3.4 A Mixed Method Approach – Best of Both Worlds
The debate over the benefits of qualitative versus quantitative methods continues, with the
proponents in each camp vigorously defending the benefits and rigour of each approach

Chapter 4 – Research Design and Methods
99
(Tashakkori & Teddlie 2003). However, in recent times researchers have begun to re-
examine these previously isolated approaches (Creswell 2003). Methods in theory and
practice have continued to emerge with new strategies such as participatory approaches,
advocacy perspectives, critical appraisal and pragmatic ideas being advanced (Lincoln &
Guba 2000). The field of mixed methods research has developed as a pragmatic approach
to utilise the strengths of both methods.
Mixed methods research is a logical extension of the current re-examination and
exploration of new practices. As Creswell (2003, p. 4) identified:
“Mixed methods research has come of age. To include only quantitative or qualitative
methods falls short of the major approaches being used today in the social and human
sciences. …The situation today is less quantitative versus qualitative and more how
research practices lie somewhere on the continuum between the two.... The best that can
be said is studies tend to be more quantitative or qualitative in nature.”
The definitions for qualitative and quantitative methods vary with individual researchers,
especially when the understanding of the actual methods is examined (Thomas 2003).
Methods such as grounded theory – where theory emerges during the data collection
process, and participatory approaches, where the researcher takes the role of a participant
or an observer, do not comfortably fit with traditional qualitative methods. These
approaches extend the often accepted boundaries of these methods as new research
strategies are developed. Mixed method design can incorporate techniques from both the
qualitative and quantitative research traditions in a unique approach to answer research
questions that could not be answered in another way (Tashakkori & Teddlie 2003, p. x).
The mixed method approach differs from other variants within the individual research
paradigms of qualitative and quantitative research (Brannen 1992). Teddlie and
Tashakkori (2003) identify three reasons where the utility of mixed methods research may
be superior to single method approach:
1. mixed methods research can answer research questions that other methodologies
cannot;
2. mixed methods research provides better (stronger) inferences; and
3. mixed methods provide the opportunity for presenting a greater diversity of
divergent views.
The above reasons, although general in context, provided the basis for justifying the mixed
method approach as a suitable research approach in this thesis. Firstly, the mixed method

A Local-State Spatial Data Sharing Partnership Model to Facilitate SDI Development
100
approach not only enabled the exploration and description of existing partnership
arrangements, particularly the “why” and “how” of the arrangements, but also facilitated
the measurement or quantification of the value of these arrangements. The research
questions identified previously are also difficult to answer through any single approach. A
case study approach was deemed as a suitable approach to addressing the “why” and
“how” questions. However, in order to gauge and evaluate the impact of large multi-
participant data sharing partnerships, a quantitative approach was more appropriate. The
addition of a questionnaire provided a convenient process to evaluate the success and
perspectives in multi-participant partnership initiatives.
Secondly, the weaknesses of a single approach are minimised through the complementary
utilisation of other methods. The qualitative case study approach provided the opportunity
to investigate the organisational aspects of the partnerships in greater depth, whilst a
quantitative survey of a larger number of partnership participants provided a greater
breadth of views.
Finally, the opportunity to investigate and present a greater diversity of views was
considered important in validating the research findings. This was valuable because it led
to the re-examination of the conceptual framework and underlying assumptions of each of
the two methods (Teddlie & Tashakkori 2003). The diversity and divergence of
perspectives between government jurisdictions such as state and local government is well
known. Importantly, this reflects the reality of the relationships and hence the health of
the partnership arrangements.
4.3.5 Ways of Combining Qualitative and Quantitativ e Methods
An important consideration when using a mixed methods approach is the way in which the
qualitative and quantitative methods are combined (Brannen 1992). The pre-eminence of
one strategy over the other have been enumerated by Bryman (1998) as three possible
approaches, namely:
1. the pre-eminence of quantitative over the qualitative;
2. the pre-eminence of qualitative over the quantitative; or
3. the qualitative and quantitative are given equal weight.
In the first approach the qualitative work may be undertaken prior to the main quantitative
study and may be used as a basis for hypothesis testing, developing the research instrument
or clarification of quantitative data. The qualitative work may be performed at an early
stage but can also be revisited at a later opportunity.

Chapter 4 – Research Design and Methods
101
In the second approach, the quantitative study can be conducted as a preliminary to the
main study or at the end of the main study. It can provide background data to
contextualise small intensive studies, test hypotheses derived through qualitative methods
or provide a basis for sampling and comparison. The final approach provides equal
weighting to each method. The two studies are considered as separate but linked, and can
be performed simultaneously or consecutively. The processes may be linked at various
stages in the research process and then integrated to formulate the final outcomes.
The priority, implementation timing, stage of integration and theoretical perspectives can
assist in classifying the mixed method approach (Creswell et al. 2003). The authors
propose six design types through the application of these four criteria (see Table 4.1).
Table 4.1 Mixed method design types (Creswell et al. 2003, p. 224)
Design Type Implementation Priority Stage of Integration
Theoretical Perspective
Sequential explanatory
Quantitative followed by qualitative
Usually quantitative; can be qualitative or equal
Interpretation phase May be present
Sequential exploratory
Qualitative followed by quantitative
Usually qualitative; can be quantitative or equal
Interpretation phase May be present
Sequential transformative
Either quantitative followed by qualitative or reverse
Quantitative, qualitative or equal
Interpretation phase Definitely present
Concurrent triangulation
Concurrent collection of quantitative and qualitative data
Preferably equal; can be quantitative or qualitative
Interpretation phase or analysis phase
May be present
Concurrent nested
Concurrent collection of quantitative and qualitative data
Quantitative or qualitative
Analysis phase May be present
Concurrent transformative
Concurrent collection of quantitative and qualitative data
Quantitative, qualitative or equal
Usually analysis phase; can be during the interpretation phase
Definitely present
This research followed the fourth typology, whereby the qualitative and quantitative
studies are considered approximately equal. The qualitative case studies of three
partnership arrangements were examined and described initially. The insights from these
partnership case studies provide an understanding of not only the issues, but also the
context of their development with each jurisdiction. The initial understandings then
provided the basis for the development of the survey instrument distributed to local
government. The cases were then revisited and clarified in association with the
quantitative analysis. In terms of the design classification types proposed by Creswell et
al. (2003), the concurrent triangulation classification (highlighted) is perhaps the closest
fit.

A Local-State Spatial Data Sharing Partnership Model to Facilitate SDI Development
102
The mixed methods approach however is not without its problems, and care must be taken
in the integration and interpretation phases of the research (Bryman 1992). However,
when properly combined and guided by an understanding of the research purposes and
problems, the mixed methods approach is a powerful approach.
4.3.6 Research Design
The research design is illustrated in Figure 4.3. The design consisted of four stages which
culminated in a model for local-state government data sharing partnerships.
Figure 4.2 Research design

Chapter 4 – Research Design and Methods
103
This design draws together a generalised design framework for case study approaches
proposed by Yin (1994), Onsrud et al. (1992), Lee (1989) and Williamson & Fourie
(1998). The three stage process of Williamson & Fourie (1998) was extended to include
the quantitative methods and the integration of both qualitative and quantitative results.
A number of mixed method design frameworks have emerged in recent times (Creswell et
al. 2003; Johnson & Onwuegbuzie 2004; Nedovic-Budic Unpublished; Tashakkori &
Teddlie 1998). The design in Figure 4.2 followed the process of contextualising the
research and framework development, conduct of qualitative case studies and quantitative
surveys, model development and validation.
The following sections of this chapter will detail the research methods used throughout this
research.
4.4 Research Methods The research method describes the four stages proposed in the research design namely:
1. Stage 1 – Review of theory and framework development
2. Stage 2 – State Government organisational case studies
3. Stage 3 – Local Government multi-participant questionnaire
4. Stage 4 - Integration, model development and validation
4.4.1 Stage 1 – Review of Theory and Framework Deve lopment
The first stage of the research provided the foundation for development of a suitable
conceptual framework for the initial data collection and assessment. For the organisational
case studies of the state governments, the conceptual framework was developed from
organisational and collaboration theory. A variety of researchers (Child et al. 2005; Gray
1985; Mulford & Rogers 1982; Oliver 1990; Prefontaine et al. 2003) have identified a
number of important dimensions of collaboration including the collaborative environment,
the determinants for collaboration, the collaborative process and the performance of
collaborative initiatives. The theory within these areas enabled the development of a basic
framework for exploring the initiation, development and operation of the state government
partnerships.
One of the primary purposes this research of the data sharing partnerships was to
investigate their contribution to SDI development at local and state levels. Therefore,
conceptual framework for the local government questionnaires was developed around the
SDI elements identified by a range of authors (Coleman & McLaughlin 1998; Groot 1997;

A Local-State Spatial Data Sharing Partnership Model to Facilitate SDI Development
104
National Research Council 1993; Rajabifard & Williamson 2001). These components
include data, people, standards, institutional framework/policies and technology/access
arrangements.
Case Study Selection
The case studies investigated existing data sharing partnerships between state and local
governments in Australia which had been established to facilitate the sharing of property
related data. The three Australian states of Queensland, Victoria and Tasmania were
chosen as the basis for the research study (see Figure 4.3). The states were selected on the
basis of an existing data sharing arrangement being in place and a variety of characteristics
including geographic area, population and the number of local governments. The State of
Queensland is the second largest state in Australia by area, and also contains a large and
varied group of local governments. Its capital city of Brisbane, represents one of the
largest local government jurisdictions in the world. Queensland also has a relatively large
number of local governments, 125 in total, including many in remote rural communities
with very small population bases.
Figure 4.3 States chosen for case studies (1) Victoria, (2) Queensland and (3) Tasmania
At the other end of the spectrum, the State of Tasmania is a compact island state that has
only 29 local governments and approximately half a million people. It provided a
contrasting study of a smaller jurisdiction both in area and in the number of partnership
participants. The third case selected was the State of Victoria with 79 local governments.
Victoria is one of the most populated states in Australia and is also well advanced in its
partnership arrangements. It complements the other two state jurisdictions and is
characterised by having a mid sized geographic area and number of local governments. In
summary, these three states represent almost 50% of Australia’s population base,
approximately 35% of the total number of local governments and about 25% of the
geographic land area, thereby providing a contrasting mixture of local governments,
geography and institutional arrangements.

Chapter 4 – Research Design and Methods
105
4.4.2 Stage 2 – State Government Organisational Cas e Studies
A key objective of the qualitative component of case studies was to examine the
organisational frameworks of each of the state government initiated partnerships in order
to describe and then classify their operations.
Case Study Data Collection
For this qualitative component, the methods of data collection focussed on two primary
forms of evidence, namely interviews and existing documentation. A semi-structured
interview technique was utilised to collect data from staff within each state government
agency that was charged with the management of the partnership arrangement. The
structure of the interviews broadly covered the following topics:
• organisation overview and role of partnership;
• historical developments within the partnership;
• existing policy arrangements;
• an understanding of the data and data sharing processes;
• operational and resource aspects of the partnership;
• organisational and institutional arrangements; and
• barriers and issues – legal, technical, economic, institutional.
A list of the general questions utilised for the interviews is contained in Appendix 2. The
people interviewed included the partnership initiators, partnership managers and staff
involved in various data sharing activities.
The other key source of evidence for the case studies consisted of historical documentation
which had been in existence since the design and development of the partnership. The
documentation varied from state to state but included some of the following:
• initial proposal documents for the partnership;
• descriptive documentation such as that available on websites;
• examples of individual partnership agreements;
• internal review documents of the arrangements;
• external consultancy reports; and
• conference and journal papers describing the arrangements.
In the evaluation of each of the documents, care was taken to recognise the strengths and
weaknesses of the various forms of documentation, particularly with respect to any bias.
In case studies, one of the most important uses for documentation is to corroborate and
augment evidence from other sources to minimise possible bias.

A Local-State Spatial Data Sharing Partnership Model to Facilitate SDI Development
106
Descriptive Case Study Framework
An important objective of the research was to understand the differing partnership
arrangements in existence and to compare and classify these data sharing partnerships. A
descriptive framework for classifying these data sharing partnerships was developed from
a range of literature including the collaborative process (Child et al. 2005; Gray 1989;
Mulford & Rogers 1982), partnership process (Lank 2006; Lendrum 2000) and the
dimensions of collaboration (Prefontaine et al. 2003). The descriptive framework consists
of six main components, namely:
1. the jurisdictional environment;
2. the institutional environment;
3. establishment and direction setting;
4. partnership operation and maintenance;
5. governance; and
6. key outcomes.
The collaborative environment (components 1 and 2 above) was identified by a number of
authors (Alter & Hage 1993; Child et al. 2005; Gray 1985; Mulford & Rogers 1982;
Prefontaine et al. 2003) as an important component in collaborations. Within the
framework the jurisdictional environment was described across the dimensions of
geography, public sector, economy and property sector. The geographical dimension
provided a perspective on the complexities of government service delivery due to either
the number of government units, size or remoteness. These factors characterise the
jurisdictional structure and the possible impact of fragmentation which may act as a
determinant of collaboration (Mulford & Rogers 1982). The economic position and size of
the government sector primarily related to the availability of resources which were also
found to be a primary determinant (Mulford & Rogers 1982; Oliver 1990; Schermerhorn
1975). The property sector is also briefly examined to examine linkages to necessary
regulatory requirements (Halpert 1982; Oliver 1990) and mutual interdependence (Gray
1989; Mulford & Rogers 1982).
The individual institutional environment is described to examine the policy and legal
frameworks that exist at an organisational level. The importance of institutional issues
were identified in both spatial data sharing literature (Harvey 2001; Masser & Campbell
1995; Nedovic-Budic & Pinto 2000; Nedovic-Budic et al. 2004a; Obermeyer 1995; Onsrud
& Rushton 1995a) and collaboration research (Alter & Hage 1993; Child & Faulkner 1998;
Gray 1989). Within this institutional environment, historical developments which have
resulted in the partnerships between local and state governments are described. The

Chapter 4 – Research Design and Methods
107
establishment and direction setting component examines the processes which led to the
formation and signing of the partnership agreements. It includes the initial goals of the
collaboration, organisational changes that were effected to accommodate the new
arrangements, negotiation issues and the details of the final agreement. The extent to
which the initiating organisation researched the arrangements is also examined, especially
their understanding of prospective partners’ capacities. The partnership agreement issues
of importance included the term, incentives, responsibilities and flexibility.
The limited understanding of the partnership processes and performance were identified as
a gap in current research and its importance is supported by recent authors (Child et al.
2005; Prefontaine et al. 2003). The description of the operation and maintenance
component of the collaboration provides an indication of how embedded the partnership is
within the organisational structures. Important aspects which were examined included the
structure of the operations within the organisational unit, the project management, support
mechanisms for the partners, communication and resourcing. The governance
arrangements of each partnership were investigated to determine their inclusiveness of
stakeholders, decision making and responsiveness. Finally, key outcomes were examined
as a measure of the effectiveness of the partnership.
Case Study Comparisons
The comparative investigation of the case studies provided a mechanism to compare the
partnerships structures and operation. Comparisons across the three case studies were
undertaken to investigate the determinants for collaboration (Dedekorkut 2004; Gray 1985;
Mulford & Rogers 1982; Oliver 1990; Schermerhorn 1975), the performance in each of the
framework dimensions (Prefontaine et al. 2003) and the contribution of each partnership to
state SDI development (Williamson et al. 2003). The state government case study
reporting and analysis is presented in Chapter 5. For this component the unit of analysis
was considered to be the data sharing initiative or project.
4.4.3 Stage 3 - Local Government Multi-Participant Questionnaire
In order to assess the motivating factors, capacity and effectiveness of local-state
government data sharing partnerships, a questionnaire was designed and delivered to the
local governments in the three state government jurisdictions. The purpose of the
questionnaire was to assess a range of factors that could influence the success or otherwise
of the data sharing partnerships, particularly from a local government perspective. The
design of the questionnaire was constructed around an SDI framework to assess local
government capacities and their appreciation of policies, data holdings, people, access

A Local-State Spatial Data Sharing Partnership Model to Facilitate SDI Development
108
arrangements and standards/technology (Rajabifard & Williamson 2001). In addition to
the SDI framework, the questionnaire also investigated the organisational setting,
partnerships and collaborations and the participant’s perspectives on the existing
partnership arrangements.
The questionnaire consists of eight sections as follows:
Part 1 – The Organisation – This section quantified the size of the local government in
terms of properties and staff, provided an assessment of their ICT capacity and the local
government’s specific capacity within the GIS or spatial information area.
Part 2 – Policy on Use of Spatial Data – This section explored the existing policies
within the local government for access and pricing of spatial information including issues
of legal liability, copyright and privacy.
Part 3 – Accessing Spatial Data – This section examined the organisation’s arrangements
for accessing and pricing of spatial information both from an internal and external user’s
perspective.
Part 4 – About Spatial Data – This part of the survey examined the sources of spatial
data, the key providers, and the status of their data holdings.
Part 5 – Spatial Data Standards and Integration – This section investigated the use or
otherwise of standards and the degree of integration of the organisation’s spatial data
systems with other core systems. This provided an indication of the level of maturity and
integration of spatial information systems within the organisation.
Part 6 – About People – This section explored the human resources of the organisation
including staff turnover and access to training.
Part 7 – Partnerships and Collaboration – This section explored the perceived strength
of the organisations relationship with a range of organisations, the barriers/obstacles for
collaborating, the drivers for collaboration and the types of existing collaborations.
Part 8 – Specific Data Sharing Partnerships – The final section examined the
organisation’s specific attitudes and experiences with an existing SDI partnership.
For the majority of questions the responses were measured on a five point Likert scale in
order to standardise and categorise the responses. The debate over the consideration of
Likert scale data as either ordinal or interval data continues (Newman 1994), however, it

Chapter 4 – Research Design and Methods
109
has been argued successfully that Likert scales can validly be considered as interval data,
particularly if five or more scale points are utilised (Jaccard & Wan 1996). A number of
questions collected numeric data, for example to quantify staff and the number of land
parcels. Prior to this statistical analysis the descriptive Likert scale data was transformed
to numerical interval data between 1 and 5.
Areas were also available for participants to provide comments on each area of the
questionnaire. A copy of the questionnaire is given in Appendix 3.
Pre-testing and Refinement
A draft questionnaire was developed in hardcopy form and distributed to three local
governments to check for terminology and understanding of the questions being asked.
The questionnaire was then converted across to a web form to enable the digital collection
of the data to facilitate a higher return rate. The web based questionnaire was then tested
internally and also externally through two local governments to ensure that the URL
provided was accessible and also that responses were being recorded at the web server.
Questionnaire Distribution, Collection and Response Rate
The distribution of the questionnaire was undertaken after consultation with each of the
state agencies. The questionnaire sought responses from local government in a number of
areas that could reflect poorly or otherwise on the state government agency, so a degree of
sensitivity was required. Privacy of customer or partner information also became an issue
in the questionnaire distribution process. Under state and federal government privacy
legislation permission must be sought from individuals before their contact details can be
disclosed. This became a significant issue as it was critical that the questionnaire was sent
to the correct partnership contact person rather than the indiscriminate targeting of local
government staff. The privacy issue was addressed by the state government agency
making the initial contact to the LGA and seeking their permission to be involved with the
study. Once they agreed their details were passed on to the researcher.
Direct telephone contact was then made to each of the local governments to improve the
chance of getting a positive response to the survey. After the telephone contact an email
containing the URL for the survey was then sent to each LGA contact. After two weeks a
reminder email was sent to each of the contacts. Where direct contact information was not
provided to the researcher, the state government agency was given the wording for an
email requesting the completion of the research questionnaire and the URL for the
questionnaire. The agency then emailed these directly to their contacts.

A Local-State Spatial Data Sharing Partnership Model to Facilitate SDI Development
110
The survey was conducted between December 2004 and May 2005. Contact was made
with 183 LGAs across three states comprising: 74 in Victoria, 89 in Queensland and 20 in
Tasmania. A total of 110 responses were received including seven responses which were
rejected as either incomplete or invalid. The remaining 103 valid returns represent a
response rate for the survey of 56% (see Table 4.2). This response was considered to be
very satisfactory given the detail requested in the questionnaire and the diversity of local
governments involved. Queensland had the lowest response rate of 54%, but also has
some of the smallest and most geographically remote LGAs in Australia which accounted
for this response rate.
Table 4.2 Response rate as a percentage of LGAs
State LGA Questionnaires
Distributed
Invalid/Incomplete Responses
Valid Responses
Response Rate
Victoria 74 2 42 57%
Queensland 89 4 48 54%
Tasmania 20 1 13 65%
Total 183 7 103 56%
If the response rate is examined from the perspective of the number of properties that are
represented by each LGA, then the overall representation provided by the survey is
significantly higher, approximately 68% (see Table 4.3). Although Queensland had the
lowest response rate based on the number LGA returns, those LGAs that did respond
accounted for approximately 81% of the State’s properties. This is due to the high
response rate of LGAs in the heavily populated south-eastern corner of the state and
coastal communities. This response rate provides a more accurate picture of the local
government representation in the survey and identifies the inclusion of the larger and more
influential local authorities.
Table 4.3 Response rate as a percentage of the number of properties
State Total No. of Properties
No. of properties in LGAs responding
Response Rate
Victoria 2360000 1341958 57%
Queensland 1960000 1586651 81%
Tasmania 247000 158879 64%
Total 4567000 3087488 68%
The data from the questionnaires was automatically collected into an excel spreadsheet via
the web server. This process was extremely effective as it eliminated coding and
transcription errors and facilitated direct transfer to the analysis software.

Chapter 4 – Research Design and Methods
111
Two test statistics were utilised to assess the inter-state variations: the Kruskal-Wallis Test
and the Analysis of Variance (ANOVA). The Kruskal-Wallis Test is a non-parametric
test used to compare three or more samples. It is used to test the null hypothesis, that all
populations have identical distribution functions, against the alternative hypothesis that at
least two of the samples differ with respect to the median (Conover 1999). The ANOVA
test allows the comparison of several groups of observations, all of which are independent
but possibly with a different mean for each group. These two tests do not identify
precisely which pairs are significantly different and further independent testing of the pairs
may be required (Brace et al. 2006, p. 162).
For this component of the research the unit of analysis was the local government
organisation. Full details of the questionnaire and its implications is presented in chapter
6.
4.4.4 Stage 4 - Model Development and Validation
After the completion of the case studies and questionnaire analysis, the results are
integrated to develop a new data sharing partnership model which is presented in chapter
7. The state case study results assisted in providing a classification of the existing
partnerships in each of the three state government jurisdictions. The descriptive and
comparative analysis enabled a clearer understanding of the organisational structures,
policy objectives and goals, partnership structure, progress and outcomes, resource
requirements and sustainability. The perspectives gained from these cases assisted in
answering some of the research questions relating to “how” and “why” the spatial data
sharing initiatives were put in place, and identified some of the major issues related to
these initiatives. Importantly, it should be noted that the descriptive case studies primarily
provided the perspective of the partnership initiator and manager rather than partnership
participants.
In order to progress the research towards the development of a generic model, the
perspectives of local government were required to provide a more balanced view of the
success of the data sharing arrangements. The results of the questionnaire identified the
capacity and motivations of local governments to participate in data sharing partnerships.
The quantitative analysis enabled these factors to be identified and modelled against the
partnership outcomes.
The triangulation of methods as depicted in Figure 4.4 utilised multiple sources of
evidence including existing theory, case studies and survey results to inform the final
model. The internal validity of the model represents the validity of the research constructs.

A Local-State Spatial Data Sharing Partnership Model to Facilitate SDI Development
112
In theory, the use of mixed methods should be superior to each of the singular approaches.
However, care was exercised in the early conceptual development and design, as a
potential risk exists that rather than the method being complementary, it could in fact
provide conflicting results which could work to confuse at the stage of integration.
Figure 4.4 Internal and external validity of the mixed methods approach
The weakness of the case study approach is often identified as the limited sample of cases
being analysed, and therefore the difficulty in attempting to generalise the case study
findings. By undertaking a more wide-ranging survey of a large number of partnership
participants, the findings of the case studies were strengthened. This process of
triangulation thereby enhances the external validity of the research outcomes.
Finally, the model was validated through a process of critical review and assessment. The
model was firstly evaluated against the three partnership case studies to determine if each
of the partnerships contributed either positively or negatively to the various components of
the model. The contributions to SDI and the ability of the model to be generalised was
also assessed.
4.5 Ethical Considerations The research was undertaken in an organisational context but views expressed by
interviewees and participants of the questionnaire were in many cases personal opinions or
perspectives. Appropriate ethical approval to conduct the human research was gained
through the University Ethics Committee and individual government agencies were
contacted at an early stage to seek their support and approval. The information from the

Chapter 4 – Research Design and Methods
113
case studies and questionnaires remained confidential and was utilised for research
purposes only.
Prior to the interview process, background information to the study was provided to the
participants, and an explanation on the limitations and use of data was provided prior to
seeking their consent. In the case of the online questionnaire, the information was
provided online and participants were required to agree to participate before being allowed
to access the questionnaire.
Although it was organisational units at both state and local government levels that were
being studied, sensitivity was required in collecting and reporting of the data. At the state
government level the data sharing partnerships represent ongoing initiatives of the
government to improve the access and reliability of information to support many areas of
government delivery. During the study, a number of the data sharing arrangements were
being reviewed or renewed. The researcher took care to ensure that the ongoing
negotiations between state and local governments were not affected.
Collected data was held in a secure environment during and after the collection period.
The analysed data shown in this thesis has been aggregated at a number of appropriate
aggregation levels to protect the individual local governments from criticism or scrutiny.
Individual comments recorded in the data collection have not been directly attributed to
any individuals and any comments that were seen to be inflammatory or judged to be
unjustified were not utilised. Where data has been passed back to organisations as an
agreed part of the collection process, only high level aggregated data belonging to their
state jurisdiction was provided.
4.6 Chapter Summary This chapter presented the methodological framework for this research. The research
context provided by chapters 2 and 3 has been reviewed and the research questions
clarified. Both qualitative and quantitative approaches were examined in order to answer
the identified research questions. A mixed method design was adopted and justified as
being an appropriate strategy for the research on spatial data sharing partnerships.
The case study approach enabled an in depth study of three data sharing partnership
initiatives through a scientifically rigorous process. The quantitative analysis of the local
government surveys complemented the case study approach by providing validation of
concepts and issues. The results of both components are reported in detail in Chapters 5

A Local-State Spatial Data Sharing Partnership Model to Facilitate SDI Development
114
and 6. The development of a generic model through the integration of both qualitative and
quantitative data sources is later described in Chapter 7.
Chapter 5 – Results of Partnership Case Studies at State Government Level
115
5 Chapter 5 Results of Partnership Case Studies at State Government
Level
Chapter 5
Results of Partnership Case Studies
at State Government Level

A Local-State Spatial Data Sharing Partnership Model to Facilitate SDI Development
116

Chapter 5 – Results of Partnership Case Studies at State Government Level
117
5.1 Introduction The results of the case study investigations are presented over two chapters. This chapter
presents the results of the qualitative case study investigations of the data sharing
partnerships in three Australian states from the state government perspective. These
partnerships were initiated, coordinated and managed at a state government level, so this
analysis sought to answer the “how, why and what” research questions relating to
partnership development and operation. The results of the quantitative analysis of the
local government perspectives and involvement in the partnership arrangements are
presented in Chapter 6.
The primary objectives of the state government case studies were to:
a) understand why the data sharing partnerships were established (determinants and
motivations);
b) investigate what institutional arrangements were put in place to establish,
operationalise, manage and sustain the partnerships;
c) determine how the data sharing partnership have contributed to SDI development
at state level.
Two primary forms of data were collected in order to investigate the spatial data sharing
partnerships. Firstly, existing background documents such as information sheets, publicly
available reports, standard agreements and published papers provided background
information and a description of historical developments. Other internal reports in some
cases were made available to the researcher upon request. This information provided a
historical perspective of the partnership establishment and operations. However, there was
limited information on the negotiation process, organisational impacts or the day to day
issues of managing these partnerships.
Secondly, the documentation was complemented by a number of semi-structured
interviews with staff in each of the state government jurisdictions to explore the
organisational issues more closely. The interviews were conducted at both management
and operational levels which provided perspectives from the staff involved in the initiation,
design, implementation, management and operational processes of the partnerships. A list
of questions on the history of the collaboration, negotiation processes, partnership
management and outcomes was used as a basis for this investigation. The list of questions
for the semi-structured interviews is given in Appendix 2.
This chapter is structured in two parts. The first part of the chapter describes each of the
three case studies using the descriptive framework described in section 4.4.2. The second

A Local-State Spatial Data Sharing Partnership Model to Facilitate SDI Development
118
part of the chapter then analyses and compares the three case studies to identify common
structures, issues and learnings. Finally, some conclusions from the case studies are
presented.
5.2 The State of Victoria – The Property Informatio n Project
The first case study described is the Property Information Project (PIP) in the State of
Victoria. This data sharing initiative between the Victorian State Government and the
Victorian Local Government Authorities (LGAs) formally commenced in 1997, in
response to the significant duplication of effort and the emergence of a growing number of
disparate databases across the state relating to key property information.
5.2.1 The Jurisdictional Environment
Geography
The State of Victoria is Australia’s most compact state occupying only 3% of Australia’s
area but with approximately one-quarter of its population (see Figure 5.1). Victoria is
Australia’s most densely populated state with an average of 21 persons per square
kilometre, compared with the national average of 2.5 persons (Australian Bureau of
Statistics 2006a). As of June 2004, Victoria’s estimated resident population was 4.97
million people, representing 24.6% of the national population. In the 1970s and 1980s,
Victoria had a high level of interstate migration, mainly to Queensland and New South
Wales, reflecting the significant impact of the national recession on Victoria. However, in
recent years this trend has reversed and the state population has grown significantly.
Figure 5.1 Geographic location of the State of Victoria
Government Sector
The total size of the public sector in Victoria (federal, state and local governments)
decreased by over 33% between 1988 and 1999, as all levels of government downsized.
Victorian State Government numbers peaked at 317,000 staff in 1991, declined to 220,000
in 1999, before climbing again to almost 270,000 in 2005. In a similar pattern, local
government staff numbers peaked at approximately 41,000 staff in 1990, declined to
31,500 in 1999, before gradually increasing to around 38,500 in 2005 as illustrated in
Figure 5.2 (Australian Bureau of Statistics 2006a).

Chapter 5 – Results of Partnership Case Studies at State Government Level
119
Public Sector Employees Victoria 1983-2005
0.0
50.0
100.0
150.0
200.0
250.0
300.0
350.0
400.0
450.0
500.0
1983
1985
1987
1989
1991
1993
1995
1997
1999
2001
2003
2005
Em
ploy
ees
'000
s
Total
Federal
State
Local
Figure 5.2 Public sector employees Victoria 1983-2005 (Australian Bureau of Statistics 2006c)
It is important to note that the Property Information Project commenced in 1997, during
the period of government down sizing. The reduction of staff at federal and state levels
coincided with a period of economic decline in Australia and the start of an era of
government reform. The decrease in size of local government staff corresponded with
reforms in the 1990s to rationalise the number of small Victorian local government
authorities (LGAs) from 210 down to 79. The decline in the public sector workforce saw
an increase in the private sector workforce to approximately 2.14 million people in 2005.
Since 1996, the proportion of persons employed in the public sector compared to the
private sector in Victoria has declined from 20.5% in 1996 to 16.5% in 2006 (Australian
Bureau of Statistics 2006a). The declining size of the Victorian public sector created
human resource shortages within government agencies and hence encouraged cooperative
activities to reduce pressures on human resources.
Economic Environment
The Victorian economy has grown strongly since 2000, with annual growth of 3.9% which
exceeds the Australian average of 3.7%. The State accounts for 25.3% of Australia’s gross
domestic product (GDP) which also exceeds the national average on a per capita basis
(Australian Bureau of Statistics 2006d). Victoria has long been recognised as a major
centre of Australian manufacturing, however in recent years this trend has changed and its
economy is now dominated by the services sector. In the late 1980s and early 1990s, the
Victorian economy was significantly depressed which reflected the government policies to
down size.
Property Sector
In 2004, there were 2.36 million rateable properties in Victoria valued at $771 billion.
This compares with 2.25 million rateable properties in 2002 and 2.17 million in 2000,

A Local-State Spatial Data Sharing Partnership Model to Facilitate SDI Development
120
valued at $557 billion and $442 billion respectively (Department of Sustainability and
Environment 2004). Since 2000, there have been approximately 50,000 new rateable
properties per year coming into the land market. In 2004, the revenue from land tax
amounted to $749 million and duties on property transactions raised over $2.45 billion
(State Revenue Office Victoria 2005). These figures serve to indicate the importance of
the property sector to the Victorian economy, and hence underscore the value of good
information to this sector and the community overall.
5.2.2 Institutional Environment
Organisational Profile
The State of Victoria commenced its computerisation of land information and digital
mapping in the early 1980s with the establishment of an agency, LANDATA, to coordinate
the development of a state-wide land information system. The agency experienced a range
of difficulties, including under resourcing, which resulted in the implementation of a
counter-productive cost recovery policy. In 1991, the lack of progress in coordination of
geographic information, particularly within the natural resources area led to the
establishment of the Office of Geographic Data Coordination (OGDC) under the
Department of Finance (Nedovic-Budic et al. 2004b).
An important stage of the development and coordination of spatial information in Victoria
was a study the OGDC commissioned in 1991 which identified the diversity and
duplication of digital spatial information holdings across state agencies. The study
identified the importance of spatial information from both a strategic and economic
perspective (Office of Geographic Data Coordination 1993). It also provided the basis for
further institutional reforms around 1997, including the development of the first of a series
of Victorian Geographic Information Strategies (VGIS). This era heralded a change in
policy and strategy which resulted in a more co-operative and collaborative approach to
spatial information management.
During this period, the majority of property related activities in Victoria were managed in
the Department of Natural Resources and Environment (DNRE). The primary division
responsible for the management of property related information was Land Victoria. In
2002, the new Department of Sustainability and Environment (DSE) was established. The
responsibility for spatial information policy and SDI development was transferred to a
separate division called Spatial Information Infrastructure (SII). DSE is a large multi-
sectoral department with over 2700 staff, which manages parks, water, land, natural
resources and environment (Department of Sustainability and Environment 2006).
Chapter 5 – Results of Partnership Case Studies at State Government Level
121
In September 2004, the Victorian Spatial Council was established as the peak body for
spatial information in Victoria. Its membership comprises of representatives of the peak
spatial information associations for business, government, academia, the professions and
key interest groups. These sectors work together through the Council to lead a coordinated
whole of industry approach to spatial information policy development, management and
utilisation (Victorian Spatial Council 2006). In 2005, the VSC established a draft policy
on data sharing frameworks in order to encourage an environment conducive to the sharing
of spatial information across the state (Victorian Spatial Council 2005).
History of the Property Information Project (PIP)
In Victoria, as in other states, land administration and titling is a state government
responsibility. However, unlike most other Australian states, the responsibility for the
production of the cadastral mapping base was split between two organisations namely, the
Melbourne Metropolitan Board of Works (now Melbourne Water Corporation) and Land
Victoria (the State Government mapping agency). The lack of a single custodian, and
hence authoritative dataset, was identified as a major limitation in the development of a
digital cadastral mapbase (Office of Geographic Data Coordination 1993). In 1994, a
negotiated agreement between these organisations placed the control of the mapbase with
the state government and facilitated the coordinated integration of the digital mapbase.
Taking over the custodianship of the integrated cadastral mapbase for the entire state
created a new set of challenges for Land Victoria. As well as the need to expand its
ongoing mapping activities, it now also had to maintain approximately 2.4 million land
parcels with approximately 50,000 new parcels being added each year. With the declining
budgets and public sector workforce, it was assessed that Land Victoria did not have the
operational capacity to meet the increased workload (Jacoby et al. 2001). A decision was
therefore made to outsource the management and maintenance of the mapbase to the
private sector, although Land Victoria remained as the custodian and owner of the
intellectual property. The outsourcing provided the opportunity to re-engineer the
cadastral database to provide new functional requirements, particularly to recognise both
parcels and properties.
The recognition of the utility of property and street address by users outside of the
traditional land administration sector was fundamental to Land Victoria embarking on the
Property Information Project (PIP) in 1997. Prior to the PIP, many larger and metropolitan
local governments were already well advanced in their GIS development, including the
utilisation of the digital mapbase. LGAs were charged substantial licensing fees in line
with the cost recovery policies that dominated the late 1980s and early 1990s. Typically,

A Local-State Spatial Data Sharing Partnership Model to Facilitate SDI Development
122
these fees were of the order of $1.00 per land parcel, with the average sized council
charged between $10,000-40,000 annually. This was a significant impost on many LGAs,
and with a third of local governments not utilising the mapbase, the licence fees presented
a major barrier for entry (Jacoby et al. 2002). During this period, local governments were
still expected to contribute their data for free to the state government agencies, particularly
emergency services. This resulted in significant ill-feeling and distrust towards the state
government by the LGAs.
In addition to the state and local governments, the Municipal Association of Victoria
(MAV) also began to take a keen interest in the project. As the representative body for
local governments in Victoria, the MAV believed that it had a role to play in the
development of the agreement. It should also be recognised that MAV had just undergone
a substantial period of change where the number of local governments in Victoria was
reduced from 210 to 79 over an 18 month period. The restructuring had significant
financial implications for the MAV which relies on subscriptions from each council.
5.2.3 Partnership Establishment and Direction Setti ng
Goal
The goal of PIP was to establish a common geospatial infrastructure between state and
local government based around the digital cadastral mapbase (Jacoby et al. 2002). The
planned outcome of this infrastructure was a complete mapbase of all of Victoria’s land
parcels with their relationships to properties and the corresponding street address.
Negotiation Phase
The State Government recognised at an early stage that good communication with the 79
local governments was critical. The first stage of this process was a letter of introduction
to each LGA providing some background details of the initiative. This was followed by
face to face meetings between July and December 1997 with the Chief Executive Officer
(CEO) of each LGA. The meetings enabled the DSE to present the importance of the
project to senior management and to seek ‘in principle’ support for the project. During
these early stages, the State Government recognised that the capacity of each local
government needed to be researched and better understood. By the end of 1997, 16 of the
79 LGAs had indicated their in principle support, which grew to 53 by June 1998, and by
the end of 1998 all of the 79 LGAs had indicated support for the project.
A brief study was commissioned to identify the status of local governments with respect to
GIS development and future directions. The study identified a range of trends such as the
maturity of LGA’s GIS, location of GIS units within the organisations, general GIS

Chapter 5 – Results of Partnership Case Studies at State Government Level
123
knowledge base and variations due to geographical location and size. This data enabled
the planning and estimation for the costing of the proposed work plan associated with the
project. Importantly, it also identified the usage of the cadastral mapbase by local
governments. At the start of the project one third of the local governments were not using
any digital cadastral mapbase and only four were utilising the mapbase maintained by the
state government. However, by the end of 2000 this had changed dramatically with 71
LGAs using this data and only eight LGAs not using any digital mapbase (See Figure 5.3).
The category of “Non-maintained Use” refers to LGAs that have made a one off purchase
of the mapbase and do little or no ongoing maintenance, whilst the “Maintained by Others”
category refers to the mapbase being maintained by authorities such as Melbourne Water.
The proposed work program included activities such as capacity building (hardware,
software and training) and reconciliation of both organisation’s property and parcel
databases.
0
1 0
2 0
3 0
4 0
5 0
6 0
7 0
N o t U s in gV ic m a pP ro p e rty
N o n -m a in ta in e d
U s e
M a in ta in e db y O th e rs
M a in ta in e db y L a n dV ic to r ia
Note: Blue=Start of PIP 1996, Red =PIP in 2000 Figure 5.3 Increased use of the DSE mapbase by LGAs ( Jacoby et al 2002)
Format of Partnership Agreements
The partnerships were formalised through a licence agreement that was executed between
each LGA and State Government, and included an agreed program of works. The
agreement, as much as possible, was a standard licence contract which identified the
objective of the project, responsibilities of each party, term of the agreement, data
ownership, intellectual property and use of data.
In 2003, with the growing recognition of the importance of address data, a new address
standard, the Rural and Urban Addressing Standard AS/NZS 4819, was developed to
provide a comprehensive standard for address information for both urban and rural areas.
However, the new standard also created some additional complexities with respect to its
implementation and adoption. In the case of local government, many of their existing
property systems had to be amended to utilise the new standard. It was the responsibility
of the software vendors to update their software to the new standard, however there was

A Local-State Spatial Data Sharing Partnership Model to Facilitate SDI Development
124
very little incentive for them to do so. At the time of the case study analysis, there were
eight different local government property/rating software systems in use across the 79
local governments in Victoria. As illustrated by this example, the private sector vendors of
local government property systems are an important component in the process of
establishing interoperability across jurisdictions.
The term of the PIP agreement was three years, with capacity to review the agreement
annually. Initially, some LGAs were seeking a longer term agreement to ensure that there
was certainty for the future of the project. This resulted in a modification to the original
agreement to facilitate the option of a rolling three year term which could be renewed
annually. With respect to intellectual property, each party retained ownership of their data
sets. In the case of the State Government, this was the State Digital Map Base (SDMB),
and for the LGAs it was the street address and property information. Under the agreement
Councils were limited to use the SDMB for their internal business purposes only.
In recognition of the efforts of local government, the State provided up-front funding of
approximately three million dollars to provide technical support and to offset some of the
LGA development costs. Depending on the size of the LGA, an incentive payment of
$20,000-$40,000 was provided during the establishment phase of the project (Jacoby et al.
2002).
After the initial in-principle support expressed by LGAs for PIP, it took over three years to
get all of the LGAs signed up to the formal agreement. Within the first year 55% of LGAs
had signed the PIP contracts; by the end of the second year this number had increased to
almost 80%; and after three years this was almost up to 90%. By the end of 2002, the last
of the LGAs had signed the PIP contracts. Although the local government CEOs had
endorsed the project, it came down to individual LGA officers to implement and signoff
the work programs and contracts. Delays in signing were often a result of personality
problems rather than technical issues.
5.2.4 Operation and Maintenance
Many of the ongoing changes and maintenance requirements in the digital mapbase are the
result of the subdivisional process. The process commences with an application for
development or subdivision with the local government. This process then triggers a range
of activities including planning assessments, referrals to other agencies, cadastral surveys
over the property, issuing of titles, allocation of street names and street address numbering.
During the development process new land parcels and/or properties are created which
require the allocation of a street address (street number and name) by local governments.

Chapter 5 – Results of Partnership Case Studies at State Government Level
125
Data Exchange Process
Under partnering the arrangements the State Government, through DSE, maintains and
distributes the digital mapbase to LGAs. LGAs then provide land parcel and property data
to DSE to update the state mapbase and database products. The approach follows the
principle that data is best collected by the authoritative source (local government), and
then compiled into a state wide database. The LGAs submit to the DSE the following
data:
• property address and numbers, known as the M1 form – this is aspatial information
• proposed plans of subdivision;
• land parcel changes, known as the M2 form – this is spatial information; and
• road name information.
The general data exchange process is shown in Figure 5.4.
Figure 5.4 Data exchange process under PIP (Alexander Tomlinson P/L 2006)
The frequency and quality of the M1 and M2 forms is recorded by LogicaCMG, the
private sector firm that is the data manager. Once the data processing is completed by
LogicaCMG new updates are submitted back to the LGAs. In December 2004, there was a
backlog of approximately 2,500 land parcel changes that needed to be completed in order
to update the mapbase. Each of these changes was estimated to cost approximately $30 to
complete, thus an immediate injection of funds of the order of $100,000 would be required
to reduce this ongoing backlog.
As a result of the downsizing of the operational mapping and data collection capabilities of
the State Government, the maintenance operations of PIP are mostly performed by this
same private sector company. As identified earlier, DSE outsourced the maintenance of its

A Local-State Spatial Data Sharing Partnership Model to Facilitate SDI Development
126
mapbase as it no longer had the capacity to maintain this dataset. When PIP was
established, LogicaCMG’s maintenance process was expanded to also include the building
of the address and property linkages. The revised mapbase and related data bases are
supplied back to DSE on a regular basis to enable the update of a range of DSE products.
Project Operation and Management
PIP has a dedicated project manager who oversees not only PIP but a number of related
projects that have been linked to the PIP initiative including the rural addressing project
and the road names project. The rural addressing project was established to implement the
provision of a standardised street number and street name for the rural properties in a
similar way to urban properties. Rural properties were often identified in records by a
variety of methods including homestead name, lot numbers or post office box numbers.
The new standardised system enables street or road address to be allocated to each
property and greatly assists the location of a rural property in the event of an emergency.
Resources
The interface between the State Government (DSE) and the local governments is
undertaken by a group 10 staff (6 equivalent full time staff), who act as liaison officers
between the DSE and LGAs. Their role is to assist LGAs in the delivery of the data
through technical support, feedback on data quality and timeliness, and the provision of
training programs.
Communication
The issue of communication and relationship building was identified at a very early stage
as an important component of the partnership arrangements. In addition to regular
telephone and email communication, a secure website was established to provide a
resource base for LGAs to access information regarding the project and to also log issues.
A small information sheet or newsletter titled “Giving you the PIP” was also developed to
provide a regular update to all LGAs on the overall project status and useful information
on initiatives and common problems.
Reporting and Auditing
In 2004, the program began a process of monitoring and benchmarking each LGA to assess
the ongoing progress. Initially the process began as a status report or survey which was
completed every six months to provide a quantitative assessment of the performance of
each LGA across the key areas of data matching, frequency of data submission, plan
lodgements, data quality and participation in GIS improvement activities.
Chapter 5 – Results of Partnership Case Studies at State Government Level
127
LGAs were rated from 0-100 in these areas based on their assessed performance. Some of
the measures such as match rates and lodgement rates were easy to identify and could
provide a defined score out of 100. However, the area of participation was more difficult
to benchmark accurately and it was up to the liaison officers to make a subjective
judgment. The assessments performed by each of the PIP liaison officers were compiled
into a single report that is used internally to assess progress and participation of each LGA.
Individual progress provided back to the LGAs were used as a tool for continuous
improvement during the project. In some cases the CEO or manager of the local
government section received the performance report and then encouraged the local
government officer to improve the LGA’s performance. The success of this initiative has
resulted in the formalisation of the process via the Property Information Audit Project.
The performance report appears to be a useful mechanism to provide an overall picture of
the progress of the project, particularly from a management perspective. It was
immediately evident from the report that matching rates in rural areas reflected a lack of
capacity or attention being paid to the rural LGAs.
By 2004, the PIP manager and staff had identified that the project had matured and should
be viewed as a program rather than a project, as it was now heavily into the operation and
maintenance cycle. Long term improvements in efficiency and sustainability were now
identified as the greatest challenges.
5.2.5 Governance
The PIP process is managed by a project manager within the DSE who reports to the
director of the Spatial Information Infrastructure group on its progress and performance.
For the purpose of project management this arrangement proved adequate, however it
became obvious that the partnership program was not sufficiently inclusive of all the
parties within the initiative. Therefore, to sustain PIP in the longer term other
arrangements needed to be considered. This resulted in the formation of the Local
Government Spatial Reference Group (LGSRG) in January 2003. The charter of the group
is to:
• develop sector-wide positions on key spatial issues relating to local government,
• take advantage of opportunities for local government collaboration,
• generate increased awareness of spatial management issues across the sector,
• seek resources to progress priority projects on a sector-wide basis, and
• advocate on behalf of local government to other key stakeholders (LGSRG 2005).

A Local-State Spatial Data Sharing Partnership Model to Facilitate SDI Development
128
The Local Government Spatial Reference Group is supported by the Municipal
Association of Victoria (MAV) which provides meeting facilities for the bimonthly
meetings, webpage hosting and correspondence. The LGSRG has a maximum of 16 Local
Government members plus a representative from the MAV. It meets on average four or
five times each year and interacts with the DSE as required (LGSRG 2005).
After the establishment of the Victorian Spatial Council (VSC) in September 2004, the
importance of PIP was quickly recognised and reporting on the progress of PIP became a
regular agenda item of the VSC. The VSC also oversaw a review process of the project
which commenced in March 2005, and concluded with a recommendation and migration
plan in February 2006 (Victorian Spatial Council 2006). Although the linkage and
reporting of PIP to the VSC does not reflect a permanent governance arrangement for the
project, it does provide a more open and inclusive mechanism for reporting the
performance, project management and major issues with respect to PIP.
5.2.6 Key Outcomes
The PIP partnership has delivered a number of significant benefits to both state and local
government, including:
• the introduction of GIS to many small local governments;
• a more comprehensive mapbase for use by both state agencies and LGAs;
• a single high quality authoritative property and address database for use by
emergency service organisations;
• improved intergovernmental relations;
• the authoritative database for the web portal for public access to land information
in Victoria;
• facilitation of other key projects such as rural addressing, valuation and planning
information to be integrated; and
• a contribution towards the national geocoded address file (G-NAF).
5.2.7 PIP Review
A comprehensive review of the partnership program was undertaken in 2005, to assess the
performance of the project against industry ‘best practice’ and to recommend a migration
strategy to assist the partnership initiative to move to a more sustainable program
environment (Alexander Tomlinson P/L 2006). The report was conducted by an
independent consultant, Alexander Tomlinson P/L, and funded through contributions from

Chapter 5 – Results of Partnership Case Studies at State Government Level
129
the DSE and individual local governments. The review consisted of on-site interviews
with 71 LGAs, DSE staff, MAV, the data maintainer, other state agencies and users.
The review identified several key findings which were presented in a series of reports to
DSE, MAV, local governments and the Victorian Spatial Council. The review highlighted
the importance of PIP to Victoria’s spatial information infrastructure, but identified that
the program did not have a clear strategic direction, particularly in relation to other spatial
and information initiatives across government. It also found that the need for a single
authoritative lands records base was essential if other DSE initiatives were to be effective
(Alexander Tomlinson P/L 2006).
The review reported that the PIP had achieved significant improvements in the accuracy
and integrity of both local and state government property databases, but it was evident that
the initiative was losing momentum, and a range of processes should be re-engineered to
improve their effectiveness. During the review several LGAs indicated a preference for
legislation to support the exchange of information between local and state government.
Council officers believed that having legislation in place would enable them to lobby more
effectively for resourcing as the process would then become a core function of the
organisation.
5.2.8 Case Summary
The case study of the Property Information Project in Victoria has revealed a number of
important aspects of data sharing partnerships, and the project, in particular. Firstly, the
environment that existed when the project was initiated in 1997 was considered to be
conducive to collaboration due to limitations on staff and resources at both state and local
government levels. The lack of a cohesive state-wide mapbase and the growing demand
for this dataset to support other initiates was also a key motivator. Secondly, the data
share arrangements were initially well funded and managed, particularly during the
negotiation and establishment phase. This provided a strong platform to build
relationships with LGAs. Financial incentives and an equitable approach to the sharing of
data sets instilled a high level of trust between the State Government and the LGAs.
The operational and maintenance phase of the program identified the need for continued
relationship management and communication. The continuing process of maintenance has
shown that resourcing demands of this phase are high and were perhaps under-estimated.
The value of performance measurement to the project was not identified in the initial
stages of the project, but is now implemented as part of the project management processes.
The issue of governance, inclusiveness and transparency of the data share arrangements

A Local-State Spatial Data Sharing Partnership Model to Facilitate SDI Development
130
were identified as important within inter-jurisdictional environments. Finally, it was found
that the data sharing process continues to be resource intensive and current technology and
exchange processes need to be re-engineered to create greater inter-operability.
5.3 The State of Queensland –The Property Location Index
The data sharing partnership under investigation in the State of Queensland, the Property
Location Index (PLI), commenced in 1995. Its objective was to develop an authoritative
database on property information used across local and state government, particularly
street address and lot on plan information.
5.3.1 Jurisdictional Environment
Geography
The State of Queensland occupies the north-eastern quarter of Australia and is the second
largest of the six Australian states, covering approximately 1,727,000 sq km or
approximately 22.5% of the total Australian continent (see Figure 5.5). As at June 2004,
the population of Queensland was estimated to be 3.89 million people or 19.4% of
Australia’s population (Australian Bureau of Statistics 2005).
Figure 5.5 Geographic location of the State of Queensland
There are 125 local governments in Queensland, comprising 18 city councils (including
Brisbane, the state capital), 3 town councils and 104 shire councils. Queensland’s large
geographic area with many remote local governments creates a challenging environment
for ICT projects, such as spatial data sharing.
Queensland has continued to attract people from other Australian states with a net positive
level of inter-state migration. The inter-state migration peaked in the late 1980s and early
1990s at almost 60,000 people per year. In 2004, the net inter-state migration was
approximately 33,000 people or 630 people per week (Office of Economic and Statistical
Research 2005). As a result of this growth there are approximately 60 new addresses
being allocated every day and 10 new streets being constructed per week in the state. This

Chapter 5 – Results of Partnership Case Studies at State Government Level
131
growth rate creates a high demand for state and local information and the delivery of
government services.
Government Sector
In contrast to Victoria, the public service in Queensland has continued to grow steadily
over the past 20 years at both in the state and local government levels. As of August 2005,
the total state government employees were approximately 249,000 staff, whilst the total
local government numbers were estimated to be almost 43,000 staff (see Figure 5.6). This
trend is different from the other two states that have been investigated, and is mainly due
to the strong economic growth of the State.
Public Sector Employees Queensland 1983-2005
0.0
50.0
100.0
150.0
200.0
250.0
300.0
350.0
1983
1985
1987
1989
1991
1993
1995
1997
1999
2001
2003
2005
Em
ploy
ees
'000
s
Total
Federal
State
Local
Figure 5.6 Public sector employees Queensland 1983-2005 (Australian Bureau of Statistics 2006c)
Economic Environment
The Queensland economy has traditionally relied heavily on primary industries. Over the
ten years to 1998, Queensland’s average annual rate of growth of the Gross State Product
per capita was 2.4% compared with 1.8% for the remainder of Australia (Crossman 2000).
Agriculture and mining are strong contributors to the Queensland economy, however
approximately 80% of the state’s economy is now generated through the services sector.
Although growth slowed significantly in the late 1980s and early 1990s, the Queensland
economy remained buoyant.
Whilst other Australian state governments were downsizing the public sector in response
to the economic impacts, the Queensland public sector continued to grow during this
period. The continuing economic and population growth led to an on-going demand for
both residential and commercial property and hence property information. However, the

A Local-State Spatial Data Sharing Partnership Model to Facilitate SDI Development
132
cuts to the public sector employees were relatively small in comparison to Victoria, and
hence there has been less pressure to collaborate on inter- or intra-jurisdictional projects.
Property Sector
In 2005, there were approximately 1.96 million land parcels in Queensland of which
approximately 70% are located within the highly populated south-east corner of the state
near to the capital city of Brisbane. These land parcels equate to approximately 1.45
million properties with an estimated unimproved value (land value only) of approximately
$311 billion in 2005 (Queensland Valuation Assessment System 2006). Between 2001 and
2005, there were approximately 253,000 new land parcels created in Queensland or
approximately 50,000 parcels per year (Queensland Department of Natural Resources
Mines and Water 2006). In the 2004-2005 financial year, the revenue generated through
land tax in Queensland was $419 million. Revenue from duties, of which land transfers
and transactions are the major contributor, amounted to $2.64 billion over the same period
(Queensland Treasury 2005).
5.3.2 Institutional Setting
The local-state government partnership case study in the State of Queensland is managed
through the Queensland Department of Natural Resources, Mines and Water (DNRM&W).
During the mid 1990s, the Department was known as Department of Natural Resources
(DNR) before the additional portfolios of mines and water were added. It is a large multi-
sectoral agency with over 3,900 staff spread across regional centres throughout
Queensland (Department of Natural Resources Mines and Water 2005). The agency’s
portfolio includes vegetation and natural resource management, land administration,
mapping, water management, and mines. The DNRM&W has evolved from a large
surveying and mapping agency in the 1980s, to gradually become a land, water and
resource management department. Many traditional government mapping and survey
activities have been out-sourced to the private sector.
Unlike Victoria, the management of the cadastral mapbase and the valuation systems in
Queensland has always remained under the control of the State Government. In the early
1980s, with the promise of the potential of land information systems and land data banks,
Queensland State Government embarked on a process to convert the existing paper based
cadastral maps into a digital cadastral database. The majority of this process was
outsourced to a range of private contractors to digitise paper map sheets to construct the
new digital cadastral data base (DCDB). In the early 1990s, the DCDB was completed and
became widely utilised across State Government departments and local government. The

Chapter 5 – Results of Partnership Case Studies at State Government Level
133
Queensland DCDB was one of the first complete coverages of a cadastral mapbase within
Australia.
The spatial information access and pricing policy of the State Government during the
1990s was characterised by partial cost recovery policy and a relatively restrictive
licensing regime. The local government and utility companies became increasingly
dissatisfied with the quality and limitations placed on the spatial data being provided by
the State Government and the relatively high data cost. Although the State Government
began to respond to the calls for improved pricing and access arrangements, the effective
monopoly held by the state government did little to motivate change.
In 1993, Queensland Government endorsed a policy on the “Transfer of Land Related
Data” to facilitate improved access and transfer of data across state government agencies
and jurisdictions (Eden & Baker 1994). The policy endorsed the transfer of data between
government agencies at the “cost of transfer” only. However, when the policy was
implemented in 1994, there were no guidelines to determine the “cost of transfer” and little
progress was made in reducing the pricing and access to land related data. By the mid
1990s, with the increasing availability of high accuracy GPS and improved data capture
systems, dissatisfied local governments began to create their own digital cadastral
databases to better meet their business needs. This started a series of legal battles between
local and state government over copyright of the cadastral data base that resulted. In short,
the level of trust and co-operation between the State Government mapping agency and
local governments had reached a new low.
Historical Development of the Property Location Ind ex (PLI) Project
The development of the PLI project in Queensland began in 1995, after a consultancy was
commissioned to investigate the integration of the land parcel base with local government
street and property information. A workshop conducted in September 1995 by McNair
Consulting endorsed the need for a street and land parcel index (McFarlane 1997). A
prototype of the index was developed by the Department of Natural Resources in 1996 as
part of the Local Government Interface Project. A feasibility report for the project was
completed in September 1997, and submitted to the Queensland Spatial Information
Infrastructure Committee (QSIIC) for funding approval. The project was sponsored
through QSIIC and commenced in late 1997, with the Department of Natural Resources
nominated as the data custodian.
There were a number of drivers for the integration of street address information within the
State Government property systems. One important business driver was the need to update

A Local-State Spatial Data Sharing Partnership Model to Facilitate SDI Development
134
the Queensland Valuation Assessment System (QVAS) which had deteriorated both in
quality and currency since the Department changed from annual property appraisals to a
mass appraisal system due to declining Departmental resources. To improve the quality of
the property addresses within QVAS, the Local Government Interface Project was initiated
to collect data from the LGA property databases. Another motivation for the project was
the need to collect address data for the State Government’s contribution to the
development of a geocoded national address file (G-NAF). In order to achieve progress in
these initiatives, it was recognised that more formal arrangements for acquiring the data
from local governments were required.
5.3.3 Establishment and Direction Setting
Goal
From interviews with senior and operational staff and the examination of a number of
internal documents, it was concluded that the goals of the Property Location Index project
were far from clear. Although a key goal of the project was to provide a single
authoritative index of land parcels and street address, it was not clear how this new
authoritative database was to be utilised. Unlike the Victorian case study, which was
driven by the need to establish a digital mapbase to support critical business activities,
there was not a critical need for the dataset in the Department of Natural Resources. This
lack of a clear goal and business need meant that the project was not seen as a critical to
the Department’s mission, and therefore obtained limited funding and priority.
Negotiation Phase
During late 1997 and early 1998, the PLI policies for access and pricing were developed
and negotiations began with the LGAs in 1998 to explain the project and to seek their
support. Unfortunately, these negotiations appeared to lack coordination and the package
offered to LGAs did not provide them with any real incentive to sign. Apart from a small
monetary incentive, the State Government did not offer to exchange any data of value to
the LGAs. In fact, the access and pricing policy still required the LGAs to purchase the
digital mapbase at a significant cost. Therefore, the take-up rate of LGAs signing the PLI
agreement was low, and by 2000 only 20 LGAs had signed up to the PLI project.
In the heavily populated south-eastern corner of the state, the LGAs refused to participate
in the PLI project because they believed that they were not receiving fair and just
compensation for their contribution of data. Of the LGAs who signed up to the PLI
agreement in the early stages, the majority were small rural or regional LGAs who
represented perhaps less than 10-15% of the State’s population. In 2000, two part time
liaison officers were employed to assist in the process of negotiation. By May 2002, 35

Chapter 5 – Results of Partnership Case Studies at State Government Level
135
local governments or 28% had signed the formal agreement for supply of data, with
another 40 local governments indicating they were prepared to enter into an agreement.
It was expected that up by the end of 2002, 90 LGAs would be participating in the data
exchange (Stanton 2002). However, by May 2003, only 54 local governments or 43% had
signed the PLI agreement which represented only 25% of the state population base (Barker
2003). The reasons identified by the Department for the poor performance of the PLI
included personality issues within local government, lack of incentives and issues relating
to intellectual property. With the lack of support from the larger and more powerful local
governments in the south-eastern corner of the state, the project went into a period of
inactivity.
In 2003, the Department employed a senior staff member from interstate who had previous
experience in dealing with local-state government data sharing, and importantly, issues
relating to the impact of access and pricing of data. In March 2004, the DNRM&W
introduced a new policy on access and pricing of spatial data which had a dramatic and
almost immediate impact. The new policy promoted a more open access and exchange of
data at minimal or no cost. In September 2004, a new data sharing and exchange
agreement was developed to replace the old PLI agreement. The key to this agreement
was that LGAs could receive the digital mapbase and other products for free in exchange
for their address data. This completely changed the attitudes of LGAs and by the end of
2004 approximately 85 local governments had signed, and by early 2006, all but six of the
125 local governments had signed the new data share agreements.
Agreements
During the PLI project, two different agreements were utilised. The first agreement
developed in 1998 and was a full data supply agreement that was based on a royalty
model. The second agreement commenced in 2004 was a data sharing agreement that did
not involve the payment of incentives or exchange of monies. Each of these agreements is
now briefly described.
Original PLI (Pre March 2004)
The original PLI agreement was developed in 1998, under the existing DNR pricing and
access policies which were characterised by partial cost recovery and significant
limitations on the data use. The agreement allowed local governments a small initial
payment for their property and address data, and then a variable royalty payment at the end
of the licensing period based on the volume of sales of the PLI by the State Government.
The royalty payment from the sales of the data was to be distributed on the basis of 85% to
A Local-State Spatial Data Sharing Partnership Model to Facilitate SDI Development
136
local government and 15% to State Government after the deduction of a $150,000 annual
cost of operation/provision (QSIIS Information Office 2000). No evidence was found of
any royalty payments ever being made because of the limited sales of the PLI.
The agreement upheld the intellectual property and custodianship of each of the party’s
data, namely street address for local government and lot/plan data for the State. However,
the intellectual property and custodianship of the PLI was signed over to the State
Government. This component of the agreement enabled the State Government to market
and on-sell the licence to use data to value-added resellers (VARs) and other areas of the
State Government (QSIIS Information Office 2000). The term of the agreement was set
for one year, with an extension for another two years if elected by the individual LGAs.
Due to the long and drawn out process of getting LGAs to sign on to the agreements, very
few ever reached the stage of re-signing or rolling over the initial agreement beyond the
first term. The one year agreement was considered too short by many local governments
and resulted in additional administrative efforts to re-sign LGAs.
Data Share (From Sept 2004)
In 2004, the new access and pricing policy of the DNRM&W resulted in the development
of a significantly different style of agreement. The new licence agreement allowed the
equitable sharing of digital data between the State of Queensland and any other
organisation provided there was a mutual benefit and a clear business reason (Department
of Natural Resources Mines and Water 2006). The data share agreement also allowed for
the creation and distribution of new products by either party. In contrast to the initial PLI
data share agreement, the new licence was much more flexible with respect to use of the
state data, provided a longer term (3 yrs) and a fairer exchange of data between the state
and local governments. Each party agreed to deliver the data at their own cost with no
exchange of monies.
5.3.4 Partnership Operation and Maintenance
Data Exchange Process
At the early stage of development of the data exchange it was decided that the PLI project
would be aligned to another operational area called the computerised inventory of survey
plans (CISP). The CISP project had already established a comprehensive index of survey
parcels and was used as the primary database for building the DCDB attribute data. It
therefore provided an authoritative source of the lot/plan data and a building block to
create the new index.
Chapter 5 – Results of Partnership Case Studies at State Government Level
137
Because of the small number of LGAs that had signed on to the PLI project prior to 2004,
there was very limited data exchange occurring. However, from mid-2005 the exchange
process began to become more active due to the new pricing and access policy of
DNRM&W. In the data exchange process, data is initially submitted to the Land
Information Systems unit of the Department where it is loaded and validated for major
errors. Reports on errors in matching are generated and then supplied back to each local
government to resolve. If the data is of acceptable quality it is passed on to the Survey
Infrastructure Services unit to then liaise with individual LGAs to resolve any mismatch
issues before being integrated into the PLI database. As of April 2006, 82 of 125 LGAs
had supplied data to the Department for loading and validation. In total, these LGAs
represent approximately 85% of the property dataset for State of Queensland.
Project Management
The management and maintenance of the PLI project is shared across a number of
divisions and business units within the Department of Natural Resources, Mines and
Water. At the time of this research there was no individual person or business unit in the
Department with a defined responsibility for the project management of the PLI activities
and no project reporting structure could be identified. With the PLI responsibilities
distributed across the different business units it was difficult to see how activities could be
effectively managed and resources allocated.
Resources
Unlike the Victorian case study which lobbied to obtain almost $3 million in funding to
initiate the project, the PLI project was allocated a small amount of start up funding to
purchase the hardware and software for the database to reside. Including liaison,
operational and management staff it is estimated that the staff resourcing for the PLI is
approximately four equivalent full time staff.
Communication
The PLI project communication between the LGAs and the state government was
identified as an area of weakness. During the negotiation stage, visits were made to LGAs
by both the DNR staff and liaison officers from QSIIC. This had the effect of confusing
LGAs as they were unsure about who was to be their final partner, QSIIC or DNR. The
process was time consuming and costly, as Queensland is a large and geographically
diverse state. To further confuse the communication processes, LGAs were then contacted
by the Product Services Unit of DNR to finalise the signing of the license agreements.
Finally, during the exchange process LGAs were in contact with two different units within
the Land Information Services Division.

A Local-State Spatial Data Sharing Partnership Model to Facilitate SDI Development
138
The lack of a coordinated communication strategy was identified as a key deficiency of the
PLI project. Even on the PLI licence agreement three different contact points are given
within the one government department. Besides the irregular phone and email contacts,
there does not appear to be any other mechanism for the project group to communicate
with the 125 LGAs in a more coordinated manner.
Reporting and Performance Management
Due to the lack of progress in the early stages of the project, the outputs from the project
have been limited. Limited statistical data on the process of negotiation, signing, data
loading and data quality was available. It is suspected that this is due to the dispersed
nature of the project control and management. However, since the signing of the new data
share agreements in late 2004, progress has improved. In April 2006, 74 of the 125 LGAs
data sets were loaded and validated with 83.6% of addresses effectively matching with the
land parcel database.
Limited information was available on the performance of other aspects of the project. One
area of concern with all of the data sharing partnerships was the time taken for data to be
collected, processed and re-distributed to users such as the emergency service agencies.
Anecdotal evidence indicated that the overall process from the time of submission through
to initial validation, resolving of matching issues and update of the PLI could be as long as
six months. If data is submitted every quarter from LGAs, then this would give a total
time delay of possibly nine months before the PLI is ready for distribution to emergency
services. Apart from their individual feedback on the error matching of their data, limited
indication was provided to local governments on their overall data quality in comparison
with other LGAs.
5.3.5 Governance
The project did not appear to have any mechanisms in place to effectively include the local
government partnership members, other state government agencies or the wider group of
existing and prospective users in the strategic development of the project. The original
PLI agreement and the new data share agreement do define the responsibilities of each
party. However, intellectual property, limitations of use of the data and dispute resolution,
the ability to review issues such as strategic direction, community interests and future
evolution of the PLI are not facilitated through any governance arrangements.

Chapter 5 – Results of Partnership Case Studies at State Government Level
139
5.3.6 Key Outcomes
The partnership has delivered modest outcomes since it was established, however recent
progress has been positive. The data from the partnership has recently been used to
contribute to the national geocoded address file (G-NAF) and it is anticipated that this
process will act as a motivator for improving the partnership performance. The data is
currently being used internally, but it is expected that it will be used to support a public
web portal. The new information portal called Information Queensland is expected to be
on-line later in 2006.
5.3.7 Case Summary
The case study of the Queensland Property Location Index has identified a number of
important characteristics of this data sharing arrangement. The initial goal and objectives
of the PLI were not clear, and as the project developed, there was no long term strategy for
the maintenance and use of the data. Although the initial agreement was called a data
share agreement, the contracts reflected a data provision arrangement in return for a
nominal fee. Little had changed from past policies on the access and pricing of
information and there was significant discontent within local government ranks because of
the need to still purchase the digital cadastral database.
The development of the new data share agreement following the new pricing and access
policy in 2004, was a defining moment in the partnership arrangement. The new
agreements resulted in a more equitable data sharing strategy and saw the immediate
upswing in support by local governments.
The project management and operation of the total PLI process is shared across two state
government departments and amongst three organisational units. Communication is
therefore problematic within the project group, and potentially confusing to local
government representatives. Performance reporting and measurement has only recently
commenced, but is a positive step in understanding the challenges facing the project.
5.4 The State of Tasmania – The Land Information Sy stem Tasmania
The data sharing partnership under investigation in the State of Tasmania commenced in
1997. Its objective was to improve the quality of the state’s spatial information, reduce
duplication and improve its accessibility across government, business and the community.
The Land Information System Tasmania, or the LIST as it became commonly known, was
a ‘whole of government’ initiative which has translated a vision into a reality.

A Local-State Spatial Data Sharing Partnership Model to Facilitate SDI Development
140
5.4.1 Jurisdictional Environment
Geographic Profile
The island State of Tasmania lies off the south-east corner of the Australian mainland (see
Figure 5.7). The area of the State, including the lesser islands, is 68,102 square kilometres
or about 0.9% of the total area of Australia; it is just under one-third the size of Victoria,
the smallest mainland State (Australian Bureau of Statistics 2006b).
Figure 5.7 Geographic location of the State of Tasmania
As of June 2003, Tasmania had a resident population of approximately 480,000 people.
Since 2002, there has been a positive population growth in Tasmania after a number of
years of declining population due to inter-state migration to mainland Australia (Australian
Bureau of Statistics 2006b). The small geographic area of Tasmania is considered to be a
positive factor in collaborative initiatives. Although many areas have limited
development, most towns and rural areas are readily accessible by vehicle and have
satisfactory ICT infrastructure. With only 29 local governments the task of
communication is also manageable.
Government Sector
The reduction in the size of the public sector in Tasmania has followed a similar pattern to
Victoria in the early 1990s. Both State and Federal public sectors were down-sized
through outsourcing, privatisation and general improvements in productivity and
efficiency. As of 2005, there were approximately 36,500 state and 4,000 local government
employees (Australian Bureau of Statistics 2006c). Figure 5.8 illustrates the changes in
the public sector profile in Tasmania over the past two decades. The partnership under
investigation commenced in 1997, at a time when staff reductions in State Government
agencies were continuing and the economic position of the State Government was poor.
Like Victoria, the commencement of the partnership initiative at a time of resource
scarcity supports the findings in literature that these situations encourage co-operation.

Chapter 5 – Results of Partnership Case Studies at State Government Level
141
Public Sector Employees Tasmania 1983-2005
0.0
10.0
20.0
30.0
40.0
50.0
60.0
1983
1985
1987
1989
1991
1993
1995
1997
1999
2001
2003
2005
Em
ploy
ees
'000
s
Total
Federal
State
Local
Figure 5.8 Public sector employees Tasmania 1983-2005 (Australian Bureau of Statistics 2006c)
Economic Environment
After the nationwide recession of the early 1990s, the Tasmanian economy lagged behind
the national average in nearly all measures of economic performance. However, since
2002, Tasmania has turned around its economy with positive population growth, a buoyant
property market, increased business investment and a reduction in unemployment. In fact,
the Tasmanian economy has grown at an annual rate of 3.5% which exceeds the national
average, and at a faster rate than all other states except Western Australia (ANZ
Economics 2006). This change from the depressed economic situation in the mid 1990s
has been due to improved economic management and a general reverse in the inter-state
migration, as people from capital cities in mainland Australia seek more affordable
housing prices. The Tasmanian economy is dependent on a number of commodity based
industries, but is now diversifying due to a number of niche industries in agriculture and
the growing value of tourism.
Property Sector
Land administration in Tasmania is the responsibility of the State Government. As of
April 2006, there were approximately 320,000 land parcels in Tasmania which equated to
approximately 252,000 properties (Tomes 2006). The total rateable value of property
within the State in 2005 was estimated at $42.1 billion. Since 2001, there has been an
average of 3,500 new land parcels produced each year in Tasmania. In the 2004/5
financial year, land tax generated $43.6 million for the Tasmanian State Government. A
further $245 million in revenue was generated through a range of financial transaction
taxes, of which a major component included the duties associated with the buying, selling
and transfer of land (Tasmanian Department of Treasury and Finance 2005).

A Local-State Spatial Data Sharing Partnership Model to Facilitate SDI Development
142
5.4.2 Institutional Environment
The Tasmanian Government agency responsible for land and property management is the
Department of Primary Industries, Water and Environment (DPIWE). The grouping of the
land management functions into a multi-disciplinary department has become increasingly
common within State Government departments in Australia as the traditional mapping
agencies are downsized and integrated with other land management activities to form
“super departments”. From a political perspective, the State of Tasmania has been very
pro-active in its attitude towards both intra- and inter-jurisdictional collaboration. A
partnerships program, initiated under the Tasmanian Department of Premier and Cabinet in
1998, actively promoted the development of co-operative agreements to improve the
working relationships between local and state government in Tasmania (Tasmanian
Department of Premier and Cabinet 2002).
Historical Development of Partnership
The coordination of land information activities in Tasmania has been undertaken by the
Tasmanian Land Information Coordination Committee (LICC) since the early 1990s. In
1995, as part of its Strategic Plan, the LICC set one of its objectives as “the creation and
maintenance of a common and effective land information infrastructure” (Land
Information Coordination Committee 2001). The LICC adopted a “whole-of-government”
approach to achieve this outcome and initiated a study to identify those data sets across
government which could be considered as core to this information infrastructure. This
study identified a potential list of over 300 data sets, of which 56 were selected for initial
development. A project and business case was then prepared by the Division of
Information and Land Services under the state government’s Capital Investment Program,
to establish a web based delivery platform to replace the existing land titling and valuation
delivery systems. In 1997, a policy initiative on delivery and access to spatial information
was released, which heralded the beginning of the Land Information Systems of Tasmania
(LIST).
The development of the LIST was initially budgeted to cost $6.5 million, including $2.9
million of new funding and $3.6 million of existing departmental resources over a three
year period. However, only $2.44 million was initially allocated from the State Investment
Program with a condition that the system was to be completed in two years. Within this
short project timeframe the project was required to:
• develop and negotiate agreements to manage the custodianship and sharing of data;
• acquire and develop the computing systems to manage and deliver the data sets;

Chapter 5 – Results of Partnership Case Studies at State Government Level
143
• establish working groups to refine data set specifications and principles to meet
community needs;
• compile 56 land related data sets;
• develop applications to facilitate access to title and valuation information via the
internet; and
• develop the associated business rules, management procedures and documentation.
(Land Information Coordination Committee 2001)
In February 1998, the LIST internet site was launched. From June 1998, title searching
was available in a number of local government areas and by June 1999, the LIST was well
on the way to meeting its original objectives. The effective development of the LIST in
this short timeframe was recognised with a national Government Technology Productivity
Award and an Exemplary Systems in Government Award from the Urban and Regional
Information Systems Association in the USA.
5.4.3 Establishment and Direction Setting
Goal
The LIST is somewhat different to the data sharing partnerships in the States of Victoria
and Queensland as the strategy pursued by the LIST was a ‘whole of government’ strategy,
not just focussed on local government. Although many of the initial data sets were able to
be sourced from within the Department, the strategic vision was certainly to provide a
common infrastructure across the state jurisdiction and to engage more effectively with
local governments. This vision also appeared to be aligned with the wider departmental
and government objectives of increasing efficiency by reducing the duplication of effort
and improving the delivery of government services and information. The use of ICT and
the engagement via partnerships was also seen as fundamental to achieving these
objectives.
Negotiation Process
Soon after the initial funding of the LIST, it was identified that to achieve the proposed
outcomes of the initiative would require improved co-operation with local government. In
the mid 1990s, the State Government information policy promulgated by the Department
of Treasury and Finance required each agency to charge each other (and local government)
for the use of their data. This meant that data, such as the digital cadastral database, was
being sold by the state government to LGAs, although there was the expectation that the
local governments would continue to supply their data at little or no cost. It was quickly
recognised that this policy would not be conducive to achieving the objectives of the LIST,

A Local-State Spatial Data Sharing Partnership Model to Facilitate SDI Development
144
so work commenced to develop a new policy on sharing of data sets with local
government.
In June 1997, a draft policy statement was prepared by the Land Information Services
Division (LISD) to facilitate the more open and cooperative exchange of data between
state and local government. The policy identified that sharing and exchange of data
through the recognition of the value of each organisation’s data would provide both
financial and functional benefits to both the government and the community (Land
Information Services Division 1997). The resolution of the Departmental policies on the
pricing and access of information was fundamental to enlisting the support of local
government and other potential contributors. The identification of the custodians of the
different data sets was an important step, as it highlighted the issues of copyright,
intellectual property and maintenance.
The development of the formal data share agreements were completed in 1999 after the
new policy on sharing of data was approved. This process included consultations with
local governments on the range of data sets to be included and the general conditions of
the agreements. A number of larger LGAs initially expressed some concerns on the
ownership of the information and sought to have some cost exchange for the data. By
2001, 27 of the 29 LGAs had signed the data share agreement and begun to exchange
information. Two LGAs remained outside of the LIST, as a satisfactory agreement could
not be reached on the sharing of some datasets. In particular, the large investment made
by the two LGAs in the development of an accurate cadastral database proved to be a
disincentive to finding common value in the data exchange.
Format of Partnership Agreement
The data exchange between the State and local governments was formalised through a
Data Share Agreement which identified the scope of the exchange and the responsibilities
of each party. The agreement was similar in structure to the Victorian data share
agreement, and specifically drafted for the sharing of data between local and the state
government. The term of the agreement was for five years with the option to extend the
agreement for a further five year period.
Each party retained the custodianship and responsibility for their existing data and agreed
to exchange that data under the agreement. Where new data sets were created, the equity
was distributed in proportion to the each party’s contribution to the development of the
data set. The standard agreement with local government covered the exchange of six data
sets, namely cadastre, nomenclature, administrative boundaries, roads, planning and street

Chapter 5 – Results of Partnership Case Studies at State Government Level
145
address. A schedule at the end of the contract detailed the equity arrangements for each of
the data themes and reflected the contribution of each party to the production and
maintenance of each theme. This particular aspect of the partnership agreement differs
from Victoria and Queensland which moved to a more liberal recognition of value of the
data being exchanged.
Due to the range of data covered under the agreement, the schedule for supply and
exchange of data varies as some data themes were required to be exchanged more
frequently than others. The agreement enabled both parties to utilise the exchanged and
aggregated data for their internal business purposes. When one party licenses the data to
be used by a third party, the other partner must be notified in writing of the arrangement
and royalties or license fees shared in accordance with the equity schedule. Either party
could terminate the agreement without reason, however two years notice had to be given to
minimise the loss or damage to either party.
5.4.4 Operation and Maintenance
Data Exchange Process
The LIST team has made significant progress in automating the exchange process between
local LGAs and the State Government. A data file exchange site was established to
facilitate the monthly download of data by LGAs and also to enable the upload of modified
data back to the State Government through the standard FTP protocol. DPIWE staff
developed standard procedures for data exchange which operate effectively, although the
periods of update seem to vary significantly between LGAs.
Project Management
During the development of the LIST in 1997, a project team was established and reported
directly to the LICC on its implementation progress. As the LIST became operational in
early 2000, the project team disbanded and was integrated into an operational program
within DPIWE. The LIST Management Advisory Group (LMAG), which consists of
representatives from state agencies and local government, continues to provide a strategic
management role. The LIST project appears to have been carefully designed, implemented
and managed.
Resources
The LIST has become an integral part of the work program of the DPIWE and the
resources required to maintain the system are spread across approximately 60 staff with a
variety of roles. The operational areas of the LIST are managed by the LIST Maintenance
Group. The group is responsible for the upload and management of the comprehensive

A Local-State Spatial Data Sharing Partnership Model to Facilitate SDI Development
146
array of data sets that exist. DPIWE is the custodian of many of the LIST data sets,
including the land titles and DCDB, however much of the day to day maintenance is the
responsibility of other state agencies. In addition to the maintenance group, the LIST
Client Services Group manages the provision of data to third parties through licensing and
sales.
Communication
Communication with LGAs is performed on an “as needs” basis and may be undertaken by
a range of staff within the State Government department. The primary forms of
communication are email and telephone, with the primary focus on routine operational
issues dealing with the data exchange processes. No other coordinated communication
process has been established, but with the LIST process well coordinated this may not be
necessary.
Reporting and Performance Management
During the data integration a report is generated on the data matching rates and errors.
However, no formal system of performance management was evident which examined the
progress of the project as a whole. Although the matching rates and data quality measures
provide a valuable guide to the completeness and reliability of the data sets, as the project
matures there is a need to extend the dimensions of this reporting in order to effect
improvements in areas such as efficiency, data turn around, bottlenecks, standards and
interoperability.
5.4.5 Governance
Initially, the LIST concept was driven by the Land Information Coordination Committee
(LICC) which facilitated the inter-agency communication, development and refinement of
the data access, pricing and licensing arrangements and overall project reporting. As the
project matured into an operational program a new management and governance structure
was put in place to facilitate broader representation of the stakeholders and reporting (see
Figure 5.9).
One of the key changes to the overall governance was the establishment of the LIST
Management Advisory Group (LMAG) which became responsible for the overall
management and direction of LIST. As the LIST data sets began to expand across the
various state and local government agencies, the LMAG provided a more appropriate and
inclusive management structure for operational management and direction setting. It
enabled the managers across the different agencies to be kept informed on the progress of

Chapter 5 – Results of Partnership Case Studies at State Government Level
147
the LIST, and facilitated group decisions which impacted on significant operational issues.
Day to day operations of the LIST is the responsibility of the LIST Operations Group.
Figure 5.9 LIST governance and reporting structure (Twinn 2001)
The role of the Land Information Coordination Committee has continued to focus on
policy development and custodian appointment. However, with the development of the
LMAG, there was less emphasis on operational issues and more effort on encouraging high
level support and development.
5.4.6 Key Outcomes
The LIST partnership has achieved a range of outcomes including:
• development of effective policies on access and pricing;
• a single authoritative data set for spatial information;
• reduced duplication of mapping activities;
• a standard data exchange process;
• a web based delivery system that is used widely by LGAs and the public; and
• improved intergovernmental relations and trust.
The LIST data sharing and management model has been extremely successful for the State
of Tasmania and has become a critical component of the information infrastructure for
government, business and the community.
5.4.7 Case Summary
The LIST continues to be a successful partnership initiative and has delivered significant
benefits across both state and local government. The partnerships were initiated in a
turbulent economic and jurisdictional environment which encouraged improved
intergovernmental relations through more efficient use of resources. The project had high

A Local-State Spatial Data Sharing Partnership Model to Facilitate SDI Development
148
level support, a clear aim and was well managed. It also had a strong emphasis on the
technical design of the project including the data model and appropriate standards.
Start-up funding was successfully acquired to initiate the project and early deliverables
were achieved. The ubiquitous nature of the LIST and the wide user base has meant that
the project has maintained its support both across state and local government agencies.
5.5 Case Study Comparison
5.5.1 Determinants and Motivations
The three cases studies were classified under eight determinants for initiating the
partnerships identified from the literature (Dedekorkut 2004; Gray 1985; Mulford &
Rogers 1982; Oliver 1990; Schermerhorn 1975). Table 5.1 summarises the possible
determinants for the establishment of the data sharing partnerships based on the
information gathered during each state government case study. A shaded cell in the table
indicates that the determinant has been assessed as being a significant positive contributor
to the formation of the data sharing arrangement.
The Victorian partnership initiative was developed during a turbulent state economic and
political period. This appears to have been a strong motivator for state government to
establish a collaborative arrangement with the Victorian local authorities. With the State
of Victoria in an economic slump during the mid 1990s, the progressive down sizing of the
public sector and outsourcing of many state government production functions, the State
Government environment was conducive to collaboration. The restructure of local
governments reduced the influence of the Municipal Association of Victoria, and also
created an improved environment for the negotiation with LGAs. The urgent need for the
formation and maintenance of a common cadastral mapbase created a common focus and
goal for both state and local government. The Victorian State Government also recognised
that development of a comprehensive property database relied on the contribution of local
governments. Similarly, LGAs realised that they did not have the resources to build all of
their data sets, so this provided the recognition of their mutual interdependence.
For the Queensland PLI, the motivation for its creation was identified as being a one-sided
data collection exercise by the state government with limited benefit for local government.
The underlying determinant was not so much a shortage of resources, but the recognition
by the state that they could exert some level of power over local governments in order to
obtain their property address databases. Overall, this approach was less than successful as
described in the case study.

Chapter 5 – Results of Partnership Case Studies at State Government Level
149
Table 5.1 Assessment of determinants for initiating data sharing partnership
Determinant Victoria PIP Queensland PLI Tasmania LI ST
Asymmetry – exercise of power for gain
Approach to cooperate was based on common need, no assertion of control necessary
Initial motivation was to improve state data quality for state purposes – strong tendency to exercise state power
Initially a state agency cooperation exercise, limited degree of authority exercised through the coordination process
Organisational Goals (reciprocity)
Strong need for both state and local government to cooperate on building mapbase
Limited common goal in initial PLI agreement. Closer alignment after 2004 data share agreement
Common goal to improve the efficiency of spatial data management
Environmental Uncertainty (stability)
Significant government change and uncertainty in the mid 1990s, staff and budget reductions
Departmental restructures but generally a stable environment
Departmental restructures, significant economic downturn, declining budgets, staff reductions
Mutual Interdependence
Growing understanding of the value of local government’s role in building the state SDI
Limited recognition of interdependence at a state government level
A strong recognition at state government level of the need for inter-jurisdictional collaboration to advance social, environmental and economic goals
Legitimacy Need to be seen as a coherent initiative to gain further support
The state wanted to be seen as a legitimate contributor to development of G-NAF and hence pressure to establish data exchange
Whole of government approach and vision was founded on local government participation
Fragmented Jurisdictional Structure
Poor state government economic performance had created some fragmentation of functions and loss of focus of service delivery in mapping in particular. Reduction in the number of local governments from 210 to 79
Devolution of some state responsibilities to local government but limited motivation as a basis for co-operation
No significant change in jurisdictional structure
Necessary Legal or Regulatory Requirement
No immediate mandated requirement to co-operate
No immediate mandated requirement to co-operate
No immediate mandated requirement to co-operate
Resource Scarcity Public service numbers declining at all levels of government. No internal capacity to build the digital cadastral mapbase
Declining government staff numbers but partially balanced by private sector subsuming some roles
Reduced public service staffing and focus on improving efficiency
Indicates a positive determinant
The Tasmanian LIST appears to have been driven by a strong government push to improve
efficiencies across the State Government during a difficult economic period. The ‘whole
of government’ approach was a timely response to these constraints, and the LIST
initiative gradually extended beyond the state levels to LGAs, as the value of their data and
their mutual interdependence were recognised. The Tasmanian Government was also a
leader in the promotion of partnering, especially with local governments, to more
effectively deliver the services to the community.

A Local-State Spatial Data Sharing Partnership Model to Facilitate SDI Development
150
5.5.2 Assessment of the Collaboration
The three case studies can also be compared across the various dimensions of the
collaboration by considering the jurisdictional and institutional environments, the
establishment and direction setting stage, partnership operation and maintenance,
governance and outcomes. Table 5.2 compares the three cases across each of these areas.
Table 5.2 Comparison of the performance of the partnerships
Collaborative Stage Victorian PIP Queensland PLI Tas manian LIST
Jurisdictional Environment - Economy - Government Sector - Geography
Economic situation was conducive to collaboration. Strong leadership and access to funding available. Relatively small number of LGAs and small geographical area
Economic environment had little positive impact. Weak institutional support and funding base. No strong leadership. Large state and diverse LGAs.
Economic situation was conducive to collaboration. Strong leadership and access to funding available. Relatively small number of LGAs and small geographical area
Institutional Environment - Policy - Historical processes - Organisational support - Resourcing
Policy framework in spatial information was appropriate, Initial up-front funding created buy-in, high level organisational support
Policy framework was not conducive to collaboration, limited high level support or funding
Strong high level political support and funding, well thought through policy development
Establishment and Direction Setting - Goal setting - Negotiation - Agreements
A clear common goal for the project. Well managed process of negotiation and development of policy and institutional structures.
Business case for project was debateable for managing department. Goals unclear and policy development worked against agreements.
High level strategy and clear overall goals. Policy and negotiations easier at state level than at local. Agreements very detailed
Operation and Maintenance - Project management - Maintenance - Resources - Communication
Project management has been good since inception, maintenance infrastructure developed progressively, some resource limitations. Communication with stakeholders and partners has been positive.
Poor institutional arrangements led to lack of resourcing and project support. Culture of inter-jurisdictional sharing only emerging. Confused channels of communication.
LIST started with strong overall leadership and project support. Project generally well resourced and technology focussed. Issues of local government communication and maintenance now starting to impact.
Governance - Governance structures - Reporting and Performance management
Early project efforts focussed on negotiation and data exchange. Performance management now part of the process. Improved governance arrangements emerging with the new VSC.
Once the project was handed over to the DNR there appears to have been little performance management or reporting. No governance structure in place involving the stakeholders.
The overall LIST reports to the LICC so some governance arrangements are in place. Performance and reporting is limited.
Outcomes - Data - Relationships - Access mechanisms
Established single mapbase, data used widely through Land Channel, improved quality, good level of inter-governmental relations
Limited outcomes under original agreement but new data share arrangements show promise
Web portal that is used widely across all sectors in Tasmania, improved inter-governmental relations, improved efficiencies and quality
The jurisdictional and institutional environments have contributed to the outcomes of the
partnership initiatives in a number of ways. Firstly, the more turbulent situations in
Tasmania and Victoria resulted in positive conditions for collaborations to form, whilst the
comparatively buoyant Queensland economy did not appear to have any significant
influence. Secondly, the policy developments at the institutional levels were shown to be

Chapter 5 – Results of Partnership Case Studies at State Government Level
151
critical for fostering a data sharing environment. Without an equitable policy framework
for the pricing and access of spatial information, it is extremely difficult to encourage the
sharing of information. The State Government of Tasmania, through its partnerships
policy, had a significant influence in bringing local government to the negotiating table.
Each of the partnership case studies has reached varying stages of maturity in the
collaboration process. The Victorian PIP and the Tasmanian LIST partnerships have been
the most comprehensive in their establishment and direction setting phase, with a
considered and well researched approach to negotiation and the development of the
agreements. The Queensland PLI struggled at this phase, as identified in the earlier
comparisons, due to a poor institutional policy framework.
All of the states appear to have under estimated the resources required to maintain the
ongoing operation and future development of the partnerships. Not surprisingly,
communication has emerged as a key ingredient for maintaining an effective partnership.
Importantly, good communication is not only required for the exchange of data, but also
helps to maintain and support the relationships that have been built by the partnership.
The issues of governance and performance management are relatively new areas to many
government projects. Projects established during the mid to late 1990s would not have
considered performance measures during the project design. However, performance
management issues are now impacting on each of these initiatives as they struggle to deal
with the operational and maintenance challenges of a mature project. Each jurisdiction is
responding differently to these challenges, but all would agree that understanding their
performance and articulating that performance to upper management was extremely
important. Governance arrangements, particularly in Victoria and Tasmania have
identified the need for improved reporting, performance management, greater stakeholder
involvement and wider jurisdictional support.
5.5.3 Contribution to SDI Development
It is also useful to examine the contribution of each of the three cases across the
dimensions of the SDI framework.
This comparison is useful in identifying the strengths and weakness of each of the data
sharing partnerships and their ability to contribute to the state SDI initiatives and
development. As can be seen from Table 5.3, the performance of the Victorian PIP across
the five dimensions of SDI identifies that the PIP partnership is contributing positively to
the State’s SDI development strategy.

A Local-State Spatial Data Sharing Partnership Model to Facilitate SDI Development
152
Table 5.3 Contribution of partnerships to SDI development
SDI Component Victoria PIP Queensland PLI Tasmania LIST
Data - appropriateness - shared value - quality - reliability - timeliness
The PIP data has become essentail to both partners. Quality of data is satisfactory and improving. Timeliness and reliability are ongoing issues.
The PLI data has not reached maturity or achieved recognition of value. Quality is generally poor although improving in recent times. Issues of reliability and timeliness.
Overall quality of data is good but further improvements required. Shared value of data is recognised. Timeliness and reliability satisfactory and integrated into state SDI.
People - partnership managers - partnership operations - users and resellers
Overall good leadership and a high level of management of the partnership. Process is under-resourced in a number of components. User and reseller base growing.
Limited overall leadership and support, lacks project management and is under resourced. Limited supply chain development or cross agency usage.
High level government sponsorship, strong project leadership and management, larger and diverse user base, operations are well coordinated and resourced.
Institutional framework - co-ordination bodies - policies - legislation - communication
Policy development preceded main initiative. Generally strong upper level support from state co-ordination body. High level of partner communication.
Initially developed under state coordination body (QSIIC). Policy development focussed on cost recovery initially until 2004 data share policy. Poor institutional support and partner communication.
Good coordination and management through LICC. Policy development appropriate but may require modification. No legislative framework. Communication levels appear satisfactory.
Standards - national standards - data models - metadata - transfer standards
Key data set of address is built to comply with new national address standard. Metadata development ongoing. Transfer standards more complex due to eight different vendors. New data model required to deliver improved efficiencies.
PLI initially built with the older address standard. Metadata is limited. Transfer standards are slowly being addressed.
Data models and standards for the exchange and maintenance were developed as part of the agreement. Strong emphasis of metadata, linkage to LIST and end users.
Technology - level of technology - access networks - maintenance/update
Data is delivered and accessed through Land Channel portal. Automation of update and maintenance has become critical.
Data has not made its way to the state SDI as such. No public access available to mapping or address data. Maintenance process and model must be updated.
Data is delivered through the LIST for both public and commercial access. Technology is highly developed and provides a good model for future developments.
Although the overall data quality from the data sharing initiative is high, further
improvements are required to ensure a high level of business and user confidence. In
particular, under-resourcing of the data maintenance process is now having an adverse
impact on the project. Apart from the under-resourcing, the data maintenance, institutional
framework and the overall partnership management appears sound.
The application of standards and recognition of metadata at both state and local
government level has been successfully developed from an initial low base. The delivery
of PIP data over the Land Channel portal is clear evidence of the partnership’s contribution
to the State SDI. The PIP data sets in the form of the digital mapbase and street address
are critical to delivery of the State’s spatial information via this portal. As identified in the
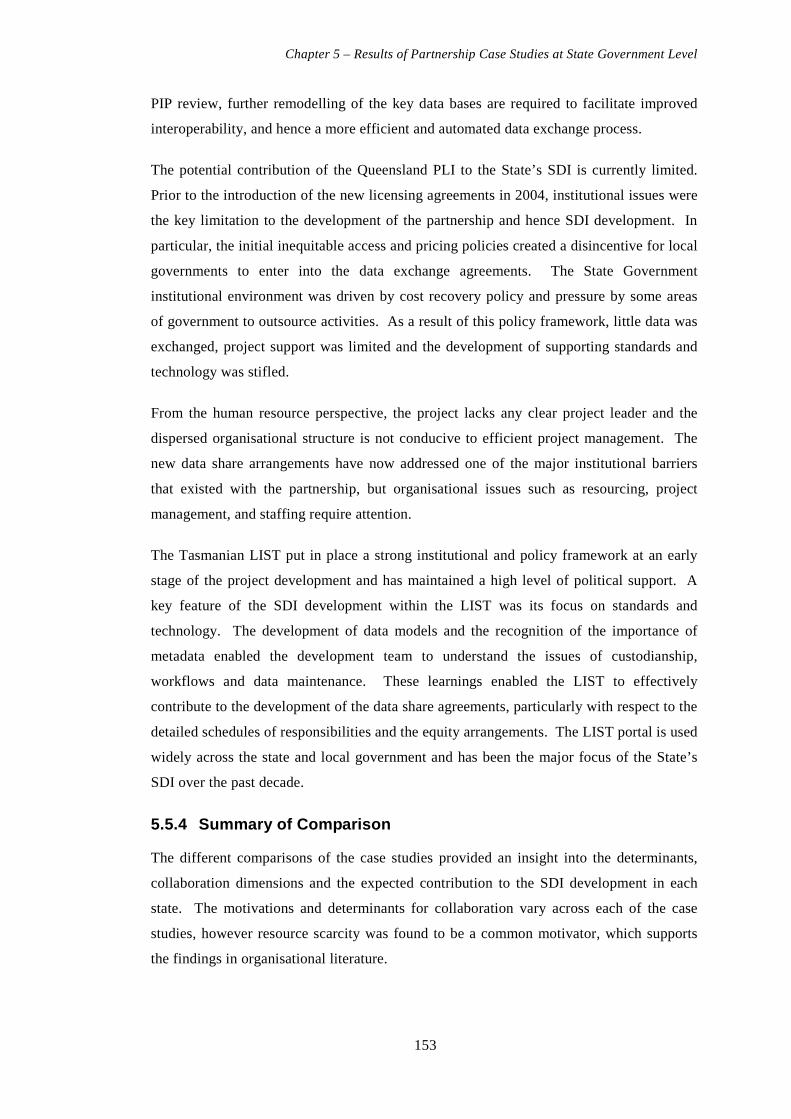
Chapter 5 – Results of Partnership Case Studies at State Government Level
153
PIP review, further remodelling of the key data bases are required to facilitate improved
interoperability, and hence a more efficient and automated data exchange process.
The potential contribution of the Queensland PLI to the State’s SDI is currently limited.
Prior to the introduction of the new licensing agreements in 2004, institutional issues were
the key limitation to the development of the partnership and hence SDI development. In
particular, the initial inequitable access and pricing policies created a disincentive for local
governments to enter into the data exchange agreements. The State Government
institutional environment was driven by cost recovery policy and pressure by some areas
of government to outsource activities. As a result of this policy framework, little data was
exchanged, project support was limited and the development of supporting standards and
technology was stifled.
From the human resource perspective, the project lacks any clear project leader and the
dispersed organisational structure is not conducive to efficient project management. The
new data share arrangements have now addressed one of the major institutional barriers
that existed with the partnership, but organisational issues such as resourcing, project
management, and staffing require attention.
The Tasmanian LIST put in place a strong institutional and policy framework at an early
stage of the project development and has maintained a high level of political support. A
key feature of the SDI development within the LIST was its focus on standards and
technology. The development of data models and the recognition of the importance of
metadata enabled the development team to understand the issues of custodianship,
workflows and data maintenance. These learnings enabled the LIST to effectively
contribute to the development of the data share agreements, particularly with respect to the
detailed schedules of responsibilities and the equity arrangements. The LIST portal is used
widely across the state and local government and has been the major focus of the State’s
SDI over the past decade.
5.5.4 Summary of Comparison
The different comparisons of the case studies provided an insight into the determinants,
collaboration dimensions and the expected contribution to the SDI development in each
state. The motivations and determinants for collaboration vary across each of the case
studies, however resource scarcity was found to be a common motivator, which supports
the findings in organisational literature.

A Local-State Spatial Data Sharing Partnership Model to Facilitate SDI Development
154
It was also found that the determinants for establishing the collaboration could provide a
mechanism for predicting the performance of collaboration. The two partnerships which
were established in more turbulent economic environments, and with an appreciation of
their mutual interdependence, seem to have progressed far more positively. Conversely,
the partnership that was established on the basis of unequal data sharing, and a degree of
exertion of control, has developed less successfully.
The collaborative initiatives also show a direct linkage and correlation to the development
of the SDI at state level. Although this link always has been assumed to exist, little
previous work has attempted to map the determinants of collaboration and the subsequent
collaborative process to the contribution of SDI development.
5.6 Chapter Summary This chapter has undertaken a comprehensive case study analysis of three state government
jurisdictions and documented their historical and contemporary progress. The qualitative
assessments provided a detailed understanding of the motivations, operation and issues
relating to each of the state initiatives, with particular focus and emphasis on why, how
and what events triggered their initiation and development. The comparisons have
identified important trends in the performance of each of the partnerships and key
operational and institutional issues.
Resource scarcity was found to be a strong positive determinant for collaboration across
the three states, particularly Victoria and Queensland. The alignment of organisational
goals and the recognition of a mutual interdependence promoted a growing level of trust
that was also evident in these two states. Legitimacy was highlighted as a positive
determinant in both Tasmania and Queensland, however the strength of legitimacy as a
long term driver is questioned. The Queensland case study has revealed that collaboration
through the exercise of power, although providing the basis for initiating collaboration,
does not appear to be a successful strategy.
The comparison of the performance of the partnerships has identified a number of
strengths and weaknesses across the six areas investigated. This analysis has found that
the Victoria and Tasmania partnerships appear to be performing more effectively than the
Queensland collaboration. The comparative findings emphasise the importance of
considering the full dimensions of the collaborative process to gain a more accurate
assessment of the partnership’s performance. The comparison of the contributions to SDI
development across the three states confirms the importance of the data sharing

Chapter 5 – Results of Partnership Case Studies at State Government Level
155
partnerships. This comparison also has the potential to assist in the targeting of
institutional strengthening efforts to improve future SDI development.
Chapter six examines the partnerships in each of these three jurisdictions from a local
government perspective through a comprehensive quantitative assessment of LGA
capacity, attitudes and outcomes.

A Local-State Spatial Data Sharing Partnership Model to Facilitate SDI Development
156

Chapter 6 – Results of Partnership Case Studies at Local Government Level
157
6 Chapter 6 Results of Partnership Case Studies at Local Government
Level
Chapter 6
Results of Partnership Case Studies
at Local Government Level

A Local-State Spatial Data Sharing Partnership Model to Facilitate SDI Development
158

Chapter 6 – Results of Partnership Case Studies at Local Government Level
159
6.1 Introduction
The case study analysis at State Government level provided a valuable insight into the
establishment, operation and institutional settings for each of the partnerships. This
chapter now examines each of the partnerships from the local government perspective.
The investigation at local government level focussed on identifying trends and factors that
would complement the analysis at state level. The research questions at local government
level sought to understand the motivations and barriers for local governments to share
data, the capacity of local government to participate in data sharing and the factors that
contribute to the success of data sharing at the local level. A quantitative method was
identified to be the most appropriate approach to answer these research questions. As a
result, an on-line questionnaire was utilised to collect data from over 100 LGAs across
three state jurisdictions.
This chapter presents the results of the analysis of the questionnaire to local governments
and is structured in three parts. In the first part of the chapter, key descriptive statistics
from the questionnaire are presented and discussed to identify the initial findings and
results. The second part of the chapter examines the similarities and variability between
the three states to determine specific trends and influences. Finally, the response variables
are grouped into components using exploratory factor analysis. A multiple regression
model is then employed to explain the contribution of these factors to the partnership
outcomes.
6.2 Descriptive Statistics and Summaries
6.2.1 Background
The survey of local governments was conducted across the three states previously
described in Chapter 5, namely Victoria, Queensland and Tasmania. The LGA
questionnaire (see appendix 3) was arranged in eight parts and included questions on each
LGAs organisation, information policies, access to data, data holdings and maturity, use of
standards, personnel, existing collaborations and outcomes from data sharing partnerships.
Table 6.1 summarises the structure of the LGA questionnaire.
Parts 1 to 7 investigated the capacity of each LGA across the components of an extended
SDI model, whilst part 8 of the questionnaire examined the outcomes and overall level of
satisfaction of LGAs with the data sharing partnership.

A Local-State Spatial Data Sharing Partnership Model to Facilitate SDI Development
160
Table 6.1 Structure of the LGA questionnaire
LGA Questionnaire Component Topics Covered Part 1: LGA Organisation Number of properties, staffing, ICT capacity, GIS
capacity, management support
Part 2: Policy on Use of Spatial Data Internal and external policies, cost recovery, attitudes towards privacy, copyright and legal liability.
Part 3: Accessing Spatial Data/ Technology Locating LGA data, technology and mechanisms to access spatial data
Part 4: About LGA Spatial Data Importance of property data, use of state government data, requests for their data, completeness of their data
Part 5: Spatial Data Standards and Integration Attitudes towards standards, use of metadata and level of data integration
Part 6: About People Profile of staff in spatial management area, organisational change, training
Part 7: Collaboration with organisations Level of collaboration, barriers and drivers, preferred models, expectations from data sharing and collaboration
Part 8: Outcomes from Specific Data Sharing Partnerships
Outcomes in terms of value, improved quality, improved communication, updates, overall satisfaction
A total of 103 valid LGA responses were received to the on-line questionnaire giving an
overall response rate of 56%. The statistical analysis of the survey results was undertaken
in SPSS Version 14. The results from the analysis are provided below.
6.2.2 The Organisation and GIS/ICT Capacity
Part 1 of the questionnaire examined a variety of organisational characteristics of LGAs
including, number of properties, staffing, ICT capacity, GIS capacity and management
support.
Size of LGAs
The LGAs across the three states vary dramatically in terms of the number of properties
they manage and their capacity. Table 6.2 provides a summary of the basic statistics of
LGAs surveyed across the three states. The median number of properties of the
Queensland and Tasmanian LGAs was very similar (approximately 10,000 properties),
whilst the median number of properties in the Victorian local governments was almost
three times this size. This difference in size can be attributed to the dramatic
amalgamation of local governments that took place in the 1990s in Victoria which reduced
the number of Victorian LGAs from 210 to 79.

Chapter 6 – Results of Partnership Case Studies at Local Government Level
161
Table 6.2 Largest, smallest and median size of LGAs in survey
State Victoria Queensland Tasmania
N = 43 47 13
Smallest LGA 4200 1500 3000
Largest LGA 128000 400000 26000
Median 27500 10300 9800
The largest local government to respond was Brisbane City Council, which has
approximately 400,000 properties in its local government area. The smallest LGA to
respond was also from Queensland, Nebo Shire Council, which has approximately 1500
properties, but spread over an area of almost 10,000 square kilometres.
ICT Infrastructure Capacity
The Information and Communication Technology (ICT) capacity of LGAs was examined
to identify potential relationships between the size of LGAs and their spatial information
capacity. Given the diversity of LGAs it was initially surprising to find 96% of LGA
respondents rated their ICT infrastructure as adequate or better. The remaining 4%
indicated that their infrastructure was poor, with all of these LGAs located in remote areas
of Queensland (see Figure 6.1). The correlation between LGA size and ICT capacity was
found to be significant (r = 0.315 at 0.01 level of significance).
PoorAdequateGoodExcellent
ICT Capacity
60.0%
50.0%
40.0%
30.0%
20.0%
10.0%
0.0%
Per
cent
VICTAS
QLD
State
Figure 6.1 ICT capacity self assessment
A number of local governments in Queensland have limited ICT and GIS capacity due to
their remoteness and lack of accessibility. This is illustrated more clearly in Figure 6.2
which maps Australia using the Accessibility/Remoteness Index. The map shows that
large areas of Queensland have a high accessibility/remoteness index (>5) which indicates
poor access to communication infrastructure and services. The accessibility of ICT to

A Local-State Spatial Data Sharing Partnership Model to Facilitate SDI Development
162
LGAs has improved significantly since the mid 1990s, which reflects the effort made by
federal government to improve communication infrastructure in remote areas. In 1997, the
Australian Government established the “Networking The Nation” program and allocated
approximately $320 million to improve ICT infrastructure across regional, rural and
remote Australia (Department of Communications Information Technology and the Arts
2006).
Figure 6.2 Accessibility/remoteness index of Australia (GISCA 2006)
Although Australia’s ICT infrastructure is poor in many remote areas of the country, its
overall ICT infrastructure and capacity is comparable to other developed nations. In 2005,
Australia was rated 11th out of 115 countries based on the network readiness index, and has
generally improved its position since 2002. The network readiness index indicates the
potential for countries to exploit the opportunities provided by information and
communication technology (Lopez 2005).
On-line Services and e-Business
Another indicator of technical capacity within the local government sector is the ability of
LGAs to provide online services or e-business to their customers. The results indicate that
39% of LGAs are already providing online services to customers, whilst another 22% were
in the process of developing these services (total of 61%). The most common online
services provided by LGAs include the payment of rates (taxes), services, animal
registration and fines. A number of local governments also offered library services,
bookings for parks and increasingly, access to information for property development or

Chapter 6 – Results of Partnership Case Studies at Local Government Level
163
conveyancing. These figures agree with an Australian Local Government Association ICT
survey which found 69% of LGAs surveyed in 2004 offered or were developing online
services (Australian Local Government Association 2004).
Spatial Information Capacity –Location of GIS Unit
With respect to the use of GIS, 95% of LGA respondents indicated that their organisation
was using a GIS. Of the remaining LGAs, 4% were in the process of establishing a GIS
and 1% indicated that their organisation did not have a GIS. The majority of those LGAs
with a GIS indicated that their GIS unit was located either within the Corporate
Services/IT Department (56%) or an Engineering Department (29%) (see Figure 6.3). The
location of the GIS unit within the IT or Corporate Services Department of the local
government is indicative of the increasing acceptance of GIS as a core corporate tool in
local government. A number of small local governments with a GIS system identified that
they used a consultant to manage their GIS. This reflects the limited technical capacity
that exists in many small LGAs.
Other location
No GIS Staff – use a consultant
Independent GIS Unit
Planning Department
Engineering/Works Department
Corporate Services/IT Department
GIS Unit Location
Figure 6.3 Location of GIS unit
Maturity of GIS in the LGA
The maturity of the GIS units within local governments is indicated by Figure 6.4. From
the figure it can be seen that the LGAs in the States of Queensland and Tasmania have
generally had GIS within their organisations for longer periods than the State of Victoria.
In the case of Queensland and Tasmania, the proportion of LGAs that have had a GIS
established for 10 years or longer is 33% and 38% respectively. In contrast, only 7% of

A Local-State Spatial Data Sharing Partnership Model to Facilitate SDI Development
164
Victorian LGAs indicated that their GIS had been in place for more than 10 years, whilst
more than 53% of LGAs identified their GIS was less than six years old.
Less than 3 yrs
4-6 yrs7-10 yrs11-15 yrsMore than 15 yrs
Age of GIS Unit
50.0%
40.0%
30.0%
20.0%
10.0%
0.0%
Per
cent
VIC
TAS
QLD
State
Figure 6.4 Length of time the LGA has had a GIS
The most likely reason for the slower uptake of GIS in Victoria was that the digital
cadastral mapbase was not readily available across the state until the late 1990s. The
digital cadastral mapbase was identified as being a priority data set, so without this data set
it would be difficult to integrate other property information. The recent development of
GIS in Victoria also correlates closely with the Property Information Project
implementation which provided funding and technical support for local governments to
establish GIS. The project provided funding and the digital cadastral mapbase, in
exchange for the street address and property information which enabled LGAs to build
their GIS.
Management Support and Resourcing
LGAs were also asked to indicate the level of management support for GIS and technology
issues. The findings indicate that approximately 82% of respondents were satisfied with
the level of support and resourcing provided by the management and their organisation.
The major area of resource deficiency identified was in the area of staffing. Most LGA
respondents (84%) indicated that their GIS unit was staffed by three staff or fewer. In
some cases, the officers responsible for managing the GIS were undertaking the GIS
management in conjunction with other activities.

Chapter 6 – Results of Partnership Case Studies at Local Government Level
165
6.2.3 Policy on Spatial Information
Part 2 of the questionnaire examined the LGA policies on accessing and pricing of spatial
information.
Presence of Formal Policies
The first issue addressed in this section of the questionnaire concerned the presence in the
LGA of formal policies on the use of spatial information either internally within the
organisation or externally. Approximately 95% of respondents indicated that their LGA
placed minimal or no restrictions on the internal use of their spatial data. However, for
external use 41% of LGAs indicated that external users were normally required to sign a
formal license agreement. Therefore, the remaining 59% of LGAs did not have any formal
policies on the use of their spatial information by external organisations or users. These
findings agree with the 2004 survey of LGAs by Australian Local Government Association
which found that approximately 60% of LGAs were found to have no formal policies on
information use (Australian Local Government Association 2004).
Some data sets provided by LGAs to external users such as developers, consultants and
business include state government data, such as the digital cadastral mapbase, which often
requires LGAs to ensure that the third party signs and abides by the state licensing
agreement.
Restrictions on the Use of LGA Spatial Information
Although only 41% of LGAs indicated that they require external users to sign a licensing
agreement a much larger percentage of LGAs indicated that they place limitations or
restrictions on the use of their spatial data. Figure 6.5 indicates that approximately 79% of
LGAs place restrictions, at least some of the time, on the use of the data provided to
external organisations. These results were generally consistent across the three states.

A Local-State Spatial Data Sharing Partnership Model to Facilitate SDI Development
166
NeverRarelySometimesMostlyAlways
Restrict Use of Data
40.0%
30.0%
20.0%
10.0%
0.0%
Per
cent
VICTASQLD
State
Figure 6.5 Are restrictions placed on the use of spatial data to external organisations?
LGAs were also asked whether the use of spatial information was encouraged both within
the LGA and externally. A high proportion of LGAs (75%) indicated that the use of
spatial information was encouraged within the organisation, but only 23% encouraged or
promoted its use to external organisations.
Pricing and Cost Recovery
The issue of charging and cost recovery provided a range of responses from the local
governments. Most LGAs (56%) responded that they do not charge for their spatial data,
whilst a further 19% charged a fee to cover the cost of provision only, and the remaining
25% were seeking to recover some additional costs (see Figure 6.6).
Recover Some Costs
Cost of Provision Don't Charge
Cost Recovery
80.0%
60.0%
40.0%
20.0%
0.0%
Per
cent
VICTAS
QLD
State
Figure 6.6 Attitude to cost recovery
The difference in attitude towards cost recovery varies significantly across the LGAs in the
three states. In Victoria, almost 75% of LGAs indicated that they rarely charge for data,

Chapter 6 – Results of Partnership Case Studies at Local Government Level
167
whilst approximately 65% of Queensland LGAs more commonly charge data at the cost of
provision or to generate some income. This may be partially explained by the fact that true
sharing of spatial data between local and state governments is still relatively new in
Queensland (less than 18 months). A number of LGAs were still being charged for state
data sets, such as the digital cadastral mapbase, at the time of the survey. This finding
indicates that LGAs are likely to adopt or copy the state government’s application of
policy.
When LGAs were asked if they charge the state government for the provision of data,
almost all local governments (92%) indicated that they do not. The remaining 8% of
LGAs were from Queensland which again supports the proposition that being charged for
data can encourage a “tit for tat” approach to charging.
Privacy, Legal Liability and Copyright
Although the issues of privacy, legal liability and copyright were identified as having an
impact on the LGA’s decision to share their data externally, the overall influence of these
issues on the LGAs policies was inconclusive. Most LGAs commented that they could
manage privacy and copyright issues, but had a greater concern regarding the potential
misuse of their data, and therefore their consequential liability.
6.2.4 Accessing and Locating Spatial Data
Part 3 of the questionnaire explored the methods used by LGAs for making their spatial
data accessible to both internal and external users.
Accessing Spatial Data for Internal Users
On the question of how internal users access and find the spatial information they require,
86% of respondents indicated that their internal users find and access the organisation’s
spatial data through the in-house GIS or intranet. A further 14% of LGAs identified that
direct telephone contact was the next most common means for internal users to find the
spatial data they require. GIS is now used widely across most LGAs with approximately
30-40% of staff in LGAs having access to GIS at their desktops..
Accessing Spatial Data for External Users
For external clients seeking to access spatial information, the situation was almost
reversed. Approximately 84% of external clients locate the spatial data they require by
telephoning the GIS officer in the LGA. Only 13% of LGAs indicated that external clients
used the internet to find data, whilst another 3% of LGAs indicated that their data could be
located by external clients through an external data directory such as the Australian Spatial

A Local-State Spatial Data Sharing Partnership Model to Facilitate SDI Development
168
Data Directory (ASDD). However, this trend is most likely to change over the next few
years as LGAs begin to provide web access to their spatial information. LGAs appear to
be very active in developing web mapping portals for their external users as identified in
Figure 6.7.
No Web MappingUnder DevelopmentWeb Mapping Available
Internet Web Mapping
60.0%
50.0%
40.0%
30.0%
20.0%
10.0%
0.0%
Per
cent
Figure 6.7 Use of web mapping
The results identified that approximately 21% of LGA respondents currently provide
external internet mapping, with another 21% indicating that they were developing a web
mapping capability. The remaining 58% of LGA indicated that either they did not want to
provide their spatial data over the internet or did not have the technical
capability/resources to do so.
Value of Web Mapping to Business
LGAs were also asked if making their data available to external clients and customers
through mechanisms such as the internet helped facilitate their LGA’s business (see Figure
6.8). 73% of respondents either agreed or strongly agreed with this proposition, 20% were
neutral, and only 7% of LGA respondents disagreed. This highlights the importance
placed by LGAs on empowering their clients to access data by external mechanisms.

Chapter 6 – Results of Partnership Case Studies at Local Government Level
169
Strongly Disagree
DisagreeNeither Agree nor Disagree
AgreeStrongly Agree
60.0%
50.0%
40.0%
30.0%
20.0%
10.0%
0.0%
Per
cent
Figure 6.8 Making spatial data accessible facilitates business
The findings illustrated in Figure 6.8 were supported by comments provided by individual
LGA staff in the open-ended comments sections within the questionnaire. The following
comments were indicative of the general experience of LGAs to opening up their spatial
data to the public.
Making common property-based data freely available to the public via web-mapping has
resulted in a sharp decline in ad-hoc queries and resulted in significant savings on staff
time. (Case # 41)
Expected to reduce the smaller and time consuming queries of where a Council asset is in
my property. (Case #20)
One LGA respondent commented that when their annual planning scheme was released
they would normally be inundated by enquiries from land owners and developers to access
this information. However, since the data was made available over the internet these
enquiries have reduced dramatically.
6.2.5 About LGA Spatial Data
Importance of Property Information to Local Governm ent
Property related information has always been required by local governments to undertake
their core business activities such as the provision of services for water, sewerage, garbage
collection, maintenance of roads and town planning and development. The LGA
respondents confirmed the importance of property related information to their
organisation, with 83% of LGAs identifying property information as very important and a

A Local-State Spatial Data Sharing Partnership Model to Facilitate SDI Development
170
further 16% rating it as important. The majority of LGAs also identified that their
property data was already in digital form.
Data Sourced from State Government
As shown in Figure 6.9, local governments obtain a significant amount of their spatial data
from the state government. LGAs from all three states indicated that the cadastral
mapbase, property valuations data, orthophotography and topographic data were the most
commonly sourced state datasets.
VICTASQLD
50
40
30
20
10
0
No.
of L
GA
s U
sing
Dat
a
TopographyPlanning DataOrthophotography
Cadastral MapbaseValuation Data
Figure 6.9 Most common spatial data sourced from state government agencies
In Victoria, valuation data is captured at a local government level which explains the small
number of requests by LGAs in Victoria for this data. Similarly, planning data in
Queensland and Victoria is primarily the responsibility of local government, so limited
requests for this data from state government would be expected. The sourcing of
topographic data appears to be most common in Tasmania and Victoria, which reflects the
broad data exchange arrangements in these states. Other key datasets identified as being
sourced from the state governments include transport, roads, vegetation and critical
infrastructure.
Accessibility of State Data
When asked the question if the data they required from the state government agencies was
easily accessible, 76% LGAs agreed or strongly agreed. On the separate question on the
pricing of the data, 63% agreed that the cost of acquiring this data was acceptable. The
Queensland LGA responses showed the only trend which indicated strong disagreement
with this statement, with approximately 20% of Queensland LGAs indicating the cost of
the state government data was not reasonable. This result is not unexpected given that

Chapter 6 – Results of Partnership Case Studies at Local Government Level
171
Queensland was still charging quite substantial fees to LGAs for the supply of their digital
mapbase up until late 2004.
Requests for LGA Data
Most LGAs received regular requests for address and property data from a variety of state
and federal government agencies, non-government organisations (NGOs) and private
companies. On average, LGAs indicated that they received between 2-3 requests per
month for their spatial data however, a number of LGAs reported as many as 20-30
requests per month. Emergency service agencies (police, fire, ambulance) and developers
were the most commonly identified source of requests with more than 55% of LGAs
identifying that they receive regular requests, from these agencies (see Figure 6.10). Other
agencies such as utility companies (e.g. Telcos), government corporations (e.g. Australia
Post) and the Electoral Commission were mentioned by specific local governments as
agencies which regularly request data.
Others - Telcos, Electral
Office, Aust Post
Local Government
and Planning
Dept
DevelopersNGOsHealth Depts
State Land and
Mapping Dept
Emergency Services
Transport Dept
60
50
40
30
20
10
0
No
of R
espo
nses
Figure 6.10 Source of property data requests by number of LGAs
Although LGAs do not have any reservation about supplying data to organisations such as
emergency services or the Electoral Commission, these requests take time and become
another task in an already busy work environment. A key outcome of the data sharing
partnership arrangements was to create a central repository at state level which would
reduce these requests. These results appear to indicate that the partnerships do not appear
to have yet achieved this goal.
Completeness of Data
The average level of completeness or maturity of LGA data sets is generally quite high.
For property related information such as street address, digital cadastral mapbase, planning

A Local-State Spatial Data Sharing Partnership Model to Facilitate SDI Development
172
information and valuation data, LGAs recorded that their databases were at a high or fully
complete stage of completeness.
Community Data
PlanningEnginnering and Asset
TopographyCadastral Mapbase
ValuationAddress and Property
5
4
3
2
1
0
Leve
l of C
ompl
eten
ess
(0=
Ver
y In
com
plet
e 5=
Ful
ly
Com
plet
e)
Figure 6.11 Average level of completeness of spatial data by data theme
Figure 6.11 shows the average level of completeness of various data themes across the
surveyed LGAs. Approximately 70% of LGAs identified that their spatial data sets were
either mostly or fully complete for each theme, whilst the remaining 30% of LGAs
reported partial completeness. This indicates that LGAs have significant holdings of data
which may potentially be available for sharing.
6.2.6 Spatial Data Standards and Integration
In part 5 of the questionnaire the use of standards, metadata and the degree of internal
system integration by LGAs were investigated to determine the potential of LGAs to
integrate their data with external organisations.
Use of Standards
Responses from LGAs on the issue of standards varied significantly with few trends
emerging on the importance or otherwise of standards. Although standards and formats
were identified as being problematic by some LGAs, most indicated that standards were
not a significant issue. The majority of LGAs (76%) responded that data standards were
considered during the construction of their spatial databases. A further 18% of LGAs
replied that they sometimes considered the issues of standards.
Use of Metadata
Metadata is an important component of spatial information data sets and identifies the
source, currency and quality of spatial data. However, only 42% of LGAs currently enter
metadata within their GIS. The remaining 58% of LGAs indicated that they did not enter

Chapter 6 – Results of Partnership Case Studies at Local Government Level
173
metadata or were not aware of the need for metadata. These findings are supported by
other documented studies such the Local Government and the Australian Spatial Data
Infrastructure Project which identified that only 44% of LGAs stored metadata
(Hawkesbury-Nepean Catchment Management Trust 2000). Not surprisingly this study
also identified that the majority of the metadata collected by these LGAs was not
compliant with national metadata standards, which will inhibit future state and national
efforts to exchange data.
Difference in the Scale of Data
In the early investigations on the issues that concerned local government with respect to
the sharing of spatial data, the variability of the scale of information being exchanged was
identified as a potential issue. However, although the issue was highlighted as important
by approximately 34% of LGAs, a further 34% did not rate the variability of scale as an
important issue.
Level of Integration
The last area investigated within this part of the questionnaire was the level of integration
between the GIS and the other LGA systems. It was hypothesised that the level of
integration could be used to predict the level of interoperability, and hence the LGA’s
capacity to easily exchange information. As Figure 6.12 illustrates, the average level of
integration of the spatial information systems with other key systems across the LGAs was
generally quite high. The level of integration with three key systems, namely
property/rating system, asset management system and the financial management system
was examined. The property/rating system, is hub of most local government information
systems and is responsible for managing individual property taxes, services such as water
and sewerage, animal registration and planning controls. Asset management systems in
local government are now widely used to manage and maintain LGA infrastructure such as
roads, sewerage networks, water supply and reticulation, drainage systems, buildings and
facilities.

A Local-State Spatial Data Sharing Partnership Model to Facilitate SDI Development
174
VICTASQLD
State
5
4
3
2
1
0
Leve
l of I
nteg
ratio
n (0
=No
Inte
grat
ion,
5=
Fully
Inte
grat
ed)
Financial System
Asset Management System
Property System
Figure 6.12 Level of integration of GIS with other systems in LGAs
Approximately 69% of LGAs identified that they had either a good or full level integration
with their property system. Integration with asset management systems was lower with
only 33% of LGAs indicating a good or full level of integration. Only 16% of LGAs
indicated that they had a good or full level of integration with their financial system.
These findings compare well with other industry findings on the level of integration. The
2003/2004 Australian GIS Best Practice Survey undertaken by Corporate GIS Consultants
reported on levels of integration for property (65%), asset management (46%) and
financial (15%) systems (Douglas & Lowe 2004). These figures compare well with the
results found in the LGA questionnaire. It is expected that the high level of integration of
the property systems in Victoria is closely correlated to the relatively new GIS systems
installed as part of the Property Information Project.
6.2.7 People
For most organisations, their human resource is the most important component of the
organisation. Part 6 of the questionnaire examined the human resource capacity of LGAs
including the number of staff involved in spatial information activities, their qualifications,
the level of staff change and staff access to training.
Average Number of GIS Staff in LGAs
The results indicate that almost 66% of LGAs have only one GIS staff member, a further
18% have either two or three GIS staff, and remaining 16% of LGAs have four or more
GIS staff. This highlights the difficult situation faced by many LGAs in participating in
data sharing partnerships. With only one staff member to manage the organisation’s GIS
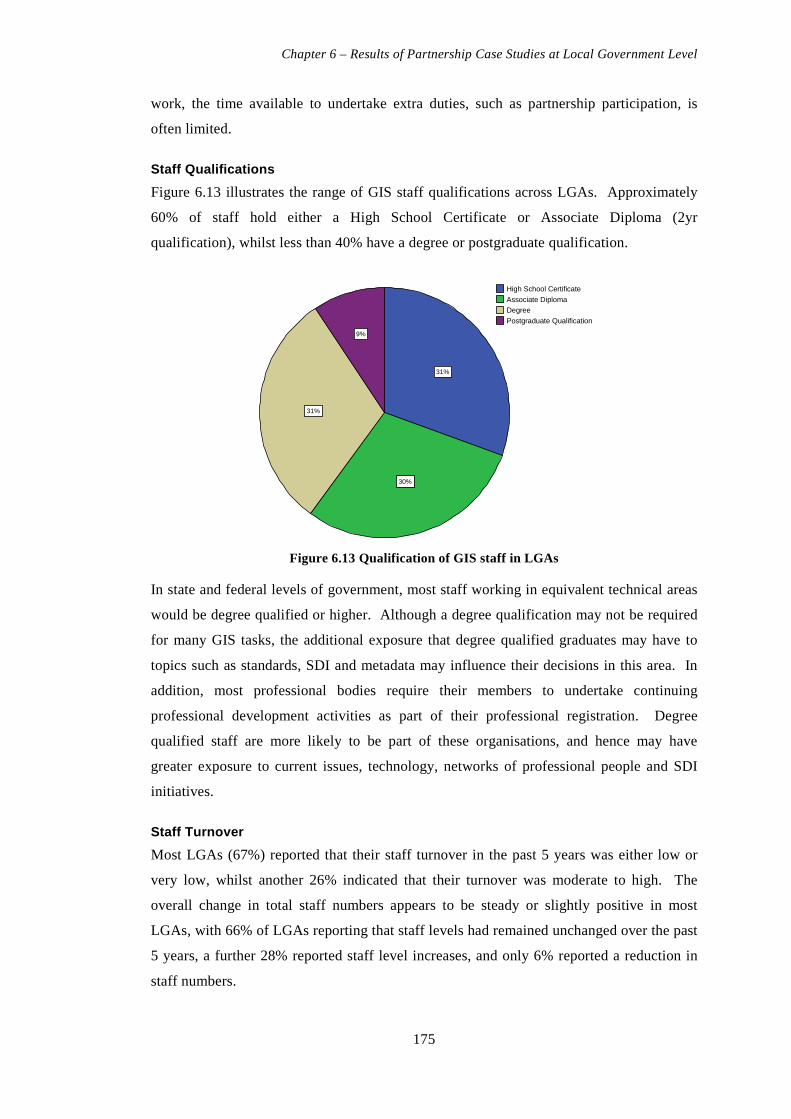
Chapter 6 – Results of Partnership Case Studies at Local Government Level
175
work, the time available to undertake extra duties, such as partnership participation, is
often limited.
Staff Qualifications
Figure 6.13 illustrates the range of GIS staff qualifications across LGAs. Approximately
60% of staff hold either a High School Certificate or Associate Diploma (2yr
qualification), whilst less than 40% have a degree or postgraduate qualification.
9%
31%
30%
31%
Postgraduate Qualification
DegreeAssociate Diploma
High School Certificate
Figure 6.13 Qualification of GIS staff in LGAs
In state and federal levels of government, most staff working in equivalent technical areas
would be degree qualified or higher. Although a degree qualification may not be required
for many GIS tasks, the additional exposure that degree qualified graduates may have to
topics such as standards, SDI and metadata may influence their decisions in this area. In
addition, most professional bodies require their members to undertake continuing
professional development activities as part of their professional registration. Degree
qualified staff are more likely to be part of these organisations, and hence may have
greater exposure to current issues, technology, networks of professional people and SDI
initiatives.
Staff Turnover
Most LGAs (67%) reported that their staff turnover in the past 5 years was either low or
very low, whilst another 26% indicated that their turnover was moderate to high. The
overall change in total staff numbers appears to be steady or slightly positive in most
LGAs, with 66% of LGAs reporting that staff levels had remained unchanged over the past
5 years, a further 28% reported staff level increases, and only 6% reported a reduction in
staff numbers.
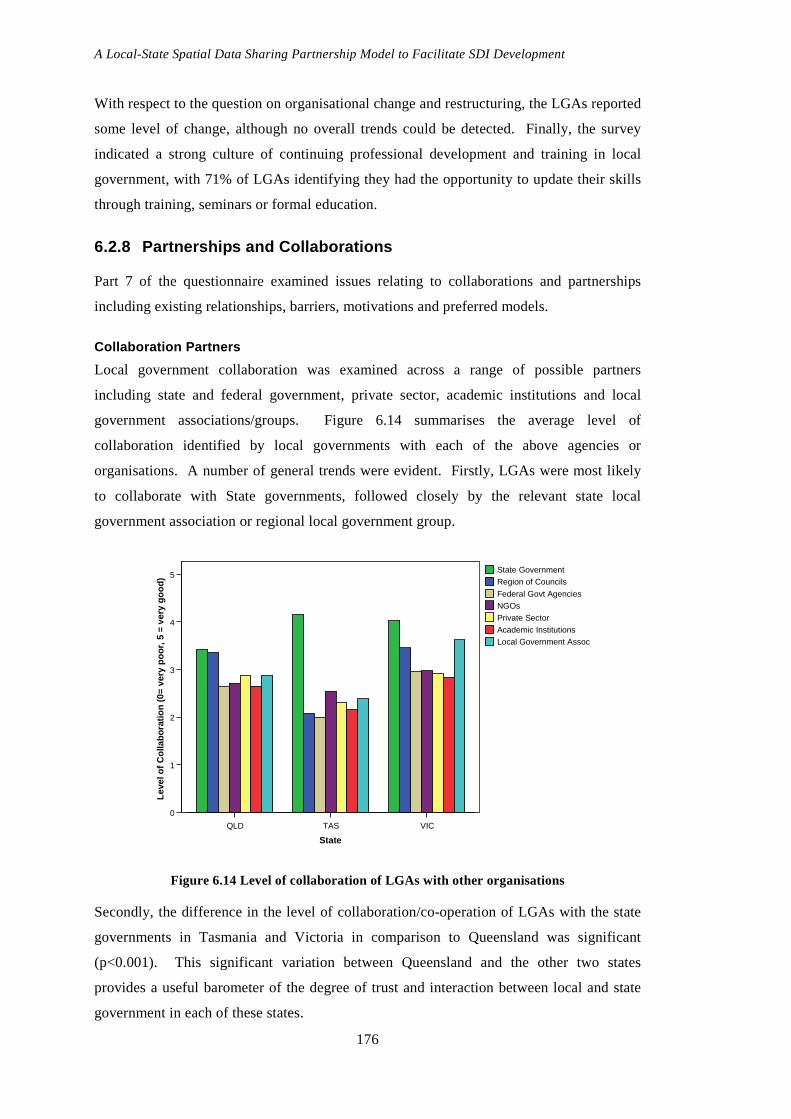
A Local-State Spatial Data Sharing Partnership Model to Facilitate SDI Development
176
With respect to the question on organisational change and restructuring, the LGAs reported
some level of change, although no overall trends could be detected. Finally, the survey
indicated a strong culture of continuing professional development and training in local
government, with 71% of LGAs identifying they had the opportunity to update their skills
through training, seminars or formal education.
6.2.8 Partnerships and Collaborations
Part 7 of the questionnaire examined issues relating to collaborations and partnerships
including existing relationships, barriers, motivations and preferred models.
Collaboration Partners
Local government collaboration was examined across a range of possible partners
including state and federal government, private sector, academic institutions and local
government associations/groups. Figure 6.14 summarises the average level of
collaboration identified by local governments with each of the above agencies or
organisations. A number of general trends were evident. Firstly, LGAs were most likely
to collaborate with State governments, followed closely by the relevant state local
government association or regional local government group.
VICTASQLD
State
5
4
3
2
1
0
Leve
l of C
olla
bora
tion
(0=
very
poo
r, 5
= v
ery
good
)
Local Government AssocAcademic InstitutionsPrivate SectorNGOsFederal Govt Agencies
Region of CouncilsState Government
Figure 6.14 Level of collaboration of LGAs with other organisations
Secondly, the difference in the level of collaboration/co-operation of LGAs with the state
governments in Tasmania and Victoria in comparison to Queensland was significant
(p<0.001). This significant variation between Queensland and the other two states
provides a useful barometer of the degree of trust and interaction between local and state
government in each of these states.
Chapter 6 – Results of Partnership Case Studies at Local Government Level
177
Equality in Collaborations
When LGAs were asked who benefited most from partnerships or collaborations for
sharing spatial data, the majority (64%) of LGAs indicated that there was approximately
equal benefit to both partners. A further 23% of LGAs indicated that the other partner was
gaining more from the partnership, whilst 13% identified that their LGA was the primary
beneficiary. Again Queensland LGAs were more likely to indicate that the other partners
were more likely to benefit more from the collaboration than their LGA.
Need to Collaborate and Share Data
There was strong overall agreement amongst the three states (73%) that the exchange or
sharing of spatial data was necessary for local governments to effectively carry out their
business, with only 2% of respondents disagreeing.
Barriers to Collaboration
The responses by LGAs with respect to the importance or otherwise of a range of potential
barriers or obstacles for collaborating with state government agencies for spatial data
sharing arrived at the ranking of issues in Figure 6.15. The highest ranking issues
identified by LGAs were legal liability, data standards, accessing of data, copyright and
privacy.
Data sets not equal
Time and effort
Trust/goodwill
ITC infrastructure
Managem
ent support
Cost/price
Privacy
Copyright
Finding/access
Data standards
Legal liability
4
3
2
1
0
Impo
rtanc
e as
Bar
rier
(0=
not i
mpo
rtan
t, 5
= ve
ry i
mpo
rtan
t)
Figure 6.15 Ranking of barriers for LGA participati on in data sharing
The issue of legal liability was raised a number of times previously by LGAs as an
obstacle for making their data more freely available to the community. LGAs seemed to
be less concerned with the cost of data, management support, their level of ICT
infrastructure, trust/goodwill, time required to support the collaboration and the equal

A Local-State Spatial Data Sharing Partnership Model to Facilitate SDI Development
178
value of the data sets. In summary, no one issue stood out clearly above the rest and all
were considered to be of some level of concern to LGAs. The responses across the three
states did not show any significant inter-state variations.
Perhaps the only category that was identified as being of lesser importance was the issue of
equality of the data sets being exchanged. The responses indicated that the actual process
of exchanging data was more important than the actual value of the data being exchanged.
This is supported by the case study in Tasmania, where the State Government has now
abandoned its efforts to define the level of equity in individual data sets as part of the LIST
data exchange. The LIST partnership found that the time and effort required to administer
the management of data equity was too time consuming and costly in comparison to the
potential royalties that accrued. The administration of small royalty payments during the
initial partnership in Queensland was also found to be unviable.
Drivers for Collaboration
The responses by LGAs on the importance of a range of drivers or motivators for the
sharing of spatial data are shown in Figure 6.16. There was no single issue that stood out
clearly above the group, although the drivers identified were rated at a relatively high level
of importance.
Figure 6.16 Ranking of drivers for LGA participation in data sharing
In summary, the drivers for collaboration appear to be closely aligned with improving
decision making and the delivery of services which emphasise the strong business basis for
the exchange of data.
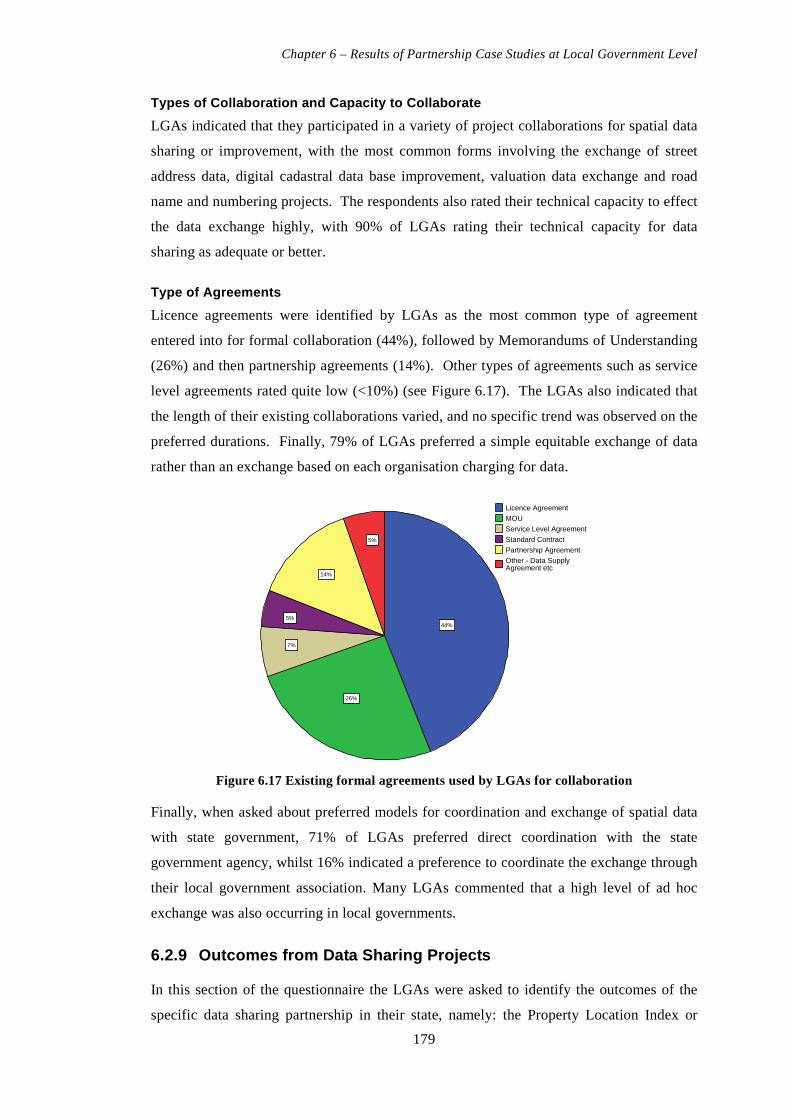
Chapter 6 – Results of Partnership Case Studies at Local Government Level
179
Types of Collaboration and Capacity to Collaborate
LGAs indicated that they participated in a variety of project collaborations for spatial data
sharing or improvement, with the most common forms involving the exchange of street
address data, digital cadastral data base improvement, valuation data exchange and road
name and numbering projects. The respondents also rated their technical capacity to effect
the data exchange highly, with 90% of LGAs rating their technical capacity for data
sharing as adequate or better.
Type of Agreements
Licence agreements were identified by LGAs as the most common type of agreement
entered into for formal collaboration (44%), followed by Memorandums of Understanding
(26%) and then partnership agreements (14%). Other types of agreements such as service
level agreements rated quite low (<10%) (see Figure 6.17). The LGAs also indicated that
the length of their existing collaborations varied, and no specific trend was observed on the
preferred durations. Finally, 79% of LGAs preferred a simple equitable exchange of data
rather than an exchange based on each organisation charging for data.
5%
14%
5%
7%
26%
44%
Other - Data Supply Agreement etc
Partnership AgreementStandard ContractService Level AgreementMOULicence Agreement
Figure 6.17 Existing formal agreements used by LGAs for collaboration
Finally, when asked about preferred models for coordination and exchange of spatial data
with state government, 71% of LGAs preferred direct coordination with the state
government agency, whilst 16% indicated a preference to coordinate the exchange through
their local government association. Many LGAs commented that a high level of ad hoc
exchange was also occurring in local governments.
6.2.9 Outcomes from Data Sharing Projects
In this section of the questionnaire the LGAs were asked to identify the outcomes of the
specific data sharing partnership in their state, namely: the Property Location Index or

A Local-State Spatial Data Sharing Partnership Model to Facilitate SDI Development
180
Data Share in Queensland, the Land Information System Tasmania or the Property
Information Project in Victoria. Seven LGAs indicated that they had not signed the
exchange agreement at the time of the survey. Six of these LGAs were from Queensland
and one was from Tasmania. The reasons given for not signing the agreements varied but
included: a lack of trust, lack of business need or the process was too bureaucratic.
The Data Sharing Partnership has been Worthwhile
This section of the questionnaire firstly examined the value of the data sharing
arrangement to each respondent’s organisation to gauge if it had been worthwhile. Figure
6.18 graphs the responses in each of the three states.
Did Not Sign
Strongly Disagree
DisagreeNeither Agree nor Disagree
AgreeStrongly Agree
The Data Sharing Partnership has been Worthwhile
60.0%
40.0%
20.0%
0.0%
% o
f LG
As fo
r Eac
h St
ate
VIC
TAS
QLD
State
Figure 6.18 Value of the data sharing arrangement to their organisation
The results show that 83% of the total respondents who had signed a data sharing
partnership arrangement either agreed or strongly agreed that it had been worthwhile for
their organisation. The levels of agreement were highest in Tasmania and Victoria whilst
there was a lower level of agreement (approximately 60%) in Queensland.
The Data Sharing Partnership has Improved Data Qual ity
A similar trend was observed on the question on whether the data sharing partnerships had
improved their organisation’s data quality. Again, the overall level of agreement to this
question was high (71%) across the aggregated state data, with both Victoria and Tasmania
responding positively (see Figure 6.19). However, the level of agreement from
Queensland LGAs was only 36% which reflects that the initial data sharing arrangement
was primarily a one way exchange process and had done little to improve the quality of the
LGAs data.

Chapter 6 – Results of Partnership Case Studies at Local Government Level
181
Strongly Disagree
DisagreeNeitherAgreeStrongly Agree
Data Share Has Improved Quality
60.0%
40.0%
20.0%
0.0%
% o
f LG
As
For E
ach
Sta
te
VIC
TASQLD
State
Figure 6.19 Has the data sharing partnership improved data quality?
These findings support the state based case studies which found that data quality of the
property related data sets in both Tasmania and Victoria had improved significantly. In the
case of Queensland it was found that LGA participation was low until a more equitable
pricing and access policy was implemented. The increased use of data of through data
sharing processes has been shown to improve data quality.
Data Sharing of Equal Value
There was a high level of agreement (70%) that the partnerships arrangements had
provided approximately equal benefit to each organisation as shown in Figure 6.20.
Strongly Disagree
DisagreeNeither AgreeStrongly Agree
Data Share is of Equal Benefit to Both Organisation s
60.0%
50.0%
40.0%
30.0%
20.0%
10.0%
0.0%
% o
f LG
As in
Eac
h S
tate
VIC
TAS
QLD
State
Figure 6.20 Is the data share of equal benefit to both organisations?
The Victorian LGAs showed the strongest level of agreement which perhaps reflects the
good level of communication and information sharing that was nurtured during the early
stages of the partnership negotiations.

A Local-State Spatial Data Sharing Partnership Model to Facilitate SDI Development
182
Value of Each Partner’s Contribution
The partnership was also explored from the perspective of the LGAs assessment of the
value of their contribution to the data share arrangement including effort, resources and
value of the data. The majority of LGAs (61%) identified that the effort or contribution of
both partners was approximately equal, however some general trends can be seen among
each of the states (see Figure 6.21).
In Queensland and Victoria, there was a cohort of LGAs who perceived that their
contribution was greater than the state government, whilst a proportion of Tasmanian
LGAs perceived the state government contribution was greater. The smaller local
governments were more likely to agree that the state’s contribution was greater.
Much less valuable than
the State
Less valuable than State
Of equal value
More valuable than State
Much more valuable than
State
LGA Perspective on the Value of Contribution
60.0%
40.0%
20.0%
0.0%
% o
f LG
As in
Eac
h St
ate
VIC
TAS
QLD
State
Figure 6.21 Perspective on the value of each partner’s contribution
Frequency of Data Updates
As part of the data sharing arrangements in each state, it is usual practice to receive regular
updates of data from each organisation. In Victoria and Tasmania, this level of exchange
was identified to occur regularly in approximately 95% and 70% of LGAs respectively.
However, in Queensland regular updates of each of the organisation’s data occurred in
approximately 44% of LGAs. Victoria’s very high levels of exchange reported can be
explained by the more developed management structure of the PIP project which focuses
on assessing the performance of the data exchange at regular intervals.
Frequency of Communication
Similar trends were reported by the LGAs on their level of satisfaction with respect to the
frequency of communications with the state government agencies. Victoria reported the
highest level of satisfaction (strong or very strong agreement) with 95%, followed by
Tasmania (71%) and then Queensland (43%). The high level of satisfaction with respect
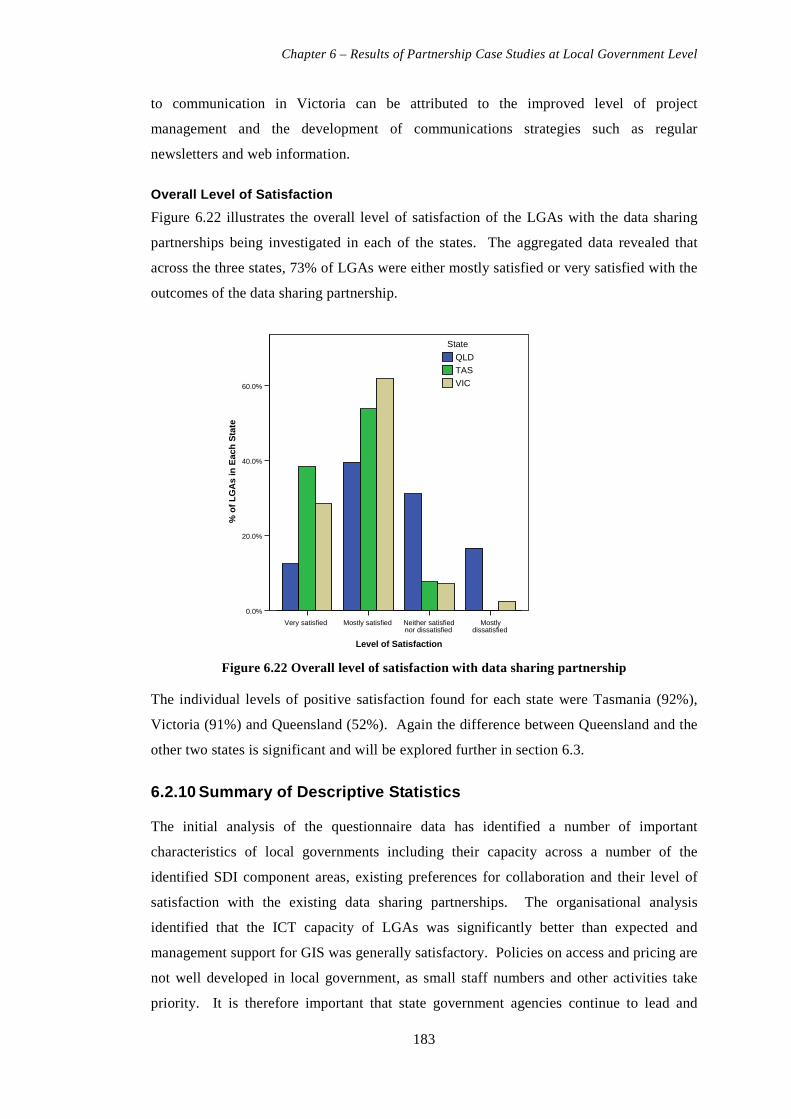
Chapter 6 – Results of Partnership Case Studies at Local Government Level
183
to communication in Victoria can be attributed to the improved level of project
management and the development of communications strategies such as regular
newsletters and web information.
Overall Level of Satisfaction
Figure 6.22 illustrates the overall level of satisfaction of the LGAs with the data sharing
partnerships being investigated in each of the states. The aggregated data revealed that
across the three states, 73% of LGAs were either mostly satisfied or very satisfied with the
outcomes of the data sharing partnership.
Mostly dissatisfied
Neither satisfied nor dissatisfied
Mostly satisfiedVery satisfied
Level of Satisfaction
60.0%
40.0%
20.0%
0.0%
% o
f LG
As
in E
ach
Sta
te
VIC
TAS
QLD
State
Figure 6.22 Overall level of satisfaction with data sharing partnership
The individual levels of positive satisfaction found for each state were Tasmania (92%),
Victoria (91%) and Queensland (52%). Again the difference between Queensland and the
other two states is significant and will be explored further in section 6.3.
6.2.10 Summary of Descriptive Statistics
The initial analysis of the questionnaire data has identified a number of important
characteristics of local governments including their capacity across a number of the
identified SDI component areas, existing preferences for collaboration and their level of
satisfaction with the existing data sharing partnerships. The organisational analysis
identified that the ICT capacity of LGAs was significantly better than expected and
management support for GIS was generally satisfactory. Policies on access and pricing are
not well developed in local government, as small staff numbers and other activities take
priority. It is therefore important that state government agencies continue to lead and

A Local-State Spatial Data Sharing Partnership Model to Facilitate SDI Development
184
support LGAs to develop their policy frameworks. LGAs appear more likely to adopt or
mimic the state government policies on access and pricing, although this has not been
proven conclusively.
Local government data is increasingly available over the web and indications are that it
will be a strong driver for facilitating business and reducing the number of over-the-
counter enquiries for LGAs. The importance of property related data, particularly address
data and the digital cadastral mapbase was confirmed. The level of completeness of core
data sets was very high for most local governments which should provide an excellent
basis for exchanging digital data. Standards and metadata were identified as issues that
will continue to demand attention and strategies to improve compliance in these areas.
Integration of data across the LGAs is well advanced, but full interoperability is still some
way off.
Differences between the states were identified in the trends on collaboration. Tasmania
and Victoria appear to have developed a higher level of trust and intergovernmental
relations than Queensland. The overall level of satisfaction with the data sharing
partnerships was also highest in Victoria and Tasmania. These significant differences will
be explored in more detail in the next section of the chapter.
6.3 Analysis of Variability Amongst the States
6.3.1 Introduction
The descriptive statistics discussed in section 6.2 have provided an insight into the
capacity of local governments to share spatial data. It was also evident that there were a
number of areas where differences existed between the states, particularly in the outcomes
that were delivered by the partnership arrangements. This section of the analysis examines
the differences amongst the three states to determine if they are significant and can be
explained.
6.3.2 Results of Difference Analysis
The results of the difference analysis are summarised in Table 6.3 and the full analysis is
provided in Appendix 5. Only the variables that illustrated significant inter-state variation
(p<0.05) are tabulated. The variables highlighted in Table 6.3 have the highest level of
significance with respect to inter-state variation with p-values <0.01 for both the ANOVA
and Kruskal Wallis tests. Organisational variables including size and staffing numbers
were identified as significant. It is suspected that some of this variance in these variables
can be partially explained by the influence of a few of large LGAs in Queensland

Chapter 6 – Results of Partnership Case Studies at Local Government Level
185
including Brisbane City Council (400,000 properties) and Gold Coast City Council
(210,000 properties).
The length of time having a GIS was identified as a significant inter-state variation. This
is partially explained by the Victorian PIP partnership which assisted the establishment of
a large number of geographic information systems at the start of the project. A significant
difference was identified in the cost recovery policy between the states which reflected the
more restrictive pricing and access arrangements in Queensland up until late 2004.
Table 6.3 Variables that illustrate significant inter-state difference (p <0.05)
State QLD VIC TAS
Variables
Mean Mean Mean
ANOVA Significance
p<0.05
Kruskal Wallis
Significance p<0.05
Number of properties 33,210 32,237 12,221 0.041
Number of staff 508 346 194 0.039
Number of GIS staff 4.47 1.15 1.14 0.023 0.003
Length of time having GIS 3.21 2.50 3.62 0.000 0.000
Cost recovery policy 2.02 1.31 1.62 0.000 0.000
Internet web mapping is available 2.23 2.19 1.08 0.023
Technology has made SI more accessible 3.52 3.57 2.92 0.027 0.045
Cost of state data is acceptable 3.31 3.74 4.23 0.001 0.002
Limitations by state on data is acceptable 3.44 3.76 4.15 0.006
Overall maturity of SI 3.73 3.54 4.24 0.016 0.005
Level of staff turnover 2.35 2.15 1.62 0.012 0.020
Access to training 3.52 4.10 3.00 0.001 0.002
Average level of collaboration across organisations 2.93 3.25 2.52 0.002 0.001
Average of all barriers 3.54 3.63 2.88 0.005 0.024
Number of collaborations 2.13 2.62 1.77 0.029
Equal exchange better 4.33 3.80 4.27 0.040
Data sharing partnerships is worthwhile 3.67 4.36 4.54 0.000 0.000
Data sharing has improved quality 3.21 4.29 4.38 0.000 0.000
Believe that the benefits are equal 3.40 4.05 3.31 0.001 0.001
Believe that the efforts are equal 2.63 2.48 3.31 0.002 0.016
Are provided updated data regularly 3.17 4.69 4.23 0.000 0.000
Communication frequency 3.35 4.12 3.92 0.000 0.000
Overall level of satisfaction 3.48 4.17 4.31 0.000 0.000
Note: Variables with p<0.01 are highlighted

A Local-State Spatial Data Sharing Partnership Model to Facilitate SDI Development
186
Queensland and Victoria showed significant differences towards web mapping and
external accessibility of data when compared to Tasmania. It appears that with the
accessibility of data through the Tasmanian LIST, LGAs in Tasmania are perhaps less
inclined to develop their own web mapping capability or do not have the technical capacity
to do so. The difference between the LGAs’ perspectives on the cost of state government
data is most evident between Queensland and Tasmania, with Queensland LGAs less
satisfied with the pricing arrangements and Tasmanian LGAs generally very satisfied. A
similar trend can be seen on the LGAs view on the limitations placed on the use of state
data by the data custodians.
Tasmania showed significant differences in the overall maturity levels of their spatial
information holdings, generally being higher than Queensland and Victoria. There was
also evidence of greater staff stability in this state than in the other states, perhaps related
to the relative isolation of this island state and the smaller size of their LGAs in
comparison to Queensland and Victoria. Victoria showed strong differences from the
other two states in the areas of access to training and the level of positive collaborations
with other organisations. It is suggested that the smaller state size and access to training
through the Property Information Project is reflected by these findings. Local
governments in the state of Victoria also appear to have established a good level of
collaboration with organisations other than the state government, particularly the
Municipal Association of Victoria.
It was found that perception of the importance of various barriers to data sharing varies
among the three states. Tasmania appears the least concerned with issues such as privacy,
copyright, trust and so forth, as being barriers to data sharing. It is suggested that this may
be explained by the length of time the data sharing arrangement in this state has been in
place. The LIST partnerships have been operating for almost 10 years and the LGAs are
therefore conditioned to a more conducive data sharing environment.
The trends in the analysis of the outcome variables, namely the value of the partnership,
improved data quality, regular communication, regularly updated data and overall level of
satisfaction show significant differences between the three states. Queensland LGAs were
the least satisfied with the partnership outcomes whilst the Tasmanian and Victoria were
the most satisfied.
6.3.3 Summary of Findings on Interstate Differences
A number of differences amongst the three states were evident across a range of variables.
Some of these differences appear to be related to the outcome related variables such as

Chapter 6 – Results of Partnership Case Studies at Local Government Level
187
satisfaction and improvements in data quality. In other instances variations appear to be
more related to the size or composition of the jurisdiction. The relationship between
variables such as pricing and access policies, size, existing collaborations, organisational
change, training and the outcome variables therefore deserve further attention. In order to
investigate these relationships, the next section of the chapter examines the use of factor
and regression analysis to explain these relationships.
6.4 Factor and Regression Analysis
6.4.1 Overview of Process
The purpose of the factor and regression analysis was to identify which variables or groups
of variables were contributing towards the success of the data sharing partnerships and
hence SDI development. Figure 6.23 illustrates the analysis process.
Figure 6.23 Factor and regression analysis process
The analysis consisted of a three stage process which commenced by using exploratory
factor analysis to reduce the identified 36 variables from Parts 1-7 of the questionnaire to
13 factors. These factors reflect the capacity of the LGAs in each of the extended SDI
framework components. Variables from Part 8 were also reduced down from six outcome
variables to a single outcome factor.
The second stage of the process was then to examine the relationships between the 13
factors to identify any important trends. The process of grouping factors often creates

A Local-State Spatial Data Sharing Partnership Model to Facilitate SDI Development
188
correlations which may provide a useful insight into the final results of the regression
analysis. Finally, the 13 factors were used as predictor variables in regression analysis to
model the single outcome factor. This identified which of the grouped factors contributed
more positively to the successful outcomes of the partnership.
6.4.2 Factor Analysis
The variables used in the questionnaire included a range of measurement types including
continuous numeric values (e.g. number of properties), descriptive ordinal/internal values
(e.g. Likert scale – agree, strongly agree) and categorical or nominal values. The
categorical or nominal variables were not suitable for factor analysis and were therefore
not utilised. Prior to the factor analysis the continuous numeric variables and the ordinal
Likert variables were transformed to numerical interval classes between 0 and 5.
Factor analysis is a well documented technique that assists in identifying clusters of
variables that may be logically grouped into a smaller set of these variables which have
common underlying constructs or factors. Factor analysis generally can be applied when:
1. the range of variables being analysed are at least of an ordinal level of
measurement;
2. the variables are normally distributed;
3. the relationship between variables is reasonably linear;
4. the sample is at least 100;
5. there are more participants than variables and extracted factors.
(Brace et al. 2006, p. 310)
Once the appropriate transformations had been completed, the data from the LGA
responses satisfied these criteria.
The factor analysis was undertaken using the standard principal component analysis
method to reduce the total number of independent variables from 36 to 13 grouped factor
components. Table 6.4 lists the 13 new components (factors) and the original 36
independent variables with their factor loadings. A full listing of the factor analysis is
given in Appendix 6

Chapter 6 – Results of Partnership Case Studies at Local Government Level
189
Table 6.4 Factor analysis components and initial variables
Components from Factor Analysis Initial Independent Variables for Factor Analysis (Factor Loadings)
Component 1: Size Number of Properties (0.932) Number of Staff (0.937) Number of GIS staff (0.925)
Component 2: Organisational Support and Attitudes
Assessment of ICT Capacity (0.695) Level of Management Support (0.670) Level of Resourcing of the GIS (0.777) Internal Policy Encourages Data Use (0.607) Staff know where to find data (0.503) Technology Has Made SI More Accessible (0.464) Capacity to Share (0.539)
Component 3: Data Accessibility/Maturity Percentage of Staff with Access to GIS (0.419) Internet Web Mapping is available ((0.679 Overall maturity of SI (0.581) External Policy Encourages Data Use (0.486) Accessibility Improves Council's Business (0.633)
Component 4: Internal Accessibility Level of integration (0.549) Percentage of Staff with Access to GIS (0.419) Staff know where to find data (0.483)
Component 5: Access to State Data Cost of State data is acceptable (0.817) Limitations by state on data is acceptable (0.781)
Component 6: Level of concern on data restrictions
Legal liability limits sharing (0.688) Copyright limits sharing (0.647) Privacy limits sharing (0.832)
Component 7: Standards and Metadata Consider standards in GIS development (0.682) Recording of metadata (0.678)
Component 8: Use of State Data and Restrictions Place Restriction on Use of Data (0.737) Level of Use of State Data (0.731)
Component 9: Organisational Change Level of Staff Turnover (0.822) Level of Organisational Restructuring (0.546) Average Level of Collaboration (-0.442)
Component 10: Staff Growth and Training Trend in staff numbers (0.499) Access to Training (0.795)
Component 11: Business Needs Share data to meet business needs (0.808) Length of time having GIS (-0.582)
Component 12: Policy on External Access to Data
Single metadata repository (0.764) Number of collaborations (-0.429)
Component 13: Length of Collaboration Term of Collaboration (0.859) Note: Variables with factor loadings <0.4 were discarded
The 13 new factor variables were obtained by computing averages from each of the
component variables. The factor loadings represent the strength of the variables
relationship with the other variables. For the purpose of this analysis, variables with an
absolute factor loadings less than 0.4 were discarded (Brace et al. 2006). The final 13
factor components account for approximately 70% of the variability amongst the 36
variables.
6.4.3 Correlation Analysis
The correlations between the 13 identified factor components are shown below in Table
6.5. Although correlation by itself is not proof of causation, it does provide a basis to
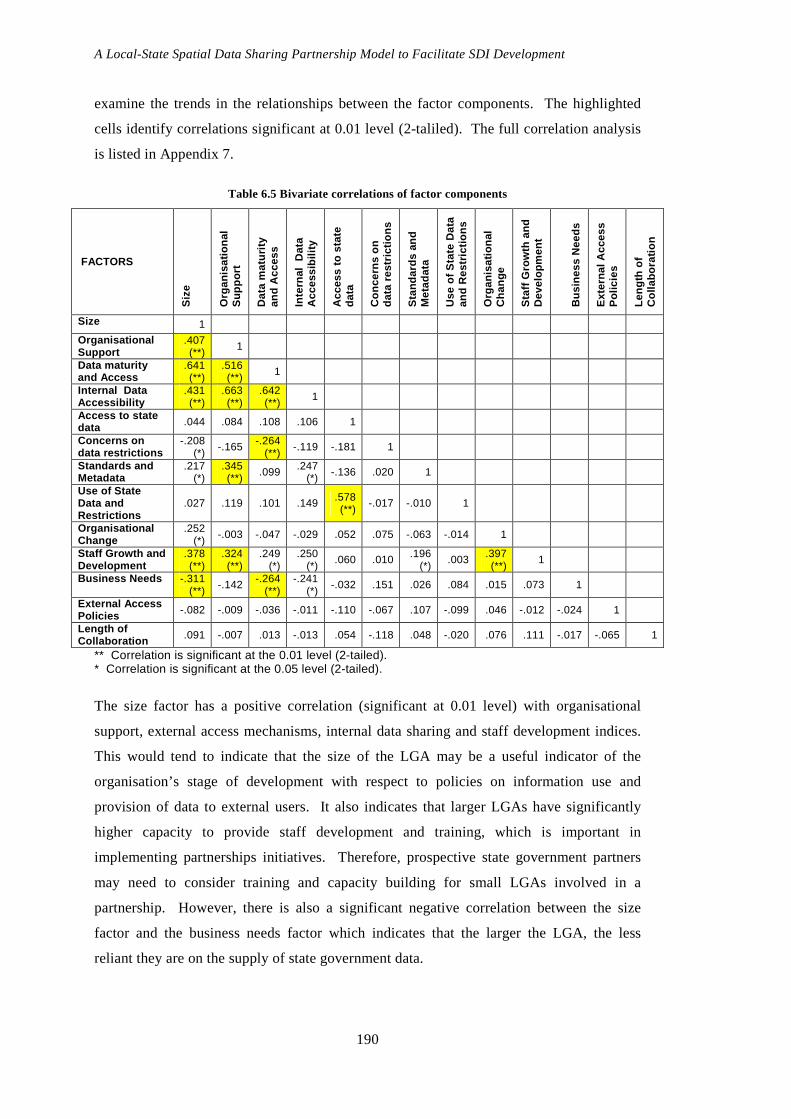
A Local-State Spatial Data Sharing Partnership Model to Facilitate SDI Development
190
examine the trends in the relationships between the factor components. The highlighted
cells identify correlations significant at 0.01 level (2-taliled). The full correlation analysis
is listed in Appendix 7.
Table 6.5 Bivariate correlations of factor components
FACTORS
Siz
e
Org
anis
atio
nal
Sup
port
Dat
a m
atur
ity
and
Acc
ess
Inte
rnal
Dat
a A
cces
sibi
lity
Acc
ess
to s
tate
da
ta
Con
cern
s on
da
ta r
estr
ictio
ns
Sta
ndar
ds a
nd
Met
adat
a
Use
of S
tate
Dat
a an
d R
estr
ictio
ns
Org
anis
atio
nal
Cha
nge
Sta
ff G
row
th a
nd
Dev
elop
men
t
Bus
ines
s N
eeds
Ext
erna
l Acc
ess
Pol
icie
s
Leng
th o
f C
olla
bora
tion
Size 1
Organisational Support
.407 (**)
1
Data maturity and Access
.641 (**)
.516 (**) 1
Internal Data Accessibility
.431 (**)
.663 (**)
.642 (**)
1
Access to state data .044 .084 .108 .106 1
Concerns on data restrictions
-.208 (*)
-.165 -.264 (**)
-.119 -.181 1
Standards and Metadata
.217 (*)
.345 (**) .099 .247
(*) -.136 .020 1
Use of State Data and Restrictions
.027 .119 .101 .149 .578 (**)
-.017 -.010 1
Organisational Change
.252 (*)
-.003 -.047 -.029 .052 .075 -.063 -.014 1
Staff Growth and Development
.378 (**)
.324 (**)
.249 (*)
.250 (*)
.060 .010 .196 (*)
.003 .397 (**)
1
Business Needs -.311 (**)
-.142 -.264 (**)
-.241 (*)
-.032 .151 .026 .084 .015 .073 1
External Access Policies -.082 -.009 -.036 -.011 -.110 -.067 .107 -.099 .046 -.012 -.024 1
Length of Collaboration .091 -.007 .013 -.013 .054 -.118 .048 -.020 .076 .111 -.017 -.065 1
** Correlation is significant at the 0.01 level (2-tailed). * Correlation is significant at the 0.05 level (2-tailed).
The size factor has a positive correlation (significant at 0.01 level) with organisational
support, external access mechanisms, internal data sharing and staff development indices.
This would tend to indicate that the size of the LGA may be a useful indicator of the
organisation’s stage of development with respect to policies on information use and
provision of data to external users. It also indicates that larger LGAs have significantly
higher capacity to provide staff development and training, which is important in
implementing partnerships initiatives. Therefore, prospective state government partners
may need to consider training and capacity building for small LGAs involved in a
partnership. However, there is also a significant negative correlation between the size
factor and the business needs factor which indicates that the larger the LGA, the less
reliant they are on the supply of state government data.

Chapter 6 – Results of Partnership Case Studies at Local Government Level
191
The size factor also illustrated correlations (significant at 0.05 level) with concerns on data
issues (privacy, copyright etc), the value of standards and the degree of organisational
change. These results indicate that larger LGAs have a greater capacity and requirement to
implement policies or procedures on the use and management of data. It is hypothesised
that as the size of the LGA increases, so does the demand by external organisations for
their data. This then requires greater effort by the organisation to improve their data
quality, implement standards to assist in the exchange of data and create information
policies to control its use. The moderate level of correlation between size and the degree
of organisational change is indicative of the continuing level of organisational
restructuring that has been happening at both state and local government levels in the past
5-10 years.
The organisational support factor shows significant positive correlation (0.01 level) with
the data maturity/access, internal sharing, recognition of standards and staff development.
The organisational support factor includes a variety of related variables including ICT
capacity, management support for GIS and the use of spatial information within the
organisation. The correlations illustrate that a supportive organisational environment for
the development of new technologies and systems like GIS, can lead to more mature
systems and improved internal access to information. These findings are supported by a
number of individual LGA comments that suggested that the internal GIS has become
recognised as an important part of the whole ICT strategy of the organisation. It was also
identified that approximately 60% of all GIS units within LGAs now reside within the
corporate services or IT division of LGA, which is another indicator of the growing
corporate utility of spatial information.
The strong correlation between the organisational support factor and internal data sharing
factor indicates that strong organisational support for ICT and GIS encourages the wider
utilisation of information systems, and hence data sharing within the organisation. The
data also suggests that strong organisational support for ICT results in a greater
recognition of the importance of data standards and staff development.
The data accessibility/maturity factor represents the capacity of LGAs to provide external
access to their spatial data and the level of maturity of the spatial data. The correlations
indicate that as LGAs’ spatial information systems develop and mature, spatial information
becomes more widely available both across the organisation and external to the
organisation. The correlation between the data accessibility/maturity factor and the
business needs factor indicates a growing reliance on spatial information for business
purposes. Finally, the strong relationship between the access to state data and the

A Local-State Spatial Data Sharing Partnership Model to Facilitate SDI Development
192
restrictions placed on the data indicates a high awareness of the licensing arrangements
that currently limit the use of state data by LGAs to internal business applications only.
6.4.4 Multiple Regression Analysis
Part 8 of the questionnaire examined a number of outcomes from the partnership initiatives
including the benefits that were derived, the improvements in data quality, frequency of
communication and the overall level of satisfaction. These responses were combined into
a single outcome factor through factor analysis. The final part of this analysis process
explored the relationship between the 13 factor components (predictor variables) and the
outcome component (criteria variable) through the use of multiple regression analysis.
A multiple regression model using the simultaneous technique was applied using the 13
grouped components from the factor analysis as the independent input variables and the
combined outcome factor as the dependent variable. The results of the regression analysis
are detailed in Appendix 8 and summarised in Table 6.6. The analysis yielded a model
that was significant: F(13,88)=4.659, p<0.005, with an Adjusted R2 =0.32, which indicates
that the model has accounted for approximately 32% of the variance in the criterion
variables.
The results of the multiple regression analysis indicate that the factor components have
contributed to the performance and success of data sharing partnerships, although they are
not the only influence on the partnership outcomes. The output from the multiple
regression model provides an indication of the factors which contribute more strongly to
successful partnership outcomes.
The highlighted component factors of organisational support, awareness of state data,
external access policy and the business needs are identified as significant to the partnership
outcomes as shown in Table 6.6. The organisational support factor importantly
encompasses ICT capacity, management support and attitudes to making data and
resources available. This emphasises the importance of assessing a potential partner’s
capacity during partnership development to better understand the ability of the
organisation to contribute to the partnership outcomes.
Policies on access and pricing were again identified as important to the outcome of the
partnerships. Policies at state and local level should be aligned to ensure that there is
minimal conflict. Local government are more likely to follow state government policy
direction due to their limited capacity to resource their own policy development. External

Chapter 6 – Results of Partnership Case Studies at Local Government Level
193
access policies and the use of the internet are identified as important considerations for
partnership development.
Table 6.6 Results of Multiple Regression Modelling
Unstandardised Coefficients
Standardised Coefficients
Model B Std. Error Beta t Sig. (Constant) 2.202 .895 2.461 .016 Size -.015 .076 -.025 -.203 .839 Organisational Support and Attitudes .294 .156 .221 1.883 .063
Data Accessibility/Maturity -.164 .149 -.148 -1.100 .274
Internal Accessibility -.103 .127 -.102 -.811 .420 Access to State Data .372 .115 .343 3.244 .002 Level of concern on data restrictions .110 .089 .111 1.240 .218
Standards and Metadata -.067 .092 -.068 -.726 .470
Use of State Data and Restrictions .104 .114 .095 .914 .363
Organisational Change
-.172 .132 -.128 -1.301 .197
Staff Growth and Training .057 .126 .047 .456 .650
Business Needs .266 .098 .247 2.705 .008 Policy on External Access to Data -.237 .077 -.260 -3.056 .003
1
Length of Collaboration -.036 .041 -.076 -.898 .371
a Dependent Variable: Outcome1
The business needs factor underlines the importance of maintaining a business focus for
the data sharing initiative to be sustainable. If the data sharing initiative is linked to
important business processes, it is more likely to receive priority and be incorporated
within mainstream operations. Wehn de Montalvo (2003b) in her study on the willingness
to share data, found that attitude and social pressure were the strongest determinants of
willingness to share spatial data. In particular, organisational pressure, GIS community
pressure, knowledge creation and social outcomes were identified by as key determinants.
Although this regression analysis examined the factors that contribute to the success of
data sharing outcomes, there are some similarities between the determinants of the
willingness to share and sharing success. In particular, the organisational support and
attitude factor, business needs factor and the policies on external access, often result from
organisational or GIS community pressure to establish an appropriate policy framework
conducive to sharing. The knowledge creation determinant identified by Wehn de
Montalvo may also explain the business need success factor or the need for business
knowledge.

A Local-State Spatial Data Sharing Partnership Model to Facilitate SDI Development
194
6.4.5 Summary of Factor and Regression Analysis
The exploratory factor analysis successfully reduced the number of predictor variables
from 36 to 13 and explained approximately 70% of variation amongst the variables. The
correlation between each of these new factors was examined to further explore their
relationships and possible linkages. Finally, the 13 new computed factors were used as
predictor variables in a regression analysis to determine their contribution to the successful
outcomes from partnerships. The factors in the multiple regression model accounted for
approximately 32% of the contribution towards the partnership satisfaction. Factor groups
such as policy, organisational support, access to state data and business needs were
identified as significant.
6.5 Chapter Summary
This chapter has undertaken a comprehensive analysis of a questionnaire to local
governments which examined their capacity, characteristics and outcomes of the data
sharing partnerships in the states of Queensland, Victoria and Tasmania. A number of
significant trends and differences were identified amongst the variables and across the
three states. The factor and regression analysis has confirmed that the relationship
between the partnership outcomes and the derived factor components is complex. The
institutional and organisational issues were found to dominate.
The next chapter integrates the findings of chapters 5 and 6 to formulate a model for the
development and sustainable operation of data sharing partnerships between local and state
government.

Chapter 7 – Model Development and Discussion
195
7 Chapter 7 Model Development and Discussion
Chapter 7
Model Development and Discussion

A Local-State Spatial Data Sharing Partnership Model to Facilitate SDI Development
196

Chapter 7 – Model Development and Discussion
197
7.1 Introduction The analysis of the state government case studies and the local government surveys were
completed in chapters 5 and 6. The outcomes from these two chapters provide the basis
for an improved understanding of the motivations for establishing the data sharing
partnerships, the differing collaborative processes and the factors that influence the
successful outcomes of the partnerships. This chapter now integrates these findings into a
model which better reflects the data sharing partnership process within a local and state
government context.
In the first part of the chapter, the model development process is discussed, including the
integration strategy and the key findings from chapters 5 and 6. The developed model is
then presented and the individual components of the model are described. Next, the
useability and performance of the model is evaluated through the application of model to
the three case studies. The ability of the model to differentiate between the three
partnerships is assessed and compared to the results from chapters 5 and 6. A critical
appraisal of the model with respect to the various SDI components is then undertaken to
determine the contribution of partnership model to SDI development. Finally, the
application and generalisation of the model to other partnership environments is discussed.
7.2 Model Development
7.2.1 Development Process
The mixed method research approach has enabled three data sharing partnerships to be
investigated across a number of dimensions and at two jurisdictional levels. In addition to
the results from these investigations, the existing theory and knowledge base on
collaboration, data sharing and SDI development has provided a solid foundation on which
to build the model. Figure 7.1 illustrates the process that was used to develop the data
sharing partnership model.
The results of the state government case studies contributed to a clearer understanding of
the institutional issues required to establish and manage the data sharing partnerships. In
multi-jurisdictional data sharing, where a key goal is to build state-wide spatial data sets,
the need for formal, well managed and process driven mechanisms was highlighted during
the research.

A Local-State Spatial Data Sharing Partnership Model to Facilitate SDI Development
198
Figure 7.1 Model development process
The local government survey highlighted the heterogeneous nature of local government, its
capacity limitations and the factors which were important from a LGA perspective. These
findings were integrated with the existing knowledge base on collaboration and data
sharing to compile a model which recognises the nuances of the state-local government
environments.
7.2.2 Integration of Research Outcomes
To assist in the integration of both the qualitative and quantitative research findings an
initial summary of the issues which were identified during the research was compiled (see
Table 7.1). It was found that the relative importance of each issue varied from one
jurisdiction or environment to the next which made the decision on its overall level of
importance difficult to assess. The source of the issue is identified in the table as S- State
Government Case Studies, L- Local Government Questionnaire or Th – Theoretical
Investigation. Many of the issues emerged from multiple sources.
As expected, some issues were not identified by the local government survey as the scope
of the questionnaire was limited to understanding the capacity of local governments across
a number of SDI related dimensions. However, the open ended responses (see appendix 4)
of the questionnaire provided another valuable source of information. Issues or factors
that were identified as being highly significant included defined business needs,
resourcing, organisational support, policies, communication and issues relating to control.
RESULTS OF LOCAL
GOVERNMENT SURVEYS
Organisational Support, ICT
capacity, Skills level,
Communication, Access policies, Business Needs, Trust,
Overall Satisfaction
Chapter 6 Data Sharing
Partnership
Model
EXISTING KNOWLEDGE BASE
on SDI, Collaboration and data
sharing
Chapters 2&3
RESULTS OF STATE GOVERNMENT CASE STUDIES
Goals, Contextual factors, Direction
setting, Policy impacts, Motivations, Resources,
Communication, Leadership, Performance and Management
Chapter 5

Chapter 7 – Model Development and Discussion
199
Table 7.1 Identification of significant issues and their source
Identified Issue or Factor
Source
Comments
Economic Environment
S, Th Some evidence exists that the economic environment and shortage of resources have influenced the development of data sharing partnerships.
Geographical Context S The size of both the state and local government jurisdiction has the potential to impact on the success of the partnership outcomes due to its correlation with both capacity and support.
Political policies S, Th Impact of political policies such as economic reform, outsourcing of services and service delivery filter through all jurisdictional levels
Technical Capacity S, L, Th The technical capacity of each organisation to engage in the sharing of data is important, particularly at local level
Vision S, Th A vision for the future of the data sharing arrangement is important from both partner perspectives
Shared goal S, L, Th The goal of the data sharing arrangement should be clearly defined and shared by both partners
Defined Business Need
S, L, Th The partnership must be able to deliver a clear business benefit to both organisations for it to work effectively
Resourcing S, L, Th Resources are usually a primary motivator for collaboration or partnerships. However, resources must be available from within both organisations to facilitate the partnership operations. Human and technical resources are important.
Leadership S, L, Th Strong leadership is important particularly at the early stages of the development of the partnership. This is primarily at state government level but extends to local governments
Organisational support S, L, Th Important for both state and local government, again particularly at the start of the partnership. Identified in the factor and regression analysis
Governance S, Th This was identified as a factor by state agencies particularly as the partnership processes become more mature
Policy on access and pricing
S, L, Th Access and pricing policies are a significant factor in the development of partnership arrangements
Capacity Building and Training
S, L, Th The issue of training was highlighted as an important part of building skills levels in the partnership process
Standards and Metadata
S, L, Th Considered a lower priority for local governments but critical for state governments who merge data
Project Management S, Th Identified from the case studies at state government level to be a critical factor in ongoing success of partnership
Performance Management
S, Th The outcomes of the partnership should be measurable and meet the initial goals and objectives
Communication S, L, Th Communication is seen as critical to all areas of collaboration and data sharing
Measurable outcomes S, L, Th The outcomes from the data sharing partnership should be aligned with the initial goals including benefits for each partner and wider community benefits
Defined responsibilities and custodianship
S, L, Th Each partner’s responsibilities need to be clearly defined during both the development and partnership process
Legal environment S, L, Th The legal framework for establishing and maintaining the partnership agreements is often substantial and a simplified approach is better. Overarching legislation may provide a supportive framework.
Control Issues S, L, Th Loss of control is often an issue in sharing of data or resources. As the understanding of the benefits to business become clearer these issues become less important
Exchange mechanism S, L, Th An efficient exchange mechanism is required to ensure that the exchange process is not too onerous
Trust S, L, Th All sources of research identified the need for trust Negotiation S, Th The negotiation process for partnership development is critical but
often time consuming. The development of an effective negotiation process will be required at the early stages of development
Note: S- State, L – Local, Th –Theory

A Local-State Spatial Data Sharing Partnership Model to Facilitate SDI Development
200
To assist in the development of the model the identified issues were classified into four
areas namely jurisdictional environment, institutional environment, collaborative process
and outcomes. The importance of the contextual factors in the collaboration i.e.
jurisdictional and institutional environments, have been identified by a number of authors
(Alter & Hage 1993; Gray 1985; Mulford & Rogers 1982; Nedovic-Budic & Pinto 1999;
Pfeffer & Salancik 1978; Pinto & Onsrud 1995; Prefontaine et al. 2003). The findings from
chapter 5 also support the inclusion of jurisdictional and institutional environments in the
model.
The collaborative process has been identified as a core element of the model. This is also
well supported by literature (Bergquist et al. 1995; Child & Faulkner 1998; Child et al.
2005; Gerdes 2003; Kevany 1995; Lank 2006; Nedovic-Budic & Pinto 1999) and the
findings of chapters 5 and 6. The case studies in Chapter 5 identified the issues of shared
goals, defined business needs, resourcing, leadership, policy, governance, training, project
management, performance management, standards, negotiations and exchange
mechanisms. The LGA survey results confirm these factors and also highlight trust,
technical capacity, responsibilities, communication, policies, resourcing, organisational
support, training and exchange mechanisms. Finally, the outcomes from data sharing are
important in measuring the progress of the initiative and are now a critical factor in
determining ongoing funding and hence the sustainability of the collaboration.
Economic Environment
Geographical Context
Political Policy
Social Context
Legislative Framework
Economic Environment
Technical Capacity
Vision
Shared Goals
Defined Business Needs
Leadership
Policies on access and pricing
Training
Standards and Metadata
Communication
Legal environment
Resourcing
Control issues
Governance
Shared Goals
Defined Business Needs
Resourcing
Leadership
Organisational Support
Policies on access and pricing
Governance
Training
Standards and Metadata
Communication
Project Management
Performance Management
Defined Responsibilities
Legal environment
Control issues
Trust
Exchange Mechanisms
Negotiation
Technical Capacity
Measurable Outcomes
Jurisdictional
EnvironmentOutcomes
Collaborative
Process
Institutional
Environment
Figure 7.2 Classification of issues
The grouping of the factors within these classifications is shown in Figure 7.2. It can be
seen that a number of issues such as communication and legal environment have been
identified to occur across multiple areas. Other issues such as project and performance
management appear to be much more important to the collaborative process.

Chapter 7 – Model Development and Discussion
201
7.3 The Data Sharing Partnership Model The grouping of the issues and factors in Figure 7.2 provided the basis to formulate a
generic model. The spatial data sharing partnership model is illustrated in Figure 7.3 and
consists of three key model components namely:
1. Contextual Factors – Jurisdictional and Institutional environments;
2. Collaborative Process; and
3. Outcomes.
Jurisdictional
EnvironmentPolitical, Economic, Social,
Environmental, Geographical
and Legal
Institutional
EnvironmentBusiness needs, Policy,
Legal, Resources, Goals,
Leadership, communication,
ICT, Standards, people
Partnership
Sustainability
Community Access
Authoritative Databases
Improved Decision
Making
DATA SHARING PARTNERSHIP MODEL
Dynamic
Partnership
Strategy and
Formulation
Partnership
Management
Governance
Arrangements
Performance
Monitoring
Business Rules
and
Responsibilities
Data
Exchange and
Maintenance
Collaborative Design
Influenced by Contextual
Factors
Leadership,
Shared Goals,
Negotiation
Stakeholders,
policy,
strategies
Project
management,
Administration,
communication
Defined measures
Monitoring
ICT/Technology
Operation and
Maintenance
Rules and Protocols
Standards
Facilitate SDI
Development
Figure 7.3 Spatial data sharing partnership model
Both the jurisdictional and institutional environments have been identified throughout the
research as having a measurable impact on collaboration and the initiation of collaborative

A Local-State Spatial Data Sharing Partnership Model to Facilitate SDI Development
202
activities. The Tasmanian case study provided a good example of a jurisdiction that
encouraged and promoted collaborative activities to improve the delivery of government
services. The model illustrates how the institutional or organisational environment
interacts with the wider jurisdictional environment. This component of the model is
discussed in detail in 7.3.1.
The collaborative process component consists of six main elements namely: partnership
strategy and formulation, governance partnership management, business rules and
responsibilities, data exchange and maintenance, and performance monitoring. This
component of the model is discussed in detail in 7.3.2.
The outcomes component is an important measure of the effectiveness of the partnership
and facilitates a number of outcomes including SDI development. Each of these
components is important and must interact with other components for the partnership to
operate effectively. The details of each of these components are now discussed. This
component of the model is discussed in detail in 7.3.3.
7.3.1 Contextual Factors
Institutional and Jurisdictional Relationship
Developing an understanding of the relationship between the jurisdictional and the
institutional environments can assist in the partnership development process. Figure 7.4
illustrates this relationship graphically by showing how the model interfaces dynamically
at both an institutional and a jurisdictional level. The jurisdictional environment reflects
the economic, social and environmental policies of the ruling government. Political
environments are dynamic and the policies developed impact on individual agencies or
departments in terms of resources, legal framework and mission.
Jurisdictional
EnvironmentPolitical, Economic, Social,
Environmental, Geographical
and Legal
Institutional
EnvironmentBusiness needs, Policy,
Legal, Resources, Goals,
Leadership, communication,
ICT, Standards, people
Dynamic
Figure 7.4 Jurisdictional and institutional relationships
Partnerships may be promoted at a relatively high political level, but eventually operate
within an institutional or organisational framework. Therefore, government agencies are
influenced by the current political policies which are operationalised through
organisational policies in line with the agency’s core function and mission. Often
government policy and the agency’s mission conflict, as politicians attempt to implement

Chapter 7 – Model Development and Discussion
203
new initiatives which may be incompatible with the agency’s administrative
responsibilities. Therefore, it is essential to understand these environments when
developing the initial partnership strategy and to limit the impact of sudden political
change.
Jurisdictional Environment
The prevailing jurisdictional environment can impact on the development of collaborative
initiatives both positively and negatively in nature. It has been clearly demonstrated by a
range of authors (Child et al. 2005; Gray 1985; Mulford & Rogers 1982) that resource
scarcity and turbulent environments often result in the initiation of co-operative activities.
The overarching jurisdictional or political environment, including the economic, social,
legal, environmental and geographical contexts, can result in policies which influence
collaboration either across agencies within a jurisdiction or in the case of this research
between different levels of government.
The prevailing economic situation impacts on government budgets and priorities. Budgets
and priorities affect public sector staffing levels and the ability of government to support
the development and maintenance of physical and information infrastructures. The
legislative framework can facilitate the processes of collaboration between two
jurisdictional levels through appropriate legislative reforms. For example, in Australia,
local government authorities are established under State Government legislation, much of
which was enacted during the middle of last century. At this time the process of
information exchange was not envisaged, so this legislative framework may require
modification to account for the new ICT environment. New legislation could compel local
government to exchange information and hence empower and legitimise the data sharing.
This framework would then simplify the drafting of formal partnership agreements through
reference to this legislation. However, care should be exercised in the use of such
legislative dictates.
To achieve the social and environmental goals of government, jurisdictions often
implement policies which encourage collaborative initiatives. A good example is
catchment management partnerships which are formed between government, private
industry and local communities to facilitate sustainable catchment management. These
partnerships involve cooperation of government agencies which provide funding and
policy guidance, and local community participants, who initiate and undertake catchment
management activities. Similarly, social strategies to improve the delivery of services
such as health and education often require a collaborative multi-agency approach to deliver

A Local-State Spatial Data Sharing Partnership Model to Facilitate SDI Development
204
improved outcomes at the local level. Spatial information is proving to be a valuable tool
to support the management and decision making for the delivery of social services.
Finally, the geographical context was identified as being an important characteristic at both
jurisdictional and institutional levels. The local government questionnaires identified that
LGA organisational size and geographical remoteness were closely related to ICT capacity
and hence the ability of the organisation to participate within the data sharing partnerships.
The analysis found that the larger LGA organisations (usually urban LGAs) typically had
greater ICT capacity, whilst the smaller sized LGA organisations (usually rural LGAs) had
limited ICT capacity, which was often further exacerbated by their remoteness.
Institutional Environment
The research found that institutional or organisational factors appear to be the most
prevalent issues arising from previous literature, the case studies within state government
and the LGA surveys. Just as the jurisdictional environment influences the institutional
environment, institutional factors can have a significant influence in shaping the
collaborative strategies which support spatial data sharing environments.
Policy development within a government agency is closely aligned to its higher level
jurisdictional policies. However, the leadership and vision shown at an organisational
level are critical in shaping partnership strategies and policy development. The support of
management influences the provision of resources, communication efforts between
organisations, ICT priorities and the degree of formality for engaging with external
organisations. The awareness by the organisation of their responsibilities to the
community and other government agencies can influence attitudes to participate beyond
their immediate environment. Loss of control or power has been identified in many areas
of literature as a common issue associated with inter-organisational collaboration and
efforts need to be taken to minimise the risk to partnerships due to control issues.
Importantly, the research identified that each of the partner organisations must attempt to
align their organisational business needs with the goal of the partnership. It is of little
value to have a partnership arrangement that does not serve the needs of both organisations
or a wider community obligation. The challenge with state-local government partnerships
is that a single state government agency could be dealing with hundreds of potential
partners. The governance arrangements in this situation are particularly important and
provide a forum for negotiating common goals, performance measures and future
strategies.

Chapter 7 – Model Development and Discussion
205
Through the institutional alignment of the various components of the model the
development of the SDI is also facilitated. SDI development relies on the building of
partnerships for data sharing which contributes to the broader government and community
objectives of sustainable development through improved economic management, more
effective delivery of social services and the responsible management of our environment
and natural resources.
7.3.2 The Collaborative Process
The six key elements of the collaborative process component are now discussed.
Partnership Strategy and Formulation
This component of the partnership model reflects the early
stages of the partnership building process including its
direction setting and establishment. The partnership
strategy and formulation process requires an appropriate
level of research on the partners, an assessment of the risk,
development of initial communication networks and the
adoption of an appropriate engagement strategy. The state
government case studies found that the early stages of
partnership development are resource intensive, so access to
appropriate funding is critical.
The research identified that prior to establishing the
partnership it was important to research the capacity of
potential partners in the collaboration. Only one of the state
agencies investigated demonstrated that they had undertaken any significant level of
research in this regard. Risk assessment is now a common business process which is
undertaken to identify any unexpected situations or outcomes that may not have been
initially anticipated.
Inevitably, this component involves a period of negotiation which can often take a number
of years to complete, as identified in the partnerships investigated. Development of good
communication networks at an early stage in the formulation of the partnership is critical
to these negotiations. The negotiations usually eventuate in contractual arrangements
which specify the responsibilities of both partners. Where possible these contracts should
be flexible enough to accommodate small variations, have the ability for extension for
further periods and include the facility to expand the arrangements to cover future areas of
Partnership Strategy and Formulation
LeadershipPartnership Research
Communication NetworksRisk Assessment
Funding Capacity Building
Shared GoalsNegotiation
Agreement Development
Partnership Strategy and Formulation
Partnership Management
Governance
Performance Monitoring
Business Rules and
Responsibilities
Data Exchange and Maintenance

A Local-State Spatial Data Sharing Partnership Model to Facilitate SDI Development
206
collaboration. The strategy for engagement with the partners should be based on shared
goals and aligned to each organisation’s business needs.
Governance
The research identified that with formal state-wide data
sharing partnerships, policy changes and decision making
in the partnership must be transparent and supported by the
stakeholders. Good governance is now recognised as being
an important component of collaborative efforts, and
therefore it is essential that any formalised data sharing
partnership model have an appropriate governance
structure. The governance model should not only represent
the interests of state and local governments, but also the
interests of existing users and the private sector where
appropriate. The role of the governance body may include
the monitoring of the progress of the data sharing
partnership, development of appropriate policies to
facilitate the data sharing arrangements and identifying
strategic directions for future partnership initiatives.
The spatial information policies on access and pricing of information were identified in
chapters 5 and 6 as critical to the development of a spatial data sharing partnership. The
Queensland case study illustrated that if the policies for accessing and pricing of the
information are not appropriately aligned with the objectives of the data sharing
partnership, they will have a negative impact on partnership participation. Pricing of
information should be balanced with the need to sustain the infrastructure and the
obligations to make information available across government and the community.
Increasingly, spatial information is being viewed by both state and local governments as
simply another form of business information, albeit an important one. To this end the
policy development with respect to spatial information should be closely aligned with
wider ICT policies on information management and use. It was shown in chapter 6 that
leadership in state government policy development has a close relationship with spatial
information policy development at the local level.
Governance
Stakeholder representationPolicy development
Partnership monitoringStrategic directions
Partnership Strategy and Formulation
Partnership Management
Governance
Performance Monitoring
Business Rules and
Responsibilities
Data Exchange and Maintenance

Chapter 7 – Model Development and Discussion
207
Partnership Management
Partnership management plays a critical role in the day to day
operation and administration of a comprehensive data sharing
partnership. Often the size of a partnership requires a team of
people to undertake activities including project management,
allocation of resources, administration of partnership
agreements and communication within the partnership group.
The administration procedures of formal partnership
agreements often necessitate on-going negotiation,
additions to agreed responsibilities, periodic renewal or
the complete redevelopment of an agreement. An
appropriate communication strategy must be developed to
ensure that communication between the partners is both
efficient and effective.
It was evident in the Victorian case study that the use of liaison staff was an effective
strategy for breaking down the institutional and jurisdictional barriers, particularly if
deployed on a regional basis. Resourcing of the partnership and its long term
sustainability depend on moving the partnership from a project funded basis to a core
institutional process supported by both jurisdictions. Another important consideration with
the management of the partnership is the geographical challenges which exist across
Australia. With high population concentrations on the coastline and relatively few people
and services in the rural areas, efforts need to be directed to improve the ICT infrastructure
to minimise the disadvantage of geographical remoteness.
Business Rules and Responsibilities
Clear business rules for the data sharing partnership
should be defined after discussions with all partners.
The business rules and responsibilities are often
dynamic and emerge over time, but should identify the
custodianship arrangements for the data being
exchanged and any new data sets that may be
developed as a result of the collaboration. The research
found that some of the partnerships investigated
initially had vague or informally established business rules. As the partnerships
progressed these rules were not revisited and therefore became a point of dispute,
particularly as the responsibilities changed.
Partnership Strategy and Formulation
Partnership Management
Governance
Performance Monitoring
Business Rules and
Responsibilities
Data Exchange and Maintenance
Partnership Strategy and Formulation
Partnership Management
Governance
Performance Monitoring
Business Rules and
Responsibilities
Data Exchange and Maintenance
Partnership Management
Project ManagementResource Allocation
Partnership AdministrationCommunication Strategy
Geographical Context

A Local-State Spatial Data Sharing Partnership Model to Facilitate SDI Development
208
Defining the rules and protocols for communication can greatly improve the efficiency and
effectiveness of partnership communication. Other rules may include the definition of
exchange standards, frequency of the exchange and the expected deliverables from each
partner. The definition of appropriate standards is critical to large
formalised data sharing initiatives. In the Victorian case study,
there were 79 local governments with eight different property
systems and five different GISs. Without a clear exchange
standard, the potential for data errors during exchange is high.
Responsibilities for resourcing of the sharing arrangements must
be clearly defined to reduce the likelihood of disputes over resources contributed by each
of the partnership members.
Data Exchange and Maintenance
The data exchange and
maintenance process often
becomes the focus of data
sharing initiatives. The research
identified that the initiation of a
new data sharing arrangement
within local government often
necessitates building the capacity of the LGA or the individual staff. Until automated
procedures can be established, the early stages of any operational processes require
constant communication and effort. As the data sharing matures the process moves into a
stage of ongoing operation and maintenance where defined procedures and processes
become the norm.
A common misconception with the data exchange process is that the effort and funding
requirements diminish once these procedures have been established. In all three case
studies this was not the case. Although the degree of automation has improved along with
the completeness and quality of data, continuing changes in application software and
heightened exchange expectations often required resources to be expanded.
Interoperability and automation to improve the currency, efficiency and accuracy of the
data exchange should be a goal for any systemised data sharing initiative. An e-business
model which more clearly quantifies the inputs from each partner may also improve the
auditing and performance assessment of the exchange process. These exchange processes
are dynamic, so constant technological change requires constant monitoring and review of
processes to continually improve their effectiveness.
Business Rules and Responsibilities
CustodianshipCommunications Protocols
Exchange periodsDeliverables
Exchange Standards
Data Exchange and Maintenance
ICT and TechnologyOperation and Maintenance
Review and ImproveInteroperability
Partnership Strategy and Formulation
Partnership Management
Governance
Performance Monitoring
Business Rules and
Responsibilities
Data Exchange and Maintenance

Chapter 7 – Model Development and Discussion
209
Performance Monitoring
Although the literature on partnerships and collaboration identified the importance of
project management, there was relatively little discussion on monitoring the performance
of partnerships. Performance monitoring has now become commonplace in many areas of
business as managers seek to improve their business
outcomes. However, in data sharing arrangements the
concept of measuring progress was usually seen as a low
priority. However, the research observed that performance
monitoring and accountability has become important to the
resourcing and sustainability of the partnership efforts.
The key to this component lies in the ability to establish
a range of performance measures during the early
stages of the partnership, and then to implement regular
monitoring procedures. Performance measures may
include data quality, data matching, data completeness,
time taken to update data and critical incident reports.
This information allows the overall partnership
performance to be assessed and improvements made to
increase efficiency or effectiveness. The results of the performance monitoring should
feed back into most components of the partnership, but in particular, the project
management and governance components.
7.3.3 Outcomes Component
The outcomes component of the model (Figure 7.5) provides a mechanism by which to
assess the effectiveness of both the institutional and jurisdictional environments. The
difficulty that often faces data sharing initiatives is that they produce outcomes such as
integrated databases or more complete data sets whose value or benefit may not be
immediately obvious.
Figure 7.5 Outcomes component of model
Performance Monitoring
Definition of MeasuresMonitoring
Continuous Improvement
Partnership Strategy and Formulation
Partnership Management
Governance
Performance Monitoring
Business Rules and
Responsibilities
Data Exchange and Maintenance

A Local-State Spatial Data Sharing Partnership Model to Facilitate SDI Development
210
Therefore, it is important that the outcomes of the data sharing partnership be defined in
terms of measurable benefits to the organisations, business and the community. One of the
important aspects of this research was to identify the relationship of data sharing
partnerships to SDI development. Although SDI development is not the only outcome of
the spatial data sharing partnerships, it is one that has a long lasting and multiplying
impact through the continued re-use of the information infrastructure.
7.4 Model Application and Evaluation
7.4.1 Evaluation Methodology
In order to evaluate the potential of the model it was decided to test the application of the
model using the three case studies. The primary advantage of testing the model against the
three case studies was that detailed empirical evidence was already available on each of
the partnerships. The evaluation process consisted of assessing the impact of each
component of the model for the three case studies. Rather than assessing the impact of
each partnership using an arbitrary point scale, the methodology chosen was to simply
assess each model sub-component as making a positive contribution (+), negligible
contribution (o) or a negative contribution (-) to the partnership outcomes.
This assessment process was considered to be objective as the judgements on the positive
or negative contributions were supported by both quantitative and qualitative evidence
from the case studies and survey. In addition, it was decided that the cumulative effect of
these individual assessment of the sub-components minimised the impact of any subjective
judgement.
7.4.2 Assessment of Contextual Factors
The jurisdictional and institutional environments can have a significant impact on the
establishment and sustainability of collaborative initiatives. Most commonly local-state
government partnerships are established by a single state government agency directly with
one or more local governments. The institutional arrangements within that state or local
government agency will often have a direct influence on the policies and operations of the
partnership. To a lesser extent the political or jurisdictional environment will have an
influence on the institutional or organisational policies and operations. Although many of
these impacts are implicitly recognised by those individuals or groups who are forming the
partnerships, it is often helpful to understand the potential of these impacts prior to
development of a partnership model. A summary of the impact of the jurisdictional and
institutional environments is given in Table 7.2.

Chapter 7 – Model Development and Discussion
211
Table 7.2 Impact of institutional and jurisdictional environments on data sharing partnerships
Victoria Tasmania Queensland Environment Component State
Impact Local
Impact State
Impact Local
Impact State
Impact Local
Impact
Jurisdictional Environment - Political Environment + o + + o o - Economic Environment + + + + o o - Environmental Priorities o + + + o + - Social Priorities + o + o + + - Legal Framework o o o o o o - Geographical Context o + + + - - Sub Total 3+ 3+ 5+ 4+ 0 1+
Institutional Environment - Communication o + o o o o - SI Policy + + + + - - - Business Needs + + + + o + - Resources o + + o o + - Shared Goals + + + + - - - Agency vision/mission + + + o o o - Leadership + o + o - o - Technology/ICT o + + o o o - Loss of Control o - - o - - Sub Total 5+ 6+ 6+ 3+ 4- 1-
Overall Totals 8+ 9+ 11+ 7+ 4- 0
Jurisdictional Environment Evaluation
As shown in Table 7.2, the jurisdictional environments in all three states were considered
to be either neutral or positive towards establishing the partnerships. Tasmania was
considered to be the state jurisdiction with the greatest positive tendencies towards
collaboration due to a range of factors. Like the State of Victoria, Tasmania was under
considerable economic difficulty in the mid 1990s, with a declining population, high
unemployment and low business confidence. Therefore, it was a prime candidate for
reforms to improve efficiencies and service delivery. The LIST project was put forward
by the state government agency DPIWE, in response to a request from government for
projects to deliver improved efficiency and encourage business activity. Tasmania is a
state which now relies on tourism and its natural environment for a considerable
component of its economy. Spatial information has assisted the government in
environmental management and decision-making, hence the LIST project has had a
positive influence in this area. The relatively small geographical areas of Tasmania and
Victoria were also seen as a positive influence on collaboration, in contrast to the
geographically diverse and remote LGAs of Queensland which made communication
difficult.

A Local-State Spatial Data Sharing Partnership Model to Facilitate SDI Development
212
Institutional Environment Evaluation
The cumulative impacts of the institutional environments of both state and local level in
Victoria (5+ and 6+) and Tasmania (6+ and 3+) were identified as being more conducive
to establishing partnerships (see Table 7.2). Specifically, leadership at the state
government level and the subsequent development of policies which encouraged the
sharing of information were considered to be critical. Through leadership, the partnership
projects emerged with a clear vision for the future and shared goals. In Queensland, the
data sharing program suffered from the lack of an identifiable leader or clear goals.
Support for the project has waned and has resulted in poor funding and limited project
progress.
One of the important findings identified during the research was the trend for policy
developments at a state government level to flow through to the lower jurisdictional level.
Although the data from the local government surveys was not conclusive, evidence
indicates that local governments with a limited capacity to develop their own policies, will
tend to copy or adapt existing state policy on pricing and access to data. This trend is also
visible at the national and state levels of government with the adoption of national
government policies by state agencies, particularly if they are seen as positive initiatives.
The correlation between the state and local policies was evident in each of the three case
studies, but perhaps most pronounced in Queensland where a more restrictive policy stance
on data access and pricing by the state government was mimicked by a number of LGAs.
Greater accountability of government organisations has resulted in the introduction of
business management principles, including a focus on service delivery and core business
responsibilities. These trends are not only evident in Australia, but can be seen globally as
privatisation of government infrastructure and entities is undertaken to improve efficiency,
save costs or to generate income. Collaborative initiatives undertaken by both state and
local agencies must now show that these initiatives are a core component of their agency’s
business and also justify their development. Therefore, the alignment of business
processes is not only a strong driver of partnership formation, but also a necessary ongoing
requirement for success. The evidence suggests that the relatively poor alignment of
business processes in Queensland has contributed to the mediocre performance of that
partnership.
7.4.3 Assessment of the Collaborative Process Compo nent
The results of the assessment of the collaborative process are shown in Table 7.3. In the
sub-component of partnership management, the Victorian PIP partnership was identified as

Chapter 7 – Model Development and Discussion
213
having the highest positive contribution. It had the highest number of staff associated with
the management of the project and multiple communication strategies for managing the
partnership. The PIP had a defined stakeholder manager whose specific task was to
manage the partnership operations. In both Queensland and Tasmania, this sub-component
was identified as an area for possible improvement.
The partnership strategy and formulation sub-component had a very positive impact on the
partnership outcome in both Tasmania and Victoria. Both states had put in place the
building blocks for a successful partnership strategy and had clear goals and strong
leadership. The Queensland partnership has struggled from the outset from a lack of
funding, poor goal alignment and limited leadership.
For the data exchange and maintenance sub-component, each of the state case studies was
assessed as contributing positively to the initiative. However, this partnership component
across all three states has significant potential for improvement through better use of
technology and greater system interoperability.
With respect to the business rules and responsibilities sub-component, all three state
initiatives had attempted to define the roles and responsibilities of each partner, primarily
through the partnership agreement. Overall, each state has made a positive contribution to
the partnership outcomes in this area, although improvements could be made in
communication protocols and exchange standards.
The components of governance and performance monitoring are highlighted as areas
which are not well evidenced in the Tasmanian or Queensland partnership arrangements.
The Victorian PIP has only begun to address the performance issues in recent years and the
review of the project in 2005 has confirmed that the importance of this sub-component to
sustain the initiative. It is therefore not surprising that most of the state government
agencies are currently reviewing their partnerships to improve some of these components.
Tasmania was judged to be the most advanced with respect to governance arrangements,
whilst Victoria has made significant progress in recent years.

A Local-State Spatial Data Sharing Partnership Model to Facilitate SDI Development
214
Table 7.3 Assessment of the collaborative process component
Model Component
Victoria
Tasmania
Queensland
Partnership Management - Project Management + + - - Resourcing + + o - Administration + o o - Geographical context o + - - Communication Strategy + o - Partnership Strategy and Formulation
- Leadership + + - - Research + o o - Shared Goals + o - - Communication Networks + o - - Risk Assessment o o o - Negotiation Strategy + + o - Formal Agreements + + - - Funding and Capacity Building
+ + o
Data Exchange and Maintenance
- ICT and Technology + + + - Operation and Maintenance + + o - Review and Improve + o - - Interoperability o o o Business Rules and Responsibilities
- Custodianship arrangements + + o - Communication protocols + o - - Exchange frequency + o o - Deliverables + + o - Exchange Standards + + + Performance Monitoring - Performance measures + o o - Monitoring Processes + o o - Continuous Improvement + o o Governance - Stakeholder representation + + o - Policy development o + o - Monitoring + o - - Strategic direction o + o
Totals 24+ 15+ 8-
This preliminary evaluation supports the findings from the LGA survey and the qualitative
case studies which identified that the Victorian and Tasmanian approaches to their
partnership formation and operation have generally delivered more satisfactory outcomes
than the Queensland partnership. However, the complexity of the Queensland situation
including the challenging geographical diversity and remoteness of LGAs, make it difficult
to attribute the level of satisfaction solely to the collaborative process.

Chapter 7 – Model Development and Discussion
215
7.4.4 Assessment of the Outcome Component
The assessment of the outcomes of each partnership are summarised in Table 7.4 and
provide a snapshot of the achievements for each state initiative.
Table 7.4 Assessment of partnership outcomes in each state
Outcome Indicator Victoria Tasmania Queensland
Digital Mapbase A combined digital mapbase which now covers most of the state (+)
Improved management of the digital mapbase and upgrade in accuracy through less duplication (o)
Some improvement in the mapbase but not a direct outcome of the partnership (o)
Authoritative Dataset An authoritative address database that is serving government agencies including emergency services (+)
A “whole of Government” approach to data sharing and not just between state and local government (+)
Progressive improvements in creating a state-wide address and property file, but further efforts required (o)
Web Portal A web portal that provides basic property information to the community and industry (+)
An exemplary web portal for property and spatial information (+)
No public portal at this stage but under development (-)
SDI Development A major contribution to SDI development in the state and a capstone project (+)
Significant contribution to the state and local SDI development (+)
Limited contribution at this stage (-)
Governmental Relations
Improved intergovernmental relations (+)
Improved intergovernmental relations (+)
Improved intergovernmental relations now occurring (+)
As can be seen in Table 7.4 the partnership initiatives have delivered a number of
significant outcomes which are generally in agreement with the assessments across the
other two components. Again Victoria (5+) and Tasmania (4+) have delivered
significantly more positive outcomes than the Queensland partnership (1-). The potential
impact on SDI development will be examined in more detail in the following section.
7.4.5 Overall Summary of Assessment
A summary of the overall evaluation of the three case studies is given in Table 7.5.
Table 7.5 Overall assessment of partnerships
Model Component Victoria Tasmania Queensland
Institutional and Jurisdiction Environments
Positive Most positive Generally neutral
Collaborative Process Most positive Positive Negative
Outcomes Most positive Most positive Generally neutral
The data sharing partnerships in the states of Victoria and Tasmania have been identified
through the evaluation process as strongly positive across the three dimensions of the
model. These findings are in agreement and supported by the qualitative assessments

A Local-State Spatial Data Sharing Partnership Model to Facilitate SDI Development
216
made in chapter 5 and the quantitative measures from chapter 6. The Queensland data
sharing partnership has delivered very limited outcomes. The institutional environment
and the collaborative mechanisms were assessed as having the greatest negative impact on
the data sharing partnership.
7.5 Potential Impact on SDI Development Apart from the key objective of satisfying an important business function, data sharing
partnerships contribute to the broader vision of developing an effective spatial data
infrastructure (SDI). Although the major function of the model is to facilitate the
exchange of data, it is expected that the model will facilitate SDI development and
strategies. To explore the potential impacts and inter-relationships of the proposed model
to SDI development, the contribution of the partnership model to each of the SDI
components is examined.
SDI Component – Data
There is an obvious alignment between SDI Data component and the outcomes that are generated through the data sharing partnership model. The data exchange processes facilitate the process of data quality checking, data standardisation and may result in a single authoritative source of information. This single authoritative data set reduces duplication of effort across government jurisdictions and will improve the service delivery.
Without the data sharing model described, SDI development will continue to emerge as a series of silo development approaches which has substantial long term cost and efficiency implications.
SDI Component – People
People impact on all aspects of the partnership model as every component requires human resources to operate. The important aspect with respect to people is their skills and capabilities. Leadership in the partnership strategy and formulation is critical and it would be expected that these attributes should also be present in the broader jurisdictional SDI development efforts. A variety of skills is required within the partnership processes including communication skills, data base managers, analysts, project managers and administrative staff. Partnership efforts contribute strongly to capacity building and awareness of SDI strategies which are important to understanding the broader SDI vision.

Chapter 7 – Model Development and Discussion
217
SDI Component – Standards
People Data
Access
Networks
Standards
Policy
Standards are an important component of any data sharing arrangement, particularly if the data sharing is to become systemised and include a large number of multiple partners. The model sub-component of business rules and responsibilities identifies appropriate standards for compliance to state or national standards for data exchange. The value of metadata standards was highlighted in the case studies, particularly its role in facilitating data discovery and improving data quality.
The very process of exchanging and sharing data encourages the use of a standardised approach. The move towards interoperability is further hastened by continuous and prolonged data exchange and sharing. The model contributes to greater use and adoption of standards as advocated by SDI policy.
SDI Component – Access and Technology
Access procedures are not necessarily part of a data sharing partnership, however, the partnership will facilitate the provision of data through jurisdictional SDI developments. Appropriate technology and ICT infrastructure for the data sharing can equally support access arrangements.
Two of the three state governments had established web portals as a result of their spatial data sharing initiatives. The partnership outcomes of delivering data and the need to provide access back to local governments and other agencies has been a positive driver to develop the web portals.
SDI Component – Policy and Institutional Arrangements
Policy and institutional arrangements are a critical component of the model and will be both influenced by, and impact on, SDI development. Initial partnership strategies need to have a strong policy and institutional focus in the early negotiations. During partnership formation formal policies must be developed as part of the governance arrangements or preferably adopt the broader jurisdictional SDI policies if they are suitable. The business rules and responsibilities component identified institutional and custodianship responsibilities which should comply with existing SDI protocols.
The partnership model assists SDI policy development by identifying where weaknesses exist and where further policy efforts need to be focussed. The partnership rules also facilitate the propagation of SDI policy across jurisdictions.
As can be seen from the discussion above, the partnership model contributes significantly
to SDI development. This supports the underlying premise that either SDI models should

A Local-State Spatial Data Sharing Partnership Model to Facilitate SDI Development
218
include data sharing partnerships or SDI development should be supported by data sharing
partnerships. So, are partnerships driving SDI development or is SDI development driving
partnerships? This research supports the notion that spatial data sharing partnerships are
primarily driven by business needs, and in doing so, they support SDI initiatives. National
SDI policy frameworks and standards play a guiding role in SDI development, but it is the
sub-national efforts, particularly through partnerships, that will continue to progress SDI
development.
7.6 Generalisation of the Partnership Model The data sharing partnership model was designed with the coordinated and systematic
sharing of spatial data between state and local governments as its primary goal. However,
many of the principles in the development of the partnership model can be applied to other
jurisdictional levels such as state/federal jurisdictions, within individual jurisdictions, and
between governments and the private sector. Some of these possible applications of the
model are now discussed.
7.6.1 Application to State-Federal Data Sharing Par tnerships
The key to the success of the local-state government partnerships in the three states
investigated was an underlying business need for the information being exchanged. The
common theme of the partnerships investigated was the sharing of property related
information, which is a core business activity at both state and local levels. Therefore, the
application of the model for state-federal partnerships should also have a common business
need as the basis for the engagement. An understanding of the state-national jurisdictional
environments will be important, particularly the ability to link the data sharing partnership
to an appropriate federal sponsor and align it to current policy initiatives.
In Australia, state and federal governments co-operate within a number of portfolios,
including security, law enforcement, community services, land management, health,
resource management and taxation. A good example of a suitable data sharing partnership
would be the establishment of a national strategy to monitor and manage water distribution
and rights across Australia. In Australia, the state governments manage the rights
associated with water, however the federal government has identified the potential for
improved efficiencies by having a national approach to water management. The
developed model would be equally applicable to state-federal government partnerships
subject to a change in emphasis on the different model components.
Perhaps the greatest emphasis in the example given should be placed on the components of
Governance, Partnership Strategy and Formulation and Partnership Management. The

Chapter 7 – Model Development and Discussion
219
development of a shared goal and vision would be critical to the early stage development
of such a partnership. As identified in the state-local partnerships investigated, adequate
funding can greatly assist in the partnership formulation processes. In the case of state-
federal partnerships a significant financial contribution to the partnership formulation
would most probably come from the federal government. Unlike local governments in
Australia, the state governments wield substantial authority and power. It is therefore
essential that good governance arrangements are established early in the partnership
process to represent all stakeholders, establish clear policies on information access and
define the strategic direction of the partnership. Partnership management would also be
considered to be of high importance.
7.6.2 Application to Intra-Jurisdictional Partnersh ips
The partnership model could also be easily adapted for data sharing within an individual
jurisdiction, such as a state government. The recent adoption of business management
principles within government has forced many agencies to re-think their strategies towards
the sharing of information across the government. The trend towards cost accounting and
recovery for the provision of information and services across government has led to a
degree of dysfunctional behaviour and a general reluctance towards data sharing.
It is expected that greater emphasis may need to be placed on the sub-components of
Partnership Strategy and Formulation, Business Rules and Responsibilities, and Data
Exchange and Maintenance. Partnerships between government agencies should focus on
service delivery, have a strong project leader, define clear goals and be outcome driven.
Working across government agencies it is often easy to operate on an informal basis
without the need for formal agreements or contracts. However, this can frequently lead to
confusion over the responsibilities of each partner in the data sharing process. Therefore,
it is important to maintain business formality and implement the delivery or exchange
through a mechanism such as a Service Level Agreement (SLA). This style of agreement
has become common within large businesses and government.
7.6.3 Government-Private Data Sharing Partnerships
With the continuing trend to privatise many areas of traditional government service and
infrastructure such as communication, transport, health and water, it is inevitable that some
areas of traditional spatial information capture or management will be undertaken by the
private sector. This is already happening in Australia, Canada, USA, UK and Europe.
Many public-private partnerships are emerging around the world which build infrastructure
such as roads, health systems and communication networks. The level of risk taken by

A Local-State Spatial Data Sharing Partnership Model to Facilitate SDI Development
220
each partner normally reflects the potential benefits from the partnership and enables
governments to share the risk of project development and also reduce the upfront project
costs.
It is envisaged that the partnership model could be applied to possible government-private
data sharing partnerships with an appropriate shift in emphasis or priority. A significant
consideration on this form of partnership would be the potential loss of control over
information as the private sector seeks to value-add their initial investment. The
governance arrangements, partnership strategy and business rules and responsibilities
would form a key focus. Privacy concerns and liabilities on the use of government
information are issues that would require careful management. The model may need to
establish a stronger e-business component to allow for the auditing and accounting of each
party’s activities and contributions.
7.6.4 Section Summary
In summary, initial investigations of the application of the model to other jurisdictional
levels indicates that it could be applied across a variety of domains. In addition, it is
expected that as partnership efforts in spatial data sharing continue to expand, particularly
at the lower levels of government, the need for improved partnership management will also
grow. Other countries of federated states such as the United States and Canada are
excellent examples of the complexity of these environments. In the United States where
there are over 85,000 individual local government entities, and Canada where there are
approximately 4,500 local governments, the need for strongly managed local to state data
sharing models will be essential to SDI development.
7.7 Chapter Summary This chapter has presented, applied and discussed the implications of a data sharing
partnership model. In the first instance the process of integrating the results from the state
cases studies and the local government surveys was described. The findings from the
previous two chapters were drawn together to identify a common core of issues and factors
that have formed the basis of the spatial data sharing partnership model.
A partnership model consisting of three core components was then presented and the detail
of each of the components was described. The model was then operationalised using the
original case study data and survey results as the basis for comparison. Next, the impact of
the model in facilitating SDI development was examined. This analysis re-affirmed the
importance of spatial data sharing partnerships in building the SDI as either a core

Chapter 7 – Model Development and Discussion
221
component of the SDI policy framework or alternatively as a key institutional process
which supports SDI.
Finally, the model was examined from the context of its applicability and useability across
other jurisdictions, within jurisdictions and between government jurisdictions and the
private sector. The model has shown to be generic and robust enough to be applied in all
three areas examined although the emphasis of the various model components may need to
be modified.
The next chapter will present the final conclusions of the research by firstly examining the
overall achievements in response to the initial research questions and stated objectives.
The significance of the research will then be discussed and recommendations for further
research will be presented.

A Local-State Spatial Data Sharing Partnership Model to Facilitate SDI Development
222

Conclusions and Implications
223
8 Chapter 8 Conclusions and Implications
Chapter 8
Conclusions and Implications

A Local-State Spatial Data Sharing Partnership Model to Facilitate SDI Development
224

Conclusions and Implications
225
8.1 Introduction SDI development has progressed from national level initiatives characterised by “top
down” and “policy driven” approaches, to the establishment of sub-national SDIs which
provide a different set of challenges. With the sophistication of the ICT infrastructure that
exists today, governments and business are beginning to apply the principle of “collect
once, but use many times” as the strategy to improve both the efficiency and effectiveness
of SDI initiatives.
This research investigated the formation, operation and outcomes of formalised local-state
government data sharing partnerships, which have become an important strategy in sub-
national SDI development. The results of this study re-affirm the importance of building
on the above principle through collaborative efforts such as partnerships. In countries
which are highly decentralised federations of states such as Australia, United States and
Canada, formalised partnership structures may provide a solution for building the SDI at
state and local levels.
This concluding chapter examines the outcomes achieved during this research, highlights
the significance of the research work to theory and practice, reflects on the original
research problem and suggests directions for future research efforts.
8.2 Research Aim and Objectives As detailed in chapter 1, the central aim of this dissertation was to:
Develop a spatial data sharing partnership model which more effectively supports the
sharing and maintenance of spatial information between local and state jurisdictions
within Australia and hence contribute to SDI development.
In chapter 7, a generic data sharing partnership model was developed through the
integration of the results from the qualitative case studies of the partnership models in
three states and the quantitative analysis of a questionnaire local governments. A mixed
methods research approach was successfully utilised to achieve this aim. This
methodology provided a number of advantages over other research approaches, including
the ability to investigate both the breadth and depth of the research problem. However,
perhaps the most important outcome of the mixed method approach was the ability to
improve the validity of the model through the triangulation of multiple and complementary
sources of evidence.

A Local-State Spatial Data Sharing Partnership Model to Facilitate SDI Development
226
The partnership model successfully described and assessed the multi-dimensional nature of
inter-jurisdictional data sharing initiatives. The model recognises the context of the
collaboration, the collaborative process and the outcomes of collaborative initiative.
Moreover, the model was used to effectively determine the strengths and weaknesses of
the partnerships and hence identify their success and sustainability.
The objectives of the research aim will now be reviewed and discussed.
8.2.1 Objective 1: Review Existing Theory and Pract ice
Existing research identified models and typologies which assist the understanding of the
motivations, mechanisms and outcomes for data sharing. However, a number of gaps in
the research were identified including a lack of evidence on the performance and operation
of formal data sharing initiatives, particularly in multi-jurisdictional environments. The
need for more quantitative evidence on partnership outcomes was also highlighted. The
investigation of collaboration theory and partnerships recognised the need to understand
not only the drivers for collaboration, but also the process of collaboration. These findings
had a significant influence on the developed model, which is “process centred” rather than
“outcome driven”. The model also incorporates the influences of the multi-jurisdictional
environments which impact on the partnership strategies, formulation, management and
governance.
8.2.2 Objective 2: Description and Classification o f Existing Local/State Government Spatial Data Sharing Partner ships
The qualitative assessments provided a detailed understanding of the motivations,
operation and issues relating to each of the state initiatives, with particular focus and
emphasis on why, how and what events triggered their initiation and development. The
research identified that the existing political and economic environments of at least two of
the state governments had a positive influence on the collaborative initiatives. One
significant conclusion from this finding is that partnership initiatives should not be put off
because of economic downturn or political change; on the contrary such circumstances
may actually assist in partnership establishment. The case studies identified limitations in
each of the partnership models including project management, performance management
and governance.
The collaborative initiatives also showed a direct linkage and correlation to the
development of the SDI at state level. Although this link always has been assumed to
exist, little previous work has attempted to map the determinants of collaboration and the
subsequent collaborative process to the contribution of SDI development.

Conclusions and Implications
227
8.2.3 Objective 3: Assessment of Organisational Cha racteristics, Capacities and Attitudes in Local Government
The results have shown that spatial information has become far more mainstream and core
to LGA business activities. The progressive alignment of GIS and corporate ICT was also
evident and may lead to different ways to engage with local governments in the future.
The assessment of the status of the areas of policy and standards in local governments
indicated that there was a relatively low appreciation of the importance of these issues for
data sharing. The influence of state government policies on access and pricing were found
to be significant, and LGAs were found to be likely to follow the lead of the state
government in these policy areas. The business needs of local government were identified
as a priority for establishing future partnership strategies.
Local government differences with respect to spatial information policy, data needs and
outcomes were identified across the three states investigated. There was significant inter-
state variation in the overall level of satisfaction of local governments with each of the
state partnerships. These differences were primarily attributed to the varying access and
pricing policies of the three states and the effectiveness of their partnership management
process. The results of the quantitative analysis correlated closely with the qualitative case
studies at state government level, thereby confirming trends.
8.2.4 Objective 4: Identification of Critical Part nership Factors and Development of a Generic Partnership Model
In chapter 7, the critical partnership factors were identified through a triangulation process
integrating findings from existing theory, the state government case studies and the results
of the quantitative analysis of the local government survey. Some of these factors
emerged initially in the literature and were then confirmed by the state case studies or the
LGA analysis. Factors that were identified as being highly significant included defined
business needs, resourcing, organisational support, policies, communication and issues
relating to control. Based on these findings a generic data sharing partnership model was
developed. The model consisted of three major components including: contextual factors,
collaborative process and outcomes.
8.2.5 Objective 5: Evaluation of the Partnership M odel and Assessment of its Contribution to SDI Development
The partnership model was evaluated using the original case study data to determine its
application and useability. The evaluation successfully identified a number of short-
comings in each of the existing local-state government data sharing partnership strategies.

A Local-State Spatial Data Sharing Partnership Model to Facilitate SDI Development
228
The outcome of the institutional evaluation illustrated the importance of factors such as
policy development, resourcing and business needs in collaborative initiatives. The
collaborative process component of the model successfully highlighted variations between
the partnerships and confirmed the assessment of the partnership outcomes from chapters 5
and 6.
The assessment of the generalisation and applicability of the model concluded that the
model is flexible enough to be utilised within a number of situations although the emphasis
of different components of the model may need to be varied. Finally, the relationship of
the model to SDI development was investigated. It was concluded that data sharing, as
expected, is closely aligned to a number of SDI components and contributes positively to
SDI development.
8.3 Conclusion on Research Problem The research problem identified in section 1.2.1 of this dissertation identified that spatial
data sharing partnership models in Australia do not adequately consider a range of
technical, institutional, political and economic factors, therefore limiting their contribution
to SDI development. This research has confirmed that this problem continues to exist in
some Australian states and is inhibiting the availability of accurate and up-to-date
information not only within government, but also to the private sector and the community.
The research revealed that in two of the case studies the overall partnership outcomes and
contribution to sub-national SDI development was very positive.
The research also confirmed the problem is complex and cannot simply be isolated to a
single factor or process. The inter-relationships between the political (jurisdictional),
organisational (institutional) and actual collaborative processes must be better understood
in order to maximize the success of collaborative initiatives such as partnerships.
Although institutional issues continue to be the dominant challenge for future data sharing
efforts, enabling technology is beginning to demonstrate that real benefits and cost savings
are achievable. The impact of technological advancements therefore should not be under-
estimated as a powerful agent for change.
8.4 Significance of Research to Theory and Practice Previous investigations of data sharing have primarily been conducted using singular
research approaches, either qualitative or quantitative in nature. These approaches,
although appropriate, often suffer from inherent weaknesses such as bias or the lack of
multiple sources of evidence. The research methodology utilised in this dissertation
followed a mixed method approach that combined the outcomes of explorative qualitative

Conclusions and Implications
229
case studies with a quantitative study of the local government environment. The strengths
of this approach were undoubtedly the ability to triangulate the findings of one method
with the results of another. The mixed methods approach also provides the capacity to
examine the research problem in both depth and breadth. Therefore, this research
methodology may be utilised more commonly in the future as researchers seek to explain
and quantify the outcomes of other dimensions of information systems or organisational
research.
The findings from the factor analysis underscore the key motivations for sharing of data,
particularly at the local government level. LGAs are very tightly resourced and highly
business driven. Therefore, the linkage of data sharing initiatives to the business processes
of LGAs is more likely to result in more successful and sustainable outcomes. The
research also indicates that policies at that state and local level should be aligned where
possible to ensure that there is minimal conflict. Local governments are more likely to
follow the lead of state agencies on policy development due to their limited capacity to
develop their own specific spatial information access and pricing policies.
Increasing, LGAs are at the cutting edge of spatial data access and provision through the
use of the internet and web mapping. Because of the closeness of LGAs to their
customers, they see immediate and significant benefits through providing information
access to the local community. Information access facilitates better service and evidence
indicates that it reduces the number of general enquiries. Organisational support and
leadership were also rated highly and agree with previous theoretical and empirical
research.
Like spatial information itself, spatial data sharing partnerships are maturing in both
purpose and operation. The model builds on existing knowledge by recognising that
partnerships are predominantly process driven. The research identified a number of key
processes such as performance management, partnership formulation and governance
arrangements are critical to the successful development and operation of these
partnerships. The findings of the research, in particular the better understanding of the
business imperatives of data sharing partnerships, are considered a significant advance in
our understanding of these collaborations.
Further, the model recognises the nexus between the collaborative process and the
institutional and jurisdictional environments. Although these environments have been
identified by a number of authors in collaboration literature, this research found that these
environments have the potential to significantly impact on the initial formation and

A Local-State Spatial Data Sharing Partnership Model to Facilitate SDI Development
230
outcomes of spatial data sharing partnerships. Therefore, an appropriate evaluation of the
both the jurisdictional and institutional environments should improve future partnership
strategies, outcomes and sustainability.
8.5 Recommendations for Further Research As an outcome of this research it is recommended that future research efforts could be
directed in the following areas.
Firstly, the developed model identified the need for monitoring the performance of spatial
data sharing partnerships. The scope of this research did not enable the further
investigation into the best methods or measures for monitoring data sharing initiatives.
Therefore, it is suggested that the investigation of appropriate metrics for measuring the
performance of partnerships and methodologies for the implementation of these measures
would provide a useful contribution for building more efficient and effective data sharing
partnerships.
Secondly, sub-national initiatives for building SDIs will continue to be a focus for
governments and the private sector organisations around the world in the future. Although
sub-national government structures are generally hierarchical in nature, spatial data
sharing, and hence SDI development, do not appear to fit neatly within this hierarchal
framework. It would therefore be valuable to explore the extent to which hierarchical
government environments contribute to different components of SDI development. Are
less structured models of SDI development appropriate at the sub-national level? What is
the role of the private sector in building the SDI at these levels and how can their
contributions be better recognised?
Finally, the local government analysis indicated the increasing usage of web mapping and
e-business activities by the medium and larger LGAs. Indications are that these portals
have had a significant impact on the delivery of services to their external clients. The
quantification of these improvements at local government level may provide a useful
research test-bed for examining the impact of SDI development on business and the
community. These findings may provide further evidence to support the spatial
enablement of government at other levels.
8.6 Final Remarks The spatial data infrastructure in Australia and many other countries is contributing
positively to the delivery of government services, improved decision-making and the
creation of business opportunities for the private sector. Spatial data sharing and the

Conclusions and Implications
231
partnership initiatives that facilitate data sharing are essential to SDIs achieving their full
potential. Sub-national datasets are now the focus of the next generation of SDI
development efforts and the challenges which they present are significant. The findings
from this research and the partnership model developed have the potential to improve the
success and outcomes of future spatial data sharing initiatives and hence benefit
governments, businesses and the community.

A Local-State Spatial Data Sharing Partnership Model to Facilitate SDI Development
232

References
233
References References
Ackoff, RL 1989, 'From data to wisdom', Journal of Applied Systems Analysis, vol. 16, pp. 3-9.
Alexander Tomlinson P/L 2006, Evaluation of the Property Information Program: Report 3 - Recommendations and Migration Plan, Spatial Information Infrastructure and MAV, Melbourne.
Alter, C & Hage, J 1993, Organisations Working Together, vol. 191, Sage Library of Social Science Research, Sage Publications, Newbury Park, CA.
ANZ Economics 2006, State of the States Economic Report, viewed 10 June 2006, <http://www.anz.com/business/info_centre/economic_commentary/StateoftheStatesMay2006.pdf>.
ANZLIC 1996, Spatial data infrastructure for Australia and New Zealand, viewed April, 2002 <http://www.anzlic.org.au/asdi/anzdiscu.htm>.
ANZLIC 2005, History of ANZLIC, viewed 6 March 2006, <http://www.anzlic.org.au/about_history.html>.
Arrowsmith, CA & Williamson, IP 1990, 'Land Information Systems in Local Government and the Role of the Private Sector', The Australian Surveyor, vol. 35, no. 1, pp. 29-39.
Australian Bureau of Statistics 2005, Population Projections Australia, 2004-2101, viewed 2 May 2006, <http://www.abs.gov.au/AUSSTATS/[email protected]/DetailsPage/3222.02004%20to%202101?OpenDocument>.
Australian Bureau of Statistics 2006a, Year Book Australia, vol. 84, Australian Bureau of Statistics, Canberra.
Australian Bureau of Statistics 2006b, Statistics Tasmania 2006, ABS Document 1384.6, viewed 5 May 2006, <http://www.abs.gov.au/AUSSTATS/>.
Australian Bureau of Statistics 2006c, Wage and Salary Earners, Public Sector, Australia, Dec 2005, ABS, viewed 1 May 2006, <http://www.abs.gov.au/AUSSTATS/[email protected]/DetailsPage/6248.0.55.001Dec%202005?OpenDocument>.
Australian Bureau of Statistics 2006d, Australian National Accounts: State Accounts, 2004-05, ABS Publication 5220.0, viewed 10 May 2006, <http://www.census.gov.au/AUSSTATS/[email protected]/allprimarymainfeatures/E6765105B38FFFC6CA2568A9001393ED?opendocument>.
Australian Government 2006, Budget 1997-98, viewed 10 May 2006, <http://www.budget.gov.au/>.
Australian Local Government Association 2004, Use of Electronic Technology by Councils - 2004 Snapshot, viewed 1 February 2006, <http://www.lgconnect.gov.au/data/NationalSurveyGraphs11.pdf?PHPSESSID=967hh6eu9vna3mtfp13i5105i4>.
Australian Local Government Association 2005, About ALGA, viewed 10 May 2006, <http://www.alga.asn.au/about/>.

A Local-State Spatial Data Sharing Partnership Model to Facilitate SDI Development
234
Axelrod, R 1997, The Complexity of Co-operation: agent-based models of competition and collaboration, Princeton Studies in Complexity, Princeton University Press, Princeton, New Jersey.
Azad, B & Wiggins, LL 1995, 'Dynamics of inter-organizational data sharing: a conceptual framework for research', in HJ Onsrud & G Rushton (eds), Sharing geographic information, Centre for Urban Policy Research, New Brunswick, NJ, pp. 22-43.
Bangemann, M 1994, Recommendations to the European Council: Europe and the global information society, viewed 7 March 2006, <http://europa.eu.int/ISPO/infosoc/backg/bangeman.html>.
Barker, T 2003, Personal communication - interview May 2003, Brisbane.
Barney, J 1991, 'Firm resources and sustained competitive advantage', Journal of Management, vol. 17, no. 1, pp. 99-120.
Benbasat, I, Goldstein, DK & Mead, M 1987, 'The case research strategy in studies of information systems', MIS Quarterly, vol. 11, no. 3, pp. 369-89.
Benbasat, I (ed.) 1984, The information systems research challenge, vol. 2, Experimental research methods, Harvard Business School Press, Boston.
Bergquist, W, Betwee, J & Meuel, D 1995, Building Strategic Relationships: How to Extend Your Organisation's Reach Through Partnerships, Alliances and Joint Ventures., Jossey-Bass, San Francisco.
Bomberger, D 1983, 'Local government's use of computer graphics: current and future applications to benefit communities.' paper presented to 11th Australian Conference on Urban and regional Information Systems, Brisbane, 22-25 November, 1983.
Bonoma, TV 1985, 'Case research in marketing: opportunities, problems, and a process', Journal of Marketing Research, vol. 22, no. 2, pp. 199-208.
Brace, N, Kemp, R & Snelgar, R 2006, SPSS for Psychologists, 3rd edn, Palgrave Macmillan, New York.
Brannen, J 1992, 'Combining qualitative and quantitative approaches: and overview', in J Brannen (ed.), Mixing Methods: qualitative and quantitative research, Avebury, Aldershot, England, pp. 3-37.
Bryman, A 1992, 'Quantitative and qualitative research: further reflections on their integration', in J Brannen (ed.), Mixing Methods: qualitative and quantitative research, Avebury, Aldershot, England, pp. 57-78.
Bryman, A 1998, Quantity and quality in social research, Unwin Hyman, London.
Budic, ZD 1994, 'Effectiveness of geographic information systems in local planning', Journal of the American Planning Association, vol. 60, no. 2, pp. 244-63.
Budic, ZD & Godschalk, DR 1994, 'Implementation and management effectiveness in adoption of GIS technology in local governments', Computers, Environment and Urban Systems, vol. 18, no. 5, pp. 285-304.
Bullock, K 1978, 'Cadastral data bases: some suggestions to their future role in the mapping and spatial referencing in Australia', paper presented to 6th Australian Conference on Urban and regional Information Systems, Sydney.
Butler, D 2006, 'The web-wide world', Nature, vol. 439, pp. 776-8.
Calkins, HW & Weatherbe, R 1995, 'Taxonomy on spatial data sharing', in HJ Onsrud & G Rushton (eds), Sharing geographic information, Centre for Urban Policy Research, New Brunswick, NJ, pp. 65-75.

References
235
Cameron, D 2001, 'The structures of intergovernmental relations', International Social Science Journal, vol. 53, no. 167, pp. 121-7.
Campbell, H 1993, 'GIS implementation in British local government', in I Masser & HJ Onsrud (eds), Diffusion and Use of Geographic Information Technologies, Kluwer Academic publishers, Dordrecht, Netherlands, pp. 117-46.
Car, A 1998, 'Hierarchical spatial reasoning: a geocomputation method', paper presented to 3rd International Conference on GeoComputation, University of Bristol, UK, 17-19 September 1998.
Carbo, T 1997, U.S. Advisory Council on the National Information Infrastructure (NII) 1994-1996, viewed 12 February 2006, <http://digitalarchive.oclc.org/da/ViewObjectMain.jsp?objid=0000003640&frame=true>.
Carter, JR 1989, 'On defining the geographic information system', in WJ Rippler (ed.), Fundamentals of geographical information systems: a compendium, ASPRS/ACSM, Falls Church, VA, pp. 3-7.
Chan, TO & Williamson, I 1999, 'The different identities of GIS and GIS diffusion', International Journal of Geographic Information Science, vol. 13, no. 3, pp. 267-81.
Child, J & Faulkner, D 1998, Strategies for cooperation: managing alliances, networks, and joint ventures, Oxford University Press Inc., New York.
Child, J, Faulkner, D & Tallman, SB 2005, Cooperative strategy, Oxford University Press, Oxford.
Clarke, D 2004a, Performance, learning, leadership and knowledge, viewed 8 September 2005, <http://www.nwlink.com/%7Edonclark/performance/understanding.html>.
Clarke, D, Hedberg, O & Watkins, W 2003, 'Development of the Australian spatial data infrastructure', in I Williamson, A Rajabifard & M-E Feeny (eds), Developing Spatial Data Infrastructures: From Concept to Reality, Taylor and Francis, London, pp. 131-45.
Clarke, R 2004b, Roger Clarke’s Information Infrastructure Home-Page, viewed 10 February 2006, <http://www.anu.edu.au/people/Roger.Clarke/II/>.
CLIP 2005, The Central and Local Government Information Partnership, viewed 1 February 2006, <http://www.clip.gov.uk/>.
Coleman, DJ & McLaughlin, J 1998, 'Defining global geospatial data infrastructure (GGDI): components, stakeholders and interfaces', Geomatica, vol. 52, no. 2, pp. 129-43.
Coleman, DJ & Nebert, DD 1998, 'Building a North American spatial data infrastructure', Cartography & Geographic Information Systems, vol. 25, no. 3, pp. 151-9.
Commonwealth Government of Australia 2003, Rates and taxes: a fair share for responsible local government, House of Representatives Standing Committee on Economics, Finance and Public Administration, Canberra.
Commonwealth Grants Commission 2001, Review of the Operation of the Local Government (Financial Assistance) Act 1995, Canberra.
Conover, WJ 1999, Practical Nonparametric Statistics, 3rd edn, Wiley, New York.
Cousins, PD 2001, 'A conceptual model for managing long-term inter-organisational relationships', European Journal of Purchasing and Supply Management, vol. 70, pp. 1-13.

A Local-State Spatial Data Sharing Partnership Model to Facilitate SDI Development
236
Craglia, M & Signoretta, P 2000, 'From global to local: the development of local geographic information strategies in the United Kingdom', Environment and Planning B: Planning and Design, vol. 27, no. 5, pp. 777-88.
Craig, WJ 1995, 'Why we can't share data: institutional inertia', in HJ Onsrud & G Rushton (eds), Sharing Geographic Information, Centre for Urban Policy Research, New Brunswick, NJ, pp. 109-19.
Craig, WJ 2005, 'White knights of spatial data infrastructure: the role and motivation of key individuals', URISA Journal, vol. 16, no. 2, pp. 5-13.
Creswell, JW 2003, Research design: qualitative, quantitative, and mixed method approaches, 2nd edn, Sage Publications, Thousand Oaks, CA.
Creswell, JW, Plano Clark, VL, Gutmann, ML & Hanson, WE 2003, 'Advanced mixed methods research designs', in A Tashakkori & C Teddlie (eds), Handbook of mixed methods in social and behavioral research, Sage Publications, Thousand Oaks, California, pp. 209-40.
Crompvoets, J, Bregt, A, Rajabifard, A & Williamson, IP 2004, 'Assessing worldwide developments of national spatial data clearinghouses', International Journal of Geographic Information Science, vol. 18, no. 1, pp. 1-25.
Crossman, P 2000, Drivers of Queensland's Economic Growth, Office of Economic and Statistical Research, Queensland Treasury, viewed 10 May 2006, <http://www.oesr.qld.gov.au/queensland_by_theme/economic_performance/general/research_papers/drivers_econ_htm.shtml#Thethesis>.
Cushing, W, Parish, LW & Warren, CJ 1975, 'Local government finance in Australia: Towards a uniform information system', paper presented to URPIS 3, Newcastle, 27-28 November 1975.
Dalrymple, K, Williamson, IP & Wallace, J 2003, 'Cadastral Systems Within Australia', Australian Surveyor, vol. 48, no. 1, pp. 37-49.
Dangermond, J 1995, 'Public data access: another side of GIS data sharing', in HJ Onsrud & G Rushton (eds), Sharing Geographic Information, Centre for Urban Policy Research, New Brunswick, NJ, pp. 331-9.
Davies, K & Lyons, K 1991, 'Micro-economic reform, land administration and land information management', paper presented to Conference on Land Information Management, Sydney, Australia, 10-11 July, 1991.
DCITA 1995, Networking Australia's Future, viewed 7 March 2006, <http://www.dcita.gov.au/tel/internet_and_broadband_services/resources/networking_australias_future_-_table_of_contents>.
Dedekorkut, A 2004, 'Determinants of Success in Interorganizational Collaboration for Natural Resource Management', Doctor of Philosophy thesis, Florida State University.
Denzin, NK & Lincoln, YS (eds) 1994, Handbook of qualitative research, Sage Publications, Thousand Oaks, California.
Department of Communications Information Technology and the Arts 2006, Networking the Nation Initiative, viewed 1 May 2006, <http://www.dcita.gov.au/tel/role_of_the_telecommunications_division_and_contacts/networking_the_nation>.
Department of Environment 1987, Handling geographic information: Report to the Secretary of State for the Environment of the Committee of Enquiry into the Handling of Geographic Information, HMSO, London.

References
237
Department of Foreign Affairs and Trade 2006, Australia's System of Government, viewed 10 December 2005, <http://www.dfat.gov.au/>.
Department of Natural Resources Mines and Water 2005, Annual Report 2004-2005, Queensland Government, viewed 4 March 2006, <http://www.nrm.qld.gov.au/about/documents/annual_report.html>.
Department of Natural Resources Mines and Water 2006, Data Sharing Licence, viewed 10 May 2006, <http://www.nrm.qld.gov.au/products/access_pricing/licences/sharer_info.html>.
Department of Sustainability and Environment 2004, 'Property Victoria', vol. 8, September, 2004.
Department of Sustainability and Environment 2006, Annual Report 2005, Victorian Government, viewed 10 April 2006, <http://www.dse.vic.gov.au/>.
DLGRP 2006, Department of Local Government and Regional Development, Western Australia, viewed 1 June 2006, <http://www.dlgrd.wa.gov.au/>.
Dollery, B 2002, A century of vertical fiscal imbalance in Australian federalism, School of Economics, University of New England, Armidale.
Dollery, B 2005, The state of play of Australian local government, Centre for Local Government, University of New England, viewed 28 February 2006, <http://www.munimall.net/articles/05/050616australia.pdf>.
Douglas, B & Lowe, C 2004, GIS/Spatial Best Practice Survey 2003/2004, Corporate GIS Consultants Pty Ltd.
Dyson, E, Gilder, G, Keyworth, J & Toffler, A 1995, 'A Magna Carta of the knowledge age', in D Altschiller (ed.), The Information Revolution, HW Wilson, New York.
Eagleson, S, Escobar, F & Williamson, IP 1999, 'Spatial hierarchical reasoning applied to administrative boundary design using GIS', paper presented to 40th Australian Surveyors Conference, Perth, Australia.
Eden, R & Barker, T 1992, 'The Queensland Land Information System', paper presented to AURISA 92, Gold Coast, 25-27 November 1992.
Eden, R & Baker, K 1994, 'Coordinating and integrating land information systems in Queensland', paper presented to AURISA 94, Sydney, 21-25 November 1994.
EUROGI 2005, EUROGI Website - Rationale, Mission and Objectives of EUROGI, viewed 8 March 2006, <http://www.eurogi.org/index_1024.html>.
Evans, JD 1997, 'Infrastructures For Sharing Geographic Information Among Environmental Agencies', Doctor of Philosophy thesis, Massachusetts Institute of Technology.
Executive Office of the President 1993, The National Information Infrastructure: Agenda for Action, viewed 7 March 2006, <http://www.ibiblio.org/nii/NII-Executive-Summary.html>.
Galligan, B 1989, 'Australian Federalism: Perception and Issues', in B Galligan (ed.), Australian Federalism, Longman Cheshire Pty ltd, Melbourne, pp. 2-14.
General Accounting Office 1998, Measuring Performance and Demonstrating Results of Information Technology Investments, US General Accounting Office, viewed 10 May 2006, <http://www.gao.gov/special.pubs/ai98089.pdf>.
Gerdes, S 2003, Navigating the partnership maze: creating alliances that work, McGraw-Hill, New York.

A Local-State Spatial Data Sharing Partnership Model to Facilitate SDI Development
238
Geringer, JM & Herbert, L 1991, 'Measuring performance of international joint ventures', Journal of International Business Studies, vol. 22, no. 2, pp. 249-64.
GISCA 2006, Accessibility/Remoteness Index for Australia, National Centre for Social Applications of Geographic Information Systems, viewed 10 May 2006, <http://www.gisca.adelaide.edu.au/>.
Goodchild, MF 2001, 'A geographer looks at spatial information theory', in DR Montello (ed.), Spatial Information Theory: Foundations of Geographic Information Science, Springer, New York, pp. 1-13.
Government of Canada 1996, Building the Information Society: Moving Canada into the 21st Century, viewed 12 February 2006, <http://www.ifla.org/II/canada.htm>.
Grant, D & Hedberg, O 2001, 'Public sector mapping agencies - Australia concept to incorporation', paper presented to International Symposium on Spatial Data Infrastructures, Melbourne, Australia, 19-20 November, 2001.
Grant, D & Williamson, I 2003, 'State SDI initiatives', in I Williamson, A Rajabifard & M-E Feeny (eds), Developing Spatial Data Infrastructures: From Concept to Reality, Taylor and Francis Ltd, London, pp. 111-27.
Gray, B 1985, 'Conditions facilitating interorganizational collaboration', Human Relations, vol. 38, no. 10, pp. 911-36.
Gray, B 1989, Collaborating - Finding Common Grounds in Multiparty Problems, Josey-Bass Publishers, San Francisco, CA.
Grimshaw, DJ 2000, Spatial Information Theory: Foundations of Geographic Information Science, John Wiley and Sons, New York.
Groot, R 1997, 'Spatial data infrastructure (SDI) for sustainable land management', ITC Journal, vol. 1997, no. 3/4, pp. 287-93.
Halpert, BA 1982, 'Chapter 4 Antecedents', in DL Rogers & DA Whetten (eds), Interorganisational Coordination: Theory, Research and Implementation, first edn, Iowa State University Press, Ames, Iowa, pp. 54-72.
Hamel, J, Dufour, S & Fortin, D 1993, Case Study Methods, vol. 32, Qualitative Research Methods Series, Sage Publications, London.
Harrigan, KR 1988, 'Strategic alliances and partner asymmetrics', in FJ Contractor & P Lorange (eds), Cooperative strategies in international business, Lexington Books, New York, pp. 205-26.
Hart, A 1991, 'Land Information Management: The Institutional Issues', paper presented to Conference on Land Information Management, Sydney, 10-11 July 1991.
Harvey, FJ 2001, 'Constructing GIS: actor networks of collaboration', Journal of Urban and Regional Information Systems Association, vol. 13, no. 1, pp. 29-37.
Harvey, FJ & Tulloch, D 2006, 'Local-government data sharing: Evaluating the foundations of spatial data infrastructures', International Journal of Geographical Information Science, vol. 20, no. 7, pp. 743-68.
Harvey, FJ, Buttenfield, BP & Lambert, SC 1999, 'Integrating geodata infrastructures from the ground up', Photogrammetric Engineering and Remote Sensing, vol. 65, no. 11, pp. 1287-91.
Hawkesbury-Nepean Catchment Management Trust 2000, Local government and the Australian Spatial Data Infrastructure - Spatial data and metadata workshop report.

References
239
Hesse, WJ & Williamson, IP 1990, 'A review of digital cadastral data bases in Australia and New Zealand', The Australian Surveyor, vol. 35, no. 4, pp. 351-67.
House of Lords 1996, Information Society: Agenda for Action in the UK, viewed 7 March 2006, <http://www.parliament.the-stationery-office.co.uk/pa/ld199596/ldselect/inforsoc/inforsoc.htm>.
Hullick, JM & Cooper, MJ 1993, 'The role of local government in urban manangement in the 1990', paper presented to AURISA 93, Adelaide, 22-26 November, 1993.
Infrastructure Canada 2006, Infrastructure Canada Home Page, viewed 10 June 2006, <http://www.infrastructure.gc.ca/index_e.shtml>.
Jaccard, J & Wan, CK 1996, LISREL approaches to interaction effects in multiple regression, Sage Publications, Thousand Oaks, CA.
Jacoby, S, O'Keeffe, E & Warnest, M 2001, 'Victoria's SDI initiatives: Fundamental partnerships driving the development of spatial data infrastructure', paper presented to International Symposium on Spatial Data Infrastructure, Melbourne, Australia, 19-20 November 2001.
Jacoby, S, Smith, J, Ting, L & Williamson, I 2002, 'Developing a common spatial data infrastructure between state and local government - an Australian case study', International Journal of Geographical Information Science, vol. 16, no. 4, pp. 305-22.
Johnson, B 1997, Additional Information on the NYS GIS Data Sharing Cooperative, New York State Department of Transportation, New York.
Johnson, R & Arbeit, D 2002, 'The MetroGIS Initiative: Lessons from a Successful Geospatial Data Collaborative', paper presented to GSDI 6, Budapest, Hungary, 16-19 September, 2002.
Johnson, R, Nedovic-Budic, Z & Covert, K 2001, Lessons from practice - a guidebook to organizing and sustaining geodata collaboratives, Geodata Alliance, viewed 20 June 2002.
Johnson, RB & Onwuegbuzie, AJ 2004, 'Mixed methods research: a research paradigm whose time has come', Educational Researcher, vol. 33, no. 7, pp. 14-26.
Kelly, K, Pardo, TA, Dawes, SS, DiCaterino, A & Foderingham, W 1995, Sharing the Costs, Sharing the Benefits: The NYS GIS Cooperative Project, Center for Technology in Government, University at Albany, Albany, NY.
Kelly, P 1993, 'A National Spatial Information Infrastructure', paper presented to Conference of the Australian Urban and Regional Information Systems Association, Adelaide, 22-26 November, 1993.
Kevany, MJ 1995, 'A proposed structure for observing data sharing', in HJ Onsrud & G Rushton (eds), Sharing geographic information, Centre for Urban Policy Research, New Brunswick, NJ, pp. 76-100.
Killing, JP 1983, Strategies for joint venture success, Praeger, New York.
Kumar, K & van Dissel, HG 1996, 'Sustainable collaboration: managing conflict and cooperation in interorganizational systems', MIS Quarterly, vol. 20, no. 3, pp. 279-300.
Lambert, SC & Garie, H 1999, 'The National Spatial Data Council: a true partnership for the NSDI', Photogrammetric Engineering and Remote Sensing, vol. 65, no. 11, pp. 1231-4.

A Local-State Spatial Data Sharing Partnership Model to Facilitate SDI Development
240
Land Information Coordination Committee 2001, The LIST - Status and Future Directions, viewed 25 April 2006, <http://www.thelist.tas.gov.au/docs/licc/futuredirections.html>.
Land Information Services Division 1997, Draft policy statement - Sharing data sets with local government., Department of Environment and Land Management.
Lank, E 2006, Collaborative Advantage, Palgrave Macmillan, New York.
Lawrence, T, Hardy, C & Phillips, N 2002, 'Institutional Effects of Inter-organizational Collaboration: The Case of Mère et Enfant (Palestine)', Academy of Management Journal, vol. 45, no. 1, pp. 281-90.
Lee, AS 1989, 'A scientific methodology for MIS case studies', MIS Quarterly, vol. 8, no. 1, pp. 33-50.
Lee, D 2003, 'Geospatial Data Sharing in Saudi Arabia', University of Southern Queensland.
Leicestershire County Council 2006, Leicestershire E-Government Partnership, viewed 2006 15 January, <http://www.leics.gov.uk/index/e_government/e_government_partnerships.htm>.
Lendrum, T 2000, The strategic partnership handbook - the practitioners guide to partnerships and alliances, 3rd edn, McGraw-Hill Australia, Sydney.
LGPMC 2006, Inter-Governmental Agreement to Guide Relations between the State and Territories, the Australian Government and Local Government, viewed 10 May 2006, <http://www.lgpmcouncil.gov.au/communique/20060412.aspx>.
LGSRG 2005, Local Government Spatial Reference Group Website, MAV, viewed 1 May 2006, <http://www.mav.asn.au/lgsrg>.
Lichfield, D 1998, 'Measuring the success of partnership endeavors', in N Walzer & BD Jacobs (eds), Public-private partnerships for local economic development, Praeger Publishers, Westport, pp. 97-120.
Lincoln, YS & Guba, EG 2000, 'Paradigmatic controversies, contradictions, and emerging confluences', in NK Denzin & YS Lincoln (eds), Handbook of qualitative research, 2nd edn, Sage, Thousand Oaks, CA, pp. 163-88.
Liner, EB 1989, 'Sorting out state-local relations', in EB Liner (ed.), A Decade of devolution : perspectives on state-local relations, Urban Institute Press, Washington, DC, pp. 3-25.
Lopez, CA 2005, Global Information Technology Report 2005-2006, World Economic Forum, viewed 20 May 2006, <http://www.weforum.org/site/homepublic.nsf/Content/Global+Competitiveness+Programme%5CGlobal+Information+Technology+Report>.
Masser, I 1993, 'Diffusion of GIS in the British local government', in I Masser & HJ Onsrud (eds), Diffusion and Use of Geographic Information Technologies, Kluwer Academic publishers, Dordrecht, Netherlands, pp. 99-115.
Masser, I 1998a, Governments and geographic information, Taylor and Francis Ltd, London.
Masser, I 1998b, 'The first generation of national geographic information strategies', paper presented to GSDI 3, Canberra, Australia, 17-19 November 1998.
Masser, I 1999, 'All shapes and sizes: the first generation of national spatial data infrastructures', International Journal of Geographic Information Science, vol. 13, no. 1, pp. 67-84.

References
241
Masser, I 2002, Report on a comparative analysis of NSDI’s in Australia, Canada and the United States, Geographic Information Network in Europe.
Masser, I 2005, GIS worlds - creating spatial data infrastructures, ESRI Press, Redlands, CA.
Masser, I & Campbell, H 1994, 'Information sharing and the implementation of GIS: some key issues', in MF Worboys (ed.), Innovations in GIS, Taylor and Francis, vol. 1, pp. 217-27.
Masser, I & Campbell, H 1995, 'Information sharing: the effects of GIS on British local government', in HJ Onsrud & G Rushton (eds), Sharing Geographic Information, Centre for Urban Policy Research, New Brunswick, NJ, pp. 231-49.
Masser, I & Campbell, H 1996, 'Great Britian: the dynamics of GIS diffusion', in I Masser, H Campbell & M Craglia (eds), GIS diffusion : the adoption and use of geographical information systems in local government in Europe, Taylor and Francis, London, pp. 49-66.
Maxwell, JA 1996, Qualitative research design: an iterative approach, vol. 41, Applied social research methods series, Sage Publications, Thousand Oaks.
Mayr, W 1992, 'Desktop GIS - power to the workers', paper presented to 20th Australian Conference on Urban and regional Information Systems, Gold Coast, 25-27 November, 1992.
McDonnell-Phillips Pty. Ltd. 2002, QSIIC Information Priorities, Queensland Spatial Information Infrastructure Council, Brisbane.
McDougall, K & Perret, P 1987, 'The Australian Key Centre in Land Information Studies - its developments in LIS and local government', Association of Consulting Surveyors Queensland Newsletter.
McDougall, K, Rajabifard, A & Williamson, IP 2005, 'Understanding the motivations and capacity for SDI development from the local level', paper presented to 8th International Conference on Global Spatial Data Infrastructures (GSDI 8), Cairo, Egypt, 16-21 April, 2005.
McFarlane, S 1997, Report on the feasibility of the lot plan/street address index, Queensland Spatial Information Infrastructure Strategy, Brisbane.
McGarty, TP 1996, 'Alternative networking architectures: pricing, policy and competition', in B Kahin (ed.), Building Information Infrastructure: Issues in the development of a national research and education network, McGraw-Hill, pp. 218-70.
Moyer, D & Fisher, KP 1973, Land Parcel Identifiers For Information Systems, American Bar Foundation, Chicago.
Mulford, CL & Rogers, DL 1982, 'Chapter 2 Definitions and Models', in DA Rogers & DA Whettons (eds), Interorganizational Coordination: Theory, Research and Implementation, Iowa State University Press, Ames, Iowa, pp. 9-31.
Nash, KR & Moll, AP 1976, 'Council of the City of Sydney land information system: description of planning applications', paper presented to 4th Australian Conference on Urban and regional Information Systems, Melbourne, 25-26 November, 1976.
National Council for Public Private Partnerships 2005, Public-private partnerships defined, viewed 10 November 2005, <http://ncppp.org/aboutus/index.html>.
National Research Council 1993, Toward a coordinated spatial data infrastructure for the nation, National Academy Press, Washington DC.
National Research Council 1994, Promoting the national spatial data infrastructure through partnerships, National Academy Press, Washington DC.

A Local-State Spatial Data Sharing Partnership Model to Facilitate SDI Development
242
National Research Council 2001, National spatial data infrastructure partnership programs: rethinking the focus, National Academy Press, Washington, DC.
National Research Council 2004, Licensing Geographic Data and Services, National Academy Press, Washington, DC.
Nebert, D 2004, Developing Spatial Data Infrastructures: The SDI Cookbook V 2.0, GSDI, viewed 10 May 2006, <http://www.gsdi.org/docs2004/Cookbook/cookbookV2.0.pdf>.
Nedovic-Budic, Z 2000, 'Geographic Information Science Implications for Urban and Regional Planning', URISA Journal, vol. 12, no. 2, pp. 81-7.
Nedovic-Budic, Z Unpublished, 'Exploring the utility of mixed method research in GIS', in progress.
Nedovic-Budic, Z & Pinto, JK 1999, 'Understanding interorganizational GIS activities: a conceptual framework', Journal of Urban and Regional Information Systems Association, vol. 11, no. 1, pp. 53-64.
Nedovic-Budic, Z & Pinto, JK 2000, 'Information sharing in an interorganizational GIS environment', Environment and Planning B: Planning and Design, vol. 27, no. 3, pp. 455-74.
Nedovic-Budic, Z & Pinto, JK 2001, 'Organizational (soft) GIS interoperability: lessons from the U.S.' International Journal of Applied Earth Observation and Geoinformation, vol. 3, no. 3, pp. 290-8.
Nedovic-Budic, Z, Pinto, JK & Warnecke, L 2004a, 'GIS database development and exchange: interactions mechanisms and motivations', URISA Journal, vol. 16, no. 1, pp. 15-29.
Nedovic-Budic, Z, Feeny, M-E, Rajabifard, A & Williamson, I 2004b, 'Are SDIs serving the needs of local planning? Case study of Victoria, Australia and Illinois, USA', Computers, Environment and Urban Systems, vol. 28, no. 2, pp. 329-51.
Newman, WL 1994, Social Research Methods, Allyn and Bacon, Boston.
NYS GIS Cooperative 2005, NYS GIS Clearinghouse, viewed 10 March 2006, <http://www.nysgis.state.ny.us/coordinationprogram/cooperative/members/index.cfm>.
Obermeyer, NJ 1995, 'Reducing inter-organizational conflict to facilitate sharing geographic information', in HJ Onsrud & G Rushton (eds), Sharing Geographic Information, Centre for Urban Policy Research, New Brunswick, NJ, pp. 139-48.
Obermeyer, NJ & Pinto, JK 1994, Managing geographic information systems, The Guildford Press, New York.
Office of Economic and Statistical Research 2005, Interstate migration, Queensland, June quarter 1981 to December quarter 2004, Queensland Treasury, viewed 1 May 2006, <http://www.oesr.qld.gov.au/queensland_by_theme/demography/migration/tables/interstate_migration.shtml>.
Office of Geographic Data Coordination 1993, GIS Strategy Report - State Government of Victoria Strategic Framework for GIS Development, Department of Treasury and Finance.
Oliver, C 1990, 'Determinants of inter-organizational relationships: integration and future directions', Academy of Management Review, vol. 15, no. 2, pp. 241-65.

References
243
Onsrud, HJ & Rushton, G 1995a, 'Sharing geographic information: an introduction', in HJ Onsrud & G Rushton (eds), Sharing geographic information, Centre for Urban Policy Research, New Brunswick, New Jersey, pp. xiii-xviii.
Onsrud, HJ & Rushton, G 1995b, 'Fundamental questions and future research', in HJ Onsrud & G Rushton (eds), Sharing Geographic Information, Centre for Urban Policy Research, New Brunswick, NJ, pp. 493-502.
Onsrud, HJ & Craglia, M 2003, 'Introduction to the special issues on access and participatory approaches in using geographic information', URISA Journal, vol. 15, no. 1, pp. 5-7.
Onsrud, HJ, Pinto, JK & Azad, B 1992, 'Case study research methods for geographic information systems', URISA Journal, vol. 1, no. 4, pp. 32-43.
Opeskin, BR 2001, 'Mechanisms for intergovernmental relations in federations', International Social Science Journal, vol. 53, no. 167, pp. 129-38.
Oxford English Dictionary Online 2005, Oxford University Press, viewed 15 January, 2004, <http://dictionary.oed.com/>.
Oxford Reference Online 2006, Oxford Paperback Thesaurus, viewed 14 March 2006, <http://www.oxfordreference.com/>.
Paull, D 2003, 'A geocoded national address file for Australia: the G-NAF what, why, who and when', paper presented to Spatial Sciences 2003, Canberra, Australia, 22-26 September, 2003.
Pfeffer, J & Salancik, G 1978, The external control of organisations: A resouce dependence perspective, Harper & Row, New York.
Pinto, JK & Onsrud, HJ 1995, 'Sharing geographic information across organisational boundaries: a research framework', in HJ Onsrud & G Rushton (eds), Sharing geographic information, Centre for Urban Policy Research, New Brunswick, New Jersey, pp. 45-64.
Prefontaine, L, Ricard, L, Sicotte, H, Turcotte, D & Dawes, SS 2000, New Models of Collaboration for Public Service Delivery - WorldWide Trends, CEFRIO.
Prefontaine, L, Ricard, L, Sicotte, H, Turcotte, D & Dawes, SS 2003, New Models of Collaboration for Public Service Delivery - Critical Success Factors of Collaboration for Public Service Delivery, CTG, viewed 1 May 2006, <http://www.ctg.albany.edu/publications/reports/new_models_wp?chapter=3>.
PSMA 2005, G-NAF, viewed 6 March 2006, <http://www.psma.com.au/datasets/g-naf>.
QSIIS Information Office 2000, Institutional Arrangements for the Property Location Index, Queensland Government, Office of Economic and Statistical Research, Brisbane.
Queensland Department of Natural Resources Mines and Water 2006, Statistical information on Queensland valuation and titling, Brisbane, May, 2006, Email.
Queensland Treasury 2005, Annual Report, Queensland Government, viewed 1 May 2006, <http://www.treasury.qld.gov.au/knowledge/docs/annual-reports/2004-05/pdf/index.shtml>.
Queensland Valuation Assessment System 2006, Estimated total unimproved valuations for Queensland properties, Department of Natural Resources, Mines and Water, Brisbane.
Rajabifard, A & Williamson, IP 2001, 'Spatial data infrastructures: concept, SDI hierarchy and future directions', paper presented to Geomatics'80, Tehran, Iran.

A Local-State Spatial Data Sharing Partnership Model to Facilitate SDI Development
244
Rajabifard, A, Feeny, M-E & Williamson, IP 2002, 'Future Directions for SDI Development.' International Journal of Applied Earth Observation and Geoinformation, vol. 4, no. 1, pp. 11-22.
Rajabifard, A, Williamson, IP, Holland, P & Johnstone, G 2000, 'From local to global SDI initiatives: a pyramid building blocks', paper presented to 4th GSDI Conference, Cape Town, South Africa.
Rajabifard, A, Feeny, M-E, Williamson, IP & Masser, I 2003, 'National SDI initiatives', in I Williamson, A Rajabifard & M-E Feeny (eds), Developing Spatial Data Infrastructures: From Concept to Reality, Taylor and Francis Ltd, London, pp. 95-109.
Rajabifard, A, Binns, A, Masser, I & Williamson, IP 2006, 'The role of sub-national government and the private sector in future spatial data infrastructures', International Journal of Geographic Information Science, vol. 20, no. 7, pp. 727-41.
Reeve, I, Marshall, G & Musgrave, W 2000, Resource Governance and Integrated Catchment Management : Issues Paper No 2, Institute for Rural Futures, Armidale, NSW.
Reichardt, M & Moeller, J 2000, 'SDI Challenges for a New Millennium NSDI at a Crossroads: Lessons Learned and Next Steps', paper presented to 4th Global Spatial Data Infrastructure Conference, Cape Town, South Africa, 13-15 March 2000.
Rhind, D 1992, 'Data access, charging, copyright and their implications for geographical information systems', International Journal of Geographic Information Science, vol. 6, no. 1, pp. 13-30.
Rhind, D 1997, Framework for the World, John Wiley and Sons, New York.
Rogers, DL & Mulford, CL 1982, 'Chapter 3 The historical development', in DL Rogers & DA Whetten (eds), Interorganisational Coordination: Theory, Research and Implementation, first edn, Iowa State University Press, Ames, Iowa, pp. 32-53.
Schermerhorn, JR 1975, 'Determinants of interorganizational cooperation', Academy of Management Journal, vol. 18, no. 4, pp. 846-56.
Schoorman, FD, Bazerman, MH & Atkin, RS 1981, 'Interlocking directorates: a strategy for reducing environmental uncertainty', Academy of Management Review, vol. 6, no. 2, pp. 243-51.
Solomon, D 1988, Australia's Government and Parliament, 7th edn, Thomas Nelson Australia, Melbourne.
Somers, R 1987, 'Geographic information systems in local government: A commentary', Photogrammetric Engineering and Remote Sensing, vol. 53, no. 10, pp. 1379-82.
State Revenue Office Victoria 2005, 2004 Annual Review, viewed 1 May 2006, <http://www.sro.vic.gov.au/sro/srowebsite.nsf/revenue/D60D4A7A752F6B97CA256F50007DC100/$File/publication-ANN-007.pdf>.
Summers, J 1985, 'Commonwealth-State Financial Relations', in D Woodward, A Parkin & J Summers (eds), Government Politics and Power in Australia, Revised edn, Longman Cheshire Pty Ltd, Melbourne, pp. 98-107.
Tashakkori, A & Teddlie, C 1998, Mixed methodology: combining qualitative and quantitative approaches, vol. 46, Applied social research methods series, Sage Publications, Thousand Oaks.

References
245
Tashakkori, A & Teddlie, C (eds) 2003, Handbook of mixed methods in social and behavioral research, Sage Publications, Thousand Oaks, California.
Tasmanian Department of Premier and Cabinet 2002, Local government partnerships, viewed July 2002 2002, <http://www.dpac.tas.gov.au/divisions/lgo/partnerships/index.html>.
Tasmanian Department of Treasury and Finance 2005, Annual Report 2004-2005, Tasmanian State Government, viewed 5 May 2006, <http://www.treasury.tas.gov.au/>.
Teddlie, C & Tashakkori, A 2003, 'Major issues and controversies in the use of mixed methods in the social and behavioral sciences', in A Tashakkori & C Teddlie (eds), Handbook of mixed methods in social and behavioral research, Sage Publications, Thousand Oaks, California, pp. 3-50.
The Australian Newspaper 2006, 'Telstra dials disaster with 000', The Australian, 14 March 2006, pp. 1-2.
Thomas, RM 2003, Blending qualitative and quantitative research methods in theses and dissertations, Corwin Press, Thousand Oaks, California.
Thompson, JD 1967, Organisations in Action, McGraw-Hill, New York.
Timpf, S & Frank, A 1997, 'Using hierarchical spatial data structures for hierarchical spatial reasoning', in S Hirtle & A Frank (eds), Spatial Information Theory - A Basis for GIS (International Conference COSIT'97), Springer-Verlag, vol. 1329, pp. 69-83.
Tomes, A 2006, Cadastral Statistics, Department of Primary Industries, Water and Environment,, Hobart.
Tosta, N 1999, 'Chapter 2: NSDI was supposed to be a verb: A personal perspective on progress in the evolution of the U.S. National Spatial data Infrastructure', in B Gittings (ed.), Integrating Information Infrastructures with GI Technology: Innovations in GIS 6, Taylor and Francis, Philadelphia.
Tulloch, D & Fuld, J 2001, 'Exploring county-level production of framework data: analysis of the national framework data survey', Journal of Urban and Regional Information Systems Association, vol. 13, no. 2, pp. 11-21.
United Nations Economic and Social Commission for Asia and the Pacific 2003, Local Government in Asia and the Pacific: A Comparative Study, viewed 30 September 2004, <http://www.unescap.org/huset/lgstudy/country/australia/australia.html>.
US Census Bureau 2002, Preliminary Report 1 - 2002 Census of Government, US Census Bureau, viewed 1 May 2006, <http://www.census.gov/govs/www/cog2002.html>.
Victorian Spatial Council 2005, Policy on Data Sharing Frameworks, viewed 2 May 2006, <http://www.nre.vic.gov.au/land/lcnlc2.nsf/alltitle/Victorian+Spatial+Council>.
Victorian Spatial Council 2006, VSC Annual Report 2004-2005, viewed 1 May 2006, <http://www.land.vic.gov.au/land/lcnlc2.nsf/alltitle/Victorian+Spatial+Council>.
Wadlow, RF 1989, 'The impact of land information systems in local government', paper presented to The 17th Australasian Conference in Urban and Regional Planning Information Systems, Perth , WA.
Walzer, N & York, L 1998, 'Public-private partnerships in U.S. cities', in N Walzer & BD Jacobs (eds), Public-private partnerships for local economic development, Praeger Publishers, Westport, pp. 47-67.
A Local-State Spatial Data Sharing Partnership Model to Facilitate SDI Development
246
Warnecke, L 1995, Geographic information/GIS institutionalization in the 50 states: users and coordinators, National Center for Geographic Information and Analysis, Syracuse, NY.
Warnecke, L, Decker, D, Pelch, L, Davis, S & Gilligan, J 2003, Statewide Leadership and Coordination of Geographic Information and Related Technology in the 50 States - NSGIC State Summaries.
Warnest, M 2005, 'A collaboration model for national spatial data infrastructure in federated countries', Doctor of Philosophy thesis, University of Melbourne.
Warnest, M, McDougall, K, Rajabifard, A & Williamson, IP 2003, 'Local and State-based collaboration: the key to unlocking the potential of SDI', paper presented to Inaugural Conference of the Spatial Sciences Institute, CD ROM, Canberra, 22-26 September, 2003.
Webb, R & Pulle, B 2002, Public Private Partnerships: An Introduction, Department of the Parliamentary Library, viewed 2006 10 April, <http://www.aph.gov.au/LIBRARY/pubs/RP/2002-03/03RP01.pdf>.
Wehn de Montalvo, U 2001, 'Strategies for SDI implementation: a survey of national experiences', paper presented to 5th Global Spatial Data Infrastructure Conference, Cartagena de Indias, Columbia, 21-25 May, 2001.
Wehn de Montalvo, U 2002, 'Mapping the determinants of spatial data sharing', paper presented to 8th EC-GI & GIS Workshop, Dublin, Ireland, July 3-5, 2002.
Wehn de Montalvo, U 2003a, 'In search of rigorous models for policy-orientated research: a behavioural approach to spatial data sharing', URISA Journal, vol. 15, no. 1, pp. 19-28.
Wehn de Montalvo, U 2003b, Mapping the determinants of spatial data sharing, Ashgate Publishing Ltd, Aldershot, England.
Whetten, DA 1982, 'Chapter 1 Objectives and issues: setting the stage', in DL Rogers & DA Whetten (eds), Interorganisational Coordination: Theory, Research and Implementation, first edn, Iowa State University Press, Ames, Iowa, pp. 3-8.
Williamson, I, Rajabifard, A & Feeny, M-E (eds) 2003, Developing Spatial Data Infrastructures: From Concept to Reality, Taylor and Francis Ltd, London.
Williamson, IP & Blackburn, JW 1985, 'Land information systems in Australasia: lessons and experiences', paper presented to 1985 AURISA National Conference (URPIS 13), Adelaide, SA.
Williamson, IP & Fourie, C 1998, 'Using the case study methodology for cadastral reform', Geomatica, vol. 52, no. 3, pp. 283-95.
Williamson, OE 1975, Markets and hierarchies: analysis and anti-trust implications, Free Press, Ney York.
Wood, DJ & Gray, B 1991, 'Towards a comprehensive theory of collaboration', Journal of Applied Behavourial Science, vol. 27, no. 2, pp. 139-62.
Yin, RK 1993, Applications of case study research, vol. 34, Applied Social Research Methods Series, Sage Publications Inc, Thousand Oaks.
Yin, RK 1994, Case study research: design and methods, 2nd edn, vol. 5, Applied social research methods series, Sage Publications, Thousand Oaks, CA.

References
247

A Local-State Spatial Data Sharing Partnership Model to Facilitate SDI Development
248

Appendix 1 – Publications Relating to Research
249
Appendix 1 – Publications Relating to Research
Appendix 1
Publications Relating to Research

A Local-State Spatial Data Sharing Partnership Model to Facilitate SDI Development
250

Appendix 1 – Publications Relating to Research
251
Appendix 1 - Publications Relating to Research
McDougall, K, Rajabifard, A & Williamson, IP 2006 (accepted), 'A Mixed Method
Approach for Evaluating Spatial Data Sharing Partnerships for SDI Development',
in H Onsrud (ed.), Research and Theory in Advancing Spatial Data Infrastructure
Concepts, ESRI Press, Redlands, CA.
McDougall, K, Rajabifard, A & Williamson, IP 2005, 'What will motivate local
governments to share spatial information?' paper presented to SSC 2005 Spatial
Intelligence, Innovation and Praxis: The national biennial Conference of the
Spatial Sciences Institute, Melbourne, Australia, 12-16 September, 2005.
McDougall, K, Rajabifard, A & Williamson, IP 2005, 'Understanding the Motivations and
Capacity for SDI Development from the Local Level', paper presented to 8th
International Conference on Global Spatial Data Infrastructures (GSDI 8), Cairo,
Egypt, 16-21 April, 2005.
Warnest, M, McDougall, K, Rajabifard, A & Williamson, IP 2003, 'Local and State-based
collaboration: the key to unlocking the potential of SDI', paper presented to
Inaugural Conference of the Spatial Sciences Institute, CD ROM, Canberra, 22-26
September, 2003.
McDougall, K, Rajabifard, A & Williamson, IP 2002, 'From little things big things grow:
building the SDI from local government up', paper presented to AURISA 2002 and
3rd Trans Tasman Surveyors Conference, Adelaide, 25-30 November 2002.

A Local-State Spatial Data Sharing Partnership Model to Facilitate SDI Development
252

Appendix 2 – Semi Structured Interview Questions
253
Appendix 2 – Semi Structured Interview Questions
Appendix 2
Semi Structured Interview Questions

A Local-State Spatial Data Sharing Partnership Model to Facilitate SDI Development
254

Appendix 2 – Semi Structured Interview Questions
255
Appendix 2 – Semi Structured Interview Questions
1. What is your current role in the data sharing operation?
2. What was the main driver for establishing the data sharing arrangements and when
and how did they first commence? What was the situation before the data share
processes?
3. What is the current status of the data sharing partnership, especially the current
number of LGAs who have signed, those in the process and the number who have
not signed? What is the period of the agreement?
4. Can you provide me a copy of a sample data share agreement?
5. Does the data sharing initiative have a specified project manager or a project
management structure? Please explain the management processes.
6. What are the responsibilities of each partner?
7. Do you have any performance monitoring processes in place and if so please
explain how they work?
8. Which group is responsible for the processing and matching of the shared data?
Do the updated data sets get returned to the original custodians? Who are the
custodians of the various data sets?
9. How do you communicate with local governments and what is the frequency of the
communication?
10. Can you describe the level of trust between your state government and the local
government?
11. How many staff are involved in the negotiation, management and processing of
exchanged data within this particular partnership?
12. Has there been or is it intended to have a review of the project or operations?
13. What is the relationship between this project and other projects?
14. How do you rate the issue of standards and technological issues which relate to the
exchange of data?
15. What is the current state government on the pricing and access to spatial
information and are there any changes intended?
16. What are the major business drivers for the state government to engage in the data
sharing partnerships?
17. Are there any governance arrangements in place for the partnership?
18. What have been the key benefits and issues in the development and operation of
the data sharing partnership? eg resources, technical, policy, people

A Local-State Spatial Data Sharing Partnership Model to Facilitate SDI Development
256

Appendix 3 - Local Government Questionnaire
257
Appendix 3 - Local Government Questionnaire
Appendix 3
Local Government Questionnaire

A Local-State Spatial Data Sharing Partnership Model to Facilitate SDI Development
258

Appendix 3 - Local Government Questionnaire
259
Appendix 3 – Local Government Questionnaire Understanding Spatial Data Sharing Arrangements Between Local and State Government Centre for Spatial Data Infrastructures and Land Administration Department of Geomatics, The University of Melbourne Department of Geomatics The University of Melbourne Victoria 3010 Australia Background Accurate and reliable spatial information relating to property is now fundamental to the business of local and state governments. Increasingly, spatial information is also used routinely in many private sector activities. The integration and amalgamation of data from both local and state governments are essential if the vision of a state and national spatial data infrastructure (NSDI) is to be achieved. Initiatives such as the Geocoded National Address File (G-NAF) rely on the close cooperation and exchange of data from local to state levels. Local government, in particular, is a critical source of accurate and detailed information on property and are custodians of a number of key data sets including street address. Emergency services and other agencies are increasingly dependent access to this data. The political and institutional relationships between state and local government have, and will, continue to be challenging. However, in recent years significant progress towards the access to, and quality of, this data has been achieved in the interests of the whole community through cooperative efforts from both levels of government. The questionnaire will assist investigation of the barriers and impediments that are limiting the potential of integration and sharing of spatial data from the local government perspective. It will also extend understanding of business drivers for data sharing by local governments and identify types of data sharing arrangements better suited to the local government environment. The findings of the survey will improve insight into how future data sharing initiatives should be structured, managed and sustained. These findings will be presented as aggregated statistical summaries and will be accessible to survey participants and distributed through publications. The survey should take approximately 20 minutes to complete. Confidentiality of individuals will be fully preserved in the collection and reporting of the results. I thank you in advance for your cooperation in providing this valuable information. Kevin McDougall PhD Candidate, University of Melbourne Telephone: +61 7 46312545 Fax: +61 7 46312526 Email: [email protected]
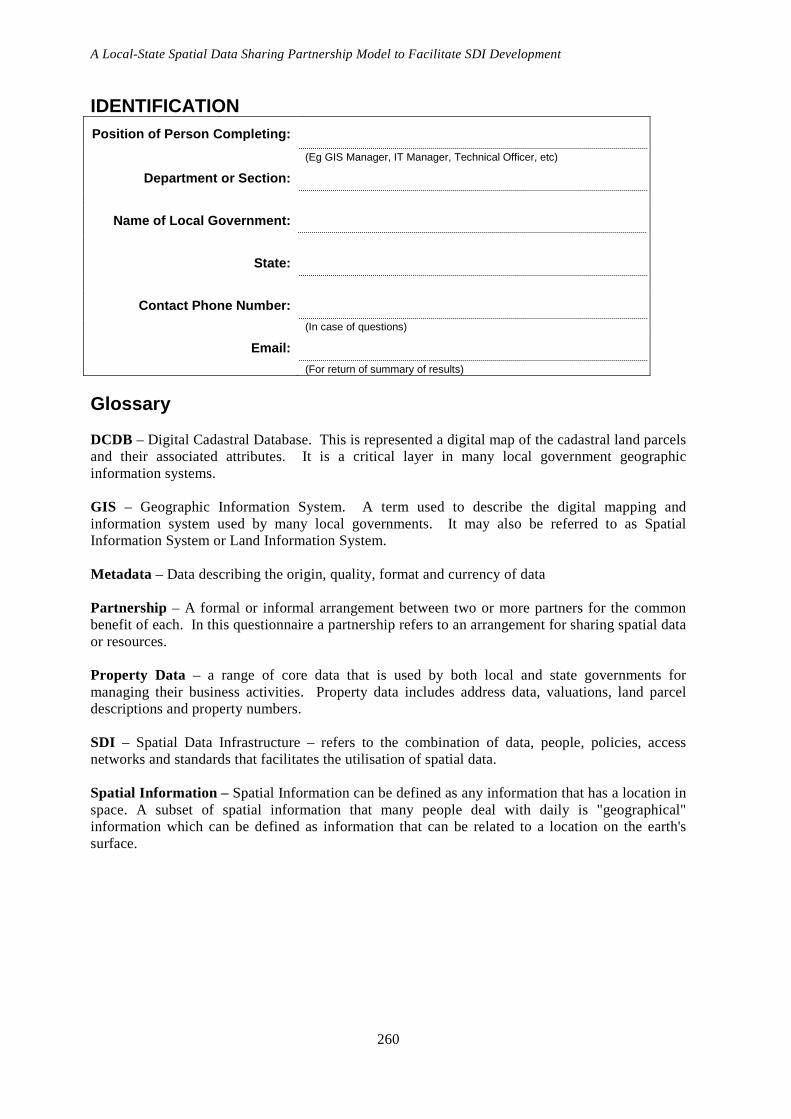
A Local-State Spatial Data Sharing Partnership Model to Facilitate SDI Development
260
IDENTIFICATION Position of Person Completing:
(Eg GIS Manager, IT Manager, Technical Officer, etc)
Department or Section:
Name of Local Government:
State:
Contact Phone Number:
(In case of questions)
Email:
(For return of summary of results)
Glossary DCDB – Digital Cadastral Database. This is represented a digital map of the cadastral land parcels and their associated attributes. It is a critical layer in many local government geographic information systems. GIS – Geographic Information System. A term used to describe the digital mapping and information system used by many local governments. It may also be referred to as Spatial Information System or Land Information System. Metadata – Data describing the origin, quality, format and currency of data Partnership – A formal or informal arrangement between two or more partners for the common benefit of each. In this questionnaire a partnership refers to an arrangement for sharing spatial data or resources. Property Data – a range of core data that is used by both local and state governments for managing their business activities. Property data includes address data, valuations, land parcel descriptions and property numbers. SDI – Spatial Data Infrastructure – refers to the combination of data, people, policies, access networks and standards that facilitates the utilisation of spatial data. Spatial Information – Spatial Information can be defined as any information that has a location in space. A subset of spatial information that many people deal with daily is "geographical" information which can be defined as information that can be related to a location on the earth's surface.

Appendix 3 - Local Government Questionnaire
261
Part 1 – Your Organisation This part of the questionnaire examines your local government as a whole and also your organisational unit (eg Geographic Information System unit or section). Q1a: Approximately how many properties are contained within your local government area? ………. Q1b: What is the total number of staff employed within your local government? …….. Q1c: Overall how would you classify your organisation’s information and communication technology (ICT) infrastructure and capacity (ie networked computers, digital databases, electronic communication) � Very poor � Poor � Adequate � Good � Excellent Q1d: Does the organisation’s web site provide a portal for e-business activities eg paying rates, dog registration and library?
� yes � no � in the process of building these applications
What other e-business services are available over the web? ………………………………………………….. Q1e: Does your local government use a Geographic Information System (GIS) to assist in property or asset management?
� Yes � No � In the process of establishing
Q1f: Where is the GIS unit or person managing the GIS located within your organisation?
� Community Services Department � Engineering/Works Department � Planning Department � Corporate Services/IT Department � Independent Geographic Information System (GIS) Unit � No GIS Unit – use a consultant where required � Other please describe …………………………………….
Q1g: How many Full Time Equivalent (FTE) staff work within your GIS unit? ……………. Q1h: Which best describes your GIS unit’s operations
� an independent unit that provides core spatial data to support the council’s business activities
� an independent unit that services a small number of spatial information users in addition to some core data support
� None of above, please elaborate ……………………………. Q1i: How long has your local government had a GIS unit for managing geographic or spatial information?
� Less than 3 yrs � 4-6 yrs � 7-10 yrs � 11-15 yrs � More than 15 yrs � Does not have a defined GIS unit

A Local-State Spatial Data Sharing Partnership Model to Facilitate SDI Development
262
Q1j: How would you classify the level of management support that the GIS unit receives within the organisation? � No Support � Limited Support � Satisfactory Support � Good Support � Very Good Support Q1k: The geographic information system is well resourced within the organisation � Strongly Disagree � Disagree � Neither � Agree � Strongly Agree Other Comments: …………………………………………………………………………………………………………………………………………………………………………………………………………………………………………………………………………………………………………………………………………………………………………………………………………………………………………………..
Part 2 - Policy on Use of Spatial Data This part of the questionnaire examines your local government’s policies regarding access and pricing of spatial data. Q2a: Internal users e.g council employees are required to sign a formal license agreement before GIS or spatial data before it will be provided. � Always � Most of the time � Sometimes � Rarely � Never Q2b: External users e.g developers, consultants, etc are required to sign a formal license agreement before GIS or spatial data before it will be provided. � Always � Most of the time � Sometimes � Rarely � Never Q2c: Restrictions are placed on the use of council’s spatial data � Always � Most of the time � Sometimes � Rarely � Never Q2d: Council’s current information policies encourages the use of your organisation’s spatial data by council staff � Strongly Disagree � Disagree � Neither � Agree � Strongly Agree Q2e: Council’s current information policies encourages the use of your organisation’s spatial data by external users or organisations . � Strongly Disagree � Disagree � Neither � Agree � Strongly Agree Q2f: Does your organisation expect to recover revenue when you provide spatial data to external users?
� no, rarely charge for data � yes, cost of provision only � yes, seek to recover some costs � yes, full cost recovery
Q2g: Does your organisation generally charge state government agencies when you provide them with spatial data?
� yes � no

Appendix 3 - Local Government Questionnaire
263
Q2h: Legal liability is limiting your council in providing external access to your spatial data e.g. concerns over accuracy or reliability � Strongly Disagree � Disagree � Neither � Agree � Strongly Agree Q2i: State government copyright limits your council in providing external access to digital spatial data products generated from your GIS � Strongly Disagree � Disagree � Neither � Agree � Strongly Agree Q2j: Privacy issues are limiting your council in providing external access to your spatial data � Strongly Disagree � Disagree � Neither � Agree � Strongly Agree Other Comments: …………………………………………………………………………………………………………………………………………………………………………………………………………………………………………………………………………………………………………………………………………………………………………………………………………………………………………………..
Part 3 – Access to Spatial Data This area of the questionnaire will examine your organisation’s arrangements for accessing spatial data. Q3a: What is the most common way for internal users find the mapping and spatial information they need?
� ringing up and asking your office � via the inhouse GIS system � using the internet or external data directory � other, please specify……………………………………
Q3b: What is the most common way external clients find the mapping and spatial information they need?
� ringing up and asking your office � using an external data directory � using the internet eg web map of your GIS � other, please specify……………………………………….
Q3c: Staff across council have a good knowledge regarding what spatial information you hold � Strongly Disagree � Disagree � Neither � Agree � Strongly Agree Q3d: What percentage of your council’s staff access the GIS on a regular basis?
� <5% � 5-10% � 10-20% � 20-30% � 30-40% � 40-50% � 50-60% � 60-70% � 70-80% � 80-90% � >90%

A Local-State Spatial Data Sharing Partnership Model to Facilitate SDI Development
264
Q3e: Does your council provide external users with access to spatial data via the internet ie web mapping/GIS?
� yes, please provide web address………………………………………………………. � no � under development
Q3f: Recent developments in technology have made your Council’s data more accessible.
� Strongly Disagree � Disagree � Neither � Agree � Strongly Agree Q3g: Making your council’s spatial data more accessible to external clients , through mechanisms such as the internet facilitates Council’s business.
� Strongly Disagree � Disagree � Neither � Agree � Strongly Agree Other Comments: …………………………………………………………………………………………………………………………………………………………………………………………………………………………………………………………………………………………………………………………………………………………………………………………………………………………………………………..
Part 4 – Use of Spatial Data This part of the questionnaire will examine the acquisition and management of spatial data, particularly property related data. Q4a: How important is property related data (street address, valuation, lot/plan number, property ID and DCDB) to your organisation’s day to day business operations? � Not important � Marginally important � Neutral � Important � Very Important Q4b: Is all of your property information in digital form?
� yes � more than 50% � less than 50% � none
Q4c: Which of the following property related data sets does your organisation obtain from State government agencies?
� valuation data � Digital Cadastral Database (DCDB) � topographic (contours or DEM) � digital orthophotos/aerial photos � planning related data � Other pleas specify………………………..
Q4d: State government property related data required by your organisation is easily sourced from the relevant state departments � Strongly Disagree � Disagree � Neither � Agree � Strongly Agree Comments………………………………………………………………………….

Appendix 3 - Local Government Questionnaire
265
Q4e: The costs to acquire State government data sets is acceptable � Strongly Disagree � Disagree � Neither � Agree � Strongly Agree Q4f: Restrictions placed the use of data obtained from the State government agencies are acceptable � Strongly Disagree � Disagree � Neither � Agree � Strongly Agree Q4g: Which are the most common organisations requesting street address and property information?
� state transport authorities � emergency services (fire, police and ambulance) � State lands and valuation departments � state health authorities � non-government agencies (NGOs) eg Landcare � developers or private industry � State local government and planning department � Other please specify………………………
Q4h: Approximately how many requests per month would you receive from State government agencies for property data? ………… Q4i: Describe the level of completeness/maturity of the following digital data: Data Set Non
Existent (1)
Very Incomplete
(2)
Partially complete
(3)
Mostly complete
(4)
Fully complete
(5) Property address and lot/plan
Valuation data Cadastral boundaries (DCDB)
topography (contours or DTM)
engineering assets (water, sewerage, roads, drainage)
Planning related data –zoning, development control plans
Community and related services –clubs, parks etc
Other Comments: …………………………………………………………………………………………………………………………………………………………………………………………………………………………………………………………………………………………………………………………………………………………………………………………………………………………………………………..
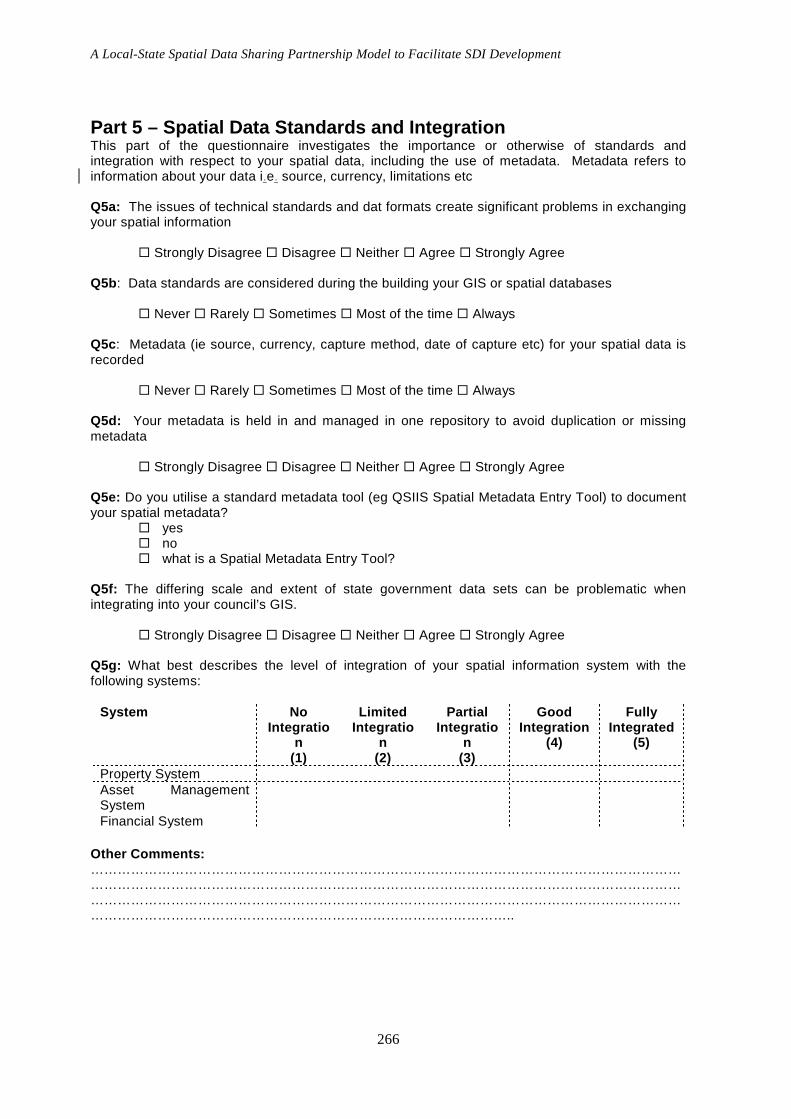
A Local-State Spatial Data Sharing Partnership Model to Facilitate SDI Development
266
Part 5 – Spatial Data Standards and Integration This part of the questionnaire investigates the importance or otherwise of standards and integration with respect to your spatial data, including the use of metadata. Metadata refers to information about your data i.e. source, currency, limitations etc Q5a: The issues of technical standards and dat formats create significant problems in exchanging your spatial information � Strongly Disagree � Disagree � Neither � Agree � Strongly Agree Q5b: Data standards are considered during the building your GIS or spatial databases � Never � Rarely � Sometimes � Most of the time � Always
Q5c: Metadata (ie source, currency, capture method, date of capture etc) for your spatial data is recorded � Never � Rarely � Sometimes � Most of the time � Always Q5d: Your metadata is held in and managed in one repository to avoid duplication or missing metadata � Strongly Disagree � Disagree � Neither � Agree � Strongly Agree Q5e: Do you utilise a standard metadata tool (eg QSIIS Spatial Metadata Entry Tool) to document your spatial metadata?
� yes � no � what is a Spatial Metadata Entry Tool?
Q5f: The differing scale and extent of state government data sets can be problematic when integrating into your council’s GIS. � Strongly Disagree � Disagree � Neither � Agree � Strongly Agree Q5g: What best describes the level of integration of your spatial information system with the following systems:
System No Integratio
n (1)
Limited Integratio
n (2)
Partial Integratio
n (3)
Good Integration
(4)
Fully Integrated
(5)
Property System Asset Management System
Financial System Other Comments: …………………………………………………………………………………………………………………………………………………………………………………………………………………………………………………………………………………………………………………………………………………………………………………………………………………………………………………..

Appendix 3 - Local Government Questionnaire
267
Part 6 – About People Q6a: Please identify the number of staff in the GIS unit for each of the following academic qualifications: High School Certificate …………… Associate Diploma or Certificate ………. Degree ……………………… Postgraduate Qualification ………… Q6b: During the last 5 years the staff turnover in your GIS unit has been. � Very Low � Low � Neutral � High � Very High Q6c: During the past 5 years staff numbers in your GIS unit have
� decreased � remained about the same � Increased
Q6d: During the past 5 years restructuring within the your local government has been � Minimal � Minor � Neither � Significant � Major Q6e: Staff within the organisational unit regularly have the opportunity to update their skills through seminars, conferences, short courses or formal education � Strongly Disagree � Disagree � Neither � Agree � Strongly Agree
Other Comments: …………………………………………………………………………………………………………………………………………………………………………………………………………………………………………………………………………………………………………………………………………………………………………………………………………………………………………………..
Part 7 – Partnerships and Collaborations This area of the questionnaire will look at your organisation’s collaboration with other organisations or groups. Q7a: How would you rate the level of collaboration or cooperation of your local government with respect to data or resource sharing with the following organisations?
Organisation Very Poor (1)
Poor
(2)
Moderate
(3)
Good
(4)
Very Good
(5) Other local governments eg within a region of councils (ROCs)
State government departments or agencies
Commonwealth government agencies
Non government organisations (NGOs) eg Landcare
Private sector organisations Educational Institutions ie Universities
Your local government or municipal association

A Local-State Spatial Data Sharing Partnership Model to Facilitate SDI Development
268
Q7b: In general, have the partnerships or collaboration for sharing of data or resources resulted in:
� Greater benefit to the other organisation � Approximately equal benefit to both organisations � Greater benefit to your organisation
Q7c: The exchange/sharing of spatial data is necessary for council to meet its business needs � Strongly Disagree � Disagree � Neither � Agree � Strongly Agree Q7d: How do you rate the importance of the following obstacles/barriers to collaborating with state government agencies for data exchange/sharing? Obstacles/Barrier Not
important (1)
Limited Importance
(2)
Moderate Importance
(3)
Important
(4)
Very Important
(5) Data sets being exchanged are not of equal value
Data standards Lack of trust or goodwill Lack of management or political support
Cost/price of data Finding and accessing suitable data
Legal liability for Council Copyright restrictions Privacy of data Time and effort required to establish agreements
IT communication/ network infrastructure
Other please specify ……………………………
Q7e: Rate the following benefits and/or business drivers for your local government in establishing data sharing/exchanging spatial data with other agencies:
Benefit/Business Driver
Not important
(1)
Limited Importance
(2)
Moderate Importance
(3)
Important
(4)
Very Important
(5) Improved quality of data ie data matching and checking
Less duplication of effort and resources
Cost savings Single authoritative source of data
Reduced requests of data by other authorities
Improved service to rate payers
Better decision making Other please specify ……………………

Appendix 3 - Local Government Questionnaire
269
Q7f: What types of spatial data collaborations has your organisation been involved with state government ? (tick all collaborations) � mapping projects � DCDB upgrade project � survey control network project � Valuation update/matching � Street address matching � Others please specify…………………….. Q7g: Your organisation’s technical capacity to implement data exchange and sharing with a state government agency is: � Very poor � Poor � Adequate � Good � Excellent Q7h: What are the most common types of formal agreements entered into when you collaborate with other organisations to share data or resources? � License Agreement � Memorandum of Understanding � Service Level Agreement � Contract � Partnership Agreement � Other………………….. Q7i: What is the most common duration of collaborations with other organisations to share data or resources? � Short term (less than 1 year) � Medium Term ( up to 3 years) � Long term (ongoing) Q7j: A system of equal exchange of useful spatial data is preferable to each organisation charging each other. For example exchanging address data for DCDB. � Strongly Disagree � Disagree � Neither � Agree � Strongly Agree Q7k: Which of the following coordination/exchange models would your council prefer for the exchange of spatial data between state and local government? � Coordination by an individual state government agency through a direct data exchange
arrangement or partnership with councils � Coordination, collection and warehousing of council data through your local government
association (LGA, MAV etc) and then exchanged with the state government agency � Coordination, collection and warehousing of council data through the Regions of Councils
(ROCs) and then exchanged with the state government agency � Coordination by an individual state government agency but collection and warehousing from
councils by a private sector company on behalf of the state government Q7l: Are there any departments or areas in your council that you would consider to have consistently good data exchange and collaboration arrangements with state government agencies? ……………………………………………………………………. Other Comments on data sharing/exchange with local government: …………………………………………………………………………………………………………………………………………………………………………………………………………………………………………………………………………………………………………………………………………………………………………………………………………………………………………………..

A Local-State Spatial Data Sharing Partnership Model to Facilitate SDI Development
270
Part 8 – Specific Data Sharing Partnerships This part of the questionnaire examines your experiences, where appropriate, in a partnership data sharing arrangement, namely the Property Information Project (PIP) in Victoria, the Property Location Index (PLI) in Queensland or the Land Information System Tasmania (LIST) in Tasmania. Q8a: Are you currently or have previously signed up to the partnership agreements for sharing address and property information to state government? If yes identify the agreement.
� Yes …. o PIP (Victoria) o PLI (Queensland) o LIST (Tasmania) continue to question 8c
� No
Q8b: If the answer to the question above was No, then please indicate why your organisation didn’t sign up to the partnership
o no financial incentive o did not have a business need o lack of trust o lack of technical capability o time o poor negotiation/communication o Other, please specify …………………….
Q8c: The data sharing arrangement has been worthwhile for the organisation � Strongly Disagree � Disagree � Neither � Agree � Strongly Agree Q8d: The data sharing arrangement has improved the quality of the organisation’s property database � Strongly Disagree � Disagree � Neither � Agree � Strongly Agree Q8e: The partnership arrangement provides equal benefit to both your local government and the state government. � Strongly Disagree � Disagree � Neither � Agree � Strongly Agree Q8f: In comparison to the effort/resourcing/costs put in by your organisation for the data sharing arrangement, do you consider your efforts to be: � Much less valuable than the state government contribution � Less valuable than the state government contribution � About the same � More valuable than the state government contribution � Much more valuable than the state government contribution Q8g: Your organisation receives regular updates of matched data from the state government to facilitate the improvement of your databases. � Always � Most of the time � Sometimes � Rarely � Never Q8h: The frequency of communication and contact during the term of the agreement was satisfactory � Strongly Disagree � Disagree � Neither � Agree � Strongly Agree

Appendix 3 - Local Government Questionnaire
271
Q8i: What has been your overall level of satisfaction with the partnership? � Very unsatisfied � Mostly unsatisfied � Neither � Mostly Satisfied � Very Satisfied Q8j: What mechanisms would you like to see implemented to improve collaboration between state and local governments? ………………………………………………………………………………………. Other Comments: ………………………………………………………………………………………………………………………………………………………………………………………………………………………………………………………………………………………………………………………………………………………………………………………………………………………………………………….. Thank you for taking the time to complete the quest ionnaire

A Local-State Spatial Data Sharing Partnership Model to Facilitate SDI Development
272

Appendix4 – Open Ended Questionnaire Responses
273
Appendix4 – Open Ended Questionnaire Responses
Appendix 4
Open Ended Questionnaire Responses

A Local-State Spatial Data Sharing Partnership Model to Facilitate SDI Development
274

Appendix4 – Open Ended Questionnaire Responses
275
Appendix 4 – Open Ended Questionnaire Responses
Case Summaries – Part 1 Comments on Organisation and Resourcing Case# Part 1 comments
1 As the GIS system is still in the process of being implemented, limited resources have been allocated.
4 The GIS must deliver business value in order to sustain management support and a level of funding that is required. Budget is closely scrutinised as part of the overall ICT spend
8 We are just adequately resourced for maintaining existing systems. Additional resources are required to make improvements to systems, replace legacy systems, update technologies etc.
9 Loadings on some divisional staff is high.
11 By delivering business focused outcomes over the last decade GIS has been integrated into the main decision making process of most Council functions - this why the funding is good
12 I feel, that GIS is not fully appreciated and/or understood by Council; consequently it is not utilised to its fullest extent
16 Primarily, GIS within Council suffers due to the lack of a full time officer able to do the day to day things, but also provide strategic guidance.
20 Could use an extra staff member so that time can be spent on the existing system so that it can be expanded and improved. All current time spent on maintaining the status quo and slowly falling behind.
24 Agree due to the maturity of GIS within ICC. We are well resourced for the maintenance activities that is carried out for the support of GIS within ICC.
28 Resourced in line with budgetary constraints of small LG
30 Although staff and managers insist that GIS is crucial to their business, they don’t want to invest a lot of money in it. They rather spend their limited budgets on their own areas of interest within their Branch. This often causes resourcing issues for GIS because Managers often under-estimates the GIS component of a project even when we provide then with realistic expectations.
32 organisational location of GIS is currently under review - this issue has been hanging for some time
34 need to purchase data capture equipment (GPS units, pda's) to help maintain data integrity
38 Adequate resourcing has only happened recently after a great deal of confidence building by the GIS team. The major impediment to this has been the historical practice of recruiting staff from within Council leading to a very insular view of what GIS was all about and what it could actually do.
41 While the core GIS business unit is well located and well resourced within IT, other business units have their own GIS assets. Eg: The Corporate Asset Information Team belongs to 'Finance' and operates the Asset Data Capture team. 'Planning & Policy' operate a Spatial Analysis Unit. All of these are service clients of the Spatial and Asset Systems team, which maintains the geodatabases, infrastructure and the website.
46 "The GIS resides in the following configuration - Corporate Services, Corporate Information & Support, Land information. The Unit is not part of IT.
55 Impossible for one person to update our own cadastre as well as most other layers and admin tasks of GIS officer. However we do have a Hydraulics GIS person in another department adding in hydraulics (independently!)
57 There are always additional products that could be provided, or data to be collected, to assist officers with their work and so additional resources are always being sought. Also, continual technological and software improvements mean upgrades are regularly sought.
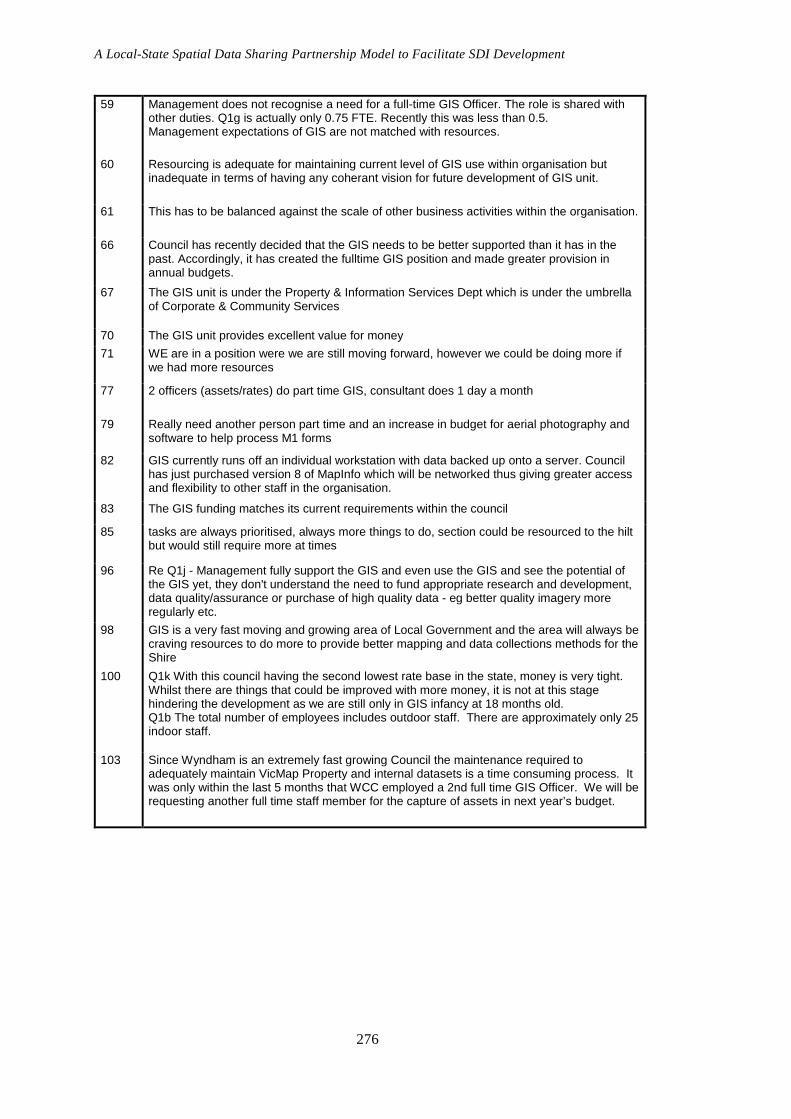
A Local-State Spatial Data Sharing Partnership Model to Facilitate SDI Development
276
59 Management does not recognise a need for a full-time GIS Officer. The role is shared with other duties. Q1g is actually only 0.75 FTE. Recently this was less than 0.5. Management expectations of GIS are not matched with resources.
60 Resourcing is adequate for maintaining current level of GIS use within organisation but inadequate in terms of having any coherant vision for future development of GIS unit.
61 This has to be balanced against the scale of other business activities within the organisation.
66 Council has recently decided that the GIS needs to be better supported than it has in the past. Accordingly, it has created the fulltime GIS position and made greater provision in annual budgets.
67 The GIS unit is under the Property & Information Services Dept which is under the umbrella of Corporate & Community Services
70 The GIS unit provides excellent value for money
71 WE are in a position were we are still moving forward, however we could be doing more if we had more resources
77 2 officers (assets/rates) do part time GIS, consultant does 1 day a month
79 Really need another person part time and an increase in budget for aerial photography and software to help process M1 forms
82 GIS currently runs off an individual workstation with data backed up onto a server. Council has just purchased version 8 of MapInfo which will be networked thus giving greater access and flexibility to other staff in the organisation.
83 The GIS funding matches its current requirements within the council
85 tasks are always prioritised, always more things to do, section could be resourced to the hilt but would still require more at times
96 Re Q1j - Management fully support the GIS and even use the GIS and see the potential of the GIS yet, they don't understand the need to fund appropriate research and development, data quality/assurance or purchase of high quality data - eg better quality imagery more regularly etc.
98 GIS is a very fast moving and growing area of Local Government and the area will always be craving resources to do more to provide better mapping and data collections methods for the Shire
100 Q1k With this council having the second lowest rate base in the state, money is very tight. Whilst there are things that could be improved with more money, it is not at this stage hindering the development as we are still only in GIS infancy at 18 months old. Q1b The total number of employees includes outdoor staff. There are approximately only 25 indoor staff.
103 Since Wyndham is an extremely fast growing Council the maintenance required to adequately maintain VicMap Property and internal datasets is a time consuming process. It was only within the last 5 months that WCC employed a 2nd full time GIS Officer. We will be requesting another full time staff member for the capture of assets in next year’s budget.

Appendix4 – Open Ended Questionnaire Responses
277
Case Summaries – Part 2 Comments on Information Policy Case# P2 comments
4 Council has a privacy policy that does restrict access to some personal details and those spatial categories that are for BCC's own planning purposes. Information is made available that constitutes a value proposition for external customers. External customers are after a tailored service that suits their limited knowledge of the data
9 There are specific data sets which are considered private data and therefore judgement is made on each request as to what can be provided.
10 Ownership information is not displayed to external users
11 By providing information in easily acceptable formats with good metadata the risk is significantly reduced
13 We provide general services information - with disclaimers. Normally don't provide any ownership details if data is handed out
16 withy the new licensing agreement signed by Council and NR&M for the DCDB and Addressing information, most previous constraints have been removed.
20 Fees are aimed at recovering costs to some extent for expensive obtained datasets that have been included as a Council budget item. These datasets include the like of orthophotos and contour data.
24 Legal liability, copyright and privacy issues are covered by the institutional arrangements and data agreements that Council has employed or entered into with the State Govt etc.
29 Funding limits the accuracy therefore the access
30 Councils IT strategic Plan is limiting this organisation in providing external access to our spatial data, eg, there is resistance to having a public access web application.
31 Some spatial data is restricted, but mainly due to reliability. Most problems relate to Attribute data (names etc). Although no formal legislation precludes release of this info Council feels it has a moral obligation not to divulge certain info.
32 Information policy relating to spatial data not formalised. (or at least not well communicated!)
38 Q2f: When external clients are doing work for Council the data is provided free of charge. Q2g: Yes, because we are required to pay them for data.
44 While access and copyright issues provide some restrictions there remains ample room for transactions outside these restricted areas.
46 Neither agree or strongly disagree answers - The use of spatial data is not part of the information policy and TCC doesn't use the State DCDB nor do we use the States information in product generation.
56 All employees are subject to an agreement that covers the use of IT infrastructure and data. This includes the GIS.
59 Council is currently working on an information policy. Service Level Agreement states that data supplied to a third party cannot be used for commercial gain.
60 Council has no formal information policy.
64 Generally data is not supplied to customers externally because we do not have an Intranet enabled GIS. Plans are in place for this to occur.
70 Technology and budget issues are probably the limiting factors for providing GIS externally
74 Q 2b groups all external users as one. We treat developers and consultants very differently. If a consultant is working on a project for us then they are given access to the data they need to complete the work for us. Developers, real estate agents and others with a commercial interest are treated very differently. We charge them for data that is ours and if they need State gov't data then they must get it from the State gov't not from us.
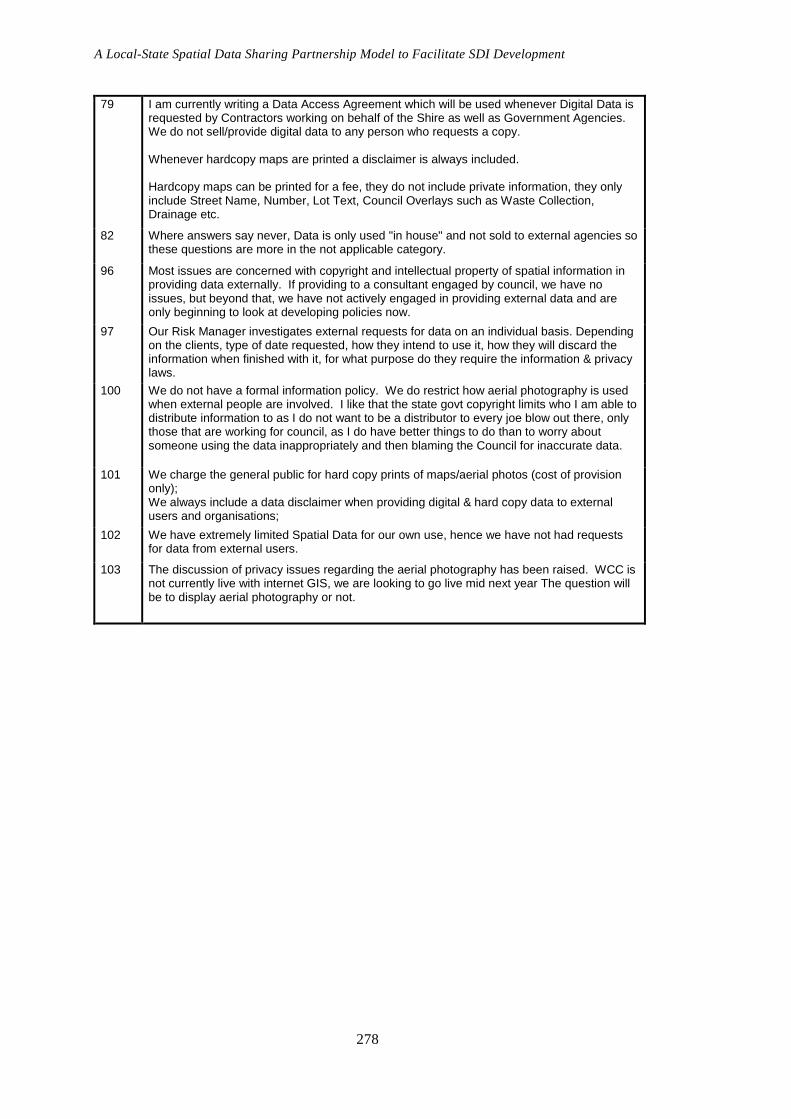
A Local-State Spatial Data Sharing Partnership Model to Facilitate SDI Development
278
79 I am currently writing a Data Access Agreement which will be used whenever Digital Data is requested by Contractors working on behalf of the Shire as well as Government Agencies. We do not sell/provide digital data to any person who requests a copy. Whenever hardcopy maps are printed a disclaimer is always included. Hardcopy maps can be printed for a fee, they do not include private information, they only include Street Name, Number, Lot Text, Council Overlays such as Waste Collection, Drainage etc.
82 Where answers say never, Data is only used "in house" and not sold to external agencies so these questions are more in the not applicable category.
96 Most issues are concerned with copyright and intellectual property of spatial information in providing data externally. If providing to a consultant engaged by council, we have no issues, but beyond that, we have not actively engaged in providing external data and are only beginning to look at developing policies now.
97 Our Risk Manager investigates external requests for data on an individual basis. Depending on the clients, type of date requested, how they intend to use it, how they will discard the information when finished with it, for what purpose do they require the information & privacy laws.
100 We do not have a formal information policy. We do restrict how aerial photography is used when external people are involved. I like that the state govt copyright limits who I am able to distribute information to as I do not want to be a distributor to every joe blow out there, only those that are working for council, as I do have better things to do than to worry about someone using the data inappropriately and then blaming the Council for inaccurate data.
101 We charge the general public for hard copy prints of maps/aerial photos (cost of provision only); We always include a data disclaimer when providing digital & hard copy data to external users and organisations;
102 We have extremely limited Spatial Data for our own use, hence we have not had requests for data from external users.
103 The discussion of privacy issues regarding the aerial photography has been raised. WCC is not currently live with internet GIS, we are looking to go live mid next year The question will be to display aerial photography or not.

Appendix4 – Open Ended Questionnaire Responses
279
Case Summaries – Part 3 Comments on Technology and Ac cess Mechanisms
Case# P3 comments
4 OGC standards and broader channels of communication are increasingly providing opportunities to share and access data externally
8 Q3f - Rather than recent technology developments making data more accessible, recent implementation of existing technologies has improved access to internal staff.
9 It will free up resources otherwise managing these requests and simplify our customers interface with us.
11 we have had all access to data on the web since 1999 - this is not recent in terms of technology
12 So far Council has only put maps of the Draft Planning Scheme on the web ( http://www.cooktowns.com/)
13 Our long term goal is to have a system using the internet
20 expected to reduce the smaller and time consuming queries of where a Council asset is in my property etc
30 When we are all working from the same base mapping it does greatly assist collaboration between external clients and Council.
34 Currently working with MapInfo software product of "Exponare" which may enable council to allow public access via the internet
40 In the process of going on line for spatial data and Council information.
41 Making common property-based data freely available to the public via web-mapping has resulting in a sharp decline in ad-hoc queries and resulted in significant savings on staff time.
44 Q3g is not complete.
46 Townsville City Council's Land Information Unit has 2 mapping products on the internet - Community and Commerical (ID and password is need to access as well as signing an agreement.
48 IT Dept security concerns are a hurdle.
56 We have been capturing data on system usage for over 6 years. Per month, we see 150+ distinct users of the system. The 40-05% of council staff refers to the 300 office staff; it does not take into account the work crews. This organisation has not made use of web mapping and other "latest" technologies.
59 Q3f - Only to Council indoor staff Much room for improvement.
60 Unlikely for such a development to be funded at current time (i.e. training for, setting up, and maintaining such a system)
67 We do not own the copyright for aerials and will not be putting them on the internet in the future. This is a powerful layer of data and I believe that this information should not be on the internet due to privacy.
70 Since there are state govt web sites like land.vic.gov.au, we encourage people to access these as Council provides information to these sites on a regular basis.
72 Regarding Internet Access, some static maps only on our internet site, also links to virtual map for finding location of local business and places of interest.
97 The main purpose of our GIS is to assist our internal customers only. We a very careful when issuing data to external customers because of privacy and accuracy of the data.

A Local-State Spatial Data Sharing Partnership Model to Facilitate SDI Development
280
100 Q3d - that’s 50-60% of indoor staff Q3e - for external non-staff uses I might point them in the direction of the land channel for something simple. For external staff or those operating from home who would normally have access if they were in the office they are able to access things remotely. Q3g We are not at a point where we are ready to do that, I know it will help, but the infrastructure up here for external users is no where near the quality or the extent that is experienced in other regional areas. Certainly if some of the external clients accessed some of the basic information over the internet, it may well prevent them from contacting Council in the first place.

Appendix4 – Open Ended Questionnaire Responses
281
Case Summaries – Part 4 Comments on Use and Capacity of Spatial Data
Case# P4 comments
1 Everything is still in the research and gather stage
8 Particularly with the Topography data, it is reasonably complete but of poor quality.
9 A major active concurrent project relating to Asset Management will address completeness of the asset data within our property data.
11 We have a complete (internal/external) digital lodgement process for all infrastructure, environmental, terrain and cadastral information. this was instigated in 1993
16 in the scheme of things council has a lot of data, although there is a high level of inaccuracy in some data sets – contours, specific land uses (units, clubs, etc)
33 Council is in the process of accurately resurveying the DCDB and supplying the data to NRM under a data sharing arrangement. Project 70% completed.
34 Lot/Plans supplied with monthly DCDB update, street number & road name address incomplete due to being a mostly rural shire
38 Q4i: The requests for property information are handled by various Depts.
44 Q4h: quoted as "0" due to existing data share agreements with State Gov. Q4i: items quoted as "Non existent" are because they are externally sourced by other organisations as a part of share agreements.
46 Please refer to other comments with reference to DCDB and contour datasets.
55 We hold lots of old outdated titles in our property database (not GIS). Other datasets listed, whilst complete, are inaccurate, spatially mismatched and all relative to our homegrown cadastre of unknown/variable accuracy.
56 Council suppied to the state government weekly updates of the cadastral framework. The supply of data between the council and state is subject to a data share agreement which excludes charging for data where that data is used for internal operations. Council operations are dependant upon complete, up to date DCDB and infrastructure datasets.
57 Complete means under constant maintenance and upgrade egg some drainage MHs do not have invert levels (<1%)
59 Council owned infrastructure i.e. water, sewer, storm water in need of attention. Adequate data not always available. Requests for street numbers from State Govt is on increase in attempt to fill gaps.
60 There are often time lags in the order of months involved between change of address/owner/valuation/boundary details and update of GIS cadastre layer. Accuracy issues exist in the layers associated with Engineering assets and these are fixed in an on-going fashion as resources allow.
62 Assets are in databases, but not mapped spatially
67 Contract valuers use a combination of our cadastral data and compile the valuation data. Have Topo data from state govt but obtaining more accurate in early 2006. Link property data to rates data base.
75 ...of data we maintain (non existent is maintained via PIP agreement)
85 recently moved from one GIS system to another, some old unreliable data has not been converted and will need to be recaptured
91 Digital data sets are continually being maintained and updated.
96 Complete is one thing - how accurate is another. Our Property Information is mostly complete, but far less accurate, perhaps only 75% accuracy of the property data in the state map base. Which effects the link and hence accuracy displayed in the corporate GIS.
97 Our GIS has more internal based datasets created on various layers, along with a combination of datasets from state government.

A Local-State Spatial Data Sharing Partnership Model to Facilitate SDI Development
282
100 Q4h Some of those state agencies are not actually requesting, its part of our arrangement that we supply information for updates each month. We have not gone live with our rural addresses yet, but when Aust Post was going through its matching phase, there were daily telephone calls from them.

Appendix4 – Open Ended Questionnaire Responses
283
Case Summaries – Part 5 Comments on Spatial Data Standa rds and Integration
Case# P5 comments
1 This is still trying to be rectified (i.e. Property & Financial System). Asset Management system still being implemented.
8 We are currently implementing a metadata system. One repository with a metadata tool.
10 Our integration currently opens the other system at the current record, two way, from/to the GIS
11 also HR system, all through web interfaces
12 Council uses Practical Computer Systems for its rates/financial system and this doesn't integrate well with GIS.
16 looking into a GIS based asset management system
20 Our Asset & Financials are in the one software package. In the middle of a conversion project from several systems to the one
41 Financial system integration is well developed between the property system-to-Finance & asset system-to-Finance. The Spatial Systems are mostly abstracted from finance by those two systems.
44 Q5g: New asset management and financial systems currently being implemented results in "Partial integration" results.
46 GIS/Asset management/Financial systems Integration currently underway.
55 State Metadata web page does not export so we have to double entry into theirs and ours.
56 Metadata is not only recorded at the dataset level but also at an object level. This enables us to state peculiarities of any object within the system. Such as a water supply zone was modified under the instruction by a particular officer. Scale being the accuracy level of data from state government is problematic. Often it does not fit the business requirement of local government
57 About to go to a web portal which will give integration with document management
59 Current GIS software (Latitude) does not have metadata capability. Govt supplied data metadata can be accessed via internet.
60 IT support is provided by a neighbouring council and the available bandwidth of the wireless link places significant limitations on the level of spatial data integration possible. Neither council can justify the resources to remedy this situation at this time.
62 Currently loading assets into database, linking to GIS to follow
64 We are currently implementing an Asset Management System. It is intended that the GIS will be the main access point to the asset data.
79 Metadata. I have an excel spreadsheet where I record all the relevant information about each layer (file) that is in our GIS system.
82 The GIS contains Council’s unique Assessment numbers where they have been previously matched. There is no link between GIS and Council's financial system at this stage but it is being developed.
86 We do not have an asset management system but our GIS has good integration into the pavement management system
100 Q5d - the metadata of a specific data set is retained in the same location as that dataset. Q5g - we have yet to capture our asset data on the GIS. We will start tackling that next year.
103 WCC have within the last six months implemented a new GIS. This has allowed many changes and improvements. Metadata is one change that we are creating at present. WCC does not have an AMS at present.
Case Summaries – Part 6 Comments on People and Skills

A Local-State Spatial Data Sharing Partnership Model to Facilitate SDI Development
284
Case# P6 comments
1 GIS position has been vacant for extended periods of time
4 BCC has implemented a learning and development group for GIS that encourages mentoring, mutil-skilling through work exchanges and external project placement
8 A centralised GIS team was only created about 2 years ago (more efficient). Prior to this there, we more GIS staff but decentralised (inefficient).
9 Purposeful training and opportunities for development are part of our ongoing training and development plans - they must be relative to the work being done including future planned work.
11 Our staff turn over is directly related to the opportunities our GIS offer the for professional development. Those which leave have (one exception)gone to higher management or technical supervision roles
16 no official 'unit', and due to other commitments, I dint have the ability to further my skills in this area
20 Really need an extra staff member, but Council current financial position prohibits this to an extent.
34 distance (therefore travel costs) increases the prices significantly
36 Our location limits the availability to attend anything!
38 Q6a: Should this question be more specific by asking for qualifications in geomatics? Q6b: We have had a 100% turnover in two years. This has been by natural attrition, but has allowed the section to go from a section with staff with no qualification in geomatics to a section which now has a very high qualifications in geomatics.
44 The best value proposition that exists for training is on-site and vendor based courses. Existing tertiary level training, while providing good background and overall appreciation of the science, provides little benefit to the usefulness of a prospective employee.
52 Use Consultants. No on staff GIS Officers
55 Hopelessly understaffed and understood - but getting there. I have been here 6 months.
56 Whilst there are 2 effective positions within the GIS sub-unit, they are occupied by 3 people
59 AD in Civil Engineering 1986 Due to complete degree end of 2005
60 Note: Less than 1 full time employee dedicated to maintenance of GIS
62 Until Aug 2004 GIS was done by part time by a non-GIS specialist in house or by external consultants - mostly for PIP property updates. One year appointment of a full time GIS specialist in Aug 2004 will become a permanent position after recruitment this month.
63 no dedicated gis unit - only what officers have learnt in developing systems
66 GIS Admin currently studying at Postgraduate level
67 Delatite Shire de-amalgamated in October 2002, forming Benalla Rural City and Mansfield Shire. This has caused major adjustments in the GIS before and after the de-amalgamation. A lot of work needed to be done to split the GIS into two separate municipalities, hence the daily routines were continually being interrupted. Over this period, the organisation/staff had been restructured many times.
68 Limited opportunities due to remoteness of Council from main centres where these courses are conducted
70 For the last 15 years the GIS staff has been one going from 2 days a week to full time. GIS also does database administration. Organisation support is excellent for updating skills.
72 Currently in process of sourcing additional member of staff for GIS functions. Possibly located within Planning/City Development section of council.
79 For the Rural Road Numbering Project, I had an additional 2 Fulltime Staff for 1 and a half years.

Appendix4 – Open Ended Questionnaire Responses
285
86 Recently increased staff from 1 to 2 with a person moving into GIS from a redundant position, however they did not find the job suitable and have now taken a package. The vacant position has been advertised and will be filled before Xmas.
89 There are no staff dedicated solely to GIS at Mansfield
96 We participate in many State sponsored training days (e.g. PIP workshops) and attend some training, but the organisation is very reluctant to pay for substantial educational training or industry seminars for the GIS staff.
100 Q6b - Prior to my accepting this position, there was no GIS position at Towong. There had been some IT dabbling, but there was no IT when I came as it had already been contracted out. There had also been some dabbling by some contract staff but that all ceased some time before I arrived.

A Local-State Spatial Data Sharing Partnership Model to Facilitate SDI Development
286
Case Summaries – Part 7 Comments on Existing Partnersh ips and Collaborations
Case# P7 Comments
4 I don’t think the state Govt always see Councils as "customers". LG's are not party to their strategic thinking regarding information, changes are just announced, and may have a major impact on councils systems. for example the DCDB and Community Titling
6 No
8 NRM&W exchange is generally OK but could have improved frequency (i.e. 1 month instead of 3). NRM&W does very little to improve the quality of the DCDB. Main Roads tends to be a 1 way exchange. We supply data and struggle to get 'As Constructed' data back at the end of construction.
9 The Qld government set out to do data share arrangements but the implementation is dependent on each council seeking independent agreements with each state gov't department. A centralised approach would see a centralised set of what data is available and improve the effectiveness of this programme.
10 This should be a whole of govt perspective - local govt would supply everything we have that State Govt need, and they would supply everything they have that we need. Examples that we would supply: address data (DNRM), tidal works (EPA). Examples that we need to do our job: DCDB (3 monthly), Veg Mapping, Native Title, Marine Parks, Valuations, some searches, Easements, Leases etc
15 We freely and openly share data with other Local Govts in our region including training and knowledge sharing
16 In regards to above question: all councils have the same basic data needs. If, through data sharing agreements these basic requirements can be satisfied, a more integrated form of data sharing can be implemented, providing access to more non-vital data sets. On main issue is that most data sets councils have are specific to a local government area
20 LG Authorities are always supply various major datasets to State and federal government bodies but receive no benefit from doing that. Those bodies then place extra demands and work on the LGA to continually supply that data. State governments should think about providing some type of financial incentive to LGA to make it more of a benefit to council. Eg Council supply the street address to state government via the PLI agreement in exchange for the DCDB. State Government on sell this to other bodies such as PSMA for the GNAF who then make money by selling the dataset to private industry. Councils should receive royalties from this product. Without Council there would be no dataset. DCDB can be (If need be)kept up to date by Council therefore the datasets are of no equal value because Council makes no money from the DCDB
22 It would be good to share DCDB with neighbouring Shires. At this point in time, if we want to see what is over our border, we have to purchase ($$) the dcdb. Not a viable option.
31 Planning, Environment & Disaster agencies seem to have a problem dealing with Loc Gov in QLD. They seem to think their data is the only source and in some cases are duplicating LG information for their own ends. Also there are too many sources of LG data available e.g. Spatial link not up to date
44 A move towards making spatial information available across all government levels is one which we strongly support. The major justification being better customer (rate/tax payers) service. This data availability support does not necessarily extent beyond the government arena.
46 Comments are preferred options if we shared or exchanged data.
47 Legal obligations for Council when providing data in exchange e.g. rural addressing, if the data has inaccuracies
55 We locked ourselves into a nightmare by refusing to share data 5 yrs ago. Subsequently we collected all our asset locations relative to our own cadastre. We now cannot easily adopt standard and accurate State data as it would cause a spatial mismatch with many of our own key datasets.
56 The council deals with the state as a whole. No individual department has agreements with the state. Councils have differing standards and capabilities, hence the need to deal with the state on an individual basis.

Appendix4 – Open Ended Questionnaire Responses
287
57 Data sharing with Federal Govt and private sector is one way only - us to them. Q7 I refer to state govt. Often consultants get data to work on council projects - their use is limited to the project for 1 yr.
62 Main impediment is the time delay between submitting amendments to receiving the updated coverage. A better model would be to have big central servers in organisations displaying their own data over an internet site and software locally that can access that data in real time to 'mix and match'. Much like the concept behind ESRI's Geography Network where a (free) viewer can read coverages from many websites to mix with local datasets without having to download or convert anything. This gives access to the latest data without the chance of picking up outdated data by mistake. Each supplier updates only their own data.
68 Privacy Legislation places some limitations on exchange
88 *Have only experienced data exchange partnerships/collaborations with the State Government. *Unaware of data held by other government authorities. *Most Utilities (gas, electricity, telephone, now water) are not prepared to make available their spatial data - claiming legal reasons.
90 No
94 Mainly informal as our use of data is usually restricted to within our boundaries

A Local-State Spatial Data Sharing Partnership Model to Facilitate SDI Development
288
Case Summaries – Part 8 Comments on Other Mechanisms for Sharing
Case# Other Mechanisms
1 More information on whom to contact and where the availability of data sets are located.
4 Effective sharing works best within a collaborative business relationship underpinned by effective communication. I think there is still considerable scope for better communication between State and LG and particularly within state agencies
6 I would like to see an option available for the data (DCDB) to be provided in formats other than QIF, eg. MapInfo tables.
8 Improved frequency of updates of data. The data exchange at GovNet via the LGAQ is a good move forward.
9 Refer comments above to question Q7i part b.
10 All data required for statutory purposes by local govt should be available regularly and free from state govt under this agreement.
11 the quality of ‘matched data’ from state is poor and we usually find ourselves as the audit organization
16 Sharing of data sets between local state and federal bodies. i.e. a web based system allowing access by group members to a wealth of data pooled from all bodies (with certain quality assurances, and standards in place) facilitated by an annual access fee (covering cost of data entry and maintenance only). Data with no private information is difficult to be used inappropriately and as such should be readily available for use by all. Obviously, data share agreements are vital to ensure all members are aware of their rights and responsibilities, specifically in relation to passing this information onto other users. With all systems/agreements etc, the level of internal support (monetary and staffing) given to GIS will be the determining factor when gauging their likelihood of success.
19 More communication in regards to where you can gain access to the shared data is needed.
20 Council provide a heap of spatial data up the chain and receive no financial benefit from the provision of the data. The top of the food chain charges a fee to private industry for that data, the money should be fed back down the chain to support the initial data capture, to increase quality, etc
25 Sharing of PLI Data for us is mainly one way. The only benefit to Council is less queries from those that are aware of the availability of PLI data
28 State Government departments are not aware of what information other departments have let alone what other local governments have. State Gov needs to integrate all information within the state government and reduce duplication. State could have corporate GIS department that provides GIS services to all agencies and departments.
31 Too many Depts DUPLICATING Council work eg Planning Dept. LG is the Authoritative source and State Gov should not be setting up out of date monster to conflict with dynamic data that LG has
35 Better documentation as far as what to do and when to do it.
38 Greater access to free (or cost of supply) data. Get rid of the requirement to invoice between parties involved in data sharing agreements.
40 Satisfied with present arrangements
41 Further development of the Spatial Data Clearinghouse concept. Agreement mechanisms are useful at managerial levels, but actual exchange and implementation occurs at a much more pragmatic level. Providing simple methods of accessing data is very powerful.
44 As is currently being executed; extension of existing agreements to include a wide range of data.
47 Knowing where to go for data. What data is available. Knowing who you should be dealing with. A set standard of format for data. Clearer guidelines for reuse of data.

Appendix4 – Open Ended Questionnaire Responses
289
54 Provision of Aerial photos at a reasonable cost.
55 Seminars by State Gov targeted to Local Gov educating us on cadastral/title system, their update programs, metadata tools and systems.
59 More regular contact with state govt. representative. This has been mooted as part of new agreement.
62 Sharing of image capture; ability to control the data update process more easily; see above for comments on web-based GIS; conformity on standards and platforms, although this may require funding
68 Internet based updates
70 A more automated process and flexibility in delivery of data
72 Improved work flows/response times to some aspects or the PIP and less red tape.
75 Ability to access online title searching at a reduced rate.
76 agreement enshrined in legislation. improved standards for data exchange.
78 Graphical updates to correct identified errors to be made a higher priority.
79 Maybe a direct cut of Council data with all amendments. Leave the M2 process as is.
80 web editing of own data
82 More sharing of data e.g. aerial photography between Council’s and other groups e.g. Landcare and CMA’S and State Government Departments thus inimizing the cost burden on individual organisations.
83 A more user friendly system of data transfer e.g. the M1 form
85 speed up amendments sent from council
86 SII need to increase resources so that M2s (property line work changes) are acted upon.
87 simplify data returns
88 See PIP Evaluation results
96 Improved and simplified processes for council submitting our property data updates to State Govt. Processes ensure what we submit is never corrupted in the process. An improved visual process for submitting the data – not an excel spreadsheet.
98 I feel Local Government is doing all the leg work, which we could do without the information sharing for the benefit of the state ie. emergency services and other agencies that require statewide information. In return we get part of a statewide cadastre and relevant information. More funding for out efforts would be appreciated.
100 When “little” projects are started at the state gov level that require local gov participation, it would be appreciated if they’d let us bed down one project before starting another time consuming one or requesting more datasets so that they can trolley on with things. They start a project and communicate with a officer who is responsible for the exchange of info, and then start a new project, by communicating with that officer only and expect them to communicate with their senior management about the project, rather than the state gov going back to the CEO and introducing the project and explaining what the aim of the project is and time frames, workloads etc.
103 I’d like to see PIP become a legislative requirement. That way we will have more chance of attaining the resourcing required to maintain the DCDB to the required performance levels.

A Local-State Spatial Data Sharing Partnership Model to Facilitate SDI Development
290
Case Summaries – Part 8 Comments on Data Sharing Partne rship Overall Case# P8 Comments
4 BCC would like to develop sharing with a whole of government approach. I don’t think the relationships between the state govt are mature enough to allow that to occur. The state should focus on data sharing within its own sector
9 I still see a lot of duplication of effort occurring in the sharing of data. Regional areas of Australia are also frustrated by the irregularity of satellite updates on available data sets and also the level of accuracy on survey data from release to release.
10 The value to us of the DCDB is not matched by the value to State Govt of our address data (particularly for emergency services). We believe they still require the information from us as well. We currently send the same information to 10 other organisations, like all the emergency services, Telstra, Energex, Australia Post etc, since they do not currently get it from DNR. We are yet to see the other datasets made available as part of this agreement, the DCDB was supposed to be just the first.
20 Council spent over $200K of its own money to increase the accuracy of the DCDB in the LGA area. Benefit to the state is countless $$. Council Received from the State....Nothing. Whoopee, we got access to the survey plans and Form 6 diagrams for the duration of the project...we already had access to that. Councils who have undertaken such projects should now receive financial benefits from the state...it may be in the form of royalties for each extraction of that LGA area that has been improved or some other appropriate means. NRM do not even maintain or improve the quality of the core survey control marks in the LGA area. The State likes to get data from Councils, but doesn't Reciprocate in kind by providing services to support spatial data acquisitions at the base level or provide a tangible benefit to the LGA
47 Our council at this time does not have the knowledge, experience or funding to fully commit to a specialist GIS Section within the council. GIS at this stage seems to be a maze of data and no clear direction as to where it is taking us and what use we should be making of it, and what funding should be allocated.
57 This section has been difficult to answer. Whereas some councils rely on State govt data we, for e.g., maintain our own DCDB and on a regular basis we & the state do a check. Who benefits most - equal. Who puts in the most work - equal.
59 New data share agreement has just been signed. Contact between council and state govt. officers has increased significantly in last 2 to 3 months leading to improved data quality and matching rates. New agreement will provide access to wider range of data.
60 Just for your info, this took a fair bit longer than 15-20 minutes to fill out (more like an hour).
68 Increased resources from both Government and Local Government area to maintain the data at a more current level and audit on data integrity. Most important due to organisations who access the data e.g. emergency services. Need to have the resources to get the data accurate
70 The quality of the products need to keep improving to a standard that meets the requirements of all authorities using the state map base.
81 answer to Q1g " How many full time equivalent (FTE) staff work within your GIS unit?" is 0.4. The form wouldn't let me put in a decimal point.
90 N/A
97 We as Council put so much time, energy, resources into providing lodging/sending data to SII. They seem to be forever doing audits and they are great at finding problems and issues - but the rework is done by all councils. Overall we slave away to give them the data they require and they just process it! Frustrating at times. The answer to QA1 is: 18,000 approx. The field will not let me enter this number in.
98 If funding was granted just for more resources to be channeled to property matching alone within the council the state and council data would be improved at a faster rate.
Appendix4 – Open Ended Questionnaire Responses
291
100 The work that is done at the Council end is very time consuming which then equates to cost in a council like this with such a small rate base but such a large area to cover. It’s difficult when you have to drive over 100 km just to get to a site, to then come back to the office and resolve the problem and feed in into the workflows of M1 or M2. The State Government has put the mechanisms in place, so this exchange works, but then Councils are left to find the solution that best suites them and there business applications at their own expense. The state gov supplies the data to all other gov departments under some other agreement I'm sure, in particular the Titles Office uses the property addresses supplied by councils, but then cracks the sods so that councils have to have another MOUE to be able to use the Titles Searching facility to improve the property matching etc. All councils should not have been judged based on one Councils misuse of access. The processing of M2s that are supplied by Councils need to have more money thrown at them so that they are processed in a much more timely fashion - a greater commitment from the budget process of the state gov to recognise that the spatial data of the state that underpins a lot of the gov departments business, needs adequate funding so that people at council level don’t get disheartened when they see time and time again that things haven’t been done.

A Local-State Spatial Data Sharing Partnership Model to Facilitate SDI Development
292

Appendix 5 – Inter-State Difference Analysis
293
Appendix 5 – Inter-State Difference Analysis
APPENDIX 5
INTER-STATE DIFFERENCE ANALYSIS

A Local-State Spatial Data Sharing Partnership Model to Facilitate SDI Development
294

Appendix 5 – Inter-State Difference Analysis
295
ANOVA ANALYSIS
Sum of
Squares df Mean
Square F Sig. Number of Properties Between Groups 4811096263.3
04 2 2405548131. 1.081 .343
Within Groups 222495708017.163
100 2224957080.172
Total 227306804280.467 102
Number of Staff Between Groups 1235977.417 2 617988.708 1.301 .277 Within Groups 47503905.263 100 475039.053 Total 48739882.680 102 Assessment of ICT Capacity
Between Groups .705 2 .352 .643 .528
Within Groups 54.791 100 .548 Total
55.495 102
Number of GIS staff Between Groups 284.182 2 142.091 3.911 .023 Within Groups 3632.775 100 36.328 Total 3916.958 102 Length of time having GIS Between Groups 17.419 2 8.710 8.754 .000 Within Groups 99.494 100 .995 Total 116.913 102 Level of Management Support
Between Groups 1.188 2 .594 .579 .562
Within Groups 102.540 100 1.025 Total 103.728 102 Level of Resourcing of the GIS
Between Groups 1.315 2 .657 .670 .514
Within Groups 98.122 100 .981 Total 99.437 102 Policy on Internal Data Use
Between Groups .090 2 .045 .060 .942
Within Groups 74.745 100 .747 Total 74.835 102 Policy on External Data Use
Between Groups 1.792 2 .896 .360 .699
Within Groups 249.120 100 2.491 Total 250.913 102 Place Restriction on Use of Data
Between Groups 2.613 2 1.307 .794 .455
Within Groups 164.591 100 1.646 Total 167.204 102 Internal Policy Encourages Data Use
Between Groups .080 2 .040 .065 .937
Within Groups 61.765 100 .618 Total 61.845 102 External Policy Encourages Data Use
Between Groups 1.953 2 .977 1.230 .297
Within Groups 79.406 100 .794 Total 81.359 102 Cost recovery Policy Between Groups 11.395 2 5.697 9.335 .000 Within Groups 61.032 100 .610 Total
72.427 102
Legal liability limits sharing Between Groups 3.220 2 1.610 1.574 .212 Within Groups 102.294 100 1.023 Total 105.515 102

A Local-State Spatial Data Sharing Partnership Model to Facilitate SDI Development
296
Copyright limits sharing Between Groups 2.271 2 1.136 .951 .390 Within Groups 119.379 100 1.194 Total 121.650 102 Privacy limits sharing Between Groups 1.598 2 .799 .805 .450 Within Groups 99.314 100 .993 Total 100.913 102 Staff know where to find data
Between Groups 2.392 2 1.196 1.452 .239
Within Groups 82.327 100 .823 Total 84.718 102 Percentage of Staff with Access to GIS
Between Groups .746 2 .373 .248 .781
Within Groups 150.186 100 1.502 Total 150.932 102 Internet Web Mapping is available
Between Groups 14.646 2 7.323 3.028 .053
Within Groups 241.878 100 2.419 Total 256.524 102 Technology Has Made SI More Accessible
Between Groups 4.443 2 2.222 3.753 .027
Within Groups 59.188 100 .592 Total 63.631 102 Accessibility Improves Council's Business
Between Groups .900 2 .450 .725 .487
Within Groups 62.032 100 .620 Total 62.932 102 Level of use of State data Between Groups 7.765 2 3.882 3.055 .052 Within Groups 127.090 100 1.271 Total 134.854 102 State held data is easy accessible
Between Groups 1.155 2 .578 .873 .421
Within Groups 66.146 100 .661 Total 67.301 102 Cost of State data is acceptable
Between Groups 9.940 2 4.970 7.447 .001
Within Groups 66.739 100 .667 Total 76.680 102 Limitations by state on data is acceptable
Between Groups 5.983 2 2.991 5.060 .008
Within Groups 59.124 100 .591 Total 65.107 102 Number of monthly requests for SI
Between Groups 99.840 2 49.920 2.162 .120
Within Groups 2308.995 100 23.090 Total 2408.835 102 Overall maturity of SI Between Groups 4.941 2 2.471 4.319 .016 Within Groups 57.201 100 .572 Total 62.143 102 Data Standards is an issue Between Groups .724 2 .362 .462 .631 Within Groups 78.305 100 .783 Total 79.029 102 Consider standards in GIS development
Between Groups 3.241 2 1.621 2.292 .106
Within Groups 70.720 100 .707 Total
73.961 102

Appendix 5 – Inter-State Difference Analysis
297
Recording of metadata Between Groups .566 2 .283 .245 .783 Within Groups 115.551 100 1.156 Total 116.117 102 Single metadata repository Between Groups 5.956 2 2.978 2.753 .069 Within Groups 108.160 100 1.082 Total 114.117 102 Scale difference of local and state data an issue
Between Groups 6.711 2 3.355 2.966 .056
Within Groups 113.115 100 1.131 Total 119.825 102 Level of integration Between Groups .474 2 .237 .358 .700 Within Groups 66.214 100 .662 Total 66.688 102 Level of Staff Turnover Between Groups 12.336 2 6.168 4.583 .012 Within Groups 134.576 100 1.346 Total 146.913 102 Trend in staff numbers Between Groups .973 2 .487 1.684 .191 Within Groups 28.891 100 .289 Total 29.864 102 Level of Organisational Restructuring
Between Groups 8.592 2 4.296 2.721 .071
Within Groups 157.874 100 1.579 Total 166.466 102 Access to Training Between Groups 14.460 2 7.230 7.725 .001 Within Groups 93.598 100 .936 Total 108.058 102 Average level of collaboration across organisations
Between Groups 5.915 2 2.958 6.652 .002
Within Groups 44.463 100 .445 Total 50.378 102 Share to meet business needs
Between Groups 2.054 2 1.027 1.777 .174
Within Groups 57.791 100 .578 Total 59.845 102 Average of All Barriers Between Groups 5.768 2 2.884 5.661 .005 Within Groups 50.938 100 .509 Total 56.705 102 Average of All Drivers Between Groups 1.459 2 .730 2.337 .102 Within Groups 31.222 100 .312 Total 32.681 102 Number of Collaborations Between Groups 9.372 2 4.686 2.798 .066 Within Groups 167.462 100 1.675 Total 176.835 102 Capacity to share Between Groups
.342 2 .171 .221 .802
Within Groups 77.115 100 .771 Total
77.456 102
Term of collaboration Between Groups 3.429 2 1.714 2.657 .075 Within Groups 64.532 100 .645 Total 67.961 102 Equal exchange better Between Groups 6.085 2 3.042 3.330 .040 Within Groups 84.063 92 .914 Total 90.147 94

A Local-State Spatial Data Sharing Partnership Model to Facilitate SDI Development
298
Data sharing partnerships is worthwhile
Between Groups 14.110 2 7.055 12.703 .000
Within Groups 55.540 100 .555 Total 69.650 102 Data sharing has improved quality
Between Groups 31.153 2 15.577 22.392 .000
Within Groups 69.565 100 .696 Total 100.718 102 Believe that the benefits are equal
Between Groups 11.264 2 5.632 7.207 .001
Within Groups 78.153 100 .782 Total 89.417 102 Believe that the efforts are equal
Between Groups 6.922 2 3.461 6.854 .002
Within Groups 50.495 100 .505 Total 57.417 102 Are provided updated data regularly
Between Groups 53.428 2 26.714 21.552 .000
Within Groups 123.951 100 1.240 Total 177.379 102 Communication frequency Between Groups 13.615 2 6.808 14.701 .000 Within Groups 46.307 100 .463 Total 59.922 102 Overall level of satisfaction Between Groups 13.515 2 6.758 10.798 .000 Within Groups 62.582 100 .626 Total 76.097 102

Appendix 5 – Inter-State Difference Analysis
299
Kruskal Wallis Test Statistics(a,b)
Chi-Square df Asymp. Sig. Number of Properties 6.403 2 .041 Number of Staff 6.509 2 .039 Assessment of ICT Capacity .771 2 .680 Number of GIS staff 11.426 2 .003 Length of time having GIS 17.138 2 .000 Level of Managemnet Support 1.063 2 .588 Level of Resourcing of the GIS .830 2 .660 Policy on Internal Data Use .299 2 .861 Policy on External Data Use .641 2 .726 Place Restriction on Use of Data 1.397 2 .497 Internal Policy Encourages Data Use .328 2 .849 External Policy Encourages Data Use 2.652 2 .266 Cost recovery Policy 16.477 2 .000 Legal liability limits sharing 2.593 2 .273 Copyright limits sharing 1.600 2 .449 Privacy limits sharing 1.678 2 .432 Staff know where to find data 2.945 2 .229 Percentage of Staff with Access to GIS .636 2 .728 Internet Web Mapping is available 7.503 2 .023 Technology Has Made SI More Accessible 6.200 2 .045
Accessibility Improves Council's Business 1.174 2 .556
Level of use of State data 4.592 2 .101 State held data is easy accessible 3.788 2 .150 Cost of State data is acceptable 12.426 2 .002 Limitations by state on data is acceptable 10.117 2 .006 Number of monthly requests for SI 5.931 2 .052 Overall maturity of SI 10.667 2 .005 Data Standards is an issue .914 2 .633 Consider standards in GIS development 3.605 2 .165 Recording of metadata .704 2 .703 Single metadata repository 4.291 2 .117 Scale difference of local and state data an issue
6.732 2 .035
Level of integration .878 2 .645 Level of Staff Turnover 7.836 2 .020 Trend in staff numbers 2.735 2 .255 Level of Organisational Restructuring 5.145 2 .076 Access to Training 12.441 2 .002 Average level of collaboration across organisations
13.064 2 .001
Share to meet business needs 3.905 2 .142 Average of All Barriers 7.496 2 .024 Average of All Drivers 3.290 2 .193 Number of Collaborations 7.060 2 .029 Capacity to share .383 2 .826 Term of collaboration 5.159 2 .076 Equal exchange better 4.865 2 .088

A Local-State Spatial Data Sharing Partnership Model to Facilitate SDI Development
300
Data sharing partnerships is worthwhile 22.983 2 .000
Data sharing has improved quality 35.478 2 .000 Believe that the benefits are equal 14.797 2 .001 Believe that the efforts are equal 8.327 2 .016 Are provided updated data regularly 33.190 2 .000 Communication frequency 24.568 2 .000 Overall level of satisfaction 17.726 2 .000
a Kruskal Wallis Test
b Grouping Variable: State as number

Appendix 6 – Factor Analysis
301
Appendix 6 – Factor Analysis
APPENDIX 6
FACTOR ANALYSIS

A Local-State Spatial Data Sharing Partnership Model to Facilitate SDI Development
302

Appendix 6 – Factor Analysis
303
Communalities
Initial Extraction Number of Properties 1.000 .912 Number of Staff 1.000 .909 Assessment of ICT Capacity 1.000 .699 Number of GIS staff 1.000 .899 Length of time having GIS 1.000 .697 Level of Managemnet Support 1.000 .737 Level of Resourcing of the GIS 1.000 .805 Place Restriction on Use of Data 1.000 .667 Internal Policy Encourages Data Use 1.000 .632 External Policy Encourages Data Use 1.000 .642 Legal liability limits sharing 1.000 .678 Copyright limits sharing 1.000 .726 Privacy limits sharing 1.000 .766 Staff know where to find data 1.000 .738 Percentage of Staff with Access to GIS 1.000 .634 Internet Web Mapping is available 1.000 .660 Technology Has Made SI More Accessible 1.000 .693 Accessibility Improves Council's Business 1.000 .588 Level of use of State data 1.000 .732 State held data is easy accessible 1.000 .594 Cost of State data is acceptable 1.000 .712 Limitations by state on data is acceptable 1.000 .666 Overall maturity of SI 1.000 .723 Consider standards in GIS development 1.000 .544 Recording of metadata 1.000 .739 Single metadata repository 1.000 .757 Level of integration 1.000 .772 Level of Staff Turnover 1.000 .717 Trend in staff numbers 1.000 .670 Level of Organisational Restructuring 1.000 .606 Access to Training 1.000 .765 Average level of collaboration across organisations 1.000 .623
Share to meet business needs 1.000 .734 Number of Collaborations 1.000 .548 Capacity to share 1.000 .548 Term of collaboration 1.000 .781
Extraction Method: Principal Component Analysis.

A Local-State Spatial Data Sharing Partnership Model to Facilitate SDI Development
304
Total Variance Explained
5.879 16.330 16.330 5.879 16.330 16.330 3.573 9.924 9.924
2.850 7.918 24.248 2.850 7.918 24.248 3.087 8.576 18.500
2.560 7.111 31.359 2.560 7.111 31.359 2.169 6.026 24.526
1.865 5.180 36.539 1.865 5.180 36.539 1.943 5.398 29.924
1.839 5.107 41.646 1.839 5.107 41.646 1.887 5.242 35.166
1.669 4.636 46.282 1.669 4.636 46.282 1.883 5.230 40.396
1.559 4.331 50.613 1.559 4.331 50.613 1.707 4.743 45.139
1.345 3.737 54.350 1.345 3.737 54.350 1.703 4.730 49.869
1.278 3.549 57.899 1.278 3.549 57.899 1.563 4.342 54.211
1.179 3.276 61.176 1.179 3.276 61.176 1.535 4.264 58.475
1.156 3.210 64.386 1.156 3.210 64.386 1.499 4.164 62.639
1.097 3.047 67.433 1.097 3.047 67.433 1.496 4.156 66.795
1.036 2.877 70.310 1.036 2.877 70.310 1.266 3.516 70.310
.972 2.701 73.011
.942 2.616 75.628
.804 2.233 77.861
.777 2.158 80.018
.726 2.018 82.036
.669 1.858 83.894
.663 1.842 85.736
.597 1.658 87.394
.557 1.548 88.942
.503 1.398 90.341
.477 1.326 91.666
.440 1.223 92.889
.405 1.126 94.015
.387 1.074 95.089
.321 .891 95.980
.300 .835 96.815
.282 .783 97.598
.254 .705 98.303
.213 .592 98.895
.153 .426 99.321
.120 .332 99.653
.086 .239 99.892
.039 .108 100.0
Component1
2
3
4
5
6
7
8
9
10
11
12
13
14
15
16
17
18
19
20
21
22
23
24
25
26
27
28
29
30
31
32
33
34
35
36
Total
% ofVarianc
e
Cumulative
% Total
% ofVarianc
e
Cumulative
% Total
% ofVarianc
e
Cumulative
%
Initial EigenvaluesExtraction Sums ofSquared Loadings
Rotation Sums of SquaredLoadings
Extraction Method: Principal Component Analysis.

Appendix 6 – Factor Analysis
305
Component Matrix(a)
Component
1 2 3 4 7 8 9 10 11 12 13 Number of Properties .657 -.594 .176 .220 -.123 .079 -.118 -.081 .022 -.063 .012 Number of Staff .613 -.673 .162 .164 -.073 .076 -.049 -.056 4.92E
-005 -.038 -.078
Assessment of ICT Capacity .564 .429 .029 .037 -.144 -.080 .173 -.210 .146 .024 -.265 Number of GIS staff .597 -.680 .169 .089 -.095 .112 -.043 -.077 .020 -.108 .023 Length of time having GIS .407 -.234 -.240 -.108 -.358 .313 .140 .044 -.157 .154 .007 Level of Managemnet Support .677 .241 .056 .049 .010 .142 .220 -.248 -.171 -.136 .112 Level of Resourcing of the GIS .546 .208 .081 -.197 .245 .031 .264 -.376 -.140 .124 -.112 Place Restriction on Use of Data .012 .235 .325 .374 -.278 .132 .186 -.064 .130 .209 .029 Internal Policy Encourages Data Use .475 .140 .000 .036 .339 -.038 .291 -.172 .227 -.069 -.063 External Policy Encourages Data Use .528 -.246 -.255 -.074 -.002 -.076 .286 .261 -.016 -.103 .238 Legal liability limits sharing -.213 .156 .314 .268 .046 -.050 -.001 .203 -.136 -.112 -.113 Copyright limits sharing -.265 .025 .549 .113 -.088 .019 .305 .187 -.023 -.117 .152 Privacy limits sharing -.108 .091 .539 .240 -.180 -.081 .042 .054 -.207 -.076 -.208 Staff know where to find data .588 .278 -.167 .068 .128 -.091 -.237 -.023 -.306 -.142 -.180 Percentage of Staff with Access to GIS .640 .136 -.034 .109 -.127 -.023 .058 .340 .029 .121 -.041
Internet Web Mapping is available .493 -.014 -.146 -.202 -.336 -.342 -.098 .096 .212 .104 .092 Technology Has Made SI More Accessible
.501 .029 .085 .225 .103 -.491 .026 -.164 -.027 .045 -.158
Accessibility Improves Council's Business
.408 -.133 -.355 .097 -.200 -.347 .186 .112 .038 -.169 .021
Level of use of State data .023 .286 .112 .511 -.156 .041 .078 .042 .467 -.238 .195 State held data is easy accessible -.096 .113 -.152 .557 -.013 .072 -.053 .025 -.096 .280 -.146 Cost of State data is acceptable .062 .093 -.529 .505 .046 .219 -.137 -.062 -.173 -.149 .102 Limitations by state on data is acceptable
-.032 .181 -.572 .326 .088 .194 -.038 -.045 -.244 -.184 .236
Overall maturity of SI .267 .374 -.526 -.136 -.152 .072 -.039 .182 .331 -.005 -.061 Consider standards in GIS development .270 .253 .317 -.242 .055 .332 -.108 .019 .139 -.123 .258 Recording of metadata .414 .125 .336 -.056 .188 .280 -.283 .103 .137 -.432 -.084 Single metadata repository .323 .078 .217 -.235 .249 -.051 .111 .450 -.175 .004 .107 Level of integration .441 .397 .113 -.092 -.173 .079 -.364 .163 -.152 .301 -.012 Level of Staff Turnover -.106 -.125 .004 .058 .353 .020 .073 -.270 .156 .247 .352 Trend in staff numbers .345 .021 -.090 .019 .042 .014 -.043 .139 .020 .132 .087 Level of Organisational Restructuring
.224 -.370 -.023 -.055 .385 -.041 -.221 .059 -.010 .063 -.017
Access to Training .404 .064 .199 .234 .195 .170 .214 .226 -.187 .402 .194 Average level of collaboration across organisations
.336 .271 .263 .065 -.114 -.115 -.377 -.089 -.086 -.064 .089
Share to meet business needs .022 -.085 -.038 .376 .555 -.272 -.104 .279 .222 .047 -.061 Number of Collaborations .265 .052 .163 .052 -.007 -.010 -.395 -.182 .266 .308 .223 Capacity to share .517 .421 .009 -.186 .202 .038 .074 .018 -.011 -.092 .040 Term of collaboration .053 -.148 -.152 -.006 .163 .509 .085 .150 .288 .130 -.527
Extraction Method: Principal Component Analysis.
a 13 components extracted.

A Local-State Spatial Data Sharing Partnership Model to Facilitate SDI Development
306
Component Transformation Matrix
.541 .584 .369 .328 .038 -.135 .210 .001 -.051 .187 .00 .145 -.007
-.743 .406 .018 .302 .139 .090 .235 .259 -.185 .034 .000 -.001 -.084
.188 .038 -.391 .023 -.586 .503 .325 .199 -.056 .148 .061 .020 -.199
.240 -.030 -.123 -.008 .519 .276 -.274 .561 -.055 .159 .378 -.140 -.022
.055 .015 -.108 .340 .004 .078 -.172 .292 .521 -.51 -.25 .387 -.061
-.057 .054 .337 .077 .114 .638 .031 -.326 .419 .017 -.04 -.382 .152
-.099 .244 -.358 -.111 .097 -.124 .139 -.304 .434 .093 .606 .270 .129
.092 -.099 -.354 .006 .301 -.043 .435 .102 .064 .194 -.45 -.020 .569
-.118 .357 .157 -.629 -.123 .149 -.290 .200 .116 .255 -.27 .325 .151
-.092 -.464 .365 .203 -.026 .226 .091 .001 -.154 .209 .209 .606 .252
-.038 -.069 .345 -.151 -.329 -.255 .272 .473 .233 -.21 .295 -.288 .337
-.113 -.064 -.100 .431 -.305 -.223 -.437 .066 .256 .575 -.06 -.183 .132
-.041 -.260 .173 -.148 .194 -.161 .352 .126 .402 .355 -.14 .033 -.607
Component1
2
3
4
5
6
7
8
9
10
11
12
13
1 2 3 4 5 6 7 8 9 10 11 12 13
Extraction Method: Principal Component Analysis. Rotation Method: Varimax with Kaiser Normalization.

Appendix 7 – Correlation Analysis
307
Appendix 7 – Correlation Analysis
APPENDIX 7
CORRELATION ANALYSIS

Appendix 7 – Correlation Analysis
308

Appendix 7 – Correlation Analysis
309
Siz
e_In
dex
Org
_sup
port
Ext
_acc
ess_
pol
icy
Inte
rnal
_sha
ring
Per
spec
t_st
ate_
data
Con
cern
_dat
a_r
estr
ictio
ns
Val
ue_s
tds
Impa
ct_s
tate
_da
ta
Sta
ff_or
g_ch
ang
e
Sta
ff_de
velo
p
Bus
s_ne
eds
Pol
_ext
_acc
ess T
erm
_col
l
Size_Index Pearson Correlation 1 .407(**) .641(**) .431(**) .044 -.208(*) .217(*) .027 .252(*) .378(**) -.311(**) -.082 .091
Sig. (2-tailed) .000 .000 .000 .659 .035 .028 .783 .010 .000 .001 .411 .360 N 103 103 103 103 103 103 103 103 103 103 103 102 103 Org_support Pearson
Correlation .407(**) 1 .516(**) .663(**) .084 -.165 .345(**) .119 -.003 .324(**) -.142 -.009 -.007
Sig. (2-tailed) .000 .000 .000 .398 .096 .000 .230 .974 .001 .152 .929 .943 N 103 103 103 103 103 103 103 103 103 103 103 102 103 Ext_access_policy Pearson
Correlation .641(**) .516(**) 1 .642(**) .108 -.264(**)
.099 .101 -.047 .249(*) -.264(**) -.036 .013
Sig. (2-tailed) .000 .000 .000 .277 .007 .318 .308 .638 .011 .007 .722 .898 N
103 103 103 103 103 103 103 103 103 103 103 102 103
Internal_sharing Pearson Correlation .431(**) .663(**) .642(**) 1 .106 -.119 .247(*) .149 -.029 .250(*) -.241(*) -.011 -.013
Sig. (2-tailed) .000 .000 .000 .286 .230 .012 .134 .768 .011 .014 .914 .897 N 103 103 103 103 103 103 103 103 103 103 103 102 103 Perspect_state_data Pearson
Correlation .044 .084 .108 .106 1 -.181 -.136 .578(**) .052 .060 -.032 -.110 .054
Sig. (2-tailed) .659 .398 .277 .286 .067 .172 .000 .599 .546 .752 .271 .585 N 103 103 103 103 103 103 103 103 103 103 103 102 103 Concern_data_restrictions
Pearson Correlation -.208(*) -.165 -
.264(**) -.119 -.181 1 .020 -.017 .075 .010 .151 -.067 -.118
Sig. (2-tailed) .035 .096 .007 .230 .067 .843 .866 .451 .919 .129 .506 .234
N 103 103 103 103 103 103 103 103 103 103 103 102
103

310
Value_stds Pearson Correlation .217(*) .345(**) .099 .247(*) -.136 .020 1 -.010 -.063 .196(*) .026 .107 .048
Sig. (2-tailed) .028 .000 .318 .012 .172 .843 .919 .524 .047 .792 .283 .627 N 103 103 103 103 103 103 103 103 103 103 103 102 103 Impact_state_data Pearson
Correlation .027 .119 .101 .149 .578(**) -.017 -.010 1 -.014 .003 .084 -.099 -.020
Sig. (2-tailed) .783 .230 .308 .134 .000 .866 .919 .886 .978 .397 .324 .844 N 103 103 103 103 103 103 103 103 103 103 103 102 103 Staff_org_change Pearson
Correlation .252(*) -.003 -.047 -.029 .052 .075 -.063 -.014 1 .397(**) .015 .046 .076
Sig. (2-tailed) .010 .974 .638 .768 .599 .451 .524 .886 .000 .878 .643 .446 N 103 103 103 103 103 103 103 103 103 103 103 102 103 Staff_develop Pearson
Correlation .378(**) .324(**) .249(*) .250(*) .060 .010 .196(*) .003 .397(**) 1 .073 -.012 .111
Sig. (2-tailed) .000 .001 .011 .011 .546 .919 .047 .978 .000 .463 .904 .266 N 103 103 103 103 103 103 103 103 103 103 103 102 103 Buss_needs Pearson
Correlation -
.311(**) -.142 -
.264(**) -.241(*) -.032 .151 .026 .084 .015 .073 1 -.024 -.017
Sig. (2-tailed) .001 .152 .007 .014 .752 .129 .792 .397 .878 .463 .813 .867 N 103 103 103 103 103 103 103 103 103 103 103 102 103 Pol_ext_access Pearson
Correlation -.082 -.009 -.036 -.011 -.110 -.067 .107 -.099 .046 -.012 -.024 1 -.065
Sig. (2-tailed) .411 .929 .722 .914 .271 .506 .283 .324 .643 .904 .813 .514 N 102 102 102 102 102 102 102 102 102 102 102 102 102 Term_coll Pearson
Correlation .091 -.007 .013 -.013 .054 -.118 .048 -.020 .076 .111 -.017 -.065 1
Sig. (2-tailed) .360 .943 .898 .897 .585 .234 .627 .844 .446 .266 .867 .514 N 103 103 103 103 103 103 103 103 103 103 103 102 103
** Correlation is significant at the 0.01 level (2-tailed). * Correlation is significant at the 0.05 level (2-tailed).

Appendix 8 – Multiple Regression Analysis
311
Appendix 8 – Multiple Regression Analysis
APPENDIX 8
MULTIPLE REGRESSION ANALYSIS

312

Appendix 8 – Multiple Regression Analysis
313
Variables Entered/Removed(b)
Model Variables Entered Variables Removed Method
1 Term_coll, Ext_access_policy, Pol_ext_access, Staff_org_change, Impact_state_data, Value_stds, Buss_needs, Concern_data_restrictions, Staff_develop, Org_support, Perspect_state_data, Size_Index, Internal_sharing(a)
. Enter
a All requested variables entered.
b Dependent Variable: Outcome1
Model Summary
Model R R Square Adjusted R
Square Std. Error of the Estimate
1 .638(a) .408 .320 .64736
a Predictors: (Constant), Term_coll, Ext_access_policy, Pol_ext_access, Staff_org_change, Impact_state_data, Value_stds, Buss_needs, Concern_data_restrictions, Staff_develop, Org_support, Perspect_state_data, Size_Index, Internal_sharing
ANOVA(b)
Model Sum of
Squares df Mean Square F Sig. Regression 25.382 13 1.952 4.659 .000(a) Residual 36.879 88 .419
1
Total 62.261 101
a Predictors: (Constant), Term_coll, Ext_access_policy, Pol_ext_access, Staff_org_change, Impact_state_data, Value_stds, Buss_needs, Concern_data_restrictions, Staff_develop, Org_support, Perspect_state_data, Size_Index, Internal_sharing
b Dependent Variable: Outcome1
Coefficients(a)

314
Unstandardized Coefficients
Standardized Coefficients
Model B Std. Error Beta t Sig.
(Constant) 2.202 .895 2.461 .016 Size_Index -.015 .076 -.025 -.203 .839 Org_support .294 .156 .221 1.883 .063 Ext_access_policy -.164 .149 -.148 -1.100 .274 Internal_sharing -.103 .127 -.102 -.811 .420 Perspect_state_data .372 .115 .343 3.244 .002 Concern_data_restrictions .110 .089 .111 1.240 .218
Value_stds -.067 .092 -.068 -.726 .470 Impact_state_data .104 .114 .095 .914 .363 Staff_org_change -.172 .132 -.128 -1.301 .197 Staff_develop .057 .126 .047 .456 .650 Buss_needs .266 .098 .247 2.705 .008 Pol_ext_access -.237 .077 -.260 -3.056 .003
1
Term_coll -.036 .041 -.076 -.898 .371
a Dependent Variable: Outcome1