midwest spatial decision support systems partnership ... sdss partnership r… · midwest spatial...
TRANSCRIPT

Midwest Spatial Decision Support Systems Partnership (MSDSSP) Accomplishments Report
“Science and Technology for Environmental Solutions”
June 4, 2013

MSDSSP Accomplishments Report P a g e | 2
Table of Contents EXECUTIVE SUMMARY ................................................................................................................................................................................................................ 3
NEW TECHNOLOGIES AND DECISION SUPPORT TOOLS ............................................................................................................................................................. 6
Lake Erie Forum Web Portal ................................................................................................................................................................................................... 6
Paw Paw River Watershed Groundwater Recharge Calculator ............................................................................................................................................ 6
The Water Withdrawal Assessment Tool (WWAT)................................................................................................................................................................ 7
Networked Neighborhoods .................................................................................................................................................................................................... 7
LiDAR Training ......................................................................................................................................................................................................................... 8
“Nowcasting” Water Quality with Virtual the Beach ............................................................................................................................................................ 9
60 Hour Beach Forecasting Models Study ............................................................................................................................................................................. 9
Long-term Hydrologic Impact Assessment Tool .................................................................................................................................................................. 10
Social Indicator Data Management and Analysis (SIDMA) ................................................................................................................................................. 10
MOVING INTO THE FUTURE, REALIZING THE VISION .............................................................................................................................................................. 11
Web-based Load Duration Curve ......................................................................................................................................................................................... 11
Emergency/Environmental Response Resources Registry (ER3) ........................................................................................................................................ 11
EnviroAtlas: Linking Ecosystems, People, and Well-being .................................................................................................................................................. 12
Environmental Learning Using Computer Interactive Decisions (ELUCID) ......................................................................................................................... 12
IWR – TNC – Mott Sediment and Groundwater Recharge Calculator ................................................................................................................................ 13
Great Lakes Watershed Management System .................................................................................................................................................................... 13
Appendix A – LEVERAGING SCARCE RESOURCES ..................................................................................................................................................................... 14
Appendix B – THE IMPACT OF THE PARTNERSHIP ................................................................................................................................................................... 16
Appendix C – THE PUBLIC FACE OF THE PARTNERSHIP ........................................................................................................................................................... 19
Appendix D – CASE STUDIES ..................................................................................................................................................................................................... 20

MSDSSP Accomplishments Report P a g e | 3
EXECUTIVE SUMMARY back to>>Table of Contents
Established in 2002, the Midwest Spatial Decision-Support System (MSDSS) Partnership, an innovative federal-state-local-academic collaboration, is in its eleventh year of applying scientific and technological expertise to solve current and evolving environmental problems in the Great Lakes and Upper Mississippi Watersheds. During its first decade, the Partnership developed and disseminated tools for water resource management, with an emphasis on bridging the gap between best-available science and the practical needs of local decision-makers. Unique within the EPA, the Partnership links tool developers from multiple agencies and academic institutions with local users—creating a feedback loop that ensures that tools are both useful and user-friendly. The tools, developed with the idea that the power to solve environmental problems should be freely available via the World Wide Web to local officials, natural resource managers, and the general public, breaking down the barriers that hinder the integration of science with local decision-making. As knowledge about environmental stressors, and new technologies emerge, the partnership evolves to meet today’s challenges. From its inception, the Partnership has been a proving ground for EPA’s for using freely available webware to drive sustainability in water resources and communities. Partnership tool developers and agencies work together in a synergistic, and cost effective manner.
Primary members of the Midwest Partnership include: • U.S. Environmental
Protection Agency • Michigan State University,
Institute of Water Research • Purdue University,
Agricultural and Biological Engineering Department
• University of Wisconsin-Extension
• Wisconsin Department of Natural Resources
• Great Lakes Commission • U.S. Geological Survey
New members of the Midwest Partnership include:
• University of Michigan's Cooperative Institute for Limnology and Ecosystem Research
• University of Minnesota, Water Resources Center
• U.S. Army Corps of Engineers, St. Paul District
o Local and regional planning commissions
• Desert Research Institute

MSDSSP Accomplishments Report P a g e | 4
NEW TECHNOLOGIES AND APPLICATIONS back to>>Table of Contents
The Midwest Partnership continues to address watershed management goals and priorities, combining existing tools, while evolving to take advantage of new and emerging technologies and social media trends; for example:
• Networked Neighborhoods for Eco-Conservation Online (NECO) creates a network of people planning and using green practices (e.g. rain barrels, rain gardens). 233 users have reported 1,088 practices on the site. The website maps these practices and reports pollutant reductions using L-THIA.
• Great Lakes Watershed Management System (GLMS) maps sediment and nutrient loadings to waters online, and conducts BMP scenario modeling. IWR’s High Impact Targeting (HIT)* Program, will be merged with Purdue’s Long Term Hydrologic Impact Assessment model (L-THIA) and expanded to four larger GLRI priority subbasins: The Fox River of Wisconsin, the Maumee River of Ohio, the Saginaw River of Michigan, and the Genessee of New York. User testing is currently underway. A formal release is expected in the coming months.
• “Nowcasting” Water Quality with Virtual Beach Improves the accuracy of forecasting beach health advisories. The Wisconsin Dept. of Natural Resources (WDNR) EPA’s Ecosystems Research Division, USGS, and local health departments developed beach Nowcasts, using the “Virtual Beach”. Nowcasts use online data so beach managers can make quick, accurate decisions at a lower cost. Nowcast is available for over 30 beaches in Wisconsin, and other states across the Great Lakes.
MIDWEST PARTNERSHIP TOOLS DESCRIBED IN PREVIOUS REPORTS The partnership offers direct access to its own web-based, decision-support tools, as well as road maps to other websites where additional tools can be found. Digital Watershed http://35.8.121.101/water/index.htm Long-term Hydrologic Impact Assessment Tool (L-THIA) https://engineering.purdue.edu/mapserve/LTHIA7/ Web-based Load Duration Curve https://engineering.purdue.edu/~ldc/JG/duration/main.cgi Virtual Beach https://wcms.epa.gov/exposure-assessment-models/virtual-beach-vb/ Networked Neighborhoods for Eco-Conservation Online http://www.networkedneighbors.org/ SPARROW http://water.usgs.gov/nawqa/sparrow/ Water Withdrawal Assessment Tool http://www.miwwat.org/ EnviroAtlas (live URL coming soon)
Full descriptions of highlighted projects are provided in the report and Appendices

MSDSSP Accomplishments Report P a g e | 5
back to>>Table of Contents The Midwest Partnership Tools are continuously updated for use by communities in the Great Lakes Basin and beyond:
Social Media & Mobile Technologies: Lake Erie Forum Web Portal http://www.lakeerieforum.org/ Social Indicator Data Management and Analysis (SIDMA) http://www.iwr.msu.edu/sidma
Groundwater Recharge: Paw Paw River Watershed Groundwater Recharge Calculator http://35.9.116.206/tnc/ IWR – TNC – Mott Sediment and Groundwater Recharge Calculator
High-Resolution Aerial Imagery: LiDAR Training http://www.mngeo.state.mn.us/chouse/elevation/lidar.html
Beach Nowcasting and Forecasting: “Nowcasting” Water Quality at the Beach EPA Virtual Beach; Environmental Data Discovery and Transformation (EnDDaT) (http://www.epa.gov/ceampubl/swater/vb2/) (http://cida.usgs.gov/enddat/) 60 Hour Beach Forecasting Models Study http://www.glerl.noaa.gov/ftp/publications/tech_reports/glerl-156/tm-156.pdf Virtual Beach 2.3 (https://wcms.epa.gov/exposure-assessment-models/virtual-beach-vb/)
Emergency Preparedness and Response: Multi-State Pilot for a Great Lakes Regional Spill Response Resources Inventory: Emergency/Environmental Response Resources Registry (ER3)
Other Environmental Learning Using Computer Interactive Decisions (ELUCID) Great Lakes Watershed Management System
NEW CHALLENGES
The Midwest Partners leverage resources and work collaboratively with a diversity of organizations at every opportunity. Grant programs such as the Great Lakes Restoration Initiative (GLRI ), EPA’s National Environmental Information Exchange Network (NEIN), and many others have encouraged and supported these types of projects financially. The Midwest Partners will continue to spread the word to reach even more communities while facing challenges: -documenting environmental results from program implementation and to track implementation; -optimizing pollutant reduction practices called for in TMDLs; -reflect and plan for Climate Change in our water quality planning; -shrinking funding and staff at all levels of government and resource organizations.
The Partners will continue to find innovative ways to engage the public with handheld best management practice (BMP) apps, group website hubs, and share information to measure the cumulative impacts of these activities in virtual geographic communities.

MSDSSP Accomplishments Report P a g e | 6
NEW TECHNOLOGIES AND DECISION SUPPORT TOOLS back to>>Table of Contents
Lake Erie Forum Web Portal In collaboration with the Ohio Environmental Council, the Institute of Water Research at Michigan State University (IWR) developed a web portal for the Lake Erie Lakewide Action and Management Plan (LaMP) Public Forum. This portal, funded by EPA through a GLRI grant, is a one-stop shop for all Lake Erie related information, with sources from both the United States and Canada. It features useful facts on Lake Erie, current research activities, policies and laws involving Lake Erie, a video gallery, and decision support tools such as web-based mapping applications. The mobile version of the site (http://lakeerieforum.org/m/) also allows farmers, teachers and citizens to utilize the information whether they are out in the farm field or canoeing on a river. Additionally, people concerned with Lake Erie's nutrient status can access the recently released Lake Erie Binational Nutrient Management Strategy at the portal. URL: http://www.lakeerieforum.org/
Paw Paw River Watershed Groundwater Recharge Calculator The Institute of Water Research at Michigan State University (IWR) collaborated with The Nature Conservancy (TNC) in 2010 to develop an online tool examining groundwater recharge in the Paw Paw River Watershed of southwest Michigan. The recharge calculator estimates the change in recharge to an aquifer based on land use/cover change and the number of acres converted. The calculator empowers local conservation organizations to evaluate spatially the impacts land cover changes and agricultural conservation practices have on groundwater recharge. IWR also created field-scale priority maps weighting recharge potential and erosion/sedimentation risk. TNC is using the tool and maps to coordinate conservation strategies with local conservation districts in the watershed. The project was funded by the Coca-Cola Foundation, in an effort to make its bottling plant in the watershed water neutral. The tool was expanded in 2012 to include the ability to estimate reductions of sediment loading based on estimates from the High Impact Targeting (HIT) model. URL: http://35.9.116.206/tnc/

MSDSSP Accomplishments Report P a g e | 7
The Water Withdrawal Assessment Tool (WWAT) back to>>Table of Contents The Water Withdrawal Assessment Tool (WWAT), designed for individuals preparing a new or increased water withdrawal, was jointly developed by the Groundwater Conservation Advisory Council, US Geological Survey, Department of Natural Resources, the Department of Environmental Quality, and Michigan State University to meet as part of Michigan's water withdrawal legislation. The web-based interface, developed by the Institute of Water Research at Michigan State University (IWR), helps users with potential water withdrawals to determine whether their proposed withdrawal will have an adverse resource impact on nearby streams.
URL: http://www.miwwat.org/ Networked Neighborhoods Networked Neighborhoods for Eco-Conservation Online (NECO) is a web-based tool created by Institute of Water Research (IWR) at Michigan State University and funded by the Great Lakes Protection Fund. The website helps individuals in the Great Lakes region map and share green practices (rain barrels, rain gardens, and other low impact practices) they have put in place or are interested in implementing. NECO uses both social networking and mapping technology to link people together with the common goals of improving the Great Lakes Basin, their watershed, town or their own back yard. The website summarizes the total water managed by these practices and reports pollutant reductions using Purdue University's Long Term Hydrologic Impact Analysis model (L-THIA) for nitrogen, phosphorus, sediment, and fecal coliform.
URL: http://www.networkedneighbors.org/

MSDSSP Accomplishments Report P a g e | 8
LiDAR Training back to>>Table of Contents Vendors contracted by the State of Minnesota have completed flights to provide full state coverage of Light Detection and Ranging (LiDAR) digital elevation data. Data for most of the state are now freely available by File Transfer Protocol (FTP). Data from the remaining seven counties are being processed and will be available by April 2013. In order to accelerate use of the LiDAR data in natural resource management and protection, the University of Minnesota Water Resources Center obtained a state grant to develop and deliver six training modules for natural resource professionals who use GIS. These modules were developed by an interagency team and delivered as hands-on workshops in computer laboratories across the state in 2012. The training materials are available on the web for self-study or review. A LiDAR user forum is now active, posting questions from users with answers by more experienced users. Both the training materials and user forum are available through the “Education and Training” section of the website. The data are being used widely in
Minnesota. Some of the applications for management of water quality and quantity are posted at the above website under “Uses of LiDAR in Minnesota”.
The training materials are available on the web for self-study or review. A LiDAR user forum is now active, posting questions from users with answers by more experienced users. Both the training materials and user forum are available through the website above, under “Education and Training”. In addition, LiDAR hydrology tools were developed by NRCS staff in Minnesota and posted on the MN Geo website above along with two videos explaining their use. The LiDAR derived digital elevation data are being used widely in Minnesota. Some of the applications for management of water quality and quantity are posted at the above website under “Uses of LiDAR in Minnesota”. The data allow for technology innovation and integration related to water resource protection and conservation through modeling, direct measurement of sediment losses from near-channel sources (stream banks, bluffs, and ravines), identification of priority management zones and potential water retention sites (depressions, culvert restrictions, constructed basins, etc.), and design of conservation structures. The LiDAR training project will end in June 2013. We are continuing to enhance the on-line training materials and will transfer them to the MN Geo website in June. We are also delivering webinars on use of LiDAR and related tools in that period. URL: http://www.mngeo.state.mn.us/chouse/elevation/lidar.html

MSDSSP Accomplishments Report P a g e | 9
“Nowcasting” Water Quality with Virtual the Beach back to>>Table of Contents Across the Great Lakes, local beach managers monitor microbial water quality and issue swim advisories or closures when unhealthy conditions are detected. Unfortunately, sampling and analysis take 18+ hours to complete, while conditions at the beach are changing. As such, decisions on whether or not to issue an advisory or closure are often incorrect, with negative public health as well as economic consequences. Developing and implementing real-time models for predicting (“nowcasting”) water quality has proven too complex and time-consuming for most local managers. Working with EPA’s Ecosystems Research Division, USGS, and local health departments, the Wisconsin Dept. of Natural Resources (WDNR) has developed a practical process for creating and operating beach Nowcasts, using the “Virtual Beach” decision-support system. Not only is the process built around routine management activities, but by connecting Nowcasts to online data via the Environmental Data Discovery and Transformation (EnDDaT) portal, beach managers can make more accurate decisions, more quickly, and at a lower cost.
Using these tools, Nowcast models have been created for 30 beaches in Wisconsin, with additional models in other states. Training and guidance on building and operating Nowcasts has been provided to managers and researchers across the Great Lakes.
60 Hour Beach Forecasting Models Study University of Michigan's Cooperative Institute for Limnology and Ecosystem Research participated in a project that used weather data from the National Weather Service (NWS) and the Great Lakes Environmental Research Laboratory`s Coastal Forecasting System to generate 60-hour forecasts of fecal bacteria at 24 beaches in Indiana, Wisconsin, Ohio, Michigan, New York, and Pennsylvania. The project compared the accuracy of its bacteria forecasts with standard tool’s predictions based on weather data collected at individual beaches and the previous day's bacteria concentration. It turns out that using the models, developed with the Virtual Beach 2.3 software, resulted in fewer errors at 70% of the sites. Principal conclusions and implications for future work: 1. At the sites studied, E.coli variation was influenced by weather patterns. 2. Forecast independent variables explain up to almost 40% of the variation in beach E.coli concentrations. 3. This study reinforced the concept that a beach with 5% or fewer samples exceeding the State Regulatory E. coli standard may not be suitable for predictive modeling. This allows a beach manager to quickly determine if a forecast DSS should be attempted if the samples exceeding the standard is above 5% and within the 42% range." If the models were used by more State and County Health Departments, more timely and accurate advisories could be issued, beach users would avoid or minimize risks, potentially
substantial economic impact of unnecessarily banning swimming at Great Lake beaches could be lowered and beaches could be ranked according to risks and targeted for remedial action.

MSDSSP Accomplishments Report P a g e | 10
Long-term Hydrologic Impact Assessment Tool back to>>Table of Contents Purdue University’s Department of Agricultural and Biological Engineering developed the Long-term Hydrologic Impact Assessment (L-THIA) tool to allow local planners, decision-makers, and the interested public to predict the impact of potential land use changes on stormwater runoff and various nonpoint source pollutants. L-THIA estimates long-term average annual runoff for land use and soil combinations based on actual long-term climate data for a user specified area. The model underlying L-THIA is a spatially distributed automation of the widely accepted curve number method developed by NRCS to relate direct runoff to 24-hour precipitation under various conditions. L-THIA estimates the loads of various pollutants based on empirically-derived coefficients for different land uses and agricultural practices. L-THIA is accessed and run on the World Wide Web or as a free extension to desktop ArcGIS software. Users can access several different versions of the tools. The L-THIA LID model represents an enhancement to the original model, used to simulate runoff and NPS pollution associated with low
impact development (LID) practices at lot to watershed scales, allowing comparison of runoff and pollutants between an initial condition and subsequent LID or conventional development. LID principles are reflected in the use of practices in the model to converge toward pre-development conditions being replicated and post-development impacts being reduced.
URL: https://engineering.purdue.edu/mapserve/LTHIA7/
Social Indicator Data Management and Analysis (SIDMA) Water quality problems have accumulated over many decades and may take decades to amend. Confirming that awareness and attitudes are changing and behaviors are being adopted in a watershed is one way that projects can demonstrate progress toward water quality goals. Social indicators provide consistent measures of social change within a watershed and can be used by managers at local, state, and federal levels to estimate the impacts of their efforts and resources. As part of the Social Indicators Planning and Evaluation System (SIPES) project, the Michigan State University Institute of Water Research developed a web-based project management aid that support SIPES watershed projects. The Social Indicator Data Management and Analysis (SIDMA) system organizes, analyzes, and visualizes social indicators, related to nonpoint source (NPS) management efforts through statistical and spatial relationships.
URL: www.iwr.msu.edu/sidma
MSDSSP Accomplishments Report P a g e | 11
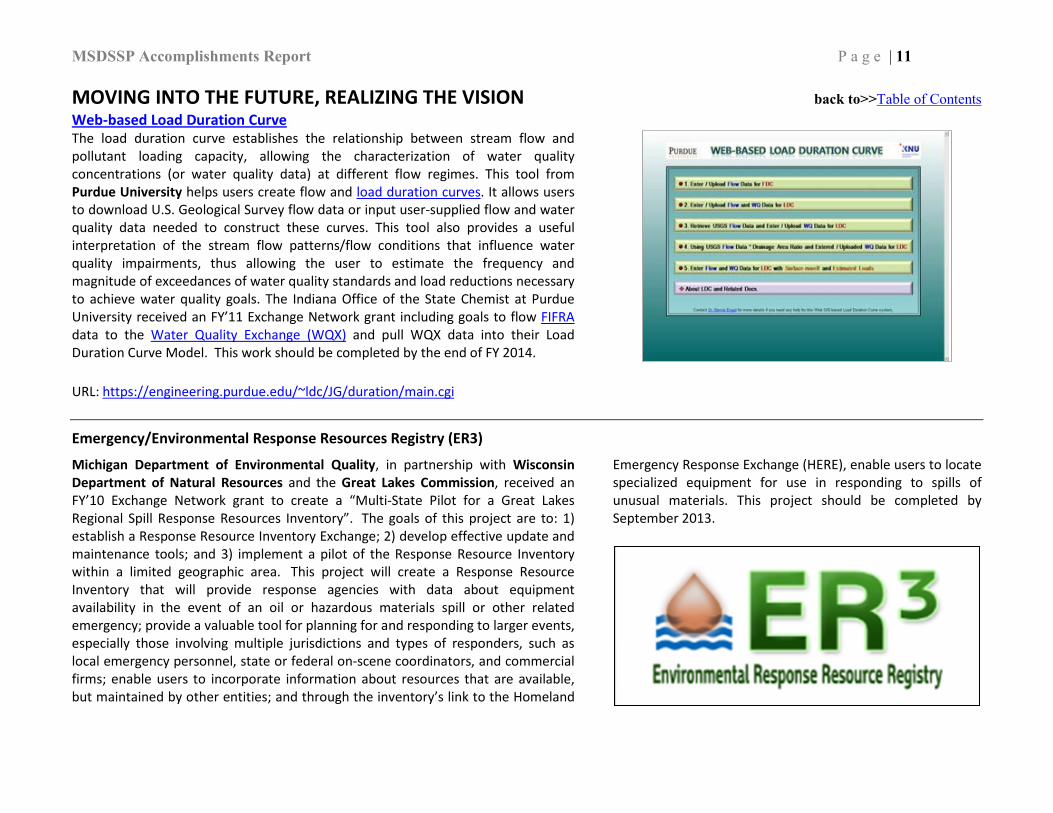
MOVING INTO THE FUTURE, REALIZING THE VISION back to>>Table of Contents Web-based Load Duration Curve The load duration curve establishes the relationship between stream flow and pollutant loading capacity, allowing the characterization of water quality concentrations (or water quality data) at different flow regimes. This tool from Purdue University helps users create flow and load duration curves. It allows users to download U.S. Geological Survey flow data or input user-supplied flow and water quality data needed to construct these curves. This tool also provides a useful interpretation of the stream flow patterns/flow conditions that influence water quality impairments, thus allowing the user to estimate the frequency and magnitude of exceedances of water quality standards and load reductions necessary to achieve water quality goals. The Indiana Office of the State Chemist at Purdue University received an FY’11 Exchange Network grant including goals to flow FIFRA data to the Water Quality Exchange (WQX) and pull WQX data into their Load Duration Curve Model. This work should be completed by the end of FY 2014.
URL: https://engineering.purdue.edu/~ldc/JG/duration/main.cgi
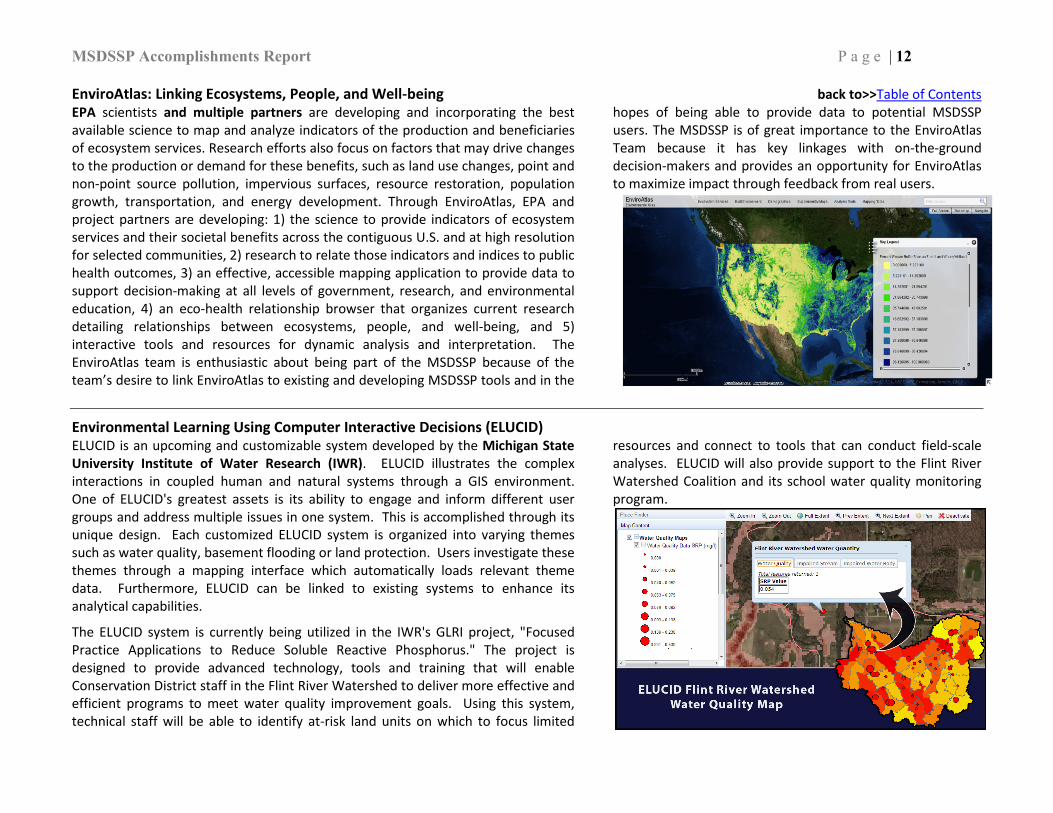
Emergency/Environmental Response Resources Registry (ER3)
Michigan Department of Environmental Quality, in partnership with Wisconsin Department of Natural Resources and the Great Lakes Commission, received an FY’10 Exchange Network grant to create a “Multi-State Pilot for a Great Lakes Regional Spill Response Resources Inventory”. The goals of this project are to: 1) establish a Response Resource Inventory Exchange; 2) develop effective update and maintenance tools; and 3) implement a pilot of the Response Resource Inventory within a limited geographic area. This project will create a Response Resource Inventory that will provide response agencies with data about equipment availability in the event of an oil or hazardous materials spill or other related emergency; provide a valuable tool for planning for and responding to larger events, especially those involving multiple jurisdictions and types of responders, such as local emergency personnel, state or federal on-scene coordinators, and commercial firms; enable users to incorporate information about resources that are available, but maintained by other entities; and through the inventory’s link to the Homeland
Emergency Response Exchange (HERE), enable users to locate specialized equipment for use in responding to spills of unusual materials. This project should be completed by September 2013.
MSDSSP Accomplishments Report P a g e | 12
EnviroAtlas: Linking Ecosystems, People, and Well-being back to>>Table of Contents EPA scientists and multiple partners are developing and incorporating the best available science to map and analyze indicators of the production and beneficiaries of ecosystem services. Research efforts also focus on factors that may drive changes to the production or demand for these benefits, such as land use changes, point and non-point source pollution, impervious surfaces, resource restoration, population growth, transportation, and energy development. Through EnviroAtlas, EPA and project partners are developing: 1) the science to provide indicators of ecosystem services and their societal benefits across the contiguous U.S. and at high resolution for selected communities, 2) research to relate those indicators and indices to public health outcomes, 3) an effective, accessible mapping application to provide data to support decision-making at all levels of government, research, and environmental education, 4) an eco-health relationship browser that organizes current research detailing relationships between ecosystems, people, and well-being, and 5) interactive tools and resources for dynamic analysis and interpretation. The EnviroAtlas team is enthusiastic about being part of the MSDSSP because of the team’s desire to link EnviroAtlas to existing and developing MSDSSP tools and in the
hopes of being able to provide data to potential MSDSSP users. The MSDSSP is of great importance to the EnviroAtlas Team because it has key linkages with on-the-ground decision-makers and provides an opportunity for EnviroAtlas to maximize impact through feedback from real users.
Environmental Learning Using Computer Interactive Decisions (ELUCID)ELUCID is an upcoming and customizable system developed by the Michigan State University Institute of Water Research (IWR). ELUCID illustrates the complex interactions in coupled human and natural systems through a GIS environment. One of ELUCID's greatest assets is its ability to engage and inform different user groups and address multiple issues in one system. This is accomplished through its unique design. Each customized ELUCID system is organized into varying themes such as water quality, basement flooding or land protection. Users investigate these themes through a mapping interface which automatically loads relevant theme data. Furthermore, ELUCID can be linked to existing systems to enhance its analytical capabilities.
The ELUCID system is currently being utilized in the IWR's GLRI project, "Focused Practice Applications to Reduce Soluble Reactive Phosphorus." The project is designed to provide advanced technology, tools and training that will enable Conservation District staff in the Flint River Watershed to deliver more effective and efficient programs to meet water quality improvement goals. Using this system, technical staff will be able to identify at-risk land units on which to focus limited
resources and connect to tools that can conduct field-scale analyses. ELUCID will also provide support to the Flint River Watershed Coalition and its school water quality monitoring program.

MSDSSP Accomplishments Report P a g e | 13
IWR – TNC – Mott Sediment and Groundwater Recharge Calculator back to>>Table of ContentsIn 2010, IWR worked with The Nature Conservancy and Coca-Cola to develop an on-line groundwater recharge calculator. In an effort to offset the withdrawals of a new bottling plant in Michigan’s Paw Paw River Watershed, Coca-Cola was interested in supporting land conservation practices that facilitate groundwater recharge. With collaboration from the Agricultural Engineering Department at Michigan State University, IWR built an on-line mapping interface where users could draw an area of BMP or land cover change, and then estimate a potential change in groundwater recharge. Recharge estimates are based on SWAT model outputs of various land cover and soil type combinations. TNC partnered with the Van Buren County Conservation District to identify priority locations and promote practices that optimize groundwater recharge. The tool was expanded in 2012 to include the ability to estimate sediment loading reductions based on estimates from the HIT model.
With new support from the Mott foundation, TNC and IWR are expanding the groundwater recharge and sediment calculators to all of Michigan’s Saginaw Bay basin. An initial version of the system is expected to be completed by the end of 2013.
Great Lakes Watershed Management SystemAs part of a continuing partnership with U.S. Army Corps of Engineers and Purdue University to reduce sediment and nutrient loading to Great Lakes waters, IWR is developing a Great Lakes Watershed Management System (GLWMS). The system will allow users to map sediment and nutrient loadings at various watershed scales, and conduct field-scale BMP scenario modeling. The joint effort is an expansion of previous Corps funded projects to provide similar analysis tools to the Burns-Ditch/Trail Creek and Swan Creek watersheds. However, whereas those previous efforts were applied to relatively small watersheds, the GLWMS will be initially available for four larger basins: The Fox River of Wisconsin, the Maumee River of Ohio, the Saginaw River of Michigan, and the Genessee of New York. These basins were selected as pilots because of their identification as priority area under GLRI. The GLWMS links IWR’s High Impact Targeting (HIT) model and Purdue’s Long Term Hydrologic Impact Assessment model (L-THIA) in a single
on-line mapping interface. User testing is currently underway. A formal release is expected in the coming months, followed by proposals to expand the GLWMS beyond its initial pilot watersheds.

MSDSSP Accomplishments Report P a g e | 14
Appendix A – LEVERAGING SCARCE RESOURCES back to>>Table of Contents Michigan State University’s Institute of Water Research Lake Erie Forum web portal funding: The Institute of Water Research received $75,000 as a sub-grantee from Ohio Environmental Council on an EPA Lake Erie LaMP GLRI project totaling $242,837. University of Minnesota’s Water Resources Center The total cost of LiDAR acquisition was approximately $12 million, paid primarily by the State of Minnesota ($9.5 million) with the remainder from local and federal government funds. Federal partners were the US Army Corps of Engineers and USGS. Additionally, counties contributed 100 surveyed control points each. Additional state grant of $180,000 covered the development and delivery of six training modules for natural resource professionals who use GIS. Purdue University The series of L-THIA models which have been developed from 1998 through 2013 have resulted from many collaborations, often with MSDSS partners such as Institute of Water Research at Michigan State University. The products have included web-based spreadsheets, map-based models, desktop GIS plug-ins, Python and C# versions, and were performed at local, regional and national scope. The research effort has stretched across 15 years with over $2 million in research funds. The diverse funding agencies include federal and state agencies including US EPA, USDA NRCS, and the US Army Corps of Engineers, through participation in three USDA CIG grants (in several states), two Indiana 319 grants, two EPA NEIEN grants, projects with Wisconsin Department of Natural Resources, Indiana Department of Natural Resources, Office of Indiana State Chemist, Indiana Department of Transportation, Indiana Department of Environmental Management, Indiana University (IU), Indiana University – Purdue University Indianapolis (IUPUI), and Purdue University Cooperative Extension. The most up-to-date L-THIA model uses an open-source database and map-serving engine which creates streaming map services from both the inputs and outputs. This technology is used in DriftWatch projects and was instrumental in securing a NEIEN Exchange network grant for WQX operations on FIFRA data. The Web 2.0 technology developed on L-THIA projects has been re-positioned in other unrelated projects at Purdue, such as the DriftWatch project, a database-driven map which displays crowd-sourced data about Pesticide Sensitive Areas over the aerial photos of Google maps. That project has also garnered hundreds of thousands of state, federal and industry dollars on its 5 year path of growing from a single state map to becoming a stand-alone, hot-for-profit spun-off from Purdue and able to display data from any state. University of Michigan's Cooperative Institute for Limnology and Ecosystem Research 60 Hour Beach Forecasting Models received $140,586 from 2010 GLRI GLNPO Funding (Grant GL-00E00658).

MSDSSP Accomplishments Report P a g e | 15
Purdue University’s Office of the Indiana State Chemist back to>>Table of Contents Office of the Indiana State Chemist received $197,676 from 2011 Exchange Network Grant funding (OS-83609801) for developing the Web-based Load Duration Curve tool. Michigan Department of Environmental Quality, in partnership with Wisconsin Department of Natural Resources and the Great Lakes Commission Emergency/Environmental Response Resources Registry (ER3) project received $343,219 from the 2010 Exchange Network Grant funding (OS-83462501).

MSDSSP Accomplishments Report P a g e | 16
“Nowcasting” Water Quality At the Beach
and 60 Hour Beach Forecasting Models Study
Two projects of the Partnership created new beach water quality management tools while sharing a set of targeted beaches.
L-THIA
Using the L-THIA watershed delineation tool, partners produced several customized regional map models: Fort McCoy, Root River, Swan Creek, Burns Ditch & Trail Creek.
Michigan State University, Institute of Water Research
MSU-IWR has worked on the Great Lakes Watershed Management System, Lake Erie Forum, Networked Neighborhoods for Eco-Conservation Online, Paw Paw River Watershed Groundwater Recharge Calculator, and Environmental Learning UCID projects.
Appendix B – THE IMPACT OF THE PARTNERSHIP back to>>Table of Contents
MSDSSP Accomplishments Report P a g e | 17
L-THIA Watershed Plan Projects back to>>Table of Contents
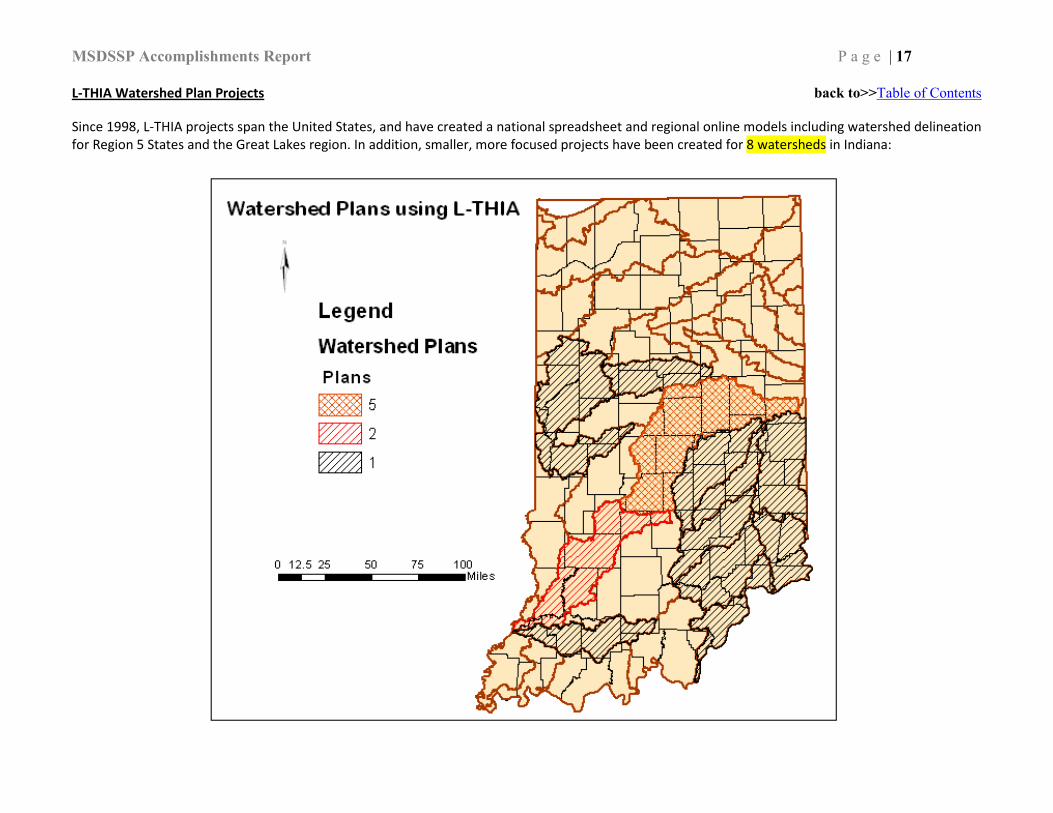
Since 1998, L-THIA projects span the United States, and have created a national spreadsheet and regional online models including watershed delineation for Region 5 States and the Great Lakes region. In addition, smaller, more focused projects have been created for 8 watersheds in Indiana:
MSDSSP Accomplishments Report P a g e | 18
back to>>Table of Contents
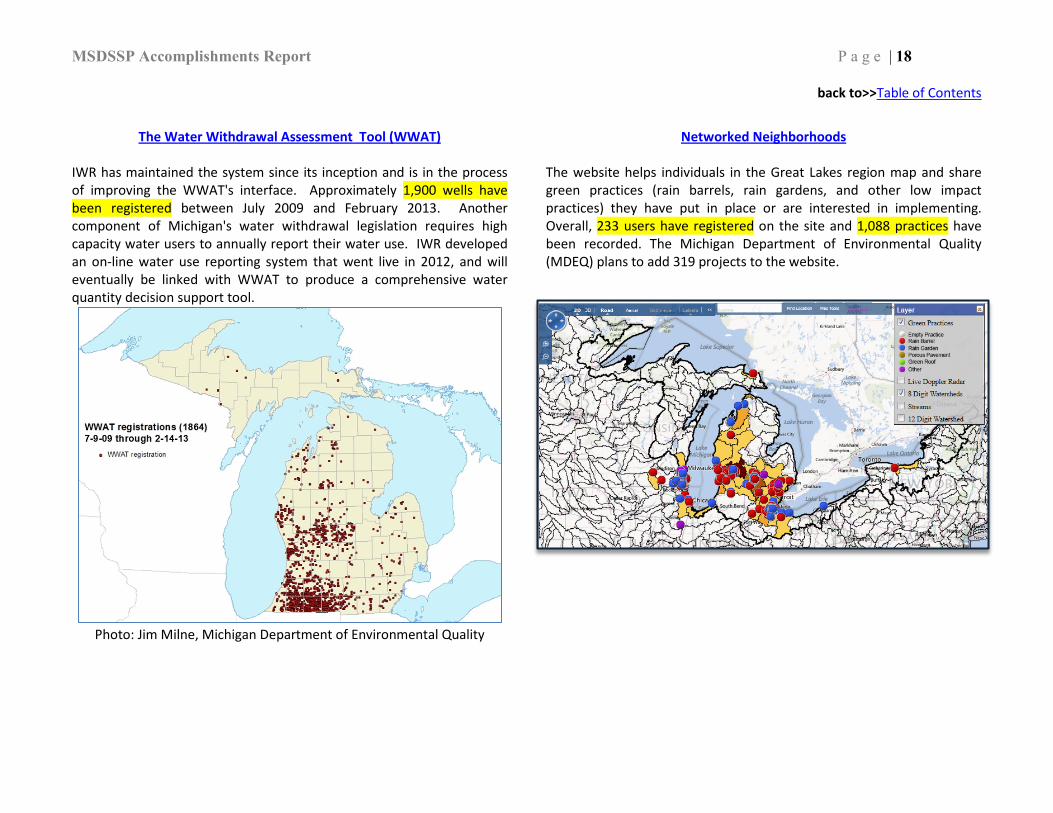
The Water Withdrawal Assessment Tool (WWAT)
IWR has maintained the system since its inception and is in the process of improving the WWAT's interface. Approximately 1,900 wells have been registered between July 2009 and February 2013. Another component of Michigan's water withdrawal legislation requires high capacity water users to annually report their water use. IWR developed an on-line water use reporting system that went live in 2012, and will eventually be linked with WWAT to produce a comprehensive water quantity decision support tool.
Photo: Jim Milne, Michigan Department of Environmental Quality
Networked Neighborhoods The website helps individuals in the Great Lakes region map and share green practices (rain barrels, rain gardens, and other low impact practices) they have put in place or are interested in implementing. Overall, 233 users have registered on the site and 1,088 practices have been recorded. The Michigan Department of Environmental Quality (MDEQ) plans to add 319 projects to the website.

MSDSSP Accomplishments Report P a g e | 19
Appendix C – THE PUBLIC FACE OF THE PARTNERSHIP back to>>Table of Contents
Lake Erie Forum web portal has received in excess of 50,000 hits. Lake Erie LaMP manager Dan O’Riordan said he uses the site regularly. Networked Neighborhoods
During 2012, 68 new users registered an account with NECO and 220 new practices were recorded. Overall, 233 users have registered on the site and 1,088 practices have been recorded. The Michigan Department of Environmental Quality (MDEQ) plans to add 319 projects to the website. IWR expects to improve NECO's interface and make it accessible on mobile devices during 2014.
Social Indicator Data Management and Analysis (SIDMA) To date, the system has 105 SIDMA projects on the website. Ninety-six of these projects are in Illinois, Indiana, Michigan, Minnesota, Ohio and Wisconsin.
Long-term Hydrologic Impact Assessment Tool
Google Analytics data have been collected on most of the various L-THIA web pages. Since June 2009, when we started tracking, we have had 19,000 different people visit 41,200 times, and they made a total of 200,000 “hits” or page views:
States (2009 – 2013) L-THIA Unique Visitors Indiana 15,955 Wisconsin 5229 Michigan 4838 Illinois 2233 Minnesota 660 New York 443 California 456 Virginia 335 Massachusetts 346
The Midwest Partnership website (http://www.iwr.msu.edu/mwdssp/) has been migrated from EPA to the Michigan State University Institute of Water Research, and is currently being updated. After more than 10 years, the Midwest Partnership has expanded its collaborative network to include new partners and projects.

MSDSSP Accomplishments Report P a g e | 20
Appendix D – CASE STUDIES back to>>Table of Contents
North Beach, Racine, Wisconsin Upper Lake Park Beach, Port Washington, Wisconsin Zoo Beach, Racine, Wisconsin Fort McCoy Wathershed Plans Making use of Region 5 GIS Training materials

Beach Water-quality Nowcast Model Case Study
North Beach, Racine, Wisconsin
Located just north of Racine’s harbor, North Beach (Figure 1) is among the most popular beaches on the Great Lakes and has been the focus of a long-term applied research program that has resulted in a series of innovations in the testing, management, and restoration of recreational water quality. These innovations have resulted in dramatic improvements in water quality over the past decade, reduced public health risk, and fewer beach closures. Since 2004, North Beach has been certified as a Blue Wave beach by the national Clean Beaches Council, the first beach in Wisconsin and second on the Great Lakes to be so recognized.
Figure 1. North Beach, Racine, Wisconsin. Racine’s Parks, Recreation, and Cultural Services Department maintains North Beach and is responsible for daily beach grooming, beach improvements, and lifeguard services throughout the summer. Based on daily counts by lifeguards in 2010 and 2011, total annual visits to North Beach are estimated at between 70,000 and 90,000. Major annual events include the two-day “Spike ‘n Splash,” which generates 200 hotel room stays, and the Ironman Racine Triathalon, which attracts 2,000 athletes from around the country. The city administration has estimated that these activities, coupled with regular visitation, generate as much as $5 million each year for the local economy1.
1 Garret, Ronnie. 2012. “A Day at the Beach.” Corporate Report Wisconsin. 2623(August). Available online: http://crwmag.com/issue/august-2012/article/a-day-at-the-beach.

Beach Water-quality Nowcast Model Case Study
Responsibility for monitoring water quality falls with the Racine Health Department, which sends monitoring personnel to collect samples five days per week (Monday through Friday) at four fixed stations along 1,980 ft. of shoreline (Figure 1). Samples are composited and tested for the bacterium E. coli in the health department’s laboratory. Tests include both the standard 18-hour, colilert analysis and a 2-hour, quantitative polymerase chain reaction (qPCR) analysis. Racine is the only jurisdiction to date approved by the U.S. EPA to use qPCR for operational water-quality testing. Racine is also the first jurisdiction to employ a standardized beach sanitary survey to identify likely sources and pathways of microbial contamination. Sanitary surveys entail intensive spatiotemporal sampling of water quality and measurements of associated nearshore, onshore, and hydro-meteorological conditions over the course of one or more beach seasons. In 2004, North Beach was posted with 21 swim advisories and three beach closures. By 2010, there was just one advisory and in 2011 there were only three. Sanitary surveys have informed several beach improvements and best management practices contributing to these reductions, including beach re-grading, improved grooming practices, dune stabilization, and the redesign of the English Street stormwater outfall. During most rainfall events, stormwater flowing into the redesigned system is routed through two “vorceptors” (which settle debris and particulates) followed by a series of wetland cells before discharging into the lake via an outlet at Zoo Beach to the north. During large rainfall events, excess stormwater bypasses the bio-filtration system and discharges into the lake at the northern extent of the beach (Figure 1). Depending on the speed and direction of the nearshore current, large rainfall events can cause high E. coli levels at the beach. Nowcast Models Separate nowcast models were developed for North Beach for the 2011 and 2012 beach seasons, respectively. The 2011 nowcast model was built by the Wisconsin DNR using Virtual Beach 2.1 with input and suggestions provided by beach monitoring staff at the Racine Health Department. The finished model was provided as a Virtual Beach model (.VBMX) file, for operation using that software. For the 2012 nowcast, Wisconsin DNR staff conducted data assembly, formatting, and model set-up, while Racine Health Department staff took the lead on building the model from a shared Virtual Beach project (.VBPX) file. The full process of data assembly, model set-up, and model-building is described in detail in the report Building Operational “Nowcast” Models for Predicting Water Quality at Five Lake Michigan Beaches2. The 2011 North Beach nowcast model was specified as:
LN(Ecoli) = 0.3824 - 0.116*(PROD(Rain24,Rain48)) + 0.6694*(SQUAREROOT(Rain48)) - 10.72*(PROD(Rain48,CurrentEast)) + 4.062*(PROD(Rain48,CurrentNorth)) + 0.000448*(PROD(Discharge,Cloudy)) - 0.4114*(Sunny) + 0.4737*(WaveHeight_ft) - 0.1971*(PROD(Rain24,WaveHeight_ft)) + 0.03915*(WaterTemp_F) - 0.7231*(ClearWater) - 2.886*(PROD(CurrentNorth,ClearWater)) + 0.9655*(QUADROOT(PROD(Rain24,Pre_June21))) + 0.1446*(QUADROOT(PROD(Discharge,June21_July15))) + 1.32*(QUADROOT(PROD(Rain24, July16_Aug10))) + 0.3075*(QUADROOT(PROD(WaterTempF,Post_Aug10)))
2 Mednick, A.C. 2012. Building Operational “Nowcast” Models for Predicting Water Quality at Five Lake Michigan Beaches. PUB-SS-1098. Bureau of Science Services, Wisconsin Department of Natural Resources, Madison.

Beach Water-quality Nowcast Model Case Study
The 2012 North Beach nowcast model was specified as:
LOG10(Ecoli) = -4.377 + 0.2074*(July16_Aug10) - 0.1271*(Sunny) - 0.312*(ClearWater) - 0.3463*(AlgBch_None) + 1.257e-06*(SQUARE(Gulls)) - 136.4*(INVERSE(DOY,59.5)) + 0.7114*(POLY(RRAIN24,1.2171673,0.048945098,-0.00066772263)) + 2.949*(POLY(Q168,1.3845188,-0.00012402325,8.6777287e-08)) + 1.376*(POLY(Q504,1.3083821,0.00075025842,-7.3351447e-07)) - 23.84*(INVERSE(Qmax672,19.5)) + 0.7337*(WaveO_comp(WVHT,WVDIR,-17.35))
Where: Ecoli = E. coli (MPN/ 100mL) — Measured by the Racine Health Dept.
AlgBch_None = Algae on beach? (n=0/ y=1) — Measured by the Racine Health Dept. Cloudy = Sky condition (y=1/ n=0) — Measured by the Racine Health Dept. ClearWater = Water “clear”? (y=1/ n=0) — Measured by the Racine Health Dept. CurrentEast = Surface Water Velocity towards 90° (meters/sec) — GLCFS, NOAA CurrentNorth = Surface Water Velocity towards 0° (meters/sec) — GLCFS, NOAA Discharge = Root River Discharge, instantaneous (ft3/sec) — USGS Gage DOY = Day of year (1-365) Gulls (count of birds) — Measured by the Racine Health Dept. June21_July15 = Between these dates? (y=1/ n=0) July16_Aug10 = Between these dates? (y=1/ n=0) Post_Aug10 = After to August 10th? (y=1/ n=0) Pre_June21 = Prior to June 21st? (y=1/ n=0) Q168 = Root River Discharge, 7-day mean (ft3/sec) — USGS Gage Q504 = Root River Discharge, 21-day mean (ft3/sec) — USGS Gage Qmax672 = Root River Discharge, 28-day max (ft3/sec) — USGS Gage RAIN24 = Rainfall, 24 hours (in) — Racine Batten Airport RAIN48 = Rainfall, 48 hours (in) — Racine Batten Airport RRAIN24 = Rainfall, 24 hours (mm) — Radar Est. from the North Central River Forecasting Center, NOAA Sunny = Sky condition (y=1/ n=0) — Measured by the Racine Health Dept. WaveHeight_ft = Wave Height (ft.) — Estimated by the Racine Health Dept. WaveO_comp = Onshore Waves (meters) — Derived from:
Significant Wave Height (meters) — GLCFS, NOAA Wave Direction (from 0-360 deg.) — GLCFS, NOAA
WaterTemp = Water Temperature (deg. F) — Measured by the Racine Health Dept And where:
LOG10 = logarithm, base 10 LN = natural logarithm POLY = polynomial transformation (a + bX + cX2) PROD = X1 * X2 QUADROOT = X1/4 SQUARE = X2 SQUAREROOT = X1/2
Beach Water-quality Nowcast Model Case Study
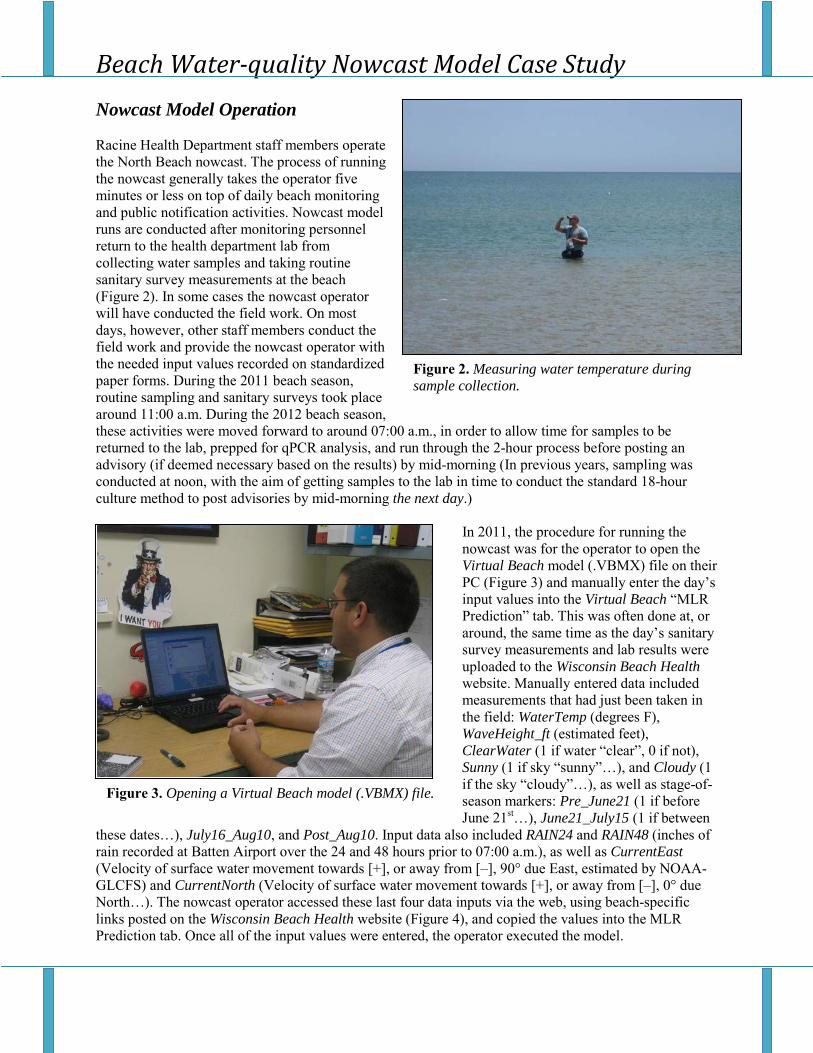
Nowcast Model Operation Racine Health Department staff members operate the North Beach nowcast. The process of running the nowcast generally takes the operator five minutes or less on top of daily beach monitoring and public notification activities. Nowcast model runs are conducted after monitoring personnel return to the health department lab from collecting water samples and taking routine sanitary survey measurements at the beach (Figure 2). In some cases the nowcast operator will have conducted the field work. On most days, however, other staff members conduct the field work and provide the nowcast operator with the needed input values recorded on standardized paper forms. During the 2011 beach season, routine sampling and sanitary surveys took place around 11:00 a.m. During the 2012 beach season, these activities were moved forward to around 07:00 a.m., in order to allow time for samples to be returned to the lab, prepped for qPCR analysis, and run through the 2-hour process before posting an advisory (if deemed necessary based on the results) by mid-morning (In previous years, sampling was conducted at noon, with the aim of getting samples to the lab in time to conduct the standard 18-hour culture method to post advisories by mid-morning the next day.)
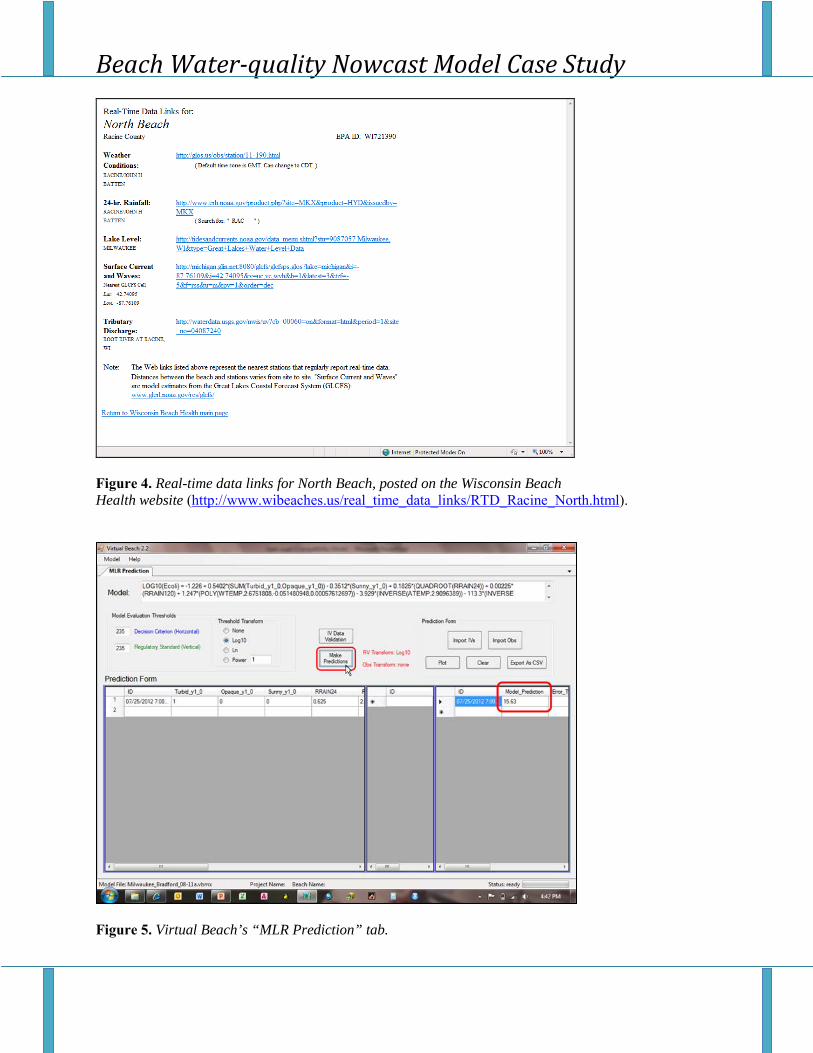
In 2011, the procedure for running the nowcast was for the operator to open the Virtual Beach model (.VBMX) file on their PC (Figure 3) and manually enter the day’s input values into the Virtual Beach “MLR Prediction” tab. This was often done at, or around, the same time as the day’s sanitary survey measurements and lab results were uploaded to the Wisconsin Beach Health website. Manually entered data included measurements that had just been taken in the field: WaterTemp (degrees F), WaveHeight_ft (estimated feet), ClearWater (1 if water “clear”, 0 if not), Sunny (1 if sky “sunny”…), and Cloudy (1 if the sky “cloudy”…), as well as stage-of-season markers: Pre_June21 (1 if before June 21st…), June21_July15 (1 if between
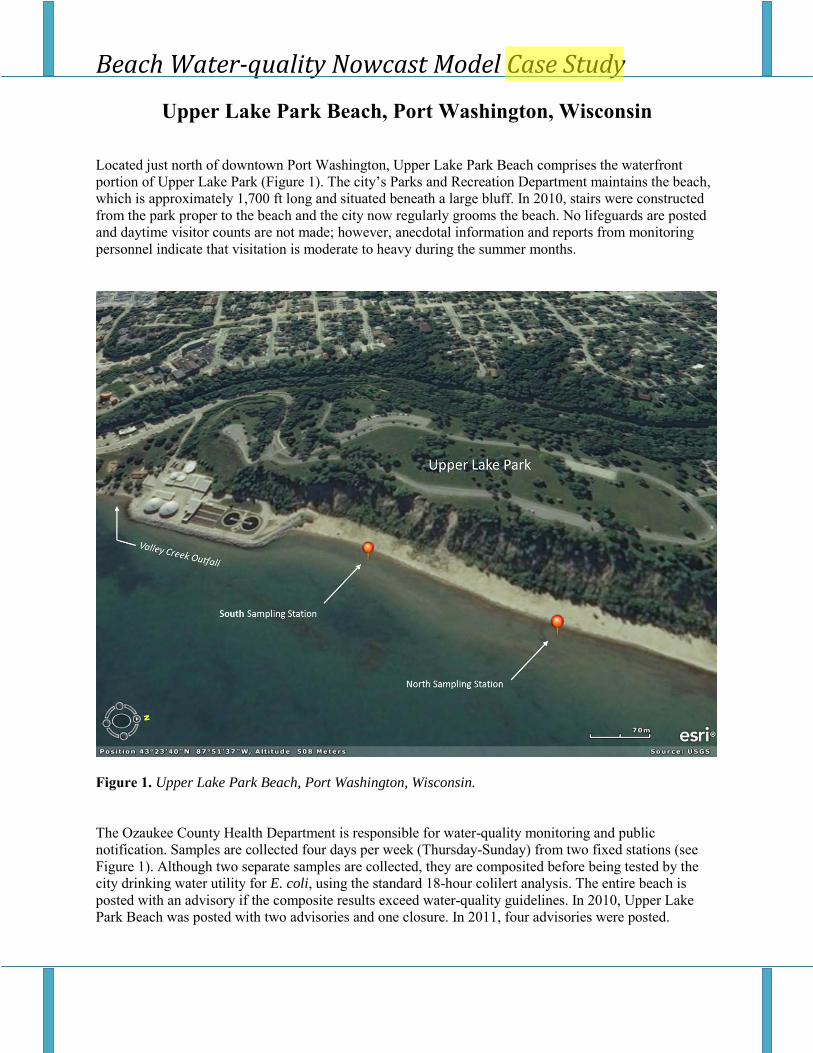
these dates…), July16_Aug10, and Post_Aug10. Input data also included RAIN24 and RAIN48 (inches of rain recorded at Batten Airport over the 24 and 48 hours prior to 07:00 a.m.), as well as CurrentEast (Velocity of surface water movement towards [+], or away from [–], 90° due East, estimated by NOAA-GLCFS) and CurrentNorth (Velocity of surface water movement towards [+], or away from [–], 0° due North…). The nowcast operator accessed these last four data inputs via the web, using beach-specific links posted on the Wisconsin Beach Health website (Figure 4), and copied the values into the MLR Prediction tab. Once all of the input values were entered, the operator executed the model.
Figure 2. Measuring water temperature during sample collection.
Figure 3. Opening a Virtual Beach model (.VBMX) file.
Beach Water-quality Nowcast Model Case Study
Figure 4. Real-time data links for North Beach, posted on the Wisconsin Beach Health website (http://www.wibeaches.us/real_time_data_links/RTD_Racine_North.html).
Figure 5. Virtual Beach’s “MLR Prediction” tab.

Beach Water-quality Nowcast Model Case Study
The procedure for running the 2012 nowcast model was somewhat different, allowing for additional “automated” data inputs via the U.S. Geological Survey’s Environmental Data Discovery and Transformation (ENDDAT) system3. The operator used a custom ENDDAT web URL (developed by Wisconsin DNR staff) to download a one-row table of the most recent values of several model inputs, including: Q168 and Q504 (7-day and 21-day average Root River discharge, ft3/sec mean), Qmax672 (28-day maximum Root River discharge, ft3/sec), RRAIN24 (millimeters of rain estimated by radar over the past 24 hours), and Significant Wave Height (meters) and Direction (0-360 degrees), as well as DOY (day of year, 1-365). The daily ENDDAT table was then imported into the Virtual Beach MLR Prediction tab, leaving the operator to manually-enter the remaining values: AlgBch_None (1 if there is any algae on the beach, 0 if none), Gulls (estimated number of gulls present), ClearWater (1 if water “clear”…), Sunny (1 if sky “sunny”…), and July16_Aug10 (1 if between these dates…). Once all of the input values were entered, the operator executed the model to make a prediction (Figure 5). Outputs of the nowcast included the estimated concentration of E. coli, as well as the statistical probability of exceeding the 235 CFU/100 mL water-quality standard. Health department staff used these outputs together with qPCR and sanitary survey results as multiple lines of evidence for determining whether or not to post a water-quality advisory or close the beach. The nowcast was generally conducted while qPCR analysis was in progress. Whereas the process of conducting the nowcast takes five minutes or so, the process of conducting qPCR typically takes two hours, including sample preparation, system operation, and output interpretation (Figure 6). As they are completed, nowcast predictions, 18-hour lab results, and qPCR are displayed alongside one another for daily comparison and validation (Figure 7).
Figure 6. Conducting qPCR analysis. clockwise from top left: sample preparation (A-B), setting-up a qPCR run (C), and displayed results (D).
3 http://cida.usgs.gov/enddat/

Beach Water-quality Nowcast Model Case Study
Figure 7. Daily comparison of Virtual Beach results to standard lab and qPCR results. Nowcast Results The 2011 North Beach nowcast was operated from June 10 through September 6. During that period, the model correctly predicted non-exceedances on 2 days when North Beach would otherwise have been posted, based on the previous days’ 18-hour lab results. Both of these decisions were confirmed by qPCR results. For the 2012 beach season, the Racine Health Department was granted special permission by the U.S. EPA to use qPCR results for regulatory purposes; i.e. posting swim advisories or issuing beach closures. The 2012 nowcast was operated simultaneously with qPCR from June 28 through August 31. Rather than using nowcast-predicted concentrations of E. coli as the basis for posting advisories, the health department used model-estimated exceedance probabilities in conjunction with qPCR results – and in some cased, field-observed beach conditions such as strong onshore winds following rainfall – as multiple lines of evidence for posting advisories. On two occasions during the summer of 2012, nowcast exceedance probabilities indicated that qPCR results were incorrectly in exceedance of 235 CFU/100 mL advisory threshold. This was confirmed by secondary qPCR analysis and the following days’ 18-hour lab results. This combined approach resulted in the posting two swim advisories and one beach closure that otherwise would have been missed, two avoided advisories that otherwise would have been posted, and one avoided closure that otherwise would have been issued.

Beach Water-quality Nowcast Model Case Study
.
Bureau of Science Services Wisconsin Department of Natural Resources
P.O. Box 7921 Madison, WI 53707-7921
Miscellaneous Publication PUB-SS-1100 2012
Author: Adam C. Mednick Editor: Dreux J. Watermolen ______________________________________________________________________________
The Wisconsin Department of Natural Resources provides equal opportunity in its employment, programs, services, and functions under an Affirmative Action Plan. If you have any questions regarding this plan, please write to Equal Opportunity Office, Department of Interior, Washington, DC 20240.
This publication is available in alternative format (large print, Braille, audio tape, etc.) upon request. Please call (608) 266-0531 for more information.
This project was funded by the Wisconsin Coastal Management Program and the National Oceanic and Atmospheric Administration, Office of Ocean and Coastal Resources Management under the Coastal Zone Management Act, Grant #NA09NOS4190107. Points of view expressed in this report do not necessarily reflect the views or policies of the Wisconsin Coastal Management Program or National Oceanic and Atmospheric Administration.
Mention of trade names and commercial products does not constitute endorsement of their use.
Beach Water-quality Nowcast Model Case Study
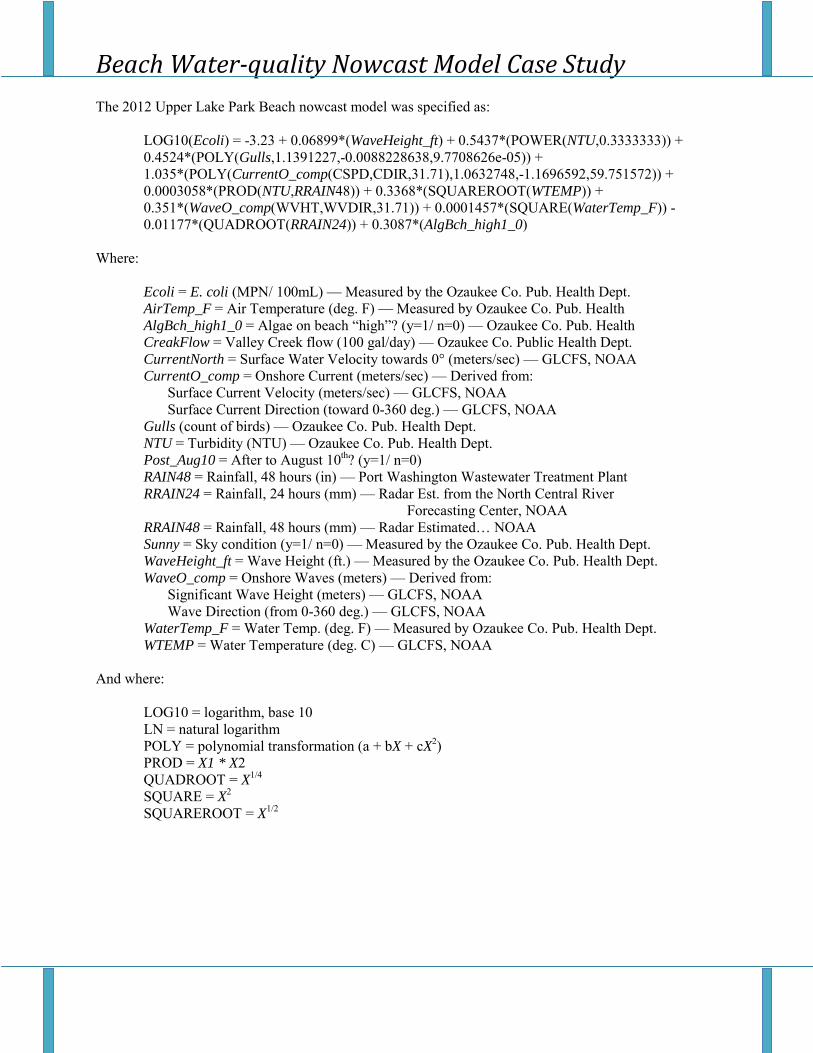
Upper Lake Park Beach, Port Washington, Wisconsin Located just north of downtown Port Washington, Upper Lake Park Beach comprises the waterfront portion of Upper Lake Park (Figure 1). The city’s Parks and Recreation Department maintains the beach, which is approximately 1,700 ft long and situated beneath a large bluff. In 2010, stairs were constructed from the park proper to the beach and the city now regularly grooms the beach. No lifeguards are posted and daytime visitor counts are not made; however, anecdotal information and reports from monitoring personnel indicate that visitation is moderate to heavy during the summer months.
Figure 1. Upper Lake Park Beach, Port Washington, Wisconsin. The Ozaukee County Health Department is responsible for water-quality monitoring and public notification. Samples are collected four days per week (Thursday-Sunday) from two fixed stations (see Figure 1). Although two separate samples are collected, they are composited before being tested by the city drinking water utility for E. coli, using the standard 18-hour colilert analysis. The entire beach is posted with an advisory if the composite results exceed water-quality guidelines. In 2010, Upper Lake Park Beach was posted with two advisories and one closure. In 2011, four advisories were posted.

Beach Water-quality Nowcast Model Case Study
In 2007, the county conducted a standardized sanitary survey of Upper Lake Park Beach to determine, in part, whether E. coli elevations at the beach were caused by effluent discharge from the nearby Port Washington wastewater treatment plant. Intensive spatiotemporal sampling and testing revealed that the treatment plant was not contributing to contamination events and that the principal source was stormwater discharge from Valley Creek, which outfalls just to the south of the plant (Figure 1). Microbial water quality was shown to be strongly correlated with rainfall and turbidity, as well as creek flow. Based on these findings, the health depart instituted the first multi-variate, early-warning system for beach water quality in Wisconsin, known as the “Rainflow” system. Rainflow recommended whether or not to post advisories based on whether threshold levels of measured rainfall, creek flow, and turbidity were exceeded. Ozaukee County is unique among local health departments in its routine operation of a stream gage to measure flow levels in the creek discharging near Upper Lake Park, as well as an in-house turbidity meter to quantitatively measure nearshore turbidity as part of its sanitary survey work. Turbidity is the most influential factor in water-quality exceedances at Upper Lake Park, and has been shown to be highly correlated to E. coli levels at beaches around the Great Lakes. Midway through the 2009 season, the Rainflow system was replaced with a statistical nowcast model developed by the Wisconsin DNR using the U.S. EPA’s Virtual Beach version 1. This system was an updated version of the original research-and-development software and had significant limitations related to conducting operational nowcasts. For example, running daily predictions required a custom spreadsheet-based system to operate the model. Experience gained through the field-testing of this combined system proved invaluable in terms of the guidance provided to the Wisconsin DNR and U.S. EPA on how future versions of Virtual Beach should function to better facilitate operational nowcasting. A re-vamped Virtual Beach version 2.0 was released in 2010; however, it was not in time for the beach season. The original hybrid system was employed for the 2010 nowcast. Nowcast Models Separate nowcast models were developed for Upper Lake Park Beach for the 2011 and 2012 beach seasons, respectively. 2011 marked the first year in which the re-vamped Virtual Beach was used as the stand-alone system for nowcasting water quality. Both years’ models were built by the Wisconsin DNR using the updated software (version 2.1 in 2011; version 2.2 in 2012). Beach monitoring staff at the Ozaukee County Public Health Department provided expert guidance and suggestions, based on their ongoing sanitary surveys. The finished models were provided as Virtual Beach model (.VBMX) files for local operation using the software. The full process of data assembly, model set-up, and model-building is described in detail in the report Building Operational “Nowcast” Models for Predicting Water Quality at Five Lake Michigan Beaches1. The 2011 Upper Lake Park Beach nowcast model was specified as:
LN(Ecoli) = -2.734 + 0.0745*(LN(PROD(CreekFlow, WaterTemp_F))) + 0.4303*(Rain48) + 0.9432*(LN(NTU)) + 0.0519*(WaterTemp_F) - 0.345*(PROD(WaveHeight_ft, Sunny)) + 0.176*(QUADROOT(PROD(AirTemp_F,Post_Aug10))) + 0.5388*(SQUAREROOT(WaveHeight_ft)) - 2.946*(CurrentNorth)
1 Mednick, A.C. 2012. Building Operational “Nowcast” Models for Predicting Water Quality at Five Lake Michigan Beaches. PUB-SS-1098. Bureau of Science Services, Wisconsin Department of Natural Resources, Madison.
Beach Water-quality Nowcast Model Case Study
The 2012 Upper Lake Park Beach nowcast model was specified as:
LOG10(Ecoli) = -3.23 + 0.06899*(WaveHeight_ft) + 0.5437*(POWER(NTU,0.3333333)) + 0.4524*(POLY(Gulls,1.1391227,-0.0088228638,9.7708626e-05)) + 1.035*(POLY(CurrentO_comp(CSPD,CDIR,31.71),1.0632748,-1.1696592,59.751572)) + 0.0003058*(PROD(NTU,RRAIN48)) + 0.3368*(SQUAREROOT(WTEMP)) + 0.351*(WaveO_comp(WVHT,WVDIR,31.71)) + 0.0001457*(SQUARE(WaterTemp_F)) - 0.01177*(QUADROOT(RRAIN24)) + 0.3087*(AlgBch_high1_0)
Where: Ecoli = E. coli (MPN/ 100mL) — Measured by the Ozaukee Co. Pub. Health Dept.
AirTemp_F = Air Temperature (deg. F) — Measured by Ozaukee Co. Pub. Health AlgBch_high1_0 = Algae on beach “high”? (y=1/ n=0) — Ozaukee Co. Pub. Health CreakFlow = Valley Creek flow (100 gal/day) — Ozaukee Co. Public Health Dept. CurrentNorth = Surface Water Velocity towards 0° (meters/sec) — GLCFS, NOAA CurrentO_comp = Onshore Current (meters/sec) — Derived from:
Surface Current Velocity (meters/sec) — GLCFS, NOAA Surface Current Direction (toward 0-360 deg.) — GLCFS, NOAA
Gulls (count of birds) — Ozaukee Co. Pub. Health Dept. NTU = Turbidity (NTU) — Ozaukee Co. Pub. Health Dept. Post_Aug10 = After to August 10th? (y=1/ n=0) RAIN48 = Rainfall, 48 hours (in) — Port Washington Wastewater Treatment Plant RRAIN24 = Rainfall, 24 hours (mm) — Radar Est. from the North Central River Forecasting Center, NOAA RRAIN48 = Rainfall, 48 hours (mm) — Radar Estimated… NOAA Sunny = Sky condition (y=1/ n=0) — Measured by the Ozaukee Co. Pub. Health Dept. WaveHeight_ft = Wave Height (ft.) — Measured by the Ozaukee Co. Pub. Health Dept. WaveO_comp = Onshore Waves (meters) — Derived from:
Significant Wave Height (meters) — GLCFS, NOAA Wave Direction (from 0-360 deg.) — GLCFS, NOAA
WaterTemp_F = Water Temp. (deg. F) — Measured by Ozaukee Co. Pub. Health Dept. WTEMP = Water Temperature (deg. C) — GLCFS, NOAA
And where:
LOG10 = logarithm, base 10 LN = natural logarithm POLY = polynomial transformation (a + bX + cX2) PROD = X1 * X2 QUADROOT = X1/4 SQUARE = X2 SQUAREROOT = X1/2

Beach Water-quality Nowcast Model Case Study
Nowcast Model Operation Beach monitoring staff at the Ozaukee County Health Department operate the Upper Lake Park Beach nowcast. The process of running the nowcast generally takes the operator five minutes or less per day, on top of routine beach monitoring and public notification activities. Nowcast model runs are conducted after monitoring personnel return to the health department office after collecting water samples and taking routine sanitary survey measurements at the beach (Figure 2) and recording flow in the nearby Valley Creek. On many days the nowcast operator is the same staff person who has conducted the field work. For parts of the season, summer interns may conduct the fieldwork and provide the nowcast operator with the needed input values recorded on standardized paper forms. Routine sampling and sanitary surveys take place around 07:00 a.m. CDT, allowing for ample time to run the model and post an advisory, if deemed necessary, by mid-morning. One additional step that is conducted for Upper Lake Park Beach is the measurement of actual turbidity, as opposed to a visual/subjective estimation of water clarity. A turbidity meter (Figure 3) is used to quantitatively measure the turbidity of water in nephelometric turbidity units (NTU). In 2011, the procedure for running the model was for the operator to open the Virtual Beach model (.VBMX) file on their PC and manually enter the day’s input values into the Virtual Beach MLR Prediction tab. This was often done at, or around, the same time as the day’s sanitary survey measurements and/or lab results were uploaded to the Wisconsin Beach Health website (Figure 4). Manually entered data included measurements that had just been taken in the field: WaterTemp (degrees F), AirTemp (degrees F), WaveHeight_ft (estimated ft), NTU (turbidity), and Sunny (1 if sky “sunny”…), as well as a stage-of-season marker: Post_Aug10 (1 if after August 10th, 0 if not). Input data also included RAIN24 and RAIN48 (inches of rain recorded at the Port Washington water treatment plant over the 24 and 48 hours prior to 07:00 a.m. CDT), as well as CurrentNorth (velocity of surface water movement towards [+] or away from [–] 0° due north, estimated by NOAA-GLCFS). The nowcast operator accessed these last three data inputs via the web, using beach-specific links posted on the Wisconsin Beach Health website (Figure 5), and copied the values into the MLR Prediction tab. Once all of the input values were entered, the operator executed the model.
Figure 2. Transporting water-quality samples, Upper Lake Park Beach, Port Washington.
Figure 3. Turbidity meter used by Ozaukee County Public Health Department.

Beach Water-quality Nowcast Model Case Study
Figure 4. Uploading routine sanitary survey data to the Wisconsin Beach Health website.
Figure 5. Real-time data links for Upper Lake Park, posted on Wisconsin Beach Health website (www.wibeaches.us/real_time_data_links/RTD_Ozaukee_Upper%20Lake%20Park.html).

Beach Water-quality Nowcast Model Case Study
The procedure for running the 2012 nowcast model was somewhat different, allowing for additional “automated” data inputs via the U.S. Geological Survey’s Environmental Data Discovery and Transformation (ENDDAT) system 2. The nowcast operator used a custom ENDDAT web URL (developed by Wisconsin DNR staff) to download a one-row table of the most recent values of several model inputs, including: RRAIN24 (millimeters of rain estimated by radar over the past 24 hours), Significant Wave Height (meters) and Direction (0-360 degrees), and DOY (day of year, 1-365). The daily ENDDAT table was then imported into the Virtual Beach MLR Prediction tab, leaving the operator to manually-enter the remaining values: AlgBch_None (1 if there is any algae on the beach, 0 if none), Gulls (estimated number of gulls on the beach), ClearWater (1 if water “clear”…), Sunny (1 if sky “sunny”…), and July16_Aug10 (1 if between these dates…). Once all of the input values were entered, the operator executed the model to make a prediction (Figure 6).
Figure 6. Virtual Beach’s “MLR Prediction” tab. Outputs of the nowcast included both the estimated concentration of E. coli and the statistical probability of exceeding the 235 CFU/100 mL water-quality standard. Health department staff primarily used the estimated E. coli concentrations to determine whether or not to post swim advisories or closures at the beach.
2 http://cida.usgs.gov/enddat/
Beach Water-quality Nowcast Model Case Study
Nowcast Results The 2011 Upper Lake Park Beach nowcast was operated from June 23 through September 5. During that period, the model correctly predicted water-quality exceedances resulting in the posting of two swim advisories that otherwise would have been missed. In addition, the model predicted non-exceedances resulting in one avoided advisory and one avoided closure that otherwise would have been issued (based on the previous day’s lab results). The 2012 nowcast was only run in operational mode from August 11 through September 3, having performed poorly (in evaluation mode) during the early part of the season, before being rebuilt to account for extreme hydro-meteorological conditions and to improve sensitivity to dry-weather/clear-water E. coli elevations. During this shortened period of operation, however, the model predicted water-quality exceedances resulting in the posting of two swim advisories that otherwise would have been missed. In addition, the model predicted non-exceedances resulting in two avoided swim advisories that otherwise would have been posted (based on the previous day’s lab results).
Bureau of Science Services
Wisconsin Department of Natural Resources P.O. Box 7921
Madison, WI 53707-7921
Miscellaneous Publication PUB-SS-1102 2012
Author: Adam C. Mednick Editor: Dreux J. Watermolen
The Wisconsin Department of Natural Resources provides equal opportunity in its employment, programs, services, and
functions under an Affirmative Action Plan. If you have any questions regarding this plan, please write to Equal Opportunity Office, Department of Interior, Washington, DC 20240.
This publication is available in alternative format (large print, Braille, audio tape, etc.) upon request. Please call (608) 266-0531 for more information.
This project was funded by the Wisconsin Coastal Management Program and the National Oceanic and Atmospheric Administration, Office of Ocean and Coastal Resources Management under the Coastal Zone Management Act, Grant #NA09NOS4190107. Points of view expressed in this report do not necessarily reflect the views or policies of the Wisconsin Coastal Management Program or National Oceanic and Atmospheric Administration.
Mention of trade names and commercial products does not constitute endorsement of their use.

Beach Water-quality Nowcast Model Case Study
Zoo Beach, Racine, Wisconsin
Located near the Racine Zoo and lakefront park, Zoo Beach (Figure 1) is a smaller and quieter neighbor to the popular North Beach, which lies just to the south. Like North Beach, Zoo Beach is maintained by Racine’s Parks, Recreation, and Cultural Services Department, which is responsible for regular beach grooming and lifeguard services throughout the summer. Based on daily counts by lifeguards in 2010 and 2011, total annual visits to Zoo Beach are estimated at between 3,700 and 4,700.
Figure 1. Zoo Beach, Racine, Wisconsin. Responsibility for monitoring water quality falls with the Racine Health Department, which sends monitoring personnel to collect samples five days per week (Monday through Friday) at three fixed stations along 1,180 ft of shoreline. Because they are located next to one another along the same stretch of shoreline, North and Zoo beaches are monitored one after the other by the same personnel, with all of the samples transported to the health department lab for testing. Tests include both the standard 18-hour, colilert analysis and a 2-hour, quantitative polymerase chain reaction (qPCR) analysis. Individual samples are composited before being tested. In 2004, Zoo Beach was posted with 13 swim advisories and four beach closures. By 2010, advisories had been reduced to four, with no closures. In 2011, there were five advisories. Like neighboring North Beach, Zoo Beach has been the subject of long-term sanitary surveys, including intensive water-quality

Beach Water-quality Nowcast Model Case Study
monitoring at multiple locations and concurrent measurements of nearshore, onshore, and hydro-meteorological conditions. This monitoring has informed several best management practices and beach improvements, including the redesign of the English Street outfall, effectively the boundary between Zoo and North beaches. During most rainfall events, stormwater flowing into the redesigned system passes through two “vorceptors” (which settle debris and particulates) and is then routed through a series of wetland cells before discharging at Zoo Beach (Figure 1). The higher number of advisories at Zoo Beach relative to North Beach may be related to the location of the wetland outlet, which has a low flow on most days and larger flows during rainfall events. In contrast, the southern bypass outlet (at the site of the original outfall) only discharges to the lake during heavy rainfall events. Nowcast Models The 2012 beach season was the first with an operational nowcast at Zoo Beach. Although Wisconsin DNR staff conducted the data assembly, formatting, and model set-up, Racine Health Department staff built the model from a shared Virtual Beach project (.VBPX) file. The full process of data assembly, model set-up, and model-building is described in detail in the report Building Operational “Nowcast” Models for Predicting Water Quality at Five Lake Michigan Beaches1. The 2012 Zoo Beach nowcast model was specified as:
LOG10(Ecoli) = 0.2516 + 0.3805*(SQUAREROOT(Wave_Height_ft)) - 0.676*(QUADROOT(RRAIN1)) + 0.3209*(POWER(RRAIN6,0.3333333)) + 0.09746*(SQUAREROOT(RRAIN48)) + 0.3751*(POWER(CLDCV,0.3333333)) - 6.203*(INVERSE(ATEMP,3.28725)) + 0.06553*(QUADROOT(Qmax672)) + 0.3889*(POLY(CurrentA_comp(CSPD,CDIR,-5.41),1.1815802,-0.21025639,12.837678)) + 0.003368*(SQUARE(WindO_comp(WSPD,WDIR,-5.41)))
Where: Ecoli = E. coli (MPN/ 100mL) — Measured by the Racine Health Dept.
ATEMP = Air Temperature (degrees C) — GLCFS, NOAA CurrentA_comp = Alongshore Current (meters/sec) — Derived from:
Surface Current Velocity (meters/sec) — GLCFS, NOAA Surface Current Direction (toward 0-360 deg.) — GLCFS, NOAA
CLDCV = Cloud Cover (percent) — GLCFS, NOAA Qmax672 = Root River Discharge, 28-day max (ft3/sec) — USGS Gage RRAIN1 = Rainfall, 1 hour (mm) — Radar Est. from the North Central River Forecasting Center, NOAA RRAIN6 = Rainfall, 6 hours (mm) — Radar Estimate… NOAA RRAIN48 = Rainfall, 48 hours (mm) — Radar Estimate…. NOAA WaveHeight_ft = Wave Height (ft.) — Estimated by the Racine Health Dept. WindO_comp = Onshore Wind (meters/sec) — Derived from:
Wind Velocity (meters/sec) — GLCFS, NOAA Wind Direction (from 0-360 deg.) — GLCFS, NOAA
1 Mednick, A.C. 2012. Building Operational “Nowcast” Models for Predicting Water Quality at Five Lake Michigan Beaches. PUB-SS-1098. Bureau of Science Services, Wisconsin Department of Natural Resources, Madison.

Beach Water-quality Nowcast Model Case Study
And where:
LOG10 = logarithm, base 10 INVERSE = 1/X POLY = polynomial transformation (a + bX + cX2) POWER = X1/3 PROD = X1 * X2 QUADROOT = X1/4 SQUARE = X2 SQUAREROOT = X1/2
Nowcast Model Operation Racine Health Department staff members operate the Zoo Beach nowcast. The process of running the nowcast generally takes the operator five minutes or less per day, on top of routine beach monitoring and public notification activities. Nowcast model runs are conducted after monitoring personnel return to the health department lab from collecting water samples and taking routine sanitary survey measurements at the beach. Beach monitoring generally takes place around 07:00 a.m., in order to allow time for samples to be returned to the lab, prepped for qPCR analysis, and run through the 2-hour process before posting an advisory (if deemed necessary based on the results) by mid-morning. In some cases the nowcast operator will have conducted the field work. On most days, however, other staff members conduct the field work and provide the nowcast operator with the needed input values recorded on standardized paper forms (Figure 2). The procedure for running the Zoo Beach nowcast was for the operator to first access and download “automated” data inputs via the U.S. Geological Survey’s Environmental Data Discovery and Transformation (ENDDAT) system 2 using a custom ENDDAT web URL developed by Wisconsin DNR staff. Launching the URL downloads a one-row table of the most recent values of several model inputs including: CLDCV (percent cloud cover), Qmax672 (28-day maximum Root River discharge, ft3/sec), RRAIN1, RRAIN6, and RRAIN47 (millimeters of rain estimated by radar over the past 1, 6, and 48 hours), Significant Wave Height (meters) and Direction (0-360 degrees), and Surface Current Velocity (meters/sec) and Direction (0-360 degrees). Next, the operator opened the Virtual Beach model (.VBMX) file and imported the daily ENDDAT table into the MLR Prediction tab, leaving the operator to manually-enter a single value: WaveHeight_ft (estimated wave height in feet). Once all of the input values were entered, the operator executed the model to make a prediction (Figure 3). Outputs of the nowcast included the estimated concentration of E. coli, as well as the statistical probability of exceeding the 235 CFU/100 mL water-quality standard. Health department staff used these outputs together with qPCR and sanitary survey results as multiple lines of evidence for determining whether or not to post a water-quality advisory or close the beach. The nowcast was generally conducted while qPCR analysis was in progress. Whereas the process of conducting the nowcast takes five minutes or so, the process of conducting qPCR typically takes two hours, including sample preparation, system operation, and output interpretation (Figure 4). As they are completed, nowcast predictions, 18-hour lab results, and qPCR are displayed alongside one another for daily comparison and validation.
2 http://cida.usgs.gov/enddat/

Beach Water-quality Nowcast Model Case Study
Figure 2. Routine sanitary survey form for Zoo Beach, Racine.
Figure 3. Virtual Beach’s “MLR Prediction” tab.

Beach Water-quality Nowcast Model Case Study
Figure 4. Conducting qPCR analysis. clockwise from top left: sample preparation (A-B), setting-up a qPCR run (C), and displayed results (D). Nowcast Results The 2012 Zoo Beach nowcast was operated from June 28 through August 31. That season, for the first time, the Racine Health Department was granted permission by the U.S. EPA to use qPCR results for regulatory purposes; i.e., posting swim advisories or issuing beach closures. The 2012 nowcast was operated simultaneous with qPCR. Rather than using nowcast-predicted concentrations of E. coli as the basis for posting advisories, the health department used model-estimated exceedance probabilities in conjunction with qPCR results – and in some cases, field-observed beach conditions such as strong onshore winds following rainfall – as multiple lines of evidence for posting advisories. On one occasion, the nowcast exceedance probability indicated that qPCR results were incorrectly in exceedance of the 1,000 CFU/100 mL beach closure guideline. This was confirmed by secondary qPCR analysis and the following day’s 18-hour lab results. This combined approach resulted in the posting two swim advisories and one closure that would have otherwise been missed, 1 avoided advisory that otherwise would have been posted, and 1 avoided closure.

Beach Water-quality Nowcast Model Case Study
Bureau of Science Services Wisconsin Department of Natural Resources
P.O. Box 7921 Madison, WI 53707-7921
Miscellaneous Publication PUB-SS-1101 2012
Author: Adam C. Mednick Editor: Dreux J. Watermolen
The Wisconsin Department of Natural Resources provides equal opportunity in its employment, programs, services, and functions under an Affirmative Action Plan. If you have any questions regarding this plan, please write to Equal Opportunity Office, Department of Interior, Washington, DC 20240.
This publication is available in alternative format (large print, Braille, audio tape, etc.) upon request. Please call (608) 266-0531 for more information.
This project was funded by the Wisconsin Coastal Management Program and the National Oceanic and Atmospheric Administration, Office of Ocean and Coastal Resources Management under the Coastal Zone Management Act, Grant #NA09NOS4190107. Points of view expressed in this report do not necessarily reflect the views or policies of the Wisconsin Coastal Management Program or National Oceanic and Atmospheric Administration.
Mention of trade names and commercial products does not constitute endorsement of their use.

Case Study: Fort McCoy and Low Impact Development L-THIA Larry Theller, GIS Analyst, ABE Dept., Purdue University Samuel Noel, Student, ABE Dept., Purdue University
The cantonment areas of military installations can be much
like a small city, composed of urbanized areas with large connected impervious surfaces. This case study reflects on a project performed at Fort McCoy, Wisconsin. From its modest beginnings when it was known as the Sparta Maneuver Tract to the ever-modernizing, premier training facility that it is today, Fort McCoy, Wisconsin has been a training resource to our nation’s civilian and military leaders for over 100 years. The Fort McCoy landscape is still dominated by the white wooden buildings with red roofs constructed during World War II. But over time, that image will change as Fort McCoy transforms. The base is a constantly renewing installation that provides superior training for service members of all branches.
As per Section 438 of the Energy Independence and Security Act (EISA), it was deemed necessary that new developments at the Fort McCoy military installation implement low-impact development practices to protect the area hydrology. The US Environmental Protection Agency (EPA) developed guidance in 2009 to comply with the EISA which outlined an approach to implementing the rule. In addition, the cantonment area is placed over several cold water streams and wetland areas, and protection of these natural resources was of particular interest. These streams, part of the greater Sparta River
watershed, formed several subwatersheds over the 3000-acre cantonment area.
L-THIA was developed as an analysis tool to evaluate the long term effects or impacts of land use change on direct runoff and nonpoint source pollution loading. Since its introduction in 1994, L-THIA has evolved into a Web-based model which employs the curve number (CN) method and Event Mean Concentration (EMC) coefficients to estimate direct surface runoff and nonpoint source (NPS) pollutant loads. The CN, determined by the combination of land use and hydrologic soil group, is widely used for simulating runoff. NPS pollutant loads are predicted in L-THIA by multiplying estimated runoff volume by the EMC value for each pollutant for each land use type.
Recently L-THIA has been extended to employ Low-Impact Development (LID) practice
in the analysis. Low-Impact Development refers to an approach to land development or
planning which is intended to mimic the pre-development site hydrology. The goal of
this analysis is to generate a suite of practices which would then be available for
integration into Fort McCoy master planning.

This LID analysis includes designing a landuse plan which will:
1) Reduce volume of runoff
2) Decentralize runoff, diffusing flows into smaller retention/detention areas
3) Improve water quality
4) Encourage groundwater infiltration
The technical team was comprised of two Purdue University students, a professor, and technical staff at the EPA and Fort McCoy.
Prior to running the L-
THIA LID model, the
team created GIS
layers of the current
and future base
development plans in
ArcGIS.
The team was able to
utilize L-THIA land
use designations,
classify the areas of
concern, and
determine runoff
water quantity and
quality for evaluation.
Following this evaluation, the L-THIA LID toolset was used as a guide for the selection
of low-impact development practices to meet the needs of Fort McCoy and
requirements of Section 438:
The project results is a conceptual design utilizing LID practices that will
• Reduce imperviousness
• Conserve infiltratable soils
• Conserve functional / sensitive landscape
• Minimize land disturbances
• Anticipate need for other LID practices to reduce NPS and stormwater volume
• Recognize needs of troops including recreational and aesthetic values
Figure 1 Cantonment Area, Fort McCoy, Wisconsin

Case Study: L-THIA use for watershed management in Indiana.
Larry Theller, GIS Analyst, Purdue University
Kathleen Hagan, Watershed Specialist, IDEM
Land use changes can significantly impact groundwater recharge, stormwater drainage, and water pollution.
The Long-Term Hydrologic Impact Assessment (L-THIA) model was developed as a tool to assess the water
quality impacts of land use change. The model produces maps of runoff depth and volume along with
nonpoint source pollution loading of the area.
Based on community-specific climate data, L-THIA estimates changes in recharge, runoff, and nonpoint source
pollution resulting from past or proposed development. It estimates long-term average annual runoff for land
use and soil combinations, based on actual long-term climate data for that area. By using many years of
climate data in the analysis, L-THIA focuses on the average impact, rather than an extreme year or storm.
Since 2002, there have been at least 17 watershed management plans (funded by IDEM's 319 or 205(j)
program, or submitted to IDEM for review to be eligible for implementation funding) that have used L-THIA.
Most commonly, L-THIA was used to estimate existing pollutant loads in a watershed. Sometimes L-THIA was
used when there was no monitoring data available, and sometimes it was used to provide a comparison with
loads calculated from monitoring data.
In some cases, L-THIA was used to estimate flow when there was no flow data available. L-THIA was also used
to determine the impervious area in a watershed, and to determine the potential water quality/quantity
impacts of projected growth in a watershed.

HUC 8 Watershed # plans using L-THIA
05080003 Whitewater 1
05090203 Middle Ohio-Laughery 1
05120107 Wildcat 1
05120201 Upper White 5
05120108 Middle Wabash - Little Vermillion 1
05120202 Lower White 2
05120204 Driftwood 1
05120205 Flatrock Haw 1
05120206 Upper East Fork White 1
05120207 Muscatatuck 1
05120209 Patoka 1
05140101 Silver-Little Kentucky 1
Total 17
Data source:
Kathleen Hagan, Watershed Specialist
IDEM - Office of Water Quality
MC 65-44 Shadeland
Indianapolis, IN 46204-2251
317-308-3197
www.watersheds.in.gov

Short Case Study – Making use of Region 5 GIS Training materials in a sophomore-level course at Purdue.
The Purdue University course Agricultural Systems Management 215 Surveying is an undergraduate class taught by Agricultural and Biological Engineering faculty but frequently taken by Landscape Architecture students. Taught by Professor Bernie Engel for Spring 2013, the laboratory portion included an introduction to GIS using ArcGIS 10.0. In order to present an easy-to-follow laboratory exercise, the lab instructors (Laurent Ahiablame, Larry Theller, and Tim Wright) used an adaptation of the EPA Region 5 GIS training course, which was provided to Purdue University by Region 5 staff.
By starting with this comprehensive training package, with PowerPoint lectures, exercises and all the required data already packaged for the course, the laboratory team was able to rapidly deploy the training for three lab sections, with a total of 40 students.
Figure 2. Students in laboratory using Region 5 GIS Training materials