a long-term evaluation of interventions on preventing preschool children’s injury in a safe ...
TRANSCRIPT
A Long-term Evaluation of Interventions on
Preschool Children’s Injury in a Community
in Shanghai from 2009 to 2014
QU SHUANGXIAO
2015.11.23
2
Methods
Results&Discussion
Background
Conclusion
Contents

Background
3
Injury and violence is a major killer of children throughout the world.
Source: The Lancet. 2015 Jan 31;385(9966):430-40. doi: 10.1016/S0140-6736(14)61698-6.
Epub 2014 Sep 30.
Figure 1: Global causes of child deaths in 2013 (1- 59 months)
Injury 5.2%
Rank 5
Background
4
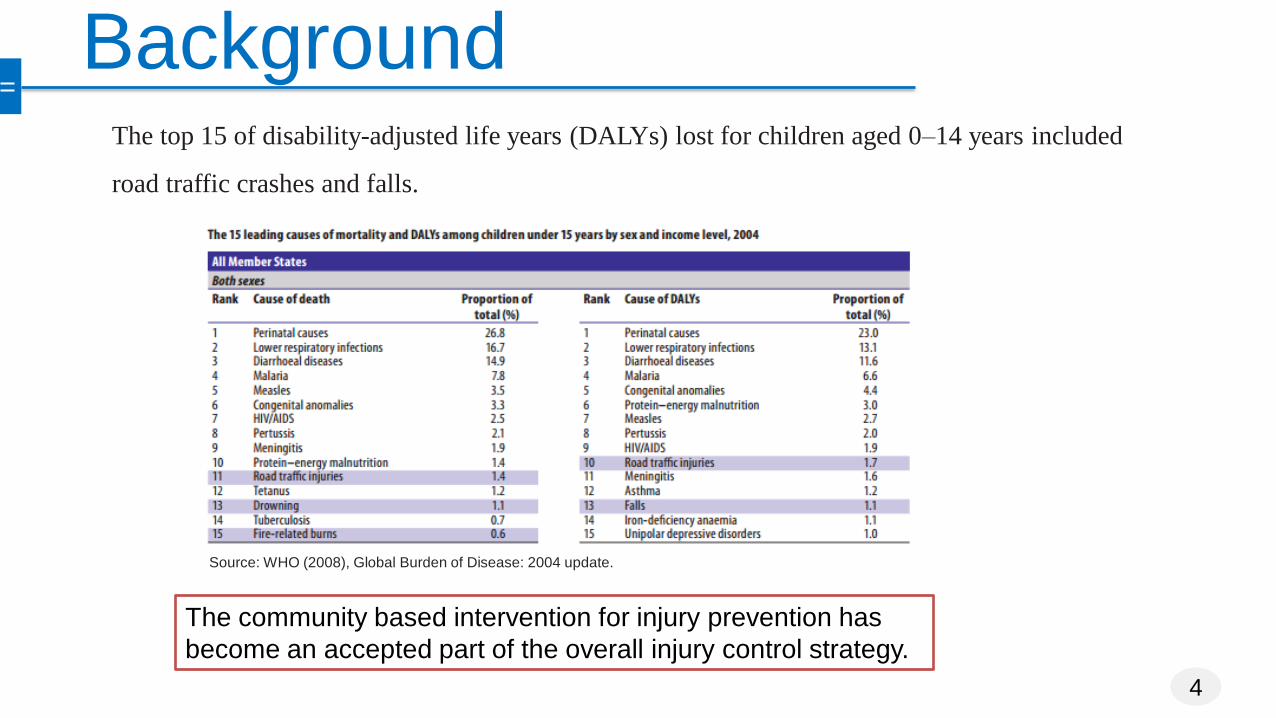
The community based intervention for injury prevention has
become an accepted part of the overall injury control strategy.
Source: WHO (2008), Global Burden of Disease: 2004 update.
The top 15 of disability-adjusted life years (DALYs) lost for children aged 0–14 years included
road traffic crashes and falls.
Background
5
Study Time frame for intervention Results
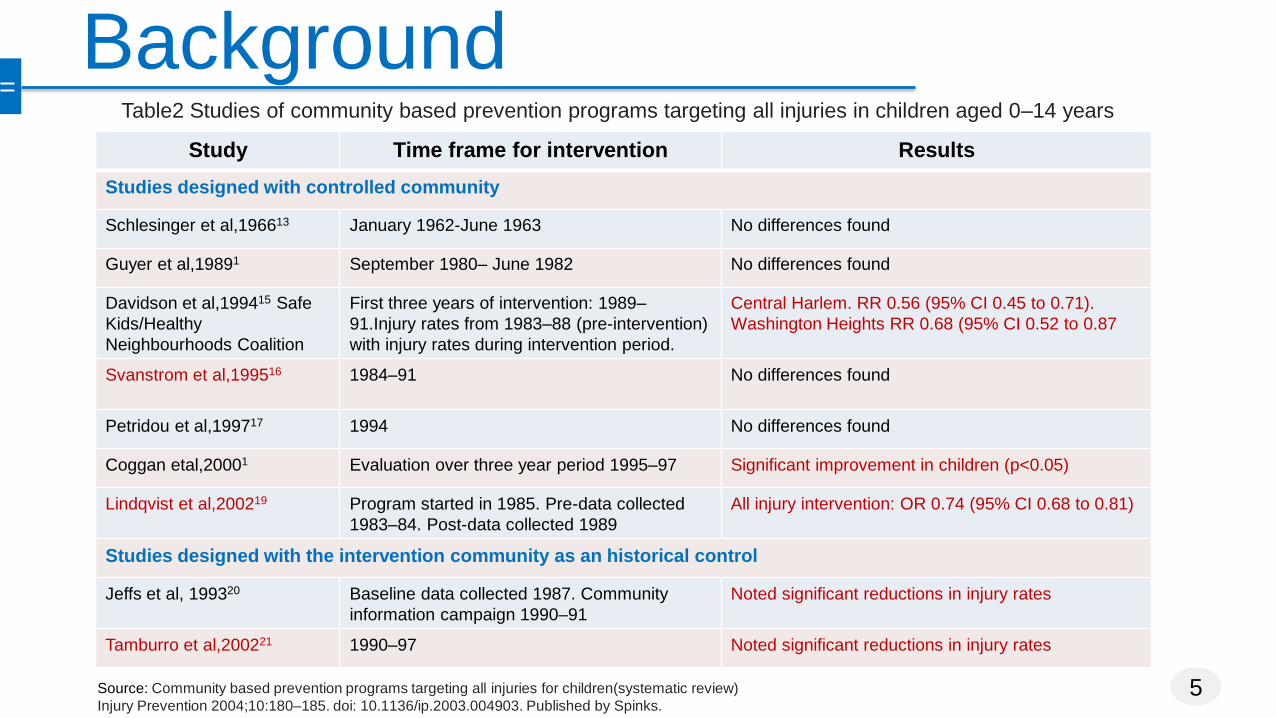
Studies designed with controlled community
Schlesinger et al,196613 January 1962-June 1963 No differences found
Guyer et al,19891 September 1980– June 1982 No differences found
Davidson et al,199415 Safe
Kids/Healthy
Neighbourhoods Coalition
First three years of intervention: 1989–
91.Injury rates from 1983–88 (pre-intervention)
with injury rates during intervention period.
Central Harlem. RR 0.56 (95% CI 0.45 to 0.71).
Washington Heights RR 0.68 (95% CI 0.52 to 0.87
Svanstrom et al,199516 1984–91
No differences found
Petridou et al,199717 1994 No differences found
Coggan etal,20001 Evaluation over three year period 1995–97 Significant improvement in children (p<0.05)
Lindqvist et al,200219 Program started in 1985. Pre-data collected
1983–84. Post-data collected 1989
All injury intervention: OR 0.74 (95% CI 0.68 to 0.81)
Studies designed with the intervention community as an historical control
Jeffs et al, 199320 Baseline data collected 1987. Community
information campaign 1990–91
Noted significant reductions in injury rates
Tamburro et al,200221 1990–97 Noted significant reductions in injury rates
Source: Community based prevention programs targeting all injuries for children(systematic review)
Injury Prevention 2004;10:180–185. doi: 10.1136/ip.2003.004903. Published by Spinks.
Table2 Studies of community based prevention programs targeting all injuries in children aged 0–14 years
Study with the intervention community as an historical control
6
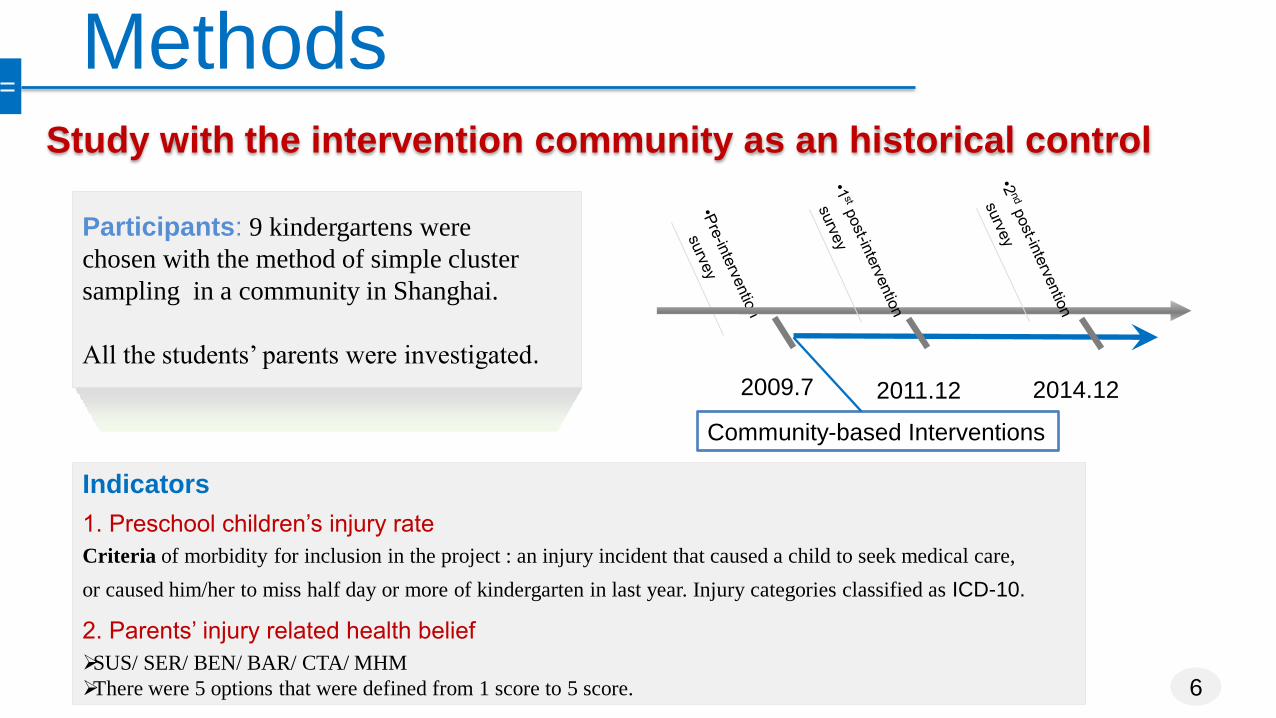
Methods
Participants: 9 kindergartens were
chosen with the method of simple cluster
sampling in a community in Shanghai.
All the students’ parents were investigated.
Indicators
1. Preschool children’s injury rate
Criteria of morbidity for inclusion in the project : an injury incident that caused a child to seek medical care,
or caused him/her to miss half day or more of kindergarten in last year. Injury categories classified as ICD-10.
2. Parents’ injury related health belief
SUS/ SER/ BEN/ BAR/ CTA/ MHM
There were 5 options that were defined from 1 score to 5 score.
Community-based Interventions
2009.7 2011.12 2014.12
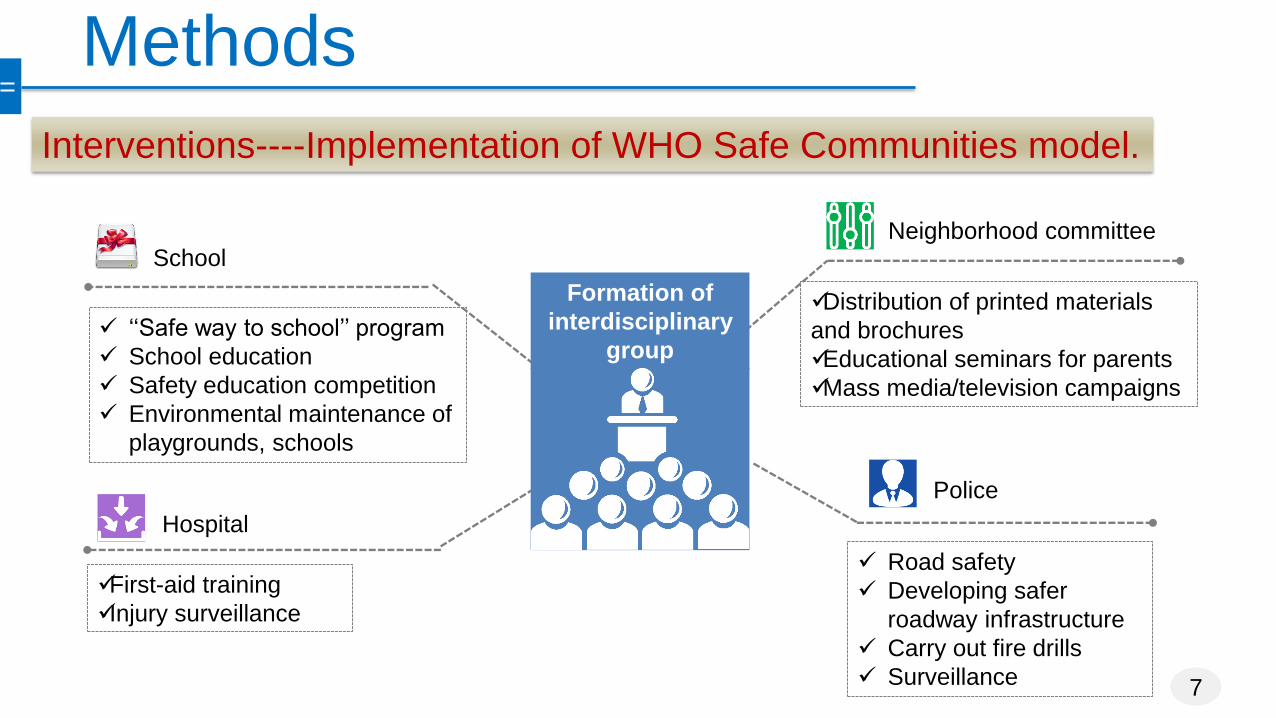
Interventions----Implementation of WHO Safe Communities model.
School
‘‘Safe way to school’’ program
School education
Safety education competition
Environmental maintenance of
playgrounds, schools
7
Methods
Police
Road safety
Developing safer
roadway infrastructure
Carry out fire drills
Surveillance
First-aid training
Injury surveillance
Hospital
Distribution of printed materials
and brochures
Educational seminars for parents
Mass media/television campaigns
Neighborhood committee
Formation of
interdisciplinary
group

8
Results Survey 1
N=1129
Survey 2
N=1576
Survey 3
N=1735 P value
Children age(m±sd), year 4.14±0.97 4.59±1.16 4.86±0.94 <0.001*
Sex
Boy 614 (55.4%) 775 (51.2%) 855 (50.7%) 0.036
Girl 494 (44.6%) 740 (48.8%) 830 (49.3%)
Education level of father
Junior middle school 126 (11.4%) 141 (9.2%) 67 (3.9%) <0.001
Senior middle school 186 (16.8%) 228 (14.8%) 200 (11.7%)
≥ college 793 (71.8%) 1170 (76.0%) 1443 (84.4%)
Education level of mother
Junior middle school 174 (15.7%) 191 (12.4%) 106 (6.2%) <0.001
Senior middle school 200 (18.1%) 226 (14.7%) 200 (11.7%)
≥ college 733 (66.2%) 1125 (73.0%) 1407 (82.1%)
Registration of father
Shanghai 683 (61.8%) 998 (65.6%) 1152 (67.6%) 0.007
Non-shanghai 422 (38.2%) 523 (34.4%) 552 (32.4%)
Registration of mother
Shanghai 629 (57.2%) 928 (61.1%) 1071 (63.8%) 0.003
Non-shanghai 470 (42.8%) 590 (38.9%) 609 (36.3%)
Family per capita monthly income
low 118 (16.3%)%) 137 (14.0%) 171 (15.5%) <0.001
middle 459 (63.4%) 628 (64.3%) 582 (52.7%)
high 147 (20.3%) 212 (21.7%) 352 (31.9%)
Table 3 Characteristics of the study participants from three surveys
*t test,others are Pearsonc2 test
9.45%
13.55%
9.12%
7.29%
10.14%
8.07%
0.0%
2.0%
4.0%
6.0%
8.0%
10.0%
12.0%
14.0%
16.0%
2009 2011 2014
Incid
ence o
f in
jury
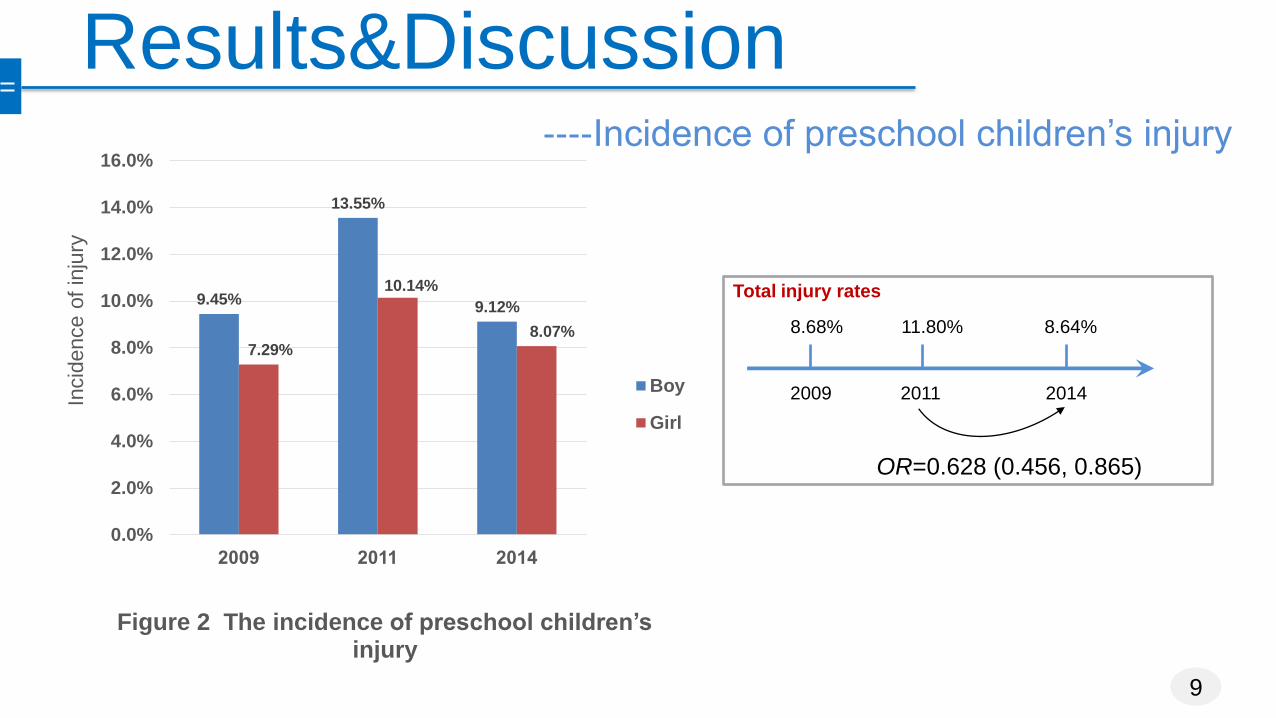
Figure 2 The incidence of preschool children’s injury
Boy
Girl
9
OR=0.628 (0.456, 0.865)
2009 2011 2014
8.68% 11.80% 8.64%
Total injury rates
----Incidence of preschool children’s injury
Results&Discussion

10
OR=0.371 (0.227, 0.607)
2009 2011 2014
OR=0.397 (0.229, 0.689) Falls
0.62% 0.51%
0.12%
4.52% 4.95%
3.23%
0.53% 0.38%
0.51%
0.0%
1.0%
2.0%
3.0%
4.0%
5.0%
6.0%
2009 2011 2014
Incid
en
ce o
f in
jury
Figure 3 The incidence of Top 3 injury type
Road traffic injuries
Falls
Fire-related burns
----Incidence of preschool children’s injury
Results&Discussion
11
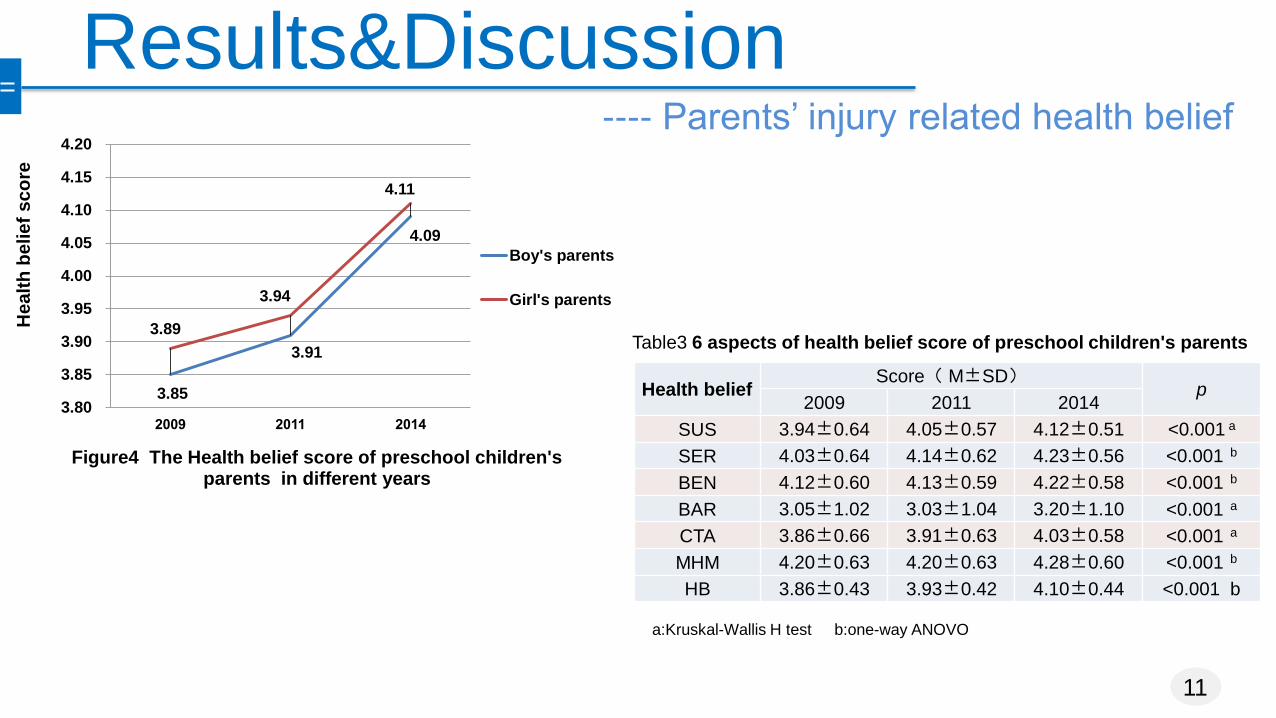
Results&Discussion
3.85
3.91
4.09
3.89
3.94
4.11
3.80
3.85
3.90
3.95
4.00
4.05
4.10
4.15
4.20
2009 2011 2014
Healt
h b
elief
sco
re
Figure4 The Health belief score of preschool children's parents in different years
Boy's parents
Girl's parents
Health belief Score( M±SD)
p 2009 2011 2014
SUS 3.94±0.64 4.05±0.57 4.12±0.51 <0.001 a
SER 4.03±0.64 4.14±0.62 4.23±0.56 <0.001 b
BEN 4.12±0.60 4.13±0.59 4.22±0.58 <0.001 b
BAR 3.05±1.02 3.03±1.04 3.20±1.10 <0.001 a
CTA 3.86±0.66 3.91±0.63 4.03±0.58 <0.001 a
MHM 4.20±0.63 4.20±0.63 4.28±0.60 <0.001 b
HB 3.86±0.43 3.93±0.42 4.10±0.44 <0.001 b
a:Kruskal-Wallis H test b:one-way ANOVO
Table3 6 aspects of health belief score of preschool children's parents
---- Parents’ injury related health belief

12
Conclusion
It was advisable that the community kept carrying out these interventions
Injury data surveillance system should be better established.
Limitations:It is difficult to solely attribute the reduction in injury rates
to the intervention program without a comparison community.
The community-based interventions were effective in reducing
preschool children’s injuries and improving parent’s injury-related
health belief.
Suggestion

THANKS FOR YOUR ATTENTION