a mathematical model of the sleep/wake cycle · a mathematical model of the sleep/wake cycle ......
TRANSCRIPT

Journal name manuscript No.(will be inserted by the editor)
A mathematical model of the sleep/wake cycle
Michael J Rempe · Janet Best · David Terman
Received: date / Revised: date
Abstract We present a biologically-based mathematical model that accounts for severalfeatures of the human sleep/wake cycle. These features include the timing of sleep andwakefulness under normal and sleep-deprived conditions, ultradian rhythms, more frequentswitching between sleep and wakefulness due to the loss of orexin and the circadian de-pendence of several sleep measures. The model demonstrateshow these features depend oninteractions between a circadian pacemaker and a sleep homeostat and provides a biologicalbasis for the two-process model for sleep regulation. The model is based on previous “flip-flop” conceptual models for sleep/wake and REM/NREM and we explore whether the neu-ronal components in these flip-flop models, with the inclusion of a sleep-homeostatic pro-cess and the circadian pacemaker, are sufficient to account for the features of the sleep/wakecycle listed above. The model is minimal in the sense that, besides the sleep homeostatand constant cortical drives, the model includes only thosenuclei described in the flip-flopmodels. Each of the cell groups is modeled by at most two differential equations for the evo-lution of the total population activity, and the synaptic connections are consistent with thosedescribed in the flip-flop models. A detailed analysis of the model leads to an understand-ing of the mathematical mechanisms, as well as insights intothe biological mechanisms,underlying sleep/wake dynamics.
Keywords sleep· REM · NREM · sleep homeostat· circadian pacemaker
This work was partially funded by the NSF under agreement 0112050 and by the AFOSR grant FA9550-06-1-0033 to D.T. and J.B.
MJ RempeMathematical Biosciences Institute, Ohio State University, Columbus, OH 43210 USAE-mail: [email protected]
J BestDepartment of Mathematics, Ohio State University, Columbus, OH 43210 USAE-mail: [email protected]
D TermanDepartment of Mathematics, Ohio State University, Columbus, OH 43210 USAE-mail: [email protected]
2 Michael J Rempe et al.
1 Introduction
Despite nearly a century of study, sleep and its underlying processes hold many mysteries.It remains unclear how identified brain regions interact to bring about the different stages ofsleep and wakefulness, how the timing of sleep depends on thelength of time spent awakeand work load, and how pathologies associated with sleep, such as narcolepsy, arise. Math-ematical modeling has been used extensively to address these issues [7,17,27,37,53]; how-ever, the success of these models in predicting sleep propensity under normal conditions,forced desynchrony and sleep deprivation comes despite a lack of a detailed understandingof biological mechanisms that underlie the observed sleep and EEG dynamics. In this paper,we develop a mathematical model for the human sleep-wake cycle that is based upon phys-iological processes and interactions of neuronal cell groups. Thus, the model can be appliedto test hypotheses concerning the neural circuitry and how identified brain regions interactto bring about the different stages of sleep and wakefulness.
One goal of this paper is to provide a biological basis for theso-called two-processmodel for sleep regulation [1,2,7,8]. This model addressesthe timing of sleep and wakeful-ness, positing that sleep regulation arises via the interactions of a roughly 24-hour circadianprocess (C) with a wake-time-dependent homeostatic process (S). The model conceptualizesa reference level of sleep that is homeostatically maintained between two thresholds that arein turn modulated by the oscillations of C. Process S builds up during waking hours, so thatlarge values of S correspond to a strong sleep drive. When S reaches an upper threshold, thesystem falls asleep and S begins to decay. S continues to decay during sleep until it reachesa lower threshold and the system “wakes up.” The dynamics of Sare chosen based on theobservation that EEG activity in the delta range of 0.5-4.5 Hz – slow wave activity (SWA) –reflects sleep intensity [17]. Spectral analysis of EEG activity not only showed that SWA ishighest in the early part of the sleep episode and, on average, decreases over the course of thenight as sleep need is satiated, but also provided a quantitative measure of its time course.The increase is fit with a saturating exponential function, and, in the simplest version of themodel, the decrease of S during sleep is also fit to an exponential function.
The two-process model has been quite successful in predicting the timing of wake andsleep under normal conditions, acute sleep deprivation andnaps despite a lack of a detailedunderstanding of neural mechanisms that underlie the observed sleep and EEG dynamics.We note that while mechanisms underlying the circadian pacemaker are well known, thenature of the homeostatic process remains poorly understood. It is also mysterious why thetiming of waking up and falling asleep occur when some combination of the homeostat andcircadian drive reach two somewhat arbitrarily constructed thresholds, especially as it is nowclear that these processes are not independent (see for example [15]).
The past decade has brought significant progress in identifying the neural substratesof sleep regulation. Our model builds on the work of Saper et al. [48] who introducedthe idea of a hypothalamic sleep-wake switch. Their conceptual model relies on evidencethat sleep-promoting neurons within the ventral lateral preoptic nucleus (VLPO) and wake-promoting neurons in the monoaminergic cell groups inhibiteach other. They proposed thatthese mutually-inhibitory connections function as a flip-flop switch: any increase in activityon one side generates positive feedback via disinhibition,avoiding dangerously slow transi-tions between sleep and wake.
Saper and colleagues also proposed that neurons containingthe neuropeptide orexin(also called hypocretin) stabilize the switch by reinforcing the monoaminergic cell groups[49]. Orexinergic cells of the lateral hypothalamus project to many of the monoaminer-gic nuclei, providing circadian-modulated excitation. Saper et al. hypothesized that, beyond

Mathematical model of sleep 3
simply promoting wakefulness, orexin functions to stabilize the switch against over-frequenttransitions. In support of this hypothesis, experiments show that the loss of orexin causesmany symptoms found in narcolepsy, including frequent transitions into sleep and frag-mented sleep episodes, indicating decreased stability of both wake and sleep states [11,40,47].
Saper and colleagues have also recently extended the flip-flop model to incorporate REMand NREM sleep stages [33], positing an additional flip-flop switch between brain stemareas involved in controlling REM and NREM sleep. Experiments suggest that the VLPOcontains two distinct populations of cells: the cluster portion (clVLPO) and the extendedportion (eVLPO). The NREM-promoting nuclei receive inhibition from eVLPO, while theREM-on populations are inhibited by monoaminergic nuclei;these connections link the twoflip-flop switches into a verbal model for the neural circuit regulating sleep including REMand NREM activity.
Our model is based on the flip-flop switches, but also reproduces the important featuresof the two-process model. The model is consistent with results of experimental studies usedto investigate how observed features of sleep arise from thecircadian and homeostatic pro-cesses and from their interactions. Our results demonstrate that the neuronal components inthe flip-flop model, together with a sleep homeostat and a circadian pacemaker, are sufficientto account for several features of the sleep/wake cycle, including a loss of orexin leading tomore frequent transitions as in narcolepsy. However, some features of REM/NREM dynam-ics require additional hypotheses. We provide a detailed analysis of the model that leads toan understanding of the mathematical mechanisms, as well asinsights into the biologicalmechanisms, underlying the sleep/wake dynamics.
2 Materials and Methods
We describe our model in two steps. First we describe the model for the sleep-wake flip-flopswitch and then we add cell groups to this model for the REM-NREM switch.
2.1 The sleep-wake flip-flop model
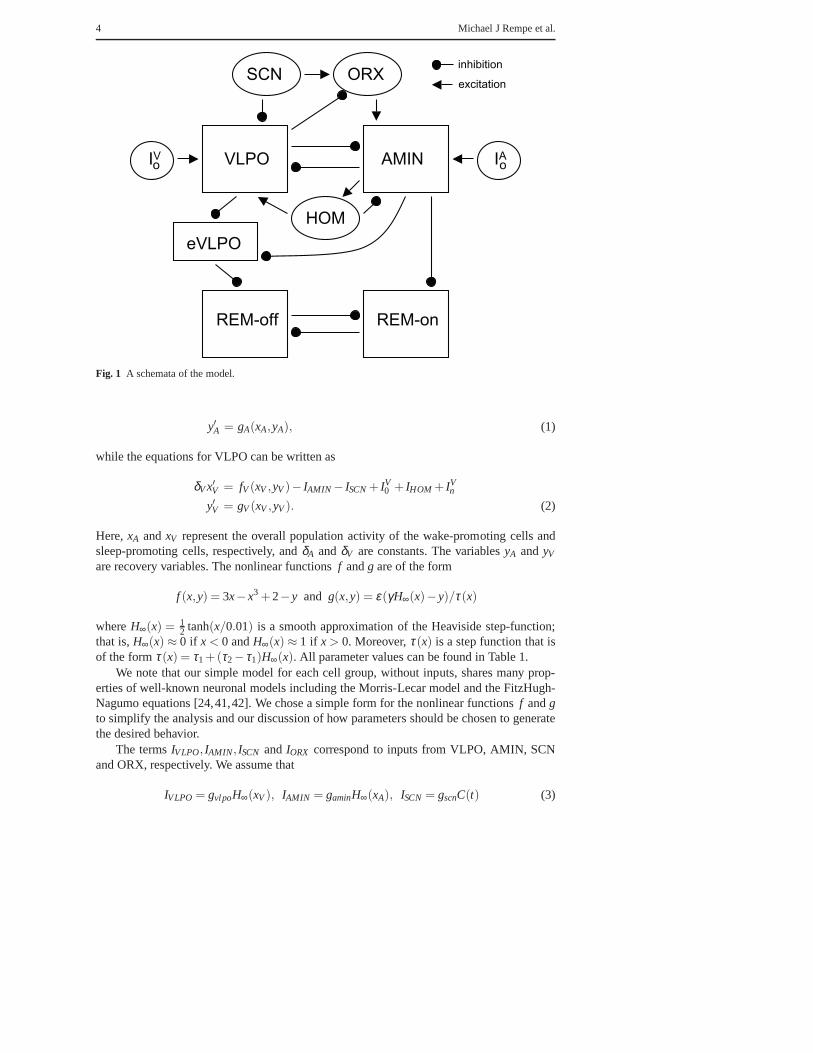
A schemata of our model for the sleep-wake and REM-NREM switches is shown in Figure 1.The model includes the sleep-promoting neurons (VLPO), thewake-promoting monoamin-ergic cell groups (AMIN), orexin neurons (ORX), a circadianpacemaker corresponding toactivity within the suprachiasmatic nucleus (SCN), and input from cortical areas. We alsoassume that there is a sleep homeostat, (HOM), that increases while awake and decreasesduring sleep.
Note that the sleep-promoting and wake-promoting cells inhibit each other. We assumethat output of SCN inhibits VLPO. While experiments have demonstrated that direct connec-tions from SCN onto VLPO are sparse, SCN does project onto other cells groups includingDMH [13] and this has an inhibitory effect on VLPO [14]. In ourmodel, AMIN receivesexcitatory input from ORX. The orexin neurons receive excitatory input from SCN and in-hibitory input from VLPO. Experiments have demonstrated that these cells are typicallyinactive while asleep [47].
The VLPO and AMIN are each modeled as a system of two ordinary differential equa-tions. The equations for AMIN can be written as
δAx′A = fA(xA,yA)− IV LPO + IORX + IA0 − IHOM + IA
n
4 Michael J Rempe et al.
VLPO AMIN
SCN ORX
HOM
IV IAoo
REM-off REM-on
eVLPO
inhibition
excitation
Fig. 1 A schemata of the model.
y′A = gA(xA,yA), (1)
while the equations for VLPO can be written as
δV x′V = fV (xV ,yV )− IAMIN − ISCN + IV0 + IHOM + IV
n
y′V = gV (xV ,yV ). (2)
Here,xA andxV represent the overall population activity of the wake-promoting cells andsleep-promoting cells, respectively, andδA andδV are constants. The variablesyA andyV
are recovery variables. The nonlinear functionsf andg are of the form
f (x,y) = 3x− x3 +2− y and g(x,y) = ε(γH∞(x)− y)/τ(x)
whereH∞(x) = 12 tanh(x/0.01) is a smooth approximation of the Heaviside step-function;
that is,H∞(x) ≈ 0 if x < 0 andH∞(x) ≈ 1 if x > 0. Moreover,τ(x) is a step function that isof the formτ(x) = τ1+(τ2− τ1)H∞(x). All parameter values can be found in Table 1.
We note that our simple model for each cell group, without inputs, shares many prop-erties of well-known neuronal models including the Morris-Lecar model and the FitzHugh-Nagumo equations [24,41,42]. We chose a simple form for the nonlinear functionsf andgto simplify the analysis and our discussion of how parameters should be chosen to generatethe desired behavior.
The termsIV LPO, IAMIN, ISCN andIORX correspond to inputs from VLPO, AMIN, SCNand ORX, respectively. We assume that
IV LPO = gvlpoH∞(xV ), IAMIN = gaminH∞(xA), ISCN = gscnC(t) (3)

Mathematical model of sleep 5
where gvlpo,gamin and gscn are constants andC(t) is the circadian pacemaker which wemodel as in [3]. The details of the circadian input to the model can be found in the appendix.To simplify the model, we do not include a separate differential equation for ORX. Instead,we assume thatIORX = ISCN(1−H∞(xV )). This implies that ORX is silent while VLPO isactive; on the other hand, if VLPO is silent, then ORX followsSCN. The constantsIA
0 andIV0 represent background cortical drives andIA
n andIVn are noise terms included to test the
robustness of the model. They are described in more detail inthe appendix.Finally, IHOM represents a current corresponding to the sleep/wake homeostat. We as-
sume that this is of the form
IHOM = ghomh(t) (4)
whereghom is a constant andh(t) decays exponentially while the system is asleep and in-creases while awake. We can scale the variables so that the system is defined to be asleep ifxA < 0 and awake ifxA > 0. Thenh(t) satisfiesh′ = αh(hmax−h) while awake andh′ =−βhhwhile asleep. Here,αh,βh andhmax are constants. Note that while awake the homeostatic in-hibition of AMIN grows stronger and the homeostatic drive toVLPO increases. That is,while awake there is an increasing pressure to fall asleep. During sleep the opposite is true.
2.2 The REM-NREM flip-flop model
We now discuss the REM-on and REM-off cell groups of the modelintroduced in the pre-vious section. Notice in Figure 1 that the REM-on and REM-offcell groups mutually in-hibit each other. We have now divided the VLPO into two cell groups: the clustered VLPO(clVLPO) and the extended VLPO (eVLPO). The eVLPO inhibits REM-off neurons andAMIN inhibits the REM-on neurons. This is consistent with experimental results describedin [32]. We further assume that clVLPO inhibits eVLPO. This assumption will be discussedin detail later.
The REM-on and REM-off cell groups are modeled in a manner very similar to before.The equations for the REM-on cells are
δRx′R = fR(xR,yR)− IAMIN − INREM + IR0 + IR
n
y′R = gR(xR,yR), (5)
while the equations for the REM-off are
δNx′N = fN(xN ,yN)− IeV LPO − IREM + IN0 + IN
n
y′N = gN(xN ,yN). (6)
Here,δR,δN , IR0 andIN
0 are constants,IRn andIN
n are noise terms,IAMIN is as defined in (3),except the constantgamin is different, andIeV LPO represents input from eVLPO. The clVLPOis modeled precisely as in (2); in fact, we assume that(xV ,yV ) now represents the overallpopulation activity and recovery of clVLPO. We assume that eVLPO is modeled by thescalar equation
x′e = −xe +Ψ (ae − xV −beH∞(xA)) (7)
wherexe represents the overall activity of eVLPO neurons,
Ψ(v) = 1/(1+ e−v/κe )
andae,be andκe are constants. Note thatΨ depends on the activity of the wake-promotingcells in a step-like manner; however, its dependence on clVLPO is more graded. Finally, welet IeV LPO = gevlpoxe wheregevlpo is a constant.

6 Michael J Rempe et al.
3 Results
3.1 Timing of sleep, wake, and ultradian dynamics
A solution of the model under normal conditions is shown in Figure 2A. Note that the sys-tem sleeps for approximately eight hours and is awake for approximately 16 hours with rapidtransitions between sleep and wakefulness. Sleep occurs during the trough of the circadiancycle. Figure 2B shows the activity of the REM-on and REM-offcell groups during onesleep episode. The model reproduces several known properties of the ultradian rhythm [54]:Sleep begins with an episode of NREM activity and there are then several transitions be-tween REM and NREM sleep. Moreover, the NREM episodes becomeincreasingly shorterand REM episodes increasingly longer while asleep so that late sleep is dominated by REMactivity and the system wakes up from REM sleep.
3.2 Removal of orexin leads to unstable switching
With the input from ORX to AMIN removed the model reproduces afew key characteristicsof the narcolepsy phenotype (Figure 2C). Note that AMIN may cycle several times duringwhich time VLPO is silent. We interpret this as several shortwake episodes interrupted withvery brief sleep episodes. This behavior is consistent withthe narcoleptic phenotype whichis characterized by excessive daytime sleepiness often leading to several short daytime sleepepisodes [18]. This is also consistent with the hypothesis proposed by Saper and colleagues:that orexin neurons act to stabilize the sleep/wake switch.
Also note that overall there are more REM sleep episodes thanNREM sleep episodes.This is consistent with the REM behavior of narcoleptics, who have inappropriate intrusionsof REM sleep, presumably because without orexin the REM/NREM balance has been tippedin favor of REM-on firing [5]. The model makes a suggestion about how that balance istipped: if VLPO doesn’t activate, it doesn’t inhibit eVLPO so eVLPO is free to inhibit theREM-off group which has the effect of disinhibiting the REM-on group. The model alsodemonstrates REM episodes that intrude on waking and more sleep-onset REM (SOREM)than in the normal case, which is also consistent with the narcolepsy phenotype [29].
Though only reproducing a few characteristics of narcolepsy, it is important to note thatalthough considerable inter- and intra-individual variation have been observed in the degreeand nature of symptoms, these two features have been observed repeatedly in narcolepticsubjects and are considered indicative of the disorder. This simplified model is not intendedto capture all of the symptoms of the disorder, but just a few of the most prominent ones.
3.3 The two-process model and sleep deprivation
Figure 3 showsIHOM, the current corresponding to the sleep/wake homeostat, along withtwo other curves. These are defined asL ≡ ISCN +KL andU ≡ ISCN +KU whereKL andKU
are constants. We will explain how these constants are chosen in the analysis section. Notethat the system wakes up whenIHOM reaches the lower thresholdL and falls asleep whenIHOM reaches the upper thresholdU . This behavior is consistent the two-process model ofsleep regulation [4]. We used the model to simulate sleep deprivation. In Figure 3, we alsosimulated keeping the system awake in two-hour increments for up to 24 hours past the usualbedtime. This was accomplished by increasing the cortical drive IA
0 to the wake-promoting

Mathematical model of sleep 7
12 14 16 18 20 22 24 26 28
−2
−1
0
1
2
x,xR,x
N
A)
B)
C)
xV
x
x
xN
xR
0 12 24 36 48
−2
−1
0
1
2
time (hours)
SleepWaking SleepWaking
C(t)
x,xV
0 12 24 36 48
−2
−1
0
1
2
x,x
V,x
N,x
R
xx
V
xR
xN
time (hours)
time (hours)
Fig. 2 A) Normal sleeping and waking. The solid trace represents the wake-active population (AMIN), andthe dashed trace represents the sleep-active population (VLPO). B) REM/NREM cycling during one sleepepisode. The red trace is the REM-off population and the bluetrace is the REM-active population.C) With-out orexin, there are more frequent transitions into and outof sleep, and more REM episodes than NREMepisodes, including several REM episodes during waking.

8 Michael J Rempe et al.
0 12 24 36 48 60 720
1
2
3
4
5
time (hours)
Ihom
U
L
Fig. 3 The agreement of the model output with the two-process model. Each black curve represents a differentlength of sleep deprivation.
cells AMIN. We then returnedIA0 to its default value and this allows the system to fall asleep.
The network then wakes up whenIHOM crossesL and then falls asleep whenIHOM crossesU .
3.4 Circadian modulation of total sleep time and sleep-onset REM
One purpose of the model and of many sleep experiments is to investigate how observed fea-tures of sleep arise from the circadian and homeostatic processes and from their interactions.In the laboratory, circadian and homeostatic modulatory effects can be teased apart with a“forced desynchrony protocol” [28] that involves isolating individuals from time cues whileimposing a rest-activity schedule so different from the near-24-hour intrinsic circadian pe-riod [10,16,57] that subjects are unable to entrain. As rhythms driven by the circadian pace-maker proceed with a period differing from that of the sleep-wake cycle, phase-resettingstimuli are distributed uniformly across the circadian cycle, avoiding feedback-resetting ef-fects [10]. Dijk and Czeisler [20] observed eight men subjected to a 28-hour rest-activitycycle, studying the extent to which circadian and homeostatic processes separately and to-gether influence several aspects of sleep. Here we describe how output from the modelcompares with their results.
In order to replicate this experiment with the model, we shifted the circadian curve byhalf-hour increments and started each simulation with the homeostat touching the lowercircadian in order to simulate waking at that phase. Noting that Dijk and Czeisler’s protocolresults in 18 hours 40 minutes of wakefulness prior to each sleep episode, we increasedthe cortical driveIA
0 to keep the model awake for a similar period before withdrawing thecortical drive and allowing an opportunity for sleep.
Experimental measurements of total sleep time revealed a broad peak encompassingcircadian phase 0 (the trough), having a rapid rise and more gradual decline [20]. As seenin Figure 4, these features are also reproduced in the model.Total sleep time has a gradualdecline and a rapid rise (panel A) with a peak corresponding to the trough of the circadiancycle (panel C). Dijk and Czeisler found that sleep tended tobe undisturbed in the early partof sleep episodes regardless of the circadian phase at sleepinitiation [19]; however, therewas a circadian dependence of sleep efficiency (proportion of time in bed spent asleep)

Mathematical model of sleep 9
0 100 200 300 400 500 600 7000
5
10
Circadian Phase
To
tal S
lee
p T
ime
(h
ou
rs)
0 100 200 300 400 500 600 7000
25
50
Circadian Phase
SO
RE
MS
(%)
0 100 200 300 400 500 600 7000
0.5
1
Circadian Phase
Circa
dia
n inpu
t
(no
rma
lize
d)
A)
B)
C)
Fig. 4 The model exhibits a circadian dependence of total sleep time and SOREMs. (A) Total sleep timeplotted as a function of circadian phase at midsleep. (B) The circadian distribution of sleep-onset REMepisodes (SOREMs). (C) The Circadian input to the model. The trough of the input wasassigned phase 0.
during the latter half of the scheduled sleep episodes. Accordingly they plotted total sleeptime versus circadian phase at midsleep, and we have done thesame in order to facilitatecomparison. The results are consistent with the relation found by Strogatz [52]. Our modeloutput differs notably from the data of Dijk and Czeisler in that there are phases at whichthe model does not go to sleep. The circadian phases at which the model failed to sleepcoincide with phases previously described as a wake-maintenance zone [52] or forbiddenzone for sleep [31]; unentrained, free-running subjects rarely choose to initiate sleep duringthis circadian phase [52]. The subjects in Dijk and Czeisler’s study, instructed to try to sleepduring this zone, were able to do so albeit with a pronounced increase in sleep latency.Both model and data share the property that total sleep time versus circadian phase resultsin a left-skewed curve, while the circadian output is right-skewed, as reflected in the bodytemperature rhythm data of Dijk and Czeisler [20] (and shared by their sleep latency data).
Dijk and Czeisler’s study also revealed a pronounced circadian modulation of REMsleep, with a peak REM sleep propensity shortly after the minimum of the circadian cycle[20]. During entrained conditions, this peak falls nearly two hours before habitual wakingand is reflected in the observation that the amount of REM sleep increases across the sleepepisode. An additional expression of this modulation arises in the forced desynchrony pro-tocol in terms of the likelihood, with respect to circadian phase, of experiencing sleep-onset
10 Michael J Rempe et al.
REM sleep (SOREMS). Dijk and Czeisler [20] found that the percentage of sleep episodeswith SOREMS (defined as REM sleep latency of at most ten minutes instead of the moreusual 70-80 minutes or longer [36,45]) showed a broad peak beginning shortly before cir-cadian phase 0 and preceded by an expanse of circadian phasesduring which sleep rarelyif ever began with REM sleep. We used 30 minutes as the cutoff for SOREMS, since Dijkand Czeisler allow sleep latencies of up to 20 minutes prior to beginning to measure REMlatency. Computing the frequency of SOREMS in our model, we find a pattern similar tothat in the Dijk and Czeisler study. (Figure 4B). Note that inour model SOREMs occur atroughly the same frequency and at the same circadian phase asseen experimentally. Notethat in this figure the data are double-plotted to illustratethe circadian dependence and to beconsistent with the presentation of the experimental data.
4 Analysis
We analyze solutions of the model using phase plane methods.The analysis helps to ex-plain the mathematical mechanisms underlying the sleep/wake rhythms. This, in turn, leadsto insights and new hypotheses for the biological mechanisms underlying these rhythms.Moreover, the analysis is extremely useful in demonstrating how parameters in the modelshould be chosen to obtain the desired behaviors.
The analysis is described in a series of model equations of increasing complexity. Wefirst introduce the basic phase-plane approach by considering a single cell population withconstant, and then time-varying, input. We then demonstrate how these methods apply tonetworks by considering two mutually inhibitory cell populations with constant inputs. Fi-nally, we consider the full models for the sleep/wake dynamics.
4.1 A single cell group without coupling
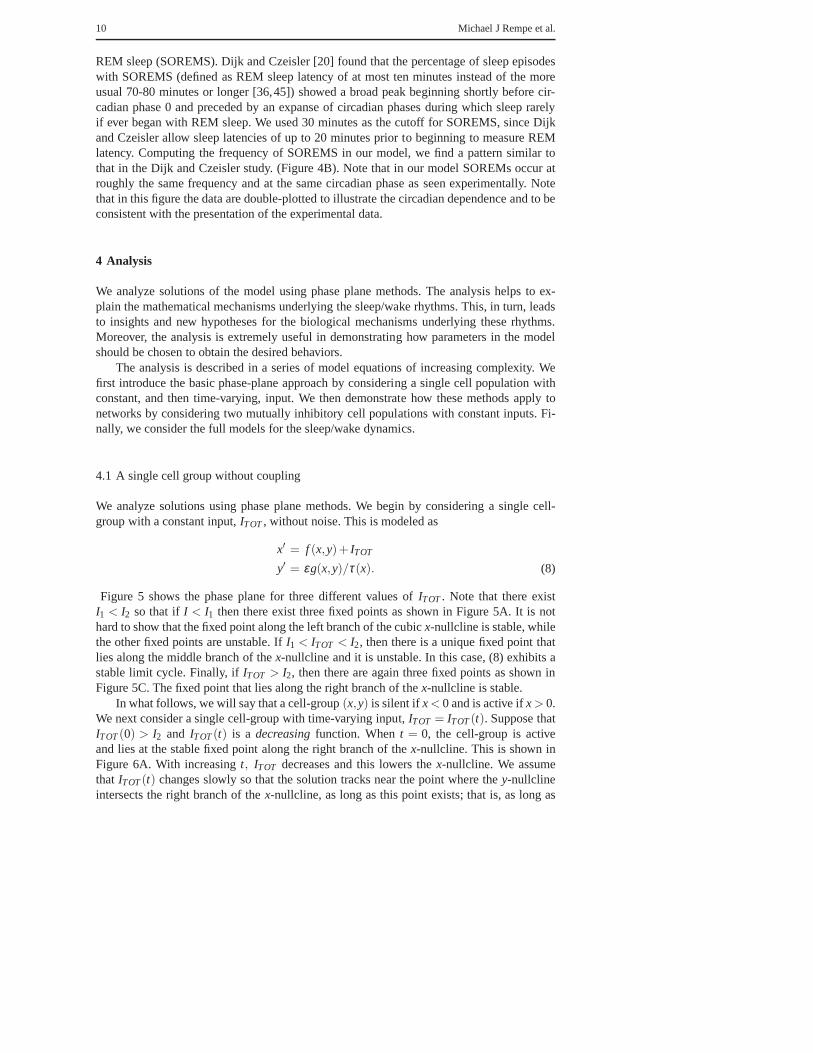
We analyze solutions using phase plane methods. We begin by considering a single cell-group with a constant input,ITOT , without noise. This is modeled as
x′ = f (x,y)+ ITOT
y′ = εg(x,y)/τ(x). (8)
Figure 5 shows the phase plane for three different values ofITOT . Note that there existI1 < I2 so that ifI < I1 then there exist three fixed points as shown in Figure 5A. It isnothard to show that the fixed point along the left branch of the cubic x-nullcline is stable, whilethe other fixed points are unstable. IfI1 < ITOT < I2, then there is a unique fixed point thatlies along the middle branch of thex-nullcline and it is unstable. In this case, (8) exhibits astable limit cycle. Finally, ifITOT > I2, then there are again three fixed points as shown inFigure 5C. The fixed point that lies along the right branch of thex-nullcline is stable.
In what follows, we will say that a cell-group(x,y) is silent ifx < 0 and is active ifx > 0.We next consider a single cell-group with time-varying input, ITOT = ITOT (t). Suppose thatITOT (0) > I2 and ITOT (t) is a decreasing function. Whent = 0, the cell-group is activeand lies at the stable fixed point along the right branch of thex-nullcline. This is shown inFigure 6A. With increasingt, ITOT decreases and this lowers thex-nullcline. We assumethat ITOT (t) changes slowly so that the solution tracks near the point where they-nullclineintersects the right branch of thex-nullcline, as long as this point exists; that is, as long as

Mathematical model of sleep 11
x xx
y
I1 < I < I2 I > I2 I < I1A) B) C)
Fig. 5 Phase plane diagrams of a relaxation oscillator for three different values of a stimulating input.
x x x
y
I(t) > I2 I(t) = I2 I(t) < I2A) B) C)
Fig. 6 Phase planes when there is time-varying input. A stable fixedpoint may disappear by a saddle-nodebifurcation as shown in B).
the “right knee” of thex-nullcline lies above they-nullcline. WhenITOT (t) = I2, the rightknee of thex-nullcline touches they-nullcline as shown in Figure 6B. At this time, the stablefixed point along the right branch of thex-nullcline comes together with the unstable fixedpoint along the middle branch; this corresponds to a saddle-node bifurcation for the systemin which IT OT is constant. Ast increases further, these two points disappear and the solutionof (8) is forced to “jump down” to the silent phase, as shown inFigure 6C. As we shall see,this describes the basic mechanism for how the full system “falls asleep” and “wakes up.”
4.2 The network without circadian and homeostatic input
Now consider a network in which VLPO and AMIN mutually inhibit each other, but thereis no circadian or homeostatic input. The equations are then:
x′A = fA(xA,yA)−gvlpoH∞(xV )+ IA0
y′A = gA(xA,yA)
x′V = fV (xV ,yV )−gaminH∞(xA)+ IV0
y′V = gV (xV ,yV ). (9)
We consider the separate phase planes associated with each cell-group. In fact, there are twophase planes associated with each cell-group depending on whether that cell-group receives
12 Michael J Rempe et al.
xV xA
yV yA
A) B)VLPO AMINsleep
sleepwake
wake
IA=0
IA=gAMIN IV=gVLPO
IV=0
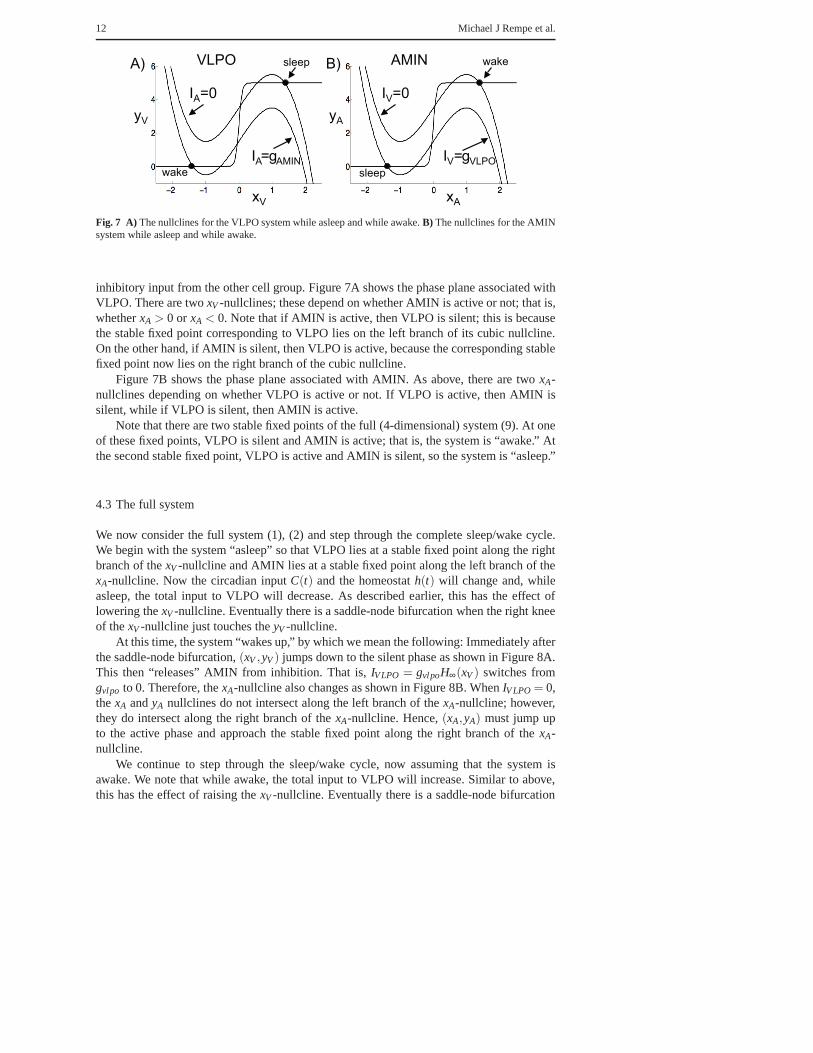
Fig. 7 A) The nullclines for the VLPO system while asleep and while awake.B) The nullclines for the AMINsystem while asleep and while awake.
inhibitory input from the other cell group. Figure 7A shows the phase plane associated withVLPO. There are twoxV -nullclines; these depend on whether AMIN is active or not; that is,whetherxA > 0 or xA < 0. Note that if AMIN is active, then VLPO is silent; this is becausethe stable fixed point corresponding to VLPO lies on the left branch of its cubic nullcline.On the other hand, if AMIN is silent, then VLPO is active, because the corresponding stablefixed point now lies on the right branch of the cubic nullcline.
Figure 7B shows the phase plane associated with AMIN. As above, there are twoxA-nullclines depending on whether VLPO is active or not. If VLPO is active, then AMIN issilent, while if VLPO is silent, then AMIN is active.
Note that there are two stable fixed points of the full (4-dimensional) system (9). At oneof these fixed points, VLPO is silent and AMIN is active; that is, the system is “awake.” Atthe second stable fixed point, VLPO is active and AMIN is silent, so the system is “asleep.”
4.3 The full system
We now consider the full system (1), (2) and step through the complete sleep/wake cycle.We begin with the system “asleep” so that VLPO lies at a stablefixed point along the rightbranch of thexV -nullcline and AMIN lies at a stable fixed point along the leftbranch of thexA-nullcline. Now the circadian inputC(t) and the homeostath(t) will change and, whileasleep, the total input to VLPO will decrease. As described earlier, this has the effect oflowering thexV -nullcline. Eventually there is a saddle-node bifurcationwhen the right kneeof thexV -nullcline just touches theyV -nullcline.
At this time, the system “wakes up,” by which we mean the following: Immediately afterthe saddle-node bifurcation,(xV ,yV ) jumps down to the silent phase as shown in Figure 8A.This then “releases” AMIN from inhibition. That is,IV LPO = gvlpoH∞(xV ) switches fromgvlpo to 0. Therefore, thexA-nullcline also changes as shown in Figure 8B. WhenIV LPO = 0,thexA andyA nullclines do not intersect along the left branch of thexA-nullcline; however,they do intersect along the right branch of thexA-nullcline. Hence,(xA,yA) must jump upto the active phase and approach the stable fixed point along the right branch of thexA-nullcline.
We continue to step through the sleep/wake cycle, now assuming that the system isawake. We note that while awake, the total input to VLPO will increase. Similar to above,this has the effect of raising thexV -nullcline. Eventually there is a saddle-node bifurcation

Mathematical model of sleep 13
MIN LPO
Fig. 8 The mechanism for waking up.A) Waking up is initiated when there is a saddle-node bifurcation inthe active phase of the VLPO system. When VLPO jumps down, this releases AMIN from inhibition and itjumps as shown inB).
MIN
LPO
Fig. 9 The mechanism for falling asleep.A) The system falls asleep when there is a saddle-node bifurcationof the VLPO system and it jumps up. The resulting inhibition onto AMIN lowers the AMIN cubic nullcline,forcing AMIN to jump down as shown inB).
when the left knee of thexV -nullcline just touches theyV -nullcline as shown in Figure 9A.Immediately after this,(xV ,yV ) jumps up to the active phase, this inhibits AMIN and(xA,yA)jumps down as shown in Figure 9B. That is, the system falls asleep.
Note that in our model, VLPO is, in some sense, responsible for initiating both sleepand wake. That is, sleep begins when VLPO jumps up to the active phase and this forcesAMIN to jump down to the silent phase; the system wakes up whenVLPO jumps back tothe silent phase and this releases AMIN from inhibition. This mechanism is consistent withresults that suggest that the VLPO drives the transition from wake to sleep [39,55].
4.4 Relationship to the two-process model
Note that the system wakes up and falls asleep when there are saddle-node bifurcations ofthe reduced system (8) in which the total input is taken to be aconstant bifurcation param-eter. Since the total inputs to VLPO and AMIN involve both a circadian and a homeostaticcomponent, the position of the saddle-node bifurcations defines a relationship between thecircadian and homeostatic inputs when the system either wakes up or falls asleep. It is thisrelationship that leads to a direct correspondence betweenthe model presented here and thetwo-process model.

14 Michael J Rempe et al.
Recall that the system falls asleep when VLPO exhibits a saddle-node bifurcation atits left knee and the system wakes up when VLPO exhibits a saddle-node bifurcation at itsright knee. Suppose that these saddle-node bifurcations occur when the total inputITOT
V toVLPO areITOT
V = IV1 andITOT
V = IV2 , respectively.
Now,IT OT
V = IV0 + IHOM − ISCN .
Hence, the system falls asleep when
IHOM(t) = ISCN(t)− IV0 + IV
1
and the system wakes up when
IHOM(t) = ISCN(t)− IV0 + IV
2 .
In Figure 3A, the lower thresholdL is the curve defined by the function
ISCN(t)− IV0 + IV
2 ≡ gscnC(t)+KL
and the upper thresholdU is the curve defined by the function
ISCN(t)− IV0 + IV
1 ≡ gscnC(t)+KU .
By choosingL andU in this manner, the homeostat changes direction when it reachesL orU .
4.5 Orexin neurons help to stabilize the flip-flop switch
Figure 2C demonstrates that if we remove the excitatory input from the orexin neurons toAMIN, then the model exhibits rapid transitions between thesleep and wake states. Phaseplane analysis is very useful for understanding the mechanism underlying this behavior.Consider the phase plane corresponding to AMIN while the system is awake. It is useful tocompare the phase planes of AMIN with and without input from ORX. Recall that, whileawake,IORX = ISCN ; hence, removingIORX is equivalent to removing excitatory input fromSCN.
Figure 10B shows the phase plane of AMIN with and without excitatory input fromORX. Note that with ORX input, thexA-nullcline intersects theyA nullcline at a stable fixedpoint along the right branch of thexA-nullcline. This corresponds to the wake state. Remov-ing excitatory ORX input lowers thexA-nullcline. If parameters are chosen appropriately,then there will no longer be a stable fixed point representingthe wake state.
Now consider what happens when the system “wakes up.” Recallthat the waking upprocess begins when there is a saddle-node bifurcation of the VLPO system and(xV ,yV )jumps down to the silent phase as shown in Figure 10A. This then releases AMIN frominhibition and(xA,yA) jumps up to the active phase. The system is now awake and(xA,yA)evolves up the right branch of thexA-nullcline. If there were excitatory input from ORX,then(xA,yA) would approach a stable fixed point in the wake state. (See Figure 8). However,without ORX input there is no longer such a stable fixed point.In this case,(xA,yA) is forcedto jump down to the silent phase when(xA,yA) reaches the right knee of thexA-nullcline,at which time the system falls asleep. If(xA,yA) evolves quickly along the right branch ofthe xA-nullcline, then the system remains awake for a short time. This explains the rapidtransitions from the wake to the sleep state.

Mathematical model of sleep 15
C)
B
time (hours)0 12 24 36 48
0
1
2
3
4
5
I ho
m
*
**
Fig. 10 The loss of orexin causes rapid transitions.A) As in Figure 9 the system may fall asleep when thereis a saddle-node bifurcation of the VLPO system. gA = gamin. B) Without excitatory ORX input, there is nolonger a stable fixed point of AMIN corresponding to the wake state and the system falls asleep when AMINreaches the right knee of its corresponding cubic. gV = gvl po. C) The graph ofIHOM(t) for the solution shownin Figure 2C.
The mechanism for the rapid transitions from the sleep to thewake state is more sub-tle. Note that VLPO does not receive input from ORX, so we cannot explain these rapidtransitions by considering how removing ORX changes the VLPO nullclines.
There are actually two reasons why removal of ORX leads to short sleep episodes. Thefirst is because the homeostat does not have enough time to build up while awake. Perhapsthe easiest way to understand this is to consider Figure 10C which showsIHOM(t) for thesolution shown in Figure 2C. Consider the location marked with ∗. Note that, as before, thesystem wakes up whenIHOM touches the lower thresholdL. This is when there is a saddle-node bifurcation in the active phase of the VLPO(xV ,yV ) system. While awake,IHOM buildsup. However, because the system is awake for only a short time, IHOM builds up by only asmall amount. Then the system falls back asleep,IHOM decreases and the system remainsasleep untilIHOM returns toL. BecauseIHOM increased only a small amount while awake,the duration of this sleep episode must be small. Note that, in our model, the duration of thesleep episode depends on whether it occurs along the rising or falling phase of the circadianrhythm. As illustrated in Figure 10C, the sleep episode willbe shorter if it occurs along therising phase of the circadian rhythm and will be longer if it occurs along the falling phase ofthe circadian rhythm.
The second reason why removal of ORX leads to short sleep episodes can be understoodby examining Figure 2C. Note that around the timet = 24 the AMIN population activatesseveral times while VLPO remains silent. Comparing Figures2C and 10C, we see that thisAMIN cycling occurs during sustained, elevated levels of the circadian inputISCN . This loca-tion is marked in Figure 10C with∗∗. SinceISCN inhibits VLPO, whenISCN is elevated, thereis increased inhibition to VLPO. This increased inhibitionshifts the(xV ,yV ) cubic nullcline
16 Michael J Rempe et al.
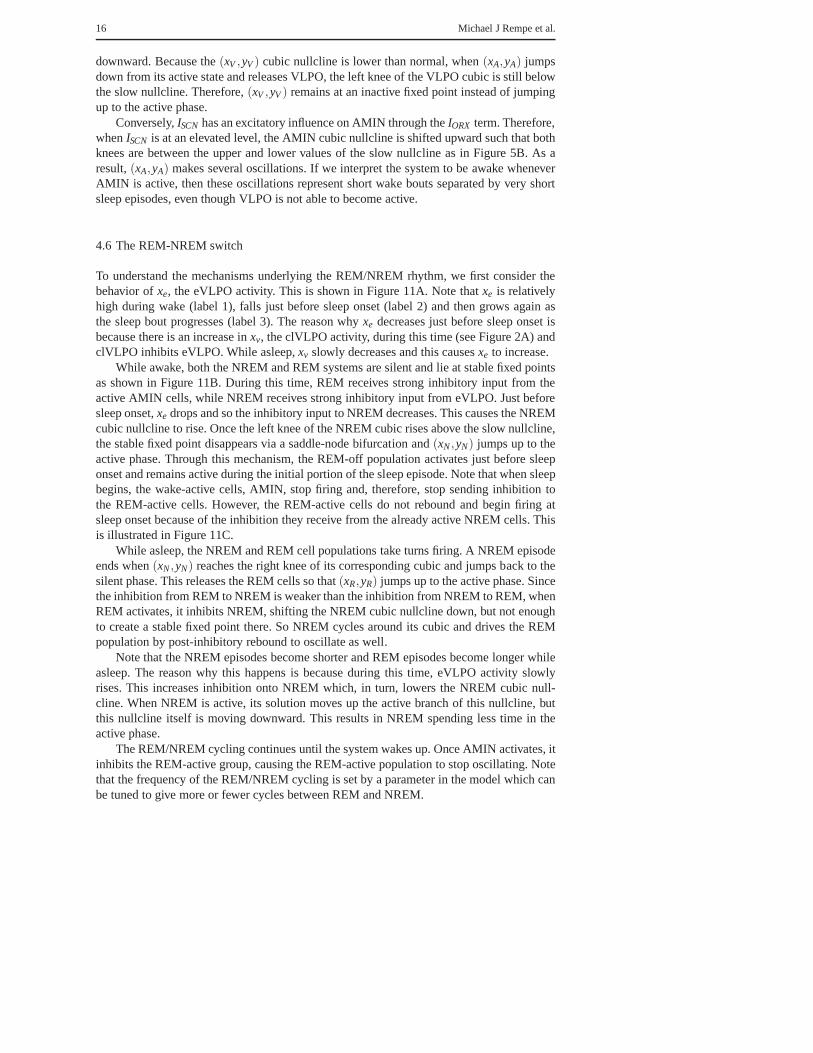
downward. Because the(xV ,yV ) cubic nullcline is lower than normal, when(xA,yA) jumpsdown from its active state and releases VLPO, the left knee ofthe VLPO cubic is still belowthe slow nullcline. Therefore,(xV ,yV ) remains at an inactive fixed point instead of jumpingup to the active phase.
Conversely,ISCN has an excitatory influence on AMIN through theIORX term. Therefore,whenISCN is at an elevated level, the AMIN cubic nullcline is shifted upward such that bothknees are between the upper and lower values of the slow nullcline as in Figure 5B. As aresult,(xA,yA) makes several oscillations. If we interpret the system to beawake wheneverAMIN is active, then these oscillations represent short wake bouts separated by very shortsleep episodes, even though VLPO is not able to become active.
4.6 The REM-NREM switch
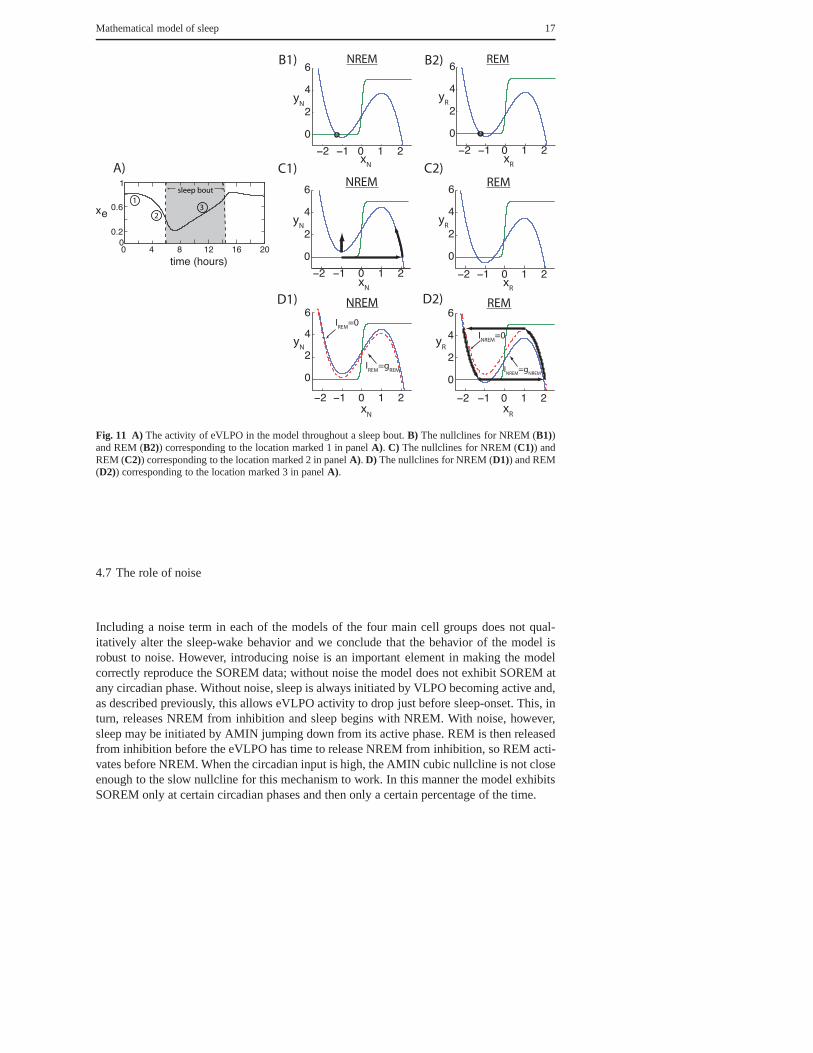
To understand the mechanisms underlying the REM/NREM rhythm, we first consider thebehavior ofxe, the eVLPO activity. This is shown in Figure 11A. Note thatxe is relativelyhigh during wake (label 1), falls just before sleep onset (label 2) and then grows again asthe sleep bout progresses (label 3). The reason whyxe decreases just before sleep onset isbecause there is an increase inxv, the clVLPO activity, during this time (see Figure 2A) andclVLPO inhibits eVLPO. While asleep,xv slowly decreases and this causesxe to increase.
While awake, both the NREM and REM systems are silent and lie at stable fixed pointsas shown in Figure 11B. During this time, REM receives stronginhibitory input from theactive AMIN cells, while NREM receives strong inhibitory input from eVLPO. Just beforesleep onset,xe drops and so the inhibitory input to NREM decreases. This causes the NREMcubic nullcline to rise. Once the left knee of the NREM cubic rises above the slow nullcline,the stable fixed point disappears via a saddle-node bifurcation and(xN ,yN) jumps up to theactive phase. Through this mechanism, the REM-off population activates just before sleeponset and remains active during the initial portion of the sleep episode. Note that when sleepbegins, the wake-active cells, AMIN, stop firing and, therefore, stop sending inhibition tothe REM-active cells. However, the REM-active cells do not rebound and begin firing atsleep onset because of the inhibition they receive from the already active NREM cells. Thisis illustrated in Figure 11C.
While asleep, the NREM and REM cell populations take turns firing. A NREM episodeends when(xN ,yN) reaches the right knee of its corresponding cubic and jumps back to thesilent phase. This releases the REM cells so that(xR,yR) jumps up to the active phase. Sincethe inhibition from REM to NREM is weaker than the inhibitionfrom NREM to REM, whenREM activates, it inhibits NREM, shifting the NREM cubic nullcline down, but not enoughto create a stable fixed point there. So NREM cycles around itscubic and drives the REMpopulation by post-inhibitory rebound to oscillate as well.
Note that the NREM episodes become shorter and REM episodes become longer whileasleep. The reason why this happens is because during this time, eVLPO activity slowlyrises. This increases inhibition onto NREM which, in turn, lowers the NREM cubic null-cline. When NREM is active, its solution moves up the active branch of this nullcline, butthis nullcline itself is moving downward. This results in NREM spending less time in theactive phase.
The REM/NREM cycling continues until the system wakes up. Once AMIN activates, itinhibits the REM-active group, causing the REM-active population to stop oscillating. Notethat the frequency of the REM/NREM cycling is set by a parameter in the model which canbe tuned to give more or fewer cycles between REM and NREM.
Mathematical model of sleep 17
−2 −1 0 1 2
0
2
4
6
−2 −1 0 1 2
0
2
4
6NREM REM
0
2
4
6
−2 −1 0 1 2
A)
B1) B2)
C1)NREM REM
−2 −1 0 1 2
0
2
4
6
C2)
D1) NREM REMD2)
−2 −1 0 1 2
0
2
4
6
−2 −1 0 1 2
0
2
4
6IREM
=0
IREM
=gREM
INREM
=0
INREM
=gNREM
0 4 8 12 16 200
0.2
0.6
1
time (hours)
xe
sleep bout
1
23
xN
yN
yN
xN
xN
yN
xR
yR
yR
yR
xR
xR
Fig. 11 A) The activity of eVLPO in the model throughout a sleep bout.B) The nullclines for NREM (B1))and REM (B2)) corresponding to the location marked 1 in panelA). C) The nullclines for NREM (C1)) andREM (C2)) corresponding to the location marked 2 in panelA). D) The nullclines for NREM (D1)) and REM(D2)) corresponding to the location marked 3 in panelA).
4.7 The role of noise
Including a noise term in each of the models of the four main cell groups does not qual-itatively alter the sleep-wake behavior and we conclude that the behavior of the model isrobust to noise. However, introducing noise is an importantelement in making the modelcorrectly reproduce the SOREM data; without noise the modeldoes not exhibit SOREM atany circadian phase. Without noise, sleep is always initiated by VLPO becoming active and,as described previously, this allows eVLPO activity to dropjust before sleep-onset. This, inturn, releases NREM from inhibition and sleep begins with NREM. With noise, however,sleep may be initiated by AMIN jumping down from its active phase. REM is then releasedfrom inhibition before the eVLPO has time to release NREM from inhibition, so REM acti-vates before NREM. When the circadian input is high, the AMINcubic nullcline is not closeenough to the slow nullcline for this mechanism to work. In this manner the model exhibitsSOREM only at certain circadian phases and then only a certain percentage of the time.

18 Michael J Rempe et al.
5 Discussion
We have presented a model that accounts for several featuresof the human sleep/wake cycle.These features include the timing of sleep and wakefulness under normal and sleep deprivedconditions, ultradian rhythms, rapid switching between sleep and wakefulness due to theloss of orexin, and the circadian dependence of total sleep time and sleep-onset REM. Themodel demonstrates how these features depend on interactions between a circadian pace-maker and a sleep homeostat and provides a biological basis for the two-process model forsleep regulation.
Our model is intended to further the development of mathematical models for humansleep-wake cycles by incorporating structures with more direct biological interpretationsthan previously available. The model is based on flip-flop models for sleep/wake and REM/NREMdue to Saper and colleagues. A major goal of this study is to determine whether the neuronalcomponents in the flip-flop models, with the addition of a sleep-homeostatic process and acircadian pacemaker, are sufficient to account for the features of the sleep/wake cycle listedabove. With this focus on the neuronal components, we have used simple models for thecircadian cycle and for homeostatic sleep pressure, addingthese processes in a modularmanner as suggested by Borbely and Achermann [9].
The model is minimal in the sense that, besides the sleep homeostat and constant corticaldrives, the model includes only those nuclei described in the flip-flop models. Each of thecell groups is modeled by at most two differential equationsfor the evolution of the totalpopulation activity. Using a simple cubic-nullcline in themodel for each cell group allows usto more easily choose parameters based on the analysis presented in this paper. The synapticconnections are consistent with those described in the flip-flop models. However, in orderto account for certain features of the ultradian rhythms, wefound it necessary to includeone additional hypothesis about the connections: that VLPOcluster inhibits eVLPO. Thisassumption is needed to ensure that under normal conditions, sleep typically begins with aNREM episode and that later sleep exhibits less NREM activity.
The model addresses human sleep/wake behavior and the underlying neural interactions.While both the two-process and the flip-flop models have been applied to human sleep, itis important to note that most of the electrophysiological data has been collected from ro-dents that not only are nocturnal but also have sleep that is differently-structured in that it ispolyphasic rather than being primarily consolidated into asingle, daily sleep episode. Datafrom mice and rats has proved useful in making inferences concerning human physiology;for example, genetically orexin-deficient mice express some symptoms found in narcolep-tic humans who are also orexin deficient. The early observations of von Economo [22] ofaltered sleep-wake behavior of humans with posthumously-confirmed brain lesions are con-sistent with the hypothalamic switch hypothesis. Nonetheless, species differences have beenidentified among mice, rats, and cats [51] and equal or greater as yet unidentified speciesdifferences surely exist between each of these species and humans. The model developedhere, and its ongoing refinements, may be useful in identifying likely differences of humanneural circuitry for which direct, human data is not available.
The model presented here differs in a number of ways from other recent mathematicalmodels of sleep/wake cycles which have either not included REM/NREM dynamics [12,44] or have included other hypothetical interactions [58].There have been previous papersmotivated, in part, by the hypothalamic sleep switch [21,44,56]. The model of Diniz Behnand colleagues [21] has the ability to produce polyphasic sleep rhythms with frequent briefawakenings, features more prominent in the sleep of mice than of humans. Orexin appears intheir model as a factor scaling the inhibition from wake-active cells to VLPO; however, they

Mathematical model of sleep 19
do not consider the removal of the orexinergic drive. In contrast to the model presented here,their model does not include a REM-off population or circadian drive, but does include aphenomenological homeostatic REM drive allowing for increased REM activity through thesleep period. The model of Phillips and Robinson [44], basedon the hypothalamic switchhypothesis without REM/NREM ultradian dynamics, describes hysteresis in sleep and wakestates. Their model does not contain orexinergic cells, butthe authors describe a possibleinterpretation of how orexin could be incorporated.
Some earlier models have relied on McCarley’s hypothesis that REM/NREM cycles areregulated by reciprocal interaction between cholinergic neurons and brainstem monoamin-ergic populations [23,34,35,38,43]; these models have generally focused on REM/NREMdynamics with little or no detail concerning the generationof sleep-wake behavior. WhileMcCarley’s models may provide a better match to neuronal data in which firing rates changemore gradually than predicted by a flip-flop model [36,50], some experimental studies havefailed to support these models since lesions of monoaminergic populations have little ef-fect on REM/NREM cycles [25]. In contrast, some recent studies implicate GABAergic andglutamatergic interactions in the dynamics of REM sleep [6,33] consistent with the REMflip-flop hypothesis.
The nature of the sleep/wake homeostat is poorly understood. In our model, we simplyassumed that the homeostat, represented by the functionh(t), decays exponentially while thesystem is asleep and increases exponentially towards some limiting value while awake. Thismodel for the sleep/wake homeostasis is similar to that originally proposed by Borbely forthe two-process model of sleep regulation. Hence, our modelcan be viewed as extending thebiological basis underlying the two-process model. There have been numerous papers thathave proposed a physiological basis for the sleep/wake homeostasis. For example, Kruegerand Obal [30] (see also Tononi [26]) have proposed that the homeostasis is a local and use-dependent process that is based primarily at the level of thecortical column. In order tointerpret this within the context of our model, we could set the total cortical drives to VLPOand AMIN to be
ICTXA = IA
0 − IHOM and ICT XV = IV
0 + IHOM.
Then, while awake, the total cortical drive to the wake promoting cells decreases and the to-tal cortical drive to the sleep promoting cells increases. The opposite holds when the systemis asleep. Others have suggested that the sleep/wake homeostasis is associated with the ac-cumulation and decay of adenosine [46], so another interpretation is thatIHOM correspondsto a homeostatic current associated with the accumulation of adenosine. Multiple factorswith differing mechanisms likely contribute to sleep homeostasis. Clearly, further researchinto the nature of the sleep/wake homeostat is needed. Mathematical modeling, includingthe analysis presented in this paper, should prove very useful in guiding these experiments.
Our model leads to several insights and predictions concerning the human sleep/wakecycle. For example, the model predicts that, during the normal sleep/wake cycle, both wak-ing up and falling asleep are driven by the activity of VLPO. That is, the system falls asleepwhen activity of sleep-active cells rises above some threshold (instead of the activity ofwake-active cells falling below some threshold). Moreover, waking up is when the activityof sleep-active cells fall below a threshold. The model alsohelps explain the role of orexinin stabilizing the sleep/wake cycle. Saper and colleagues have suggested that an importantrole of the excitatory input from orexin neurons to the wake promoting cells is to stabi-lize the flip-flop switch. The model and analysis presented here provides a mathematicalinterpretation for how orexin stabilizes the switch and whythe loss of orexin leads to rapidswitching between sleep and wakefulness. In our model, without excitatory inputs from

20 Michael J Rempe et al.
ORX to AMIN, there is no longer a stable fixed point corresponding to the wake state. Thisleads to a short wake episode and, therefore, the sleep homeostat does not have time to buildup sufficiently. This, in turn, leads to a short sleep episode. Our model also predicts how theshort sleep/wake episodes should depend on circadian phase. Finally, as we have alreadydiscussed, in order to get a model based on the REM/NREM switch hypothesis to generatefeatures of the ultradian rhythms we need to posit an inhibitory connection from clVLPOto eVLPO and a drop in the activity of the eVLPO just before sleep onset. Our hope is thateach of these predictions will motivate future experimental studies.
Appendix
Circadian inputTo model the 24-hour circadian input, we used the same model as in [3]:
C(t) = −[0.97sin(ωt) + 0.22sin(2ωt)+0.07sin(3ωt)
+ 0.03sin(4ωt)+0.001sin(5ωt)]
ω =2πτ
and τ = 24.
NoiseA separate current is added to each of the four cell groups (wake-active, sleep-active, REM-active and NREM-active) to represent noisy inputs from other brain regions.In each case the noise is modeled as follows:
Iin = gnoiseni, (10)
wherei represents AMIN, VLPO, REM, or NREM. The termni is modeled with the following differentialequation:
n′i = wn(−ni +anN), (11)
whereN is a normally distributed random variable with mean 0 and standard deviation 1. Botha andw areconstants. Each time step a new value is chosen forN from the normal distribution. If this value is largerthan the value ofni at that time stepni will increase. Conversely, if the value chosen is negative thenni willdecrease. The values ofgnoise, an, andwn can be found in Table 1.
References
1. Achermann, P.: The two-process model of sleep regulationrevisited. Aviation Space And EnvironmentalMedicine75(3), A37–A43 (2004)
2. Achermann, P., Borbely, A.A.: Simulation of human sleep- ultradian dynamics of electroencephalo-graphic slow-wave activity. Journal Of Biological Rhythms5(2), 141–157 (1990)
3. Achermann, P., Borbely, A.A.: Simulation of daytime vigilance by the additive interaction of a homeo-static and a circadian process. Biological Cybernetics71(2), 115–121 (1994)
4. Achermann, P., Dijk, D.J., Brunner, D.P., Borbely, A.A.: A model of human sleep homeostasis basedon EEG slow-wave activity - quantitative comparison of dataand simulations. Brain Research Bulletin31(1-2), 97–113 (1993)
5. Boeve, B.F., Silber, M.H., Saper, C.B., Ferman, T.J., Dickson, D.W., Parisi, J.E., Benarroch, E.E.,Ahlskog, J.E., Smith, G.E., Caselli, R.C., Tippman-Peikert, M., Olson, E.J., Lin, S.C., Young, T., Ws-zolek, Z., Schenck, C.H., Mahowald, M.W., Castillo, P.R., Del Tredici, K., Braak, H.: Pathophysiologyof REM sleep behaviour disorder and relevance to neurodegenerative disease. Brain130, 2770–2788(2007)
6. Boissard, R., Gervasoni, D., Schmidt, M.H., Barbagli, B., Fort, P., Luppi, P.H.: The rat ponto-medullarynetwork responsible for paradoxical sleep onset and maintenance: a combined microinjection and func-tional neuroanatomical study. European Journal Of Neuroscience16(10), 1959–1973 (2002)
7. Borbely, A.: A two process model of sleep regulation. HumNeurobiol1, 195–204 (1982)8. Borbely, A., Achermann, P.: Sleep homeostasis and models of sleep regulation. J Biol Rhythms14,
557–568 (1999)

Mathematical model of sleep 21
sleep/wake model REM/NREM modelParameter Value Parameter Value
εA 3 εR 4.5εV 3 εN 4.5γA 5.7 γR 6γV 3.73 γN 6τ1A 1 τ1R 1τ2A 2 τ2R 2τ1V 1 τ1N 0.5τ1V 2 τ2N 1.8δA 0.01 δN 0.033δV 0.01 δR 0.033
gvl po 5 gamin (A to REM) 2.5gamin 2 gREM 0.4gscn 1 gNREM 5IA0 3 ae 1.4
IV0 0.6 be 2.7ghom 5.5 ke 0.25αh 18.2 gevl po 6.2βh 4.2 IR0 1
hmax 1 IN0 2.3KU 1.4KL -0.87
gnoise 5an 20wn 0.01
Table 1 Parameter values used in the models for the wake-active, sleep-active, REM-on, and REM-off pop-ulations.
9. Borbely, A.A., Achermann, P.: Concepts and models of sleep regulation, an overview. J. Sleep Res1,63–79 (1992)
10. Campbell, S., Czeisler, C., Dijk, D., Kronauer, R., Brown, E., Duffy, J., Allan, J., Shanahan, T., Rimmer,D., Ronda, J., Mitchell, J., Silva, E., Emens, J.: Is there anintrinsic period of the circadian clock? Science288, 1174–1175 (2000)
11. Chemelli, R.M., Willie, J.T., Sinton, C.M., Elmquist, J.K., Scammell, T., Lee, C., Richardson, J.A.,Williams, S.C., Xiong, Y.M., Kisanuki, Y., Fitch, T.E., Nakazato, M., Hammer, R.E., Saper, C.B., Yanag-isawa, M.: Narcolepsy in orexin knockout mice: Molecular genetics of sleep regulation. Cell98(4),437–451 (1999)
12. Chou, T.: Regulation of wake-sleep timing: Circadian rhythms and bistability of sleep-wake sates. Ph.D.thesis, Harvard University (2003)
13. Chou, T.C., Bjorkum, A., Gaus, S., Lu, J., Scammell, T., Saper, C.: Afferents to the ventrolateral preopticnucleus. Journal of Neuroscience22, 977–990 (2002)
14. Chou, T.C., Scammell, T.E., Gooley, J.J., Gaus, S.E., Saper, C.B., Lu, J.: Critical role of dorsomedialhypothalamic nucleus in a wide range of behavioral circadian rhythms. Journal Of Neuroscience23(33),10,691–10,702 (2003)
15. Colwell, C.S., Michel, S.: Sleep and circadian rhythms:do sleep centers talk back to the clock? NatureNeuroscience6(10), 1005–1006 (2003)
16. Czeisler, C., Duffy, J., Shanahan, T., Brown, E., Mitchell, J., Rimmer, D., Ronda, J., Silva, E., Allan, J.,Emens, J., Dijk, D., Kronauer, R.: Stability, precision, and near-24-hour period of the human circadianpacemaker. Science284, 2177–2181 (1999)
17. Daan, S., Domien, G.M.B., Borbely, A.A.: Timing of humansleep - recovery process gated by a circadianpacemaker. American Journal Of Physiology246(2), R161–R178 (1984)
18. Dauvilliers, Y., Amulf, I., Mignot, E.: Narcolepsy withcataplexy. Lancet369(9560), 499–511 (2007)19. Dijk, D.J., Czeisler, C.A.: Paradoxical timing of the circadian-rhythm of sleep propensity serves to con-
solidate sleep and wakefulness in humans. Neuroscience Letters166(1), 63–68 (1994)

22 Michael J Rempe et al.
20. Dijk, D.J., Czeisler, C.A.: Contribution of the circadian pacemaker and the sleep homeostat to sleeppropensity, sleep structure, electroencephalographic slow waves, and sleep spindle activity in humans.Journal Of Neuroscience15(5), 3526–3538 (1995)
21. DinizBehn, C.G., Brown, E.N., Scammell, T.E., Kopell, N.J.: Mathematical model of network dynamicsgoverning mouse sleep-wake behavior. Journal Of Neurophysiology 97(6), 3828–3840 (2007)
22. von Economo, C.: Sleep as a problem of localization. J. Nerv. Ment. Dis.71, 249–259 (1930)23. Ferrillo, F., Donadio, S., De Carli, F., Garbarino, S.: Amodel-based approach to homeostatic and ultra-
dian aspects of nocturnal sleep structure in narcolepsy. Sleep30(2), 157–165 (2007)24. FitzHugh, R.: Impulses and physiological states in theoretical models of nerve membrane. Biophysical
Journal1, 445–466 (1961)25. Fuller, P.M., Saper, C.B., Lu, J.: The pontine REM switch: past and present. Journal Of Physiology-
London584(3), 735–741 (2007)26. Hill, S., Tononi, G.: Modeling sleep and wakefulness in the thelamocortical system. Journal Of Neuro-
physiology93(3), 1671–1698 (2005)27. Jewett, M.E., Kronauer, R.E.: Interactive mathematical models of subjective alertness and cognitive
throughput in humans. Journal Of Biological Rhythms14(6), 588–597 (1999)28. Kleitman, N.: Sleep and wakefulness. University of Chicago Press (1987)29. Krahn, L.E., Black, J.L., Silber, M.H.: Narcolepsy: Newunderstanding of irresistible sleep. Mayo Clinic
Proceedings76(2), 185–194 (2001)30. Krueger, J.M., Obal, F.: A neuronal group-theory of sleep function (vol 2, pg 63, 1993). Journal Of Sleep
Research2(3), 186–186 (1993)31. Lavie, P.: Ultrashort sleep-waking schedule. iii. ’gates’ and ’forbidden zones’ for sleep. Electroen-
cephalography and clinical Neurophysiology63, 414–425 (1986)32. Lu, J., Bjorkum, A.A., Xu, M., Gaus, S.E., Shiromani, P.J., Saper, C.B.: Selective activation of the ex-
tended ventrolateral preoptic nucleus during rapid eye movement sleep. Journal Of Neuroscience22(11),4568–4576 (2002)
33. Lu, J., Sherman, D., Devor, M., Saper, C.B.: A putative flip-flop switch for control of rem sleep. Nature441(7093), 589–594 (2006)
34. Massaquoi, S., McCarley, R.: Extension of the limit cycle reciprocal interaction model of rem cyclecontrol. an integrated sleep control model. J. Sleep Res.1, 138–143 (1992)
35. McCarley, R., Massaquoi, S.: Neurobiological structure of the revised limit cycle reciprocal interactionmodel of rem cycle control. J. Sleep Res.1, 132–137 (1992)
36. McCarley, R.W.: Neurobiology of rem and nrem sleep. Sleep Medicine8(4), 302–330 (2007)37. McCarley, R.W., Hobson, J.A.: Neuronal excitability modulation over sleep cycle - structural and
mathematical-model. Science189(4196), 58–60 (1975)38. McCarley, R.W., Massaquoi, S.G.: A limit-cycle mathematical-model of the rem-sleep oscillator system.
American Journal Of Physiology251(6), R1011–R1029 (1986)39. McGinty, D., Szymusiak, R.: Hypothalamic regulation ofsleep and arousal. Frontiers In Bioscience8,
S1074–S1083 (2003)40. Mochizuki, T., Crocker, A., McCormack, S., Yanagisawa,M., Sakurai, T., Scammell, T.E.: Behavioral
state instability in orexin knock-out mice. Journal Of Neuroscience24(28), 6291–6300 (2004)41. Morris, C., Lecar, H.: Voltage oscillations in the barnacle giant muscle fiber. Biophys. J.35, 193–213
(1981)42. Nagumo, J., Arimoto, S., Yoshizawa, S.: An active pulse transmission line simulating nerve axon. Proc
IRE 50, 2061–2070 (1962)43. Nobili, L., Beelke, M., Besset, A., Billiard, M., Ferrillo, F.: Nocturnal sleep features in narcolepsy: a
model-based approach. Revue Neurologique157(11), S82–S86 (2001)44. Phillips, A.J.K., Robinson, P.A.: A quantitative modelof sleep-wake dynamics based on the physiology
of the brainstem ascending arousal system. Journal Of Biological Rhythms22(2), 167–179 (2007)45. Plazzi, G., Serra, L., Ferri, R.: Nocturnal aspects of narcolepsy with cataplexy. Sleep Medicine Reviews
12, 109–128 (2008)46. PorkkaHeiskanen, T., Strecker, R.E., Thakkar, M., Bjorkum, A.A., Greene, R.W., McCarley, R.W.:
Adenosine: A mediator of the sleep-inducing effects of prolonged wakefulness. Science276(5316),1265–1268 (1997)
47. Sakurai, T.: The neural circuit of orexin (hypocretin):maintaining sleep and wakefulness. Nature Re-views Neuroscience8(3), 171–181 (2007)
48. Saper, C.B., Chou, T.C., Scammell, T.E.: The sleep switch: hypothalamic control of sleep and wakeful-ness. Trends In Neurosciences24(12), 726–731 (2001)
49. Saper, C.B., Scammell, T.E., Lu, J.: Hypothalamic regulation of sleep and circadian rhythms. Nature437(7063), 1257–1263 (2005)

Mathematical model of sleep 23
50. Siegel, J.M.: The stuff dreams are made of: anatomical substrates of rem sleep. Nature Neuroscience9(6), 721–722 (2006)
51. Siegel, J.M.: Do all animals sleep? Trends In Neurosciences31(4), 208–213 (2008)52. Strogatz, S.: The mathematical structure of the human sleep-wake cycle. Springer (1986)53. Strogatz, S.H.: Human sleep and circadian-rhythms - a simple-model based on 2 coupled oscillators.
Journal Of Mathematical Biology25(3), 327–347 (1987)54. Swick, T.J.: The neurology of sleep. Neurologic Clinics23(4), 967–+ (2005)55. Szymusiak, R., Gvilia, I., McGinty, D.: Hypothalamic control of sleep. Sleep Medicine8(4), 291–301
(2007)56. Tamakawa, Y., Karashima, A., Koyama, Y., Katayama, N., Nakao, M.: A quartet neural system model
orchestrating sleep and wakefulness mechanisms. J Neurophysio 95(4), 2055–2069 (2006)57. Wright, K., Hughes, R., Kronauer, R., Dijk, D., Czeisler, C.: Intrinsic near-24-h pacemaker period de-
termines limits of circadian entrainment to a weak synchronizer in humans. PNAS98, 14,027–14,032(2001)
58. Yin, W.: A mathematical model of the sleep-wake cycle. Master’s thesis, Georgia Institute of Technology(2007)