a method for calibrating molecular clocks and its ...lynchlab/pdf/lynch59.pdf · a method for...
TRANSCRIPT

Copyright 0 1993 by the Genetics Society of America
A Method for Calibrating Molecular Clocks and Its Application to Animal Mitochondrial DNA
Michael Lynch and Paul E. Jarrell' Department of Biology, University of Oregon, Eugene, Oregon 97403
Manuscript received April 20, 1992 Accepted for publication July 29, 1993
ABSTRACT A generalized least-squares procedure is introduced for the calibration of molecular clocks and
applied to the complete mitochondrial DNA sequences of 13 animal species. The proposed technique accounts for both nonindependence and heteroscedasticity of molecular-distance data, problems that have not been taken into to account in such analyses in the past. When sequence-identity data are transformed to account for multiple substitutions/site, the molecular divergence scales linearly with time, but with substantially more variation in the substitution rate than expected under a Poisson model. Significant levels of divergence are predicted at zero divergence time for most loci, suggesting high levels of site-specific heterozygosity among mtDNA molecules establishing in sister taxa. For nearly all loci, the baseline heterozygosity is lower and the substitution rate is higher in mammals relative to other animals. There is considerable variation in the evolutionary rate among loci but no compelling evidence that the average rate of mtDNA evolution is elevated with respect to that of nuclear DNA. Using the observed patterns of interspecific divergence, empirical estimates are derived for the mean coalescence times of organelles colonizing sister taxa.
A s various genome-sequencing projects get under- way, we can anticipate a substantial increase in
our understanding of the dynamics of evolution in the nuclear genome. Such an understanding is already within reach for the mitochondrial genome for which complete nucleotide sequences from several different species are now available. Drawing from this infor- mation, the purpose of this paper is to develop a general description of the patterns of variation in the evolutionary rate within and between mitochondrial loci, with a particular goal of rigorously ascertaining the feasibility of dating evolutionary events with mo- lecular data. T o achieve this end, some statistical methods involving generalized least-squares analysis, similar to those recently suggested by BULMER (1989, 199 l), are introduced.
Animal mitochondrial DNA (mtDNA) is a small circular molecule, generally around 16 kb long. It contains two ribosomal RNA genes, 22 transfer RNA genes, and in most cases, 13 genes that code for subunits of enzymes functioning in electron transport or ATP synthesis (BROWN 1985; WILSON et al. 1985; MORITZ, DOWLING and BROWN 1987). A comparative study of the evolution of the animal mitochondrial genome is simplified greatly relative to studies with nuclear genes, since the mitochondrial genome seems generally to be inherited maternally (but see Gyllen- sten et al. 1991; Hoeh, Blakley and BROWN 1991), without recombination. Because all genes within such
Ashland, Oregon 97520-507 1,
Genetics 135: 1197-1208 (December, 1993)
' Present address: Department of Biology, Southern Oregon State College,
a genome must experience identical patterns of de- scent, variation in patterns of evolution among loci cannot be attributed to historical differences in pedi- gree structure. They must be a product of differences in the frequency and/or selective consequences of mutations.
BROWN, GEORGE and WILSON (1 979) and Brown et al. (1 982) established an association between mtDNA sequence divergence and evolutionary time; and sub- sequently, their evolutionary clock has been used widely to attach approximate dates to evolutionary events. However, their analysis was restricted to pri- mates, and it is unclear whether the results are gen- eralizable to other taxa (MARTIN, NAYLOR and PAL- UMBI 1992). Several studies with nuclear genes suggest the existence of variability in the rate of evolution among taxa (e .g . , Wu and LI 1985; LI, TANIMURA and SHARP 1987; HASEGAWA and KISHINO 1989; BULMER, WOLFE and SHARPE 1991), but the extent to which such variation is consistent with a general stochastic model, such as the neutral theory, remains to be seen. A second purpose of this study is to evaluate how well locus-specific patterns of evolution for animal mtDNA conform to a general stochastic model of evolution.
MATERIALS AND METHODS
A statistical model for molecular-clock calibration: Sup- pose that sequence data (amino acid or nucleotide) are available for r taxa for which a phylogenetic tree, based on information extrinsic to the data being analyzed, is available. There are then k = r(r - 1)/2 species comparisons. If 6 is
1198 M. Lynch and P. E. Jarrell
the average probability of a substitution per site per unit time in a lineage, then e-6 is the probability of no substitution assuming a Poisson process. (Provided 6 is small, this will also be approximately true for non-Poisson processes.)
For protein sequences, as a first approximation, it is reasonable to assume that the probabilities of back and parallel mutations are negligible if the time of divergence is less than the reciprocal of the site-specific mutation rate, i .e . , if Tij6 < 1, where Ty is the total time separating taxa i and j (twice the time from the present back to their first common ancestor), estimated directly from the phylogenetic tree. Letting E(lo) be the expected baseline identity (pro- portion of shared amino acids) for pairs of genes that become established in sister taxa descendant from the same ancestral species (one in one taxon, one in the other), the expected identity of random genes taken from two taxa ( i and j ) separated by T,J time units is then approximately
E(I , ) = E(Io)e-6Tq. (1)
At the DNA-sequence level, the probabilities of back and parallel mutations can be much more significant because there are only four nucleotides, and an alternative approach is needed to account for the possibility of multiple substitu- tions per site. This is true as well for amino-acid sequences when the time scale is large. Taking this into consideration, LEWONTIN (1989) showed that a more general solution to the expected dynamics of sequence identity is
E ( I q ) = I , + [ E ( l o ) - Im]e-6T~'("'J, (2)
where I , is the asymptotic identity approached as t + 00. We will return to the issue of estimating I , below, noting here simply that Equation 2 reduces to Equation 1 when 1, is assumed to be zero. Calibration of a molecular clock involves the estimation of the parameters lo and 6 from observations-on sequence identity and divergence time.
Letting a denote a parameter estimate, rearrangement and logarithmic transformation of Equation 2 leads to the linear model,
where I,J is the observed fraction of shared amino ?acids or nucleotides between sequences i andj , A. = -In(Zo - I,), and ey is the deviation of the 9th estimate of genetic distance from the prediction of the linear model. The initial hetero- zygosity per site (the proportion of site differences) for genes that become established in sister taxa is estimated by
fi0 = 1 - io = 1 - I , - e-'O. (4)
In empirical studies, Ho has usually been assumed to be zero in transformations of observed differences to estimates of numbers of substitutions. But in the context of species trees, it seems reasonable to expect Ho to be on the order of the heterozygosity within ancestral species. In reality, Ho may be more or less than the heterozygosity observed within ancestral species depending on which genes successfully colonize the daughter taxa.
From Equation 3, it can be seen that a regression of the transformed identity, D, = -ln(l,j - I-) , on the transformed time scale, Ty/(l-- I-), provides a basis for estimating the substitution r?te 6 and the baseline heterozygosity Ho (from the intercept Ao). However, two issues argue against the use of ordinary least-squares regression in the calibration of a molecular clock. First, due to the fact that the sequence from each species is used in ( r - 1) comparisons, the data clearly are nonindependent. Second, since the stochasticity of the evolutionary process will result generally in an in-
crease in the realized variances of genetic distances over time, the D estimates are heteroscedastic. These problems have been appreciated in earlier studies (WAYNE, Van Val- kenburgh and O'BRIEN 1991), but attempts to deal with them have been rather ad hoc. Although ordinary least- squares analysis often yields parameter estimates that are not greatly biased, the standard errors generated by the former are often gross underestimates, a serious concern when it comes to hypothesis testing.
The method of generalized least-squares regression, which simultaneously accounts for nonindependence and heteroscedasticity of data (KENDALL and STUART 1979), provides a useful solution to these problems. Estimates of the parameters of the model are given by the solution to
where the prime denotes a transpose. X is a k X 2 design matrix-the elements of the first column are all equal to one, and account for the intercept, while those of the second column are the corresponding values of the predictor vari- able TJ(1 - I-) . D is a column vector of the observed D,, each element being computed as -ln(Zy - I-) . V is the k X k sampling variance-covariance matrix for the elements of D. Implementation of this model requires estimates of the elements of V and of I,, which we now consider.
Elements of the variance-covariance matrix: Applying a second-order Taylor approximation to Equation 3, the ex- pectations of the diagonal and off-diagonal elements of V are found to be
where s is the number of amino acids per pFotein or nucle- otides per DNA sequence in a comparison, 1, is obtained by substituring the estimates of lo, T,, I,, and 6 into Equation 2, and Z,,k, = I , + (lo - Im)exp[-6Ty.kl/(l - I,)] with Tq,kl being the evolutionary time shared between the path i + j and the path k + 1. The T,,U can be obtained directly by inspection of the branch lengths of the phylogenetic tree or by the use of the computer algorithm of NEI and JIN (1 989). Equations 6a and 6b are very similar to the formulae of BULMER (1989), differing only because Bulmer assumed lo = 1. Note that the sampling variances and covpiances of the D,J approach their theoretical maxima as I 4 I,. In addition to accounting for heteroscedasticity, the use of V in Equation 5 has the effect of giving less weight to the DiJ with higher sampling error.
Estimation of the asymptotic identity: It is necessary to estimate the asymptotic identity I , prior to the computation of D and V. The following discussion focuses on I , for DNA sequences, but the extension to protein sequences is straight forward. At least three approaches to the problem, which depend on one's interpretation of interspecific differences in nucleotide content, are possible:
1) At any point in time, at least slight differences in nucleotide content will exist between taxa. But provided the four nucleotide frequencies simply have been varying sto- chastically in time, their phylogeny-wide mean frequencies (gA,qC,gG,qT) should lead to a reasonably representative es- timate of the asymptotic proportion of shared nucleotides by letting
I , = g:

Rate of Mitochondrial Evolution
(TAJIMA and NEI 1984), where n is the nucleotide type (A,C,G,T), and the summation is over all four nucleotides. When the four nucleotides have equal mean frequencies, I , = 0.25.
Because the r observed taxa are phylogenetically related to different degrees, it is desirable to account for their nonindependence in estimating the Qn. Let qni be the fre- quency of the nth nucleotide in the ith taxon and W be an r X r matrix whose elements are proportiopal to the sam- pling variance-covariance of the observed qni. Under the assumption that the nucleotide frequencies are fluctuating randomly in time, it seems reasonable to set the diagonal elements of W equal to 1 and to equate the ijth off-diagonal element to the fraction of time from the root of the tree shared by species i and j. The phylogeny-wide mean nucleo- tide frequencies can be estimated by using a special case of Equation 5,
I
q n = q n i W i l W T , (8) i= I
where wi is the sum of the elements in the ith row of W-’, and wT is the sum of the elements of W-’.
2) On the other hand, if the observed interspecific differ- ences in nucleotide frequencies are regarded as lineage specific, then unique values of I , need to be estimated for each pair of taxa i and j. One way to accomplish this is to let
(BULMER 1991), where the summation is over all four nucle- otides. A potential shortcoming of this approach is that it assumes that the properties of extant species provide an adequate description of Zm(ij) throughout the whole path between i and j . If qni and qnj differ, this cannot be strictly true for the simple reason that i and j share a common ancestor.
In principle, this problem might be avoided by estimating the nucleotide frequencies for all of the nodal species of a phylogeny so as to compute values of I , specific to each branch segment. Provided these differed substantially, Equation 2 could then be broken down into branch com- ponents to obtain more refined estimates of the actual number of substitutions. Unfortunately, this approach does not allow the construction of a linear model, and we will not pursue it any further.
3) A compromise between approaches 1) and 2) can be achieved by using an estimate of I , for the most recent common ancestor of species i and j to approximate Zm(ij). The nucleotide frequencies of the nodal species can be computed as a function of the information on all of the observed species through a special application of Equation 8 using node-specific weight matrices. In this case, for nodal species x we let the ith diagonal element of the W matrix be equal to the time separating observed species i and inferred nodal taxon x, and the ijth off-diagonal element be equal to the time shared between paths i c, x and j t, x. Again, both types of elements can be obtained directly from the phylo- genetic tree. After the node-specific nucleotide frequencies have been estimated, Equation 7 is used to compute the asymptotic identities.
One remaining issue involving the application of methods 2) and 3) concerns the assignment of specific I , in the computation of the off-diagonal elements of V. The ap- proach taken below was simply to compute Im(ij ,kl) for the element involving distances z j and kl by averaging Z,(ij) and Im(k, l ) .
Parameter estimation: Because the elements of V are
ri’
I
I I I I I I I J 0.6 0.4 0 2 0.0
BYA
1199
Reitus
Mus
HOmO
Phoca
Bas
Bekienoptem
Gallus
Xenopus
Pmcentrdus
Strongylocemtlls
Dmphi la
Apis
Caenothabditis
FIGURE 1 .-Phylogenetic tree assumed in the analysis. The num- bers at the nodes refer to the analyses in Table 3.
functions of-the pazameters to be estimated, it is necessary to estimate A. and 6 by a recursive procedure. After assign- ing initial values to the elements of V, a first round of estimates of A0 and 6 arc acquired by use of Equation 5. Then the first estimates Io and 6 are substituted into Equa- tions 6a and 6b, and a second set of parameter estimates is obtained with Equation 5. This process is repeated until a satisfactory degree of stability is achieved for the parameter estimates. For the data sets analyzed in this paper, seven or fewer recursions were almost always adequate for conver- gence to several decimal places, and the final results did not depend on the starting conditions. After noting this, Io = 1 and 6 = 0.1 per billion years were used as initial values in the iterative process.
Following convergence, the 2 X 2 sampling variance- covariance matrix of the parameter estimates is obtained as
var(6) = (x’v-~x)-’. (10)
The square roots of the two diagonal clements of Var(B) estimate the standard errors of A. and 6, respectively. The off-diagonal elements are equal to each other and estimate the sampling covariance of A0 and 6. By Taylor expansion, the sampling variance of the baseline heterozygosity is found to be approximately
var(fio) = e-2 i~ Var(A,,). (1 1)
This iterative approach to parameter estimation has a long history of successful applications in genetic analysis [for a review of the issues involving quantitative-genetic analysis, see SHAW (1987)l. To verify that the procedure is not just a seat-of-the-pants technique but really does estimate the relevant parameters, evolution was simulated over a nine- species phylogenetic tree very similar in structure to that in Figure 1 (minus the whale, seal, bee and nematode). For the ”constant-rate” simulations reported in Table 1, the number of substitutions per site over a branch segment T billion

1200 M. Lynch and P. E. Jarrell
TABLE 1
Mean parameter estimates obtained from simulations
Conditions Ha 6 R
E(Ho) = 0.00 -0.0002 (0.0098) 0.249 (0.046) 0.94 (2.19) Constant rate
Variable rate
Constant rate
Variable rate
E(Ho) = 0.00 0.0003 (0,0099) 0.245 (0.051) 1.21 (1.78)
E(Ho) = 0.05 0.0486 (0.01 14) 0.249 (0.047) 0.95 (1.89)
E(Ho) = 0.05 0.0480 (0,0115) 0.249 (0.054) 1.13 (1.72)
Standard deviations are given in parentheses. For each set of conditions, 1000 simulations were performed, with 100 sites as- sumed per gene. The expected value of d is 0.25 in all cases.
years in length was taken to be Poisson-distributed with expectation 0.25T (a rate of evolution similar to that found in many of the actual data analyses). For the “variable-rate” simulations, a similar procedure was followed except that each branch had a unique expected substitution rate drawn from a normal distribution with expectation 0.25 and stand- ard deviation 0.05. Simulations were performed with ex- pected baseline identities equal to 1.00 and 0.95, in the latter case letting the actual baseline divergence for any pair of taxa be drawn from a normal distribution with mean 0.05 and standard deviation 0.0 1. Each set of input conditions was used to generate 1000 sets of pairwise substitutional differences (the r(r - 2) 20, values), which were then run through the model to esti-mate H,and 6.
The mean values of Ho and 6 as well as the standard deviations among runs are reported in Table 1 for the four sets of simulations. In all cases, the technique recovered mean parameter estimates that were very close to their expectations. Thus, variance in the substitution rate among lineages, baseline divergence, and variation in baseline di- vergence appear to cause negligible bias in parameter esti- mation using the generalized least-squares approach.
Coalescence times: As noted above, AO is an estimate of the initial divergence (T = 0) between pairs of genes descending into sister taxa. By extending the regression line, given by Equation 3, back to the point at which D = -In(l - I=) , it is possible to estimate the time separating pairs of founding genes ( i e . , the time necessary to go back- ward before the founding genes are expected to be identical in state). The expression for this empirical estimate of the coalescence time can be acquired by rearrangement of Equa- tion 3,
T, = - (1 - L,)[& + In(1 - I,)]
26 (1 2)
This approach assumes that the evolutionary forces (selec- tion, mutation and drift) influencing variation within species are equivalent to those causing divergence among species.
Variance of the substitution rate: Due to the stochastic nature of mutation, the realized number of substitutions is expected to vary from lineage to lineage over the same evolutionary time span. Provided there is not a substantial negative covariance between substitution rates in different intervals, this sampling variance should accumulate over time, resulting in an increase in the deviation between observed and expected divergence with time. Information on the dispersion pattern of divergence estimates can yield useful insight into statistical properties of the evolutionary process.
Procedures similar to those just outlined can be used to estimate the variance of the substitution rate if one is willing to assume that the residual sampling variance accumulates in an approximately linear fashion with time. (Nonlinear time-dependence can be accommodated readily, although it will not be pursued here). For each species comparison, the squared-deviation from the regression prediction is e*, = (0, - De)*, where D, = A. + 6T,J(l - I,) is the fitted divergence. The slope of the regression of the e2q on Tq/(l - I,) is obtained by use of Equation 5 with the vector of the e2q substituted for D, X as defined above, and the elements of the weight matrix V being redefined as described below. The variance of the substitution rate per site is s times the slope. If substitutions occur according to a Poisson process, the expectes value of this quantity is 6, so that its expected ratio with 6 (R , the index of dispersion) is approximately equal to one (KIMURA 1983; GILLESPIE 1986a, 1987).
The main difficulty with this approach is knowing how to scale the elements of V, the sampling variances and covari- ances of the e2,.,. with time. A eneral expression for the variance of a varlance is (p4 - pp ), where pp and p4 are the second and fourth moments about the mean, which reduces to 2pZ2 under the assumption of normality. With a lar e number of sites per gene, approximate normality of the e 8 rl
is expected under the central limit theorem. Therefore, as a first approximation, we let the elements of V be twice the squares of the expressions 6a and 6b. Results from simula- tions (Table 1) show that this approach yields average values of R that are very close to one when the expected rate of evolution is the same for all branches (“constant rate” anal- yses). However, the standard deviation of R among replicate runs tends to be very high, with values of R in excess of 10 or below zero sometimes occurring, even in the case of the ideal Poisson model. This is not too surprising, since the sampling variance of a variance can be quite high, and it underscores the limitations of inferring too much from estimates of R derived from a small number of genes. The results in the table also show that the mean estimate of R is inflated when 6 varies among branch segments, as expected.
Lineage-specific rates of evolution: The approach just outlined is meant to estimate the average variance in the substitution rate throughout the entire phylogeny. Another procedure is needed to evaluate whether the average rate of substitution varies among different branches in the tree. This can be accomplished by viewing the total evolutionary change between two extant species as the sum of evolution- ary changes along the relevant segments of the phylogenetic tree, these segments extending either between adjacent nodes or between a node and a branch tip. The evolutionary changes over independent segments are estimated by gen- eralized least-squares by using an expression identical in form to Equation 5 . In this case, X is a k X m design matrix, where m is the number of segments. The elements of X are all zeros or ones, depending on whether the segment con- tributes to the observed distance. The elements ofiV are again given by Equations 6a and 6b. The solution B is the m X 1 vector of estimated evolutionary change over the m branch segments.
The data: The following analyses utilize the complete sequences (excluding the highly variable d-loop) of single mitochondrial genomes from man (ANDERSON et al. 1981); mouse (Mus musculus, BIBB et al. 1981); rat (Rattus nowegz- cus, GADELETA et al. 1989); cow (Bos taurus, ANDERSON et al. 1982); fin whale (Balaenoptera physalus, ARNASON, GULL- BERG and WIDECREN~ 991); harbor seal (Phoca uitulina, AR- NASON and JOHNSSON 1992); chicken (Gallus gallus domesti- CUS, DESJARDINS and MORAIS 1990); frog (Xenopus laevis, ROE et al. 1985); two sea urchins (Strongylocentrotus purpur-
Q

Rate of Mitochondrial Evolution 1201
atus, JACOBS et al. 1988; Paracentrotus lividus, CANTATORE et al. 1989); Drosophila yakuba (CLARY and WOLSTENHOLME 1985); honeybee (Apis mellqera, CROZIER and CROZIER 1993) and the nematode (Caenorhabditis elegans, OKIMOTO et al. 1992). The same genes are present in all of these species except ATP8, which seems to be absent from C. elegans.
The analysis is restricted to substitutional changes. Inser- tions and deletions are rare in the protein-coding genes, but more common in the transfer RNA and ribosomal RNA genes. Alignments of each gene were performed initially by eye, as core regions that are highly conserved across all taxa could be located readily in this manner. When gaps caused uncertainties in alignments between conserved regions, the program MALIGN (WHEELER and GLADSTEIN 1993) was used to multiply align the intervening sequences while ac- counting for the phylogeny. The aligned sequences are available from the authors.
Prior to analysis of the data, the phylogenetic tree shown in Figure 1 was inferred using information in the fossil record summarized in BRODKORB (1 964), JACOBS and PIL- BEAM (1980), YOUNG (1981), SAVAGE and RUSSELL (1983), FUTUYMA (1986), NOVACEK (1992), MORRIS (1993), and references therein. Because the substitution rate may vary among phylogenetic groups, and some investigators may desire a molecular clock specific to mammals, we performed analyses on mammals alone as well as on the total data set.
RESULTS
Protein-coding genes: Due to variation among amino acids in the redundancy of the genetic code, there can be substantial difficulties in relating nucleo- tide substitutions in a protein-coding gene to evolu- tionary time if the protein is under selective con- straints (LEWONTIN 1989). Therefore, the analyses for these loci were restricted to the level of amino-acid substitutions. Using method 1, outlined above, the estimated asymptotic identities for amino-acid se- quences were remarkably constan: among genes, the mean and standard deviation of I , being 0.082 and 0.010 for mammals, and 0.080 and 0.009 for the entire phylogeny. Thus, I , was set at 0.080 in all of the protein analyses.
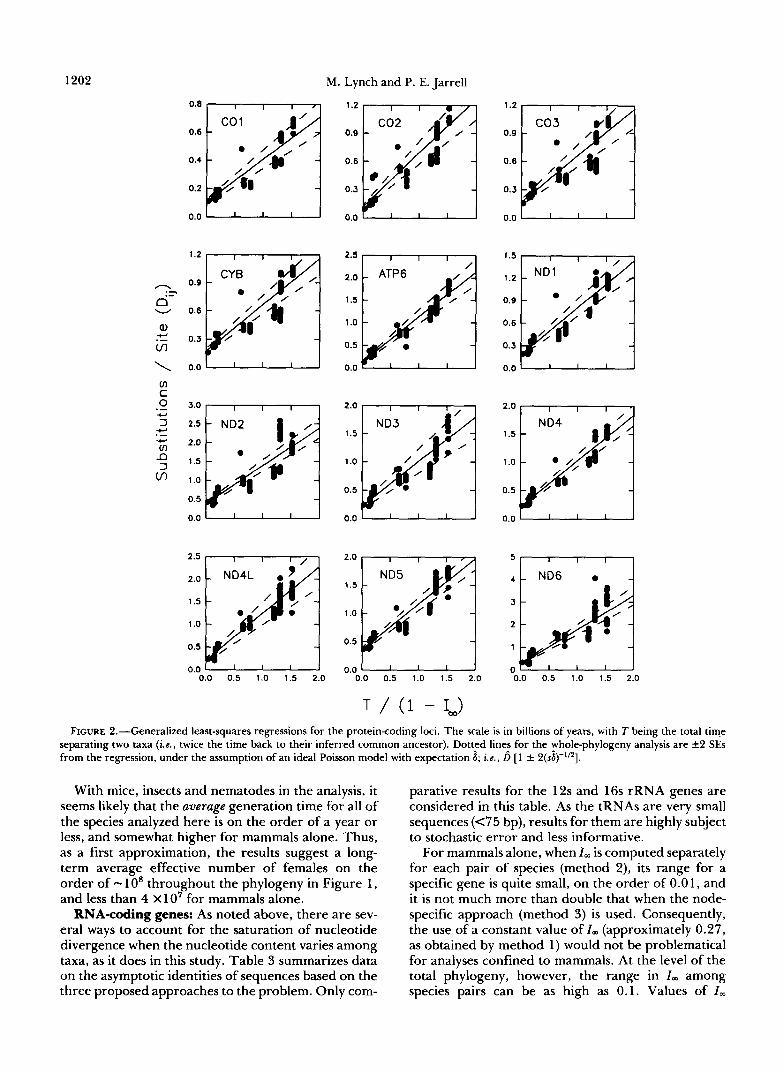
At the level of the entire phylogeny, the estimated mean substitution rates (per billion years) range from $ = 0.30 for COl to 1.52 for ND6 (Figure 2, Table 2). The standard errors of these estimates are all on the order of 10% of the estimates, so there is little question that there is significant heterogeneity in the rates of evolution among different loci. Such hetero- geneity has been inferred previously from restriction- site data by WHITTAM et al. (1 986). In every case, the average substitution rate for mammals is higher than that for the entire available animal phylogeny-with a narrow range of 1.03 times higher for COI to 1.94 times higher for C02, and an average inflation Over all genes of 1.47 2 0.07.
Using two standard errors as a criterion for signifi- cance, the intercepts of the regressions are significant for all of the whole-phylogeny analyses, suggesting a baseline heterozygosity per amino-acid site in found-
ing genes ranging from 0.02 for COl to 0.25 for ATP8 (Table 2). When the analysis is restricted to mammals, f i 0 is lowered for all 13 genes, but it is still significantly greater than zero in 10 cases.
In almost every protein analysis, the estimated index of dispersion is greater than the Poisson expectation of one. This can be seen most easily in Figure 2, where the dashed lines denote the expected 95% confidence limits around the regression assuming the divergence process is truly Poisson with expectation 6 ; many of the data fall outside of the expected Poisson range. At the level of the entire phylogeny, averaged over all 13 genes, the ratio of the variance to the mean substitution rate ( ~ s E ) is = 16.8 f 1.0 (Table 2). When the analysis is confined to mammals, the level of variation is approximately halved, with the average index of dispersion becoming 6.9 f 1.5. This reduc- tion in R is an expected consequence of confining the analysis to a narrower taxonomic group, since as noted above, mammalian mitochondrial DNA tends to evolve more rapidly than that in other taxonomic groups.
Regardless of whether conditions of strict neutrality are met, one expects both higher heterozygosity and higher substitution rates at loci with higher mutation rates to acceptable changes. The anticipated correla- tion is indeed found, with fitted slopes of the regres- sion of f i o on s equal to 145 f 18 ( r 2 = 0.84, P < 0.001) million years for the whole-phylogeny and 75 k 12 ( r2 = 0.84, P C 0.001) million years for the mammalian analysis (Figure 3).
To the extent that the estimates of Ho are repre- sentative of the heterozygosity in ancestral species and the observed substitutions are predominantly neutral, the relationships in Figure 3 provide some additional insight into long-term average effective population size. The expected heterozygosity per site for a ma- ternally inherited organellar genome is 2Nfp/(1 + 2Nfp), where Nf is the effective number of females and p is the mutation rate per site per generation. Since p = St, under neutrality, where t, is the mean generation time in years and 2Nfp/(l + 2Np) 2Nfp for small Nfp, the expected slope of a regression of HO on 6 is approximately 2Nftg under such an inter- pretation. Thus, the regressions in Figure 3 lead to the suggestion that the average value of Nft, through- out the entire phylogeny is approximately 72 X IO6 and approximately 38 X lo6 for mammals. Both esti- mates are remarkably close to the coalescence times obtained by averaging results over all 13 genes, Fc = 78 k 11 million years for the whole phylogeny and 38 & 7 million years for mammals only. This may be more than coincidental. As noted by AVISE, BALL and ARNOLD (1988), the expected coalescence time (in years) under the neutral theory is equal to the average value of Nftc
1202 M. Lynch and P. E. Jarrell
0.0 - cn C
0.0 - 2.5 I I I 1 / 1 "t.."i 1 .o
0.5
0.0 0.0 0.5 1.0 1.5 2.0
1.2
0.6
0.3
0.0
2.5
2.0
1.5
1 .o
0.5
0.0
2.0
1 .o
0.0
2.0
1.5
1 .o
0.5
.."i 0.0 -
0.0 0.5 1.0 1.5 2.0
1.2
0.9
0.6
0.3
0.0 - 1.5
0.9
0.6
0.3
0.0 - 2.0
1 .o
0.5
0.0 - 51,,,) :t,6"1 2
1 / 0
0 0.0 0.5 1.0 1.5 2.0
FIGURE 2.--Generalized least-squares regressions for the protein-coding loci. The scale is in billions of years, with T being the total time separating two taxa ( k , twice the time back to their inferred common ancestor). Dottled lines for the rholephylogeny analysis are +2 SEs from the regression, under the assumption of an ideal Poisson model with expectation 6; ie., D [ 1 f 2(sb)"/*].
With mice, insects and nematodes in the analysis, it seems likely that the average generation time for all of the species analyzed here is on the order of a year or less, and somewhat higher for mammals alone. Thus, as a first approximation, the results suggest a long- term average effective number of females on the order of - 10' throughout the phylogeny in Figure 1, and less than 4 XlO' for mammals alone.
RNA-coding genes: As noted above, there are sev- eral ways to account for the saturation of nucleotide divergence when the nucleotide content varies among taxa, as it does in this study. Table 3 summarizes data on the asymptotic identities of sequences based on the three proposed approaches to the problem. Only com-
parative results for the 12s and 16s rRNA genes are considered in this table. As the tRNAs are very small sequences (<75 bp), results for them are highly subject to stochastic error and less informative.
For mammals alone, when Z, is computed separately for each pair of species (method 2), its range for a specific gene is quite small, on the order of 0.01, and it is not much more than double that when the node- specific approach (method 3) is used. Consequently, the use of a constant value of Zm (approximately 0.27, as obtained by method 1) would not be problematical for analyses confined to mammals. At the level of the total phylogeny, however, the range in Zm among species pairs can be as high as 0.1. Values of Zm

Rate of Mitochondrial Evolution 1203
TABLE 2
Parameter estimates for amino-acid substitutions
Gene
co1
c02
C 0 3
CYB
A TP6
A TP8
N D I
ND2
N D 3
ND4
ND5
ND6
ND4L
Ho
0.022 f 0.007 0.020 f 0.007 0.032 f 0.013
-0.010 f 0.014 0.079 f 0.016 0.018 f 0.012 0.079 f 0.013 0.048 f 0.01 3 0.052 f 0.016 0.034 f 0.018 0.254 f 0.049 0.163 f 0.051 0.090 f 0.015 0.065 f 0.016 0.245 f 0.020 0.220 f 0.021 0.122 f 0.028 0.094 f 0.030 0.1 16 f 0.014 0.094 f 0.015 0.223 f 0.016 0.198 f 0.017 0.152 f 0.027 0.146 f 0.030 0.107 f 0.03 1 0.088 f 0.033
0.302 f 0.013 0.31 1 f 0.049 0.576 f 0.028 1.118 f 0.135 0.496 f 0.024 0.605 f 0.097 0.493 f 0.020 0.879 f 0.098 0.996 f 0.037 1.284 f 0.155 1.383 f 0.098 2.523 f 0.424 0.627 f 0.025 0.958 f 0.1 13 0.998 f 0.03 1 1.472 f 0.142 0.786 f 0.046 1.247 f 0.217 0.81 1 f 0.024 1.092 f 0.101 0.803 f 0.023 1.205 f 0.104 1.515 f 0.054 1.967 f 0.228 1.033 f 0.058 1.361 f 0.246
15.9 f 0.6 4.4 f 1.4
13.4 f 0.6 19.6 f 1.0 14.8 f 0.8
1.0 * 1.2 21.9 f 0.8
5.6 f 1.4 5.8 f 0.7 3.7 f 1.3 3.7 f 0.9 5.8 f 1.6
15.6 f 0.8 4.3 f 1.5
48.0 f 0.9 15.6 f 2.1 6.3 f 0.8 2.9 f 1.6
16.9 f 0.8 7.6 f 1.6
23.4 f 0.9 6.0 f 2.1
28.1 f 0.7 11.1 f 1.7 4.4 f 0.7 2.3 f 1.5
COI-3 are subunits of cytochrome oxidase, CYB is cytochrome B, ATP6 and 8 are ATPase subunits, and NDI-6 are subunits of NADH dehydrogenase. For each gene, the second set of estimates is for the analysis applied exclusively to mammals. Standard errors follow the f signs. The standard error of the index of dispersion was obtained from the expression for the variance of a ratio.
x 0'3 ;
0.0 1 I , J 0.0 0.5 1.0 1.5 2.0 2.5
Substitutions/Site/BY FIGURE 3,"Estimates of Ho us. d for the protein-coding genes.
Open points refer to the whole-phylogeny analysis and solid points to the analysis for mammals alone.
substantially in excess of 0.3 occur when one member of a species pair is very A-T rich, as is the case of Apis in this study.
The estimates of HO and 6 derived by the different methods are given in Table 4. The iterative algorithm
TABLE 3
Asymptotic identities ( L ) for nucleotide substitutions
Approach: 1 2 3
Total phylogeny 12s rRNA 0.281 0.252-0.328 0.261-0.305 16s rRNA 0.297 0.254-0.367 0.268-0.328 tRNA 0.291
12s rRNA 0.268 0.262-0.274 0.267-0.295 16s rRNA 0.273 0.268-0.277 0.272-0.284 tRNA 0.278
Mammals only
For methods 2 and 3, the range of I , among species pairs is given. The method 1 results given for the tRNA loci are averages over all 22 loci.
TABLE 4
Parameter estimates for nucleotide substitutions
Substitu+ns/BY Index of dispersion Gene H o (6) ( R )
12s RNA Total 1 0.102 f 0.006 0.447 f 0.007 112.4 f 0.4
2 0.088 f 0.005 0.489 f 0.007 35.9 f 0.3 3
Mammals 1 0.054 f 0.006 1.050 f 0.043 3.4 f 0.7 2 0.061 f 0.006 1.001 f 0.042 2.5 f 0.8 3 0.054 f 0.006 1.138 f 0.043 3.0 f 0.7
Total 1 0.147 f 0.005 0.474 f 0.005 49.3 f 0.4 2 0.125 f 0.005 0.406 f 0.005 50.9 f 0.4 3
Mammals 1 0.134 f 0.005 0.648 f 0.026 9.4 f 1.1 2 0.139 f 0.005 0.609 f 0.025 8.3 f 1.1 3 0.136 f 0.008 0.674 f 0.026 9.8 f 1.0
- - -
16s RNA
- - -
tRNA Total 1 0.088 f 0.009 0.584 f 0.037 8.8 f 1.1 Mammals 1 0.073 f 0.009 0.822 f 0.1 13 4.4 f 0.8
Results for the tRNA loci are averages over the method 1 analyses applied to each of the 22 genes.
did not converge when method 3 was applied to the total phylogeny. Otherwise, the results of all three methods are fairly similar qualitatively, although f can differ by as much as 15% among methods. In the following discussion of the data and their implications, the analyses resulting from the species-specific ap- proach (method 2) will be relied upon.
Compared with the substantial range in the rate of amino-acid substitution among protein-coding genes (0.3-2.5 substituitions/site/BY), the rate of nucleotide substitution for RNA-coding genes is relatively con- stant. For the whole-phylogeny analysis, f = 0.49 and 0.41/BY for the 12s and 16s ribosomal RNAs, and f = 0.58 averaging over all 22 tRNAs. As in the case of the protein-coding genes, all estimates of 6 are higher when the analysis is confined to mammals than when it is performed on the entire phylogeny. Aver- aging over the three types of RNA genes, the rate of nucleotide substitution in mammals is inflated about

1204 M. Lynch and P. E. Jarrell
1.6-fold relative to the total phylogeny, very similar to the 1.5-fold inflation noted for the rate of amino- acid substitution. As in the case of protein-coding genes, the estimated baseline heterozygosities are highly significant for rRNA and tRNA loci, ranging up to 0.15 per nucleotide site. For all three types of loci, the index of dispersion is significantly greater than one, averaging 31.9 & 12.3 for the whole phylogeny and 5.1 f 1.7 when the analysis is confined to mam- mals.
The average coalescence time is estimated to be 1 19 f 25 million years for the whole phylogeny and 80 f 27 for mammals. Both estimates are about 40 million years greater than those derived from the protein- coding genes.
Lineage-specific rates of evolution: The evolution- ary distances were estimated for the 23 branch seg- ments of the phylogeny (Figure 1) and converted to relative amounts of divergence_ by dividing by the expected divergences (A0/2) + [St/( 1 *- fm)]: where t is the time along the segment, and Ao, 6 and I, are from the whole-phylogeny analysis. (With significant base- line heterozygosity, relative divergences cannot be definitively ascribed to differences in rates of substi- tution.) Averaging over all loci, the data strongly suggest the existence of heterogeneity in the average rate of amino-acid substitution among different seg- ments (Table 5) .
For protein-coding loci, the amount of divergence is exceptionally high in the primate and hymenop- teran (Apis) lineages. In the branch separating birds and mammals (2-6), the divergence is about half of the expectation and it is about one-quarter of the expectation in the branch separating echinoderms and vertebrates (8-9). Moreover, there appears to have been negligible divergence in the branches between amniotes and amphibia (6-7) and between arthropods and deuterostomes (10-1 1). Thus, most of the deep internal branches of the phylogeny in Figure 1 are characterized by unusually low rates of amino-acid substitution in the mitochondrion. (Although low rel- ative rates of evolution are noted for other branch segments in Table 5 , these all involve relatively short (<20 MY) time periods and are much more sensitive to errors in the placement of the phylogenetic nodes than the rates for long branches discussed above.)
Similar results were obtained for the rRNA and tRNA loci. Among mammals, the lineage leading to man exhibits the highest evolutionary rate, and for the entire phylogeny, it is inflated by approximately 40% in the external branch leading to Apis. The bird- mammal, echinoderm-vertebrate and arthropod- deuterostome branches again exhibit very low or neg- ligible rates of substitution.
DISCUSSION
The approaches that we have used to estimate means and variances of evolutionary rates are similar
to those employed by BULMER (1989) but differ in two fundamental ways. First, unlike Bulmer’s method, which assumes a star phylogeny, the proposed tech- nique makes no special assumptions about phyloge- netic structure. Second, contrary to the assumption made in most other attempts to calibrate molecular clocks, a baseline heterozygosity equal to zero is not assumed. Such an assumption does not appear to be warranted for any of the mitochondrial genes. Rather, the data suggest that mitochondria that ultimately colonize sister taxa are often substantially divergent within their ancestral species.
In principle, a temporal decline in the rate of mo- lecular evolution (as would occur, for example, if new species tended to undergo brief, initial phases of rapid evolution) could lead to a false impression of baseline heterozygosity when a linear model is used to fit the data. It is true that the regression coefficients are almost always higher, and the intercepts lower, when the analysis is confined to mammals. Such a pattern is consistent with a reduction in the evolutionary rate over time, since the mammalian lineage is relatively young. However, in the absence of data on other recent, species-rich lineages, it is equally plausible that mammals intrinsically have more rapid rates of molec- ular evolution than other animal taxa. As can be seen in Figure 2, there is no indication of curvilinearity in the total data set for protein-coding genes, and the situation is the same for the rRNA and tRNA genes (data not shown). Thus, for the existing sequences, Equation 3 appears to correct adequately for multiple amino-acid substitutions, rendering the data compat- ible with a linear model.
Errors in the placement of the nodes in the phylo- genetic tree could also lead to systematic errors in the estimates of Ho. However, based ?n the estimated coalescence times, a reduction of Ho to zero would require the average divergence times for all of the taxa in Figure 1 to be underestimated by about 100 million years, and by about 50 million years in the case of mammals alone. At least in the latter case, this seems rather unlikely.
Baseline heterozygosity in the mitochondrial ge- nome is expected for the simple reason that restric- tion-site variation has been found in essentially every species that has been surveyed. A practical conse- quence of this result is that, unless the positive inter- cept is allowed for, linear models fit to molecular data for the purpose of dating unknown evolutionary events will tend to overestimate the time of the event if the event is fairly recent (say within 100-200 million years). Recently, WAYNE, VAN VALKENBURCH and O’BRIEN (1 99 1) attempted to calibrate mammalian molecular clocks for divergence estimates based on isozymes, DNA-DNA hybridization and microcomple- ment fixation. Inspection of their data indicates

Rate of Mitochondrial Evolution 1205
TABLE 5
Mean relative evolutionary rates for branch segments
Branch Segment Protein rRNA tRNA Average
Above average divergence 3-Homo 9-Stongylocentrotus 1 1 - A p i ~
Average divergence 1"Rattus
4-Phoca 1 -MUS
5-BOS 5"Balaenoptera 6-Gallus 9-Paracentrotus 8-10 1 O-Caenorhabditis
1-2 2-3 3-4 4-5 2-6 6-7
Below average divergence:
7-Xenopus 7-8 8-9 10-11 1 1 "Drosophila
1.45 (0.15) 1.14 (0.05) 1.88 (0.13)
1 .OO (0.08) 0.94 (0.06) 0.91 (0.04) 0.78 (0.05) 0.94 (0.08) 0.91 (0.05) 0.93 (0.06) 0.90 (0.28) 1.05 (0.06)
0.63 (0.06) 0.25 (0.06) 0.39 (0.10) 0.02 (0.05) 0.49 (0.1 3)
-0.02 (0.14) 0.75 (0.08) 0.93 (0.12) 0.25 (0.13)
1.04 (0.05) -0.04 (0.08)
1.19 (0.01) 1.19 (0.12) 1.37 (0.16)
0.96 (0.07) 0.90 (0.03) 0.97 (0.02) 0.98 (0.05)
1.03 (0.08)
0.83 (0.04) 1.03 (0.01)
0.33 (0.09) 0.05 (0.03) 0.09 (0.04) 0.07 (0.01)
0.18 (0.07) 0.88 (0.04) 0.51 (0.01) 0.15 (0.11)
0.79 (0.07)
1.02 (0.10)
1.01 (0.02)
0.2 1 (0.1 1)
0.11 (0.11)
1.14 (0.15) 1.38 (0.46) 1.46 (0.37)
0.98 (0.05) 1.00 (0.06)
0.91 (0.14) 0.98 (0.04) 1.40 (0.33) 1.18 (0.26) 2.21 (1.58) 0.67 (0.12)
0.30 (0.09) 0.13 (0.12) 0.12 (0.06)
-0.26 (0.43) 1.17 (0.69) 0.86 (0.18) 0.63 (0.31) 0.47 (0.15) 0.15 (0.15) 0.82 (0.12)
1.09 (0.1 1)
-0.02 (0.15)
1.26 (0.10) 1.24 (0.07) 1.57 (0.16)
0.98 (0.01) 0.95 (0.03) 0.99 (0.05) 0.89 (0.06) 0.98 (0.02) 1.1 1 (0.15) 1.04 (0.07) 1.31 (0.44) 0.92 (0.12)
0.42 (0.1 1) 0.14 (0.06)
0.02 (0.03)
0.44 (0.37) 0.83 (0.04) 0.69 (0.12) 0.29 (0.09) 0.07 (0.06) 0.88 (0.08)
0.20 (0.10)
0.15 (0.22)
~ ~ ~~~ ~~ ~
The numbers in the branch-segment column refer to the nodes in Figure 1. Standard errors are given in parentheses. ~ ~~
clearly that a linear model would have lead to positive intercepts. The authors avoided the issue by log- transforming the data prior to analysis, a treatment that results in curvilinear regressions that pass through the origin on the untransformed time scale. This led the authors to conclude (possibly incorrectly) that the rate of molecular divergence usually slows down over time.
At first sight, the estimates of HO appear to be inconsistent with direct observations of gene diversity within species. Based on restriction-site data for the entire mitochondrial genome, estimates of the mean heterozygosity per nucleotide site (within- plus be- tween-population gene diversity) range from 0.002- 0.0 10 in eight species of vertebrates and invertebrates (LYNCH and CREASE 1990). Multiple sequences of the same gene within a species are still rare, but WAYNE et al. (1990) recently reported up to 8% nucleotide- sequence divergence for CYB in a population of black- backed jackals.
There at least two reasons why existing studies of within-population diversity may substantially under- estimate the level of divergence between incipient species. First, it is conceivable that gene diversity estimates based on restriction-site surveys give a biased assessment of overall nucleotide diversity due to spe- cial properties of restriction sites, e.g., restriction sites
may evolve unusually slowly. Second, the maximum sequence divergence between pairs of mitochondria in a species (for example, between mitochondria at opposite ends of a species' range) is usually much higher than the mean divergence. If isolation-by- distance is an important mechanism of speciation, baseline divergence would be expected to be much greater than the observed heterozygosity within local populations. Thus, the indirect estimates of HO are not necessarily incompatible with direct observations. That being the case, the data suggest that high-fio loci such as ATP8, ND2, ND5 and ND6 may actually be hypervariable and hence useful markers for studies of population structure.
The results of this study do not support previous claims, based largely on primate data, that the rate of evolution of mtDNA is generally high relative to that of nuclear DNA (BROWN, GEORGE and WILSON 1979; BROWN et al. 1982). If anything, the rate of evolution of the mitochondrial genome may be somewhat con- servative. For example, the range of $ for amino-acid substitutions in 54 nuclear protein-coding genes, ex- cluding histones, ubiquitin and fibrinopeptides, is 0.1- 3.7 substitutions/BY (NEI 1987), which encompasses that observed in the mitochondrion (Table 2). Al- though our analyses of the protein-coding loci were restricted to amino-acid substitutions, the rates of

1206 M. Lynch and P. E. Jarrell
nucleotide substitution for mitochondrial rRNAs and tRNAs are about an order of magnitude lower than rates of synonymous substitutions observed for nu- clear genes and are even somewhat low compared with nonsynonomous rates (LI and GRAUR 1991). These are only general comparisons, not being based on the same species, but they do suggest that a sub- stantially accelerated rate of evolution in mtDNA may be rather unique to primates (the analyses in Table 5 are consistent with such an interpretation). A similar conclusion was reached by SHARP and LI ( 1 989), who found that mtDNA in Drosophila evolves at about the same rate as nuclear DNA, and VAWTER and BROWN (1 986) have also suggested that the rates of mitochon- drial and nuclear gene evolution are approximately equal in echinoderms.
The average indices of dispersion for both amino- acid and nucleotide substitutions average about 6 when the analysis is confined to mammals and are several-fold higher when the entire animal phylogeny is considered. Other published estimates of R (KIMURA 1983; BEVERLY and WILSON 1984; GILLESPIE 1989), mostly for nuclear genes in mammals, tend to average around 3-5. Some artifactual inflation is expected in all of these estimates due to inevitable errors in the branch points in the phylogenetic trees assumed (GIL- LESPIE 1989; EASTEAL 1990), as well as to errors in sequencing and alignment, but the emerging picture is that molecular clocks are often significantly noisier than expected under a pure Poisson process. A true inflation of the index of dispersion above 1 cannot be explained by site-specific variation in the substitution rate within genes (TAKAHATA 1991). It must be due to temporal variation in the substitution rate, such as that observed for the different phylogenetic branches (Table 5) . Although existing estimates of R are quan- titatively consistent with the predictions of a model for an episodic stochastic clock introduced by GILLES- PIE (1984, 1986b), little more can be said on the matter without perfect knowledge of the phylogeny.
For protein-coding genes, a relationship exists be- tween the expected heterozygosity per amino-acid site for a particular gene and its rate of divergence (Figure 3), suggesting that the maintenance of heterozygosity within species and the divergence of sequences be- tween species are governed by the same processes. Such a pattern is expected under neutrality (HUDSON, KREITMAN and AGUADE 1987), as is the equality of the slope of the regression and the estimated coales- cence time, which was also found. However, given the wide range of substitution rates estimated for differ- ent genes, it is clear that not all mutations affecting mitochondrial protein sequences are neutral. Some of the protein-coding genes and some of the sites within genes are obviously under much greater selective constraints than others. Nevertheless, it is conceivable
that most of the observed amino-acid substitutions are effectively neutral, with differences in the evolution- ary rate among loci being largely a consequence of differences in the fractions of mutations that are inconsequential.
Regardless of the mechanisms that are responsible for the divergence of mitochondrial sequences, the results of this study provide an empirical basis for using such sequences to date evolutionary events in the animal kingdom. By rearrangement of Equation 3, the estimated time to the common ancestor of species i and j is
where & = -ln(l - f i o - f,). Substitution of the parameter estimates from Tables 2-4 and the ob- served D, = -ln(Z, - fm) yields an estimate of diver- gence time in billions of years BP. Approximate 95% confidence limits for 2, can be obtained with the following expression
i,(CL) = D, - &)(+) , (14)
where R denotes the index of dispersion (Tables 2 and 4). As can be seen in Figure 2, some loci are much more reliable than others for purposes of dating. The more rapidly evolving loci are not necessarily the best ones for dating recent evolutionary events, and even for loci with low indices of dispersion, the confidence limits will usually be quite large. Consequently, esti- mates of divergence time should be averaged over sequence analyses involving several loci.
T o further appreciate the magnitude of the sam- pling error, consider the recent data of LIU and BECK- ENBACH (1992), for which the complete amino-acid sequences of C02 yield values ofl, ranging from 0.53- 0.77 for members of different insect orders. Assuming I , = 0.08 (as noted above), these values translate into Dy = 0.372 and 0.799. Using the C02 statistics for the entire phylogeny (Table 2), f i o = 0.032, $ = 0.576, R = 13.4, and the mean number of amino acid sites per sequence is s = 228. Substituting into Equation 13, the resultant estimates of t range from 202-543 MY, consistent with the idea that the major orders of insects diverged roughly 300 or more million years ago. However, using Equation 14, the confidence limits for these estimates are found to be quite large, (86-728 MY) and (294-1673 MY), respectively. More accurate estimates of the true divergence times clearly require sequences from several additional genes.
Finally, it is worth noting that Equation 2 is just one of several expressions that may be used to convert observed sequence divergence into expected numbers of substitutions per site [see NEI (1987) for a review]. The proposed method for molecular-clock calibration

Rate of Mitochondrial Evolution 1207
can be used with any distance statistic that can be made linear with time, provided the appropriate changes are made for the elements of the weight matrix V.
Many thanks to W. BIRKY, M. BULMER, E. MARTINS, K. SPITZE, B. SULLENDER and K. THOMAS for helpful comments. This study was supported by PHS grant R01 GM36827-01 and NSF grants BSR 86-00487 and 89-1 1038 to M.L.
L ITERATURE CITED
ANDERSON, S., A. T . BANKIER, B. G. BARRELL, M. H. L. DEBRUIJN, A. R. COULSON, et a l . , 198 1 Sequence and gene organization of the human mitochondrial genome. Nature 2 9 0 457-465.
ANDERSON, S., M. H. L. DEBRUIJN, A. R. COULSON, I. C. EPERON, F. SANGER, et al . , 1982 Complete sequence of bovine mito- chondrial DNA: conserved features of the mammalian mito- chondrial genome. J. Mol. Biol. 156 683-717.
ARNASON, U., A. GULLBERG and B. WIDEGREN, 1991 The com- plete nucleotide sequence of the mitochondrial DNA of the fin whale, Balaenoptera physalw. J. Mol. Evol. 33: 556-568.
ARNASON, U., and E. JOHNSON, 1992 The complete mitochon- drial DNA sequence of the harbor seal, Phoca vitulina. J. Mol. Evol. 3 4 493-505.
AVISE, J. C., R. M. BALL and J. ARNOLD, 1988 Current versus historical population sizes in vertebrate species with high gene flow: a comparison based on mitochondrial DNA lineages and inbreeding theory for neutral mutations. Mol. Biol. Evol. 5:
BEVERLEY, S. M., and A. C. WILSON, 1984 Molecular evolution in Drosophila and the higher Diptera. J. Mol. Evol. 21: 1-13.
BIBB, M. J., R. A. VANEITEN, C. T . WRIGHT, M. W. WALBERG and D. A. CLAYTON, 1981 Sequence and gene organization of mouse mitochondrial DNA. Cell 2 6 167-180.
BRODKORB, P., 1964 Catalog of fossil birds: part 2 (Anseriformes through Galliformes). Bull. Fla. State Mus. Biol. Sci. 8: 195- 335.
BROWN, W. M., 1985 The mitochondrial genome of animals, pp. 95-130 in Molecular Evolutionary Genetics, edited by R. J. MACINTYRE. Plenum, New York.
BROWN, W. M., M. GEORGE and A. C. WILSON, 1979 Rapid evolution of animal mitochondrial DNA. Proc. Natl. Acad. Sci.
331-344.
USA 76: 1967-1971. BROWN, W. M., E. M. PRAGER, A. WANG and A. C. WILSON,
1982 Mitochondrial DNA sequences of primates: tempo and mode of evolution. J. Mol. Evol. 18: 225-239.
BULMER, M., 1989 Estimating the variability of substitution rates. Genetics 123: 6 15-61 9.
BULMER, M., 1991 Use of the method of generalized least-squares in reconstructing phylogenies from sequence data. Mol. Biol.
BULMER, M., K. H. WOLFE and P. M. SHARPE, 1991 Synonymous nucleotide substitution rates in mammalian genes: implications for the molecular clock and the relationship of mammalian orders. Proc. Natl. Acad. Sci. USA 88: 5974-5978.
CANTATORE, P., M. ROBERTI, G. RAINALDI, M. N. GADALETA and C. SACCONE, 1989 The complete nucleotide sequence, gene organization, and genetic code of the mitochondrial genome ofParacentrotus lividus. J. Biol. Chem, 264: 10965-10975.
CLARY, D. O., and D. R. WOLSTENHOLME, 1985 The mitochon- drial DNA molecule of Drosophila yakuba: nucleotide sequence, gene organization, and genetic code. J. Mol. Evol. 22: 252- 271.
CROZIER, R. H., and Y. C. CROZIER, 1993 The mitochondrial genome of the honeybee A f i s mellqera: complete sequence and genome organization. Genetics 133: 97-1 17.
EvoI. 8: 868-883.
DESJARDINS, P., and R. MORAIS, 1990 Sequence and gene orga- nization of the chicken mitochondrial genome: a novel gene order in higher vertebrates. J. Mol. Biol. 212: 599-634.
EASTEAL, S., 1990 The pattern of mammalian evolution and the relative rate of molecular evolution. Genetics 124: 165-173.
FUTUYMA, D. J., 1986 Evolutionary Biology. Sinauer Associates, Inc., Sunderland, Mass.
GADELATA, G., G. PEPE, G. DECANDIA, C. QUAQLIARIELLO, E. SBISA, et a l . , 1989 The complete nucleotide sequence of the Rattus nomegicus mitochondrial genome: cryptic signals re- vealed by comparative analysis between vertebrates. J. Mol. Evol. 28: 497-516.
GENBANK, 1991 Bolt, Beranek and Newman, Inc. Cambridge, Mass.
GILLESPIE, J. H., 1984 The molecular clock may be an episodic clock. Proc. Natl. Acad. Sci. USA 81: 8009-8013.
GILLESPIE, J. H., 1986a Variability of evolutionary rates of DNA. Genetics 113: 1077-1091.
GILLESPIE, J. H., 1986b Natural selection and the molecular clock.
GILLESPIE, J. H., 1987 Molecular evolution and the neutral allele
GILLESPIE, J. H., 1989 Lineage effects and the index of dispersion
GYLLENSTEN, U., D. WHARTON, A. JOSEFSSON and A. C. WILSON, 1991 Paternal inheritance of mitochondrial DNA in mice. Nature 352: 255-257.
HASEGAWA, M., and H. KISHINO, 1989 Heterogenetiy of tempo and mode of mitochondrial DNA evolution among mammalian orders. Jpn. J. Genet. 6 4 243-258.
HOEH, W. R., K. H. BLAKLEY and W. M. BROWN, 1991 Heteroplasmy suggests limited biparental inheritance of Mytilus mitochondrial DNA. Science 251: 1488-1490.
HUDSON, R. R., M. KREITMAN and M. AGUADE, 1987 A test of neutral molecular evolution based on nucleotide data. Genetics
JACOBS, H. T., D. J. ELLIOT, B. M. VEERABHADRACHARYA and A. FARQUHARSON, 1988 Nucleotide sequence and gene organi- zation of sea urchin mitochondrial DNA. J. Mol. Biol. 202: 185-21 7.
JACOBS, L. L., and D. PILBEAM, 1980 Of mice and men: fossil- based divergence dates and molecular “clocks.” J. Hum. Evol. 9 351- 555.
KENDALL, M. G., and A. STUART, 1979 The Advanced Theory of Statistics. Vol. 2. Inference and Relationship. Griffin and Co., London.
KIMURA, M., 1983 The Neutral Theory of Molecular Evolution. Cambridge Univ. Press, New York.
LEWONTIN, R. C., 1989 Inferring the number of evolutionary events from DNA coding sequence differences. Mol. Biol. Evol. 6 15-32.
LI, W.-H., and D. GRAUR, 1991 Fundamentals of Molecular Evo- lution. Sinauer Associates, Inc., Sunderland, Mass.
LI, W.-H., M. TANIMURA and P. M. SHARP, 1987 An evaluation of the molecular clock hypothesis using mammalian DNA se- quences. J. Mol. Evol. 25: 330-342.
LIU, H., and BECKENBACH, A. T., 1992 Evolution of the mito- chondrial cytochrome oxidase I1 gene among 10 orders of insects. Mol. Phylogen. Evol. 1: 41-52.
LYNCH, M., and T. J. CREASE, 1990 The analysis of population survey data on DNA sequence variation. Mol. Biol. Evol. 7: 377-394.
MARTIN, A. P., G. J. P. NAYLOR and S. R. PALUMBI, 1992 Rates of mitochondrial DNA evolution in sharks are slow compared with mammals. Nature 357: 153-155.
MORITZ, C., T. E. DOWLING and W. M. BROWN, 1987 Evolution of animal mitochondrial DNA: relevance for population biol- ogy and systematics. Annu. Rev. Ecol. Syst. 18: 269-292.
Mol. Biol. Evol. 3: 138-155.
theory. Oxf. Surv. Evol. Biol. 4 10-37.
of molecular evolution. Mol. Biol. Evol. 6: 636-647.
116: 153-159.

1208 M. Lynch and P. E. Jarrell
MORRIS, S. C., 1993 The fossil record and the early evolution of the Metazoa. Nature 361: 219-226.
NEI, M., 1987 Molecular Evolutionary Genetics. Columbia Univer- sity Press, New York.
NEI, M., and L. JIN, 1989 Variances of the average numbers of nucleotide substitutions within and between populations. Mol. Biol. Evol. 6: 290-300.
NOVACEK, M. J., 1992 Mammalian phylogeny: shaking the tree. Nature 356: 121-125.
OKIMOTO, R., J. L. MACFARLANE, D. 0. CLARY and D. R. WOL- STENHOLME, 1992 The mitochondrial genomes of two nem- atodes, Caenorhabditis elegans and Ascaris mum. Genetics 130:
ROE, B. A., D. P. MA, R. K. WILSON and J. F. H. WONG, 1985 The complete nucleotide sequence of the Xenopus laevis mitochon- drial genome. J. Biol. Chem. 2 6 0 9759-9774.
SAVAGE, D. E., and D. E. RUSSELL, 1983 Mammalian Paleofaunas of the World. Addison-Wesley, Reading, Mass.
SHARP, P. M., and W.-H. LI, 1989 On the rate of DNA sequence evolution in Drosophila. J. Mol. Evol. 28: 398-402.
SHAW, R. G., 1987 Maximum likelihood approaches applied to quantitative genetics of natural populations. Evolution 41:
TAJIMA, F., and M. NEI, 1984 Estimation of evolutionary distance
TAKAHATA, N., 1991 Statistical models of the overdispersed mo-
471-498.
812-826.
between nucleotide sequences. Mol. Biol. Evol. 1: 269-285.
lecular clock. Theor. Popul. Biol. 3 9 329-344.
VAWTER, L., and W. M. BROWN, 1986 Nuclear and mitochondrial DNA comparisons reveal extreme rate variation in the molec- ular clock. Science 234: 194-1 96.
WAYNE, R. K., B. VAN VALKENBURGH and S. J. O’BRIEN, 1991 Molecular distance and divergence time in carnivores and primates. Mol. Biol. Evol. 8: 297-3 13.
WAYNE, R. K., A. MEYER, N. LEHMAN, B. VAN VALKENBURGH, P. W. KAT, et al., 1990 Large sequence divergence among mi- tochondrial DNA genotypes within populations of eastern Af- rican black-backed jackals. Proc. Natl. Acad. Sci. USA 87:
WHEELER, W. and D. GLADSTEIN, 1993 Malign. Version 1.73. Am. Mus. Nat. Hist., New York.
WHITTAM, T . S., A. G. CLARK, M. STONEKING, R. L. CANN and A. C. WILSON, 1986 Allelic variation in human mitochondrial genes based on patterns of restriction site polymorphism. Proc. Natl. Acad. Sci. USA 83: 961 1-9615.
WILSON, A. C., R. L. CANN, S. M. CARR, M. GEORGE, U. B. GYLLENSTEN, et al., 1985 Mitochondrial DNA and two per- spectives on evolutionary genetics. Biol. J. Linn. SOC. 26: 375- 400.
WU, C., and W.-H. LI, 1985 Evidence for higher rates of nucleo- tide substitution in rodents than in man. Proc. Natl. Acad. Sci. USA 82: 1741-1745.
YOUNG, J. Z. , 1981 The Lye of Vertebrates. Ed. 3. Clarendon Press, Oxford, U.K.
1772-1776.
Communicating editor: A. G. CLARK