a methodology for a hydrodynamic analysis of a moonpool … · geometry creation in ansys...
TRANSCRIPT

A Methodology for a Hydrodynamic Analysis
of a Moonpool structure with Mooring Lines
Using the ANSYS AQWA Product
Maira Vargas, M.Sc - ESSS
Lucas Froes Cavalcanti - COPPE

PRESENTATION TOPICS
• Introduction
• Problem Description;
• Methodology;
• Conclusion and next steps.

Introduction
• This paper describes two examples of hydrodynamic
analysis methodology of a particular floating system with
(and also without) considering the effects of its mooring
lines and of a typical ship hull using ANSYS AQWA
programs
• AQWA allows to develop different types of analysis,
working independently, in the time and frequency domain.

CASE 1 – HYDRODYNAMIC EVALUATION OF A FLOATING
STRUCTURE WITH THE EFFEC OF MOORING LINES

Problem Description
• Geometry to be reproduced in DM
An hexagonal floating monocolumn system
DimensionsExternal dimension: 11,25 m Internal dimension: 5,5 m Depth: 6,66 mDisplacement (moorings): 1708,176 tonCG: (0, 0, -3.33) m (referece in Water Line)
The unit system recomended for thegeometry creation in ANSYS DesignModeler is meter.

Worbench Platform with AQWA 13.0 (New)
The time response analysis takes the
geometry, model and /or results obtained in
frequency domain (Hydrodynamic
Diffraction).
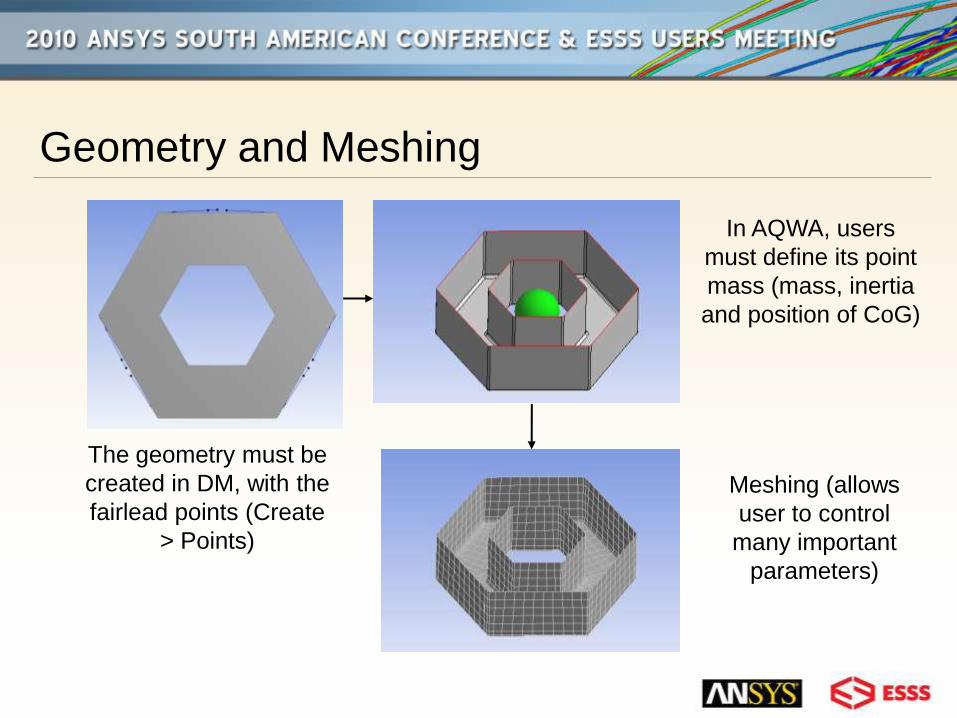
Geometry and Meshing
The geometry must be
created in DM, with the
fairlead points (Create
> Points)
In AQWA, users
must define its point
mass (mass, inertia
and position of CoG)
Meshing (allows
user to control
many important
parameters)

Geometry and Meshing (New)
• It’s important that the points created be a component of the platform.
It’s done by creating a line connecting the point and the structure. In
AQWA, user must supress the line, so it doesn’t interfer in the results.
Line connecting point and platform

Fairlead points (New)
• To define the fairlead points in Design Modeler, it’s possible to create
a .txt file, containing the points coordinates and import it with Create >
Points > From Coordinates File

ANSYS AQWA Outline
Definition of each cable of the mooring system
(different types, e.g. catenary, linear and
elastic)
The anchor connection points are defined in
AQWA
Diffraction/Radiation analysis parameters
Catenary Sections (cable segment properties)
Time Response analysis parameters

Wave Frequencies
• It’s important to define the range of waves frequencies or periods we
want to analyze. In our case, it was set the initial frequency (0,02 Hz)
and also the end frequency (0,2 Hz), for a number of intermediate
values equal to 8. This last value automatically calculates the interval
frequency.

Diffraction / Radiation Results
In AQWAWB it’s possible to visualize the wave contours in the frequency domain. Note that it changes by considering different frequencies / wave heights.

Diffraction / Radiation Results (New)
• AQWA 13.0 comes with even more graphic results, allowing users to
plot all these parameters below:

Diffraction / Radiation Results
• The graphic comparison shows that the results are the same with the
upgrades.
AQWAWB 12.0
AQWA 13.0
AQWA Classical

Diffraction / Radiation Results (New)
Radiation Damping x Frequency Force x Frequency x Direction
3D – Plots
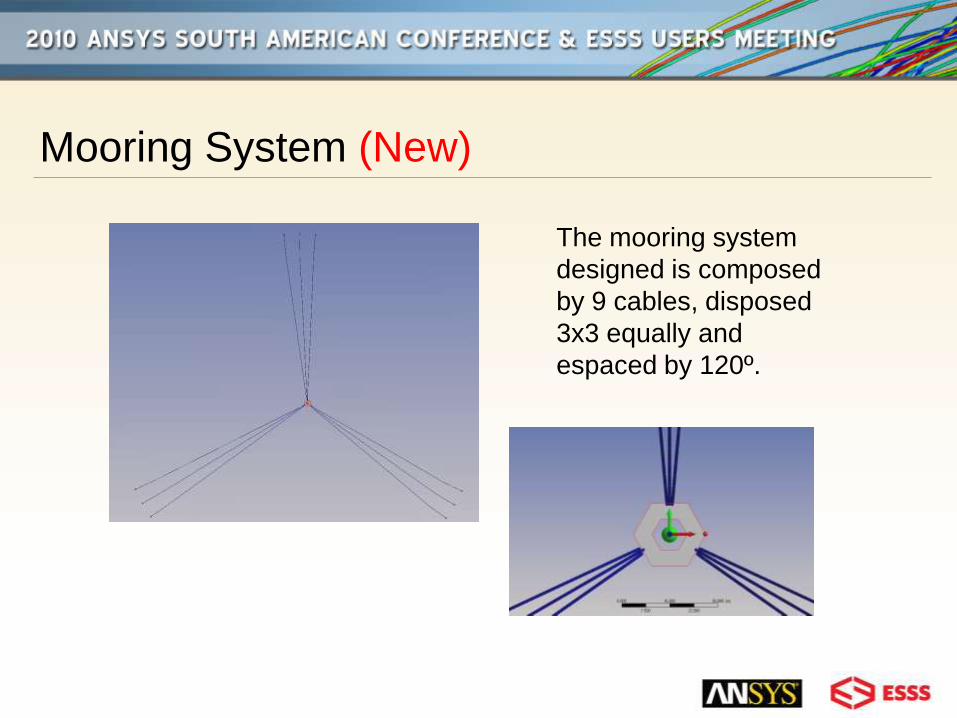
Mooring System (New)
The mooring system
designed is composed
by 9 cables, disposed
3x3 equally and
espaced by 120º.

Mooring System
• Fairlead and anchor points table:
Line Fairlead (*) AnchorX(m) Y(m) Z(m) X(m) Y(m) Z(m)
1 0.87 9.96 -5.66 54.63 624.46 -22002 0 10 -5.66 0 626.85 -22003 -0.87 9.96 -5.66 -54.63 624.46 -22004 -9.06 -4.23 -5.66 -568.12 -264.92 -22005 -8.66 -5 -5.66 -542.87 -313.43 -22006 -8.19 -5.74 -5.66 -513.49 -359.55 -22007 8.19 -5.74 -5.66 513.49 -359.55 -22008 8.66 -5 -5.66 542.87 -313.43 -22009 9.06 -4.23 -5.66 568.12 -264.92 -2200
Anchor pointsmust be definedas Connection
Points
Farilead points mustbe defined in Design
Modeler

Cable sections (New)
For each section, user must define the following main properties:

Cable summary (New)
Each cable (1-9) is composed by the sections (1-6 already
described) shown below:

Time Domain Analysis (New)
• In time domain, we can compute the cable influence in the system
response (including or not its dynamics), considering many different
sea and environment conditions.

Time Domain Analysis Results (New)
• In Time Response analysis, it’s possible to visualize the results of all
these parameters below:

Parametric Analysis (New)
• It’s possible to create a parametric analysis, to study the influence of
the systematic variations in geometry and hydrodynamic (frequency
and tme domain) parameters.

Parametric Analysis (New)
• Here are some examples of parametrization with time domain and
cable system. Note that every item with the blank box can be
parametrized.

Parametric Analysis
• In WB, it’s possible to define the values of some parameters, in a way
to define sucessive analysis. In this particular case, the wave forward
speed will be changed, to obtain the maximum RAO along the x
rotational axis.

PRESENTATION TOPICS
• Company Overview (2-3 minutes);
• Problem Description;
• Methodology;
• Goals;
• Conclusion and next steps.