a metrics-based approach to enhancing schedule performance ... · a metrics-based approach to...
TRANSCRIPT

A Metrics-Based Approach to Enhancing Schedule Performance Insight
NASA Cost Symposium 2016
Steve Shinn, NASA Goddard Space Flight Center
Walt Majerowicz, NASA Goddard Space Flight Center
1
PURPOSE
§
§
§
To provide an overview of the GSFC Business Change Initiative (BCI) and the products and cultural changes produced.
This session specifically examines what has been learned so far from the implementation of a schedule performance metrics program within the Flight Projects Directorate (FPD) at Goddard Space Flight Center (GSFC)
This presentation also examines several practical applications of the metrics for enhancing program planning & control (PP&C)
2

§ § § § § § § §
TOPICS
GSFC Business Change Initiative (BCI)
Schedule Metrics Background
Implementing the Metrics Program
Metrics Analysis and Reporting
What We’ve Learned About the Metrics
Practical Applications of Metrics
Summary
References
3

GSFC FLIGHT PROJECTS BUSINESS CHANGE INITIATIVE (BCI) APPROACH
4

THE BCI: A NOVEL APPROACH TO IMPROVED COST AND SCHEDULE MANAGEMENT WHY CHANGE - BUSINESS CHANGE INITIATIVE OVERVIEW
ü ü ü
ü
ü ü
ü
ü
ü
ü
(former) Current State
Rising costs, schedule delays,and inconsistent processesGreater competition forresourcesOncoming retirement wave andcorresponding knowledge gapIncreasing external reviewsand data requests
Disparate Community
Integrated Community
Business Change Initiative
Ø
Ø Ø
Ø
Ø
Ø
Ø
(current) Future State Increased visibility and accountabilityImproved management tools Established GSFC policies and procedures Enhanced training and knowledge sharing Standardized processes Early identification of risk
RESULTS Expand guidance on how to apply best practicesCentralize information to improve accessibility Apply NASA, federal, and industry scheduling best practices Promote consistent schedule management procedures on all programs/projects
Improve accuracy and precision in schedulemanagementMitigate schedule risks through informedteams and stakeholdersIncrease use and accessibility to guidance andresources
5

THE BCI: A NOVEL APPROACH TO IMPROVED COST AND SCHEDULE MANAGEMENT
THE JOURNEY – THE BUSINESS CHANGE INITIATIVE The Business Change Initiative is a comprehensive evaluation of PP&C, as well as programmatic communication and information sharing mechanisms to improve cost, schedule, and overall performance across the Flight Projects Portfolio
6

THE BCI: A NOVEL APPROACH TO IMPROVED COST AND SCHEDULE MANAGEMENT
7
CHANGE APPROACH 1. Selected experts in core competencies to form action teams2. Identified strengths/weaknesses and opportunities for improvement
1. Interviewed projects; Assessed and prioritized best practices2. Performed stakeholder analyses
1. Revised project work streams to foster consistent best practice application2. Created implementation plans to sequence activities and to determine
scalability options and measures for adoption
1. Built tools/resources and guidance to support adoption of best practices2. Established curriculum paths
1. Fostered environment that adopts best practices2. Released progress communications to FPD projects and GSFC/NASA partners3. Implemented new processes, guidance/policy, tools, and training
1. Enable a learning environment for collaboration and knowledge sharing2. Continuously improve practices to maintain best in class and exceed expectations3. Cultivate awareness of programmatics to prepare for environmental challenges
NOTE: * Ongoing, continuous activity
7

THE BCI: A NOVEL APPROACH TO IMPROVED COST AND SCHEDULE MANAGEMENT
INCREMENTAL AND SCALABLE APPROACH FOR DEPLOYMENT
Program/Project Lifecycle
Survey and assess complete FPD program/project portfolio to understand similarities and differences
Applicability
Identify valid needs for each grouping of “like” programs/ projects to balance conditions for feasibility and adoption
Compliance
Provide tools, templates, guidance, and resources to facilitate fulfillment of requirements for all applicable groups
Ø Our work is varied. There isn’t a “single answer solution” for all of ourneeds.Prior to deployment, each change is considered for its effect onGSFC’s project portfolioVarious projects will pilot tools and resources to measure ability toadopt new practices
8
Additional tools and resources are developed to assist in acceptance
Ø
Ø
Ø

THE BCI: A NOVEL APPROACH TO IMPROVED COST AND SCHEDULE MANAGEMENT
- -
-
- - -
-
PROCESS FOR LASTING CHANGE – FLIGHT PROJECTS’ INTEGRATED COMMUNITY
DRIVERS - External policy
changesNASA PP&CrequirementsNew industry/federal practices/tools
-
- TEAMS Program/project teamsPlanning and scheduling community Earned value management practitioners Risk managers Business community Configuration management community System engineers
FORUMS - Planning and scheduling
lunch and learns Earned value roundtables K-MAP workshopsConfiguration management forums Combined resources forum NASA working groups
- - -
-
-
COORDINATION - Program managers
weekly meetings Program business managers monthly meetings Monthly Flight Projects’ tag-ups All-hands Senior strategy meetingsSupervisors meetings
-
-
- - -
PRODUCTS - New and refined
best practicesand toolsContinuing educationand guidanceRepeatable processes
-
-
9
THE BCI: A NOVEL APPROACH TO IMPROVED COST AND SCHEDULE MANAGEMENT
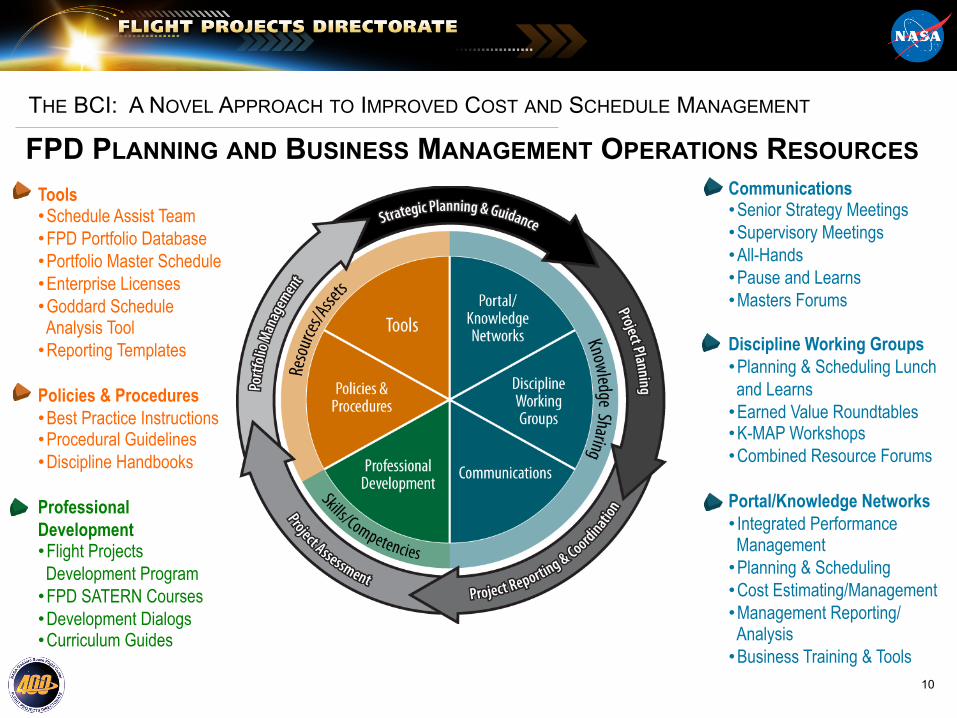
FPD PLANNING AND BUSINESS MANAGEMENT OPERATIONS RESOURCES Tools • Schedule Assist Team FPD Portfolio Database Portfolio Master Schedule Enterprise Licenses Goddard Schedule Analysis Tool Reporting Templates
••••
•
Policies & Procedures • Best Practice Instructions
Procedural Guidelines Discipline Handbooks
• •
Professional Development • Flight Projects Development Program FPD SATERN Courses Development Dialogs Curriculum Guides
• • •
• • • • •
•
• • •
•
•••
•
Communications Senior Strategy Meetings Supervisory Meetings All-Hands Pause and Learns Masters Forums
Discipline Working Groups Planning & Scheduling Lunch and Learns Earned Value Roundtables K-MAP Workshops Combined Resource Forums
Portal/Knowledge Networks Integrated Performance Management Planning & Scheduling Cost Estimating/Management Management Reporting/Analysis Business Training & Tools
10

THE BCI: A NOVEL APPROACH TO IMPROVED COST AND SCHEDULE MANAGEMENT COMPLETED 100+ CHANGES
Over 100 changes were deployed spanning schedule, cost, earned value, risk, and configuration management, as well as project coordination, reporting, performance analysis, and employee education
11

SCHEDULE METRICS BACKGROUND
12

§
§
— — —
§
SCHEDULE METRICS BACKGROUND
Focus on schedule performance of GSFC projects in recent years included examination of new metrics, reasons for schedule delays, effect of merge bias, implications of marching army, schedule runway, etc.* GSFC’s Business Change Initiative (BCI) benchmarking of PP&C best practices identified three metrics for augmenting schedule performance reporting and insight:
Baseline Execution Index (BCI) Hit or Miss Index (HMI) Current Execution Index (CEI)
BCI, HMI and CEI were incorporated as part of monthly status reporting to executive leadership
* See list of references 13
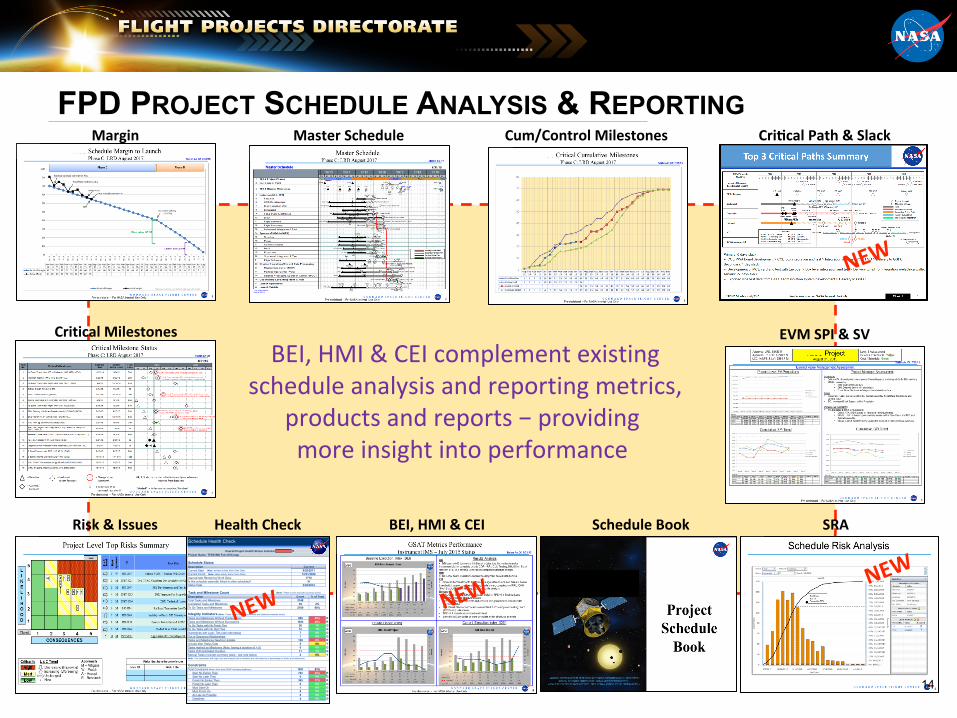
FPD PROJECT SCHEDULE ANALYSIS & REPORTING
IJ"
BEI, HMI & CEI complement existing schedule analysis and reporting metrics,
products and reports − providing more insight into performance
Margin Cum/Control Milestones
EVM SPI & SVCritical Milestones
Master Schedule
Risk & Issues
Critical Path & Slack
SRASchedule BookOverall Project Health Status Indicator R
(Note: These counts exclude summary tasks)
Count % of Total214839 2%
2109 98%
959 45% R1023 49% R26 1% G12 1% G7 0% G7 0% G
120 6% R5 0% Y0 0% G
11 1% G2 0% Y
Note: The summaries with logic ties and manual tasks numbers are calculated as a percentage of tasks and milestones.
1081 51%703 33% R0 0% G
365 17% R0 0% G1 0% G8 0% G0 0% G4 0% G
As Late As Possible
Tasks With Estimated DurationManual Tasks (includes summary tasks - see note below)
Current Finish (Note: latest activity Early Finish Date)
Total Tasks and Milestones
Tasks and Milestones Without Predecessors
Is this schedule externally linked to other schedules?
Completed Tasks and MilestonesTo Go Tasks and Milestones
Finish No Earlier Than
Approximate Remaining Work Days 1710N
Description
Tasks marked as Milestones (Note: having a duration of > 0)
Status Date
Out of Sequence Relationships
Schedule Health Check
DescriptionCurrent Start (Note: earliest activity Early Start Date)
Constraints
9/29/2011
To Go Tasks with No Start Ties
Tasks and Milestones Without Successors
Must Start On
Schedule Status
Tasks and Milestones Needing Updates
To Go Tasks with No Finish Ties
2/28/2014
Task and Milestone Count
Actuals after Status Date
Start No Later Than
Current
12/31/2020
Summaries with Logic Ties (see note below)
Integrity Indicators (Note: These counts exclude summary and started/completed tasks)
Total Constraints (Note: other than ASAP including deadlines)
Deadlines
Finish No Later Than
Project Name: TESS IMS Feb 2014.mpp
Must Finish On
Start No Earlier Than
Health Check BEI, HMI & CEI
14

SCHEDULE METRICS REFRESHER
Metric What It Is Formula Primary Benefit
BEI A cumulative measure of IMS task performance against the baseline
Ratio of total number of IMS tasks (with a baseline) actually finished to the total number of tasks baselined to be finished
Objectively indicates how efficient the project in executing to its schedule baseline
HMI A monthly measure of IMS task performance against the baseline
Ratio of the IMS tasks actually finished during the month to the specific tasks baselined to be finished during the month
Early indicator of whether the schedule baseline is achievable
CEI A monthly measure of IMS task performance against the monthly forecast
Ratio of the IMS tasks actually finished during the month to the specific tasks forecast to be finished during the month (based on the previous month’s forecast)
Objective indicator of the quality of month-‐to-‐ month schedule forecasts
15
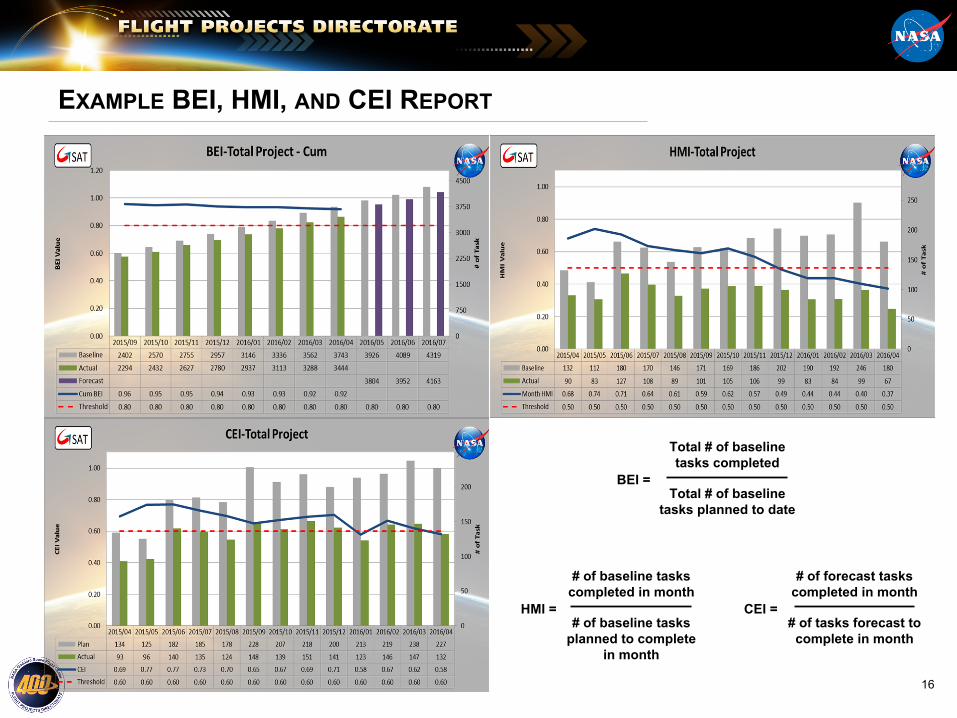
EXAMPLE BEI, HMI, AND CEI REPORT
BEI =
Total # of baseline tasks completed
Total # of baseline tasks planned to date
HMI =
# of baseline tasks completed in month
# of baseline tasks planned to complete
in month
CEI =
# of forecast tasks completed in month
# of tasks forecast to complete in month
16

IMPLEMENTING THE METRICS PROGRAM
17

METRICS IMPLEMENTATION SUMMARY
§ Prepared Best Practice Instructions (BPIs) for BEI, HMI and CEI metrics
Developed Goddard Schedule Analysis Tool (GSAT) for calculating BEI, HMI and CEI directly from MS Project IMS files
Provided metrics and GSAT training to project schedulers
Established target goals/thresholds for metrics
Encouraged projects to use metrics as part of their internal management processes
Required projects to report metrics performance monthly to FPD leadership
Socialized benefits of metrics to project teams, FPD management, and GSFC senior leadership
Incorporated metrics-based schedule analysis and forecasting into FPD independent assessments of project performance
Established FPD Schedule Metrics Database for ongoing monitoring of performance trends by total project, in-house work, and contracts
§
§ § §
§ §
§
§
18

SCHEDULE METRICS GOALS/THRESHOLDS
Baseline Execution Index (BEI) Threshold
≥ .95
≥ .80
Indicator Explanation
DCMA/NDIA Goal
FPD Goal
.70 -‐ .79 Watch
≤ .69 Caution
Hit or Miss Index (HMI) Threshold
≥ .75
Indicator Explanation
DAU Goal
≥ .50 FPD Goal
.40 -‐ .49 Watch
≤ .39 Caution
Current Execution Index (CEI) Threshold
≥ .75
Indicator Explanation
NDIA Goal
≥ .60 FPD Goal
.50 -‐ .59 Watch
≤ .49 Caution
Notes FPD Goal: Code 400 performance expectation
Watch: Monitor for change in trend Caution: Potential for problems
DCMA: Defense Contract Management Association NDIA: National Defense Industrial Association
DAU: Defense Acquisition University
19

METRICS ANALYSIS & REPORTING
20
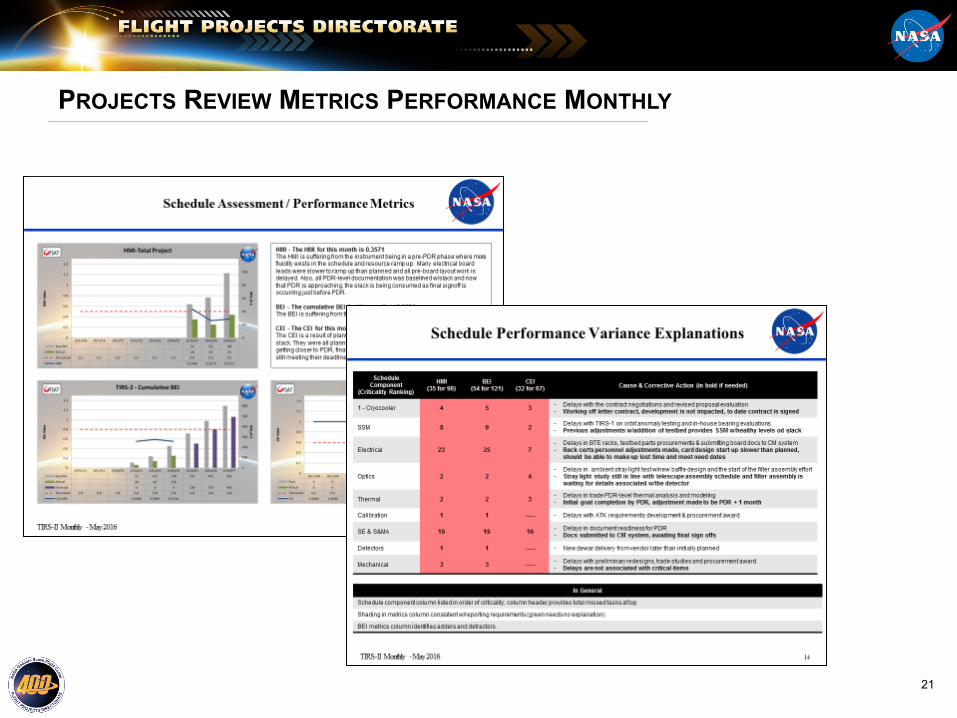
PROJECTS REVIEW METRICS PERFORMANCE MONTHLY
21
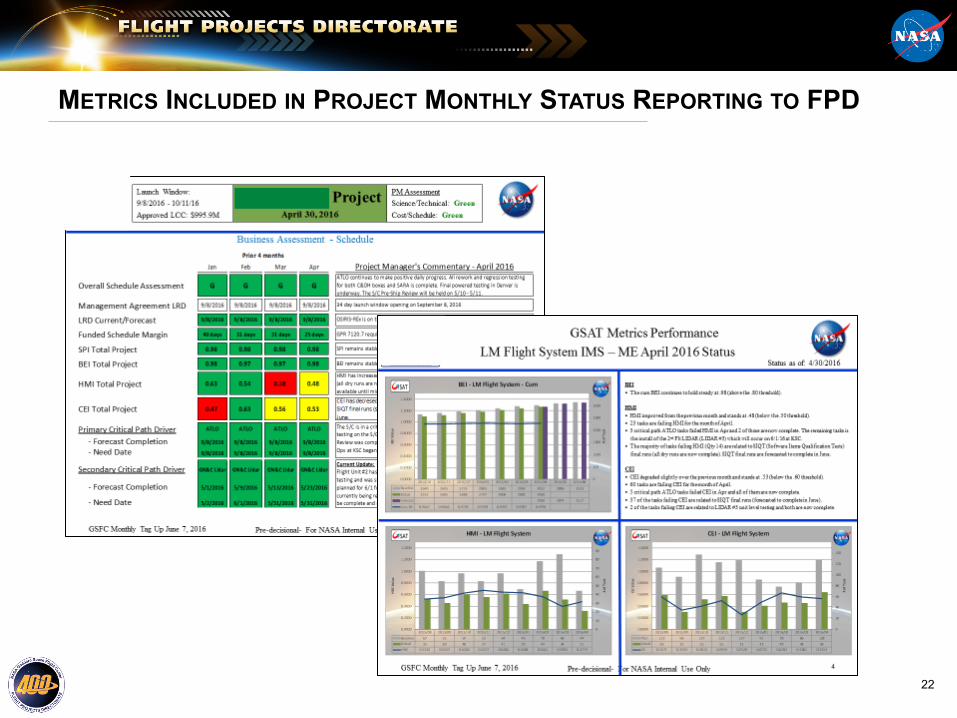
METRICS INCLUDED IN PROJECT MONTHLY STATUS REPORTING TO FPD
22

FPD Monthly Project
Assessment Report
June 2016
Ø ØØ Ø
METRICS ARE A MAJOR PART OF FPD INDEPENDENT ASSESSMENTS
FPD metricsexamined monthly aspart of overallschedule assessmentprocess
BEI and CEI-based schedule forecasts/estimates developed monthly
Monthly
FPD “deep dive”metrics analysison selectedprojects
CEI provides an objective, performance-‐based source for SRAduration uncertainty
As Needed 23

WHAT WE’VE LEARNED ABOUT THE METRICS (SO FAR)
24
WHAT WE’VE LEARNED SO FAR ABOUT THE SCHEDULE METRICS
1. GSFC can sustain metrics performance below NDIA, DCMA, and DAU guidelines and still finish projects on time: FPD projects average .45 and .55 on HMI and CEI – performance that can be offset by schedule margin, de-scopes, workarounds, and other management actions.
2. HMI trend ≤ .40 is an early warning sign of an unsustainable baseline: Once an unfavorable HMI trend of .40 or less is established, schedule margin erosion and baseline completion delays are likely.
3. In-house forecasts and execution are 11 percent better than contractors’ based on CEI: GSFC in-house CEI averages .60 and contractors’ CEI averages .54 vs. the FPD threshold of .60.
4. CEI trend ≤ .55 is an early warning sign of a “Bow Wave:” A sustained .55 or less CEI trend indicates a bow wave of unfinished work that will erode the remaining margin and threaten project completion.
5. Inconsistent baseline control practices distort BEI and HMI: Misleading BEI and HMI results occur due to inappropriate baseline control.
6. Element level “drill down” analysis enhances insight into performance for large projects: Element level reporting (e.g. instrument, contract, subsystem) is more meaningful than total project level reporting on large scale, complex projects (e.g., JWST, OSIRIS-REx). 25

ALL FPD PROJECTS/ELEMENTS HMI SCORES: FEB 2012 – MAY 2016
0
20
40
60
80
100
Coun
t
120
HMI Scores
.50 FPD HMI Goal / Threshold Mean = .45
26

IN-HOUSE FPD PROJECTS/ELEMENTS HMI SCORES: FEB 2012 – MAY 2016
0
5
10
15
20
25
30
35
Coun
t
HMI Scores
.50 FPD HMI Goal / Threshold Mean = .48
27

OUT-OF-HOUSE FPD PROJECTS/ELEMENTS HMI SCORES: FEB 2012 – MAY 2016
0
10
20
30
40
50
60Co
unt
HMI Scores
.50 FPD HMI Goal / Threshold Mean = .44
28

ALL FPD PROJECTS/ELEMENTS CEI SCORES: FEB 2012 – MAY 2016
020406080
100120140160180
Coun
t
CEI Scores
.60 FPD CEI Goal / Threshold Mean = .55
29

IN-HOUSE FPD PROJECTS/ELEMENTS CEI SCORES: FEB 2012 – MAY 2016
0
10
20
30
40
50
60Co
unt
CEI Scores
.60 FPD CEI Goal / Threshold Mean = .60
30

OUT-OF-HOUSE FPD PROJECTS/ELEMENTS CEI SCORES: FEB 2012 – MAY 2016
0
10
20
30
40
50
60Co
unt
CEI Scores
.60 FPD CEI Goal / Threshold Mean = .54
31

CEI TREND < .55 IS AN EARLY WARNING OF A “BOW WAVE” OF UNFINISHED WORK
Project CEIAverage
Comments
Project 1 .39 Schedule remains “under review”
Project 2 .40 CDR delayed; peer reviews delayed
Project 3 .42 One delivery slip so farProject 4 .45 400 delivers metrics to 460 each month
Project 5 .47 CDR delayed; peer reviews delayedProject 6 .55 CEI indicated problems long before schedule slip
Project 7 .65 Performed well even with facility conflicts
Project 8 .70 Based on "backtesting" 12 months prior to launch
Project 9 .73 Based on "backtesting" from SIR through launch
Project 10 .77 Improved recent performance
Project 11 .90 Average CEI for 12 months prior to launch
At risk or
delayed
On track or completed on time
32

ELEMENT LEVEL “DRILL DOWN” ANALYSIS EXAMPLE FOR A LARGE PROJECT
Total Project Levelmetrics reported at FPD
Tag-Up
Element Level metrics provide additional insight
33

PRACTICAL APPLICATIONS OF METRICS
34

PRACTICAL APPLICATIONS OF THE METRICS GOING FORWARD
1. Verify cost/schedule integration with BEI: Compare BEI to SPIcum – these should track closely.
2. Predict future performance with BEI and CEI: Using BEI and/or CEI as performance factors results in objective project completion predictions and cross checks on margin adequacy.
3. “Drill down” into lower levels of the WBS to identify problem areas: GSAT can isolate performance on critical path elements, high risk elements, subsystems, etc.
4. Focus on the CEI of Critical Path drivers: Examine the critical path driver’s CEI since inefficiency along the critical path could lead to margin erosion and future delays.
5. Streamline the SRA process with HMI and CEI: Metrics provide an objective, unbiased way to derive duration estimating uncertainty for use with probabilistic schedule risk analysis.
6. Use comparative analysis: Compare BEI, HMI and CEI to other metrics such as slack, margin, critical milestones, SPI, schedule risks, and cumulative milestones to mitigate overreliance on any single metric.
35

VERIFY COST/SCHEDULE INTEGRATION WITH BEI
• Compare BEI to SPIcum – these should trend in a similar pattern when cost/schedule integration is sound
- -
-
Inconsistent SPIcum and BEI
SPI indicates good performance (green) while BEI indicates deterioration (black)Retroactive BCRs added already completed work to baseline (red line), but performance erosion continued as measured by BEI (red) Project eventually slipped launch
Consistent SPIcum and BEI - Project B’s SPI and BEI track closely
Slight difference due to removal of LOE tasks from IMS for BEI calculation
-
36
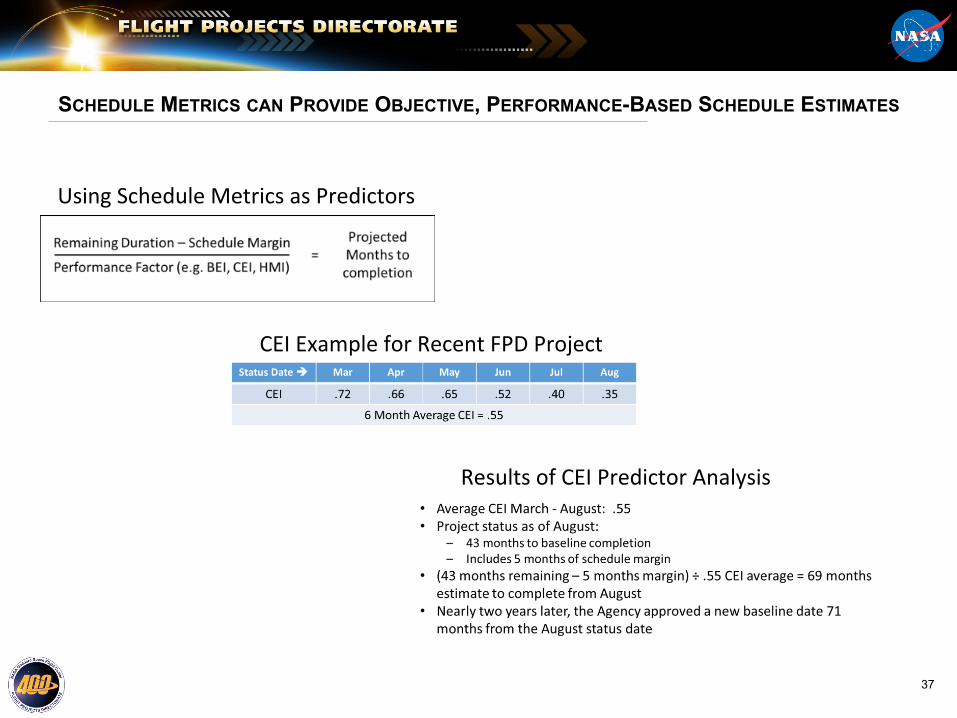
SCHEDULE METRICS CAN PROVIDE OBJECTIVE, PERFORMANCE-BASED SCHEDULE ESTIMATES
Using Schedule Metrics as Predictors
CEI Example for Recent FPD Project
Results of CEI Predictor Analysis
37
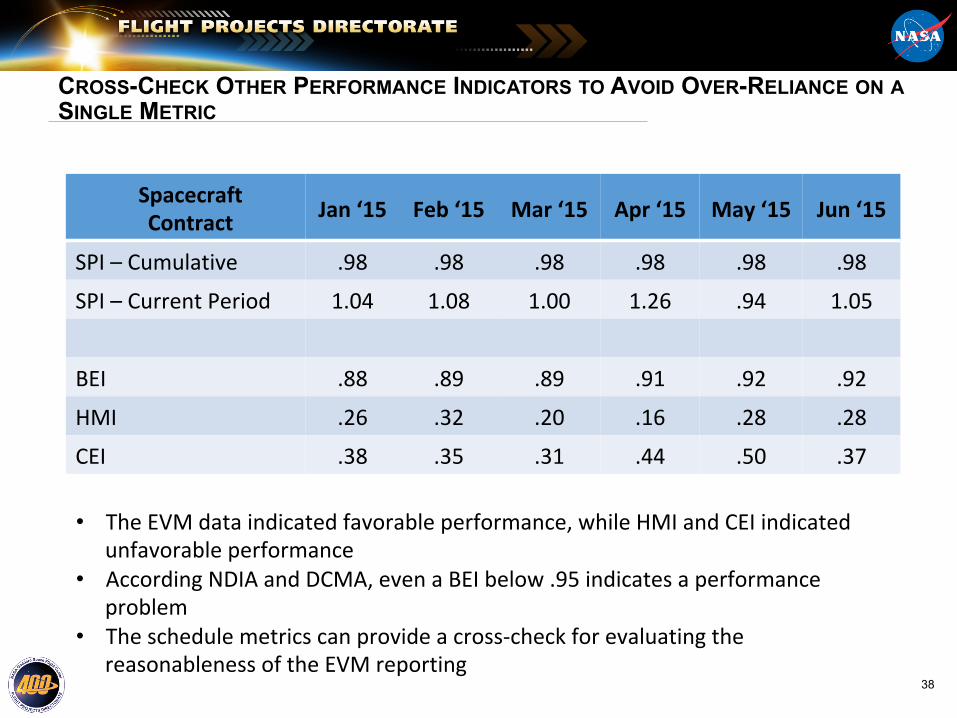
CROSS-CHECK OTHER PERFORMANCE INDICATORS TO AVOID OVER-RELIANCE ON A SINGLE METRIC
Spacecraft Contract Jan ‘15 Feb ‘15 Mar ‘15 Apr ‘15 May ‘15 Jun ‘15
SPI – Cumulative .98 .98 .98 .98 .98 .98
SPI – Current Period 1.04 1.08 1.00 1.26 .94 1.05
BEI .88 .89 .89 .91 .92 .92
HMI .26 .32 .20 .16 .28 .28
CEI .38 .35 .31 .44 .50 .37
• The EVM data indicated favorable performance, while HMI and CEI indicatedunfavorable performanceAccording NDIA and DCMA, even a BEI below .95 indicates a performance problemThe schedule metrics can provide a cross-‐check for evaluating the reasonableness of the EVM reporting
•
•
38
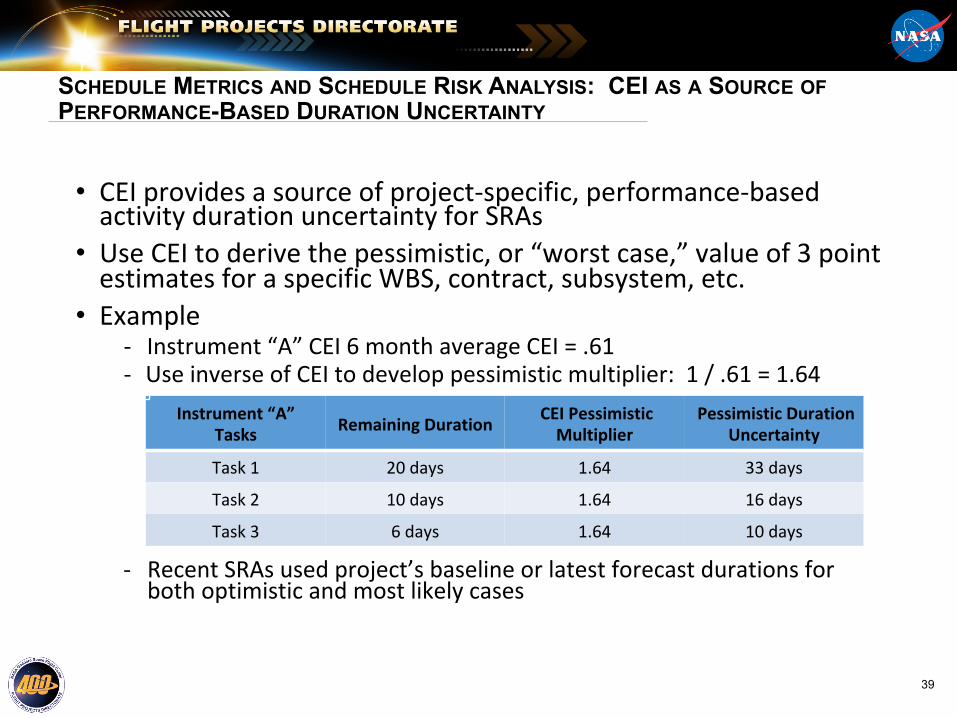
SCHEDULE METRICS AND SCHEDULE RISK ANALYSIS: CEI AS A SOURCE OF PERFORMANCE-BASED DURATION UNCERTAINTY
• CEI provides a source of project-‐specific, performance-‐basedactivity duration uncertainty for SRAsUse CEI to derive the pessimistic, or “worst case,” value of 3 point estimates for a specific WBS, contract, subsystem, etc.Example
•
•- Instrument “A” CEI 6 month average CEI = .61 Use inverse of CEI to develop pessimistic multiplier: 1 / .61 = 1.64 -‐
-‐
Instrument “A” Tasks Remaining Duration CEI Pessimistic
Multiplier Pessimistic Duration
Uncertainty
Task 1 20 days 1.64 33 days
Task 2 10 days 1.64 16 days
Task 3 6 days 1.64 10 days
Recent SRAs used project’s baseline or latest forecast durations for both optimistic and most likely cases
39

EXAMPLE SRA SCHEDULE CONFIDENCE RESULTS
• This SRA used CEI past performance for pessimistic 3 point duration uncertainty
Results provided a cross-‐check on the project’s replan schedule for an October 2016 launch
•
40

SUMMARY
§ BEI, HMI and CEI trending can augment existing project performance metrics with objective data derived directly from project and/or contractor MS Project IMS files
Training project planners/schedulers and project stakeholders on significance of metrics’ variances and trends will promote buy-in
Further research into leveraging the metrics, particularly CEI, for schedule estimating/forecasts and SRA in Phase B and beyond can potentially enhance independent assessment processes
§
§
41

REFERENCES
§ W. Majerowicz, R.E. Bitten, D.L. Emmons, S. Shinn, “Contribution of Schedule Delays to Cost Growth: How to Make Peace with a Marching Army,” 2016 IEEE Aerospace Conference, Big Sky, Montana, March 2016. R. Kellogg, R. Bitten, E. Mahr, S. Holloman, V. Roeum, “An Independent Cost and Schedule Estimate Process for NASA Science Projects,” 2016 IEEE Aerospace Conference, Big Sky, Montana, March 2016. R. E. Bitten, D. L. Emmons, C. W. Freaner, “Using Historical NASA Cost and Schedule Growth to Set Future Program and Project Reserve Guidelines,” SCAF/SSCAG/EACE International Conference on Cost Forecasting, Royal Institution of Naval Architects (RINA), London, UK, September 19-21, 2006. M. Hayhurst, R. Bitten, S. Eftekharzadeh, R. Kellogg, V. Roeum, S. Shinn, “Calculating Reserves on Schedule-to- Go (STG) Based on Historical Data,” 2015 IEEE Aerospace Conference, Big Sky, Montana, March 2015. D.L. Emmons, R.E. Bitten, “Quantitative Approach to Independent Schedule Estimates of NASA Science Missions,” 2009 IEEE Aerospace Conference, Big Sky, Montana, March 2009. NPR 7120.5E, “NASA Space Flight Program and Project Management Requirements,” August 14, 2012. J. Little, W. Majerowicz, S. Shinn, “Implementing Quantitative Schedule Performance Metrics at NASA Goddard Space Flight Center,” 2015 IEEE Aerospace Conference, Big Sky, Montana, March 2015. “A Guide to Managing Programs Using Predictive Measures” National Defense Industrial Association Integrated Program Management Division, 24 March 2015.
§
§
§
§
§
§
§ 42