a mine trip to tibet and inner mongolia: gemological study ... · the inner mongolia plagioclase...
TRANSCRIPT

A. Abduriyim. A Mine Trip to Tibet and Inner Mongolia: Gemological Study of Andesine Feldspar. News from Research. Sept. 10, 2009. http://www.gia.edu/research-resources/news-from-research
A Mine Trip to Tibet and Inner Mongolia: Gemological Study of Andesine Feldspar
Ahmadjan Abduriyim Gemmological Association of All Japan (GAAJ)-ZENHOKYO Laboratory
Abstract Natural-colored Cu-bearing plagioclase feldspar (andesine) has been mined from an alluvial secondary deposit near the Tibetan city of Xigazê since 2006. The gem-quality feldspar is derived from Quaternary-Tertiary volcano-sediments related to Jurassic-Cretaceous volcanic rocks. Weathering and alluvial transport resulted in rounded crystal morphologies. Most of the crystals have an orangy red bodycolor, and a few have red and green bicolored zones. EPMA chemical analyses calculated an empirical chemical formula of (K0.03Na0.46–0.49)2Ca0.46–0.49Al1.43–1.48Si2.51–2.53O8. The ratio of albite:anorthite:orthoclase for this composition is Ab47–50:An47–50:Or3, which correlates to andesine or andesine-labradorite. The lattice parameters calculated from XRD measurements were a0=8.161–8.193Å, b0=12.849–12.919Å, c0=7.105–7.126Å, α=93.26°–93.74°, β=116.27°–116.38°, γ=89.93°–90.16°. Optical characterization by RI measurement (α=1.550–1.551, β=1.555–1.556, γ=1.560–1.561) correlated with andesine. Pale yellow non-Cu-bearing plagioclase feldspar (andesine) has been mined near the villages of Shuiquan and Haibouzi in Inner Mongolia. This material can be diffused with copper to produce a red color. Quantitative chemical analysis using EPMA and LA-ICP-MS showed that andesine from these two regions had a similar range of major and trace elements, but they could be differentiated by plotting Ba/Sr vs. Ba/Li ratios. In general, the Tibetan andesine had a lower Ba/Li ratio than Inner Mongolian andesine. INTRODUCTION Natural gem-quality plagioclase feldspar (andesine) was recently discovered in the Chinese region of Tibet. Natural copper-bearing andesine is an unusual gem that is prized for its color and rarity. It is typically intense orange-red to red, but green material is occasionally found. In late 2005, a red andesine called “Tibetan sunstone” was supplied by Do Win Development Co. Ltd. of Tianjin, China. The company reported its origin as Nyima (actually Nyemo) in central Tibet (Laurs, 2005). At the February 2007 Tucson gem shows, King Star Jewellery Co. (Hong Kong) and M. P. Gem Corp. (Kofu, Japan) introduced a similar red andesine from Tibet called “Lazasine,” which raised the market value of gem plagioclase sunstone (figure 1). Although purportedly rare, a large supply of red andesine allegedly from China was marketed as the official gemstone of the 2008 Summer Olympic Games in Beijing. Despite claims to the contrary, there has been widespread suspicion that the Chinese red andesine is diffusion-treated. In light of this, the author investigated mines in Tibet and Inner Mongolia in October and November 2008 to confirm the authenticity of the andesine locality (Abduriyim, 2008). Also participating in the expedition were Masaki Furuya (Japan Germany Gemmological Laboratory, Kofu, Japan), David Chiang (BBJ Bangkok Ltd., Bangkok), and Marco Cheung (Litto Gems Co. Ltd., Hong Kong). The following study introduces the geographical location of the deposits and describes the mining of andesine in Tibet and China, a topic of concern in the worldwide gem industry.

Figure 1. Since 2007, natural-colored orange-red and red-green pleochroic andesine has been recovered from a deposit in Xigazê, Tibet. These faceted stones (up to 5 ct) and rough samples (up to 30 ct) are from the deposit. Courtesy of King Star Jewellery Co. and M. P. Gem Corp. Photo by M. Kobayashi. LOCATION AND ACCESS The Tibetan andesine mine is located in Bainang County at 29.03984°N, 89.38791°E, 70 km south of the region’s second-largest city, Xigazê (or Shigatse), in the Himalayan highlands of southern Tibet (Qin Zang Gao Yuan; figure 2). From the capital city of Lhasa, a well-paved road at an elevation of 4,000 to 5,000 m leads 280 km to Xigazê, a five-hour drive by van. During the winter season, the road is frozen, making it difficult to reach this city. From Xigazê, it takes another hour or two of driving on paved and dirt roads to reach the mining area. The mine is located at an elevation of 4,000 m, in a frigid area with thin air. Twenty to thirty local Tibetan families are now living there, and we noticed fewer than ten miners digging pits near a piedmont riverbed and observing our intrusion. Without permission from the Chinese government and local authorities, foreigners are not allowed to visit this area. According to the miners, red andesine was originally found here in the 1970s, and beads of this material appeared in Lhasa’s largest bazaar—Bakuo Street—in 2003. However, mining did not begin officially until January 2006, under the supervision of Li Tong. The work is only done by hand from April to November. The Inner Mongolia plagioclase feldspar from Guyang County, north of the city of Baotou, has been known for more than a decade as a source of fine-quality pale yellow andesine-labradorite (Li, 1992; Cao, 2006). The mining areas are located about 3 to 4 km northwest of the villages of Shuiquan and Haibouzi, in the center of Inner Mongolia (again, see figure 2). We drove five to six hours in a small van, following a paved road for 190 km and then a dirt road for approximately 90 km from the capital city of Hohhot. The region is flat, with a few hilly areas. Since 2003, mine owner Wang Gou Ping has employed some 40 local farmers to work in the mines after each harvest season. A. Abduriyim. A Mine Trip to Tibet and Inner Mongolia: Gemological Study of Andesine Feldspar. News from Research. Sept. 10, 2009. http://www.gia.edu/research-resources/news-from-research
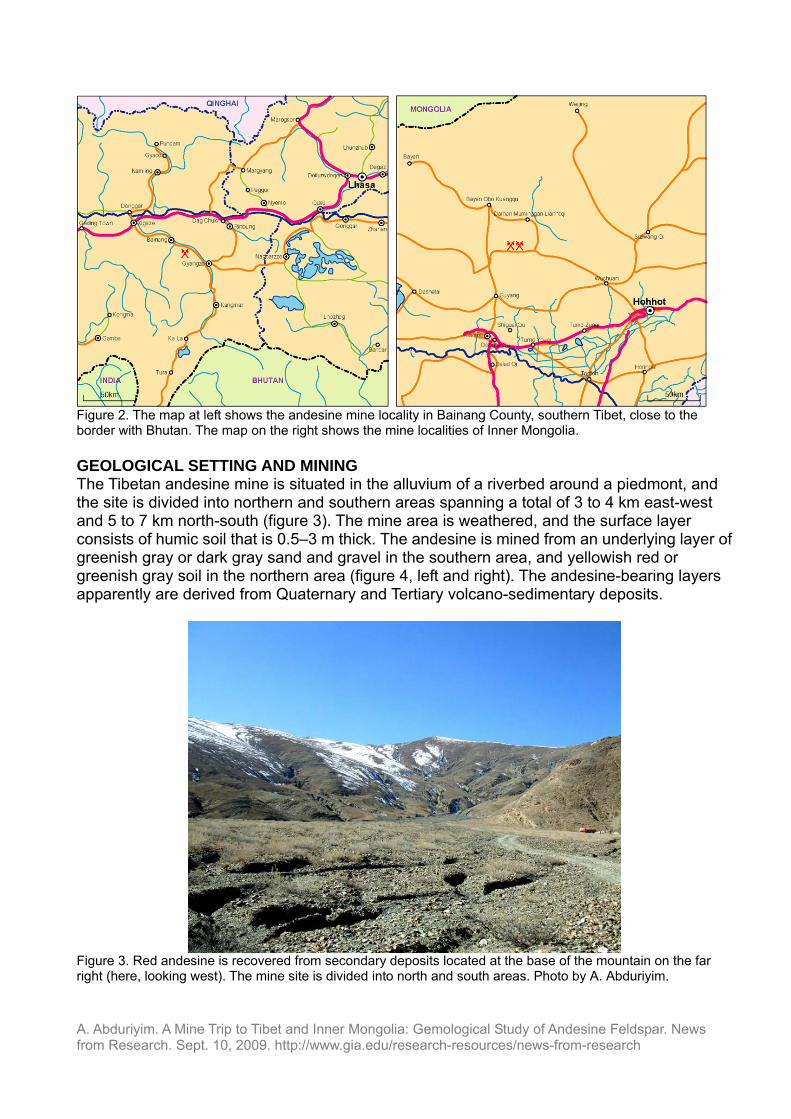
Figure 2. The map at left shows the andesine mine locality in Bainang County, southern Tibet, close to the border with Bhutan. The map on the right shows the mine localities of Inner Mongolia. GEOLOGICAL SETTING AND MINING The Tibetan andesine mine is situated in the alluvium of a riverbed around a piedmont, and the site is divided into northern and southern areas spanning a total of 3 to 4 km east-west and 5 to 7 km north-south (figure 3). The mine area is weathered, and the surface layer consists of humic soil that is 0.5–3 m thick. The andesine is mined from an underlying layer of greenish gray or dark gray sand and gravel in the southern area, and yellowish red or greenish gray soil in the northern area (figure 4, left and right). The andesine-bearing layers apparently are derived from Quaternary and Tertiary volcano-sedimentary deposits.
Figure 3. Red andesine is recovered from secondary deposits located at the base of the mountain on the far right (here, looking west). The mine site is divided into north and south areas. Photo by A. Abduriyim. A. Abduriyim. A Mine Trip to Tibet and Inner Mongolia: Gemological Study of Andesine Feldspar. News from Research. Sept. 10, 2009. http://www.gia.edu/research-resources/news-from-research

Figure 4. At left, rounded crystals of Tibetan andesine are shown in situ in the south area of the mine. Shown at right is the andesine-bearing layer in the north area. Photos by A. Abduriyim and M.Furuya. The geological survey of China’s Chengdu Institute of Multipurpose Utilization of Mineral Resources recently carried out extensive geological mapping of the Qin Zang Gao Yuan area of the Tibetan highlands, but the mine area of Bainang County is lacking in detail. A visit to the summit there revealed large-scale late Jurassic to early Cretaceous deposits of detrital clastic rocks and volcanic rocks. The geological occurrence of gem andesine crystals suggests that they crystallize underground in magmas and are carried to the surface by volcanic eruptions. Weathering of the primary deposit rocks resulted in the deposition of a soil layer at the lower part of the mountain to form a secondary alluvial deposit. These accumulations appear to have been spread across a wide area by water from seasonal snowmelt. The author did not encounter such crystals in the primary deposits of volcanic rock during his visit. In the south mining area, activities were limited to a few small tunnels penetrating several meters horizontally into the andesine-bearing layers. These tunnels did not exceed 2–2.5 m2 and 1–4 m in depth. A family of local miners worked the mine using picks and shovels to dig through gravel. The andesine crystals were concentrated in patches consisting of several to more than a dozen pieces (100–200 g total) mixed with sand and gravel or soil (figure 5, left and right). The excavated material is shaken on a handheld sorting screen to remove the soil and pebbles, and then the andesine is picked out by hand (figure 6). In addition, a shaft was sunk several meters deep in the north mining area, but operations there were discontinued after the devastating Chengdu earthquake in May 2008.
Figure 5. Rounded crystals of Tibetan andesine are found mixed with sand and gravel or soil at the entrance to the pit. Photos by A. Abduriyim.
A. Abduriyim. A Mine Trip to Tibet and Inner Mongolia: Gemological Study of Andesine Feldspar. News from Research. Sept. 10, 2009. http://www.gia.edu/research-resources/news-from-research

Figure 6. The andesine is excavated from a series of tunnels by local Tibetan miners using simple hand tools. Photo by A. Abduriyim.
Alluvial transport rounded the crystals, and most were translucent to transparent stones <1 cm in diameter (figure 7), though the largest pieces reached 4 cm. Approximately 80% of the crystals had an orangy red bodycolor; and the remaining 20% were deep red. The south mining area had a few red and green pleochroic crystals and bicolored crystals, but we did not see any pieces that were completely brown, yellow, or colorless. The annual production from the region is estimated to be 700–800 kg, of which 4%–6% are top-quality. The cleaned rough materials are presorted into four grades; the finest rough is faceted and the low-grade stones are polished to cabochons and beads in Guangzhou, China (figure 8 left and right).
Figure 7. The Tibetan andesine crystal consists of orangy red pebbles, generally <1 cm in diameter. The largest pieces reached 4 cm. Photo by A. Abduriyim.
A. Abduriyim. A Mine Trip to Tibet and Inner Mongolia: Gemological Study of Andesine Feldspar. News from Research. Sept. 10, 2009. http://www.gia.edu/research-resources/news-from-research
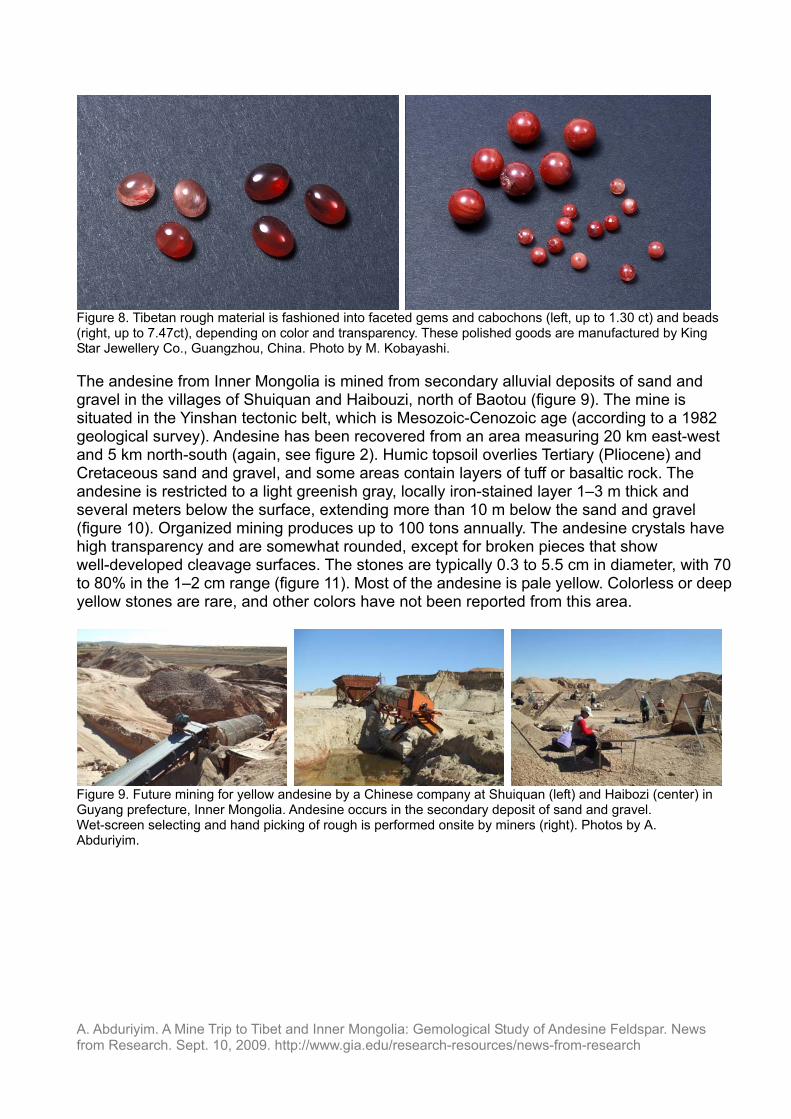
Figure 8. Tibetan rough material is fashioned into faceted gems and cabochons (left, up to 1.30 ct) and beads (right, up to 7.47ct), depending on color and transparency. These polished goods are manufactured by King Star Jewellery Co., Guangzhou, China. Photo by M. Kobayashi. The andesine from Inner Mongolia is mined from secondary alluvial deposits of sand and gravel in the villages of Shuiquan and Haibouzi, north of Baotou (figure 9). The mine is situated in the Yinshan tectonic belt, which is Mesozoic-Cenozoic age (according to a 1982 geological survey). Andesine has been recovered from an area measuring 20 km east-west and 5 km north-south (again, see figure 2). Humic topsoil overlies Tertiary (Pliocene) and Cretaceous sand and gravel, and some areas contain layers of tuff or basaltic rock. The andesine is restricted to a light greenish gray, locally iron-stained layer 1–3 m thick and several meters below the surface, extending more than 10 m below the sand and gravel (figure 10). Organized mining produces up to 100 tons annually. The andesine crystals have high transparency and are somewhat rounded, except for broken pieces that show well-developed cleavage surfaces. The stones are typically 0.3 to 5.5 cm in diameter, with 70 to 80% in the 1–2 cm range (figure 11). Most of the andesine is pale yellow. Colorless or deep yellow stones are rare, and other colors have not been reported from this area.
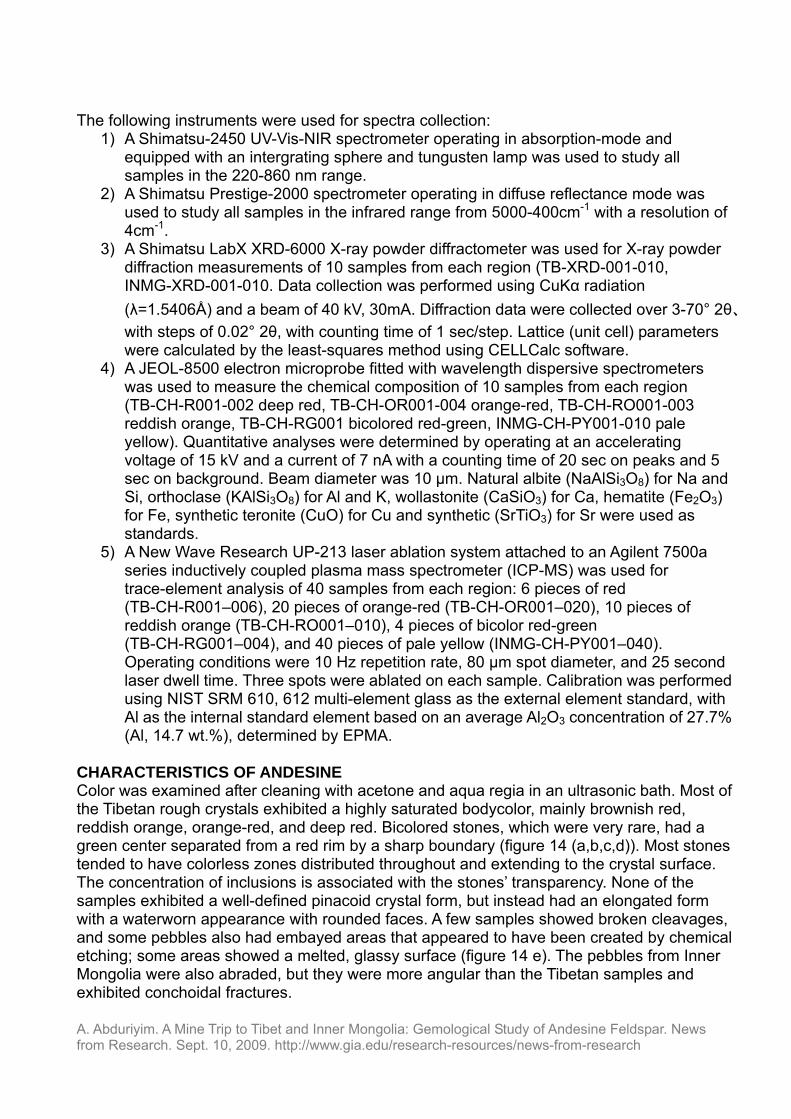
Figure 9. Future mining for yellow andesine by a Chinese company at Shuiquan (left) and Haibozi (center) in Guyang prefecture, Inner Mongolia. Andesine occurs in the secondary deposit of sand and gravel. Wet-screen selecting and hand picking of rough is performed onsite by miners (right). Photos by A. Abduriyim.
A. Abduriyim. A Mine Trip to Tibet and Inner Mongolia: Gemological Study of Andesine Feldspar. News from Research. Sept. 10, 2009. http://www.gia.edu/research-resources/news-from-research
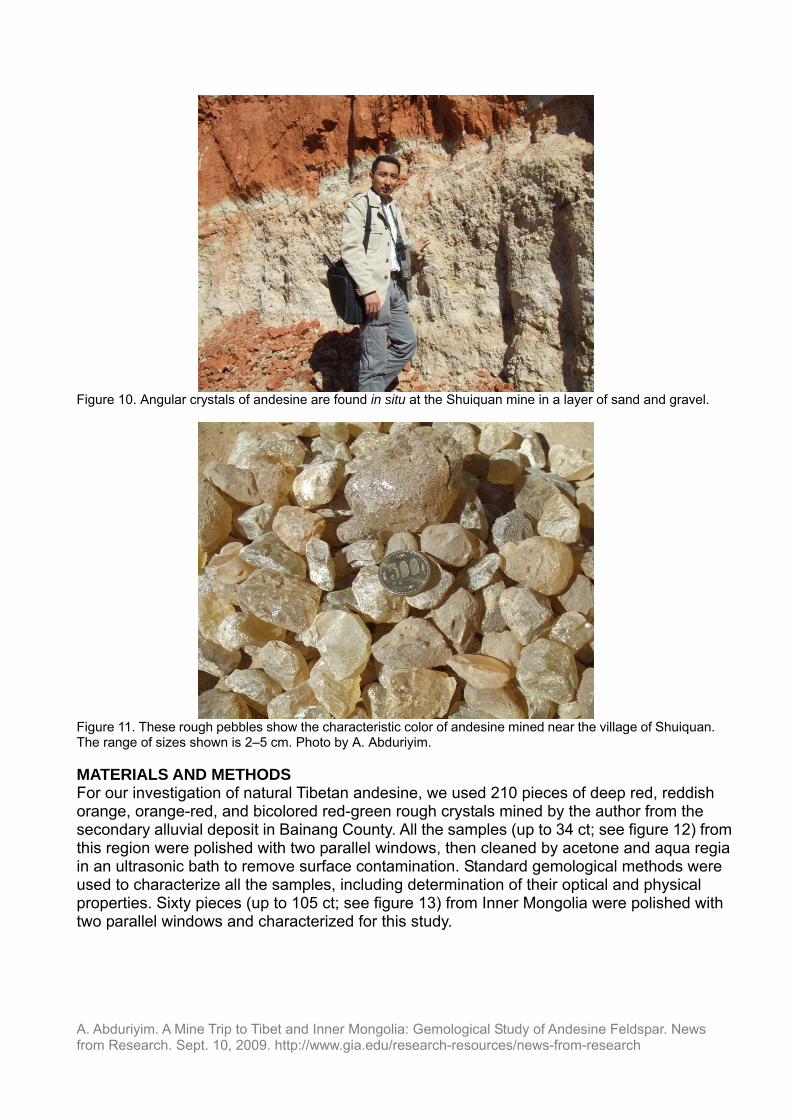
Figure 10. Angular crystals of andesine are found in situ at the Shuiquan mine in a layer of sand and gravel.
Figure 11. These rough pebbles show the characteristic color of andesine mined near the village of Shuiquan. The range of sizes shown is 2–5 cm. Photo by A. Abduriyim. MATERIALS AND METHODS For our investigation of natural Tibetan andesine, we used 210 pieces of deep red, reddish orange, orange-red, and bicolored red-green rough crystals mined by the author from the secondary alluvial deposit in Bainang County. All the samples (up to 34 ct; see figure 12) from this region were polished with two parallel windows, then cleaned by acetone and aqua regia in an ultrasonic bath to remove surface contamination. Standard gemological methods were used to characterize all the samples, including determination of their optical and physical properties. Sixty pieces (up to 105 ct; see figure 13) from Inner Mongolia were polished with two parallel windows and characterized for this study.
A. Abduriyim. A Mine Trip to Tibet and Inner Mongolia: Gemological Study of Andesine Feldspar. News from Research. Sept. 10, 2009. http://www.gia.edu/research-resources/news-from-research

Figure 12. This pile of andesine rough (behind) was collected from the Bainang mine in Tibet. These untreated rough materials had a range of color and size (2.4-34.42ct), and they displayed rounded shapes and a water worn appearance. Parallel window were polished on samples examined for this study. Photo by M. Kobayashi.
Figure 13. Some partially polished Inner Mongolia samples were examined for this study. Photo by M. Kobayashi. A. Abduriyim. A Mine Trip to Tibet and Inner Mongolia: Gemological Study of Andesine Feldspar. News from Research. Sept. 10, 2009. http://www.gia.edu/research-resources/news-from-research
A. Abduriyim. A Mine Trip to Tibet and Inner Mongolia: Gemological Study of Andesine Feldspar. News from Research. Sept. 10, 2009. http://www.gia.edu/research-resources/news-from-research
The following instruments were used for spectra collection:
1) A Shimatsu-2450 UV-Vis-NIR spectrometer operating in absorption-mode and equipped with an intergrating sphere and tungusten lamp was used to study all samples in the 220-860 nm range.
2) A Shimatsu Prestige-2000 spectrometer operating in diffuse reflectance mode was used to study all samples in the infrared range from 5000-400cm-1 with a resolution of 4cm-1.
3) A Shimatsu LabX XRD-6000 X-ray powder diffractometer was used for X-ray powder diffraction measurements of 10 samples from each region (TB-XRD-001-010, INMG-XRD-001-010. Data collection was performed using CuKα radiation (λ=1.5406Å) and a beam of 40 kV, 30mA. Diffraction data were collected over 3-70° 2θ、with steps of 0.02° 2θ, with counting time of 1 sec/step. Lattice (unit cell) parameters were calculated by the least-squares method using CELLCalc software.
4) A JEOL-8500 electron microprobe fitted with wavelength dispersive spectrometers was used to measure the chemical composition of 10 samples from each region (TB-CH-R001-002 deep red, TB-CH-OR001-004 orange-red, TB-CH-RO001-003 reddish orange, TB-CH-RG001 bicolored red-green, INMG-CH-PY001-010 pale yellow). Quantitative analyses were determined by operating at an accelerating voltage of 15 kV and a current of 7 nA with a counting time of 20 sec on peaks and 5 sec on background. Beam diameter was 10 μm. Natural albite (NaAlSi3O8) for Na and Si, orthoclase (KAlSi3O8) for Al and K, wollastonite (CaSiO3) for Ca, hematite (Fe2O3) for Fe, synthetic teronite (CuO) for Cu and synthetic (SrTiO3) for Sr were used as standards.
5) A New Wave Research UP-213 laser ablation system attached to an Agilent 7500a series inductively coupled plasma mass spectrometer (ICP-MS) was used for trace-element analysis of 40 samples from each region: 6 pieces of red (TB-CH-R001–006), 20 pieces of orange-red (TB-CH-OR001–020), 10 pieces of reddish orange (TB-CH-RO001–010), 4 pieces of bicolor red-green (TB-CH-RG001–004), and 40 pieces of pale yellow (INMG-CH-PY001–040). Operating conditions were 10 Hz repetition rate, 80 μm spot diameter, and 25 second laser dwell time. Three spots were ablated on each sample. Calibration was performed using NIST SRM 610, 612 multi-element glass as the external element standard, with Al as the internal standard element based on an average Al2O3 concentration of 27.7% (Al, 14.7 wt.%), determined by EPMA.
CHARACTERISTICS OF ANDESINE Color was examined after cleaning with acetone and aqua regia in an ultrasonic bath. Most of the Tibetan rough crystals exhibited a highly saturated bodycolor, mainly brownish red, reddish orange, orange-red, and deep red. Bicolored stones, which were very rare, had a green center separated from a red rim by a sharp boundary (figure 14 (a,b,c,d)). Most stones tended to have colorless zones distributed throughout and extending to the crystal surface. The concentration of inclusions is associated with the stones’ transparency. None of the samples exhibited a well-defined pinacoid crystal form, but instead had an elongated form with a waterworn appearance with rounded faces. A few samples showed broken cleavages, and some pebbles also had embayed areas that appeared to have been created by chemical etching; some areas showed a melted, glassy surface (figure 14 e). The pebbles from Inner Mongolia were also abraded, but they were more angular than the Tibetan samples and exhibited conchoidal fractures.

A B C
D E Figure 14. Shown are representative color varieties of Tibetan andesine selected for this study. These varieties include (a) deep red, (b) orange-red, (c) reddish orange, and (d) bicolored red-green. Surface etching and a melted glassy appearance were visible on a Tibetan andesine crystal (e). Photos by A. Abduriyim, magnified 28x.
A B C
D E F
A. Abduriyim. A Mine Trip to Tibet and Inner Mongolia: Gemological Study of Andesine Feldspar. News from Research. Sept. 10, 2009. http://www.gia.edu/research-resources/news-from-research

G Figure 15. With magnification, characteristic inclusions can be observed in Tibet andesine. These include (a) twin lamellae; (b) parallel lath-like hollow channels filled with a white solid substance; (c) dense concentrations of pipe-like growth tubes parallel to the [010] direction; (d) distinctive irregular dislocations; (e) uneven orange-red colored patches with a turbid, milky appearance resulting from concentrated granular clouds; (f) leaf-like discoid fractures, cleavage cracks, gas bubbles, and negative crystals; and (g) small grains or platelets of native copper. Photomicrographs by A. Abduriyim; magnified 20x–25x. Refractive indices of the Tibetan samples fell in the range expected for plagioclase feldspar (RI—α=1.550–1.551, β=1.555–1.556, γ=1.560–1.561), which correlated with andesine that has An30–50, a birefringence of 0.009–0.010, and a biaxial positive optic sign. Specific gravities of Tibetan samples were also consistent with plagioclase feldspar, with SG measurements of 2.67–2.72 determined by hydrostatic balance. Pleochroism was weak. The samples fluoresced weak chalky orange to long-wave UV radiation and dark red or inert to short-wave UV. The Chelsea color filter reaction was red. The Inner Mongolian samples exhibited almost identical properties except that they were inert to both long- and short-wave UV radiation, and they showed no reaction to the color filter. Examination with a gemological microscope revealed that most of the Tibetan samples contained prominent twin lamellae parallel to the [010], parallel lath-like hollow channels, and pipe-likes tubes (figure 15a,b,c). They also contained irregular dislocations (figure 15d), irregular color patches caused by milky turbidity from fine granular inclusions (figure 15e), fissures, leaf-like discoid fractures, cleavage cracks, gas bubbles, and negative crystals (figure 15f). One sample displayed reddish colloidal coloration (aventurescence) due to the presence of native copper grains or platelets (figure 15g). The samples from Inner Mongolia contained parallel flat growth tubes (figure 16 left), as well as abundant linear fissures (figure 16 right) and fine twin planes arranged parallel to the [010] direction. In some cases, the linear fissures caused a weak opalescence, and such stones cut en cabochon would be expected to show a weak cat’s-eye effect. Cleavage planes were also well developed along the [010] direction.
A. Abduriyim. A Mine Trip to Tibet and Inner Mongolia: Gemological Study of Andesine Feldspar. News from Research. Sept. 10, 2009. http://www.gia.edu/research-resources/news-from-research
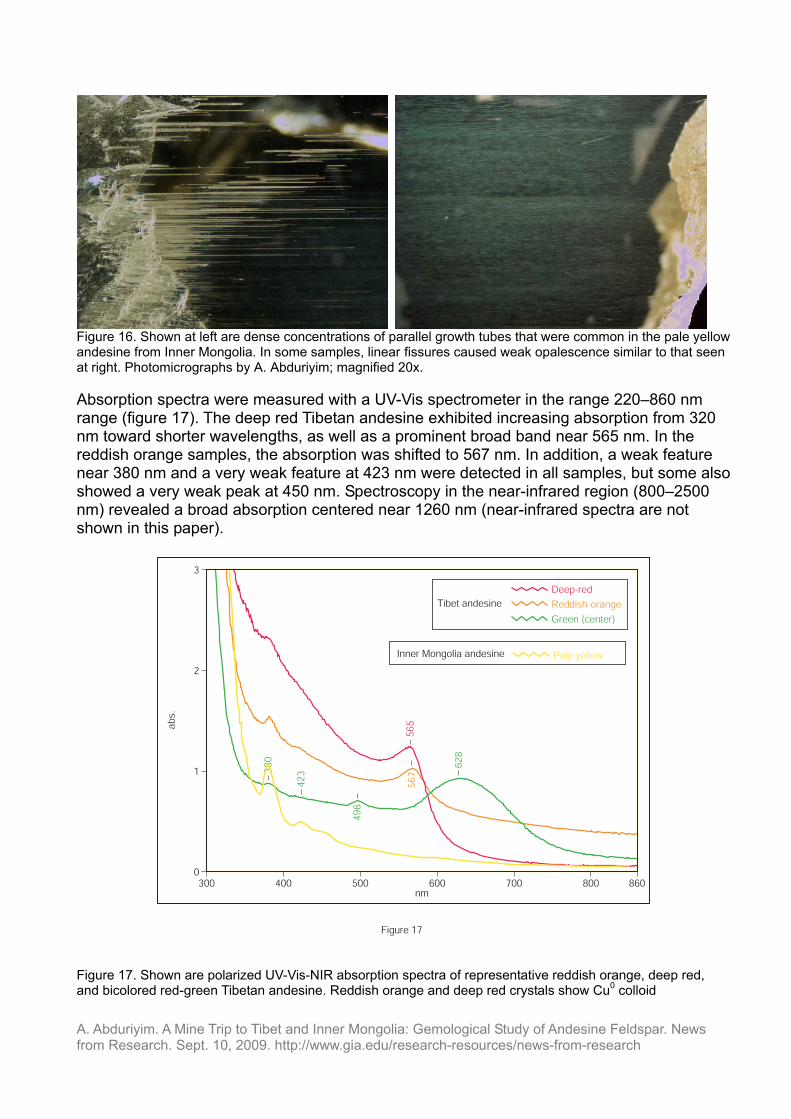
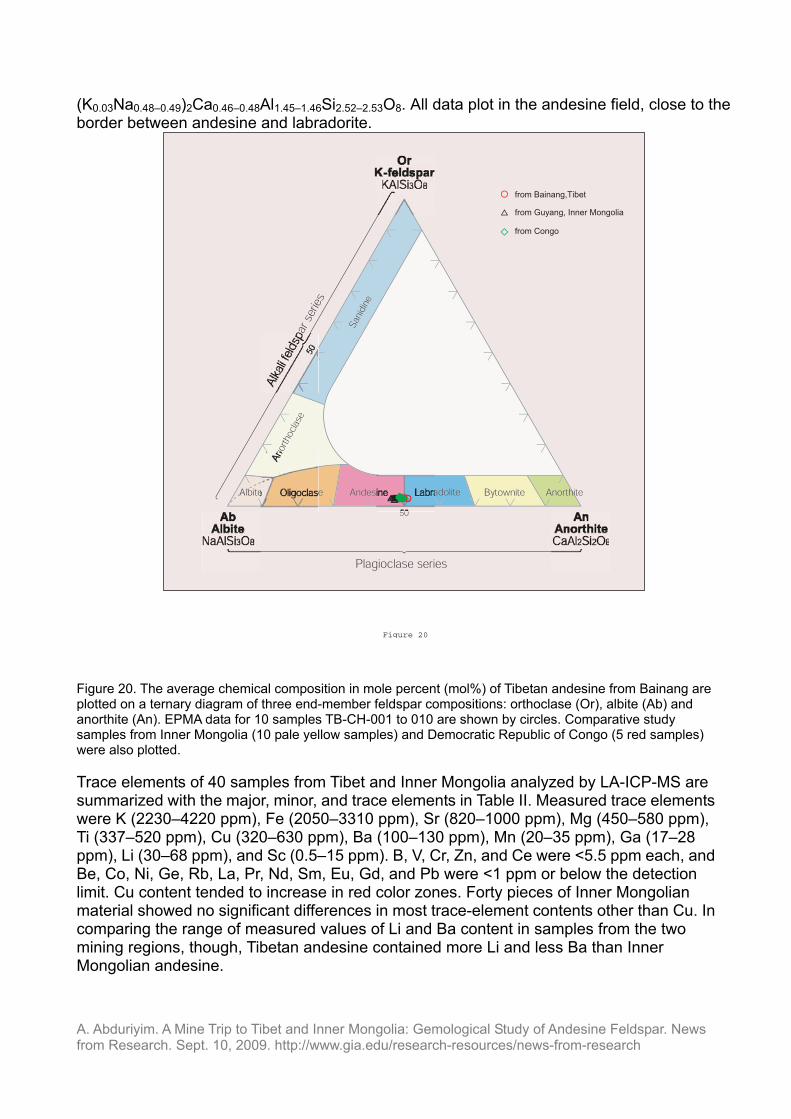
Figure 16. Shown at left are dense concentrations of parallel growth tubes that were common in the pale yellow andesine from Inner Mongolia. In some samples, linear fissures caused weak opalescence similar to that seen at right. Photomicrographs by A. Abduriyim; magnified 20x. Absorption spectra were measured with a UV-Vis spectrometer in the range 220–860 nm range (figure 17). The deep red Tibetan andesine exhibited increasing absorption from 320 nm toward shorter wavelengths, as well as a prominent broad band near 565 nm. In the reddish orange samples, the absorption was shifted to 567 nm. In addition, a weak feature near 380 nm and a very weak feature at 423 nm were detected in all samples, but some also showed a very weak peak at 450 nm. Spectroscopy in the near-infrared region (800–2500 nm) revealed a broad absorption centered near 1260 nm (near-infrared spectra are not shown in this paper).
Tibet andesine
Inner Mongolia andesine
3
2
1
0300 400 500 600 700 800 860
nm
abs.
567
565
380
423
496
628
Deep-red
Reddish-orange
Green (center)
Figure 17
Pale yellow
Figure 17. Shown are polarized UV-Vis-NIR absorption spectra of representative reddish orange, deep red, and bicolored red-green Tibetan andesine. Reddish orange and deep red crystals show Cu0 colloid
A. Abduriyim. A Mine Trip to Tibet and Inner Mongolia: Gemological Study of Andesine Feldspar. News from Research. Sept. 10, 2009. http://www.gia.edu/research-resources/news-from-research

absorption bands at 565–567 nm, as well as weak absorptions near 423 and 380 nm due to Fe3+. The absorption spectra of the green zone in a bicolored red-green crystal showed a combination of absorptions at 628, 496, 450, 423, and 380 nm. A strong absorption feature at 628 nm is attributed to Cu0-Cu+. Samples from Inner Mongolia showed absorptions at 380, 420, and 450 nm. In the case of bicolored red-green samples, the green area showed weak absorptions at 380, 423, 450, and 496 nm, and a very strong broad absorption centered at 628 nm (again, see figure 17). A broad absorption was also observed near 1260 nm. The andesine from Inner Mongolia showed absorptions at 380, 420, and 450 nm. A strong and broad absorption also was observed near 1260 nm. The samples from both mining regions showed almost no OH- or H2O-related absorptions in the 2800–3700 cm-1 range of their infrared spectra (figure 18).
Tibet andesine200
175
150
125
100
75
50
25
05000 4500 4000 3500 3000 2500 2000 1500 1000 500
1/cm
%T
Deep-red
Reddish-orange
Green (center)
Tibet Andesine
Inner Mongolia andesine
Pale yellow
Figure 18. Shown are representative infrared spectra of natural reddish orange, deep red, and bicolored red-green Tibetan andesine from Baining, and pale yellow andesine from Inner Mongolia. X-ray powder diffractograms of Tibet and Inner Mongolia materials were consistent with a sodium calcium aluminum silicate (figure 19), as evidenced by their albite-calcian high-temperature disordered structure. Lattice parameters were calculated for 10 Tibetan samples as a0=8.161–8.193(26) Å, b0=12.849–12.919(16) Å, c0=7.105–7.126(14) Å, α=93.26°–93.74°, β=116.27°–116.38°, γ=89.93°–90.16°.Ten samples from Inner Mongolia had calculated lattice parameters of a0=8.172–8.190(35) Å, b0=12.871–12.885(17) Å,
A. Abduriyim. A Mine Trip to Tibet and Inner Mongolia: Gemological Study of Andesine Feldspar. News from Research. Sept. 10, 2009. http://www.gia.edu/research-resources/news-from-research

c0=7.103–7.124(15) Å, α=93.34°–93.53°, β=116.22°–116.44°, γ=89.69°–89.83°.
70605040302010
1000
500
0
Analysis resultSpectrum position
(131
)(1
31)
I (C
ount
s)
Figure 19. Shown is the X-ray powder diffraction pattern (3-70˚) of Tibetan andesine from Bainang mine taken with CuKa radiation. Quantitative chemical analysis was carried out with a JEOL-8500 electron microprobe on the polished surface of 10 samples from the Bainang mine: TB-CH-R001–002 (deep red), TB-CH-OR001–004 (orange-red), TB-CH-RO001–003 (reddish orange), and TB-CH-RG001 (bicolored red-green). The results are listed in Table I. The chemical compositions are reported in weight percent (wt.%), with a range of 55.50–56.72 wt.% SiO2, 26.97–27.86 wt.% Al2O3, 9.53–10.18 wt.% CaO, and 5.29–5.61 wt.% Na2O. Trace elements such K, Mg, Ti, Fe, and Sr were detected. The Tibetan stones also contained 0.04–0.14 wt.% CuO, and no significant difference was detected between red and green color zones. The chemical composition in mole percent (mol%) yields a calculated ratio of albite:anorthite:orthoclase of Ab47–50:An47–50:Or3. If K is excluded, the anorthite content is An48–51) and the calculated empirical chemical formula is (K0.03Na0.46–0.49)2Ca0.46–0.49Al1.43–1.48Si2.51–2.53O8. On a ternary diagram of feldspar end member compositions orthoclase (Or), albite (Ab) and anorthite (An), most of the samples plot in the andesine field but are quite close to the border with labradorite. Two samples extend into the labradorite field. (figure 20). Ten pale yellow Inner Mongolian samples (INMG-CH-001–010) showed a range of 55.9–56.2 wt.% SiO2, 27.32–27.55 wt.% Al2O3, 9.66–10.00 wt.% CaO, and 5.56–5.70 wt.% Na2O. The ratio of albite:anorthite:orthoclase was Ab48–50:An47–48:Or3 (excluding the K, the albite:anorthite is Ab50–51:An48–50). The calculated chemical formula was
A. Abduriyim. A Mine Trip to Tibet and Inner Mongolia: Gemological Study of Andesine Feldspar. News from Research. Sept. 10, 2009. http://www.gia.edu/research-resources/news-from-research
(K0.03Na0.48–0.49)2Ca0.46–0.48Al1.45–1.46Si2.52–2.53O8. All data plot in the andesine field, close to the border between andesine and labradorite.
Figure 20 Figure 20. The average chemical composition in mole percent (mol%) of Tibetan andesine from Bainang are plotted on a ternary diagram of three end-member feldspar compositions: orthoclase (Or), albite (Ab) and anorthite (An). EPMA data for 10 samples TB-CH-001 to 010 are shown by circles. Comparative study samples from Inner Mongolia (10 pale yellow samples) and Democratic Republic of Congo (5 red samples) were also plotted. Trace elements of 40 samples from Tibet and Inner Mongolia analyzed by LA-ICP-MS are summarized with the major, minor, and trace elements in Table II. Measured trace elements were K (2230–4220 ppm), Fe (2050–3310 ppm), Sr (820–1000 ppm), Mg (450–580 ppm), Ti (337–520 ppm), Cu (320–630 ppm), Ba (100–130 ppm), Mn (20–35 ppm), Ga (17–28 ppm), Li (30–68 ppm), and Sc (0.5–15 ppm). B, V, Cr, Zn, and Ce were <5.5 ppm each, and Be, Co, Ni, Ge, Rb, La, Pr, Nd, Sm, Eu, Gd, and Pb were <1 ppm or below the detection limit. Cu content tended to increase in red color zones. Forty pieces of Inner Mongolian material showed no significant differences in most trace-element contents other than Cu. In comparing the range of measured values of Li and Ba content in samples from the two mining regions, though, Tibetan andesine contained more Li and less Ba than Inner Mongolian andesine.
A. Abduriyim. A Mine Trip to Tibet and Inner Mongolia: Gemological Study of Andesine Feldspar. News from Research. Sept. 10, 2009. http://www.gia.edu/research-resources/news-from-research

IDENTIFICATION AND DISCUSSION The materials from Bainang mine in Tibet showed an RI range of 1.550–1.561 with birefringence of 0.009, values that are consistent with andesine (Dana, 1997), is from China (6.42 – 25.32 ct). These RI values overlapped with Inner Mongolian andesine from the Shuiquan and Haibozi mines in China’s Guyang prefecture (Abduriyim. 2008), but were significantly lower than those of labradorite from Oregon in the United States and Chihuahua in Mexico. By examining the characteristic inclusions such as parallel lath-like hollow channels, pipe-like tubes, irregular dislocations, and milky turbid clouds, it is possible to distinguish the Tibetan material from red labradorite from Oregon. The native copper grains in Tibetan material that are responsible for aventurescence are fewer and smaller than those in material from Oregon. However, similar characteristic inclusions have been reported for red and green andesine-labradorite from the Democratic Republic of the Congo (Krzemnicki, 2004), though the source of this material is unspecified. In fact, in our recent studies of copper-diffused red andesine treated in China, we used material from Inner Mongolia that featured pipe- and tube-like structures, discoid fractures, recrystallized white residue filling the lath-like hollow channels, and cloud inclusions that resemble inclusions in the Tibetan stones (figure 21, left and right). These same features in Tibetan samples may indicate exposure to a thermal reaction underground before eruption of plagioclase-bearing magma. A recent study has demonstrated the viability of copper-diffusing such material (Roskin, 2008; Emmett and Douthit, 2009).
Figure 21. This copper-diffused rough specimen on the left is from China. On the right, an induced orange-red color layer penetrates gradually from the rim to core in a section view of diffused andesine. Red pipes or tubes, irregular dislocations, and turbid clouds were observed in this treated stone. Such features can also be seen in untreated Tibetan andesine. Photos by M. Kobayashi and A. Abduriyim, magnified 25x Tibetan materials mostly exhibit deep red, reddish orange, and orange-red colors. The depth of the red color correlates with the concentration of copper. The highest Cu content was in deep red andesine, reaching 630 ppm 63Cu, whereas reddish orange material went as low as 320 ppm. A UV-Vis-NIR absorption peak near 565 nm, caused by small particles of Cu0, produced a deep red color in one sample. The size of colloidal copper in red Tibetan andesine was smaller than 200 nm, as determined by microstructure observations using a JEM-3200FSK high-resolution transmission electron microscope (TEM) operated at 300 kV (figure 22). The UV-Vis spectra also showed several weak bands at 380, 423, and 450 nm due to Fe3+, and a broad absorption band centered at 1260 nm due to Fe2+. This suggests that presence of Fe3+ can be assigned wholly to the tetrahedral site, and Fe2+ entirely to the space of framework site of the plagioclase structure. The infrared
A. Abduriyim. A Mine Trip to Tibet and Inner Mongolia: Gemological Study of Andesine Feldspar. News from Research. Sept. 10, 2009. http://www.gia.edu/research-resources/news-from-research

spectra of Tibetan andesine did not present any OH-related features.
Figure 22. TEM image of a round native-copper grain in Tibetan red andesine.
On the other hand, UV-Vis spectra from the green color zone in bicolored stones showed a broad, distinct absorption at 628 nm, produced by the Cu0-Cu+ intervalence charge transfer. This spectral feature is also responsible for the green color of labradorite from Oregon and the Congo (Hofmeister and Rossman, 1985; Krzemnicki, 2004). But when the green color had an additional red component in its overall bodycolor, the 628 nm feature showed a decrease in absorption and a shift toward the UV-visible region, and this combination is responsible for the reddish green hue. In addition, a weak absorption band at 496 nm, possibly related to iron, is only present in the green color zone in Tibetan material. This is due to the slightly higher iron content of the green zone compared to the red zone (2510 vs. 2420 ppm 56Fe, respectively). In conclusion, the red and green color variation has been attributed to the copper exsolution temperature, the rate of Cu diffusion and aggregation of Cu0 colloids, and the oxidation state of copper (Cu0 or Cu+) by Hofmeister and Rossman (1985) and Krzemnicki (2004). The pale yellow andesine from Inner Mongolia had absorptions at 380, 420, and 450 nm. The 380 nm feature related to Fe3+ was the strongest, while the broad band at 420 nm presumably was due to the charge transfer between Fe2+ and Fe3+. Detailed chemical study by EPMA showed that the Tibetan feldspar samples were very low in potassium and could be compositionally assigned to the plagioclase series. The
A. Abduriyim. A Mine Trip to Tibet and Inner Mongolia: Gemological Study of Andesine Feldspar. News from Research. Sept. 10, 2009. http://www.gia.edu/research-resources/news-from-research

calculated mole percentage of the anorthite component shows a range of An48 to An51 (excluding the K content), which plots in the Ca-rich region of the andesine field on the ternary feldspar composition diagram. They are close to the boundary of andesine, however, and several stones have a slightly more than 50% An content. Tibetan material can be described as Ca-enriched andesine with a small amount of Na-labradorite. We also performed careful EPMA analysis of 10 pieces of pale yellow rough we collected from the mine in Inner Mongolia and five red stones from the Democratic Republic of the Congo that were purchased from gem dealer Laurent Sikirdji (Gemfrance.com). Their position on the ternary feldspar diagram completely overlaps that of the Tibetan materials, very close to the boundary of andesine and labradorite. However, the compositions of materials from Inner Mongolia and the Congo do not cross over into the labradorite field. Therefore, material from these three localities cannot be separated by plotting their chemical compositions.
●
●
●
●● ●
●430 343
527
536
400
450
441
●
●
●
●
362
368 399 340
Cu ppmBa/Sr=0.12-0.13
Ce/Nd=2.15-2.85
Figure 23. Compositional mapping of copper content is illustrated here. The ratios of Ba/Sr and Ce/Nd on a polished surface of a Tibetan sample (TB-CH-001) are also provided.
A. Abduriyim. A Mine Trip to Tibet and Inner Mongolia: Gemological Study of Andesine Feldspar. News from Research. Sept. 10, 2009. http://www.gia.edu/research-resources/news-from-research
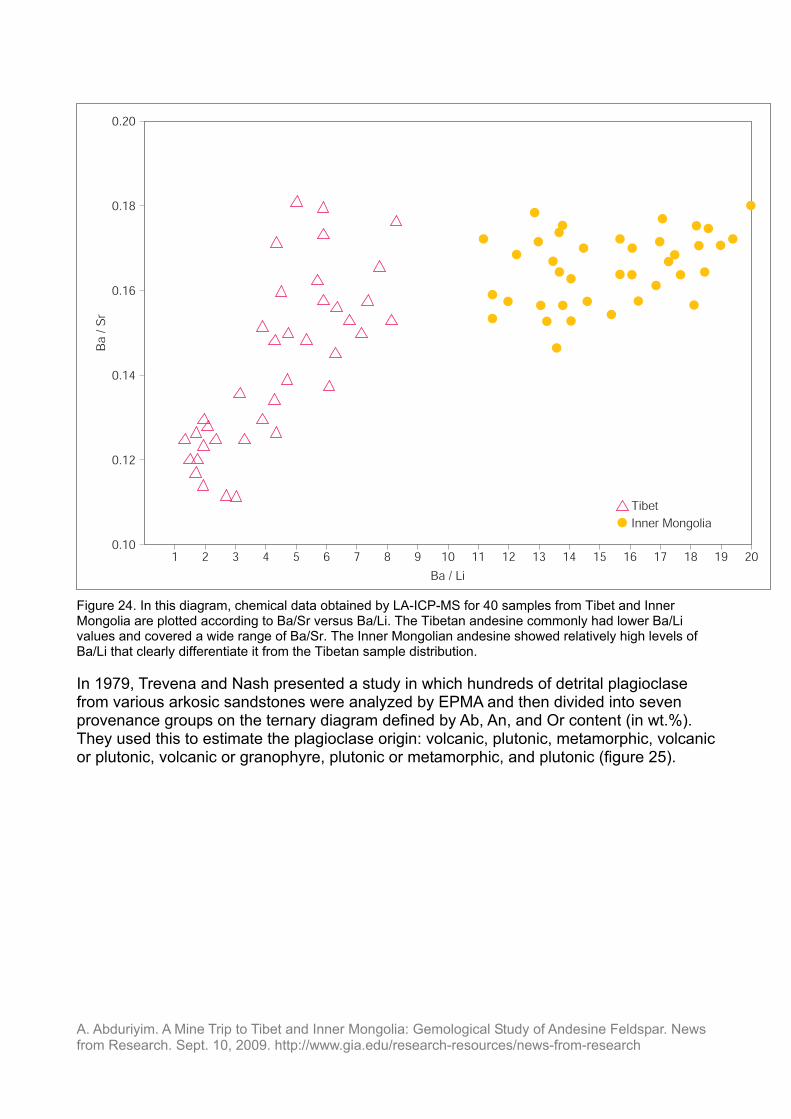
Trace elements in 40 samples from the Bainang mine in Tibet were analyzed by LA-ICP-MS and showed abundant contents of Li, Be, B, Mg, K, Sc, Ti, V, Cr, Mn, Fe, Co, Ni, Cu, Zn, Ga, Ge, Rb, Sr, Ba, and Pb, and rare earth element contents of La, Ce, Pr, Nd, Sm, Eu, and Gd. The ratios of Ba/Sr and Ce/Nd measured across a sample were rather constant (0.12–0.13 and 2.15–2.85, respectively; figure 23). The degree of Eu anomaly also appears constant for all the samples. This chemical homogeneity suggests the possibility that the plagioclase from Tibet may have been formed from single parent magma. The 40 samples from Inner Mongolia showed a similar range of trace elements, but the Li content was lower and the Ba content higher than red andesine from Tibet. To evaluate the usefulness of chemical data for separating the andesine from these two regions, we plotted two combinations of trace elements, Ba/Sr and Ba/Li, in figure 24. Tibetan red andesine falls into a field characterized by a low ratio of Ba/Li (<9) and a wide range of Ba/Sr (0.11–0.18). In contrast, Inner Mongolian pale yellow andesine is characterized by a higher ratio of Ba/Li (>11) and a limited range of Ba/Sr (0.14–0.18). Therefore, it appears that andesine from Tibet and Inner Mongolia can be clearly differentiated on this basis. We are planning future studies on more samples, which may help to confirm this chemical fingerprinting.
1 2 3 4 5 6 7 8 9 10 11 12 13 14 15 16 17 18 19 20
Ba / Li
0.20
0.18
0.16
0.14
0.12
0.10
TibetInner Mongolia
Ba
/ Sr
Figure 24. In this diagram, chemical data obtained by LA-ICP-MS for 40 samples from Tibet and Inner Mongolia are plotted according to Ba/Sr versus Ba/Li. The Tibetan andesine commonly had lower Ba/Li values and covered a wide range of Ba/Sr. The Inner Mongolian andesine showed relatively high levels of Ba/Li that clearly differentiate it from the Tibetan sample distribution. In 1979, Trevena and Nash presented a study in which hundreds of detrital plagioclase from various arkosic sandstones were analyzed by EPMA and then divided into seven provenance groups on the ternary diagram defined by Ab, An, and Or content (in wt.%). They used this to estimate the plagioclase origin: volcanic, plutonic, metamorphic, volcanic or plutonic, volcanic or granophyre, plutonic or metamorphic, and plutonic (figure 25).
A. Abduriyim. A Mine Trip to Tibet and Inner Mongolia: Gemological Study of Andesine Feldspar. News from Research. Sept. 10, 2009. http://www.gia.edu/research-resources/news-from-research

Figure 25. A composite in weight percent (wt.%) ternary diagram has been assigned plagioclase to seven provenance groups defined by Or-Ab-An contect. v=volcanic, p=plutonic, m=metamorphic, v+g=volcanic+granophyre, v+p=volcanic+plutonic, p+m=plutonic+metamorphic, p+m+a=plutonic+metamorphic+authigenic. Composition of 10 samples of Tibetan and Inner Mongolian andesine (wt.%) analyzed by EPMA placed in the field of v+p group. According to this diagram, the K2O in plagioclase generally decreases from volcanic through plutonic to metamorphic parageneses. Compositions of andesine samples from Quaternary-Tertiary sedimentary deposits in Tibet and Inner Mongolia are shown in part of the volcanic or plutonic field. The Tibetan material appears to consist almost entirely of plagioclase that is volcanic in origin. The temperature is the most important factor that influences the extent of Al/Si ordering in feldspar. Smith and Yoder (1956) introduced a simple method, based on a measurement of the spacing between the (13
-
1) and (131) peaks by X-ray power diffraction pattern, to estimate the difference of Al content in four tetrahedral sites, including T1(o) and {T1(m), T2(o), T2(m)}. In 1980, Kroll and Ribbe used two methods to determine the Al/Si distribution among the four (Al, Si)O4 -tetrahedral sites of albite in plagioclase by considering the plane spacing parameter of ∆=2θ(13
-
1)-2θ(131) or the lattice angle parameter of γ as a function of anorthite (An) chemical content (figure 26 and 27). This study mentioned that the γ-parameter plot method gives more precise
A. Abduriyim. A Mine Trip to Tibet and Inner Mongolia: Gemological Study of Andesine Feldspar. News from Research. Sept. 10, 2009. http://www.gia.edu/research-resources/news-from-research

results for plagioclase. On the other hand, the well-known method of ∆=2θ(13-
1)-2θ(131) can be used somewhat less precisely to determine structural states, but the value of ∆ is comparable from one sample to the next.
Figure 26. A diagram of plotting of the parameter of ∆=2θ(13
-
1)-2θ(131) and mole percent An has been contoured with the degree of order (from 1 to 10) of Al in tetrahedral sites T1(o)-T1(m). The Tibet samples distributed in a range of ∆ parameter from 1.9539 to 1.9668. However, Inner Mongolia samples showed the value ∆ from 1.9161-1.9487 and indicate that the Inner Mongolian materials had a higher degree of Al/Si ordering in the feldspar structure.
A. Abduriyim. A Mine Trip to Tibet and Inner Mongolia: Gemological Study of Andesine Feldspar. News from Research. Sept. 10, 2009. http://www.gia.edu/research-resources/news-from-research

Figure 27. A diagram of lattice angle γ parameter (in degrees) as a function of anorthite in mole percent for low, high and intermediate structural states. The plotting is contoured for ordering degree of Al in tetrahedral sites T1(o)-T1(m). Parameter of γ value from Tibet and Inner Mongolia samples also indicated a same level of order degree as parameter ∆=2θ(13
-
1)-2θ(131). Eberhard (1967) and Smith (1972) studied a relation between the formation temperature and the parameter of ∆=2θ(13
-
1)-2θ(131) in synthetic plagioclase, and presented a model involving the parameter of ∆=2θ(13
-
1)-2θ(131) and An content to explain the degree of Al/Si ordering in the tetrahedral sites of feldspar structure (see again, figure 26). Our TEM observation of the microstructure of Tibetan and Inner Mongolian materials confirmed that these feldspars do not include any complex exsolution lamellae structures, which means that accurate measurement of 2θ{131} can be obtained from a homogeneous matrix of feldspar by X-ray powder diffraction. The X-ray power diffraction data for 10 pieces of Tibetan material showed values of ∆=1.9539–1.9668, and the lattice angle parameter γ showed values of 89.93°–90.16°. The range of values measured for ∆ plot along the Al/Si ordering degree of 0.24–0.29 in figure 26, and the range of values measured for γ plot along the Al/Si ordering degree 0.22–0.28 (figure 27), which indicates that 22–29% of aluminum moves into the tetrahedral site T1(o) from T1(m), T2(o), and T2(m), has a lower ordering structural state. From a plot of the ∆ data for Tibetan material, we estimate that the
A. Abduriyim. A Mine Trip to Tibet and Inner Mongolia: Gemological Study of Andesine Feldspar. News from Research. Sept. 10, 2009. http://www.gia.edu/research-resources/news-from-research

temperature stability of Al/Si ordering in Tibetan andesine is about 800°C, consistent with temperatures in a high volcanic environment (figure 28). The investigated pale yellow stones from Inner Mongolia we investigated are volcanic or plutonic origin, showing a value of ∆=1.9161–1.9487, an Al/Si ordering parameter of 0.32–0.36, and a lattice angle parameter γ of 0.30–0.37, which indicates the Inner Mongolia feldspar more Al/Si structural ordering on the tetrahedral site and may be formed close to 700°Celsius (see again, figure 28). Our data showed a close field mapping with a recent study of andesine from Inner Mongolia by Dong et al., 2009.
Figure 28. Shown is a plot of the parameter ∆=2θ(13
-
1)-2θ(131) versus An composition for various formation temperature isotherms. This provides information about the structural ordering of Al and Si that is produced when different compositions crystallize at various temperatures. This plot indicates that Tibet material had a higher formation temperature than Inner Mongolian material. CONCLUSIONS The Bainang mine in the southern part of Xigazê area in Tibet produces gem-quality orange-red andesine feldspar from a volcanic-sedimentary deposit. These stones are used to fashion faceted, cabochon, and beaded material. Simple hand-tool mining by locals is currently a small-scale endeavor that produces several hundred kilograms of rough per year. It is estimated that mining with heavy machinery could increase the productivity. No other A. Abduriyim. A Mine Trip to Tibet and Inner Mongolia: Gemological Study of Andesine Feldspar. News from Research. Sept. 10, 2009. http://www.gia.edu/research-resources/news-from-research

A. Abduriyim. A Mine Trip to Tibet and Inner Mongolia: Gemological Study of Andesine Feldspar. News from Research. Sept. 10, 2009. http://www.gia.edu/research-resources/news-from-research
known deposit in Tibet produces such saturated colors. Gemological and chemical investigations indicate that the red color results from small clusters of copper (Cu0), while the green color may be a result of the oxidation state of copper (Cu0-Cu+ intervalence charge transfer) similar to labradorite from Oregon. RI and SG values correlate to andesine. Chemical composition shows that the three end members are Ab47-50:An47-50:Or3, and the material can be classified accordingly as andesine or andesine-labradorite. We calculated an empirical chemical formula of (K0.03Na0.46–0.49)2Ca0.46–0.49Al1.43–1.48Si2.51–2.53O8. The Ab-An-Or data plot the samples in the volcanic or plutonic origin area of a ternary feldspar diagram. The lattice parameters are (a0=8.161–8.193 Å, b0=12.849–12.919 Å, c0=7.105–7.126 Å, α=93.26°–93.74°, β=116.27°–116.38°, γ=89.93°–90.16°). The measured parameter of ∆=2θ(13
-
1)-2θ(131)=1.9539–1.9668 indicates that Tibetan andesine has a small amount of Al/Si ordering (22–29%), and formed at about 800°C in a volcanic environment. Organized mining has taken place near the Inner Mongolian villages of Shuiquan and Haibouzi, producing up to 100 tonnes annually. Most of the andesine was pale yellow. Colorless or deep yellow stones were uncommon, and the pale yellow andesine may be used as the starting material for diffusion treatment. EPMA chemical analysis has shown that non-Cu-bearing Inner Mongolian andesine and Tibetan andesine have identical quantities of major and minor elements. Trace element analysis with LA-ICP-MS, plotting Ba/Sr versus Ba/Li, is useful for distinguishing the two. X-ray powder diffraction revealed that Inner Mongolian andesine has lattice parameters a0=8.172–8.190 Å, b0=12.871–12.885 Å, c0=7.103–7.124 Å, α=93.34°–93.53°, β=116.22°–116.44°, and γ=89.69°–89.83°. The parameter of ∆=2θ(13
-
1)-2θ(131) was 1.9161–1.9487, which indicates that Inner Monglian andesine has more Al/Si ordering than Tibetan material. This study has introduced the andesine mines from Tibet and Inner Mongolia. Further research of copper-diffused red andesine from China is currently being conducted, because distinguishing between treated and untreated materials requires further investigation. Additional research will be published in the near future. ACKNOWLEDGMENTS The author is grateful to Wong Ming (King Star Jewellery Co) and Christina Iu (M. P. Gem Corp) for supporting and organizing the field trip, and also offers special thanks to mine owner Li Ting in Tibet for allowing access and guiding us. Special thanks to Prof. Detlef Günther from Swiss Federal Institute of Technology Zürich for providing LA-ICP-MS chemical analysis for comparison. Also, the author appreciates the support of Kousuke Kosuda from the National Institute for Materials Science (NIMS) in electron microprobe analysis, and thanks Dr. Shoichi Toh from the Research Laboratory of High-Voltage Electron Microscope, Kyushu University, for supporting TEM observations. The author thanks our research colleagues Hiroshi Kitawaki, Dr. Jun Kawano, Makoto Okano, Taisuke Kobayashi, and Chihiro Fukuda at GAAJ-ZENHOKYO Laboratory for assistance with this work. The author is also thankful to Prof. Masao Kitamura for his critical reading of this report.
References Ahmadjan A. (2008) Gem News International: Visit to andesine mines in Tibet and Inner Mongolia,
A. Abduriyim. A Mine Trip to Tibet and Inner Mongolia: Gemological Study of Andesine Feldspar. News from Research. Sept. 10, 2009. http://www.gia.edu/research-resources/news-from-research
Gemological properties of andesine collected in Tibet and Inner Mongolia. Gems & Gemology, Vol. 44, No. 4, pp. 369–373.
Carpenter M.A., McConnell J.D.C. (1984) Experimental bracketing of order/disorder transformations in plagioclase. Progress in Experimental Petrology, Vol. 6, pp. 186–189.
Dana’s new mineralogy (1997)the system of mineralogy of James Dwight Dana and Edward Salisbury Dana, 8th ed. Entirely rewritten and greatly enlarged by Gaines R.V, Skinner H.C.W, Foord E.E, Rosenzweig A. Printed in USA. ISBN 0-471-19310.
Dong X. Z., Qi L.J., Zhong Z.Q. (2009) Preliminary study on gemological characteristics and genesis of andesine from Guyang, Inner Mongolia. Journal of Gems and Gemmology, Vol. 11, No 1, pp. 20–24.
Eberhard V.E. (1967) Zur synthese der plagioclase. Schweizerische Mineralogische und Petrographische Mitteilungen. Vol .47, pp. 385–398.
Emmett J., Douthit T (2009) Copper diffusion in plagioclase. Presentation in GIA seminar on 21st Aug. Haifu Li. (1992) First study of gem-quality Inner Mongolian Labradorite moonstone. Jewellery, Vol. 1, No. 6,
pp. 45–47 [in Chinese]. Hofmeister A.N., and Rossman G.R. (1985) Exsolution of metallic copper from lake county labradorite.
Geology, Vol. 13, pp. 644–647. Kroll H and Ribbe P.H. (1980) Determinative diagrams for Al,Si order in plagioclases. American Mineralogist.
Vol. 65, pp. 449–457. Krzemnicki M.S. (2004) Red and green labradorite feldspar from Congo. Journal of Gemmology, Vol. 29, No.
1, pp. 15–23. Laurs B.M. (2005) Gem News International: Gem plagioclase reportedly from Tibet. Gems & Gemology, Vol.
41, No. 4, pp. 356–357. Roskin G. (2008) “JCK web exclusive: The andesine report,” posted November 12,
http://www.jckonline.com/article/CA6613857.html?desc=topstorySmith J.R., Yoder H.S. (1956) Variation in X-ray powder diffraction patterns of plagioclase feldspars.
American Mineralogist. Vol. 41, pp. 632–647. Smith J.R. (1972) Critical review of synthesis and occurrence of plagioclase feldspar and a possible phase
diagram. The Journal of Geology, Vol. 80, No. 5, pp. 505–525. Trevena A.S., Nash W.P. (1979) Chemistry and provenance of detrital plagioclase. Geology, Vol. 7, pp.
475–478. Yue Cao. (2006) Study on the feldspar from Guyang County, Inner Mongolia and their color enhancement,
Master’s thesis, Geological University of China.

Table I.
Chemical compositon deep-red orange-red reddish orange bicolored red
zonebicoloured green zone pale yellow
TB-CH-R001-002 TB-CH-OR001-004 TB-CH-RO001-003 TB-CH-RG001 TB-CH-RG001 INMG-CH-PY001-010Oxide (wt.%) Oxide (mol%) Oxide (wt.%) Oxide (mol%) Oxide (wt.%) Oxide (mol%) Oxide (wt.%) Oxide (mol%) Oxide (wt.%) Oxide (mol%) Oxide (wt.%) Oxide (mol%)
Na2O 5.49-5.56 6.04-6.07 5.29-5.52 5.77-6.02 5.50-5.61 6.00-6.12 5.54 6.05 5.53 6.04 5.56-5.70 6.06-6.20Al2O3 27.49-27.51 18.27-18.43 27.55-27.75 18.25-18.41 26.97-27.19 17.88-18.04 27.86 18.49 27.75 18.41 27.32-27.55 18.14-18.25SiO2 55.90-55.92 62.76-63.03 55.80-55.99 62.82-62.95 56.54-56.72 63.64-63.79 55.5 62.52 55.65 62.65 55.9-56.2 62.93-63.21K2O 0.52-0.56 0.37-0.40 0.53-0.56 0.38-0.40 0.59-0.6 0.43 0.54 0.39 0.56 0.39 0.52-0.56 0.37-0.40CaO 9.85-9.87 11.91-11.94 9.84-10.18 11.87-12.26 9.53-9.64 11.48-11.63 10 12.08 9.99 12.05 9.66-10.0 11.64-12.04FeO 0.39-0.40 0.17-0.30 0.29-0.34 0.28-0.32 0.36-0.41 0.15-0.17 0.3 0.29 0.31 0.29 0.31-0.35 0.29-0.33CuO 0.08-0.14 0.04-0.09 0.05-0.11 0.03-0.09 0.04-0.1 0.03-0.08 0.11 0.09 0.09 0.08 bdl -SrO 0.15-0.17 0.08-0.11 0.10-0.13 0.06-0.08 0.09-0.11 0.06-0.07 0.15 0.1 0.12 0.08 0.06-0.14 0.03-0.09
Total 100 100 100 100 100 100 100 100 100 100 100 100
AtomNa 0.48 0.46-0.48 0.48-0.49 0.48 0.48 0.48-0.49Al 1.48 1.46-1.47 1.43-1.44 1.48 1.48 1.45-1.46Si 2.52 2.52-2.53 2.54-2.55 2.51 2.51 2.52-2.53K 0.03 0.03 0.03 0.03 0.03 0.03Ca 0.48 0.48-0.49 0.46 0.48 0.48 0.46-0.48Fe 0.01 0.01 0.01 0.01 0.01 0.01Cu 0 0 0 0 0 0Sr 0 0 0 0 0 0Total 5 4.99-5 4.98-4.99 5 5 5Ab-An-Or compositionAb 48.59-48.96 50.22-50.49 46.96-48.73 48.47-50.37 49.05-49.79 50.82-51.59 48.5 50.04 48.43 50.04 48.61-49.93 50.15-51.46An 48.00-48.17 49.51-49.78 48.01-49.94 49.63-51.54 46.72-47.47 48.41-49.18 48.42 49.96 48.36 49.96 46.82-48.31 48.39-48.53Or 3.03-3.23 excluded K 3.09-3.26 excluded K 3.48-3.50 excluded K 3.09 excluded K 3.2 excluded K 3.07-3.23 excluded K
Note: EPMA chemical composition data represent an average of 3-5 analyses per sample, and data show a range of valuesfor a number of samples from each color variety.
A. Abduriyim. A Mine Trip to Tibet and Inner Mongolia: Gemological Study of Andesine Feldspar. News from Research. Sept. 10, 2009. http://www.gia.edu/research-resources/news-from-research
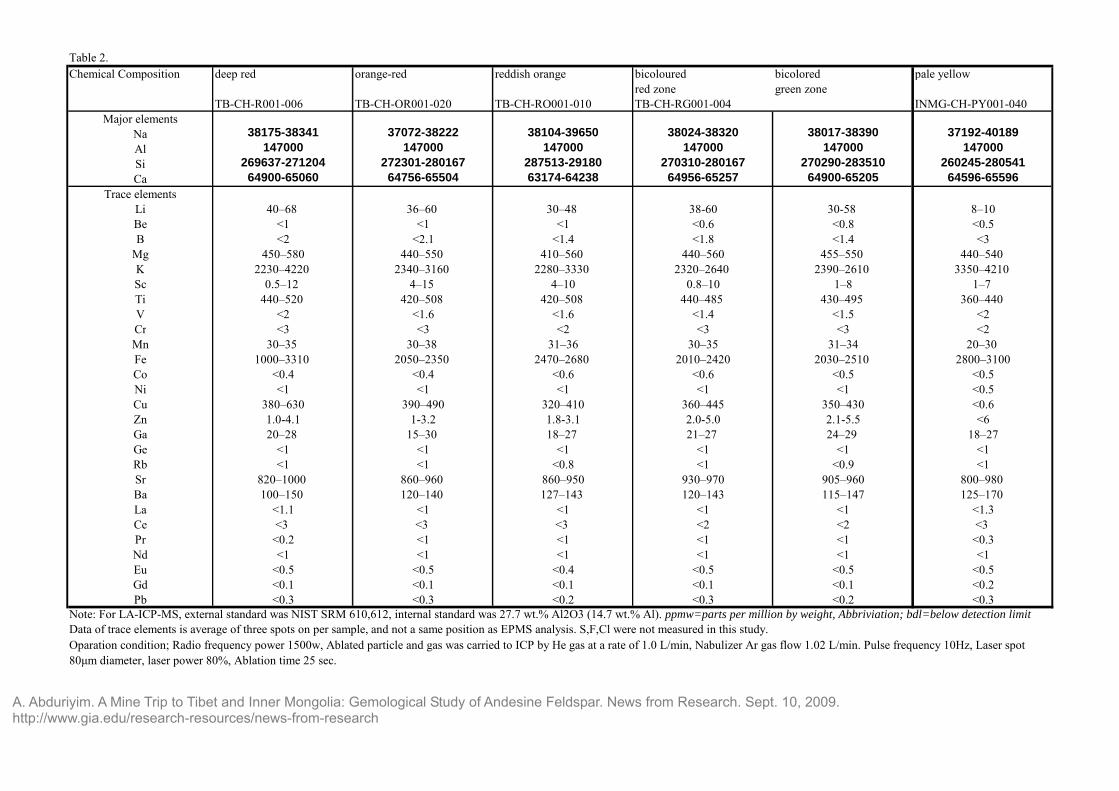
Table 2.Chemical Composition deep red orange-red reddish orange bicoloured bicolored pale yellow
red zone green zoneTB-CH-R001-006 TB-CH-OR001-020 TB-CH-RO001-010 TB-CH-RG001-004 INMG-CH-PY001-040
Major elementsNa 38175-38341 37072-38222 38104-39650 38024-38320 38017-38390 37192-40189Al 147000 147000 147000 147000 147000 147000Si 269637-271204 272301-280167 287513-29180 270310-280167 270290-283510 260245-280541Ca 64900-65060 64756-65504 63174-64238 64956-65257 64900-65205 64596-65596
Trace elements Li 40–68 36–60 30–48 38-60 30-58 8–10Be <1 <1 <1 <0.6 <0.8 <0.5B <2 <2.1 <1.4 <1.8 <1.4 <3
Mg 450–580 440–550 410–560 440–560 455–550 440–540 K 2230–4220 2340–3160 2280–3330 2320–2640 2390–2610 3350–4210 Sc 0.5–12 4–15 4–10 0.8–10 1–8 1–7 Ti 440–520 420–508 420–508 440–485 430–495 360–440 V <2 <1.6 <1.6 <1.4 <1.5 <2Cr <3 <3 <2 <3 <3 <2Mn 30–35 30–38 31–36 30–35 31–34 20–30 Fe 1000–3310 2050–2350 2470–2680 2010–2420 2030–2510 2800–3100Co <0.4 <0.4 <0.6 <0.6 <0.5 <0.5Ni <1 <1 <1 <1 <1 <0.5Cu 380–630 390–490 320–410 360–445 350–430 <0.6Zn 1.0-4.1 1-3.2 1.8-3.1 2.0-5.0 2.1-5.5 <6Ga 20–28 15–30 18–27 21–27 24–29 18–27Ge <1 <1 <1 <1 <1 <1Rb <1 <1 <0.8 <1 <0.9 <1Sr 820–1000 860–960 860–950 930–970 905–960 800–980 Ba 100–150 120–140 127–143 120–143 115–147 125–170 La <1.1 <1 <1 <1 <1 <1.3Ce <3 <3 <3 <2 <2 <3 Pr <0.2 <1 <1 <1 <1 <0.3Nd <1 <1 <1 <1 <1 <1Eu <0.5 <0.5 <0.4 <0.5 <0.5 <0.5Gd <0.1 <0.1 <0.1 <0.1 <0.1 <0.2Pb <0.3 <0.3 <0.2 <0.3 <0.2 <0.3
Note: For LA-ICP-MS, external standard was NIST SRM 610,612, internal standard was 27.7 wt.% Al2O3 (14.7 wt.% Al). ppmw=parts per million by weight, Abbriviation; bdl=below detection limitData of trace elements is average of three spots on per sample, and not a same position as EPMS analysis. S,F,Cl were not measured in this study.Oparation condition; Radio frequency power 1500w, Ablated particle and gas was carried to ICP by He gas at a rate of 1.0 L/min, Nabulizer Ar gas flow 1.02 L/min. Pulse frequency 10Hz, Laser spot 80μm diameter, laser power 80%, Ablation time 25 sec.
A. Abduriyim. A Mine Trip to Tibet and Inner Mongolia: Gemological Study of Andesine Feldspar. News from Research. Sept. 10, 2009. http://www.gia.edu/research-resources/news-from-research