a n d e c ono s mics business and economics e o n u i s nr
TRANSCRIPT
The Role of Institutions and Good Governance for Attracting Foreign DirectInvestments: Evidence from Southeast EuropeValbona Zeneli*
Professor of national security studies, George C. Marshall European Center for Security Studies, Garmisch, Germany*Corresponding author: Valbona Zeneli, Professor of national security studies, George C. Marshall European Center for Security Studies, Garmisch, Germany, Tel:0049 88217502633; E-mail: [email protected] date: February 13, 2014, Accepted date: March 24, 2014, Publication date: March 30, 2014
Copyright: © 2014 Zeneli V. This is an open access article distributed under the terms of the Creative Commons Attribution License, which permits unrestricted use,distribution, and reproduction in any medium, provided the original author and source are credited.
Abstract
Institutional infrastructure and governance play a critical role in attracting foreign investments. This is especiallytrue in transition countries. This paper examines the role of Foreign Direct Investment (FDI) in South EasternEuropean Countries during the 1992-2010 timeframe. Using GMM estimations applied to dynamic panel data,visibility into regional foreign investments highlight the role of institutions as well as the distinctions between total FDIand Non-Privatization related FDI. The empirical data point to the importance of the quality of the institutions and therole of the privatization process in these countries.
IntroductionForeign Direct Investment (FDI) remains one the most important
features when considering the economics of globalization. The generalnegative attitude towards FDI prevalent until the 1980s has changed tothe view where it is typical that economies sought and wouldencourage FDI inflow. However, this debate would restart againduring the recent crises as the world economy suffered the deepestfinancial and economic crisis since World War II, witnessing majordeclines in output, trade, investments and employment. To some, FDIwere seen much more volatile when compared to domesticinvestments. The nature of FDI and its role during the crisis has beenone of the main topics of debate in the recent years.
Hence, determining what drives FDI towards certain countries andnot others is a topic worthy of study. In both developing and transitioneconomies FDI is viewed by most scholars and policymakers as amajor catalyst to assist in development, and an important indicator ofeconomic health and stability. Over the past two decades developingand transition economies have used FDI to supplement investmentresources, transfer technology and managerial skills, upgrade qualityand productivity, and gain access to world markets. FDI inflows havestimulated the development of market economies and their supportingregulatory infrastructures, which are so essential to their efficiency [1].
However, the empirical evidence has been mixed especially sinceFDI’s macro and micro economic performance remains unclear.Existing studies show the effects of FDI largely depend on theconditions of the host country, précising that their benefits do notaccrue automatically and evenly across countries, sectors, and localcommunities. Instead, national policies and the internationalinvestment architecture are very important for attracting FDI andreaping their full benefits for development [2]. The local conditions or“absorptive capacities” are: human capital [3], trade openness [4] anddomestic financial institutions [5].
According to the data available and various empirical studies, themajority of global FDI flows move within developed countries andthere is a lack of mobility towards developing countries. The reasonsmay be the external push-factors and asymmetric information, or on
pull-factors such as the quality of institutions, imperfections of thefinancial markets (Alfaro, 2005) and technological differences.
The worldwide competition for FDI attraction has resulted in anumber of responses such as policy changes [6], provision ofincentives and inducements for seeking investments and selectivetargeting for “quality FDI” [7]. Various scholars generally interpretthis latter idea of “desirability "of FDI related to the magnitude oflikely economic impacts. Hence, the idea is usually built on simpledichotomies, such as the size of firm (larger firms more desirable thansmaller, industry (higher value-added industry is preferred to lowervalue-added), the functional focus of an affiliate (higher orderfunctions such as research and development (R&D) or regionalheadquarters are preferred to assembly operations), the form of entry(Greenfield investment is superior to mergers and acquisitions orBrownfield investment), or the orientation (motive) of a firm [8].
In recent years FDI has gone through unprecedented growth,showing also new features such as increased inflows towardsdeveloping countries; a shift from primary and manufacturing sectorsto services such as finance, communication and business consulting;and, a trend shifting from privatization related to Greenfieldinvestments and cross-border mergers and acquisitions. Hence, tounderstand and explain the FDI flows it is necessary to understandwhy companies invest abroad and how they choose the locationswhere to invest. In the empirical literature, FDI determinants havebeen examined both at micro and macro levels, but in the case ofSoutheast Europe, it has been absent from the literature.
The FDI investment picture concerning Southeast Europe (SEE)raises some compelling questions that need to be addressed. What isthe distribution of FDI inflows in the SEE? Which economies havebeen most successful in attracting FDI? What are the factors thatdetermine the volume of FDI inflow that these countries receive?What type of FDI is noticed in SEE? Are there specific conditions intransition countries that play particularly important roles for theattraction of FDI? Is there any connection between the transitionprocess, privatization, and FDI?
Zeneli V, Bus Eco J 2014, 5:2DOI: 10.4172/2151-6219.100092
Reasearch Article Open Access
Bus Eco JISSN:2151-6219 BEJ, an open access journal
Volume 5 • Issue 2 • 100092
Business and Economics JournalBu
sine
ssan
d E conomics Journal
ISSN: 2151-6219

This paper will focus on the importance of the quality ofinstitutions in creating a friendly environment for the attraction ofFDI. The economies taken in consideration in this study are the SouthEast European countries (The countries taken in consideration areaccording the EBRD definition of South East Europe: Albania,Bulgaria, Romania, Croatia, FR of Macedonia, Bosnia & Herzegovina,Serbia, Montenegro.). Before the transition process from centrallyplanned to market economies, FDI inflows in the region were atminimal levels. At the beginning of the 1990s, the total inflow of FDIin Central and Eastern Europe was less than 1 percent of the worldtotal. By 2008 it had increased significantly to 6.9 percent, suggestingthat the rising share of FDI in the countries’ GDP was a factor helpingthem to integrate into the global economy [9]. The availability ofnatural resources played an important role for the attraction of FDI inthe region at the beginning of the transition, followed by theliberalization of the trade regimes, incentives from governments andprivatization process.
This research is based on the New Paradigm of Development thatintroduced the concept of institutional assets into the eclecticParadigm or OLI Model [10]. As a result of new developments in theworld economy, the content and the quality of the institutions arebecoming more significant components of the competitive advantagesfor the firms and the attractiveness of a particular country’s location.For this very reason, a careful attention is being given to the quality,content and origin of institutions, their instruments and mechanismsof implementation.
This paper adds to the literature on FDI in four main aspects.
First, I attempt to explain the importance of the quality of theinstitutions as the main determinant for attracting FDI in SEE.
Second, I distinguish between privatization and non-privatizationrelated FDI, since FDI is usually time bound, and in most of thesecountries the privatization process is in the process of beingcompleted. The focus of the governments should be on the ability ofthese economies to attract non-privatization related FDI.
Third, traditional variables are used in the analysis such as marketsize, trade openness, exchange rate, cost of labor, infrastructurevariables, but also determinants that remained unnoticed in theexisting literature such as remittances, domestic investment, quality ofinstitutions, presence of foreign banks, and privatization processes.
Finally, the study fills in the existing gap in literature by using theGMM econometric technique for the time frame 1992-2010 for SEE,since other studies may suffer from the endogeneity problems andshort term series issues leading to biased results.
The paper is organized as follows: In section 2, I make a briefliterature review on international trade and FDI, and variouscharacteristics of FDI in SEE are discussed, in section 3 theeconometrical model and empirical approach are introduced, followedby section 4 the empirical results of the study are reported, and section5 concludes.
Literature ReviewIn this section the theoretical base for FDI will be traced. The new
international trade reality poses questions on the explanation of tradeflows between countries, the nature and the extent of gains or lossesfor an economy, and the effects of trade policies. Initially, the pureeconomic theory, the international trade and the theory of the firms
were adopted as theoretical base for empirical studies on FDI flows.The Theory of Absolute Advantage, with the origins in 1876 withAdam Smith, was the first attempt to explain why countries engagefreely in international trade. It was followed by the Theory ofComparative Advantage of David Ricardo which emphasized theconcept of “specialization” by countries, promoting the efficiency inthe production processes, based on the labor theory of values. Thislatter would be redefined in terms of opportunity costs andcomparative advantages for countries, where many of the principles ofthe World Trade Organization are based on the belief of the validity ofthe law of comparative advantage [11].
It was later followed by Factor Proportion Theory or the Theory ofHeckscher Ohlin (H-O) which extended the concept of economicadvantage by considering the endowments and costs of the factors ofproduction. Usually multinational companies use the imperfections inthe market in terms of factors of production and capitalize on theresources of a foreign country creating in this way an opportunities forforeign direct investments.
With the significant technological progress witnessed in the 1960sand the rise of the multinational enterprises, the Product Life CycleTheory of international trade [12] and the Technology Gap Theories[13] were found to be useful for explaining and predictinginternational trade patterns. The essence was that technologicalinnovation and market expansion were critical issues being technologya key factor in creating and developing new products, while marketsize and structure influential in determining the patterns of theinternational trade.
While theories of perfect competition dictate that firms producehomogenous products enjoying the same level of accessing the factorsof production, The Market Imperfections Theory states that firmsconstantly seek market opportunities and their decision to investoverseas is explained as a strategy to capitalize on certain capabilitiesnot shared by competitors in foreign countries [14].
John Dunning developed the International Production Theory,addressing the reasons why foreign production is considered the mostdesirable means of harnessing the firms’ advantage, explaining that notonly resource differentials and the advantages of the firm play a part indetermining overseas investment activities, but foreign governmentactions may significantly influence the piecemeal attractiveness andentry conditions for international firms.
To explain the behavior of MNCs, Dunning [15] developed theEclectic Paradigm of OLI Theory, which largely dominated thethinking in the 1970s and early 1980s. According to this latter theory, aforeign firm must own three advantages over local firms in order todecide to take an FDI, each represented by one of the letters: O(Ownership); L (Location); and I (Internalization).
However, adapting to fast globalization patterns, new developmentthinking started for the world economy with The New Paradigm ofDevelopment (NPD), after the post-1980 liberalization of markets andtechnological, information and knowledge advances in cross bordertransportation and communication. As a result of new developmentsin the world economy, the content and the quality of the institutionshave become very important components of both competitiveadvantages of firms and the location attractions of countries. The NPD[16] explains that shifts in economic ideology, recent advances intechnology, and new insights into the determinants of growth haveshown that however necessary the three determinants Resources(R),Capabilities(C) and Markets (M) may be for the competitiveness of
Citation: Valbona Zeneli (2014) The Role of Institutions and Good Governance for Attracting Foreign Direct Investments: Evidence fromSoutheast Europe. Bus Eco J 5: 92. doi:10.4172/2151-6219.100092
Page 2 of 20
Bus Eco JISSN:2151-6219 BEJ, an open access journal
Volume 5 • Issue 2 • 100092
firms and for the growth of host countries, they may not be a sufficientcondition anymore. For this reason a very careful attention needs to begiven to the quality, content and origin of institutions, theirinstruments and mechanisms of implementation. This is why Dunningincorporates institutions in NPD, as a variable that both influences theextent, content and quality of (R), (C) and (M) and is influenced bythem. My research was mainly based in this recent theory.
The general proposition would be that the more the institutionsfavor a particular location, the more the MNCs will choose to create oradd value to their global ownership specific advantages to thatlocation. From this perspective host countries’ governments have ahuge responsibility to ensure that institutions and societal entities arebest able to create, organize and utilize the resources, capacities andmarkets available to them and at the same time supplement the foreigninvestors in order to create a structure of value adding activities [17].According to this new theory, institutions are seen as ‘sets of commonhabits, routines, established practices, rules and laws that regulate theinteraction between individuals and groups’. They create the milieuwithin which innovation is undertaken; establish the ground rules forinteraction between economic actors and represent the economicculture of the country.
Many scholars believe that governments are essential to promotinginter-linkages between the elements of absorptive capacity and tocreating the opportunities for economic actors to absorb andinternalize spillovers, arguing even that efficient institutionscontribute more to economic growth than location or trade [18].Among others there is a strong contribution of the three NobelLaureates- Amartya Sen [19], Joseph Stiglitz [20] and Douglas North(1990, 1994, 1999, and 2005) on the importance of the institutions asone the critical determinants for the international trade and economicdevelopment.
Theoretical determinants for the attraction of foreign directinvestments
Theories suggest a set of host-specific location determinantsattributing to the uneven distribution of FDI flows across countries.However, FDI inflows depend usually on four main types of motivesfor the activities of multinationals and their interest in variousmarkets: resource seeking, market seeking, efficiency seeking andstrategic assets seeking [21,22]. On the basis of location of productionsectors, FDI could also be categorizes as vertical or horizontal. Forhorizontal FDI, the size and the purchasing power of the local marketare very important. A horizontal model of MNCs is the one withmultiple production facilities producing homogeneous goods,functioning on the key assumption of the presence of economies ofscale, a source of competitive advantage over the domestic firms [23].On the other side, investors interested in vertical FDI would pay moreattention to the costs of the factors associated to their investment sincethey would always have the objective to minimize their cost factors. Athird type of FDI is known as the Knowledge-Capital Model, as anintegration of horizontal and vertical models in the sense that botheconomies of scale and factor price differences play an important role[24-26].
Location-specific attractiveness in the form of political andeconomic stability, property and profit tax system, market size, labor-force composition, geographic proximity, competition, freedom ofentry and exit from markets, domestic financial markets, are all factorsinfluencing the volume and the type of FDI. In addition, energy and
water resources, transportation and telecommunication infrastructureare some other critical elements having a huge influence in theattraction of FDI. Country specific characteristics determining theattractiveness for foreign investors also include the openness of aneconomy and the extent to which it is multicultural and tolerant ofdifferent belief systems and ready to assimilate the positiveinstitutional practices of other countries. The stage of economic andsocial development is very important because it affects the quality ofits supportive institutional infrastructure. The institutional demandsof a particular industrial entity such as the size, the culture towardswealth creation and entrepreneurship, the extent and seriousness of itssocial unrest or social dysfunction, and the extent of democracy andfreedom of action on business practices, are all key factors governingthe decision making concerning FDI. Other specific assets might beimposed by the home or host country governments or supranationalentities, such as patents protection, banking regulations, transparencyregarding bribery and corruption, safety procedures, environmentprotections and so on.
The human capital stock has also a very significant value. Labor hasto be sufficiently educated and trained to absorb and use newtechnology and serve as an infrastructure to meet FDI needs in thehost countries. Human capital stock in developing countries becomesa prerequisite to take advantage of and absorb such advancedtechnologies to achieve economic growth [3].
Empirical literature reviewIn the empirical literature only few studies focus on FDI inflows
Eastern Europe. In particular the region of SEE has attracted littleattention, because of the low level of FDI. Of over 60 empirical studiesreviewed only a few of them cover this region. Studies include Culem[27], Bevan and Estrin [28], De Mello [29] who presents a summary ofcase studies, among others.
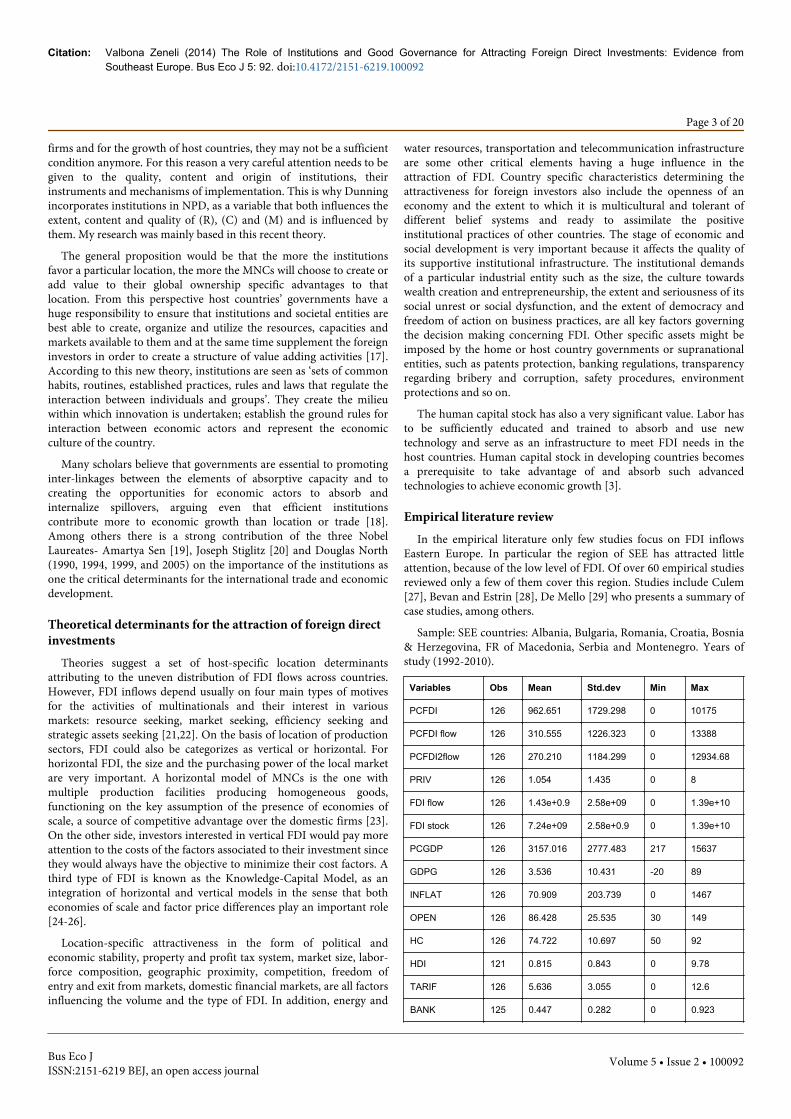
Sample: SEE countries: Albania, Bulgaria, Romania, Croatia, Bosnia& Herzegovina, FR of Macedonia, Serbia and Montenegro. Years ofstudy (1992-2010).
Variables Obs Mean Std.dev Min Max
PCFDI 126 962.651 1729.298 0 10175
PCFDI flow 126 310.555 1226.323 0 13388
PCFDI2flow 126 270.210 1184.299 0 12934.68
PRIV 126 1.054 1.435 0 8
FDI flow 126 1.43e+0.9 2.58e+09 0 1.39e+10
FDI stock 126 7.24e+09 2.58e+0.9 0 1.39e+10
PCGDP 126 3157.016 2777.483 217 15637
GDPG 126 3.536 10.431 -20 89
INFLAT 126 70.909 203.739 0 1467
OPEN 126 86.428 25.535 30 149
HC 126 74.722 10.697 50 92
HDI 121 0.815 0.843 0 9.78
TARIF 126 5.636 3.055 0 12.6
BANK 125 0.447 0.282 0 0.923
Citation: Valbona Zeneli (2014) The Role of Institutions and Good Governance for Attracting Foreign Direct Investments: Evidence fromSoutheast Europe. Bus Eco J 5: 92. doi:10.4172/2151-6219.100092
Page 3 of 20
Bus Eco JISSN:2151-6219 BEJ, an open access journal
Volume 5 • Issue 2 • 100092

PCREDIT 126 32.008 19.342 3 76
TEL LINE 126 22.446 11.507 1.2 45
INFRAS 126 2.057 0.693 1 3.33
RESOURC 126 15.252 7.551 4 54.4
INVEST 126 21.217 5.462 8.4 37.8
REM 126 8.437 9.977 0 49.7
INSTU 126 2.642 0.682 1.11 4.9
CORRUP 126 2.372 1.446 0 4.4
ERI 126 2.666 0.672 1.22 3.55
MTR 126 3.056 0.693 0.55 3.88
FSR 126 2.118 0.692 1 3.5
LSP 126 2.582 0.890 1 4
SSP 126 3.428 0.745 1 4.33
ER 126 2.023 0.587 1 3
PL 126 3.840 0.707 1 4.33
TFS 126 3.644 0.968 1 4.33
CP 126 1.743 0.639 1 3
BRIRL 126 2.458 0.839 1 4
SMNBFI 126 1.783 0.611 1 3
Table 1: Summary statistics PANEL DATA.
Wang and Swain [30] explored the factors that explain FDI inflowinto Hungary and China during 1978-1992, using the OLS (OrdinaryLeast squares) estimation method. The finding of their study suggestedthat the size of the market and the cost of capital significantly affectFDI inflows. Little support was founded in their study about the tariffbarriers and import variables.
Lankes and Venables [31] is an important paper that analyzes thedeterminant of FDI inflows, based on a survey of 117 managers ofWestern firms that were investors or potential investors in the Regionof East Europe. The results of the work indicate that the progress oftransition, the political stability, new market opportunities and risklevels were important management decisions about investment in thisregion.
Holland and Pain [32] studied the determinants of FDI to elevenCentral European economies during the period 1992 to 1996 using apanel data (Table 1). The paper finds that the method of privatization,labor costs, trade linkages and proximity to the European Union areimportant for FDI inflows.
Resmini [33] used a unique panel data (Table 1) set on the sectorlevel to study determinants of FDI in eleven CEE economies during1990-1995. The study concentrates on the manufacturing sector andthe results suggest that FDI inflows are determined primarily bymarket variables such as population and GDO per capita.
Bevan and Estrin [34] studied the FDI inflows to transitioncountries using panel data (Table 1). Their worked aimed to identify
FDI inflows from 18 individual source countries to ten CEE economiesand Ukraine for the period 1994-1998. The paper finds that FDIinflows are significantly affected by market size, distance, risk andlabor costs.
Botric and Skuflic [35] analyze FDI determinants in South Europeancountries during the period 1996-2002, using GLS regression analysison a pooled sample. Their study showed that openness andinfrastructure exerts a positive influence on FDI, but the study did notfind any significant effect on the market seeking determinants such asGDP per capita, GDP growth or population.
Cartesen and Toubal [36] studied the FDI inflows to eighteconomies during the period 1993-1999, using a dynamic panel data(Table 1), exactly the Generalized Method of Moments (GMM)estimation technique. The results indicate that market size, the methodof privatization and country risk affect significantly the volume of FDIinflows.
Campos and Kinoshota [37] examined the FDI determinantsanalyzing 25 transitional countries and using a panel data (Table 1),based on GMM estimation Technique. This paper stressed theimportance of institutions and natural resource abundance in foreigninvestor’s location decisions.
Demekas et al. [38] tried to explain FDI inflows in to SEE countriesby using the gravity equation. They find that FDI allocation acrosscounties is explained in terms of macroeconomic and initial conditionvariables. Their second paper focuses on non-privatization FDI andfind evidence of non-linearity's, with the impact of policies changingabove a certain level of income.
Foreign direct investments in south east EuropeFDI has been vital for the smooth transition process in Eastern
Europe, helping the economic development of the region and creatingjobs and employment, followed by higher wages and better livingconditions. FDI has played a significant role in replacing most of theoutdated capital stock and shifting production toward goods andservices both for the domestic consumption and exports. It has beenan important tool for resource transfer, not only capital, but alsotechnological and managerial knowledge, translating into higher GDPper capita for these countries.
Some compelling questions are raised regarding FDI in our regionof research interest. What is the distribution of FDI inflows in theSouth European countries? Which economies have been mostsuccessful in attracting FDI? What are the factors that determine thevolume of FDI inflow that these countries receive? What type of FDIdo we notice in SEE countries? Are they market seeking investmentslooking for big markets and satisfying the local demand for goods andservices? Are they resource-seeking FDI with the objective ofexploiting natural resources? Are there specific conditions oftransition countries that play an important role for the attraction ofFDI? Is there any connection between the privatization process andFDI?
Inflows of FDI began to run into Southeastern Europe at thebeginning of the 1990s, as a result of the transition of these countriesto the free market economy, which created new opportunities forforeign investors. At the beginning, the availability of natural resourceshas played a very important role on the attraction of FDI in the region.Later, the liberalization of the trade regimes and price systems, as well
Citation: Valbona Zeneli (2014) The Role of Institutions and Good Governance for Attracting Foreign Direct Investments: Evidence fromSoutheast Europe. Bus Eco J 5: 92. doi:10.4172/2151-6219.100092
Page 4 of 20
Bus Eco JISSN:2151-6219 BEJ, an open access journal
Volume 5 • Issue 2 • 100092

as the incentives offered by the host countries governments stimulatedmore attraction of FDI, alongside with a large privatization process.
The Euro-Atlantic integration process of most SEE countriesincreased the importance of these economies in the internationalmarket and increased the confidence of serious investors in thestability of the business environment. During this process, countrieswere introduced step by step into the free trade zone representing anintermediary phase towards complete accession to EU. The economicintegration positively influenced the inflows of FDI in the region,through a perceived decreased risk on the investments, improvementof the business climate, reformation and harmonization of thecountries’ legislative regulations with the EU regulations. Importantly,agreements for EU accession allow free market access for foreigninvestors to new and bigger European markets.
There is empirical evidence from the region, that FDI geographicdistribution is strongly influenced by the host country's political andinstitutional quality, because it reflects the foreign investors’confidence on the local investment environment. Political stability,favorable regulations, rule of law are among the main considerationsof foreign investors.
SEE offers unique opportunities for foreign investors in terms ofmarket size, strategic position, trade openness, natural resources,flexible low cost labor force, investment incentives and tax regimes.However, FDI inflows remain low in the global context, with thelowest level in Albania with 1462 US dollars per capita andMontenegro the highest with 9178 US dollars per capita in 2011 (SeeUNCTAD, 2012).
Among the main concerns that serious potential investors haveexpressed are: unfinished transition process for most of the countries,political and institutional instability in the region, underdevelopmentof the market economy, non-sufficient infrastructure, superficialinstitutional reforms, rampant corruption, lack of transparency in theprivatization process, and overwhelming regulations andadministrative procedures. Foreign investors and internationalinstitutions also raise concerns about the quality of education andprofessional training in SEE, not only because of inadequate publicexpenditures but also because of institutional weaknesses in theformulation and implementation of good policies.
Model and MethodologyTo understand the relationship between the preferences of foreign
investors for the host country characteristics and their contribution tothe distribution of FDI in SEE a panel data (Table 1) has beenconstructed covering eight countries (Albania, Bosnia & Herzegovina,Bulgaria, FYR of Macedonia, Croatia, Romania, Serbia andMontenegro) within the timeframe 1992-2010. The number of thepanel observations is 126 (18×7) (For the purpose of data availabilityuntil 2006 we consider the two different countries, Serbia andMontenegro as one.)
Yit= βXit+ Δ Zi, t+ µit (1.1)
µit= vi+ εit (1.2)
Yit is the FDI per capita in country (i) in the year (t). Xit is a vectorof macroeconomic and general explanatory variables listed in the nextsection and Zi, t the vector of institutional reforms explanatoryvariables. The error term µit contains two components, theunobservable country effect vi and the white noise εit. In addition tothe standard variables our model on the right side will further propose,an agglomeration effect of FDI which is captured by introducing aone-year lagged stock of FDI per capita, and also the one-year laggedindexes of reforms we took in consideration, of the three variables thatshow the quality of the institutions. This model was used for twodifferent dependent variables, making a research distinction betweenthe total inflows of FDI and Non-privatization related FDI.
The new model will be:
Yi,t= β0+β1Yi,t-1+β2Xi,t+β3Zi,t+β4Zi,t-1+µit (1.3)
In this equation, a positive β1 would be taken as indication of theagglomeration effect. In order to have consistent estimations, GMMGeneralized Method of Moments has been used, a model proposed byArellano and Bond [39] in the context of the endogeneity problem.This is a well-known concern in the empirical literature, since some ofthe regressors may be potentially endogenous or predetermined indetermining FDI flows. For example FDI may be attracted to a countrythat has a more liberalized financial system, but at the same time thefinancial system may be enhanced by the presence of FDI [40].
The variables in Xit are assumed to be endogenous. Becausecausality may run in both directions, from capital inflows toinvestment and vice versa, these regressors may be correlated with theerror term. This model has proved in the past that valid instrumentscan be obtained in a dynamic panel model if one utilizes theorthogonality conditions that exist between lagged values of Yit, Xit,and the disturbance εit. Under this approach, the new equation will befirst-differenced to eliminate the country-specific effect.
Δ Yit= β1ΔYi,t-1+ β2Δ Xit+ β3Δ Zi, t+ β4Δ Zi, t-1+ Δ εit
Since Δ Yi,t-1 is correlated with Δ εit, OLS estimates are biased.According to Arellano and Bond (1991), the valid instruments for ΔYi,t-1 are all the lagged levels of Yi,t, Yi,t-s, where s ≥ 2.
The model can be estimated in one stage or in two stages of GMM.In this research just the one stage estimates will be used, since Arellanoand Bond (1991) warns caution against interpretation on coefficientswithin the two stages, due to an underestimation of the standard errorof the coefficients.
To check for the robustness of the model two specification testshave been conducted, to check the validity of the lagged instruments aswell as the appropriateness of the model. These tests are namely: theSOC test, the Arellano and Bond test of second order correlation in thefirst-differenced error terms and the Sargan Test of over identificationwhich tests for correlation between instruments that are excludedfrom the second-stage model and the residuals.
The main objective of this research paper is to explain the rationalefor FDI attraction in SEE. Variables used, denomination and thesources of date are presented in Table 2.
Variable Definition Source
PCFDI flow Flow of per capita total FDI UNCTAD World Development Indicator onlinedatabase
Citation: Valbona Zeneli (2014) The Role of Institutions and Good Governance for Attracting Foreign Direct Investments: Evidence fromSoutheast Europe. Bus Eco J 5: 92. doi:10.4172/2151-6219.100092
Page 5 of 20
Bus Eco JISSN:2151-6219 BEJ, an open access journal
Volume 5 • Issue 2 • 100092
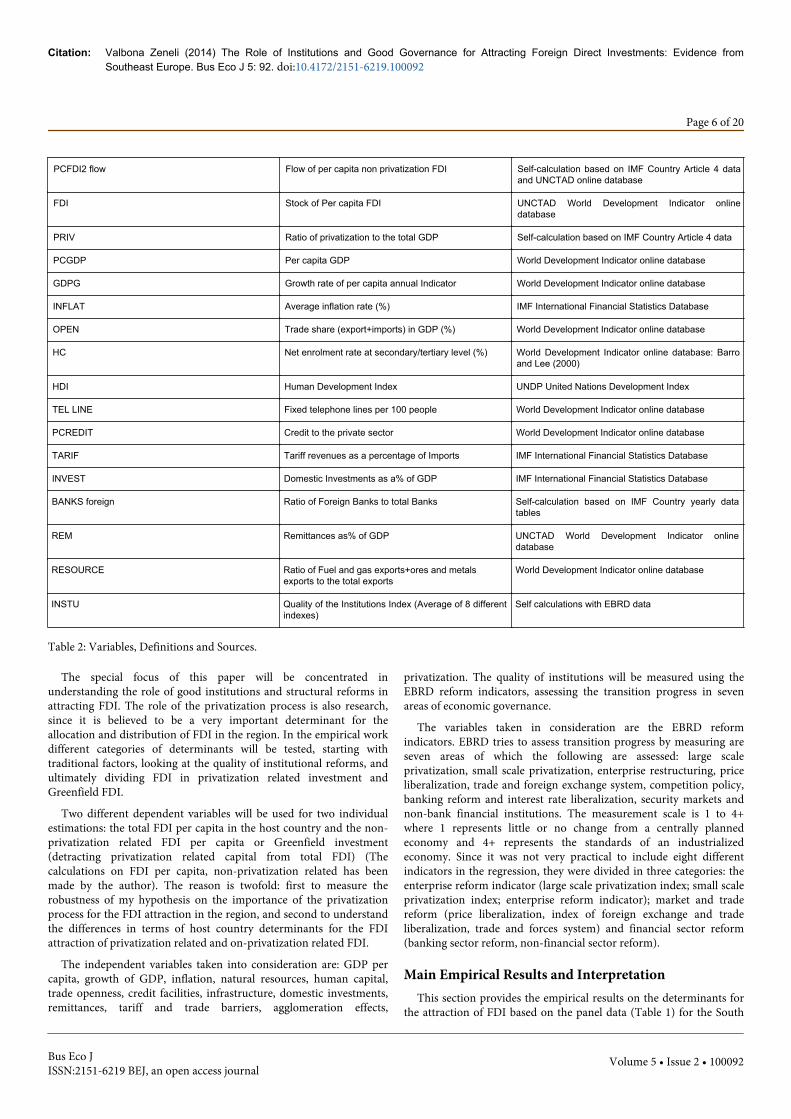
PCFDI2 flow Flow of per capita non privatization FDI Self-calculation based on IMF Country Article 4 dataand UNCTAD online database
FDI Stock of Per capita FDI UNCTAD World Development Indicator onlinedatabase
PRIV Ratio of privatization to the total GDP Self-calculation based on IMF Country Article 4 data
PCGDP Per capita GDP World Development Indicator online database
GDPG Growth rate of per capita annual Indicator World Development Indicator online database
INFLAT Average inflation rate (%) IMF International Financial Statistics Database
OPEN Trade share (export+imports) in GDP (%) World Development Indicator online database
HC Net enrolment rate at secondary/tertiary level (%) World Development Indicator online database: Barroand Lee (2000)
HDI Human Development Index UNDP United Nations Development Index
TEL LINE Fixed telephone lines per 100 people World Development Indicator online database
PCREDIT Credit to the private sector World Development Indicator online database
TARIF Tariff revenues as a percentage of Imports IMF International Financial Statistics Database
INVEST Domestic Investments as a% of GDP IMF International Financial Statistics Database
BANKS foreign Ratio of Foreign Banks to total Banks Self-calculation based on IMF Country yearly datatables
REM Remittances as% of GDP UNCTAD World Development Indicator onlinedatabase
RESOURCE Ratio of Fuel and gas exports+ores and metalsexports to the total exports
World Development Indicator online database
INSTU Quality of the Institutions Index (Average of 8 differentindexes)
Self calculations with EBRD data
Table 2: Variables, Definitions and Sources.
The special focus of this paper will be concentrated inunderstanding the role of good institutions and structural reforms inattracting FDI. The role of the privatization process is also research,since it is believed to be a very important determinant for theallocation and distribution of FDI in the region. In the empirical workdifferent categories of determinants will be tested, starting withtraditional factors, looking at the quality of institutional reforms, andultimately dividing FDI in privatization related investment andGreenfield FDI.
Two different dependent variables will be used for two individualestimations: the total FDI per capita in the host country and the non-privatization related FDI per capita or Greenfield investment(detracting privatization related capital from total FDI) (Thecalculations on FDI per capita, non-privatization related has beenmade by the author). The reason is twofold: first to measure therobustness of my hypothesis on the importance of the privatizationprocess for the FDI attraction in the region, and second to understandthe differences in terms of host country determinants for the FDIattraction of privatization related and on-privatization related FDI.
The independent variables taken into consideration are: GDP percapita, growth of GDP, inflation, natural resources, human capital,trade openness, credit facilities, infrastructure, domestic investments,remittances, tariff and trade barriers, agglomeration effects,
privatization. The quality of institutions will be measured using theEBRD reform indicators, assessing the transition progress in sevenareas of economic governance.
The variables taken in consideration are the EBRD reformindicators. EBRD tries to assess transition progress by measuring areseven areas of which the following are assessed: large scaleprivatization, small scale privatization, enterprise restructuring, priceliberalization, trade and foreign exchange system, competition policy,banking reform and interest rate liberalization, security markets andnon-bank financial institutions. The measurement scale is 1 to 4+where 1 represents little or no change from a centrally plannedeconomy and 4+ represents the standards of an industrializedeconomy. Since it was not very practical to include eight differentindicators in the regression, they were divided in three categories: theenterprise reform indicator (large scale privatization index; small scaleprivatization index; enterprise reform indicator); market and tradereform (price liberalization, index of foreign exchange and tradeliberalization, trade and forces system) and financial sector reform(banking sector reform, non-financial sector reform).
Main Empirical Results and InterpretationThis section provides the empirical results on the determinants for
the attraction of FDI based on the panel data (Table 1) for the South
Citation: Valbona Zeneli (2014) The Role of Institutions and Good Governance for Attracting Foreign Direct Investments: Evidence fromSoutheast Europe. Bus Eco J 5: 92. doi:10.4172/2151-6219.100092
Page 6 of 20
Bus Eco JISSN:2151-6219 BEJ, an open access journal
Volume 5 • Issue 2 • 100092

European countries during the period 1992-2010 using GMMestimation. The results are presented at the tables. The results arepresented at the tables at the end of the section. The Sargan test and
the Second order correlation test (SOC) are reported in the last rows ofeach table we are presenting.
Dependent Variable: Flows of FDI per capita (Total flows)
1 2 3 4 5 6 7 8 9 10
PCGDP 0.293
(0.383)
0.546
(0.414)
0.614
(0.411)
0.614
(0.414)
1.064
(0.435)**
1.282
(0.436)***
1.269
(0.444)***
0.931
(0.489)**
0.869
(0.485)*
0.783
(0.496)*
GDPG 0.159
(0.117)
0.104
(0.121)
0.087
(0.120)
0.086
(0.123)
0.137
(0.121)
0.104
(0.119)
0.104
(0.120)
0.065
(0.121)
0.061
(0.120)
0.118
(0.136)
INFLAT -0.012
(0.072)
-0.018
(0.072)
-0.015
(0.071)
-0.016
(0.102)
0.046
(0.076)
0.088
(0.080)
0.087
(0.081)
0.072
(0.080)
0.076
(0.080)
0.032
(0.087)
OPEN 0.730
(0.448)*
1.086
(0.470)**
1.084
(0.475)**
1.726
(0.516)***
1.762
(0.582)***
1.765
(0.587)***
1.451
(0.611)**
1.237
(0.627)**
1.245
(0.637)**
HDI -7.795
(3.364)**
-7.821
(3.427)**
-3.413
(3.689)
-1.251
(3.678)
-1.187
(3.719)
-0.195
(3.743)
0.067
(3.704)
2.146
(3.915)
TEL LINES -0.0172
(0.341)
-0.243
(0.342)
-0.320
(0.344)
-0.295
(0.376
-0.418
(0.322)*
-0.419
(0.377)
-0.509
(0.395)
PCREDIT -0.612
(0.214)***
-0.629
(0.214)***
-0.614
(0.228)***
-0.464
(0.244)*
-0.562
(0.254)*
-0.632
(0.263)**
BANK foreign 0.398
(0.188)**
0.383
(0.192)**
0.349
(0.190)*
0.274
(0.196)
0.325
(0.224)
RESOURC -0.036
(0.183)
-0.099
(0.185)
-0.135
(0.184)
-0.170
(0.190)
TARIF -0.123
(0.141)
-0.149
(0.141)
-0.200
(0.166)
DI 0.923
(0.735)
1.155
(0.752)
REM 0.009
(0.108)
INSTU t-1 0.500
(0.175)**
0.515
(0.174)***
0.493
(0.173)***
0.495
(0.178)***
0.516
(0.74)***
0.507
(0.170)***
0.499
(0.177)***
0.497
(0.174)***
0.366
(0.201)**
0.371
(0.204)**
FDI t-1 0.250
(0.152)*
0.253
(0.151)*
0.283
(0.150)
0.279
(0.169)*
0.215
(0.167)
0.220
(0.169)
0.221
(0.170)
0.172
(0.172)
0.204
(0.171)
0.031
(0.212)
Constant 0.214
(0.069)***
0.161
(0.075)**
0.203
(0.077)***
0.205
(0.085)**
0.206
(0.083)**
0.152
(0.084)*
0.155
(0.086)*
0.172
(0.086)**
0.152
(0.086)*
0.138
(0.088)
Obs 78 78 78 78 78 74 74 73 73 69
Sargan Test 0.997 0.997 0.999 0.999 0.999 1 1 1 1 1
SOC Test 0.396 0.419 0.501 0.503 0.339 0.187 0.186 0.154 0.165 0.144
Table 3: Determinants of FDI- Institutions and Agglomeration effect. Notes: 1. All regression is estimated by GMM Arrellano Bond (one-step)estimator. 2. All the variables are expressed in natural log (ln). Standard errors are reported in parentheses. (***), (**), and (*) indicate coefficientsignificant at 1, 5 and 10 % respectively. 3. Sargan Test (p-value, Prob >chi2): null hypothesis is no misspecification with the instrument sets, sothat the instruments are not correlated with the residuals. 4. SOC test (p-value): Arrellano and Bond Test with null hypothesis of no second-order correlation in differenced term errors, so that the errors in the first difference regression exhibit no second order serial correlation.
Citation: Valbona Zeneli (2014) The Role of Institutions and Good Governance for Attracting Foreign Direct Investments: Evidence fromSoutheast Europe. Bus Eco J 5: 92. doi:10.4172/2151-6219.100092
Page 7 of 20
Bus Eco JISSN:2151-6219 BEJ, an open access journal
Volume 5 • Issue 2 • 100092
Estimations in Table 3 show the results of the research, with thefirst columns designed to include the effects of the traditionaldeterminants for FDI inflows based in the Gravity Theory, and in theother columns, the other variables are added one by one to theestimations in order to capture the effect of each of those.
In this research the most important variable to be explored is thequality of the institutions. First the effect of the institutional reforms asa whole (INSTU) were be measured, represented by one variable; laterin this paper the variable was decomposed to see the specificimportance and effects. The lagged value of the institutional variableswas used, since the effects of reforms are not shown immediately.
Across all specifications from Column (1) through column (10), thequality of institutional reforms is notably significant and positive. Itranges between 0.37 and 0.516 with a majority staying around 0.5indicating a well-founded effect of the quality of the institutions forattraction of FDI inflows. The positive and strongly significantcoefficients confirm our main hypothesis and both the Sargan andSOC tests show that instruments are valid throughout the regressions.
The other variables taken in consideration are explained as follows.To be consistent with the Theoretical Gravity Model, whichconsistently explains about 60% of aggregate FDI stocks or flows,regardless the region, GDP per capita representing the existingdemand in the economy and Growth of GDP, representing thepotential for future demand in the market, being an indicator ofprofitability for companies, are used.
The positive and significant coefficient of per capita GDP indicatesthat a host country with a higher degree of market demand is moreattracted to foreign investors, providing empirical ground for thetheory of market seeking (horizontal) FDI.
The growth of GDP has a positive coefficient in all specifications,but not significant, and this empirical result is also known in theliterature. Growth is important, because higher rates of economicgrowth are usually associated with an increase of the profitability ofthe corporations, but also is a signal of economic stability andfavorable investment climate.
Inflation is another determinant for consideration, which exertsnegative influence on the profitability of FDI, since it increases theuser cost of capital but also increases macroeconomic instability in thehost country. In this research, the relationship is not stable (positive ornegative) and not significant, the reason could lay on the fact that thepanel taken in examination is made of transition countries fromcentrally planned to market economy and inflation oscillations wereexpected in the first years.
The variable trade openness, measures trade as a percentage of GDPand as expected this variable has a positive effect on FDI inflows,resulting significant and positive in all the estimations. This result istheoretically sound, identifying the magnitude of trade liberalizationand especially important for efficiency and market seeking FDI.
Human capital, theoretically a very important factor for theattraction of FDI, especially the low cost of labor, is considered to be astrong comparative advantage for developing countries. However, inseveral studies, labor costs are not always found to be significant, duein part to the difficulties in accurately measuring productivitydifferentials, and also because low wages do not necessarily reflect lowproduction costs since labor productivity may be low too . Instead, theskilled labor is becoming among the investor’s top considerations inthe decisions of location. For this reason, the variable of Human
Development Index (HDI) (HDI combines indicators of threedimensions of human development as: a long and healthy lifemeasured by life expectancy at birth, knowledge measured by the adultliteracy rate and combined gross enrollment ratios for primarysecondary and tertiary schooling), and a decent standard of livingmeasured by GDP per capita.
HDI is measured by UNDP as (1/3 life expectancy index +1/3education index +1/3 GDP index). Education index itself is measuredas (2/3 adult literacy rate +1/3 combined gross enrollment index)) isintroduced in this research. Throughout the estimations, humancapital does not appear to be stable and significant, evidentially beingnot so important determinant for foreign investors who are interestedin SEE.
The variable pertaining to natural resources, an importantcharacteristic especially for resource-driven FDI, taking as a proxy thepercentage of fuels and natural gas and the percentage of ores andmetal in total exports has a negative and significant coefficient. Thisshows that the abundance of natural resources is not a significantdriver for FDI in the SEE. Statistical data reveal that in the recent yearsin SEE, the exports of natural resources have decreased, when at thesame time the level of FDI inflows has continued to increase.
Tariffs, have a negative sign as expected but not significant. In thiscase it could be argued that lower taxes tend to attract more FDI,particularly vertical FDI. The literature suggests that trade barriersattract horizontal FDI and deter vertical FDI. Lower tariff rates help toreduce trade barriers, which mean a less restrictive trade environment.The insignificance of this variable could be explained with thecaptured of the effect from the variable trade openness.
The infrastructure, represented by the (fixed telephone lines per 100people) has a negative but insignificant sign, opposing to what thetheory suggests according to which a sound infrastructure is anadvantage for the foreign investors. The reason for these results couldlay on the variable used, since the expansion of high tech and moreadvanced communication technologies in all these countries such asmobile phones or internet.
The variable domestic investment, measured by domestic privateinvestments as a percentage of GDP has a positive and significant sign,showing that the relationship between FDI and domestic investment iscomplementary.
Credit Facilities are represented in these estimations by twovariables such as private credit measured by the credit of the domesticbanking sector to the private business and foreign banks measured bythe ratio of foreign banks to the total of the banking system in the hostcountry. Private credit has a negative and significant sign as expected.Recalling the theory, this means that FDI are a major source of capitalaccumulation in the countries taken in examination. The variableforeign banks are positive and significant, as expected, positivelyinfluencing the FDI attraction, as a signal of stability and marketsecurity.
The variable, remittances, measured as a percentage of GDP showsa negative sign, but not significant. Usually in the literature, thevariable emerges positively since remittances are expected to capturethe market-seeking motivation of FDI as major source of income forthe region’s population. At the same time this could be a source fordomestic investments, making in this case the relationship not clear.
The agglomeration effect is investigated in these estimations and itis noticed that the lagged value of the stock of FDI is positive and
Citation: Valbona Zeneli (2014) The Role of Institutions and Good Governance for Attracting Foreign Direct Investments: Evidence fromSoutheast Europe. Bus Eco J 5: 92. doi:10.4172/2151-6219.100092
Page 8 of 20
Bus Eco JISSN:2151-6219 BEJ, an open access journal
Volume 5 • Issue 2 • 100092
significant in the first four columns, later it loses significance but notthe sign, probably because of the correlation with the other variablestaken in consideration. Since FDI is considered a long term capital thatis irreversible in the short term, foreign investors are really verycautious about their investment location choice.
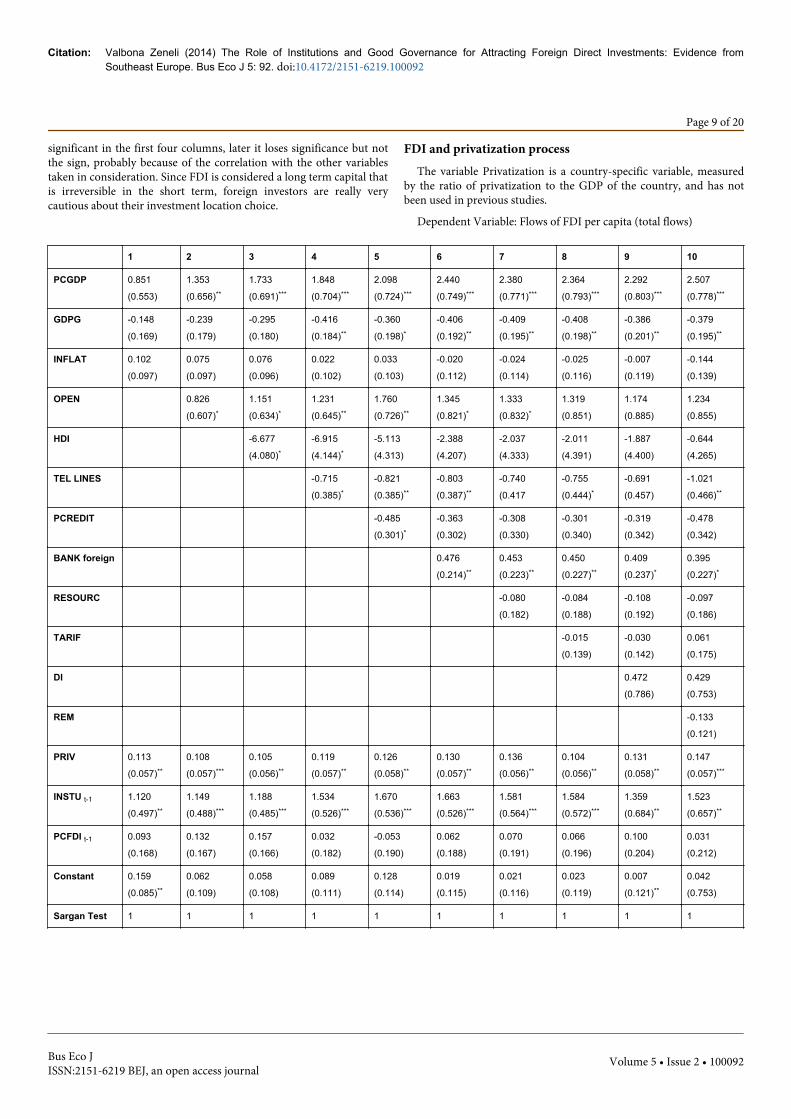
FDI and privatization processThe variable Privatization is a country-specific variable, measured
by the ratio of privatization to the GDP of the country, and has notbeen used in previous studies.
Dependent Variable: Flows of FDI per capita (total flows)
1 2 3 4 5 6 7 8 9 10
PCGDP 0.851
(0.553)
1.353
(0.656)**
1.733
(0.691)***
1.848
(0.704)***
2.098
(0.724)***
2.440
(0.749)***
2.380
(0.771)***
2.364
(0.793)***
2.292
(0.803)***
2.507
(0.778)***
GDPG -0.148
(0.169)
-0.239
(0.179)
-0.295
(0.180)
-0.416
(0.184)**
-0.360
(0.198)*
-0.406
(0.192)**
-0.409
(0.195)**
-0.408
(0.198)**
-0.386
(0.201)**
-0.379
(0.195)**
INFLAT 0.102
(0.097)
0.075
(0.097)
0.076
(0.096)
0.022
(0.102)
0.033
(0.103)
-0.020
(0.112)
-0.024
(0.114)
-0.025
(0.116)
-0.007
(0.119)
-0.144
(0.139)
OPEN 0.826
(0.607)*
1.151
(0.634)*
1.231
(0.645)**
1.760
(0.726)**
1.345
(0.821)*
1.333
(0.832)*
1.319
(0.851)
1.174
(0.885)
1.234
(0.855)
HDI -6.677
(4.080)*
-6.915
(4.144)*
-5.113
(4.313)
-2.388
(4.207)
-2.037
(4.333)
-2.011
(4.391)
-1.887
(4.400)
-0.644
(4.265)
TEL LINES -0.715
(0.385)*
-0.821
(0.385)**
-0.803
(0.387)**
-0.740
(0.417
-0.755
(0.444)*
-0.691
(0.457)
-1.021
(0.466)**
PCREDIT -0.485
(0.301)*
-0.363
(0.302)
-0.308
(0.330)
-0.301
(0.340)
-0.319
(0.342)
-0.478
(0.342)
BANK foreign 0.476
(0.214)**
0.453
(0.223)**
0.450
(0.227)**
0.409
(0.237)*
0.395
(0.227)*
RESOURC -0.080
(0.182)
-0.084
(0.188)
-0.108
(0.192)
-0.097
(0.186)
TARIF -0.015
(0.139)
-0.030
(0.142)
0.061
(0.175)
DI 0.472
(0.786)
0.429
(0.753)
REM -0.133
(0.121)
PRIV 0.113
(0.057)**
0.108
(0.057)***
0.105
(0.056)**
0.119
(0.057)**
0.126
(0.058)**
0.130
(0.057)**
0.136
(0.056)**
0.104
(0.056)**
0.131
(0.058)**
0.147
(0.057)***
INSTU t-1 1.120
(0.497)**
1.149
(0.488)***
1.188
(0.485)***
1.534
(0.526)***
1.670
(0.536)***
1.663
(0.526)***
1.581
(0.564)***
1.584
(0.572)***
1.359
(0.684)**
1.523
(0.657)**
PCFDI t-1 0.093
(0.168)
0.132
(0.167)
0.157
(0.166)
0.032
(0.182)
-0.053
(0.190)
0.062
(0.188)
0.070
(0.191)
0.066
(0.196)
0.100
(0.204)
0.031
(0.212)
Constant 0.159
(0.085)**
0.062
(0.109)
0.058
(0.108)
0.089
(0.111)
0.128
(0.114)
0.019
(0.115)
0.021
(0.116)
0.023
(0.119)
0.007
(0.121)**
0.042
(0.753)
Sargan Test 1 1 1 1 1 1 1 1 1 1
Citation: Valbona Zeneli (2014) The Role of Institutions and Good Governance for Attracting Foreign Direct Investments: Evidence fromSoutheast Europe. Bus Eco J 5: 92. doi:10.4172/2151-6219.100092
Page 9 of 20
Bus Eco JISSN:2151-6219 BEJ, an open access journal
Volume 5 • Issue 2 • 100092

SOC Test 0.515 0.588 0.521 0.501 0.540 0.9953 0.986 0.998 0.979 0.949
Table 4: Determinants of FDI- Privatization. 1. All regression is estimated by GMM Arrellano Bond (one-step) estimator. 2. All the variables areexpressed in natural log (ln). Standard errors are reported in parentheses. (***), (**), and (*) indicate coefficient significant at 1, 5 and 10 %respectively. 3. Sargan Test (p-value, Prob >chi2): null hypothesis is no misspecification with the instrument sets, so that the instruments are notcorrelated with the residuals. 4. SOC test (p-value): Arrellano and Bond Test with null hypothesis of no second-order correlation in differencedterm errors, so that the errors in the first difference regression exhibit no second order serial correlation.
Table 4 presents the results of the estimations when the variablethat measures the importance of privatization in the attraction of FDI.Throughout all the estimations from column 1 through 10, thevariable is positive and strongly significant, confirming the initialhypothesis.
What happens with the other variables? The quality of institutionsis positive and strongly significant throughout all the estimations. The
effect ranges between 1.120 and 1.670 with a majority staying around1.5 indicating the strong effect of the variable. The other variablesremain the same. Both the Sargan and SOC tests show that theinstruments are valid throughout the regressions.
Decomposition of the “quality of institutions”
Variable Definition Source
LSP Large Scale Privatization Index EBRD Transitional Indicators data
SSP Small Scale Privatization Index EBRD Transitional Indicators data
ER Enterprise restructuring Index EBRD Transitional Indicators data
PL Price Liberalization Index EBRD Transitional Indicators data
TFS Trade and Forces System Index EBRD Transitional Indicators data
CP Competition Policy Index EBRD Transitional Indicators data
BRIRL Banking Reforms and Interest rate liberalization Index EBRD Transitional Indicators data
SMNBFI Securities markets and non-bank financial institutionsIndex
EBRD Transitional Indicators data
ERI Enterprise Restructuring Reforms Self-calculations with EBRD data
MTR Market and Trade Reforms Self-calculations with EBRD data
FSR Financial System Reforms Self-calculations with EBRD data
Table 5: Decomposition of Institutions.
Table 5 shows the variable institution decomposed in three differentvariables to understand the effect of each of them. First, enterpriserestructuring reforms (ERI index measured as the average other threeindexes: the quality of large scale privatization (LSP), small scaleprivatization (SSP) and enterprise restructuring (ER). The secondvariable is market and trade reforms (MTR measured as the average ofthree variables: price liberalization (PL), trade and forces system (TFR)and competition policy (CP). The third variable is financial systemreform (FSR which is an average of two variables: banking reforms andinterest rate liberalization (BRIRL) and securities market & non-bankfinancial institutions (SMNBFI). In this regression the lagged values ofthese indicators will be considered to understand the effects of reformsover time.
All the variables taken in consideration are positively correlatedwith the inflow of FDI, but only one of them, the variable that showsthe reforms in the market and trade (MTR) is strongly significant(column 3 in Table 6. Trade liberalization and competition policy
remain very important for foreign investors. In Table 6, column 1,enterprise restructuring is positive but not significantly correlated tothe FDI inflow. Further, the findings show that the index related withthe privatization of large scale enterprises is positively and significantlycorrelated with FDI inflows, reconfirming the initial hypothesis on theimportance of the privatization process for FDI attraction.
The financial system reforms are also important, maybe the variableis not significant in this estimation because the effect might becaptured form the other variables such as private credit and foreignbanks. It is argued that foreign capital inflows can boost growth onlywhen the recipients countries financial markets are developed enoughto channel foreign capital efficiently to finance productive investment.To understand the effect of the variable used for the financial systemreforms, I have decomposed it in other two variables, and I note thatthe variable (SMNBFI) security markets and non-financial institutionsis positively and significantly correlated to the inflow of FDI,represented in Column (5) Table 6.
Citation: Valbona Zeneli (2014) The Role of Institutions and Good Governance for Attracting Foreign Direct Investments: Evidence fromSoutheast Europe. Bus Eco J 5: 92. doi:10.4172/2151-6219.100092
Page 10 of 20
Bus Eco JISSN:2151-6219 BEJ, an open access journal
Volume 5 • Issue 2 • 100092

1 2 3 4 5 6
PCGDP 2.058
(0.341)***
2.024
(0.352)***
1.867
(0.342)***
2.028
(0.365)***
1.997
(0.382)***
2.042
(0.882)**
GDPG -0.300
(0.240)
-0.320
(0.247)
-0.286
(0.243)
-0.305
(0.202)
-0.326
(0.254)
-0.328
(0.205)
INFLAT -0.100
(0.063)
-0.097
(0.065)
-0.109
(0.080)
-0.078
(0.060)
-0.090
(0.054)*
-0.008
(0.188)
OPEN 0.701
(0.284)**
0.568
(0.309)*
0.519
(0.435)
0.680
(0.328)**
0.826
(0.376)**
1.389
(0.688)*
HDI -0.218
(4.267)
0.323
(3.935)
0.904
(3.920)
-0.273
(4.579)
-0.491
(4.660)
5.370
(5.461)
TEL LINES -0.561
(0.261)**
-0.843
(0.239)**
-0.706
(0.291)**
-0.651
(0.255)**
-0.700
(0.311)**
-0.810
(0.473)*
PCREDIT -0.312
(0.247)
-0.284
(0.187)
-0.263
(0.224)
-0.334
(0.221)
-0.334
(0.234)
-0.603
(0.385)
BANK foreign 0.231
(0.067)***
0.272
(0.091)***
0.135
(0.106)
0.302
(0.101)***
0.270
(0.049)***
0.882
(0.427)**
RESOURC -0.243
(0.102)**
-0.199
(0.109)*
-0.233
(0.114)
-0.205
(0.100)***
-0.171
(0.135)
0.057
(0.221)
TARIF 0.011
(0.196)
-0.022
(0.168)
-0.051
(0.167)
0.003
(0.197)
0.011
(0.181)
0.038
(0.185)
DI 1.384
(0.613)**
1.448
(0.539)***
1.465
(0.630)**
1.351
(0.611)**
1.279
(0.556)**
0.103
(0.940)
REM -0.113
(0.062)*
-0.120
(0.061)**
-0.080
(0.063)
-0.104
(0.077)
-0.100
(0.074)
-0.079
(0.137)
PRIV 0.138
(0.040)***
0.132
(0.036)***
0.118
(0.043)
0.140
(0.040)***
0.139
(0.036)***
0.145
(0.061)**
ERIT-1 0.341
(0.928)
LSPt-1 0.701
(0.370)**
MTRT-1 3.638
(0.994)***
FSRT-1 0.891
(0.822)
SMNBFIt-1 0.844
(0.461)*
INSTU T-1 0.525
(0.243)**
FDI t-1 0.156
(0.208)
0.059
(0.164)
0.146
(0.160)
0.090
(0.214)
0.081
(0.193)
0.020
(0.216)
Constant -0.005 0.009 0.122 0.007 0.025 0.052
Citation: Valbona Zeneli (2014) The Role of Institutions and Good Governance for Attracting Foreign Direct Investments: Evidence fromSoutheast Europe. Bus Eco J 5: 92. doi:10.4172/2151-6219.100092
Page 11 of 20
Bus Eco JISSN:2151-6219 BEJ, an open access journal
Volume 5 • Issue 2 • 100092
(0.070) (0.065) (0.077) (0.062) (0.076) (0.121)
Sargan Test 1 1 1 1 1 1
SOC Test 0.506 0.246 0.601 0.340 0.446 0.982
Table 5: Determinants of FDI: Decomposition of Institutions. 1. All regression is estimated by GMM Arrellano Bond (one-step) estimator. 2. Allthe variables are expressed in natural log (ln). Robust Standard errors are reported in parentheses. (***), (**), and (*) indicate coefficientsignificant at 1, 5 and 10 % respectively. 3. Sargan Test (p-value, Prob >chi2): null hypothesis is no misspecification with the instrument sets, sothat the instruments are not correlated with the residuals. 4. SOC test (p-value): Arrellano and Bond Test with null hypothesis of no second-order correlation in differenced term errors, so that the errors in the first difference regression exhibit no second order serial correlation.
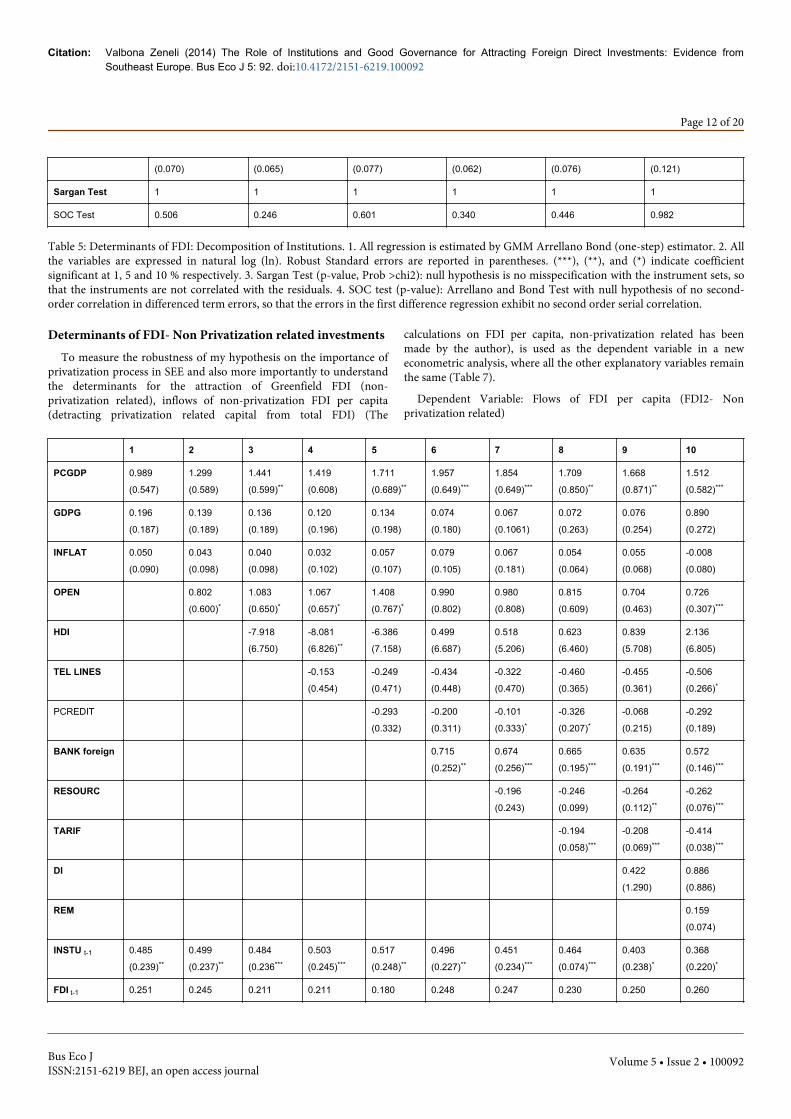
Determinants of FDI- Non Privatization related investmentsTo measure the robustness of my hypothesis on the importance of
privatization process in SEE and also more importantly to understandthe determinants for the attraction of Greenfield FDI (non-privatization related), inflows of non-privatization FDI per capita(detracting privatization related capital from total FDI) (The
calculations on FDI per capita, non-privatization related has beenmade by the author), is used as the dependent variable in a neweconometric analysis, where all the other explanatory variables remainthe same (Table 7).
Dependent Variable: Flows of FDI per capita (FDI2- Nonprivatization related)
1 2 3 4 5 6 7 8 9 10
PCGDP 0.989
(0.547)
1.299
(0.589)
1.441
(0.599)**
1.419
(0.608)
1.711
(0.689)**
1.957
(0.649)***
1.854
(0.649)***
1.709
(0.850)**
1.668
(0.871)**
1.512
(0.582)***
GDPG 0.196
(0.187)
0.139
(0.189)
0.136
(0.189)
0.120
(0.196)
0.134
(0.198)
0.074
(0.180)
0.067
(0.1061)
0.072
(0.263)
0.076
(0.254)
0.890
(0.272)
INFLAT 0.050
(0.090)
0.043
(0.098)
0.040
(0.098)
0.032
(0.102)
0.057
(0.107)
0.079
(0.105)
0.067
(0.181)
0.054
(0.064)
0.055
(0.068)
-0.008
(0.080)
OPEN 0.802
(0.600)*
1.083
(0.650)*
1.067
(0.657)*
1.408
(0.767)*
0.990
(0.802)
0.980
(0.808)
0.815
(0.609)
0.704
(0.463)
0.726
(0.307)***
HDI -7.918
(6.750)
-8.081
(6.826)**
-6.386
(7.158)
0.499
(6.687)
0.518
(5.206)
0.623
(6.460)
0.839
(5.708)
2.136
(6.805)
TEL LINES -0.153
(0.454)
-0.249
(0.471)
-0.434
(0.448)
-0.322
(0.470)
-0.460
(0.365)
-0.455
(0.361)
-0.506
(0.266)*
PCREDIT -0.293
(0.332)
-0.200
(0.311)
-0.101
(0.333)*
-0.326
(0.207)*
-0.068
(0.215)
-0.292
(0.189)
BANK foreign 0.715
(0.252)**
0.674
(0.256)***
0.665
(0.195)***
0.635
(0.191)***
0.572
(0.146)***
RESOURC -0.196
(0.243)
-0.246
(0.099)
-0.264
(0.112)**
-0.262
(0.076)***
TARIF -0.194
(0.058)***
-0.208
(0.069)***
-0.414
(0.038)***
DI 0.422
(1.290)
0.886
(0.886)
REM 0.159
(0.074)
INSTU t-1 0.485
(0.239)**
0.499
(0.237)**
0.484
(0.236***
0.503
(0.245)***
0.517
(0.248)**
0.496
(0.227)**
0.451
(0.234)***
0.464
(0.074)***
0.403
(0.238)*
0.368
(0.220)*
FDI t-1 0.251 0.245 0.211 0.211 0.180 0.248 0.247 0.230 0.250 0.260
Citation: Valbona Zeneli (2014) The Role of Institutions and Good Governance for Attracting Foreign Direct Investments: Evidence fromSoutheast Europe. Bus Eco J 5: 92. doi:10.4172/2151-6219.100092
Page 12 of 20
Bus Eco JISSN:2151-6219 BEJ, an open access journal
Volume 5 • Issue 2 • 100092
(0.200)* (0.198)* (0.197) (0.207) (0.214) (0.202) (0.203) (0.204) (0.253) (0.222)*
Constant 0.143
(0.093)
0.082
(0.102)
0.106
(0.109)
0.124
(0.118)
0.122
(0.119)
0.017
(0.112)
0.036
(0.114)
0.055
(0.110)
0.047
(0.101)*
0.024
(0.074)
Sargan Test 0.999 0.999 0.999 0.999 1 1 1 1 1 1
SOC Test 0.162 0.172 0.135 0.131 0.159 0.187 0.186 0.154 0.162 0.20
Table 6: Determinants of FDI- Non Privatization Related. Notes: 1. All regression is estimated by GMM Arrellano Bond (one-step) estimator. 2.All the variables are expressed in natural log (ln). Robust Standard errors are reported in parentheses. (***), (**), and (*) indicate coefficientsignificant at 1, 5 and 10 % respectively. 3. Sargan Test (p-value, Prob >chi2): null hypothesis is no misspecification with the instrument sets, sothat the instruments are not correlated with the residuals. 4. SOC test (p-value): Arrellano and Bond Test with null hypothesis of no second-order correlation in differenced term errors, so that the errors in the first difference regression exhibit no second order serial correlation.
GDP per capita continues to have a very strong and significantpositive correlation with the FDI inflow, ranging the coefficient from0.9939 to 2.085. The relationship is stronger than for the total FDIconsidered in the first part of this research.
GDP growth is positive through all the estimations, but notsignificant, inflation is not stable (positive or negative) and notsignificant. Trade openness is strongly positively and sometimessignificantly correlated with the attraction of FDI. Human capital,represented from HDI has a not stable sign, but more variables we addin the model, it tends to be positively but not significant. Thecoefficient for infrastructure is negative through all the estimations,but not significant.
Foreign banks is very strongly and significantly correlatedthroughout all regressions indicating that FDI that are not attractedfrom privatization, depend strongly on their home countries banksoperating in the host country, as a signal for security, stability andinterest.
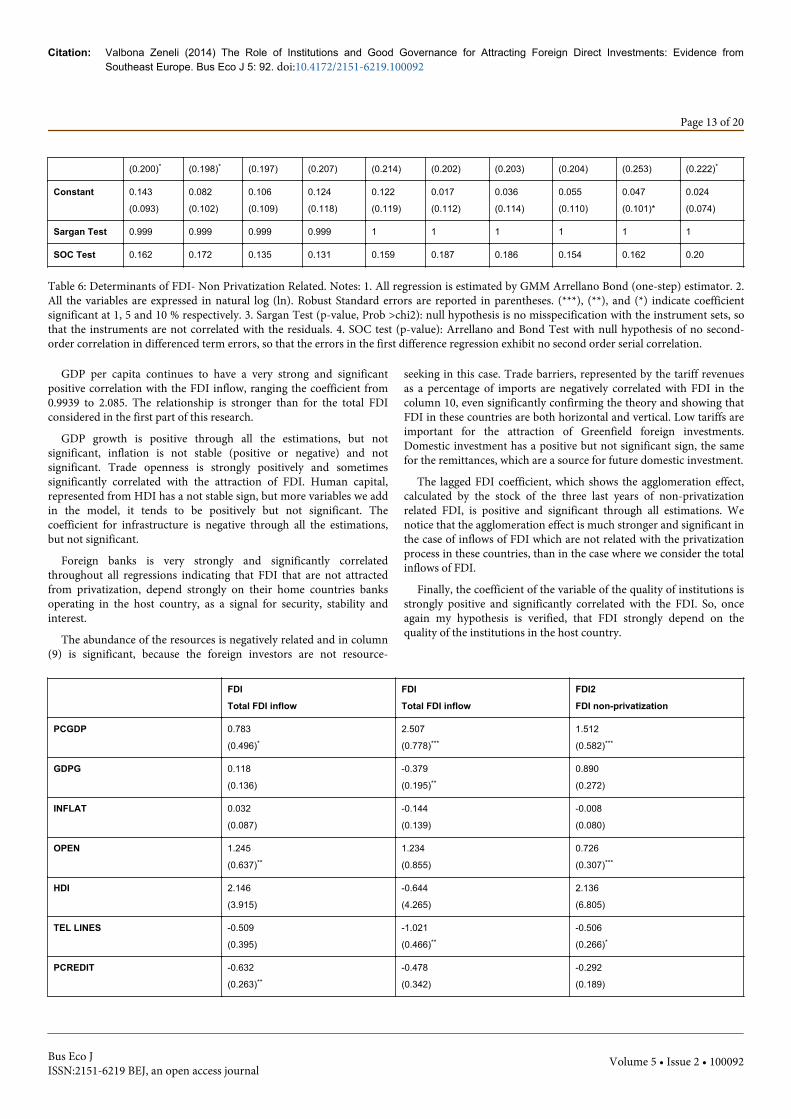
The abundance of the resources is negatively related and in column(9) is significant, because the foreign investors are not resource-
seeking in this case. Trade barriers, represented by the tariff revenuesas a percentage of imports are negatively correlated with FDI in thecolumn 10, even significantly confirming the theory and showing thatFDI in these countries are both horizontal and vertical. Low tariffs areimportant for the attraction of Greenfield foreign investments.Domestic investment has a positive but not significant sign, the samefor the remittances, which are a source for future domestic investment.
The lagged FDI coefficient, which shows the agglomeration effect,calculated by the stock of the three last years of non-privatizationrelated FDI, is positive and significant through all estimations. Wenotice that the agglomeration effect is much stronger and significant inthe case of inflows of FDI which are not related with the privatizationprocess in these countries, than in the case where we consider the totalinflows of FDI.
Finally, the coefficient of the variable of the quality of institutions isstrongly positive and significantly correlated with the FDI. So, onceagain my hypothesis is verified, that FDI strongly depend on thequality of the institutions in the host country.
FDI
Total FDI inflow
FDI
Total FDI inflow
FDI2
FDI non-privatization
PCGDP 0.783
(0.496)*
2.507
(0.778)***
1.512
(0.582)***
GDPG 0.118
(0.136)
-0.379
(0.195)**
0.890
(0.272)
INFLAT 0.032
(0.087)
-0.144
(0.139)
-0.008
(0.080)
OPEN 1.245
(0.637)**
1.234
(0.855)
0.726
(0.307)***
HDI 2.146
(3.915)
-0.644
(4.265)
2.136
(6.805)
TEL LINES -0.509
(0.395)
-1.021
(0.466)**
-0.506
(0.266)*
PCREDIT -0.632
(0.263)**
-0.478
(0.342)
-0.292
(0.189)
Citation: Valbona Zeneli (2014) The Role of Institutions and Good Governance for Attracting Foreign Direct Investments: Evidence fromSoutheast Europe. Bus Eco J 5: 92. doi:10.4172/2151-6219.100092
Page 13 of 20
Bus Eco JISSN:2151-6219 BEJ, an open access journal
Volume 5 • Issue 2 • 100092

BANK foreign 0.325
(0.224)
0.395
(0.227)*
0.572
(0.146)***
RESOURC -0.170
(0.190)
-0.097
(0.186)
-0.262
(0.076)***
TARIF -0.200
(0.166)
-0.061
(0.175)
-0.414
(0.038)***
DI 1.155
(0.752)
0.429
(0.753)
0.886
(0.886)
REM 0.009
(0.108)
-0.133
(0.121)
0.159
(0.074)
PRIV 0.147
(0.057)***
INSTU t-1 0.371
(0.204)**
1.523
(0.657)**
0.368
(0.220)*
FDI t-1 0.031
(0.212)
0.031
(0.212)
0.260
(0.222)*
Constant 0.138
(0.088)
0.042
(0.753)
0.024
(0.074)
Sargan Test 1 1 1
SOC Test 0.144 0.949 0.20
Table 7: Determinants of Total FDI (FDI) and Non Privatization Related FDI (FDI2). 1. All regression is estimated by GMM Arrellano Bond(one-step) estimator. 2. All the variables are expressed in natural log (ln). Robust Standard errors are reported in parentheses. (***), (**), and (*)indicate coefficient significant at 1, 5 and 10 % respectively. 3. Sargan Test (p-value, Prob >chi2): null hypothesis is no misspecification with theinstrument sets, so that the instruments are not correlated with the residuals.4. SOC test (p-value): Arrellano and Bond Test with null hypothesisof no second-order correlation in differenced term errors, so that the errors in the first difference regression exhibit no second order serialcorrelation.
In Table 8, the complete estimations of total FDI and non-privatization related FDI, the difference in the importance of thedeterminants can be easily understood. As noticed, more factors areimportant on the attraction of FDI that are not related with theprivatization of the state owned companies. The quality of institutionsand the GDP per capita is positive and significant in both cases. Tradeopenness is more important for the non- privatization related FDI(FDI2), natural resources are significant and negatively correlated, thisvariable was not significant in the case of total FDI inflows. Foreignbanks are strongly significantly and positively correlated with FDIattraction. Tariffs that in the case of total FDI inflows are notsignificant, in the case on non- privatization related FDI aresignificantly negatively correlated, confirming the theory. Theagglomeration effect is stronger and significant in the case of Non-privatization FDI.
Summary of the main resultsPer Capita GDP is one of the most significant variables and
determinants found to have a favorable effect on FDI attractionthroughout all the estimations, with a stronger and more significanteffect for non-privatization related FDI. These findings emphasize thenecessity of a large market for the efficient utilization of resources andthe exploitation of economies of scale. Market size helps attract FDI,
and a larger market offers higher demand and absorptive capacity inan economy, providing an empirical confirmation for the theory ofhorizontal (market-seeking) FDI, conform to the Gravitational Theoryof FDI.
GDP growth is positive in the majority of estimations, but only fewtimes significant. High growth rates usually indicate credible andstable macroeconomic policies.
The Agglomeration effect, measured by the variable of the laggedvalue of stock of FDI (stock of previous years), is significant andpositively correlated with the attraction of FDI, as a signal of securityfor foreign investors about the favorable business climate at the foreignlocation. This shows to be more important for non-privatizationrelated FDI. It can also be associated with a number of positiveexternalities such as technology improvement, advanced labor skillsand efficient production and distribution network. This also explainswhy the relatively advanced economies in the SEE which absorbed FDIearlier than the others, continue to attracts the larger share of FDI inthe region.
Inflation throughout the estimations is dominantly negative but notsignificant. The reason could lay on the fact that the countries taken inexamination are transition countries, which have really had very large
Citation: Valbona Zeneli (2014) The Role of Institutions and Good Governance for Attracting Foreign Direct Investments: Evidence fromSoutheast Europe. Bus Eco J 5: 92. doi:10.4172/2151-6219.100092
Page 14 of 20
Bus Eco JISSN:2151-6219 BEJ, an open access journal
Volume 5 • Issue 2 • 100092

oscillations of inflation in the first years of transition, but this has notstopped foreign investments.
Trade Openness is positive and highly significant in almost all theestimations, but the effects seem to be stronger on the attraction ofFDI when the inflow of investments is non-privatization related. Thisidentifies the magnitude of trade liberalization, being more importantwhen the FDI are efficiency seeking than market seeking, somultinationals are attracted by countries with location advantages,aiming at the exports of their final products to other larger markets,but also for the imports of raw materials and other instruments. Ourpositive correlation between trade openness and FDI is theoreticallysound.
Human capital, represented by the HDI is another importantvariable, which represents not only the level of education of thepopulation (showing the quality of the workforce), but also indirectlythe cost of labor. The sign of this variable is not stable and notsignificant for both dependent variables, meaning that the quality ofthe labor force and the education are not so significant for the foreigninvestors which consider the countries of SEE. Theoretically, theimpact of qualified education should have been positive, but based inthe statistical data, education in transition countries does not pay backthe same ways it does in developed countries. Obviously, skilled laborforce is crucial to the implementation of innovative productiontechnologies, but in SEE the low level of new industrial technologies isconfirmed.
Infrastructure and Communication Facilities, measured in terms ofnumbers of fixed telephone lines per 100 people, has a negative andsignificant in both cases when we consider the total flows of FDI andthose not-related with privatization. These findings are not sound tothe theory because a good infrastructure is an advantage for theforeign investors and it is believed to attract them. The reason may lieon the variable used.
Private Credit is the variable used to measure the level ofdevelopment of the financial system on the host country, and the levelof crediting of banking system to the private sector. The sign isnegative as expected, but significant only in few cases. This means thatFDI is a strong source of capital accumulation for the countries of SEEand this is sound to the theory.
Foreign banks, is a new explanatory variable, which represents theshare of foreign banks in the banking system of the host country, andcan act as a strong signal of stability for foreign investors. This variableis positive and highly significant in all the estimations, both in the caseof total FDI and non-privatization related.
Natural Resources, is represented in the equation from the ratio ofexports of oil and natural gas and ores and metals to the total exports.In all the estimations, the sign for natural resources is negative and inthe case of non-privatization related FDI also significant. This meansthat FDI in those countries are not resource-seeking, but market orefficiency seeking. This result is dubious, since some of the countriesof SEE are rich in natural resources.
Tariffs and Trade barriers, measured by the tariff revenues as apercentage of imports. When the total flow of FDI is considered, thevariable is not stable and significant. On the contrary, for non-
privatization FDI the sign of the coefficient is negative and significant,as expected and sound with the theory. Because FDI inflows rise withdecreasing taxes and tariffs, the complementary relationship betweentrade and FDI may be due to vertical multinational activities.However, the attraction of FDI because of the tax incentives can beaffected from the other factors such as corruption, non- transparencyof tax policies, the immersion of new non-formal taxes such as “timetax" or "bribe tax", and could turn to be ignored.
Domestic Investment represents the host country investments andhas a positive and sometimes significant sign, meaning that therelationship between FDI and domestic investment is complementary.This could mean that foreign investors feel more secure in investing incountries where they can find network of industry for their businesslinkages.
Remittances, could be used capture two effects in this study; themarket seeking motivation of multinationals and the variable has apositive but not significant sign in the case of non-privatization FDI,because they are an easy source of income for recipients. On the otherside, remittances are a source of capital accumulation, which can beused for domestic investments in the host countries.
Privatization is the explanatory variable we have used forunderstanding the importance of the privatization process. The resultsconfirm the initial hypothesis, with the sign of the variable used forprivatization (ratio of privatizations to the GDP), is always positiveand highly significant throughout all the estimations.
Quality of Institutions is strongly positively correlated with theattraction of FDI throughout all the estimations of this study, both forthe total flows of FDI and non-privatization FDI. The importance ofnew policies, reforms and implementation of those seems to beconsidered even more significant in the decision making process offoreign investors where to locate their investments in the South-European countries that the traditional well-known variables used invarious works. When the variable is decomposed for understandingthe reforms considered more important for foreign investors, thevariable market trade reforms is positive and significant for FDI. In theenterprise reforms, the importance of the process of the large scaleprivatization is confirmed. Financial sector reforms are also positivelycorrelated with FDI, and security markets and non-financialinstitutions reforms is also strongly significant for the attraction ofFDI. The results of this research are sound with the Theory ofDunning (2006) that explains the importance of institution on thelocation decisions of foreign companies.
The GMM estimation procedure was used to correct the potentialendogeneity problem. However, to ensure the appropriateness ofGMM model, I need to verify that the instrument sets used in theestimations are properly specified and that there is no second-orderserial correlation of first-differenced error terms. For this reason, twotests are performed in order to ensure the appropriateness of thismodel, the Sargan Test and the Arrellano & Bond second ordercorrelation (SOC) Test. the p-value for both Sargan tests (null of noinstruments misspecification) and SOC Test (null of no-correlation)indicate that neither of the null hypothesis can be rejected. The resultsof both tests confirm the properness of my interpretation (Table 9).
Variables FDI per capita Non- Privatization related FDI
Citation: Valbona Zeneli (2014) The Role of Institutions and Good Governance for Attracting Foreign Direct Investments: Evidence fromSoutheast Europe. Bus Eco J 5: 92. doi:10.4172/2151-6219.100092
Page 15 of 20
Bus Eco JISSN:2151-6219 BEJ, an open access journal
Volume 5 • Issue 2 • 100092

GDP per capita Positive, significant Significant, positive
GDP growth Positive, not always significant Positive, not always significant
Agglomeration effect Positive, significant Positive, highly significant
Inflation Negative, non-significant Negative, non-significant
Trade openness Positive, significant Positive, highly significant
Human capital (enrollment rate%) Sign not stable, not significant Sign not stable, not significant
Human Development Index Sign not stable, not significant Sign not stable, not significant
Infrastructure (telephone lines) Negative, significant Negative, significant
Bank credit to the private sector Negative, not always significant Negative, not always significant
Tariff revenues as% of imports Not stable, not significant Negative, significant
Domestic investment as%GDP Positive, not always significant Positive, not always significant
Foreign Banks (ratio) Positive, significant Positive, highly significant
Remittances as% GDP Positive, not significant Positive, not significant
Natural resources Negative, not significant Negative, significant
Quality of Institutions Positive, significant Positive, highly significant
Table 9: representing the main results of the research.
Robustness checkTo further check the robustness of this analysis and model, I rerun
the regressions using different dependent variables. I use as adependent variable the flow of FDI in million $.
1
PCFDI flow
2
FDI flow
2
PCFDI stock
4
FDI stock
PCGDP 2.507
(0.778)***
1.639
(0.522)***
1.512
(0.411)***
1.332
(0.390)***
GDPG -0.379
(0.195)**
-0.075
(0.099)
-0.009
(0.105)
0.113
(0.086)
INFLAT -0.144
(0.139)
-0.238
(0.075)***
-0.091
(0.078)
0.023
(0.104)
OPEN 1.234
(0.855)
0.759
(0.457)*
0.818
(0.461)*
0.569
(0.418)
HDI -0.644
(4.265)
2.591
(3.125)
-3.540
(2.392)
-2.446
(2.082)
TEL LINES -1.021
(0.466)**
-0.396
(0.304)
-0.783
(0.237)***
-0.666
(0.401)
PCREDIT -0.478
(0.342)
-0.165
(0.144)
-0.331
(0.193)*
-0.409
(0.401)
BANK foreign 0.395
(0.227)*
0.305
(0.105)***
0.220
(0.121)*
0.300
(0.126)**
Citation: Valbona Zeneli (2014) The Role of Institutions and Good Governance for Attracting Foreign Direct Investments: Evidence fromSoutheast Europe. Bus Eco J 5: 92. doi:10.4172/2151-6219.100092
Page 16 of 20
Bus Eco JISSN:2151-6219 BEJ, an open access journal
Volume 5 • Issue 2 • 100092

RESOURC -0.097
(0.186)
-0.036
(0.128)
0.123
(0.104)
0.254
(0.210)
TARIF 0.061
(0.175)
0.147
(0.078)*
0.027
(0.100)
-0.131
(0.121)
DI 0.429
(0.753)
-0.067
(0.252)
-0.053
(0.454)
0.375
(0.569)
REM -0.133
(0.121)
-0.088
(0.062)
-0.104
(0.068)
0.102
(0.116)
PRIV 0.147
(0.057)***
0.224
(0.027)***
0.058
(0.032)*
0.043
(0.018)**
INSTU t-1 1.523
(0.657)**
0.138
(0.046)***
0.570
(0.124)***
0.167
(0.060)***
FDI t-1 0.031
(0.212)
6.30e-12
(9.23e-12)
0.163
(0.093)*
0.074
(0.136)
Constant 0.042
(0.753)
0.019
(0.048)
0.107
(0.061)*
0.122
(0.051)
Sargan Test 1 1 1 1
SOC Test 0.949 0.423 0.208 0.782
Table 9: Robustness Check of the Dependent Variable- Total FDI. 1. All regression is estimated by GMM Arrellano Bond (one-step) estimator. 2.All the variables are expressed in natural log (ln). Robust Standard errors are reported in parentheses. (***), (**), and (*) indicate coefficientsignificant at 1, 5 and 10 % respectively. 3. Sargan Test (p-value, Prob >chi2): null hypothesis is no misspecification with the instrument sets, sothat the instruments are not correlated with the residuals. 4. SOC test (p-value): Arrellano and Bond Test with null hypothesis of no second-order correlation in differenced term errors, so that the errors in the first difference regression exhibit no second order serial correlation.
The results in Table 10 confirm the findings and the initialhypotheses about the important role of the quality of the institutionsand the process of privatization. Furthermore, two other dependent
variables are included, the stock of FDI per capita in column (3) andthe aggregate stock FDI stock in column (4). The same patterns arenoted also in the new model we have used.
1
PCFDI2 flow
Non-privatization
2
FDI2 flow
Non-privatization
PCGDP 1.512
(0.582)***
7.457
(0.148)***
GDPG 0.890
(0.272)
0.008
(0.0045)*
INFLAT -0.008
(0.080)
-0.003
(0.034)
OPEN 0.726
(0.307)***
0.080
(0.017)***
HDI 2.136
(6.805)
0.142
(0.119)
TEL LINES -0.506
(0.266)*
-0.059
(0.012)***
PCREDIT -0.292 0.002
Citation: Valbona Zeneli (2014) The Role of Institutions and Good Governance for Attracting Foreign Direct Investments: Evidence fromSoutheast Europe. Bus Eco J 5: 92. doi:10.4172/2151-6219.100092
Page 17 of 20
Bus Eco JISSN:2151-6219 BEJ, an open access journal
Volume 5 • Issue 2 • 100092
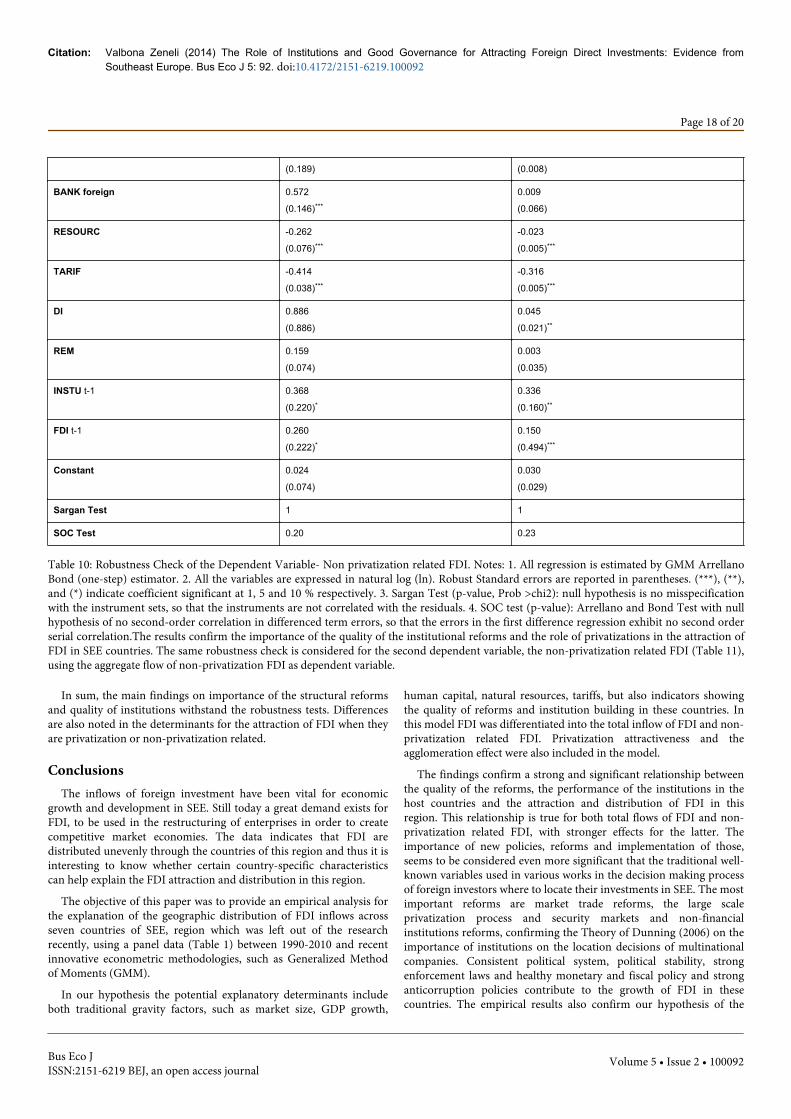
(0.189) (0.008)
BANK foreign 0.572
(0.146)***
0.009
(0.066)
RESOURC -0.262
(0.076)***
-0.023
(0.005)***
TARIF -0.414
(0.038)***
-0.316
(0.005)***
DI 0.886
(0.886)
0.045
(0.021)**
REM 0.159
(0.074)
0.003
(0.035)
INSTU t-1 0.368
(0.220)*
0.336
(0.160)**
FDI t-1 0.260
(0.222)*
0.150
(0.494)***
Constant 0.024
(0.074)
0.030
(0.029)
Sargan Test 1 1
SOC Test 0.20 0.23
Table 10: Robustness Check of the Dependent Variable- Non privatization related FDI. Notes: 1. All regression is estimated by GMM ArrellanoBond (one-step) estimator. 2. All the variables are expressed in natural log (ln). Robust Standard errors are reported in parentheses. (***), (**),and (*) indicate coefficient significant at 1, 5 and 10 % respectively. 3. Sargan Test (p-value, Prob >chi2): null hypothesis is no misspecificationwith the instrument sets, so that the instruments are not correlated with the residuals. 4. SOC test (p-value): Arrellano and Bond Test with nullhypothesis of no second-order correlation in differenced term errors, so that the errors in the first difference regression exhibit no second orderserial correlation.The results confirm the importance of the quality of the institutional reforms and the role of privatizations in the attraction ofFDI in SEE countries. The same robustness check is considered for the second dependent variable, the non-privatization related FDI (Table 11),using the aggregate flow of non-privatization FDI as dependent variable.
In sum, the main findings on importance of the structural reformsand quality of institutions withstand the robustness tests. Differencesare also noted in the determinants for the attraction of FDI when theyare privatization or non-privatization related.
ConclusionsThe inflows of foreign investment have been vital for economic
growth and development in SEE. Still today a great demand exists forFDI, to be used in the restructuring of enterprises in order to createcompetitive market economies. The data indicates that FDI aredistributed unevenly through the countries of this region and thus it isinteresting to know whether certain country-specific characteristicscan help explain the FDI attraction and distribution in this region.
The objective of this paper was to provide an empirical analysis forthe explanation of the geographic distribution of FDI inflows acrossseven countries of SEE, region which was left out of the researchrecently, using a panel data (Table 1) between 1990-2010 and recentinnovative econometric methodologies, such as Generalized Methodof Moments (GMM).
In our hypothesis the potential explanatory determinants includeboth traditional gravity factors, such as market size, GDP growth,
human capital, natural resources, tariffs, but also indicators showingthe quality of reforms and institution building in these countries. Inthis model FDI was differentiated into the total inflow of FDI and non-privatization related FDI. Privatization attractiveness and theagglomeration effect were also included in the model.
The findings confirm a strong and significant relationship betweenthe quality of the reforms, the performance of the institutions in thehost countries and the attraction and distribution of FDI in thisregion. This relationship is true for both total flows of FDI and non-privatization related FDI, with stronger effects for the latter. Theimportance of new policies, reforms and implementation of those,seems to be considered even more significant that the traditional well-known variables used in various works in the decision making processof foreign investors where to locate their investments in SEE. The mostimportant reforms are market trade reforms, the large scaleprivatization process and security markets and non-financialinstitutions reforms, confirming the Theory of Dunning (2006) on theimportance of institutions on the location decisions of multinationalcompanies. Consistent political system, political stability, strongenforcement laws and healthy monetary and fiscal policy and stronganticorruption policies contribute to the growth of FDI in thesecountries. The empirical results also confirm our hypothesis of the
Citation: Valbona Zeneli (2014) The Role of Institutions and Good Governance for Attracting Foreign Direct Investments: Evidence fromSoutheast Europe. Bus Eco J 5: 92. doi:10.4172/2151-6219.100092
Page 18 of 20
Bus Eco JISSN:2151-6219 BEJ, an open access journal
Volume 5 • Issue 2 • 100092

important role of privatizations of state owned companies, especiallyin the first years of transition, meaning that FDI in the countries takenin consideration are strongly attracted from the privatization process.
The existence of a strong agglomeration effect, especially for non-privatization related FDI, helps explaining the herding of manyinvestors in SEE during the last two decades. This model also predictsthe importance of trade openness, which is stronger for non-privatization related FDI. The quality of the labor force and theeducation are not so significant for the foreign investors whichconsider the countries of SEE, showing that education in transitioncountries does not pay back the same ways it does in developedcountries. This shows also the low innovative level production andmanagement technologies established in this region. Foreigncompanies are not only motivated by relatively cheap and not skilledlabor but also discriminate between the countries of SEE with less ormore skilled labor. This model provides a strong support to the viewthat FDI inflow to SEE economies are predominantly horizontal,market or efficiency seeking but not resource-seeking and they are astrong source of capital accumulation for these countries. Bankingsector and particularly the presence of foreign banks can act as a verystrong signal of stability for foreign investors, playing also the role ofcommunicative effect, acting as promotion and marketing through thereputation, both in the case of total FDI and non-privatization related.Tariffs and taxes are particularly significant for non-privatization FDI.
The analysis suggests that the larger inflows of FDI to some of thecountries of SEE rather than the others can be explained by betteropportunities for market seeking investments due to stronger hostcountry demand and a faster transition process. Countries that haveimplemented transition policies successfully have had relatively speedymembership into European Union, which has further accelerated FDIthat has generated more growth and development. SEE countriesshould continue to focus on policies and reforms that promoteinstitutional development and develop a friendly environment for theattraction and targeting of “qualitative” foreign investments, in orderto start a new cycle of development. Consistent political stability,efficient law enforcement, healthy fiscal and monetary policies andstrong anti-corruption reforms could contribute not only for theattraction of “qualitative” foreign investments but also for boostinglonger and sustainable positive effects for growth and development.New and effective legislation should be able to direct the inflows ofFDI to the sectors that augment domestic investment and lead tosustainable economic growth. To the governments of all SEEcountries, these findings may serve for the policy stipulation aimed atimproving the overall investment environment, and these changesmay work as a strong signal of a more favorable host destination forforeign investors. Hover ever, more research effort need to be devotedto the topic, as counties of Southeast Europe are getting moreintegrated in the global economy.
References1. Child J, David KT (2001) China’s transition and its implications for
international business. J Int Bus Stud 32: 5-17.2. OECD Investment Reform Index 2010. Monitoring Policies and
Institutions for Direct Investment in South East Europe.3. Borensztein E, De Gregorio J, Lee JW (1998) How does foreign direct
investment affect economic growth? J Int Econ 45: 115-135.4. Balasubramanyam VN, Salisu M, Sapsford D (1996) Foreign direct
investment and growth in EP and IS countries. Econ J 106: 92–105.5. Alfaro L, Chanda A, Kalemli-Ozcan S, Sayek, S (2003) FDI and economic
growth: The role of local financial markets. J Int Econ 64: 89–112.
6. World Investment Report (1999) Foreign Direct Investment and theChallenge of Development. United Nations Conference on Trade andDevelopment.
7. World Investment Report, 2006. FDI from Developing and TransitionEconomies: Implications for Development. United Nations Conferenceon Trade and Development, New York and Geneva.
8. Enderwick P (2005) Attracting "desirable" FDI: Theory and Evidence.Transnational Corporations. 14: 94-116.
9. World Investment Report (2009) Transnational Corporations,Agricultural Production and Development. United Nations Conferenceon Trade and Development.
10. Dunning JH (2006) Towards a New Paradigm of Development:Implications for the Determinants of International Business Activity.Transnational Corporations 15: 173–228.
11. Root FR (2001) Entry Strategies for International Markets. Lexington,MA: Lexington Books.
12. Vernon R (1966) International Investment and International Trade in theProduct Life cycle. Quart J Econ 80: 190-207.
13. Gruber WH, Mehta D, Vernon R (1967) The R&D Factor inInternational Trade and International Investment of United StatesIndustries. J Polit Econ 75: 20-37.
14. Hymer S (1976) The International Operations of National Firms: A Studyof Foreign Direct Investment, Mass: The MIT Press, Cambridge.
15. Dunning JH (1977) Trade, location of economic activity and the MNE: asearch for an eclectic approach, in B. Ohlin and P.O. Hesselborn (eds.).The International Allocation of Economic Activity, 395-418, London,Macmillan.
16. Dunning JH (2006) Towards a New Paradigm of Development:Implications for the Determinants of International Business Activity.Transnational Corporations 15: 173–228.
17. Rondinelli DA (2002) Assessing government policies for businesscompetitiveness in emerging market economies: an institutionalapproach. Cambridge University Press. In Grosse (ed).
18. Rodrik D (2004) Growth Strategies. Working Paper, Kennedy School ofGovernment, Harvard University.
19. Sen Amartia (1999) Development as a Freedom. Oxford University Press.20. Stilglitz J (1998) Distinguished Lecture on Economics in Government.
The private uses of Public interests: Incentives and Institutions. J EconPerspect 12: 3-22.
21. Narula R, Dunning JH (1988) Globalization and new realities formultinational enterprises-developing host country interaction.
22. Lahiri S (2009) Foreign Direct Investment: An Overview of Issues. IntRev Econ Financ 18: 1-2.
23. Markusen James R, Venables A (1998) Multinational firms and the newtrade theory. Journal of International Economics 52: 209-234.
24. Markusen James R, Markus K.E (1999) Discriminating among alternativetheories of the multinational enterprise. Working paper No 7164.National Bureau of Economic Research. Cambridge, MA.
25. Carr D, Markusen J, Maskus K (2001) Estimating the Knowledge-CapitalModel of the Multinational Enterprise. Am Econ Rev 91: 693-708.
26. Enderwick P (2005) Attracting "desirable" FDI: Theory and Evidence.Transnational Corporations, Vol. 14 (2). United Nations. New York andGeneva.
27. Culem CG (1988) The location determinants of direct investmentsamong industrialized countries. Eur Econ Rev 32: 885-904.
28. Bevan A, Estrin S (2004) The determinants of foreign direct investmentin transition economies. CEPR Discussion Paper No. 2638. Centre forEconomic Policy Research, London.
29. De Mello LR (1997) FDI in Developing Countries and Growth: Aselective Survey. J Dev Stud 34: 1-34.
30. Wang ZQ, Swain NJ (1995) The determinants of Foreign DirectInvestment in Transforming Economies: Evidence from Hungary andChina. Weltwirtschaftliches Archive, 131: 359-382.
Citation: Valbona Zeneli (2014) The Role of Institutions and Good Governance for Attracting Foreign Direct Investments: Evidence fromSoutheast Europe. Bus Eco J 5: 92. doi:10.4172/2151-6219.100092
Page 19 of 20
Bus Eco JISSN:2151-6219 BEJ, an open access journal
Volume 5 • Issue 2 • 100092
31. Lankes HP, Venables AJ (1996) FDI in economic transition: the changingpattern of investments. Econ Transition 4: 331-347.
32. Holland D, Pain N (1998) The diffusion of innovations in Central andEastern Europe: A study of the determinants and impacts of foreigndirect investments. NIESR discussion paper No.137. NIESR, London.
33. Resmini L (2000) The determinants of foreign direct investment in theCEECs: New evidence from sectoral patterns. Econ Transition, 8:665-689.
34. Prasad ES, Rajan R, Subramanian A (2007) Foreign Capital andEconomic Growth. Brookings Papers on Economic Activity, 38: 153–230.
35. Botric V, Skuflic L (2006) Main determinants of Foreign DirectInvestment in the Southern European countries. Transition Stud Rev 13:359-377.
36. Carstensen K, Toubal F (2004) Foreign direct investment in Central andEastern European countries: a dynamic panel analysis. J Comp Econ 32:3-22.
37. Campos, N and Kinoshota, Y (2003), "Why does FDI goes where it goes?New Evidence from the Transition Economies" IMF Working Paper No.228
38. Demekas DG, Balász H, Ribakova E, Wu Y (2007) Foreign directinvestment in European transition economies – The role of policies. JComp Econ 35: 369–386.
39. Arrelano M, Bond SR (1991) Some test specification for panel data:Monte Carlo evidence and an application to employment Equation. RevEcon Stud 58: 277-297.
40. Campos N, Kinoshota Y (2003) Why FDI does go where it goes? NewEvidence from the Transition Economies. IMF Working Paper No.228
Citation: Valbona Zeneli (2014) The Role of Institutions and Good Governance for Attracting Foreign Direct Investments: Evidence fromSoutheast Europe. Bus Eco J 5: 92. doi:10.4172/2151-6219.100092
Page 20 of 20
Bus Eco JISSN:2151-6219 BEJ, an open access journal
Volume 5 • Issue 2 • 100092