› nbs › takwimu › environment › nesr_2017.pdf the united republic of tanzaniathe united...
TRANSCRIPT

The United Republic of Tanzania
June, 2018

The United Republic of Tanzania
National Environment Statistics Report, 2017
Tanzania Mainland

The National Environment Statistics Report, 2017 (NESR, 2017) was compiled by the
National Bureau of Statistics (NBS) in collaboration with National Technical Working Group
on Environment Statistics. The compilation work of this report took place between
December, 2016 to March, 2018. Funding for compilation and report writing was provided by
the Government of Tanzania and the World Bank (WB) through the Tanzania Statistical
Master Plan (TSMP) Basket Fund. Technical support was provided by the United Nations
Statistics Division (UNSD) and the East African Community (EAC) Secretariat.
Additional information about this report may be obtained from the National Bureau of
Statistics through the following address: Director General, 18 Kivukoni Road, P.O.Box 796,
11992 Dar es Salaam, Tanzania (Telephone: 255-22-212-2724; email: [email protected];
website: www.nbs.go.tz).
Recommended citation: National Bureau of Statistics (NBS) [Tanzania] 2017.
National Environment Statistics Report, 2017 (NESR, 2017), Dar es Salaam, Tanzania
Mainland.

i
TABLE OF CONTENTS
List of Tables ................................................................................................................................ vi
List of Figures ............................................................................................................................... ix
List of Maps ................................................................................................................................... x
LIST OF ABBREVIATION AND NOTATIONS ..................................................................... xi PREFACE ................................................................................................................................... xv
EXECUTIVE SUMMARY ..................................................................................................... xviii Summary Table of Key Latest Available Environment Statistics, 2013-2017 ................... xxiii
BACKGROUND, methodology, AND CONCEPTS AND DEFINITIONS ........................ xxvi
Background .............................................................................................................................. xxvi
CHAPTER ONE ........................................................................................................................... 1 ENVIRONMENTAL CONDITIONS AND QUALITY ............................................................ 1 1.1: Physical Conditions ........................................................................................................ 1
1.1.1: Atmosphere, Climate and Weather ................................................................................ 1
1.1.1.1: Background .................................................................................................................... 1
1.1.1.2: Physical Features ............................................................................................................ 1 1.1.1.3: Climatology of Tanzania ................................................................................................ 2 1.1.1.4: Annual Mean Maximum Temperature Records from Meteorological Stations ............. 4
1.1.1.5: Monthly Mean Maximum Temperature ......................................................................... 5
1.1.1.6: Annual Mean Minimum Temperature Records for Meteorological Stations from 2012
to 2016 ............................................................................................................................ 7 1.1.1.7: Monthly Mean Minimum Temperature .......................................................................... 7
1.1.1.8: Annual Rainfall Records for Meteorological Stations (2012 – 2016) ............................ 9 1.1.1.9: Monthly Total Rainfall ................................................................................................. 10
1.1.2 - Hydrographical Characteristics .................................................................................... 11
1.1.2.1: Water Resources Availability ....................................................................................... 14 1.1.2.2: International Water Issues ............................................................................................ 15
1.1.2.3: Water Use ..................................................................................................................... 17
1.1.2.4: Rural Water Supply ...................................................................................................... 17 1.1.2.5: Urban Water Supply and Sanitation ............................................................................. 17 1.1.2.6: Water Management ...................................................................................................... 18
1.1.2.7: Groundwater Resources ............................................................................................... 19 1.1.2.8: Groundwater Governance ............................................................................................. 19
1.1.3 - Geological and Geographical Information ................................................................... 20
1.1.3.1: Geographical Location, Boundaries and Area ............................................................. 20
1.1.3.5: Description about Coastal Area .................................................................................... 22 1.1.3.6: International Legal Frameworks for Coastal and Marine Resources Governance ....... 23 1.1.3.13: Environment Legislation .............................................................................................. 24 1.1.3.14: Economic Importance of Coastal Area ........................................................................ 25
1.1.3.15: Coastal Resources Degradation .................................................................................... 26
1.1.3.16: Coastal Area Management ........................................................................................... 26
1.1.4 - Soil Characteristics ....................................................................................................... 26
1.2.1- Land Cover ................................................................................................................... 27

ii
1.2.2- Ecosystems and Biodiversity ........................................................................................ 29
1.2.2.1: Known Flora and Fauna Species .................................................................................. 33 1.2.2.2: Tanzania’s Endemic Flora and Fauna Species ............................................................. 33 1.2.2.4: Invasive Alien Species (Flora and Fauna) .................................................................... 34 1.2.2.5: Invasive Flora Species .................................................................................................. 34 1.2.2.6: Invasive Fauna Species ................................................................................................ 35
1.2.2.7: Control and Management of Invasive Species ............................................................. 35 1.2.2.8: Protected Terrestrial Area ............................................................................................ 36 1.2.2.9: National Parks .............................................................................................................. 36 1.2.2.10: Game Reserves and Other Protected Areas .................................................................. 40
1.2.2.11: Game Controlled Areas (GCAs) .................................................................................. 41 1.2.2.12: Forest Reserves ............................................................................................................. 43
1.2.3- Forests .......................................................................................................................... 48
1.3. Environmental Quality ................................................................................................. 51
1.3.2: Freshwater Quality ....................................................................................................... 51
CHAPTER TWO ........................................................................................................................ 65 ENVIRONMENTAL RESOURCES AND THEIR USE ........................................................ 65 2.1: Mineral Resources ........................................................................................................ 65
2.1.1- Stocks and Changes of Mineral Resources .................................................................. 67
2.1.2- Production and Trade of Minerals ................................................................................ 68
2.1.2.1: Production of Minerals ................................................................................................. 68 2.1.2.2: Importation of Minerals ................................................................................................ 70
2.1.2.3: Exportation of Minerals ................................................................................................ 71
2.2. Energy Resources ......................................................................................................... 72
2.2.1- Stocks and Changes of Energy Resources ................................................................... 73
2.2.1.1: Extraction of Energy Resources ................................................................................... 75
2.2.2- Production, Trade and Consumption of Energy ........................................................... 77
2.2.2.1: Electricity Generation and Consumption ..................................................................... 78 2.2.2.2: Electricity Consumption ............................................................................................... 80
2.2.2.3: The National Energy Policy issues and challenges ...................................................... 81
2.3. Land .............................................................................................................................. 83
2.3.1- Land Use ....................................................................................................................... 83
2.3.1.1: Potential Irrigated Area ................................................................................................ 83 2.3.2 - Use of Forest Land ....................................................................................................... 85 2.3.2.1: Forest Area by Forest Designated Functions ............................................................... 85 2.3.2.2: Area Deforested ............................................................................................................ 87
2.3.2.3: Area Reforested ............................................................................................................ 88 2.3.2.4: Area afforested ............................................................................................................. 88 2.3.2.5: Extension Areas in Forest Plantations .......................................................................... 91
2.5. Biological Resources .................................................................................................... 92
2.5.1- Timber Resources ......................................................................................................... 92
2.5.1.1: Forest Resources Management ..................................................................................... 94 2.5.1.2: Forest Production by Type of Product ......................................................................... 95 2.5.1.3: Imports and Exports of Forest Products ....................................................................... 97
2.5.1.5: Export Quantities of Forest Products ........................................................................... 98

iii
2.5.1.6: Fertilizer Demand in Tanzania ................................................................................... 100 2.5.1.7: Fertilizer Availability ................................................................................................. 100
2.5.1.8: Fertilizer Utilisation ................................................................................................... 101 2.5.1.9: Policy and Environmental Related Issues .................................................................. 102
2.5.2- Aquatic Resources ...................................................................................................... 104
2.5.2.1: Fish Capture Production ............................................................................................. 104
2.5.2.2: Import of Fish and Fishery Products .......................................................................... 106 2.5.2.3: Export of Fish and Fishery Products .......................................................................... 107 2.5.2.4: Aquaculture Production .............................................................................................. 108 2.5.2.5: Freshwater Aquaculture ............................................................................................. 108
2.5.3 Crops .......................................................................................................................... 110
2.5.3.1: Area and Production of Food Main Crops ................................................................. 110 2.5.3.2: Annual Crops .............................................................................................................. 111 2.5.3.3: Perennial Crops .......................................................................................................... 112 2.5.3.4: Imports and Exports of Agricultural Crops ................................................................ 114
2.5.4- Livestock .................................................................................................................... 117
2.5.4.1: Number of Livestock by Type in Tanzania ................................................................ 117
2.5.5- Other Non-cultivated Biological Resources ............................................................... 118
2.5.5.1: Regulated Hunting ...................................................................................................... 118 2.5.5.2: Importation and Exportation of Wild Animals ........................................................... 123
CHAPTER THREE .................................................................................................................. 124
RESIDUALS .............................................................................................................................. 124 3.1. Emissions to Air ......................................................................................................... 124
3.1.2- Consumption of Ozone Depleting Substances (ODS) ............................................... 124
3.1.2.1: Refrigeration Sector ................................................................................................... 126 3.1.2.2: Domestic Refrigeration .............................................................................................. 126
3.1.2.3: Commercial Refrigeration .......................................................................................... 126 3.1.2.4: Industrial Refrigeration .............................................................................................. 127 3.1.2.5: Transport Refrigeration .............................................................................................. 127
3.1.2.6: Air Conditioning Activity .......................................................................................... 127 3.1.2.7: Aerosols Activity ........................................................................................................ 127
3.1.2.8: The Use of ODS Alternatives in Economic Activities ............................................... 129 3.1.2.10: Challenges and Opportunities in Adopting ODS Alternatives ................................... 130
3.2. Generation and Management of Wastewater ............................................................. 131
3.2.1- Generation and Pollutant Content of Wastewater ...................................................... 131
3.2.1.1: Sewerage Services and Sanitation in Urban Areas .................................................... 131
3.3. Generation and Management of Waste ...................................................................... 133
3.3.1- Generation of Waste ................................................................................................... 133
3.3.1.1: Solid Waste Generation in Tanzania .......................................................................... 134 3.3.1.2: Generation of Waste in Dar es Salaam City ............................................................... 136
3.3.1.4: Waste Composition in Dar es Salaam ........................................................................ 137
3.3.2 - Management of Waste ................................................................................................ 138
3.3.2.1: Solid Waste Management in Tanzania ....................................................................... 138 3.3.2.2: Legislation Governing Municipal Solid Waste (MSW) Management ....................... 140
3.3.2.3: Management of Hazardous Waste in Tanzania .......................................................... 141

iv
3.3.2.5: Management of Waste in Dar es Salaam City ............................................................ 144 3.3.2.6: Waste Collection and Transportation in Dar es Salaam City ..................................... 145
3.3.2.7: Recovery and Recycling in Dar es Salaam ................................................................ 146 3.3.2.8: Waste Disposal in Dar es Salaam City ....................................................................... 147
3.4. Release of Chemical Substances ................................................................................ 148
3.4.1- Release of Chemical Substances ................................................................................ 148
CHAPTER FOUR ..................................................................................................................... 150 EXTREME EVENTS AND DISASTERS .............................................................................. 150 4.1. Natural Extreme Events and Disasters ....................................................................... 150
4.1.1 and 4.1.2, Occurrence of natural extreme events and disasters; and Impact of Natural
Extreme Events and Disasters .................................................................................... 150
4.2. Technological Disasters ............................................................................................. 156
4.2.1 and 4.2.2, Occurrence of Technological Disasters; and Impact of Technological
Disasters ..................................................................................................................... 156
CHAPTER FIVE ...................................................................................................................... 160
HUMAN SETTLEMENTS AND ENVIRONMENTAL HEALTH ..................................... 160 5.1. Human Settlements ..................................................................................................... 160
5.1.1 Urban and Rural Population ....................................................................................... 160
5.1.1.1: Urban Population ........................................................................................................ 160 5.1.1.2: Rural Population ......................................................................................................... 161
5.1.2- Access to Selected Basic Services .............................................................................. 162
5.1.2.1: Improved Drinking Water Sources ............................................................................. 162
5.1.2.2: Improved Sanitation Facilities .................................................................................... 163
5.1.3 - Housing Conditions .................................................................................................... 164
5.1.3.1: Urban Population Living in Slums ............................................................................. 164
5.1.3.2: Population Living in Hazard Prone Areas .................................................................. 165 5.1.3.3: Hazard Prone Areas .................................................................................................... 165
5.1.3.4: Number of Dwellings with Adequacy of Building Materials Defined by National
Standards .................................................................................................................... 167
5.1.5- Environmental Concerns Specific to Urban Settlements ........................................... 169
5.1.5.1: Number of Private and Public Vehicles ..................................................................... 169 5.1.5.2: Population Using Public Modes of Transportation .................................................... 170 5.1.5.3: Railway Transport ...................................................................................................... 170 5.1.5.4: Marine Transport ........................................................................................................ 171
CHAPTER SIX ......................................................................................................................... 173 ENVIRONMENTAL PROTECTION, MANAGEMENT AND ENGAGEMENT ............ 173
6.2. Environmental Governance and Regulation ................................................................... 173
6.2.1- Institutional Strength .................................................................................................. 173
6.2.1.1: National Environment Management Council (NEMC) .............................................. 173 6.2.1.2: Annual Budgets of the Main Environment Authority ................................................ 174 6.2.1.3: Number of Staff in the Main Environment Authority ................................................ 174
6.2.2- Environmental Regulation and Instruments ............................................................... 175
6.2.2.1: Environment Management Act No. 20 of 2004 (EMA, 2004) ................................... 175 6.2.2.2: Number of Applications for Licenses Received and Approved Per Year .................. 175 6.2.2.3: Budget and Number of Staff Dedicated to Enforcement of Environment Regulations. 176
v
6.2.3- Participation in MEAs and Environment Conventions .............................................. 177
6.3. Extreme Event Preparedness and Disaster Management ........................................... 178
6.3.1 and 6.3.2 - Preparedness for Natural Extreme Events and Technological Disasters ......... 178
6.3.2.1: Disaster Management Institutional Arrangement ....................................................... 179 6.3.2.2: Tanzania Disaster Management Committee (TADMAC) .......................................... 179 6.3.2.3: National Platform for Disaster Risk Reduction .......................................................... 179 6.3.2.4: Disaster Management Committees ............................................................................. 179
6.3.2 - Preparedness for Technological Disasters .................................................................. 181
6.3.2.1: National Disaster Management Tools ........................................................................ 181 6.3.2.2: National Disaster Management Resources ................................................................. 181
6.4. Environmental Information and Awareness ............................................................... 182
6.4.1- Environmental Information ........................................................................................ 182
6.4.1.1: National Environment Statistics Programmes ............................................................ 182 6.4.1.2: Number and Type of Environment Statistics Products and Periodicity of Updates .. 182
6.4.1.3: Existence and Number of Participating Institutions in Inter-agency Environment
Statistics Platforms or Committees ............................................................................ 183
6.4.3- Environmental Perception and Awareness ................................................................. 184
References ................................................................................................................................... 186

vi
List of Tables
Table 1. 1: Annual Mean Maximum Temperature (°C), 2012 - 2016 ......................................... 5
Table 1. 2: Monthly Mean Maximum Temperature (°C), 2012 - 2016 and Long Term Mean
Maximum Temperature (1981 – 2010) ...................................................................... 6
Table 1. 3: Annual Mean Minimum Temperature (°C) for Stations, 2012 - 2016 ...................... 7
Table 1. 4: Monthly Mean Minimum Temperature (°C), 2012 – 2016 and Long Term Mean
Minimum Temperature (1981 -2010) ........................................................................ 8
Table 1. 5: Annual Rainfall (mm), by Stations, 2012 - 2016 ....................................................... 9
Table 1. 6: Monthly Total Rainfall, 2012 – 2016 and Monthly Long Term Mean Rainfall (mm),
1981 – 2010.............................................................................................................. 10
Table 1. 7: Water Basins in Tanzania, 1991 - 2004 ................................................................... 11
Table 1. 8: Transboundary Lakes ............................................................................................... 16
Table 1. 9: Transboundary Rivers .............................................................................................. 16
Table 1. 10: Area of Major Islands in Tanzania Mainland (Km2) ............................................... 22
Table 1. 11: Land Cover (Vegetation Types), Tanzania Mainland, 2015 .................................... 28
Table 1. 12: Types of Ecosystem, 2014 ....................................................................................... 32
Table 1. 13: Some of the Known Endemic Flora Species in Tanzania ........................................ 34
Table 1. 14: Forest Invasive Flora Species .................................................................................. 35
Table 1. 15: Forest Invasive Fauna Species .................................................................................. 35
Table 1. 16: List of National Parks by Area, Year Gazzetted, Bordering Districts and Available
Flora and Fauna, 1960 - 1992 .................................................................................. 38
Table 1.17: Distribution of Game Reserves by Government Notice, Area, Bordering Region and
Year of Gazettement, 1959 -2012 ............................................................................ 41
Table 1.18: Game Controlled Areas by Size, Year of Establishment and Bordering Regions, 1974
- 1974 ....................................................................................................................... 42
Table 1.19: Forest Nature Reserves in Tanzania, by Area, Flora and Fauna and Year of
gazettement .............................................................................................................. 44
Table 1.20: TFS Forest Area Distribution, 2013 - 2017 ............................................................. 51
Table 1. 21: Freshwater Quality Data, Lake Victoria 2013 - 2017 .............................................. 64
Table 2. 1: Tanzania Mineral Reserves for Selected Minerals, 2015 ........................................ 68

vii
Table 2. 2: Mineral Production in Tanzania, 2013 - 2016 ......................................................... 70
Table 2. 3: Mineral Importation in Tanzania, 2010 - 2017 ........................................................ 71
Table 2. 4: Mineral Exports in Tanzania, 2013 - 2016 .............................................................. 72
Table 2. 5: Tanzania Natural Gas Reserve, 2013 - 2017 ........................................................... 74
Table 2. 6: Natural Gas Productions in Tanzania, 2012 - 2017 ................................................. 77
Table 2. 7: Production, Trade and Consumption of Energy, 2013 - 2016 ................................. 78
Table 2. 8: Electricity Generation (GWh) by Type of Fuel, 2011 - 2017 .................................. 79
Table 2. 9: Electricity Consumption (GWh), 2011 - 2017 ......................................................... 80
Table 2. 10: Potential Irrigation Areas ......................................................................................... 85
Table 2. 11: Cumulative Total Area Equipped with Irrigation Infrastructure, 2007/08 – 2016/17
.................................................................................................................................. 85
Table 2. 12: Forest Areas by Designated Functions, 2013 - 2017 ............................................... 86
Table 2. 13: New Forest Plantations Established by TFS Between 2014 and 2017 .................... 87
Table 2. 14: Trend of Reforestation in TFS forest Plantations, 2010 - 2017 ............................... 88
Table 2. 15: Areas Under Forest Plantations, 2017 ..................................................................... 90
Table 2. 16: Use of Forest Land, 2013 - 2017 ............................................................................. 90
Table 2. 17: Extent of Planting in Extension Areas in Forest Plantations, 2011 - 2017 .............. 91
Table 2. 18: Forest Coverage (Ha) by Regions in Tanzania Mainland, 2015 .............................. 92
Table 2. 19: Estimated Contribution of Forestry Sector to GDP in Tanzania ............................. 93
Table 2. 20: Harvesting Quota Allocated by District Harvesting Committees, 2014/15 – 2017/18
.................................................................................................................................. 94
Table 2. 21: The Volume (M3) of Timber Resources Harvested from TFS Forests, 2013 - 201795
Table 2. 22: Types of Forest, Bees Products and Services .......................................................... 96
Table 2. 23: Export Quantities of Forest Products and Values .................................................... 99
Table 2. 24: Fertilizer Demand (Tonnes ) in Tanzania, 2011/12-2016/17................................. 100
Table 2. 25: Fertilizer Availability (Tonnes) in Tanzania - 2008/09-2012/13 ........................... 101
Table 2. 26: Fertilizer Utilization (Tonnes) in Tanzania from 2011/12-2015/16 ...................... 101
Table 2. 27: Summary of Environmental and Social Impacts of Inorganic Fertilizers.............. 104
Table 2. 28: Fisheries Statistics, Tanzania Mainland, 2007 - 2016 ........................................... 106
Table 2. 29: Trend of Import of Fish Products from 2010-2016 ............................................... 107
Table 2. 30: Trend of Export Performance from 2001 - 2016 ................................................... 108
Table 2. 31: Number of Fish Ponds, Aqua Farmers and Production ......................................... 109

viii
Table 2. 32: Seaweed Farmers and Production from 2005 – 2016 ............................................ 110
Table 2. 33: Annual Crops Production (Tonnes), 2012 – 2016 .................................................. 112
Table 2. 34: Production of Perennial Crops (Tonnes “000”), 2012 - 2016 ................................ 113
Table 2. 35: Number of Livestock by Type in Tanzania, 2010 - 2016 ...................................... 118
Table 2. 36: Trend of Some of the Wild Animals (Big five) Hunted From 2000 - 2012 .......... 119
Table 2. 37: Amount of Money (TZS) from Trophy Hunting Disbursed to Different Districts
from 2010/2011 to 2015/2016 ............................................................................... 121
Table 2. 38: Wildlife Products/Live Species Imported into Tanzania in 2015 and 2016 .......... 123
Table 3. 1: Sectors and Sub-Sectors Using ODS Alternatives in the Country ........................ 125
Table 3. 2: Estimated Use by ODS Alternative (Metric tonnes - MT)
................................................................................................................................ 128
Table 3. 3: Summary of Refrigerants Usage in all Activities for 2012 - 2015 (MT) ............... 129
Table 3. 4: Historical and Predicted Consumption of ODS Aternatives, 2012 – 2030 ............ 130
Table 3. 5: Generation, Collection, Treatment and Disposal of Wastewater for the City of Dar
es Salaam, 2013 - 2017 .......................................................................................... 132
Table 3. 6: Generation of Waste by Source for Selected Regions in Tanzania Mainland, 2013 -
2015........................................................................................................................ 135
Table 3. 7: Waste Generated by Source (Dar es Salaam City), 2013 - 2016 ........................... 137
Table 3. 8: Management of Hazardous Waste for Selected Regions in Tanzania Mainland, 2013
- 2015 ..................................................................................................................... 142
Table 3. 9: Waste Recycling Industries in Dar es Salaam City, 2017 ..................................... 147
Table 3. 10: Fertilizer Utilization (Tonnes) in Tanzania from 2011/12-2015/16 ...................... 149
Table 4. 1: Recent Natural Disasters Events and Interventions in Tanzania ........................... 151
Table 4. 2: Recent Technological/ Manmade Disasters Events and Interventions in Tanzania
................................................................................................................................ 157
Table 5. 1: Population Living in Urban and Rural Areas, Tanzania Mainland; 2012 ............. 161
Table 5. 2: Percentage Distribution of the Population Using an Improved Drinking Water,
Tanzania Mainland................................................................................................. 163

ix
Table 5. 3: Percent Distribution of Population Using an Improved Sanitation Facility, 2015/16
................................................................................................................................ 164
Table 5. 4: Percentage Distribution of Households’ by Construction Materials and Area,
Tanzania Mainland, 2000/01, 2007 and 2011/12 HBS’s ....................................... 168
Table 5. 5: Road Network in Kilometres by Status, Tanzania Mainland, 2010 – 2015 .......... 170
Table 5. 6: Freight and Passengers Transported by Railway, Tanzania Mainland; 2010-2016171
Table 5. 7: Marine Transportation of Cargo and Passengers, 2010-2016 ................................ 172
Table 6. 1: Annual Budget of the Main Environment Authority, 2012/13 – 2017/18 ............. 174
Table 6. 2: Number of Staff in the Main Environment Authority, 2013 - 2017 ...................... 175
Table 6. 3: NEMC Zones and Number of Staff, 2017 ............................................................. 175
Table 6. 4: Budget and Number of Staff Dedicated to Enforcement of Environment
Regulations, 2012/13 – 2017/2018 ........................................................................ 177
Table 6. 5: List and Description of MEAs to which Tanzania is a Party ................................. 178
Table 6. 6: National Technical Working Group (NTWG) on Environment Statistics, 2017 ... 184
List of Figures
Figure 1. 1: Annual Cycle of Rainfall for 2 Selected Stations, Bimodal (a) Dar es Salaam and
Unimodal (b) Dodoma ............................................................................................ 3
Figure 1. 2: Monthly Mean Maximum Temperature from 2012 - 2016 compared with Long
Term Mean 1981-2010 .............................................................................................. 6
Figure 1. 3: Monthly Mean Minimum Temperature from 2012 to 2016 Compared With Long
Term Mean 1981-2010 .............................................................................................. 8
Figure 2. 1: Number of Import and Export Permits for Forest Products, 2015 - 2017 ............... 97
Figure 2. 2: Distribution of Perennial Crop Production, 2012 – 2016 ...................................... 114
Figure 2. 3: Import and Export Data for Agricultural Crops, 2012 – 2016 ............................... 115
Figure 2. 4: Trends of Revenue Accrued from Tourist Hunting, 2010/11 – 2015/16 ............... 120
Figure 3. 1: Trends in Sewerage Connections in Regional WSSAs and Dar es Salaam ........... 131
Figure 3. 2: Waste Composition in Dar es Salaam .................................................................... 137
Figure 3. 3: Functional Elements of the Waste Management System ....................................... 139

x
Figure 3. 4: Municipal Waste Collected in Dar es Salaam City (000,000 Tonnes), 2013 - 2016
................................................................................................................................ 144
Figure 5. 1: Percentage of Urban Population Living in Unplanned Settlements, 2015 ............ 165
Figure 6. 1: Number of Applications for EIAs and EAs Received and Approved, 2013 - 2016
................................................................................................................................ 176
Figure 6. 2: Disaster Management Organogram ....................................................................... 180
List of Maps
Map 1. 1: Tanzania Topographical Map .................................................................................... 2
Map 1. 2: Tanzania Annual Mean Total Rainfall Distribution for 30 Years, 1981-2010 ......... 4
Map 1. 3: Tanzania Water Basin Map ...................................................................................... 13
Map 1. 4: Tanzania Administrative Regional Boundaries, International Boundaries, and
Number of Islands .................................................................................................... 21
Map 1. 5: Soil Types in Tanzania............................................................................................. 27
Map 1. 6: Forest Nature Reserves of Tanzania ........................................................................ 47
Map 1. 7: Tanzania Forest Services Agency Zone Distribution .............................................. 48
Map 1. 8: Freshwater Quality ................................................................................................... 63
Map 2. 1: Geological and Mineral Occurences in Tanzania .................................................... 66
Map 2. 2: Natural Gas Discoveries in Tanzania, 2010 - 2015 ................................................. 75
Map 2. 3: National Grid System ............................................................................................... 82
Map 5. 1: Map of Tanzania Showing Five Main Hazards Affecting the Areas ..................... 166

xi
LIST OF ABBREVIATION AND NOTATIONS
3Rs - Reduce, Re- use and Recycle
AASS - Agricultural Annual Sample survey
BAU - Business as Usual
BDAS - Basic Data of Agricultural Sector
BEST - Biomass Energy Strategy in Tanzania
CAN - Calcium Ammonium Nitrate
CBM/ M3 - Cubic Metres
CE - Chief Executive
CFCs - Chlorofluorocarbons
CGL - Comprehensive guideline
CO2 - Carbon-Dioxide
COWSOs - Community-Owned Water Supply Organizations
DANIDA - Danish International Development Agency
DAP - Di Ammonium Phosphate
DAWASA - Dar es Salaam Water Supply Authority
DAWASCO - Dar es Salaam Water and Sewerage Corporation
DBSS - Director of Business Support and Services
DCC - Dar es Salaam City Council
DLAs - Dar es Salaam Local Authorities
DPRU - Director of Planning and Resources Utilization
DRM - Director of Resources Management
EBM - Ecosystem Based Management
EEZ - Exclusive Economic Zone
EIA - Environmental Impact Assessment
EIS - Electric Industry Supply
EMA - Environment Management Act, 2004
ERC - Environment Resources Management
EWURA - Energy and Water Utilities Regulatory Authority
FAO - Food and Agriculture Organization of the United Nations
FBD - Forest and Beekeeping Division
FDI - Foreign Direct Investment
FNR - Forest Nature Reserves
FYDP - Five Year Development Plan
GCA’s - Game Controlled Areas

xii
GDP - Gross Domestic Product
GHGs - Greenhouse Gases
GIIP - Gas Initial in place
GN - Government Notice
GO - Gas Oil
GoT - Government of Tanzania
GWh - Gigawatt-hour
ha - Hectares
HCFCs - Hydrochlorofluorocarbons
HFCs - Hydrofluorocarbons
HFO - Heavy Fuel Oil
ICZM - Integrated Coastal Zone Management
IDF - Irrigation Development Fund
IEA - International Energy Agency
IPPs - Independent Power Producers
ISO - International Organization for Standardization
ITCZ - Intertropical Convergence Zone
IUCN - International Union for Conservation of Nature
IWMI - International Water Management Institute
IWRMD - Integrated Water Resources Management and Development
JESR - Joint Energy Sector Review
JICA - Japan International Cooperation Agency
JNIA - Julius Nyerere International Airport
JPCC - Joint Permanent Commission of Cooperation
KGS - Kilograms
KIA - Kilimanjaro International Airport
Km2 - Kilometers Squares
Ktoe - Kilotons of Oil Equivalent
kWh - Kilowatt-hour
LGA - Local Government Authority
LPG - Liquefied Petroleum Gas
LTM - Long term mean
LVEMP - Lake Victoria Environment Management Project
MEAs - Multi-lateral Environment Agreements
MEM - Ministry of Energy and Minerals
MLF - Multilateral Fund

xiii
MMCFT - Million Cubic Feet
MNRT - Ministry of Natural Resources and Tourism
MoA - Ministry of Agriculture
MOP - Muriate of Potash
MoWI - Ministry of Water and Irrigation
MRP - Minjingu Rock Phosphate
MSW - Municipal Solid Waste
MW - Megawatt
NAFORMA - National Forest Resources Monitoring and Assessment
NAIVs - National Agricultural Inputs Voucher System
NAP - National Agricultural Policy
NEMC - National Environment Management Council
NEP - National Energy Policy
NEP - National Environment Policy
NGUMP - Natural Gas Utilization Master Plan
NIP - National Irrigation Policy
NIRC - National Irrigation Commission
NOU - National Ozone Unit
NPK - Sodium, Phosphorus and Potassium
NRW - Non-Revenue Water
NTWG - National Technical Working Group
ODS - Ozone Depleting Substances
PDA - Personal Digital Assistant
PET - Polyethylene Terephthalate
PFCs - Perfluorocarbons
PIC - Prior Informed Consent
PSMP - Power System Master Plan
REA - Rural Energy Agency
S/A - Sulphate of Ammonia
SADC - Southern Africa Development Community
SAN - Sustainable Agricultural Network
SAP - Subsidiary Action Programme
SDG - Sustainable Development Goals
SDGs - Sustainable Development Goals
SOP - Sulphate of Potash
SP - Strategic Plan

xiv
SVP - Shared Vision Programme
TAFIRI - Tanzania Fisheries Research Institute
TAFORI - Tanzania Forest Research Institute
TANAPA - Tanzania National Parks
TANESCO - Tanzania Electric Supply Company
TAWA - Tanzania Wildlife Management Authority
TCF - Trillion Cubic Feet
TCMP - Tanzania Coastal Management Partnership
TFS - Tanzania Forest Services
TMA - Tanzania Meteorological Agency
TON - Tonnes
TPA - Tanzania Ports Authority
TPDC - Tanzania Petroleum Development Corporation
TRA - Tanzania Revenue Authority
TSP - Triple Super Phosphate
TZS - Tanzania Shillings
UNCLOS - United Nation Convention on the Law of the Sea
UNESCO - United Nations Education, Science and Cultural Organization
URT - United Republic of Tanzania
URT - United Republic of Tanzania
USAID - United States Agency for International Development
USD - United States Dollars
UWSS - Urbanl Water Supply and Sanitation
VPO - Vice President’s Office
WMO - World Meteorological Organization
WQMPCS - Water Quality Management and Pollution Control Strategy
WRMA - Water Resources Management Act
WSSAs - Water Supply and Sanitation Authorities
WSSR - Water Sector Status Report
WUA - Water Users Associations
ZAMCOM - Zambezi Basin Watercourse Commission
xv
PREFACE
The National Environment Statistics Report, 2017 (NESR, 2017) is the first ever national
comprehensive report on environment statistics in Tanzania. Publication of this report has shifted
the paradigm of production of environment statistics in the country, from the conventional
practice of researching on a single environment phenomenon to a multi and inter disciplinary
approach encompassing various aspects of the environment. This transition was made possible
upon National Bureau of Statistics (NBS) request for technical support from United Nations
Statistics Division (UNSD) to enhance the production of environment statistics within the
National Statistical System (NSS) which meet international standards. As a follow up to this
request, the UNSD advised on the use of Framework for the Development of Environment
Statistics (FDES 2013), which was endorsed by the United Nations Statistical Commission
(UNSC) as a guideline for production of environment statistics. FDES 2013 classifies
environment statistics into six components namely, Environmental Conditions and Quality;
Environmental Resources and their Use; Residuals; Extreme Events and Disasters; Human
Settlements and Environmental Health; and Environmental Protection, Management and
Engagement.
Environment statistics is a relatively new field in statistics development when compared with
other branches of statistics such as economic or social statistics. This is understood, since issues
of environment became more prominent after the 1992 Rio Summit. However, in spite of this
perceived infancy, the demand for environment statistics is increasing in tandem with the
ongoing environmental challenges faced by societies. These challenges emanate from use of
technology, population pressure, energy issues, sustainable development and climate change.
The realization that human wellbeing and development depend on the environment has led to an
increasing emphasis on the environment and sustainability concerns on which decisions and
actions need to be taken. For instance, environment is among the three pillars of sustainable
development to ensure environment sustainability is achieved in parallel with social and
economic development of the society. Of paramount importance to these actions is the regular
production of environment statistics of the highest quality to monitor the performance of
national, regional and international development plans, policies and programmes for sustainable
development.
xvi
NESR, 2017 provides a comprehensive picture of the environment situation of the country and it
is an important instrument for policy integration and informed decision making. The NESR,
2017 covers a wide range of environment topics to facilitate one stop access and use of
environment statistics for evidence-based decision making. It provides statistics for monitoring
of national, regional and global development frameworks such as Tanzania Vision, 2025; the
National Five - Year Development Plans; the East Africa Community Vision 2050; the Africa
Development Agenda, 2063; the Sendai Framework for Disaster Risk Reduction 2015 – 2030,
the Paris Climate Agreement 2015 and the UN Sustainable Development Goals, 2030 (SDGs,
2030). These development frameworks articulate environment management milestones to be
attained over the course of time. In this regard, data and information in this report help quantify
the stress that is put on environment and informs the strategies that seek to minimize harm to the
environment and mitigate climate change.
Most of the statistics presented in this report have been gathered from administrative sources
from various institutions and thus, some of the data may already be available in other
publications. NBS as a coordinator for production and dissemination of official statistics within
the NSS appreciates the contributions of all the experts and stakeholders who provided data for
this report. The report provides series of statistics from 2012 to 2016 and whenever possible,
2017 statistics are also presented.
Notwithstanding the foregoing, there are still data gaps that would need to be addressed to
comprehensively meet the high and growing demand for environment data and statistics. NBS in
collaboration with the National Technical Working Group for Environment Statistics (NTWG)
will put more efforts to fill the identified data gaps and update this publication every two years.
NBS will also be producing environment statistics booklets, in between the years of production
of the NESR, which will include frequently produced data to meet data needs.
Production of this report would not have been successful without collaboration of various
participants who contributed valuable inputs throughout the process. In this regard, I wish to
extend my sincere gratitude to the development partners, particularly the World Bank (WB) for
the financial support through the Tanzania Statistical Master Plan (TSMP), the United Nations
Statistics Division (UNSD) and the East African Community (EAC) Secretariat for their
technical support. I appreciate the substantial technical contribution made by Ms. Reena Shah,
the Chief of the Environment Statistics Section at UNSD and the coordinator of Module A of the
UN Development Account project (DA) “Supporting member states in developing and
strengthening environment statistics and integrated environmental-economic accounting for
improved monitoring sustainable development”, of which Module A focused on strengthening
environment statistics in the EAC Secretariat and its member states.
.

xvii
I also wish to extend special thanks to the heads of Ministries, Departments and Agencies
(MDAs) from which members of the NTWG on environment statistics were appointed.
Appreciations are particularly extended to Irenius Ruyobya, Director for Statistical Operations
Directorate and Ruth Minja, Environment Statistics and Further Analysis department Manager at
NBS for managing the compilation of this report. I acknowledge the immense technical and
coordination support provided by Jafari Chobo from Tanzania Metorological Agency (TMA), in
his capacity as Chairperson of the NTWG and of other members of the NTWG indicated below:
Enezaeli Emmanuel Ayo (Dar es Salaam City Council); Mandalo Salum (Tanzania Forest
Service Agency); Ndalu Youbert Amos (National Environment Management Council); Faraja
Ngerageza (Vice President’s Office); Jane Alfred (Prime Minister’s Office); Julius Edward
(Planning Commission); Ansbert S. Rwamahe (Ministry of Natural Resources and Tourism);
Simon Mwansasu (University of Dar es Salaam); Diana Kimbute (Ministry of Water and
Irrigation); Sarah Novaty Kayunze and Obeth Mwakalindile (Ministry of Agriculture); Lait A.
Simukanga (National Irrigation Commission); Thobias M. Sonda (Tanzania Ports Authority);
M.J. Gwambaye (Tanzania People's Defence Forces); Jackson Birore and Aziza Swedi (Ministry
of Mineral); John Francis Kitonga (Ministry of Energy); Brigita Sylvester (Tanzania Electric
Supply Company Ltd); Abel Mhehe Anthony (Ministry of Livestock and Fisheries); Milka Jane
Sangiwa (Tanzania Forest Research Institute); Annes Mahembe (Ardhi University); Deogratius
Malamsha, Pius Kaskana, Opiyo Mamu and Hashim Njowele (NBS) and the NBS editorial team.
NBS welcomes comments and suggestions regarding this report and for improving quality of
future reports. All comments and suggestions should be addressed to the Director General,
National Bureau of Statistics, P.O. Box 796, Dar es Salaam, e-mail [email protected].
Dr. Albina Chuwa
Director General
National Bureau of Statistics
Dar es Salaam.

xviii
EXECUTIVE SUMMARY
The National Environment Statistics Report, 2017 follows the structure proposed by the
Framework for the Development of Environment Statistics, 2013 (FDES 2013), for collection
and compilation of environment statistics at the national level. The report brings together data
and information from various subject areas and sources covering issues and aspects of the
environment that are relevant for measuring, monitoring and decision making for various
environmental phenomena.
Chapter one of the report on Environmental Conditions and Quality, presents statistics about the
physical, biological and chemical characteristics of the environment. In this report, statistics on
meteorology; hydrography; geography; soil characteristics; land cover; ecosystems and
biodiversity; forests; and freshwater quality are presented.
Regarding the climate, the report notes that, most part of Tanzania is characterized by two main
rain seasons, long rains (Masika) from March to May, and the short rains (Vuli) from October to
December. The mean maximum temperatures are observed in September to March, ranging from
26.6°C in southern western to 33.1°C in northern Eastern. The mean minimum temperatures
occur in July, ranging from 5.3°C in southern western regions of the country to 18.3°C in coastal
areas. The report findings also show that, for the period of 2012 - 2016, the observed annual
mean maximum temperature was 28.5 °C while the annual mean minimum temperature was
18.0°C.
The results further indicate an increasing trend of monthly mean maximum temperatures with an
average of 30.0°C for the period of 2012 to 2016 compared to 29.4°C for the long-term period
from 1981to2010. For the period of 2012 to 2016, there hasn’t been significant variability on
annual total rainfall. The minimum amount of annual rainfall was 411.8 mm and maximum
2,280.0 mm.
Regarding hydrographical characteristics, the report underscores the country’s great endowment
of surface water resources, including - rivers; lakes; springs and dams. All lakes and swamps
constitute about 5.8 % of the country’s surface area. Management of these water resources is

xix
based on hydrological boundaries in the form of basins, rather than administrative boundaries.
The report notes that, Rufiji (182,708.10 Km2) and Lake Nyasa (34,266.09 Km
2) are the largest
and smallest basins respectively out of the nine water basins in Tanzania. In addition, seven out
of the nine basins are transboundary in nature.
The report also presents some statistics regarding soil characteristics and land cover; the findings
reveal that, the dominant soil groups in Tanzania are Cambisols (37 %), followed by Luvisols
(7.6 %), Lixisols (6.7 %) and Ferrosols (5.7 %). For the land cover, woodlands and cultivated
lands are the major contributors to the total land cover with 53.6 % and 20.6 %, respectively.
Other types of land cover, like forests, bush land, grass land, open land, water and others,
account for less than 10.0 % of the total land cover each.
With respect to the country’secosystems, the report reveals three dominant types of natural
ecosystems in Tanzania, namely: - terrestrial ecosystems, inland water ecosystems (lakes, rivers,
dams and wetlands), and coastal and marine ecosystems. For the terrestrial ecosystems, the forest
ecosystem occupies 55 % of total land area while the agricultural ecosystem occupies 45 % of
total land area under terrestrial ecosystems. The report also informs about several species of flora
and fauna native to Tanzania. There are six known flora species that are endemic to Tanzania,
namely: - Saintpaulia goetzeana; Saintpaulia shumensis; Allanblackia stulhmanii; Allanblackia
uluguruensis; Ocotea usambarensis; and Afrocarpus usambarensis. The invasive flora species
are: - Maesopsis emini; Leucaena spp; Lantana camara; and Cedrela Mexicana. The invasive
species are among the drivers of environmental changes and important causes of loss of
biodiversity.
Chapter two of the report - Environmental Resources and their Use, presents information about
quantities of environmental resources and their changes, along with statistics on activities related
to their use and management. The report presents statistics on various topics under various
subcomponents of the FDES 2013, particularly on mineral resources; energy resources; land; and
biological resources.
For the mineral resources, the report pictures Tanzania as one of the major mining countries in
Africa, the 4th
major gold producer in Africa, and also endowed with other industrial mineral

xx
reserves, including iron ore (219 million tonnes); titanium (175,000 tonnes); uranium (156
million pounds) and other metals in various quantities. On the production and trade of minerals,
Tanzania is the sole producer of the precious Tanzanite gemstone worldwide. The report
indicates that, for the period of 2013 to 2016, there has been an increase in production of
important minerals such as gold by 1.5 percentage points, diamond by 6.8 percentage points, coal
by 22.1 percentage points, silver by 11.8 percentage points, and copper by 6.2 percentage points.
The increase in mineral production was attributed by the increase in industrial demand. On the
other hand, statistics indicate a decline in production of some mineral resources such as:
Tanzanite by 17.1 percentage points; and tin by 27.5 percentage points. On importation of
minerals, the report findings reveal that, coal and clinker are the two major imported minerals in
Tanzania. The imports for these minerals in 2015 amounted to 244,400 and 50,000 metric tonnes
respectively and, were largely contributed by an increase in demand for cement production. On
the export side, statistics indicate that gold has been the most important exported mineral,
contributing more than 80 % of the country’s exports earnings from minerals for the period 2013
– 2016.
The available statistics demonstrate that there have been some positive results from the
Government strategies to develop the energy sector to ensure reliability, availability,
affordability and access to modern energy services in the country. There has been a palpable
increase in production of natural gas from about 21,000 cubic feet in 2013 to 51,000 cubic feet in
2017. As a result of this increase, use of gas in electricity production accounts for a larger
proportion (51 %), compared to the use of hydro, 35 %; diesel, 13 %. Electricity generation has
also grown considerably, rising from about 5,000 GWh in 2011 to 7,000 GWh in 2017. It also
depicts the commitment of the Government to enhance electricity generation by increasing
installed capacity from 1,583.0 MW 2014 to 10,000MW by 2025 and increasing connection
levels from 32 % in 2016 to 75 % by 2033.
Chapter three - Residuals, presents statistics on the amount and characteristics of remnants
generated by human production and consumption processes, their management and their final
discharge to the environment. The report presents information for subcomponent emissions to
air, particularly on consumption of Ozone Depleting Substances (ODS); and Generation and
Management of Wastewater.

xxi
With respect to emissions to air, Tanzania is a low volume consuming country of the ODS.
However, despite the minimal consumption, there has been a steady consumption of ODS
alternatives for the period of 2012 to 2015, while consumption of Hydro chlorofluorocarbons
(HCFCs), in particular has been on the decline. It is revealed that, Hydrochloro (HC 600a) is one
of the most common ODS alternatives used in Tanzania, which increased from 232.6 MT in
2012 to 636.4 MT in 2015. In order to regulate trade and consumption of ODS, the Government
has put in place licensing regulations for ODS. These regulations oblige people intending to
import or export a controlled substances or products to lodge an application to the Director of
Environment at the Vice President’s Office. On Generation and Management of wastewater,
statistics reveal a general increase in wastewater generation from about 74 million cubic metres
per year in 2013 to 100 million cubic metres per year in 2015. The volume of wastewater
collection and treatment has however, nearly remained nearly stagnant at about 16 million cubic
metres per year during this period. At the same time, there has beena steady increase in volume
of wastewater that is discharged to the environment without treatment from about 57.5 million
M3 to 83.7 million M
3, during this period.
Chapter four of the report- Extreme Events and Disasters presents statistics on the occurrence of
extreme events and disasters and their impacts on humans and on infrastructure. The report
indicates floods, droughts, heavy rainfall and earth quakes being common natural events and
disasters, and notes their occurrence in various parts of the country at various times. The latest
natural disaster was an earthquake which hit Kagera region in 2016. The reported casualties
associated with this disaster were 17 deaths and 440 injuries. The damage to infrastructure
included total demolition of 2,072 private houses, 2,191 partial damages to public buildings and
14,595 private houses. The report also notes fire and motor or marine accidents being the
frequent technological or man-made disasters.
Chapter five of the report presents statistics on the environment in which humans live and work,
particularly with regard to living conditions and environmental health. This information is
covered under various sub-components of the FDES 2013. The NESR, 2017 specifically,
presents statistics on population, access to some basic amenities and housing conditions.

xxii
With regard to population, the Tanzania population distribution is suchthat there are more people
living in rural than in urban areas. The rural-urban population ratio is estimated at 70:30 (2012
Census). With respect to access to some basic services, the statistics showthat nearly six-tenths
of the population (58.6 %) use improved drinking water sources and 67.5 % have access to
electricity. Under one-fifth of the population (19.0 %) use improved toilet facilities.
On housing conditions, the report notes that as of 2012, about 39.4 % of households had their
house floors made of cement or tiles, and 58.6 % of households had their house floors made of
earth. The report also indicates baked or burnt bricks and iron sheets are common building
materials for walls and roofs. About 27.3 % of households had their house walls made of burnt
bricks, while 66.3 % had their house roofs maded of iron sheets.
Chapter six of the report- Environmental Protection, Management and Engagement, presents
statistics and information regarding the country’s engagement in protection and management of
the environment and the resources it dedicates to that task. In particular, it presents information
on Government environmental protection and resource management expenditure; institutional
strength of the environmental management authority; environmental regulations and instruments;
and participation in Multilateral Environmental Agreements (MEAs) and environmental
conventions.
With respect to Government environmental protection and resource management expenditure
and institutional strength of the environmental management authority, the report underlines the
National Environment Management Council (NEMC) as the authoritative office for
environmental management in Tanzania. The NEMC had staffing strength of about 160
employees and budgetary allocation of about TZS 13.1 billion per year as of 2016.
The report also underlines the country’s environmental initiatives towards regional, continental
and global communities. Tanzania as a member of the global community has joined in the global
efforts by taking part in addressing various global environmental challenges through ratification
of several MEAs. Some important MEAs which have been ratified include: - United Nations
Convention to Combat Desertification; Basel Convention on the Control of Transboundary
Movements of Hazardous Wastes and their Disposal; United Nations Framework Convention on

xxiii
Climate Change (UNFCCC); Convention on International Trade in Endangered Species of Wild
Flora and Fauna (CITES); Kyoto Protocol to the United Nations Framework Convention on
Climate Change; and Vienna Convention for the Protection of the Ozone.
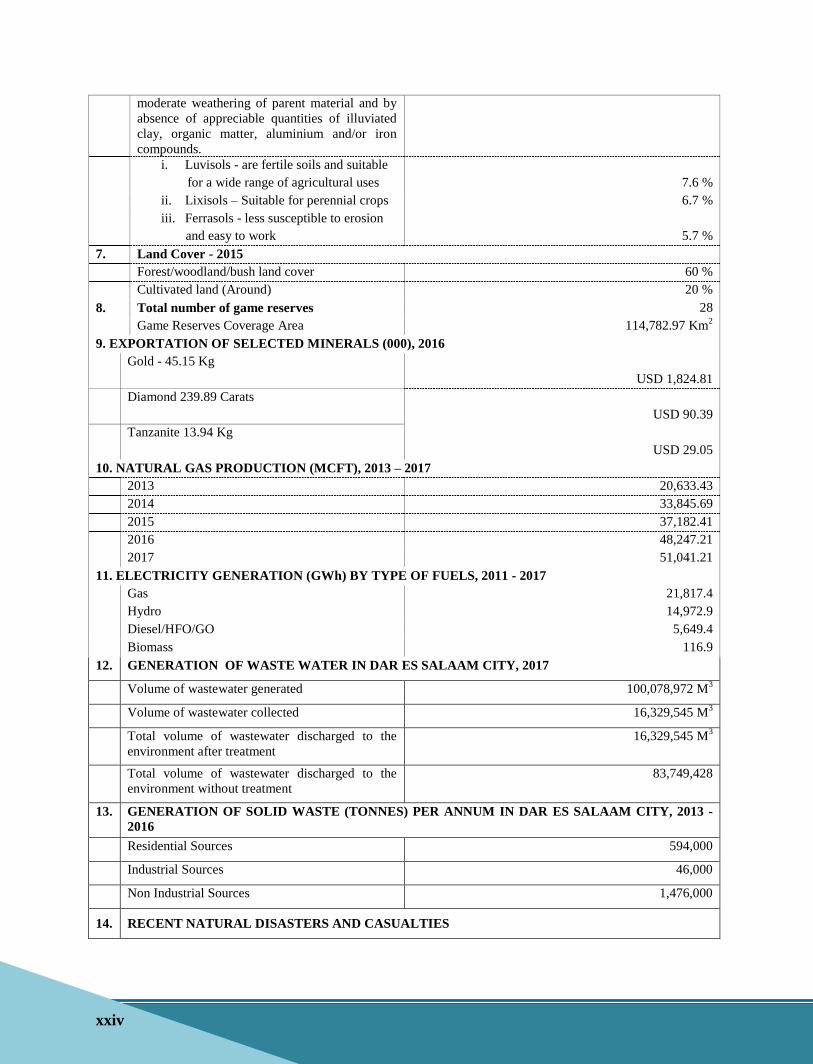
Summary Table of Key Latest Available Environment Statistics, 2013-2017
S/N INDICATOR VALUE
1. TEMPERATURE, 2012 – 2016
Range of Mean minimum temperature (°C) 5.3°C to 18.3°C
Range of Mean maximum temperature (°C) 26.6°C to 33.1°C
2. RAINFALL, 2012 – 2016
Ranges of Annual Rainfall 550 mm to 2500 mm
Minimum Rainfall 411.8 mm
Maximum Rainfall 2,280.0 mm
4. HYDROLOGICAL CHARACTERISTICS VALUE
Largest water basin (Rufiji basin) 182,708 Km2
Smallest water basin (Nyasa basin) 34,266.09 Km2
Lakes and swamps country area coverage 5.4 million hectares
Annual average available renewable water
resources per capita - 2015/2016 1,952 M3/Year
External renewable water resources - 2016 12.27 million M3
Estimated surface water leaving the country -
2016 15,640 million M³/year
Number of dams - 2009 633
Total capacity of large dams - 2009 104,200 million M³
5. WATER USE
Total water withdrawn in year 2012 5,142 million M3
Proportions of Dominant Sectors in Use of The Withdrawn Water Resources
Agricultural sector 90 %
Municipal sector - 2002 10 %
Rural population in Tanzania mainland (2012) 31,623,999
Cumulative water points constructed (from 2007
to 2016) 95,733
Cumulative number of rural population served
with water (from 2007 to 2016) 22,792,322
URBAN WATER SUPPLY & SANITATION
Groundwater withdrawal - 2012 462 million M3
Urban population served with clean and safe
water (23 regional headquarters) - 2016 86 %
Number of people with access to water supply -
2016 4,260,820
Domestic connections - 2016 375,757
Kiosks - 2016 2,013
6. DOMINANT SOIL TYPES IN TANZANIA
Cambisols - soils characterized by slight or 37 %
xxiv
moderate weathering of parent material and by
absence of appreciable quantities of illuviated
clay, organic matter, aluminium and/or iron
compounds.
i. Luvisols - are fertile soils and suitable
for a wide range of agricultural uses 7.6 %
ii. Lixisols – Suitable for perennial crops 6.7 %
iii. Ferrasols - less susceptible to erosion
and easy to work 5.7 %
7. Land Cover - 2015
Forest/woodland/bush land cover 60 %
Cultivated land (Around) 20 %
8. Total number of game reserves 28
Game Reserves Coverage Area 114,782.97 Km2
9. EXPORTATION OF SELECTED MINERALS (000), 2016
Gold - 45.15 Kg
USD 1,824.81
Diamond 239.89 Carats
USD 90.39
Tanzanite 13.94 Kg
USD 29.05
10. NATURAL GAS PRODUCTION (MCFT), 2013 – 2017
2013 20,633.43
2014 33,845.69
2015 37,182.41
2016 48,247.21
2017 51,041.21
11. ELECTRICITY GENERATION (GWh) BY TYPE OF FUELS, 2011 - 2017
Gas 21,817.4
Hydro 14,972.9
Diesel/HFO/GO 5,649.4
Biomass 116.9
12. GENERATION OF WASTE WATER IN DAR ES SALAAM CITY, 2017
Volume of wastewater generated 100,078,972 M3
Volume of wastewater collected 16,329,545 M3
Total volume of wastewater discharged to the
environment after treatment
16,329,545 M3
Total volume of wastewater discharged to the
environment without treatment
83,749,428
13. GENERATION OF SOLID WASTE (TONNES) PER ANNUM IN DAR ES SALAAM CITY, 2013 -
2016
Residential Sources 594,000
Industrial Sources 46,000
Non Industrial Sources 1,476,000
14. RECENT NATURAL DISASTERS AND CASUALTIES

xxv
Earthquake occurred on 10
th September,2016 in
Kagera Region
17 people died and 440 people were injured
15. RECENT TECHNOLOGICAL DISASTERS AND CASUALTIES
Collapse of a Building in Dar es salaam on
29/03/2013
39 People died

xxvi
BACKGROUND, METHODOLOGY, AND CONCEPTS AND
DEFINITIONS
Background
Historically, compilation of environment statistics dates back to 1994 when the National Bureau
of Statistics in collaboration with the Statistics Sweden compiled the first pamphlet on
Environment Statistics. Due to lack of resources, NBS could not manage to maintain periodicity
of environment statistics reports. The next publication was compiled in 2012, followed by 2014.
This publication marks the first comprehensive National Environment Statistics Report in
Tanzania Mainland which is compliant with the International Framework for the Development of
Environment Statistics, FDES 2013. NBS is planning to update this publication every two years
and also produce environment statistics booklet on annual basis to inform the public on the status
of environment for selected high frequency environment statistics such as climate change.
Objectives of Environment Statistics Report
The Environment Statistics Report provides statistical data on various environmental aspects. It
helps in monitoring state of environment of the country over time and provides data for evidence
based decisions on different development programmes. The specific objectives of the
Environment Statistics Report include the following:
i. Measure goods and services provided by the environment to economy and the impact of
the economic activities and development on the environment;
ii. Increase community awareness on the importance of preserving the environment and
support efforts to protect the environment;
iii. Provide data on available and stocked natural resources and the extraction of those
resources;
iv. Provide data on environment pollutants and the extent of its impact on the environment;
v. Combine planning tools with environment statistical indicators;
vi. Monitor the value of the State’s contributions and assistance to preserve the environment;
and
vii. Provide information about the actions taken to protect the environment in the country.

xxvii
Methodology
The environment statistics include a wide range of information which is multidisciplinary in
nature. Data sources are spread over different organizations and data producers, and numerous
methods are applied for their compilation. The data used for production of the National
Environment Statistics Report, 2017 were compiled using a variety of data collection techniques
such as statistical surveys, administrative records, remote sensing (for satellite imaging of land
use, water bodies or forest cover); monitoring systems (field-monitoring stations for water
quality, air pollution and climate); and scientific research and special projects undertaken to fulfil
National and International demand.
In order to produce high quality environment statistics, specific statistical and environmental
expertise, knowledge, institutional development and adequate resources are necessary. This
includes presence and application of an appropriate framework to guide the development,
coordination and organization of efforts for statistics production at all levels. To facilitate this,
NBS has started to apply the United Nations Framework for the Development of Environment
Statistics (FDES) 2013 to guide National Efforts in the production of Environment Statistics.
Adoption of the UN Framework for the Development of Environment Statistics (FDES
2013)
In strengthening production and dissemination of environment statistics, the NBS has been
working in close collaboration with the United Nations Statistics Division (UNSD) for technical
support. This synergy was realized through the UNSD Development Account Project named,
“Supporting Member States in developing and strengthening environment statistics and
integrated environmental-economic accounting for improved monitoring of sustainable
development” of which Module A focuses on strengthening environment statistics in the East
African Community (EAC) Secretariat and its member states.

xxviii
In Tanzania, the UNSD support for production of Environment Statistics has focused on
activities including:
i. Introduction of Framework for Development of Environment Statistics (FDES 2013) and
Environment Statistics Self-Assessment Tool (ESSAT);
ii. Capacity building to enhance knowledge of the environment experts within the NSS;
iii. Improved data quality assurance procedures when comparing the recommended
methodology in the FDES 2013 with the quality dimensions used to compile the available
statistics;
iv. Support on environment statistics’ prioritization using tier classification;
v. Participation in the development of regional EAC Environment Statistics Compendium;
and
vi. Promoting of inter-institutional platforms such as the establishment of the National
Technical Working Group (NTWG) on environment statistics. This is a technical forum
in which issues related to production of environment statistics are discussed and has
representation from Ministries, Department and Agencies (MDAs) responsible for
production of environment statistics in the country.
The introduction of ESSAT enabled Tanzaniato conduct a data gaps assessment to identify
available environment statistics, identify data sources, existing gaps and reasons for non-
availability. Furthermore, adoption of the tools facilitated designing of data capture questionnaire
according to FDES 2013, development of National Environment Statistics Action Plan (NESAP,
2017/18) and development of metadata guidelines to be used by data producers for quality
assurance, to increase transparency in data production and to facilitate data comparison.
The FDES 2013 organizes environment statistics into three tiers based on the level of relevance,
availability and methodological development of the statistics, Using this approach, it has been
possible to identify among others, the Basic Set of Environment Statistics in the country and the
associated methodologies to identify and reclassify the environmental concerns highlighted in
the National Environmental Policy (NEP, 1997) according to the FDES 2013 and identify
environmentally-related SDG indicators which can be monitored using the existing national
environmental frameworks. In effect, this has helped to improve coverage of environment

xxix
indicators for monitoring and implementation of national, regional and global development
programmes.
Main Challenges faced during the implementation of FDES 2013 and ESSAT
This exercise was, however, not without challenges. Among the main challenges faced during
the implementation of the FDES 2013 and ESSAT include:-
i. Lack or incomplete metadata for some indicators from Ministries, Departments and
Agencies (MDAs)
ii. Inexistence of coordinated Information Management Systems in MDAs
Concepts and Definitions for Environment Statistics
Climatology
This refers to Climate and its phenomenon, sometimes understood as the "average weather,” and
is defined as the measurement of the mean and variability of relevant quantities of certain
variables (such as temperature, precipitation or wind) over a period of time, ranging from months
to thousands or millions of years. The classical period is 30 years, as defined by the World
Meteorological Organization (WMO).
Long term Mean
Refers to climatological standard normal which is defined as averages of climatological data
computed for successive 30-year periods (WMO).
Variability
The term is often used to denote deviations of climatic statistics over a given period of time (e.g.
a month, season or year) from the long-term statistics relating to the corresponding calendar
period.
Bimodal Areas
Refers to areas having two rainfall regimes per year.

xxx
Unimodal Areas
Refers to areas having a single rainfall regime per year.
Precipitation (Rainfall)
The total amount of rainfall reaching the ground during a stated period is expressed as the depth
to which it would cover a horizontal projection of the Earth’s surface. The rainfall
averages/totals are based on the daily rainfall measurements. Daily rainfall is defined as the 24-
hour accumulated amount of rain from 8:00 AM on a given day until 8:00 AM the following day.
Temperature
Air temperature is a measure of how hot or cold the air is. It is the most commonly measured
weather parameter. More specifically, temperature describes the kinetic energy, or energy of
motion, of the gases that make up air. As gas molecules move more quickly, air temperature
increases. Air temperature is measured in a shaded enclosure (most often a Stevenson Screen) at
a height of approximately 1.2 metres above the ground. Maximum and minimum temperatures
for the previous 24 hours are nominally recorded at 9 am local clock time. Minimum temperature
is recorded against the day of observation, and the maximum temperature against the previous
day.
Forest
A continuous stand of trees many of which may attain a height of 50 metres. Species
composition is quite different from that of the woodland. Normally has three canopy layers;
emergents, middle and lower canopy with a regenerative canopy beneath. Forests are further
characterized by the presence of lianas, climbers and creepers, and also epiphytes including ferns
and, occasionally, orchids.
Woodland
The canopy coverage in woodland typically ranges between 20–80 % (Closed if crown cover>40
% and Open if crown cover <40), and height between 5–20 metres although occasionally being
taller. Wet woodland is dominated by Brachystegia/Julbernadia sp. (Miombo woodland). Dry
woodland is usually dominated by Acacia. Trees possess recognizable stems, normally single,
that may be measured for both diameter and height. Woodland is characterized by only two main

xxxi
strata - the main canopy itself and a shrub / herb-layer beneath, which often contains
regenerating saplings of the species comprising the main canopy.
Bushland
Bushland differs from Woodland in two principal ways. Stature is less, rarely exceeding 5 m and
normally between 1–3 metres in height. Single-stemmed plants are almost nonexistent. The
exception is when there are occasional trees termed as emergents. Bushland is fundamentally
defined as being predominantly comprised of plants that are multi-stemmed from a single root
base.
Grassland
Predominantly grasses though may contain ground cover of trees or bushes below 10 % of total.
Cultivated Land
The physiognomy varies widely in accordance with the significance of the tree and crop
component associated with each sub-class. The agro forestry systems contain permanent tree
crops (timber and fruit) which are mixed with permanent and annual agricultural crops (yam,
beans, banana, coffee, etc. The tree crops (Gravillea, Albizia, Cordia, Citrus, Acrocarpus, etc.)
which form the upper canopy act as shade to the lower canopy crops (banana, coffee, beans).
Cultivation with herbaceous crops (e.g. cotton, vegetables, sisal, tobacco, flowers etc) where the
tree component may be reduced to the occasional fruit tree or trees retained to demarcate field
boundaries. Cultivation with grain crops is a sub-class that approaches open grassland where the
role of trees is often diminished. Cultivation with pure woody crops of cashew, tea, coffee,
mango, citrus, jackfruit and coconut are common and identifiable as a subclass where the
physiognomy approaches a closed woodland, or woodland with scattered cropland.
Open Land
The common feature is that vegetation cover is almost or entirely absent in each case, although
many rock outcrops often bear small pockets of xerophytes that are botanically very interesting.
These units are not represented extensively upon the maps. Bare soil type may be more widely
represented, but is generally confined to the larger lake shores and disturbed areas.

xxxii
Inorganic Fertilizer
Inorganic fertilizers are natural compounds formed through chemical processes (composed of
natural chemicals and minerals) or are fertilizers mined from mineral deposits or manufactured
from synthetic compounds.
Known Flora and Fauna Species
Endemic species are flora and fauna species which occur in only one geographical region. The
total number of endemic species (i.e. flora and fauna) in Tanzania is not well known but it’s
estimated to range between 400-3000 species. Most of the endemic species are likely to be found
within the Eastern Arc Mountains as they are famously known to harbour a diverse number of
flora and fauna.
Invasive species are the species that are non-native to the ecosystem whose introduction cause
economic and environmental harm. They are among the significant drivers of environmental
change worldwide and important causes of biodiversity loss.
Research to obtain data on known flora and fauna species takes long time to be completed; it
requires professionalism and large investment to capture these data, thus obtaining such data may
seem impossible although through external help some areas have been researched on.
Protected Areas and Species
Protected areas are the sites which are set aside to conserve the wildlife present in that specific
area. In Tanzania, protected areas include 16 national parks that comprise a total area of
57,365 Km2, 28 Game Reserves covering a total area of 114,782.97 Km
2, and 42 Game
Controlled Areas covering a total area of 55,565.02 Km2.
In national parks only nonconsumptive wildlife utilization is allowed while in game reserves and
GCAs both consumptive and non-consumptive wildlife utilization is allowed after permits are
obtained.
Ruaha National Park is the largest covering a total area of 20,300 Km2 while Saanane Island
National park is the smallest, covering an area of 50 Km2.

xxxiii
Most protected areas are affected by encroachment by local communities living near the areas
and illegal hunting activities that affect the management efforts.
Forest Reserves
Forest nature reserves (FNRs) are area that are protected and managed in order to preserve
particular types of habitat and their flora and fauna which are often rare or endangered. No
extraction of woody or animal species is allowed in these FNRs and activities are generally
restricted to research, education and nature-based tourism.
To date Tanzania has a total of 12 forest nature reserves which are managed by Tanzania Forest
Service Agency (TFS).
Minerals
Mineral is any substance, whether in solid, liquid or gaseous form, occurring naturally in or on
the earth, or in or under the seabed formed by or subject to a geological process, but does not
include petroleum or surface water.
Exploration
Exploration is the search for minerals by drilling, trenching, excavation, blasting, disturbance of
the ground by mechanical means, or prescribed geophysical equipment.
Mineral Reserves
Reserve are quantities of mineral resources anticipated to be commercially recoverable by
application of development projects to known accumulations from a given date forward under
defined conditions.
Mineral Production
Mineral production is defined in physical terms as the amount of the mineral extracted from the
deposit within the national territory in a given period of time, usually a year.
Mining
Mining is the extraction of ore from the ground.

xxxiv
Surface Mining
Surface mining involves the removal of overburden and waste rock, drilling of the ore, blasting,
loading and transporting the materials for storage or beneficiation.
Underground Mining
Underground mining involves excavating of either, a vertical shaft, a horizontal adit or an
inclined passageway. It involves ore extraction from the ground, which is then transported,
refined and processed (ore dressing).
Ores dressing
Ores dressing is themilling and separation of ore minerals from gangues.
Refining or Purification
Refining or Purification is the removal of impurities from substance; it depends on the nature of
the metals and impurities.
Smelting
Smelting is the process of recovering metals from mineral concentrates.
Mineral Imports
Mineral imports are defined in physical terms as the amount (in mass or volume) of the minerals
that is produced or extracted by non-residents outside the national territory and that is bought by
the residents of the national territory in a given period of time, usually a year.
Export of Minerals
Exports are defined in physical terms as the amount (in mass or volume) of the minerals that is
produced by the residents of the national territory and sold to non-residents in other territories in
a given period of time, usually a year.

xxxv
Natural Gas
Natural gas is a fossil fuel naturally occurring as a gaseous mixture of light hydrocarbons in
sedimentary rocks. Main constituents of natural gas are methane, ethane, propane, butane and
pentane with other non-hydrocarbons compounds including carbon dioxide, hydrogen, sulphide,
nitrogen and rare gases found in small quantities.
Natural Gas Reserves
Natural Gas Reserves are quantities of gaseous energy resources anticipated to be commercially
recoverable by application of development projects to known accumulations from a given date
forward under defined conditions.
Natural Gas Production Field
Production field is an oil and gas producing area which has been given a specific name by
regulatory bodies.
Energy Production
Production of energy is defined as the capture, extraction or manufacture of fuels or other energy
products in forms which are ready for general consumption.
Renewable and Non-renewable Energy
Renewable energy: are energy resources which are naturally replenished on a human timescale
while Non-renewable energy sources are finite in nature and do not get replenished.
Primary Energy Production
Primary energy products are extracted or captured directly from natural resources such as crude
oil, coal, firewood and natural gas. Or primary energy is energy from sources that involve only
extraction or capture with or without separation from contiguous materials, cleaning or grading
before the energy embodied in that source can be converted into heat or mechanical work.
Import of Energy
Import of energy is energy such as petroleum, electricity, coal, LPG, JetA1 and etc that is
imported or brought into the domestic territory from other territories or countries.

xxxvi
Total Energy Supply
Total energy supply is the total energy supply which includes primary energy and secondary
energy supply.
Final Energy Consumption
Final energy consumption is the energy consumption by final user i.e. energy which is not being
used for transformation into other forms of energy.
Electricity Generation
Electricity generation is the production of electric energy and power from any primary source of
energy.
Fuel
Fuel is a material which can be burnt or processed to produce heat or power. Fuel types/sources
include water (hydro), gas, oil (diesel oil, heavy fuel oil/HFO, gas oil/GO), biomass, coal, and
others.
Electricity Consumption
Electricity consumption is the use of electric energy.
Electricity Consumption Groups:
Domestic Use (D1): This represents usage tariff for domestic customers who on average
consume less than 75kWh per month, and the power is supplied at low voltage levels.
General Use (T1): Represents general usage tariff for customers such as residential, small
commercial and light industries, public lighting and billboards, where power is supplied at low
voltage levels.
Low Voltage Supply (T2): Represents a usage tariff for general use customers with an average
consumption of more than 7500kWr and demand not exceeding 500kVA per reading metre
reading period.

xxxvii
High Voltage Supply (T3): Represents tariff for customers connected to medium voltage.
Zanzibar (T5): Represents tariff for customers connected to high voltage. These include Zanzibar
Electric Company (bulk power to Zanzibar Electric Company-ZECO) and Twiga cement.
Kahama Gold Mine (T8): represents a power usage tariff for Kahama mining company
(Bulyanhulu mine)
High voltage supply (T3) refers to the supply of ac or dc voltage of the amount equal or above
to sixty six thousand plus or minus ten percent (66,000-10 % kW).
Low voltage supply (T2) refers to the supply of ac or dc voltage less or equal to four hundred
plus or minus five percent (400-5 % kW).
Electricity Supply is defined as sale of electricity to consumers.
Electricity access is defined as the proportion or percentage of the population living within 600
metres from a transformer.
Connection level is the proportion or percentage of population/households with metreed
electricity.
Irrigation
Irrigation is the application of a specific amount of water at a particular location in order to meet the
requirements of a crop growing at that location in amounts that are appropriate to the crop’s stage of
growth. It can also mean the application of water in amounts necessary to bring soil to the desired
moisture level prior to crop planting.
Irrigation Potential
Irrigation potential is the total area which is technically feasible, economically and financially profitable,
socially viable and environmentally acceptable that has been brought under irrigation, plus that which
can be planned for irrigation on the basis of water availability, land availability and suitability.
Developed Irrigation Scheme
Developed irrigation scheme is an irrigation scheme that is provided with technically constructed or
installed irrigation infrastructure and facilities.

xxxviii
Irrigation Scheme
Irrigation scheme is the area where crops are grown under irrigation through any method including flood
recession; gravity or pump fed canal systems supplying either surface or groundwater; water harvesting
and pressurised systems such as drip and sprinkler. Irrigation schemes include traditional schemes,
rehabilitated or upgraded schemes, new smallholder investment and purely private commercial
investment.
Traditional Irrigation Scheme
Traditional irrigation scheme is an irrigation scheme with irrigation system comprising of
temporary infrastructure and/or facilities that are not technically constructed/installed
Ozone Depleting Substances (ODS) Alternatives
Ozone depleting substances (ODS) alternatives are those substances which deplete the ozone
layer and are widely used in refrigerators, air conditioners, fire extinguishers, in dry cleaning, as
solvents for cleaning, electronic equipment and as agricultural fumigants. They include:
Chlorofluorocarbons (CFCs), Halon, Carbon tetrachloride (CCl4), Methyl chloroform
(CH3CCl3), Hydrobromofluorocarbons (HBFCs), Hydrochlorofluorocarbons (HCFCs), Methyl
bromide (CH3Br), and Bromochloromethane (CH2BrCl).
The ODS are controlled by the Montreal Protocol, an internationally legally binding instrument
which came into force in January 1989.
Ozone is a gas that occurs naturally in the atmosphere. Each ozone molecule contains three
atoms of oxygen and is denoted chemically as O3. Ozone has a pungent odour that allows it to be
detected even at very low amounts.
Ozone Layer is a band of Ozone-rich air located at an altitude ranging from 10-50 Km in the
upper part of Earth’s atmosphere called the “stratosphere”. The Ozone layer has the function of
filtering biologically harmful ultraviolet solar radiation.
xxxix
Servicing: Means any act of repair, maintenance, testing and trouble shooting of parts, including
mechanical and electrical components of an existing refrigeration and air conditioning
equipment.
Chlorofluorocarbon: a family of chemicals containing chlorine, fluorine and carbon.
Hydrochlorofluorocarbon: a family of chemicals containing hydrogen, chlorine, fluorine, and
carbon.
Hydrofluorocarbons: a family of chemicals containing hydrogen, fluorine and carbon.
Hydrofluoroolefin: a family of chemicals containing hydrogen, fluorine and carbon, with a
double bond in the molecule.
Roadways
This refers to the total distance in Kilometers of paved and unpaved roads in the country.
Marine Transport
Sea and Inland water ways transport services; it covers the number of passengers or tonnage of
cargo transported by water ways in the country
Waste
Means any matter whether liquid, solid, gaseous or radioactive, which is discharged, emitted or
deposited in the environment in such volume, composition or manner likely to cause an
alteration of the environment, and includes such waste as may be prescribed under the
(Environmental Management, Act No. 20 of 2004).
Waste Management
Waste Management is defined as the discipline associated with control of generation, storage,
collection, transport or transfer, processing and disposal of waste materials in a way that best
addresses the range of public health, conservation, economics, aesthetic, engineering and other
environmental considerations.

xl
Hazardous wastes
Hazardous wastes imply toxic, flammable, corrosive or radioactive waste. These include motor
oil, diesel, fuel, gasoline (petrol), paint, solvents, dry cell and batteries, pesticides and infectious
or medical wastes from hospitals and clinics. They also include metallic and/or oily sludge or
solvents from commercial and industrial establishments, asbestos materials, pesticides,
radioactive wastes, and the like.
Recycling
Is the process of converting waste products into new products to prevent energy usage and
consumption of fresh raw materials. Recycling is the third component of Reduce, Reuse and
Recycle waste hierarchy. The idea behind recycling is to reduce energy usage, reduce volume of
landfills, reduce air and water pollution, reduce greenhouse gas emissions and preserve natural
resources for future use.

1
CHAPTER ONE
ENVIRONMENTAL CONDITIONS AND QUALITY
1.1: Physical Conditions
1.1.1: Atmosphere, Climate and Weather
1.1.1.1: Background
This topic provides information on atmosphere, climate and weather compiled and managed by
Tanzania Meteorological Agency (TMA). TMA is a Government Agency established by the
Government Executive Agency Act No.30 of 1997 and officially launched on 3rd
December
1999. The Agency is responsible for provision of meteorological services; weather forecasts,
climate services and warnings and advisories information for the country. TMA is operating as
an agency under the Ministry of Works, Transport and Communications. Among the roles of
TMA are to monitor and predict the state and behaviour of the atmosphere, climate change and
variability; and their impacts to communities. In fulfilling this role, TMA issues statement on the
status of Tanzania climate annually. The statements provide detailed information on temperature
and rainfall distribution, extreme weather events and their socio-economic impacts in the
country.
1.1.1.2: Physical Features
Tanzania has complex topographical features extending from coastal belt of the western Indian
Ocean with sand beaches to an extensive plateau with altitude ranging from 1,000 to 2,000
metres above mean sea level. The plateau is fringed by narrow belts of highlands, including
Mount Kilimanjaro (5,895m), the highest mountain in Africa and other mountain ranges such as
Livingstone, Kipengere, Udzungwa, Uluguru, Nguu, Usambara and Pare mountains. Tanzania
has several freshwater bodies, including Lake Victoria, the largest in Africa; Lake Tanganyika,
the longest and deepest in Africa; and Lake Nyasa. Tanzania has many large rivers including
River Kagera, Mara, Ruaha, Rufiji, Pangani, Ruvuma and Malagarasi.

2
Map 1. 1: Tanzania Topographical Map
Source: Tanzania Meteorological Agency (TMA)
1.1.1.3: Climatology of Tanzania
The climate of Tanzania is characterized by bimodal and unimodal rainfall regimes. The northern
part of the country including areas around Lake Victoria Basin (Mwanza, Kagera, Mara,
Shinyanga, Geita and Simiyu), North-Eastern Highlands (Kilimanjaro, Arusha and Manyara) and
the Northern Coast (Dar es Salaam, Tanga and Northern Morogoro ) experience two main rain
seasons (bimodal) namely, long rains (Masika) which normally begins in mid March and end at
the ends of May and short rains (Vuli), which begins in mid October and continues to early
December (Figure 1.1a). The Central part of the country (Dodoma and Singida), the Southern
part (Ruvuma, Lindi and Mtwara), the Western areas (Kigoma, Tabora, Katavi and Rukwa) and
South-western Highlands (Mbeya, Njombe, Iringa and Southern Morogoro) have a prolonged
unimodal rainfall regime that start in November and continues to the end of April (Figure 1.1b).
These rain seasons are associated with the southwards and northwards movement of the
Intertropical Convergence Zone (ITCZ). Annual rainfall amount varies from 550 mm in the

3
central parts of the country to 2500 mm in some parts of surrounding Lake Victoria as indicated
in Map 1.2.
Figure 1. 1: Annual Cycle of Rainfall for 2 Selected Stations, Bimodal (a) Dar es Salaam
and Unimodal (b) Dodoma
(a) Dar es Salaam
(b) Dodoma
Source - Tanzania Meteorological Agency

4
Map 1. 2: Tanzania Annual Mean Total Rainfall Distribution for 30 Years, 1981-2010
Source: Tanzania Meteorological Agency (TMA)
Temperatures are generally are evenly distributed whereby mean maximum temperature is
normally experienced in February and ranges from 26.6°C in Southern Western Highlands to
33.1°C in Northern Eastern Highlands. Mean minimum temperatures normally occur in July
from 5.3°C in Southern Western Highlands to 18.3°C in coastal areas.
1.1.1.4: Annual Mean Maximum Temperature Records from Meteorological
Stations
Table 1.1 presents annual mean maximum temperature for Tanzania for the period of 2012 to
2016 with overall mean maximum temperature of 28.5°C. The results further indicate that, the
highest mean maximum temperature observed was 32.2°C recorded at Julius Nyerere
International Airport (JNIA) meteorological station in Dar es Salaam in 2012. The lowest mean
maximum temperature was 23.7°C recorded at Mbeya meteorological station in 2014. Available

5
Key Message
The monthly mean maximum
temperatures are showing a rising trend
with an average of 30.0°C for the period
from 2012 to 2016 compared to 29.4°C
for the long-term period from 1981-2010,
both observed in October.
statistics show that, annual mean maximum temperature variations from station to station are
small.
Table 1. 1: Annual Mean Maximum Temperature (°C), 2012 - 2016
Station 2012 2013 2014 2015 2016 Mean
Bukoba 26.5 26.5 26.4 27.3 26.2 26.6
Mwanza 28.6 27.3 28.3 28.6 28.9 28.6
Musoma 28.7 28.9 28.2 29.7 28.6 28.8
Kigoma 29.5 29.2 28.1 29.9 30.0 29.3
Tabora 30.3 30.2 29.5 30.3 30.5 30.1
Dodoma 29.2 29.6 29.1 29.6 29.4 29.4
Iringa 27.8 27.4 26.4 27.4 27.2 27.0
Arusha 26.2 25.7 25.8 26.5 26.6 26.3
Kilimanjaro (KIA) 30.8 30.3 29.7 30.4 30.1 30.1
Dar es Salaam (JNIA) 32.2 32.1 32.0 32.0 31.3 31.8
Mtwara 30.6 31.0 30.7 31.1 30.9 30.9
Songea 26.7 27.3 26.7 27.7 28.0 27.5
Mbeya 25.1 24.6 23.7 26.2 24.0 24.6
Mean 28.6 28.5 28.0 29.0 28.6 28.5
Source: Tanzania Meteorological Agency (TMA)
1.1.1.5: Monthly Mean Maximum Temperature
Monthly mean maximum temperature refers to
average maximum temperature for a period of one
month and Long Term Mean (LTM) maximum
temperature is the mean value of monthly average
maximum temperature over the period of 30 years
(1981 – 2010). For this report the mean
maximum temperature presented in Table 1.2 are
averages of monthly maximum temperature of all
meteorological stations presented in Table 1.1.
Overall, long term mean monthly maximum
temperature was 28.2°C while, for the shorter
period of 2012 to 2016, mean monthly maximum
temperature observed was 28.7°C. The hottest
mean monthly maximum temperature for both

6
long term and shorter period (2012 - 2016) was observed in October with temperature of 29.4°C
and 30.0°C respectively.
The comparison of temperature between the shorter period (2012 - 2016) and long term mean
temperature indicates that, the temperature for the period (2012 - 2016) are higher than long term
means for all months as indicated in Figure 1.2.
Table 1. 2: Monthly Mean Maximum Temperature (°C), 2012 - 2016 and Long Term Mean
Maximum Temperature (1981 – 2010) Year Jan Feb Mar Apr May Jun Jul Aug Sep Oct Nov Dec Mean
2012 29.3 29.9 29.5 28.1 27.5 27.4 27.5 28.2 29.2 30.3 29.5 28.9 28.8
2013 29.3 29.9 29.3 28.2 27.7 27.3 27.5 27.9 29.3 30.0 30.0 28.8 28.8
2014 29.0 28.4 28.9 28.2 27.4 27.8 27.4 28.4 28.4 29.8 29.7 29.0 28.5
2015 28.6 30.0 29.8 28.0 27.8 27.7 27.9 28.6 29.6 29.9 29.0 28.7 28.8
2016 28.4 28.9 29.8 27.9 27.9 27.3 26.8 28.1 28.5 29.9 29.6 28.5 28.5
Mean (2012-2016) 28.9 29.4 29.5 28.1 27.7 27.5 27.4 28.2 29.0 30.0 29.6 28.8 28.7
LTM (1981-2010) 28.5 29.0 28.9 28.0 27.3 26.8 26.6 27.4 28.7 29.4 29.2 28.6 28.2
Source: Tanzania Meteorological Agency (TMA)
Figure 1. 2: Monthly Mean Maximum Temperature from 2012 - 2016 compared with Long
Term Mean 1981-2010
Source: Tanzania Meteorological Agency (TMA)

7
Key Message
The lowest monthly mean minimum
temperature was observed in July
(15.9°C and 15.6°C for the period of
2012 - 2016 and long term mean (1981 -
2010) respectively.
1.1.1.6: Annual Mean Minimum Temperature Records for Meteorological Stations
from 2012 to 2016
Table 1.3 shows that, the annual mean minimum temperature was 18.0°C from 2012 to 2016. In
addition, the highest mean minimum temperature was 23.2°C observed at JNIA meteorological
station in Dar es Salaam in 2016 while, the lowest minimum temperature was about 11.7°C
observed at Mbeya meteorological station in 2012.
Table 1. 3: Annual Mean Minimum Temperature (°C) for Stations, 2012 - 2016
Station 2012 2013 2014 2015 2016 Mean
Bukoba 17.9 18.1 18.4 18.6 18.9 18.6
Mwanza 17.9 17.5 18.6 18.9 18.6 18.7
Musoma 18.2 18.7 17.9 18.3 17.7 18.0
Kigoma 19.2 19.4 19.9 19.7 19.8 19.8
Tabora 17.7 17.6 16.9 16.9 15.9 16.6
Dodoma 17.7 17.8 17.9 17.7 17.7 17.8
Iringa 15.3 14.7 15.5 15.3 15.2 15.3
Arusha 15.1 14.6 15.3 15.5 15.3 15.4
Kilimanjaro 18.0 17.6 17.1 17.6 18.6 17.8
Dar es Salaam 22.4 22.3 22.5 23.1 23.2 22.9
Mtwara 21.5 20.9 21.2 21.5 21.4 21.4
Songea 14.9 14.2 15.7 12.2 15.6 14.5
Mbeya 11.7 20.9 14.1 12.0 14.4 13.5
Mean 17.8 18.2 17.9 17.8 18.1 18.0
Source: Tanzania Meteorological Agency(TMA)
1.1.1.7: Monthly Mean Minimum Temperature
Monthly mean minimum temperature refers to
average minimum temperature for a period of one
month and Long term mean (LTM) minimum
temperature is the mean value of monthly average
minimum temperature over the period of
1981to2010. The minimum temperature averages
presented in Table 1.4 are averages of all
meteorological stations presented in Table 1.3. It
is indicated that, the long term mean minimum
temperature was 18.3°C compared to 18.1°C for
the period of 2012 to 2016.

8
The results indicate that the lowest mean minimum temperature was observed in July for both
long term and shorter period of 2012 to 2016 with 15.6°C and 15.9°C respectively. Likewise,
when compared to the long term mean (1981 – 2010) with five years’ period from 2012 to 2016,
monthly mean minimum temperature shows no significant changes in temperature trends (Figure
1.3). Although the monthly mean minimum temperature for shorter period (2012 - 2016) was
slightly higher than the long term mean for the whole period.
Table 1. 4: Monthly Mean Minimum Temperature (°C), 2012 – 2016 and Long Term Mean
Minimum Temperature (1981 -2010) Year Jan Feb Mar Apr May Jun Jul Aug Sep Oct Nov Dec Mean
2012 19.8 20.4 19.9 19.4 18.2 16.6 15.8 16.9 18.1 19.6 19.9 20.2 18.7
2013 20.3 20.1 20.5 19.7 18.2 15.9 15.6 16.7 18.1 19.5 20.5 20.1 18.8
2014 19.9 19.9 19.8 19.4 18.3 17.9 16.4 18.1 17.9 19.7 19.7 19.8 18.9
2015 19.9 20.0 19.6 18.6 18.6 16.9 16.4 16.9 18.0 20.1 20.2 20.1 18.8
2016 19.9 20.2 20.9 20.0 18.3 16.7 15.8 15.6 17.3 18.7 20.0 18.1 18.5
Mean (2012-2016) 19.9 20.0 20.0 19.4 18.3 16.7 15.9 16.8 17.8 19.4 20.0 19.7 18.1
LTM (1981-2010) 19.5 19.5 19.5 19.2 18.0 16.3 15.6 16.3 17.5 18.8 19.5 19.6 18.3
Source: Tanzania Meteorological Agency (TMA)
Figure 1. 3: Monthly Mean Minimum Temperature from 2012 to 2016 Compared With
Long Term Mean 1981-2010
Source: Tanzania Meteorological Agency (TMA)

9
Key Message
Based on TMA observations for the period
of 2012 to 2016, the annual total rainfall
variability is not significantly pronounced
because of the nature of rainfall patterns
with minimum being 411.8mm and
maximum 2,280.0mm.
1.1.1.8: Annual Rainfall Records for Meteorological Stations (2012 – 2016)
Annual rainfall refers to total amount of rainfall
over a period of one year for the location
(station). Table 1.5 indicates that on average, for
the period of 2012 to 2016, Tanzania received
annual rainfall of 893.9 mm recorded from
different meteorological stations. It is also
observed that, the amount of rainfall recorded in
bimodal areas ranged from 411.8 mm (recorded
at Kilimanjaro International Airport (KIA)
station in Kilimanjaro) to 2,280 mm at Bukoba
meteorological station. On the other hand,
recorded rainfall in unimodal areas ranged from
452.2 mm recorded at Dodoma meteorological
station to 1,332.9 mm (recorded at Mtwara meteorological station). The available rainfall
statistics show that the annual rainfall variability is not significantly pronounced because of the
nature of rainfall patterns. However, inter-seasonal and inter-annual variability and shift in
rainfall patterns are very common.
Table 1. 5: Annual Rainfall (mm), by Stations, 2012 - 2016
Rainfall Regime Station 2012 2013 2014 2015 2016 Mean
Bimodal Areas
Bukoba 2,280.0 1,863.3 2,227.2 1,755.1 1,452.9 1,915.7
Dar es Salaam 702.6 1,004.4 1,278.9 1,038.9 782.9 961.5
Mwanza 1,307.5 1,125.6 971.4 1,530.7 1,039.3 1,194.9
Musoma 646.3 766.2 720.9 1,038.0 627.2 759.7
Kilimanjaro (KIA) 429.2 411.8 501.7 482.8 492.5 463.6
Morogoro 646.7 551.8 993.8 587.6 587.6 673.5
Unimodal Areas
Mtwara 646.3 1,157.1 1,023.9 1,072.0 1,332.9 1,046.4
Songea 896.0 1,072.7 1,010.8 852.3 846.7 935.7
Tabora 810.8 939.8 826.5 957.4 911.6 889.2
Kigoma 735.3 999.9 832.7 951.6 913.5 886.6
Mbeya 508.1 1,028.3 1,220.3 876.0 952.6 917.1
Iringa 545.3 859.1 885.5 555.4 757.6 720.6
Dodoma 620.9 487.4 489.7 452.2 545.2 519.1
Annual Mean 828.8 872.7 968.8 934.6 864.8 893.9
Source: Tanzania Meteorological Agency (TMA)

10
Key Message
For the period of five years from (2012
- 2016) monthly mean rainfall
decreased by 4.5 mm which is about 5
% as compared to the long term mean
(1981-2010). This gives an indication
that monthly rainfalls are declining in
most parts of the country.
1.1.1.9: Monthly Total Rainfall
Monthly total rainfall refers to total amount of
rainfall accumulated over a period of one month and
Long term mean (LTM) rainfall is the mean value
of monthly total rainfall over the period of 30 years
(1981 – 2010). Monthly rainfall averages in Table
1.6 below are averages of all stations presented in
Table 1.2 above. For the period of 30 years (1981 -
2010) the highest mean monthly total rainfall was
160.9 mm, which was recorded in March and the
overall period mean was 83.3 mm. On the other
hand, the period of five years from 2012 to 2016
Tanzania received, on average of 78.8 mm rainfall
per month with the maximum observed in April,
which accumulated to 172.9 mm. Generally, it is
observed that, monthly mean rainfall decreased by
4.5 mm during this five year period, which is about 5 % when compared to long term mean. This
gives an indication that rainfall has been declining in most parts of the country in recent years.
Table 1. 6: Monthly Total Rainfall, 2012 – 2016 and Monthly Long Term Mean Rainfall
(mm), 1981 – 2010
Year Jan Feb Mar Apr May Jun Jul Aug Sep Oct Nov Dec Mean
2012 86.2 95.4 93 151.5 93.8 24.1 2.6 17.9 14.9 63.9 92.6 138.4 72.9
2013 144.2 63.2 196 147.8 62.8 0.4 9 13.1 33 23.2 95.2 142.7 77.6
2014 108.7 140.9 185.3 180.7 60.2 15.4 4.5 20.6 42.8 61.9 105.3 117.9 87.0
2015 123 57.7 122.8 171 100.3 9.2 5.1 9.4 11 63.3 164.3 132.2 80.8
2016 191.8 131.2 140 213.6 41.1 9.2 2.2 8.3 14.1 27.8 64.6 66.6 75.9
Mean (2012-2016) 130.8 97.7 147.4 172.9 71.6 11.7 4.7 13.9 23.2 48 104.4 119.6 78.8
LTM (1981-2010) 133.9 113.4 160.9 155.6 82.5 16.7 9.3 13.3 18.7 53 99.8 142.3 83.3
Source: Tanzania Meteorological Agency (TMA)

11
1.1.2 - Hydrographical Characteristics
Tanzania adopted Basin Management Approach for water resource management in the 1980s
when the country was divided into nine basins through Act No.10 of 1981, which was an
amendment of the Principal Act No. 42 of 1974. Since then, there have been several initiatives
on formal water management institutions. In 1991, the first National Water Policy was launched
to augment the changes in the water sector. In 1993, the Rufiji Basin Water Board was launched
and the Rufiji Basin Water Office started operating in the same year. Later, in 1997, the Principal
Act for water management, i.e. the Water Utilization (Control and Regulation) Act No. 42 of
1974 was amended to accommodate further changes.
Early in 1995 a comprehensive review of Tanzania’s water resources policies and institutions
was carried out by the Government of Tanzania, World Bank and DANIDA (DANIDA & World
Bank, 1995). The nine Basin Water Boards are fully responsible for regulating and planning
water resources and uses within the basin borders.
Table 1. 7: Water Basins in Tanzania, 1991 - 2004 S/N Basin Catchment
Area (Km2)
Drainage Basin Year of
Establishment
I Pangani 55,176.82 Indian Ocean 1991
II Wami / Ruvu 66,867.18 Indian Ocean 2000
III Rufiji 182,708.10 Indian Ocean 1993
IV Ruvuma 102,743.38 Indian Ocean 2004
V Lake Nyasa 34,266.09 Indian Ocean 2001
VI Lake Rukwa 77,808.92 Endorheic basin 2001
VII Lake Tanganyika 167,732.23 Atlantic Ocean 2004
VIII Lake Victoria 114,508.14 Mediterranean Sea 2001
IX Internal Drainage 143,697.76 Endorheic basin 2004
Total
(Km2)
945,508.62
Source: MoWI, WSSR, 2016

12
Key Message
Water resources management is based on
hydrological boundaries and not
administrative boundaries. The largest
basins is Rufiji (182,708 Km2), about 20%
of Tanzania Surface Area.
The Rufiji Basin is the largest basin covering
an area of 182,708 square kilometers (about 20
% of Tanzania). The river drains into the Indian
Ocean. The land use in the basin includes
agriculture, mining, forestry, livestock keeping,
fishing, wild life, navigation and human
settlements. The Rufiji Basin comprises four
major rivers namely: - The Great Ruaha River,
Kilombero River; Luwegu River and Rufiji
(lower part of main river). The climate in the
basin differs from the coast to the highlands in
the upper parts of the catchments. The Average rainfall varies from 400 mm in the drier areas to
2000 mm in wetter parts.

13
Map 1. 3: Tanzania Water Basin Map
Source: Ministry of Water and Irrigation

14
Key Message
In the hydrological year 2015/2016 annual
average available renewable water
resources per capita recorded 1,952 M3
which is above the lowest annual average
of 1,700 M3 acceptable internationally.
1.1.2.1: Water Resources Availability
Tanzania is endowed with numerous and diverse
water resources in the form of rivers, lakes,
groundwater aquifers, ponds, reservoirs, and
wetlands. The country is riparian to some of
Africa’s largest trans-boundary freshwater lakes
(URT, 2006). Each of these water bodies exhibits
unique characteristics and a complex range of
water resources management development issues
as well as challenges. With its numerous water
bodies, the country is perceived to have abundant surface and groundwater resources for meeting
its present consumptive and non-consumptive needs.
River discharge and lake levels start rising in November-December and generally reach their
maximum in March-April with a recession period from May to October/November. Many of the
larger rivers have flood plains, which extend far inland with grassy marshes, flooded forests and
ox-bow lakes.
The lakes and swamps cover 5.4 million hectares and comprise 5.8 percent of the country (SEI,
2007). The major ones include: - Lake Victoria, Lake Tanganyika and Lake Nyasa, which also
form the border to neighbouring countries. Other lakes are Lake Rukwa, Lake Eyasi, Lake
Manyara and Lake Natron.
The available annual renewable water resources in Tanzania is about 89 Km3 as of 2015/2016
hydrological year with possibility of decreasing with time, hence reducing the annual average
available renewable water resources per capita. This decline could be attributed to different
reasons including climate change effects, inadequacy in planning and water security
infrastructures, population increase, increase of social economic activities, catchment
degradation as well as water user conflicts. However, in the hydrological year 2015/2016 annual
average available renewable water resources per capita has been recorded as 1,952 M3 which is
above the lowest annual average of 1,700 M3 acceptable internationally. However, if efforts are

15
Key Message
Tanzania shares more international
water resources (6 lakes, 5 rivers and
7 aquifers), than any other country in
Africa.
not taken, such amount is expected to be depleted to an average annual per capita of 883 M3 in
2035 (WSSR, 2016).
1.1.2.2: International Water Issues
Tanzania shares six international lakes and five
international rivers including three of the largest
African river basins - Nile, Congo and Zambezi, and
seven international aquifers. This is more than any
other nation in Africa in comparison. A larger part of
the country’s international borders are water bodies.
The Ruvuma River forms a boarder with
Mozambique, Lake Tanganyika with the Democratic
Republic of the Congo, Zambia and Burundi, Lake
Nyasa and the Songwe River with Malawi, the Kagera River with Rwanda and Uganda and Lake
Victoria with Uganda and Kenya. As a result, the United Republic of Tanzania is part of
numerous transboundary institutions and agreements for the management of these shared water
resources.
Some important international agreements on the use of water resources are: - the SADC’s Shared
Water Course Systems Protocol, Lake Tanganyika Authority (LTA), the Joint Water
Commission Agreement between Tanzania and Mozambique in 2007, the Lake Victoria
Tripartite Agreement, Cooperative Framework Agreement for the River Nile Basin ratified in
2015.
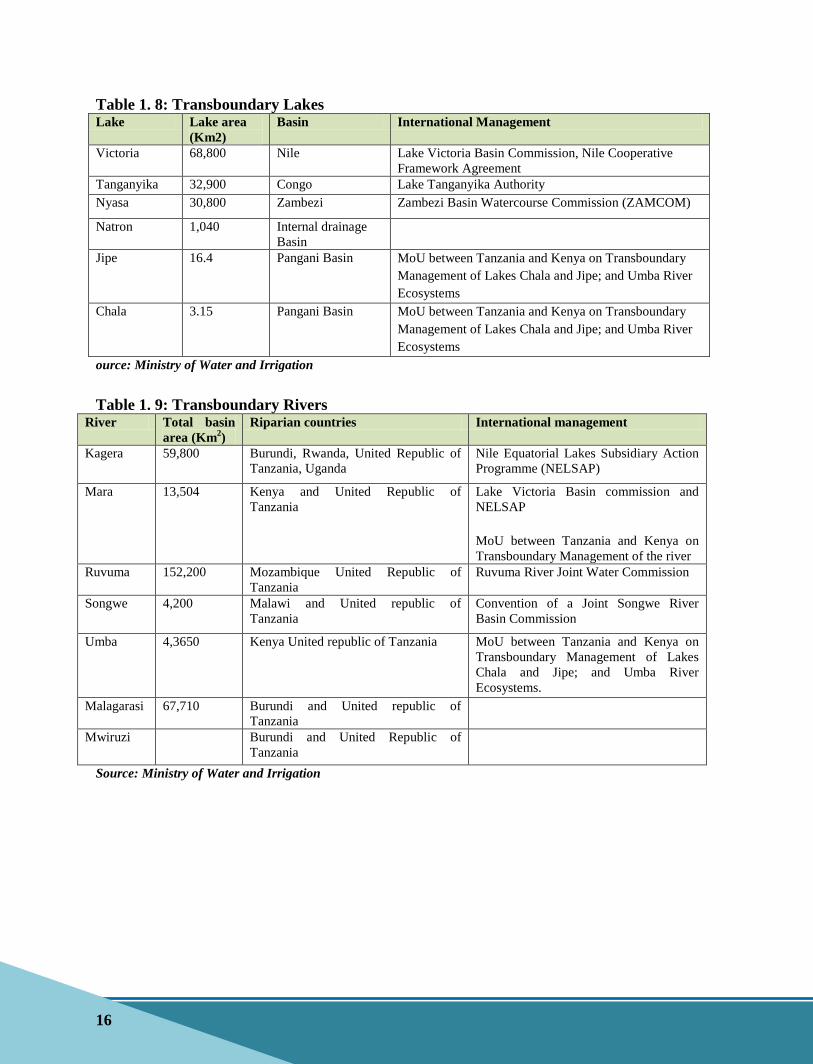
16
Table 1. 8: Transboundary Lakes Lake Lake area
(Km2)
Basin International Management
Victoria 68,800 Nile Lake Victoria Basin Commission, Nile Cooperative
Framework Agreement
Tanganyika 32,900 Congo Lake Tanganyika Authority
Nyasa 30,800 Zambezi Zambezi Basin Watercourse Commission (ZAMCOM)
Natron 1,040 Internal drainage
Basin
Jipe 16.4 Pangani Basin MoU between Tanzania and Kenya on Transboundary
Management of Lakes Chala and Jipe; and Umba River
Ecosystems
Chala 3.15 Pangani Basin MoU between Tanzania and Kenya on Transboundary
Management of Lakes Chala and Jipe; and Umba River
Ecosystems
ource: Ministry of Water and Irrigation
Table 1. 9: Transboundary Rivers River Total basin
area (Km2)
Riparian countries International management
Kagera 59,800 Burundi, Rwanda, United Republic of
Tanzania, Uganda
Nile Equatorial Lakes Subsidiary Action
Programme (NELSAP)
Mara 13,504 Kenya and United Republic of
Tanzania
Lake Victoria Basin commission and
NELSAP
MoU between Tanzania and Kenya on
Transboundary Management of the river
Ruvuma 152,200 Mozambique United Republic of
Tanzania
Ruvuma River Joint Water Commission
Songwe 4,200 Malawi and United republic of
Tanzania
Convention of a Joint Songwe River
Basin Commission
Umba 4,3650 Kenya United republic of Tanzania
MoU between Tanzania and Kenya on
Transboundary Management of Lakes
Chala and Jipe; and Umba River
Ecosystems.
Malagarasi 67,710 Burundi and United republic of
Tanzania
Mwiruzi Burundi and United Republic of
Tanzania
Source: Ministry of Water and Irrigation

17
1.1.2.3: Water Use
Total water withdrawal in Tanzania was estimated for the year 2002 to be 5,142 million M³.
Agriculture was the largest water withdrawal sector with almost 90 % of total, and in particular
irrigation (86 %) which is only one percentage point higher than the 2002 National Water Policy
and the 2009 Water Resources Management Act targets. In addition, the municipal sector used
10 % and industry less than one percent.
1.1.2.4: Rural Water Supply
In the course of implementation of the Water Sector Development Programme (WSDP I) (July
2007 to June 2016), a total number of water points constructed is 50,995 benefiting 11,607,822
people. The total cumulative achievement is 95,733 water points, serving 22,792,322 people in
rural areas of Tanzania Mainland, equivalent to 72 % of the 31,623,999 people of rural
population, according to 2012 Population and Housing Census (WSSR 2016).Water Su
Sanitation
1.1.2.5: Urban Water Supply and Sanitation
There are 130 Regional and Districts Urban Water Supply and Sanitation Authorities (WSSAs)
regulated and licensed by the Energy and Water Utilities Regulated Authority (EWURA). These
are classified into categories A, B and C according to financial capability. As of 2017, there are
15 registered WSSAs in category “A”, which are Dar es Salaam Water Supply Authority
(DAWASA), 13 regional WSSAs and Kahama District Utility. Four water supply and sanitation
authorities, namely, Singida, Kigoma, Sumbawanga and Bukoba are registered as category B,
Swhile 6 Regional WSSAs, 8 National projects and 97 District WSSAs are registered as category
C, (WSSR 2016).
In Dar es Salaam City, there are interventions which have been commissioned by the
Government to provide reliable water services to the growing population in the DAWASA/ Dar
es Salaam Water & Sewerage Corporation Dar es Salaam Water & Sewerage Corporation
(DAWASCO) service area. These interventions include construction of transmission main and
rehabilitation and expansion of systems. The programme planned to increase water production

18
capacity from 300 million litres per day to 756 million litres per day; current demand in Dar es
Salaam City is 510 million litres per day.
The construction, rehabilitation and expansion efforts have resulted in 1,383,610 additional
people who are making a total of 2,201,625 people served with safe and clean water. There are
currently 143,495 water supply domestic connections and 246 kiosks in suburban areas of Dar es
Salaam. Despite these achievements, DAWASA is faced with problem of non revenue water
(NRW) which is currently recorded at 53 % against the internationally recommended target
value of 20 %. Studies and remedial actions are being taken to reduce physical and commercial
losses (WSSR 2016).
In Regional WSSAs there are also interventions underway to increase water supply services and
reduce water losses; 4,260,820 people have access to water supply through 375,757 domestic
connections and 2,013 kiosks in the 23 regional headquarters equivalent to 86 % of urban
population served with clean and safe water. NRW in almost all regional WSSAs is still higher
than the recommended target value of 20 %. By June 2016, the average NRW in all regional
urban utilities was 35 %.
1.1.2.6: Water Management
Water resources in the United Republic of Tanzania are managed according to the 2009 Water
Resources Management Act (WRMA) at five levels, from national to local: i) national water
board, ii) the nine basin water boards, iii) catchment water committees, iv) district councils and
v) water users associations (WUA). The latter are organized in water catchments and are
responsible for managing allocation of water resources at local level, managing equitable
allocation of resources during drought, and mediating local disputes (Medmu, Magayane, 2005).
The nine basin water boards are responsible for preparation of Ingrated Water Resources
Managemenat and Development (IWRMD) Plans, (MoWI, 2017). Regarding water supply and
sanitation services, Community-Owned Water Supply Organizations (COWSOs) are in charge in
rural areas, and Water Supply and Sanitation Authorities (WSSA) in urban areas.

19
1.1.2.7: Groundwater Resources
It is unquestionable that groundwater is an important resource for human life and ecosystem
sustenance. Groundwater availability is mainly controlled by geology and climate, and is
unevenly distributed across the country. The groundwater has huge potential for complementing
the surface water sources, it accounts for over 97 % of the accessible global freshwater resource.
In many countries, Tanzania included groundwater is often the main source for domestic water
supply apart from widely being used for irrigated agriculture and industry. (JICA, 2002
coordinated by the Ministry of Water and Irrigation).
1.1.2.8: Groundwater Governance
The principal instruments that regulate water resources in Tanzania are the Water Resources
Management Act, (WRMA) No. 11 of 2009 and the Water Supply and Sanitation Act, No. 12 of
2009. These legislations regulating water resources management and water delivery respectively
built on the 2002 National Water Policy.
In order to properly guide and control drilling activities, the Government in 2013 published the
Groundwater (Exploration and Drilling) Licensing Regulations in Government Notice No.219.
Groundwater licensing is a legal requirement to comply with the Water Resources Management
Act No. 11 of 2009 Section 62. Licensing of all water well exploration consultants and drilling
contractors ensures better relations with (and information flow to) the water resources
administration, higher standards of well construction, improved reports on the hydrogeological
conditions encountered, and reduced likelihood of illegal well construction.
As of 2017, there are 65 registered groundwater drilling companies and 13 registered
groundwater exploration companies (MoWI, Jan 2018). The main persistent challenge, which
contineus to be ahindrance to groundwater utilization and development, is paucity of data. More
efforts are needed in order to get relevant information on available and minable groundwater
resources.

20
1.1.3 - Geological and Geographical Information
1.1.3.1: Geographical Location, Boundaries and Area
1.1.3.2: Location
Tanzania is located in Eastern Africa between longitudes 290 and 41
0 East and latitudes 1
0 and
120
South. The most Northerly point is Mutukula (10 01' S and 31
0 25' E), most Southerly point-
Mtalika (110 32' S and 37
0 05' E. The most Westerly and Easterly points are Kigoma (4
0 52' S
and 290 38' E) and Msimbati (10
0 21' S and 40
0 26' E).
1.1.3.3: Boundaries
Tanzania Mainland is bordered on the north by Kenya and Uganda; on the west by Rwanda,
Burundi and Democratic Republic of the Congo; on its south sestern side by Zambia and
Malawi; in the south by Mozambique and in the east by the Indian Ocean.

21
Map 1. 4: Tanzania Administrative Regional Boundaries, International Boundaries, and
Number of Islands
Source: Tanzania in Figures, 2016

22
Key Message
Protection of Coastal and Marine resources
is a national policy priority which needs to
be implemented based on an integrated
multistakeholder approach led by coastal
communities.
1.1.3.4: Major Islands in Tanzania Mainland
The two major islands of Ukerewe (in Lake Victoria) and Mafia (in the Indian Ocean) have a
total area of 1,165 Km2
which is about 0.12 % of the total country area. There are also several
other small Islands.
Table 1. 10: Area of Major Islands in Tanzania Mainland (Km2)
Major Islands in Tanzania Mainland Area (Km2) Percent
Ukerewe 647 0.07
Mafia 518 0.05
Total Island 1,165 0.12
Total Area of Tanzania Mainland 945,508.62 100.00
Source: Tanzania in Figures, 2016
1.1.3.5: Description about Coastal Area
Tanzania Mainland’s coastline is both
ecologically and economically important to the
nation. The coastline is approximately 800 km
long, extending from the Kenyan border in the
north (4o
7’S) to the Mozambican border in the
south (10o 5’S), (TPA & TAFIRI, 2007). The
coastline is somewhat straight and is bounded
by sandy, open beaches and some cliff out
croppings in the south and with extensive
mangrove forests in the riverine estuaries and
deltas. It encompasses five coastal regions
which are Mtwara, Lindi, Pwani, Dar es Salaam
and Tanga. About 10 rivers drain into the Indian Ocean, of which Pangani in the north, Rufiji in
the middle and Ruvuma in the south are the main ones. The smaller rivers include Zigi, Wami,
Ruvu, Matandu, Mavuji, Mbwemkuru and Lukuledi.
23
The continental shelf is characterised by seagrass, fringing coral reef and island habitats. The
shelf is generally narrow, dropping sharply after the depth of 60 M. The 200 m depth is about 2
Km from the coast at the narrowest point and 80 Km at the widest point. The widest points are
the Zanzibar and Mafia Channels and off the Rufiji Delta. With the exception of the narrow
coastal belt, most of the country lies on the Great African Plateau with altitudes ranging between
1,000 and 2,000 M above the mean sea level, (TCMP 2001). It also has three large islands of
Mafia, Unguja and Pemba.
The coastal Districts cover about 15 % of the Nations total land area and they support 25 % of
the population or 11.2 million people (Census 2012), it is projected that the coastal population
will increase to 20 million by 2025 (Akwilapo, 2007).
1.1.3.6: International Legal Frameworks for Coastal and Marine Resources
Governance
The URT government has signaled its intent and commitments to protect coastal and marine
areas in the country by adopting numerous international and regional conventions that are
concerned with the sustainable use and conservation of these areas. The country has
implemented these instruments at the national level using a wide variety of tools including the
establishment of MPAs, implementation of SDGs 14 through FYDP II and other policies
relevant for marine environment conservation, protection, and sustainable use. These
international legal frameworks include:-
(i) United Nations Convention on the Law of the Sea (UNCLOS) 1982
(ii) UNCLOS provides that some ocean areas are under national jurisdiction while others are
beyond the jurisdiction of any single state, i.e. open to all states, whether coastal or
landlocked. Beyond the limits of national Exclusive Economic Zones (EEZs) or in the
high sea, UNCLOS recognizes high seas freedoms of navigation, over flight, cable
laying, fishing, and scientific research, etc. The URT enacted this convention by the
parliament as Territorial Sea and Exclusive Economic Zone Act 1989, stated that the EEZ
shall not extend beyond 200 nautical miles from the baseline from which the breadth of
the territorial sea is measured.

24
(ii) The Convention for the Protection, Management and Development of the Marine
and Coastal Environment of the Eastern African Region (Nairobi Convention)
The Nairobi Convention was adopted in 1985 and came into force in 1996. The principle
objective of the Nairobi Convention is to establish close cooperation to protect and
improve the state of wild fauna and flora and natural habitats in the East African region
through the establishment of specially protected areas in the marine and coastal
environment. Article 10 of the Nairobi Convention requires all Parties to the convention
to take appropriate measures to protect and preserve rare or fragile ecosystems as well as
rare, depleted, threatened or endangered species and their habitats.
1.1.3.13: Environment Legislation
(i) National Environment Policy (NEP, 1997)
The National Environmental Policy (NEP) of 1997 is an overarching national
environment policy, which focuses on the conservation of the environment and the
effective use of natural resources. The policy identifies six major environmental problems
to be addressed, namely: - loss of wildlife habitats and biodiversity; deforestation; land
degradation; deterioration of aquatic systems; lack of accessible good quality water; and
environment pollution.
The government admits in this policy that, the country needs to adopt environmentally
sustainable natural resource management practices in order to ensure that long-term
sustainable economic growth is achieved. It can therefore be concluded that, the policy
recognizes that the country's long-term economic growth is dependent, among other
factors, upon its coherent natural resource management. The Policy thus provides the
framework for mainstreaming environment consideration in decision making processes.
(ii) Environment Management Act (EMA, 2004)
The EMA is the main legal framework for the management of the environment in
Tanzania. It was enacted by the Parliament of the URT in 2004 and came into force in
2005. Prior to its enactment, environment management issues were governed and
regulated by sectorial laws. Thus, EMA establishes an administrative and institutional

25
arrangement to facilitate administration of environment matters across the different
government institutions, from the local to national level. The Act provides a legal and
institutional framework for the sustainable management of the environment. It outlines
principles of environment management, environment impact and risk assessment,
prevention and control of pollution, waste management, environment quality standards,
public participation in environment decision making and planning; environment
compliance and enforcement; implementation of international instruments on
environment; and implementation of the NEP (Daffa J, 2011).
In Cap 191 the Act emphasizes the protection of Coastal environment zones,
conservation of biological diversity and protection of atmosphere. It also empowers the
NEMC to cooperate with Local Government Authorities (LGAs) to formulate strategies
to deal with coastal and marine management.
1.1.3.14: Economic Importance of Coastal Area
About 80 % of industries in Tanzania are located in Dar es Salaam. These include: - food,
beverage and animal feed processing; chemical and cosmetic production; metal product
manufacture; paper product, printing and publishing industries; wood products manufacture and
construction materials production; electrical appliance and battery industries; motor vehicle
servicing; glass product manufacture; ginnery and tobacco processing; and mining. In addition,
tourism and the hospitality industry are centred around the city’s beaches. The marine
environment off Dar es Salaam receives pollutants from these sources through streams, sewer
and storm water outflows. Some of the streams also drain the densely-populated areas of the city.
Even though the level of industrialization is still low, untreated municipal and industrial
wastewater discharges cause significant localized pollution (Machiwa, 2010).
The other major economic activities in the coastal areas of Tanzania include mariculture
development and natural gas exploration. There is also a substantial potential for agriculture,
offshore fisheries, shipping activities, urban development, small scale mining and manufacturing.

26
1.1.3.15: Coastal Resources Degradation
The main causes of coastal degradation include:-
a. Population growth which causes excessive exploitation and uncontrolled use of coastal
and marine resources e.g. mangrove cutting.
b. Increasing pressure from tourism,
c. Major developments associated with industrial growth,
d. Coral mining which is increasing to supply building material for construction activities.
e. Lack of non-resources dependant jobs in rural coastal area.
1.1.3.16: Coastal Area Management
Ecosystem-Based Management (EBM) approach recognizes that maintaining the structure and
function of ecosystems is vital and that human uses and ecosystem health are interdependent.
Tanzania’s ocean ecosystems and its marine biological diversity are core national assets. If their
use is well managed, they can meet a broad range of economic, social and cultural aspirations.
Marine planning under various policies uses entire ecosystems as the basic planning unit. As a
result, marine plans seek to integrate across jurisdictions and sectors to ensure that all impacts on
the ecosystem are considered concurrently.
For this reason, an Integrated Coastal Zone Management (ICZM) approach, conservation and
restoration of critical habitats and areas of high biodiversity are important intervantions. These
intervatntions are carried in line to ensuring that the coastal people continue to benefit from the
sustainable use of the resources, and most importantly, building the capacity of both human and
institutions for managing the coastal zone in an integrated manner.
1.1.4 - Soil Characteristics
Map 1.4 indicates soil types in Tanzania. The most dominant soil type in Tanzania is Cambisols
(37 %). This type of soil is characterized by slight or moderate weathering of parent material and
by absence of appreciable quantities of illuviated clay, organic matter and aluminium or iron
compounds. Other dominant types of soils are Luvisols (7.6 %), Lixisols (6.7 %) and Ferrasols
(5.7 %). The remaining soil types have composition of less than 5 %. Luvisols are fertile soils
and suitable for a wide range of agricultural uses. They are important soils in Morogoro,
Dodoma, Arusha, Manyara, Kilimanjaro, Tanga and Ruvuma regions. Perennial crops are

27
preferred over annual crops in Lixisols and they are important soils in Lindi, Mtwara, Ruvuma
and Mbeya regions. Most Ferrasols in Tanzania have good physical properties, less susceptible
to erosion and easy to work. Ferrasols are mainly found in Kigoma, Rukwa, Mbeya, Morogoro,
Tanga, Kilimanjaro, Dar es Salaam and Mtwara regions.
Map 1. 5: Soil Types in Tanzania
Source: SADC/FAO
1.2. Land Cover, Ecosystems and Biodiversity
1.2.1- Land Cover
The most recent statistics on land cover types are presented in National Forest Monitoring and
Assessment of Tanzania Mainland, 2015 (NAFORMA, 2015). A similar assessment was

28
conducted by Hunting Technical Services Limited (HTSL) between 1993 and 1995. Such
assignments are costly and it takes a long time, usually ten years, before another assessment is
done. Results from NAFORMA Land Use Land Cover change indicate that the rate of
deforestation between 1995 and 2010 was 372,816 ha per year compared to 130,000 ha and
500,000 ha per year that was reported by Tanzania to the Global Forest Resource Assessment
(FRA) covering the period 1990 -2000.
More than 60 % of Tanzania is covered with forest/woodland/bushland as indicated in Table
1.11. Cultivated land is around 20 % but there is a small percentage imbedded in
forest/woodland/bushland and to a greater extent in grasslands.
Table 1. 11: Land Cover (Vegetation Types), Tanzania Mainland, 2015
Land Cover Sub-types Area (ha) Percent
Forest Humid montane 995,300 1.1
Lowland 1,656,500 1.9
Mangrove 158,100 0.2
Plantation 554,500 0.6
Woodland Closed Woodland 8,729,000 9.9
Open Woodland 35,997,300 40.8
Woodland with scattered cropland 2,530,900 2.9
Bushland Thicket 971,900 1.1
Dense Bushland 2,012,400 2.3
Bushland with Emergent Trees 309,400 0.4
Thicket with Emergent Trees 308,300 0.4
Open Bushland 2,843,500 3.2
Bushland with scattered cropland 1,162,700 1.3
Grassland Wooded Grassland 4,712,300 5.3
Bushed Grassland 438,900 0.5
Open Grassland 3,091,100 3.5
Grassland with scattered cropland 596,600 0.7
Cultivated land Agro-forestry system 1,373,000 1.6
Wooded crops 1,521,100 1.7
Herbaceous crops 5,045,400 5.7
Mixed tree cropping 154,700 0.2
Grain crops 9,866,700 11.2
Open land Bare Soil 161,100 0.2
Salt Crusts 18,300 0.0
Rock outcrops 73,100 0.1
Water Inland water 154,700 0.2
Swamp 1,007,900 1.1
Others Unspecified (built up areas etc.) 1,892,700 2.1
Total 88,337,400 100.0
Source: NAFORMA Report -2015

29
Key Message
Natural ecosystems in Tanzania are
classified into three major types
namely: - terrestrial; inland water;
and coastal and marine ecosystems.
Key Message
Terrestrial Ecosystems which
relates to forest ecosystems occupy
55 % of the total land area of
which Agricultural ecosystem
occupies 45 % of terrestrial
ecosystems.
1.2.2- Ecosystems and Biodiversity
Tanzania is constituted by Tanzania Mainland and
Zanzibar with a total surface area of 945,087 Km2
comprised of land area of 883,749 Km2 (881,289 Km
2
mainland and 2,460 Km2 Zanzibar Islands), plus
59,050 Km2 inland water bodies (VPO, 2014).
Natural ecosystems in Tanzania can be categorized into
three major types namely: - terrestrial ecosystem;
inland water ecosystem; and coastal and marine
ecosystem. Terrestrial ecosystems include forest and
agricultural areas. Inland water ecosystems include
wetlands, freshwater lakes, rivers and their catchments and dams. Coastal and marine ecosystems
include mangroves, coral reefs, seaweeds and sea-grass beds (URT, 2014).
Terrestrial Ecosystems relates to forest ecosystems
which occupy 55 % of the total land area, equivalent to
about 48 million ha (480,000 Km2), of which 93 % is
covered by woodlands and only 3 % is covered by other
forest ecosystems including coastal forests, humid
montane forest and plantations (VPO, 2015).
Woodlands- Woodlands in the country include miombo
and Acacia-commiphora woodlands. Miombo is a
vernacular word that has been adopted by ecologists to
describe those woodland ecosystems dominated by trees
in the genera Brachystegia, Julbernardia and Isoberlinia. Miombo woodlands cover more than
20 million ha or about 40 % of Tanzania’s land area. Acacia-commiphora woodlands cover
much of northern and central Tanzania, extending around the eastern margins of Lake Victoria.
Montane forests - which are located in the mountainous areas, cover about 2 million hectares of
land (or about 4 % of the total forest cover) (URT, 2014).

30
Agricultural ecosystems - Tanzania is endowed with about 44 million hectares of arable land
(approximately, 45 % of total land area), out of which only 24 % is under crop production (URT,
2014). It is estimated that about 80 % of the cultivated land consists of traditional subsistence
farming systems in which there is considerable diversity of crops and species grown and sizeable
variety in the ways in which they are grown.
Inland Water Ecosystems occupy about 20 % of the total land area. They are comprised of
wetlands (10 %) including those of international importance – Ramsar sites (5.5 %); freshwater
lakes (6.1 %); and rivers and their catchment areas. Tanzania has over 2,810 rivers and streams
including permanent and seasonal, 2,325 springs, 440 lakes and dams, and 22,379 deep
boreholes (URT, 2014).
Wetlands- There are about 115 different wetlands ecosystems occupying 10 % of the total land
area of Tanzania mainland (approximately 88,300 Km2) harbouring over 650 associated species,
such as molluscs, crustaceans, echinoderms and fish (VPO, 2015). The major wetlands include
Kilombero, Malagarasi-Muyovosi, Rufiji-Mafia, Lake Natron and Ihefu. In terms of their
distribution, 60 % extend over village land while the remaining 40 % is located over public land
(URT, 2014).
Lakes- Tanzania comprises a chain of freshwater and alkaline lakes located mainly on the Rift
Valley covering a total area of 54,337 Km2 (or about 6.1 % of the total country’s surface area).
The major lakes are: - are Victoria, Tanganyika and Nyasa.
Rivers- Majority of the river ecosystems are not protected with few exceptions such as those
under protected montane forests and Ramsar sites. The major rivers include Rufiji, Ruvu,
Pangani, Malagarasi and Mara (URT, 2014; VPO, 2015).
Dams- Dams cover over 85,000 ha of land area in Tanzania. The major dams include two large
reservoirs of Mtera (610 Km2) and Nyumba ya Mungu (180 Km
2). Three medium–large dams
include Hombolo (1,537 Km2), Kidatu (10 Km
2) and Pangani. There are also many other small
dams and reservoirs (URT, 2014; VPO, 2015).

31
Key Message
Coastal and Marine Ecosystems
cover an area of about 20 % of
total land area of the country and it
includes mangrove ecosystems.
Coastal and Marine Ecosystems occupy an area of
241,500 Km2
or about 20 % of the total land area of the
country (VPO, 2015). A wide range of important and
valued species are found along the coast, including an
estimated 150 species of corals in 13 families; 8,000
species of invertebrates; 1,000 species of fish; 5 species
of marine turtles, 428 species of seaweeds and 44
species of marine birds (URT, 2014).
Mangroves - All mangrove forests in Tanzania are
gazetted as forest reserves and occupy about 0.3 % (1,440 Km2) of the forest cover in the country
(URT, 2014). They cover 115,500 ha of Tanzania mainland and 18,000 ha on Zanzibar (VPO,
2015).
Coral reefs - Coral reefs are located along 600 Km of the country’s continental shelf, covering
an area of about 3,500 Km2 (or about 11 % of the total area of territorial sea).
Seagrass beds - The area covered by seagrass beds and the relative species densities in Tanzania
are not known.
Seaweeds - The area covered by seaweeds is not known (URT, 2014).

32
Table 1. 12: Types of Ecosystem, 2014 S/N Type of
ecosystem (Major
ecosystem)
Area
(Km2)
Details (Sub ecosystems) Ecosystem services
1. Terrestrial
ecosystem
920,000 Forests ecosystem occupies
480,000 Km2 (55 %) of total land
area.
Forest ecosystem provides about 40 % of
the total household consumption of forest
and woodland products such as firewood,
building materials, medicinal herbs, wild
fruits and other food materials in nearby
communities.
Agricultural ecosystem occupies
440,000 Km2 (45 %) of total land
area.
Agricultural ecosystem- Mostly consists of
traditional subsistence farming systems in
which there is considerable diversity of
crops and species grown and sizeable
variety. The most favorable conditions for
agricultural biodiversity are considered to
occur under extensive and/or traditional
agricultural management.
2. Inland water
ecosystem
146,545.40 Lakes, Rivers, Dams and Wetland
(Lakes about 54,337 Km2); Dams
about 2,337 Km2; Rivers about
31,701.8 Km2; Wetlands about
88,374 Km2.
Wetland ecosystems are one of the most
productive supporting numerous natural
resource user groups such as fishermen,
pastoralists, farmers (i.e. irrigation, crops
and vegetables), hunters (Bush-meat) and
producers of non-timber products. Other
services include electricity (hydro-electric
power - HEP); key to wildlife habitats and
serve as important wildlife corridors.
Indirectly, wetland plays an important role
in flood control, water purification and
waste management. Wetlands interrupt
freshwater discharge, (sink for organic and
inorganic materials as well as pollutants);
store rainwater captured by mountain forest
ecosystems and contribute to the provision
of water resources during the dry season.
Wetland ecosystem accounts for most of
hydro-power generation, rural, urban and
industrial water supply and the dry season
water and grazing of livestock and wildlife
and sustain the tourism economy.
3. Coastal and
Marine ecosystem
241,500 Mangroves occupy about 0.3 % of
the forest cover in the country
(1,440 Km2), coral reefs (3,500
Km2, 11 %) of the total area of
territorial sea, sea grass beds,
seaweeds, sandy beaches, rocky
shores and numerous islets.
Seafood and reef mining, and services like
recreational, coastal protection, as well as
aesthetic and cultural benefits. Coral reefs
serve as physical buffer for oceanic currents
and waves, creating a suitable environment
for sea grass beds and mangroves. Sea
grasses serve as breeding, nursery and
feeding areas for many invertebrates and
vertebrate species; they are a source of food
for herbivorous invertebrates, fish and
turtles; they trap and bind sediments thereby
reducing particulate pollutants over coral
reefs; and they provide protection to
shorelines by dissipating wave energy.
Source: VPO; Tanzania Forest Services (TFS)

33
1.2.2.1: Known Flora and Fauna Species
1.2.2.2: Tanzania’s Endemic Flora and Fauna Species
Endemic flora and fauna species are species which occur in only one geographical region.
Tanzania ranks the fifth as a mega-biodiversity region globally as it harbours a number of
endemic flora and fauna. According to USAID, 2012; SAN, 2013; Birdlife International, 2014;
and URT, 2014, the total number of endemic flora and fauna species in Tanzania is not well
known but it’s estimated to range between 400 - 3000 species.
It is difficult to identify the exact number of endemic species due to the high diversity of species
found in different regions of Tanzania. International organizations such as IUCN and Birdlife
International, as well as researchers have made efforts to identify some endemic flora and fauna
species found in Tanzania. However, there are still gaps in knowledge about the exact numbers
since individual researcher and international organizations have tended to identify and collect
information in the area of interest only thus not covering all parts of Tanzania.
1.2.2.3: Endemic Flora
Saintpaulia species is the most famously known African violets belonging to family
Gesneriaceae. These herbaceous perennial flowering plants are found in Tanzania adjacent to
southern Kenya in eastern tropical Africa. Saintpaulia goetzeana and Saintpaulia shumensis are
the two species that are endemic to Tanzania. The Nguru Mountains harbours high concentration
of Saintpaulia goetzeana making this Saintpaulia species endemic in those mountains while
Saintpaulia shumensis sub-population has been found in Shume-Magamba Forest Nature
Reserve (FNR) in Tanga region and Nguru forest reserve in Morogoro region. Other endemic
flora species include Allanblankia stulhmanii (Mkimbo), Ocotea usambarensis (camphor),
Afrocarpus usambarensis, Allanblackia uluguruensis (Mkani) etc.
Table 1.13 describes some of the few known endemic flora species found in Tanzania and their
localities. The six mentioned endemic species are located in similar areas of mountainous
regions, high altitudes, which are safe for undisturbed growth and most endemic flora species
can be found. Also most of the endemic flora species are likely to be found within the Eastern
Arc Mountains as they are famously known to harbour a diverse number of flora and fauna.

34
Key Message
Invasive species are among the
significant drivers of environment
change worldwide and important
causes of biodiversity loss.
Table 1. 13: Some of the Known Endemic Flora Species in Tanzania S/N Endemic Flora Species Locality
1 Saintpaulia goetzeana Nguru Mountains
2 Saintpaulia shumensis Shume-Magamba FNR
3 Allanblackia stulhmanii
Usambara and Uluguru
Mountains
4 Allanblackia uluguruensis Uluguru Mountains
5 Ocotea usambarensis Usambara Mountains
6 Afrocarpus usambarensis Usambara Mountains
Source: TAFORI
1.2.2.4: Invasive Alien Species (Flora and Fauna)
Invasive species are those which are non native to the ecosystem whose introduction cause
economic and environmental harm. They are among the significant drivers of environmental
change worldwide and important causes of biodiversity loss. They hinder sustainable
development, economic growth and cause ecological problems in various areas in the world
including Tanzania.
In Tanzania, there has been a massive increase of
invasive species. The introduction of these species may
be deliberate or accidental. Deliberate introduction of
invasive species may have come about through efforts
to improve the prospects of agricultural productivity,
among others, while accidental introduction may be
caused by pollinators in case of plant invasive species.
1.2.2.5: Invasive Flora Species
In the forestry sector, invasive species have appeared to
be dangerous to the growth of the sector as they destroy the ecosystems and cause loss of
potential plants. There are four common forest invasive species as shown in Table 1.14.
The invasive flora species are plant species which have been introduced in the ecosystem and
cause harm to other plants as well as animals present in the ecosystem. Plant species such as
Leuceana species and Cedrella Mexicana were previously introduced as multipurpose trees.
However, these species are considered as weeds in some areas and since they are good seeders,

35
they spread in almost all ecological regions and to other regions and are thus considered as
invasive alien species.
Maesopsis eminii (Mhesi) was previously introduced as timber species and also used to nurse
other tree species e.g. Newtonia buchananii (Mkufi)) in East Usambara. However, a pollinator
known as a hornbill has facilitated pollination of Maesopsis seeds and its spread to other areas in
the Usambara, thus it is now considered as an invasive species and is widely spread.
Table 1. 14: Forest Invasive Flora Species Category Forest Invasive Flora Species
Plants Maesopsis eminii
Leucaena spp
Lantana camara
Cedrela Mexicana
Source: TAFORI
1.2.2.6: Invasive Fauna Species
Most of the invasive fauna are introduced accidentally. In the case of forestry, the seven listed
forest invasive insect species which have been a threat to timber species as they affect
productivity are presented in Table 1.15. Invasive insects such as Cinnara cupressi attack trees
member of the conifers family (Cupressus, Thuja, Juniperus, Chamaecyparis and Callitris). Other
insects such as Pine boerneri attack pine trees while Hetropsylla cubana attack Leuceana, and
Eucalyptus chalcid attacks Eucalyptus.
Table 1. 15: Forest Invasive Fauna Species Category Forest Invasive Fauna Species
Insects Cinnara cupressi
Heteropsylla cubana
Leuceana psyllid
Pinus boerneri
Pine wholly aphid
Phorocantha semipunctata and Phorocantha recurva
Eucalyptus chalcid
Source: TAFORI
1.2.2.7: Control and Management of Invasive Species
There are several approaches for controlling invasive species, the following are the most
commonly used approaches in Tanzania:-

36
i) Biological control: by introducing biological predators that can destroy specific
invasive species;
ii) Chemical control: use of pesticides and fungicides to eliminate the invasive species;
iii) Mechanical control: use of mechanical measures to eliminate invasive species
mostly done to flora invasive species such as Lantana camara by uprooting;
iv) Administrative controls: improving border inspection by improving the enforcement
of quarantines at border posts.
1.2.2.8: Protected Terrestrial Area
Game Controlled areas, National Parks and Game Reserves both are homes to wild animals but
differ in aspects such as activities, organization, and conservation status as described below:-
Activities
Generally, protected areas are famously known for a variety of activities such as mountain
hiking, tourist hunting, fishing, photography, camping etc. Game reserves and Game Controlled
areas are protected areas which only allow tourist hunting and fishing with permits, while in the
national parks consumptive wildlife utilization is not allowed.
Organization
Game reserves and Game Controlled areas in Tanzania are operated underthe Tanzania Wildlife
Management Authority (TAWA). The National parks on their part are managed by Tanzania
National Parks (TANAPA). The two institutions are both government agencies.
Conservation Status
Some of the protected areas are considered World Heritage Sites since such areas are listed by
the United Nations Educational, Scientific and Cultural Organization (UNESCO) as of special
cultural or physical significance. These areas include Serengeti National Park, Ngorongoro
Conservation Area and Selous National Park.
1.2.2.9: National Parks

37
Key Message
Out of 57,424 Km2 covered by
national parks in Tanzania,
Ruaha is the largest national
park with an area of 20,300 Km2
(35.4 %) of total area of national
parks.
Table 1.16 shows the list of national parks in Tanzania
which comprise a total area of 57,424 Km2. Ruaha is the
largest national park with an area of 20,300 Km2 (35.4 %)
of total area of national parks. Serengeti is the second
largest national park with an area of 14,763 Km2 which is
about 25.7 % of the total area of Tanzania’s national parks.
Saanane is the smallest national park covering an area of
50 Km2. Additional information concerning national parks,
year of gazzettment, bordering districts and available flora
and fauna are shown in Table 1.16.

38
Table 1. 16: List of National Parks by Area, Year Gazzetted, Bordering Districts and
Available Flora and Fauna, 1960 - 1992 S/N Name Area
(Km2)
Year
Gazzetted
Bordering Districts Flora and Fauna
1 Arusha National
Park
552 1960 Arumeru (Arusha
region)
Giraffe, Cape Buffalo, Elephant,
Zebra, Dik-Dik, Hippopotamus,
Waterbuck, Warthog, Leopard, Eland,
Spotted Hyena, Klipspringer, Baboon,
Blue Monkey, Black-and-White
Colobus, Greater Flamingo, Lesser
Flamingo, Sacred Ibis, Maccoa Duck,
Egyptian Goose, Turaco, Narina
Trogon, Broadbill, Red-Hot Poker,
Spanish Moss, Giant Lobelia
2 Gombe Stream
National Park
52 1968 Kasulu, Kigoma
urban (Kigoma
region)
Chimpanzee, Olive Baboon, Redtailed
Monkey, Red Colobus,
Diademed Monkey, Leopard,
Bushbuck, Buffalo, Waterbuck,
Barbet, Palm-Nut Vulture, Forbes
Plover, African Fish Eagle, Peters's Twinspot
3 Katavi National
Park
4,471 1974 Mpanda (Rukwa
region)
Eland, Sable Antelope, Roan Antelope,
Hippopotamus, Crocodile, Lion,
Leopard, Elephant, Zebra, Buffalo,
Topi, Pelican, Waterfowl
4 Kilimanjaro
National Park
1,668 1973
Siha, Hai, Moshi rural
(Kilimanjaro region),
Longido (Arusha
region)
Abbott's Duiker, Grey Duiker, Red
Forest Duiker, Bushbuck, Eland,
Elephant, Leopard, Buffalo, Small
Antelope, Blue Monkey, Black-and White
Colobus, Galago
Crassicaudatus, Kilimanjaro Tree
Hyrax, Abbot's Starling, Raven,
Papiliosjoestedti, Giant Lobelia,
Moss, Lichen
5 Kitulo
National Park
465 2004 Makete (Iringa
region), Mbeya rural,
Rungwe (Mbeya
region)
Red-Hot Poker, Aloe, Protea,
Pelargonium Geranium, Giant Lobelia,
Lilies, Asters, Denham's Bustard,
Blue Swallow, Mountain Marsh
Widow, Cisticolanjombe, Kipengere
Seedeater, Mountain Reedbuck,
Eland, Chameleon, Lizards, Frogs
6 Lake Manyara
National Park
648 1959 Babati, Mbulu
(Manyara region),
Karatu, Monduli
(Arusha region)
Elephant, Cape Buffalo, Lion,
Hippopotamus, Impala, Giraffe, Zebra,
Wildebeest, Bushbuck, Leopard,
Baboon, Lesser Flamingo, Greater
Flamingo, White Pelican, Yellow-Billed
Stork, White-Breasted Cormorant,
Palm-Nut Vulture, Ayres's Hawkeagle,
Nile Monitor, Cobra
7 Mahale National 1,613 1980 Kigoma rural Chimpanzee, Redcolobus, Red-Tailed

39
Park (Kigoma region),
Mpanda (Rukwa
region)
Monkey, Blue Monkey, Giant Squirrel, Red-
Legged Sun Squirrel, Brush-Tailed
Porcupine, Bushy-Tailed Mongoose, Angolan
Black-And-White Colobus, Sharpe's Grysbok,
Red-Collared
Widowbird, Speckled Mousebird, Crowned
Eagle, Bee-Eaterroller, Crested Guineafowl,
Ross' Turaco, White-Browed Robin-Chat,
Red-Wingedstarling, Violet-Backed Starling
Parrots
8 Mikumi
National Park
3,230 1964 Kilosa, Morogoro,
Mvomero (Morogoro
region)
Eland, Greater Kudu, Yellow Baboon, Velvet
Monkey, Serval, Sable
Antelope, Hippopotamus, Zebra, Lion,
Wildebeest, Impala, Buffalo, Giraffe,
Elephant, Lilac-Breasted Roller, Yellow-
throated Longclaw, Bateleur Eagle,
Waterbirds
9 Mkomazi
National Park
3,254 2007 Same, Mwanga
(Kilimanjaro region),
Lushoto, Korogwe,
Mkinga (Tanga
region)
Oryx, Kudu, African Wild Dog, Black
Rhinoceros, Big Mammal
10 Ruaha
National Park
20,300 1964 Iringa rural (Iringa
region), Mbarali,
Chunya (Mbeya
region), Chamwino
(Dodoma region)
Elephant, Hornbill, Kingfisher, Sunbird,
White Stork, African Wild Dog
Sable Antelope, Greater Kudu, Crested
Barbet, Yellow-Collared Lovebird
11 Rubondo
Island
National Park
456 1977 Muleba (Kagera
region), Sengerema
(Mwanza region),
Geita, Chato (Geita
region)
Yellow-Spotted Otter, Nile Perch, African
Fish Eagle, Hippopotamus, Vervet Monkey,
Genet, Mongoose, Bushbuck, Sitatunga,
African Grey Parrot, Malachite Kingfisher,
Paradise
Flycatcher, Herons, Storks, Spoonbills
12 Saadani
National Park
1,062 2004 Bagamoyo (Coast
region), Pangani,
Handeni (Tanga
region)
Giraffe, Buffalo, Warthog, Waterbuck,
Reedbuck, Hartebeest, Wildebeest, Red
Forest Duiker, Greater Kudu, Eland, Sable
Antelope, Yellow Baboon, Verve Monkey,
Elephant, Lion, Leopard, Spotted Hyena,
Black-Backed Jackal, Hippopotamus,
Crocodile, Mangrove Kingfisher, Lesser
Flamingo, Green Turtle
13 Saanane
Island
National Park
50 2012 Nyamagana District -

40
14 Serengeti
National Park
14,763 1951
Meatu, Bariadi
(Shinyanga region),
Magu (Mwanza
region), Bunda,
Serengeti, Tarime
(Mara region),
Ngorongoro (Arusha
region).
Wildebeest, Zebra, Lion, Leopard, Elephant,
Rhinoceros, Buffalo, Cheetah, Gazelle,
Giraffe, Spotted Hyena, Jackal, Aardwolf,
Serval, Agama Lizard, Rock Hyrax, Secretary
Bird, Ostrich, Black Eagle
15 Tarangire
National Park
2,850 1970 Babati, Kiteto,
Simanjiro (Manyara
region), Monduli
(Arusha region),
Kondoa (Dodoma
region)
Oryx, Gerenuk, Elephant, Baobab, Lesser
Kudu, African Wild Dog, Lion, Kori Bustard,
Ground Hornbill, Ostrich, Yellow-Collared
Lovebird, Rufous-Tailed Weaver, Ashy
Starling, Dwarf
Mongoose, Red-And-Yellow Barbet
16 Udzungwa
Mountains
National Park
1,990 1992 Kilombero, Kilosa
(Morogoro region),
Kilolo (Iringa region)
Rufous-Winged Sunbird, Udzungwa
Partridge, Sanje Crested Mangabey, Iringa
Red Colobus, Rungwecerbus
Kipunji, Matundu Dwarf Galago,
Mountain Dwarf Galago, Reptiles and
Amphibians, Hyrax, Squirrel and Big
Mammals
Total 57,424
Source: Ministry of Natural Resources and Tourism – TANAPA, -www.tanzaniaparks.go.tz
“-” Data not available
1.2.2.10: Game Reserves and Other Protected Areas
Game reserves are wildlife protected areas which are declared for the purpose of conservation.
Consumptive and non-consumptive wildlife utilization is allowed after obtaining permits. These
game reserves are famously known in Africa as areas for variety of activities.
Tanzania has a total of 28 game reserves covering an area of 117,755.4 Km2. Selous is the largest
game reserve covering an area of 50,000 Km2 (Table 1.17) which is about 42.5 % of the total
area under game reserves. The remaining game reserves individually constitute less than 10 % of
the total game reserve area.

41
Table 1. 17: Distribution of Game Reserves by Government Notice, Area, Bordering
Region and Year of Gazettement, 1959 -2012 S/
N
Name of Game
Reserve
Government Notice
(GN)
Area
(Km2)
Bordering Region Year of
Gazzettment
1 Biharamulo - 1,300.0 Kagera 1959
2 Burigi - 2,200.0 Kagera 1972
3 Grumeti 214 of 1994 2,000.0 Mara 1993
4 Ibanda - 200.0 Kagera 1972
5 Ikorongo 214 of 1994 3,000.0 Mara 1993
6 Kigosi - 7,000.0 Shinyanga/Tabora 1983
7 Kijereshi 215 of 1994 300.0 Mwanza 1994
8 Kimisi - 1,026.2 Kagera 2005
9 Kizigo - 4,000.0 Singida 1972
10 Liparamba - 571.0 Ruvuma 1959
11 Lwafi - 2,228.0 Rukwa 1993
12 Lukwati 459 of 1997 3,146.0 Rukwa 1997
13 Lukwika-Lumesule - 444.0 Mtwara 1995
14 Maswa - 2,200.0 Shinyanga 1969
15 Mkungunero - 700.0 Dodoma/Manyara 1996
16 Moyowosi - 6,000.0 Kigoma 1981
17 Mpanga-Kipengele - 1,574.3 Iringa 2003
18 Msanjesi - 210.0 Mtwara 1995
19 Muhesi 217 of 1994 2,000.0 Singida 1994
20 Pande 216 of 1994 12.0 Dar Es Salaam 1994
21 Rukwa - 4,000.0 Rukwa 1995
22 Rumanyika - 800.0 Kagera 1965
23 Rungwa - 9,000.0 Singida/Tabora/Mbeya 1951
24 Selous - 50,000.0 Pwani/Morogoro/Lindi/Ruv
uma
1920
25 Swagaswaga - 871.0 Dodoma 1996
26 Ugalla - 5,000.0 Tabora 1965
27 Uwanda - 5,000.0 Rukwa 1959
28 Piti - 2,972.9 - 2012
Total 117,755.4
Source: MNRT
“-” Data Not Available
1.2.2.11: Game Controlled Areas (GCAs)
Table 1.18 presents statistics on Tanzania’s game-controlled areas. There are a total of 42 game-
controlled areas covering 55,565.02 Km2. Kilombero is a dominant game-controlled area
covering 6,500 Km2, equivalent to 11.7 % of the total game-controlled area. There is no
significant difference in areas covered by the remaining game-controlled areas.

42
Table 1. 18: Game Controlled Areas by Size, Year of Establishment and Bordering
Regions, 1974 - 1974 S/N Name of GCA Area (Km
2) Year of
Establishment
Bordering Region - District
1 Burunge 400 1974 (GN 269) Arusha - Babati
2 Chabula Marsh 100 1974 (GN 269) Mwanza - Mwanza
3 Enduleni 600 1974 (GN 269) Arusha - Ngorongoro
4 Gombe 3,000 1974 (GN 269) Tabora - Urambo
5 Handeni 3,500 1974 (GN 269) Tana - Handeni and Kilindi
6 Igombe Dam 100 1974 (GN 269) Tabora - Tabora
7 Kalimawe 300 1974 (GN 269) Kilimanjaro and Tanga – Same and
Lushoto
8 Kihirumira Pool 100 1974 (GN 269) Lindi - Liwale
9 Kilombero 6,500 1974 (GN 269) Morogoro - Kilombero and Ulanga
10 Kitwai 3,500 1974 (GN 269) Arusha - Kiteto
11 Kongwa 1,500 1974 (GN 269) Dodoma - Kongwa
12 Lake Daramatai 0.02 1974 (GN 269) Dodoma - Kondoa
13 Lake Kwela 70 1974 (GN 269) Rukwa - Sumbwanga
14 Lake Manka 20 1974 (GN 269) Tanga - Lushoto
15 Lake Natron 3,000 1974 (GN 269) Arusha - Longido
16 Lihogosa 30 1974 (GN 269) Iringa - Njombe
17 Loliondo 4,000 1974 (GN 269) Arusha - Ngorongoro
18 Lokisale 1,500 1974 (GN 269) Arusha - Monduli
19 Longido 1,500 1974 (GN 269) Arusha - Longido
20 Luganzo 2,500 1974 (GN 269) Tabora - Kaliua
21 LundaMkwambi 1,000 1985 (GN 38) Iringa - Iringa (R)
22 Masasi River 180 1974 (GN 269) Kagera - Biharamulo
23 Meserani Dam 75 1974 (GN 269) Arusha - Monduli
24 Mlele 3,000 1974 (GN 269) Katavi - Mpanda
25 Msima 2,000 1974 (GN 269) Katavi - Mpanda
26 Mto-wa-Mbu 1,500 1974 (GN 269) Arusha - Monduli
27 Muhuwesi 1,500 1974 (GN 269) Ruvuma - Tunduru
28 Mwadui 10 1974 (GN 269) Shinyanga - Shinyanga
29 Mwambesi 1,000 1974 (GN 269) Ruvuma - Tunduru
30 Nchwa – Nkima 50 1974 (GN 269) Kagera - Biharamulo
31 Ngeju – Nijro Dam 30 1974 (GN 269) Arusha
32 Nyonga 3,500 1974 (GN 269) Katavi and Tabora – (Mpanda and Tabora)
33 Rau Forest 100 1974 (GN 269) Kilimanjaro - Moshi
34 Rungwa River 1,500 1974 (GN 269) Katavi - Mlele
35 RuvuMaasai 1,500 1974 (GN 269) Arusha - Simanjiro
36 Ruvu – Same 1,000 1974 (GN 269) Kilimanjaro - Same
37 Sanya – Lelatema 800 1974 (GN 269) Ilimanjaro and Arusha
38 Simanjiro 2,000 1974 (GN 269) Arusha - Simanjiro
39 Speke Gulf 300 1974 (GN 269) Mara - Bunda
40 Ugunda 1,500 1974 (GN 269) Tabora - Sikonge
41 Umba River 300 1974 (GN 269) Tanga - Lushoto and Tanga
42 Utengule Swamps 500 1974 (GN 269) Mbeya - Mbarali [harmonize all hyphens]
Total 55,565.02
Source: MNRT

43
Key Message
Forest nature reserves are strictly
for protection purposes as
recognized by the forest legislation
of 2002. Only research; education
and nature-based tourism activities
are allowed in the reserves.
1.2.2.12: Forest Reserves
Forest nature reserves are areas that are protected and
managed in order to preserve a particular type of habitat
and its flora and fauna, which are often rare or
endangered. The reserves are essential areas for study
and research, they provide tourist attraction areas, they
provide catchment sources which help supply water to
communities surrounding the reserves, they also play an
important role in climate regulation and most
preservation of nature reserve biodiversity.
The urge to form Nature Reserves in Tanzania begun in
the 1990s. The forest legislation of 2002 in Tanzania
identifies forest nature reserves as protected forest areas
of high importance for the conservation of biodiversity. The main challenges for the
sustainability of the nature reserves include: - illegal mining, poaching and logging activities;
conversion of forest to farmland; fire attacks; invasive plant species; and animal grazing.
Table 1.19 lists forest nature reserves found in Tanzania, their total areas, flora and fauna and
years in which they were gazzetted.These forests are managed by Tanzania Forest Services
(TFS). Kilombero is the largest forest nature reserve covering an area of 134,511 ha which is
about 43.2 % of total area under forest nature reserves. The second largest forest nature reserve is
Udzugwa with an area of 32,763 ha, equivalent to 10.5 % of the total forest nature reserves area.
Mt. Hanang is the smallest, covering an area of 5,871 ha.
Amani Nature Reserve, established in 1997, is among the earliest established nature reserve in
the country. The reserve has a high biodiversity and it is a home to different scientific studies on
ecology and biodiversity. Other forest reserves were in existence before 1997 but had not been
upgraded to nature reserve until after the year 2005.

44
All the 12 nature reserve are rich in flora of different species, the most common ones in all the
reserves being- Ocotea usambarensis, Albizia gummifera, Parinari excelsa, Maesopsis eminii
(i.e. endemic and invasive in some nature reserves) and Allanblackia stulhmanii. These flora
species have grown largely in Chome, Kilombero, Magamba, Amani, Rondo, Uluguru, Minziro
and Nilo Nature Reserves.The fauna composition in the nature reserves include birds, insects,
mammals, reptiles, amphibians etc. Fauna species are different from one nature reserve to
another since they are found in different ecological areas. This wide variation results to endemic
species.
Eight of the twelve forest nature reserves are found in the the Eastern Arc Mountains (Chome,
Magamba, Nilo, Amani, Mkingu, Uluguru, Kilombero and Udzungwa Scarp). The other four are
scattered in different locations in the country: one in the Southern Highlands (Rungwe); one in
the coastal forest Southern part of Tanzania (Rondo); one in the forest of recent dormant volcano
(Mt. Hanang) and one in the lowland swamp forest (Minziro), Map 1.5 show the locations of the
forest nature reserves.
Table 1. 19: Forest Nature Reserves in Tanzania, by Area, Flora and Fauna and Year of
gazettement Name Area
(Ha)
Region Year
Established
Flora Fauna
Amani
Nature
Reserve
8,380 Tanga 1997 A.stuhlmanii,
Isoberlinia scheffleri,
Macaranga capensis,
Cephalosphaera
usambarensis,
Myrianthus holstii,
Newtonia buchananii,
Parinari excelsa.
Mites, spiders, freshwater crabs,
dragonflies, beetles, butterflies,
millipedes, mollusks, duikers,
bushpigs, money
Invasive spp-
Maesopsiseminii
Endemic spp-Usambara weaver
(Ploceusnicolli), Usambara alkalat,
Usambara hyliota, Usambara eagle-
owl (Bubo vosseleri)
Chome
Nature
Forest
14,283 Kilimanjaro 2016 Ocotea usambarensis,
Erica arborea
Birds and monkeys
Nilo
Nature
Reserve
6,225 Tanga 2007 Saint paulia (African
violet flower),
Allanblankia
stuhlmanii, Sorindeia
madagascariensis,
Leptonychia
usambarensis
Banded green sunbird, Red-capped
forest warbler, Angolan pied
colobus, Usambara three-horned
cameleon, zanj elephant shrew

45
Minziro
Nature
Reserve
25,000 Kagera 2016 Baikiaea-Podocarpus,
Acacia spp, Manilkara
obovata, Syzygium
cordatum, Maesopsis
eminii etc.
58 Birds spp, butterflies, Thomas
galago, Grey-cheeked mangabey,
Viper snake, great blue turaco
Endemic spp-
Afrocarpus dawei,
Coffea canephora
Uluguru
Forest
Nature
Reserve
24,115 Iringa 2007 Parinari excelsa,
Draceana steudneri,
Rauvolfia manii,
Solanecio manii,
Passiflora edulis,
Solanum terminale etc.
Angola piedcolobus, yellowbaboon,
savannah monkey, bluemonkey,
small-eared galago, zanj elephant
shrew, Zanzibar galago, usambara
galago, honey buzzard, African
black duck etc.
Endemic spp.- Afrixalus
uluguruensis (leaf frog)
Kilombero
Forest
Nature
Reserve
134,511 Morogoro 2007 Cassipourea gummifla,
Maesa lanceolate,
Syzygium guineense,
Ocotea usambarensis,
Hagea abyssinica,
Bridelia micrantha,
Furea spp, Khaya
anthotheca, Rauvolia
caffra, Millicia excelsa
etc.
Sanje mangabey, Red colobus
monkey, black and white colobus
monkey, yellow monkey, sykee’s
monkey, Senegal galago
Rungwe
Forest
Nature
Reserve
13,652 Mbeya 2009 Aphloiathei formis,
Ficalhoa laurifolia,
Maesa lanceolata,
Trichpcladus ellipticus,
Albizia gummifera,
Macaranga
kilimandscharica,
Bridelia micrantha
Abbott’s duiker, Tanganyika
mountain squirrel, Livingstone
turaco
Endemic spp.- Rungwe-cebus
kipunji, Rungwe galago
Magamba
Forest
Nature
Reserve
9,283 Tanga 2016 Ocotea usambarensis,
Tabernaemontana
pachysiphon,
Macaranga
conglomerate, Albizia
gummmifera, Syzygium
guineense, Flacourtia
indica, Grewia
benguelensis, Dodonea
viscosa etc.
Bush-pig, black and white colobus
monkey, rabbits, antelope, lizards,
snakes, Nectarinia usambaricus,
Turdus roehli, black billed weaver
etc.
Mkingu
Forest
Nature
Reserve
23,388 Tanga 2015 Black and white colobus monkeys,
mountains galagos, black and rufous
elephant shrew, moreau’s sunbird,
banded green sunbird.
Endemic spp.- Werner’s three
horned chameleon, the Nguru spiny
pygmy chameleon
Udzungwa
scarp
Forest
Nature
32,763 Iringa 2016 Brachystegia spp,
Protea spp, Uapaca
kirkiana, Hagenia
abyssinica, Casspoure
Udzungwa re colobus, Tana river
mangabey, grey-faced sengi

46
Reserve agummiflua, Myrica
salicifolia, Croton
macrostachyus etc.
Endemic spp.- Bicolored frog,
orange breasted sunbird
Rondo
plateau
Forest
Nature
Reserve
14,000 Lindi 2016 Afzelia quanzensis,
Albizia gummifera,
Albizia adianthifolia,
Dialium holtzii, Ficus
spp, Parinari excelsa,
Faurea saligna,
Cussonia, zimmermanii
The rondo dwarf galago and the
East coast Akalat.
Mount
Hanang
Forest
Nature
Reserve
5,871 Manyara 2016 Juniperus excelsa,
Albizia spp, Fagaropsis
angolensis, Oliniaro
chetiana, Euclea
divinorum, Catha
edullis, Ficus spp,
Prunus africana,
Clodendrum capense
Silky blesmol, bush duck, python,
olive baboon, bush pigs, leopard,
spotted hyena
TOTAL 311,471
Source: Ministry of Natural Resources-nature-reserves.go.tz

47
Map 1. 6: Forest Nature Reserves of Tanzania

48
1.2.3- Forests
Tanzania Forest Services (TFS) Agency operates within the governance model stipulated in its
Establishment Order No. 269/2010 under the Ministry of Natural Resources and Tourism. TFS
operates in seven zones as indicated in the Map 1.7.
Map 1. 7: Tanzania Forest Services Agency Zone Distribution

49
A Forest is defined as a piece of land with trees more than 0.5 ha and a canopy cover of at least
10 % and where the trees have a height of more or equal to 5 metres. Forest resources means a
forest and forest products including anything which is produced by or from trees or grows in a
forest or is naturally found in the forest. The forest produce include things such as bamboos, bark
of trees, branch wood, canes, charcoal, fibre, firewood, fruits, gums, latex, leaves, poles, plants,
resins, withies, seeds, timber, trees, wax, wood oils, roots, sap, litter, and any other living or
inanimate object declared by the Forest Act to be a forest product.
Tanzania is endowed with vast areas of forest resources, which offer considerable social and
economic potential, unique natural ecosystems rich in biological diversity and wildlife habitats.
Furthermore, forest and bee resources contribute significantly to the socio-economic wellbeing in
terms of raw material supply, employment, food security, energy and environmental protection
among others. Most of the rural communities are highly dependent on forest resources for their
livelihood.
Furthermore, forests are important for the provision of numerous goods and services both in the
national economy and to the society at large. The goods include timber, wood fuel, food, fodder
and medicine while services include watershed, shelter, employment, recreation, habitats for
wildlife, and carbon sequestration. They also provide a range of unique natural ecosystems,
landscape and biological diversity and genetic resources. In terms of linkage and support to other
sectors, forests stabilize stream flows and therefore reduce disasters such as landslides, erosion
and floods in areas of steep topography and high precipitation. Forests also have an important
function in the supply of irrigation water for lowland farming and fish production.
In order to minimize damage to the ecosystem due to human activities, the forest policy (1998)
aims to carry out Environment Impact Assessment (EIA) before carrying out large investment
projects, which convert forestlands to other land uses. These include activities such as forest
industries, mining, road construction, agriculture, dams, refugee settlement, shrimp farming and
tourism (URT, 1998).

50
The forest policy spells out several strategies and measures to ensure ecosystem conservation
and management in areas of biodiversity, watershed, soil, and wildlife. These strategies and
measures are inferred from the policy statements, which include:
(i) New forest reserves for diversity conservation will be established in areas of
high biodiversity value;
(ii) Forest reserves with protection objectives of national strategic importance
may be declared as nature reserves;
(iii) Involvement of local communities and other stakeholders in conservation and
management will be encouraged through joint management agreements;
(iv) Biodiversity research and information dissemination will be strengthened in
order to improve biodiversity conservation and management;
(v) Biodiversity conservation will be incorporated in the management regimes of
natural production forests and plantations;
(vi) The replacement of natural forests by exotic plantations will be minimized;
(vii) New catchment forest reserves for watershed management and soil
conservation will be established in critical areas; and
(viii) EIA will be required for investments, which convert forestland to other land
use or may cause potential damage to the forest environment.
Forest resources cover 48.1 million hectares (ha) equivalent to 55 % of the total surface land area
of Tanzania Mainland. Woodlands cover 44.6 million ha (93 %) of the forestland, while
catchment forests, mangroves, coastal forests and government forest plantations occupy 3.4
million ha (7 %). Furthermore, about 20 million ha of the forestland is production forests and 28
million ha are protected forests found in forest reserves and other protected areas.
According to international vegetation formation description, the main types of forests in the
country are clustered as extensive miombo woodland in the lowland areas across the central and
southern parts; the acacia woodlands in the northern regions, the coastal forest/woodland
mosaics in the east, mangrove forests along the Indian Ocean and closed canopy forests on the
ancient mountains of the Eastern Arc. The distribution of forests in terms of ownership includes
16.6 million hectares (35 %) under the Central Government managed by TFS; 3.1 million ha (7

51
%) under Local Government Authorities; 22 million ha (45.7 %) under Village Governments; 3.5
million ha (7 %) of private sector; and 2.73 million ha (5.7 %) as forests in general lands.
Woodlands are low-density forests forming open habitats with plenty of sunlight and limited
shade; woodlands may support understories of shrubs and herbaceous plants including grasses
and sometimes form a transition to shrub land under drier conditions.
Table 1.20 shows forest area distribution in Tanzania. Statistics in the table show areas under
TFS jurisdiction only. Statistics on forests owned by LGAs, village lands and privately owned
forest are not included.
The forest area planted with trees is showing an increasing trend, from 189,741.7 ha in 2013 to
206,074.0 ha in 2016. It is also observed that, in the same period, there has been a general
decrease of forest areas affected by fires. Area under natural forest has not changed much.
Table 1. 20: TFS Forest Area Distribution, 2013 - 2017 Forests Unit of Measure 2013 2014 2015 2016 2017
Total Area (Ha) 48,100,000.0 48,100,000.0 48,100,000.0 48,100,000.0 48,100,000.0
1. Natural Area (Ha) 28,814,258.3 28,811,252.0 28,807,497.0 28,802,853.0 28,797,926.0
2. Planted Area (Ha) 189,741.7 192,748.0 196,503.0 201,147.0 206,074.0
3.Protected forest areas Area (Ha) 19,096,000.0 19,096,000.0 19,096,000.0 19,096,000.0 19,096,000.0
4. Forest area affected by fire Area (Ha) 9,872,485.0 10,255,576.7 7,884,130.1 9,667,395.5 8,349,727.7
Source: TFS
Note- The statistics in the table shows areas under TFS areas of jurisdiction only; they do not necessarily add up to
total.
1.3. Environmental Quality
1.3.2: Freshwater Quality
Freshwater quality problems are mainly caused by economic activities, climate, and pollution.
The problem is sometimes aggravated due to non-uniform distribution of rainfall and extended
droughts. During droughts, there are low flows and extended heat raises water temperatures and
increases salinity levels in rivers and streams.

52
The Ministry of Water and Irrigation is implementing a National Water Quality Management and
Pollution Control Strategy (WQMPCS). In recent times it has been observed that, as a result of
intensive catchment degradation caused by rapid changes in land use, non-point sources of
pollution are on the rise. Few cases of water-borne diseases have been reported in connection
with the use of river water for domestic uses especially in rural areas (URT 2011).
Different freshwater source for example lakes, river, spring face different water quality issues. At
the moment there are no established water quality standards for receiving freshwater bodies such
as lakes, river, and springs. The available standards are only for treated drinking water for human
consumption and for effluent water that enters the receiving freshwater bodies such as lakes and
rivers.
1.3.2.1: PANGANI BASIN
Surface Water Quality
Both point source and non-point source pollution are experienced in the Pangani Basin.
Municipal sewerage effluent and industrial discharges are the main sources of point source
pollution. Effluents from most of the industries do not meet the required effluent standards. The
city/municipal effluent treatment systems are insufficient and their discharges do not meet the
required standards. Most of the populations in large settlements are not connected to the
wastewater treatment systems. In addition, not all large settlement areas are equipped with
wastewater treatment systems. This situation leads to the presence of high values of Biological
Oxygen Demand (BOD) and Chemical Oxygen Demand (COD) within water bodies near large
settlement areas in the Pangani Basin (PBWB-IUCN, 2011).
Non-point source pollution in the Pangani basin is largely attributed to agricultural activities.
Potential agricultural effects include reduced river flows, loss of native riparian vegetation,
change in seasonal flows, excess nutrients, excess sediment load, change in both pH and Electric
Conductivity (EC) values and water contamination with agro chemicals and sewage (PBWB-
IUCN, 2011).

53
Groundwater Quality
The quality of groundwater in the Pangani Basin varies from fresh to saline. In general, some
areas along the coast and areas of valleys or depression within the metamorphic basement area
with low rainfall show elevated EC values (>1000 µs/cm). Fluoride problems occur in the
volcanic areas of Arusha town down to the Sanya plains. Kahe plains have high fluoride values
with less salinity problems. Fluoride decreases towards areas of Usagara metamorphic rocks
Many water sources in the Pangani Basin receive some kind of agro-chemical and industrial
pollution such as pesticides and heavy metals. High salinity, iron (Fe) and nitrate (NO3) are
experienced eastwards of the Pangani basin towards the coastal zone. Aquifers within municipal
areas suffer from effluent discharges resulting in higher BOD, COD and pH values (PBWB-
IUCN, 2011).
1.3.2.2: LAKE VICTORIA BASIN
Surface Water Quality
Polution in the Lake Victoria Basin is attributed to both point source and non-point sources.
Municipal effluent, mining and industrial discharges are the main sources of point source
pollution. As a result of availability of high value minerals, there are small scale and large scales
mining activities in various areas within the basin. These activities are the major source of heavy
metals, low pH values, high sulphide content and turbidity contaminations in both surface and
groundwater bodies.
Lack of sufficient city/municipal effluent treatment systems and lower connection to the
wastewater treatment systems has led to high presence of TDS, pH, NO3-, EC, BOD, COD and
nutrients within water bodies near large settlement areas in Lake Victoria Basin. The discharge
from textile industries also bears intense colorations derived from the dyes of fibrous materials.
Non-point source pollution in the basin is largely attributed to agricultural activities. Potential
agricultural effects include reduced river flows, loss of native riparian vegetation, change in
seasonal flows, excess nutrients, excess sediment load, change in both pH and EC values and
water contamination with agro-chemicals and sewage.

54
Groundwater Quality
The groundwater quality of the Lake Victoria Basin is mostly affected by industrial, agricultural
and mining activities, leading to higher values of Electric Conductivity (EC), Nitrates (NO3),
Iron (Fe), Mercury (Hg), Copper (Cu), Arsenic (As) and other heavy metals. Aquifers within
municipal areas suffer from effluent discharges resulting in higher BOD, COD, phosphates and
nitrates values. In addition, both high and low pH values are manifested depending on the nature
of the pollutant.
The geological nature of the Lake Victoria Basin has less impact on groundwater quality, except
for aquifers in volcanic terrains, where sulphur and carbonates are suspected, and in Malagarasi
super group terrain where carbonates are pronounced. Aquifers within the superficial deposits
and the Nyanzian-Kavirondian formations are generally of good water quality except in localized
gold mineralized zones where sulphides, silicates and carbonates are the common contaminants,
along with anthropogenic contamination related to extraction of mineral ores. In addition, mining
activities are causing high heavy metal content and low pH values in groundwater.
1.3.2.3: WAMI_RUVU BASIN
Surface Water Quality
In the Wami-Ruvu Basin, Municipal sewerage effluent, Irrigation, Mining and Industrial
discharges are the main sources of point source pollution. The most affected parameters are
Temperature, pH, colour, odour, taste, coliforms, turbidity, EC, TDS, COD and BOD. Other
parameters are Nitrates, Sulphates, Phosphates, Mercury (Hg), Iron (Fe), Manganese (Mn),
Cadimium (Cd), Lead (Pb), Copper (Cu), Chromium (Cr), Zinc (Zn), Nickel (Ni), Arsenic (As),
Cyanide as well as Total Petroleum Hydrocarbon (TPH).
Non-point source pollution in the basin is largely attributed to agricultural activities with
potential agricultural effects such as reduced river flows, loss of native riparian vegetation,
change in seasonal flows, excess nutrients, excess sediment load, change in pH, TDS, COD,
BOD, Nitrates, EC values and water contamination with agro-chemicals and sewage.

55
Groundwater Quality
The groundwater quality of the Wami Ruvu Basin is mostly affected by industrial, agricultural
and mining activities leading to higher values of EC, NO3, Fe, Hg, Cu, As and other heavy
metals. Aquifers within municipal areas suffer from effluent discharges resulting in higher BOD,
COD, coliforms, phosphates and nitrates values. In addition, both high and low pH values are
manifested depending on the nature of the pollutant.
The geological nature of the basin has an impact on groundwater quality. High EC values and
high mineral content in groundwater are attributed to the geological nature of aquifers. The high
electric conductivity areas are observed in the areas from the centre of Dar es Salaam to the
centre of Bagamoyo, the northern part of Bagamoyo District, western part of Kibaha District,
Morogoro Urban, southern part of Kongwa District and the southern part of Kiteto District.
1.3.2.4: RUFIJI BASIN
According to WREM (2012), the water resources of the Rufiji Basin, both surface and
groundwater, have relatively good chemical quality, but poor physical and bacteriological
quality. Surface waters have generally poorer physical quality than groundwater s. The common
physical quality problems are turbidity, colour, total suspended solids, and odour. Iron-humic
acid complexes present a water treatment challenge in surface waters draining swampy or
heavily forested areas. Both surface and groundwater s are contaminated with microorganisms of
faecal origin. Surface waters have a higher occurrence of faecal contamination, and higher
numbers of faecal coliform organisms per unit volume than groundwaters.
With respect to mineral content, both surface and groundwaters are relatively fresh, with the
larger proportion of waters having low concentrations of dissolved substances. Surface waters
are relatively fresher and softer than groundwaters. Electrical conductivity (a proxy for mineral
content), ranges from 5 to 1740 µS/cm in surface waters and 7 to 7960 µS/cm in groundwaters.
The 75th
percentile for conductivity is 106 µS/cm and 391 µS/cm in surface and groundwater
sources, respectively. Despite the lowly mineralized character of most waters inn this basin, there
are pockets of highly mineralized waters, especially in the Great Ruaha and Lower Rufiji sub-
basins.

56
Chemical quality problems occur in some waters. The key problem parameters in relation to
chemical quality, which are more common in groundwaters than surface waters, are acidic and
alkaline reaction (sometimes is considered a physical property), hardness and relatively high
concentrations of Sodium, Chlorides and Sulphates. There is great variability in the degree of
acidity or alkalinity of the waters. The pH ranges from 5.2 to 9.0 units in surface waters and 4.3
to 10.7 units in groundwaters. The mean pH is 7.07 and 6.86 units for surface and groundwaters,
respectively.
Based on the above observed water quality characteristics, the waters of the basin, both surface
and ground, only require minor treatment (to remove colour, turbidity and microorganisms) to be
fit for human consumption and other uses. If water is abstracted from remotely-located and well
protected water catchment areas, it may be supplied without treatment.
There is strong seasonality in water quality in both surface and groundwaters. In the wet seasons,
turbidity, colour and bacteriological contamination problems increase while the chemical content
gets diluted by rainwater. The opposite is observed in the dry seasons. Available data is
inadequate to infer the extent and impact of salt water intrusion in the Rufiji Delta.
1.3.2.5: INTERNAL DRAINAGE BASIN (IDB)
The National Sanitation Foundation developed a standardized method for comparing the water
quality of various water bodies in 1970. The water quality index is classified as follows: For
indexes between 91-100 the water quality is classified excellent, indexes between 71-90 is good,
indexes between 51-70 is medium, indexes between 25 - 50 is bad and below 25 is very bad.
Based on this classification, 25 % of water samples in the basin had good quality, 71.5 % of the
samples were in medium condition, and a single sample (Manyara Lake) had a bad water quality
index. About 83.7 % of samples from rivers were in medium condition (YEKOM/FBNE, 2015).
The most important pollution sources in the IDB aredomestic pollution sources, agricultural
pollution sources, industrial waste pollution, and livestock pollution sources. Domestic pollution
sources emanate within population centres (cities and villages). Wastewater and solid waste
produced from these population centres includes garbage from urban and commercial places (30
%), ashes and residuals (23 %), demolition and construction materials (3 %), domestic organic

57
rubbishes (22 %) and plastics (22 %). The solid waste accumulated in urban and rural areas is
highly concentrated with BOD and must be isolated from surface water and groundwater
resources. It is estimated that 1,156,288 tonnes of solid waste are produced annually in the basin,
with Lake Eyasi sub-basin, where most of the population centers are located, producing almost
60 % of all solid waste (YEKOM/FBNE, 2015).
Wastewater from domestic human activities is the most important pollution source in urban
areas. About 115 Million Cubic Metre (MCM) of wastewater are produced annually in the
Internal Drainage Basin releasing 113,527 tonnes of BOD, 27,330 tonnes of total nitrogen and
4,205 tonnes of total phosphorus into the environment (YEKOM/FBNE, 2015).
The Internal Drainage Basin is highly populated with livestock waste due to the social setup of
its inhabitants. Livestock related waste contributes 135,147 tonnes /yr BOD, phosphorus (5,005
tonnes /yr), and nitrogen (162,677 tonnes /yr) pollutions in the basin. Agricultural pollution in
the Internal Drainage Basin is very limited as usage of fertilizers and pesticides is very low and
could be ignored. Similarly, industrial wastes in the basin are limited to mining activities
whereby heavy metals (Calcium and Mercury), lower pH, higher EC, high carbonates and
turbidity are the main concerns (YEKOM/FBNE, 2015).
The quality of the basin's water resources is highly affected by both higher Electric Conductivity
(EC) values and higher fluoride concentrations, caused by high magnesium and other alkaline
metals present due to the geological nature of its rocks. Relatively high nitrate concentrations are
observed in some areas and are mostly attributed to anthropogenic origins.
1.3.2.6: RUVUMA RIVER AND SOUTHERN COAST BASIN
Surface Water
Surface water in the basin is considered to be of good quality except in highly populated areas,
where surface water quality is affected by municipal wastes. High nitrate, pH, BOD and COD
contents are observed in polluted surface water around settlement areas. There are no major
industries in the basin, the only major industrial pollution emanates from mining activities. High

58
heavy metal concentrations, low pH and high turbidity values are observed in surface water
around mining areas.
Groundwater
Groundwater in Ruvuma River and Southern Coast is affected by both natural and anthropogenic
sources. Aquifers in coastal formations are saline in some places due to either sea water intrusion
or type and source of the sediments contained in it. Marine sediments contain high carbonate
materials that affect groundwater quality. Low pH values and higher salinity are observed in
these aquifers.
Basement aquifers depicts low pH, high salinity, medium to high EC and low Total Dissolved
Solids (TDS) values due to mineral content of the rock mass. Karoo, alluvial and ligoriths
aquifers are generally of good water qualities. The unconsolidated and partially consolidated
formations generally contain waters that are high in iron and manganese, and total dissolved
solids (TDS), possibly as a result of contact with Tertiary and Quaternary, or even Mesozoic
formations. High pH values have been observed in spring flows emanating from dolomitic
formations.
1.3.2.7: LAKE RUKWA BASIN
The main water quality issues in the basin include high silt loads from widespread catchment
degradation; poor rural sanitation leading to physical and bacteriological contamination of
surface and groundwater resources; poor urban sanitation leading to heavy pollution of streams
draining urban areas; high iron from suspected pipe rust; high iron occurring naturally in rock
formations; high fluoride naturally occurring in groundwater sources; high levels of
mineralization and hardness in groundwater; and heavy metal pollution from mining activities
(WREM International, 2014).
Generally, the basin’s surface waters and groundwater have relatively poor physical and
bacteriological quality, but have good chemical quality. Poor physical quality is most
pronounced in surface water. There is strong seasonality in water quality, with poor water quality
observed more often during the rainy seasons. Both surface and groundwater in several basin
areas is contaminated with bacteria of faecal origin. The problem is most serious in surface
59
waters, where about 75 % of tested water samples had higher coliform counts. However, only 10
% of groundwater sources exhibited this problem (WREM International, 2014).
Lake Rukwa is an alkaline lake with a sodium-bicarbonate water type. The pH of the lake ranges
from 8.8 to 9.8; alkalinity is about 900 mg CaCO3 per litter, and electrical conductivity ranges
from 2,200 to 2,800 μS/cm. The lake has poor physical and bacteriological quality. The lake is
turbid and strongly coloured. Colours vary with seasons from dull brown, through brick red and
brilliant green, to greenish-grey. Turbidity values are typically in excess of 100 Nephelometric
Turbidity Unit (NTU) while colour, which comes from algal pigments, humic compounds,
suspended solids and iron complexes, typically exceeds 100 True Colour Unit (TCU). Faecal
coliform concentrations are in excess of 200 colony-forming unit (cfu)/100mL reflecting the
poor environmental sanitation challenges in the drainage basin, and the favourable climate within
the basin for the growth and proliferation of bacteria (WREM International, 2014).
Heavy metal pollution from gold mining poses the greatest threat to water quality. Artisanal
mining activities increasingly mobilize heavy metals from goldfields and transport them into
surface water bodies. Heavy metals are present and are likely accumulating in Lake Rukwa
(WREM International, 2014).
1.3.2.8: LAKE NYASA BASIN
Surface Water
The analysis of water quality for the major rivers in the basin (Songwe, Kiwira, Mbaka, Lufilyo
and Lumbira) is identified in three groups based on the chemistry of water (SMEC, 2015).
Songwe, Lumbira, and Lufilyo had Ca/Cl and Na/Cl ratios higher than the lake water, which was
associated with presence of bedrock in the catchments drained by the rivers. Mbaka showed low
Ca/Cl and Na/Cl ratios and so did Kiwira River-which is impacted by hydrothermal springs in its
catchment.
The Songwe and Kiwira Rivers contribute 4 % and 5 % of the annual river input to Lake Nyasa
respectively and, therefore, have significant influence on the lake’s water quality. Atmospheric
inputs to the lake accounts for 33 % of new phosphorus and 72 % of new nitrogen to Lake

60
Nyasa. The lake is particularly sensitive to nutrient enrichment and pollution because of its large
surface area and slow water-flushing rates (SMEC, 2015).
Only turbidity and high sediment content are contaminants associated with mining activities
within the basin. Agricultural related pollution mainly occurs in flood plains where paddy
irrigation and maize plantations are taking place in relatively large scale. High EC, BOD, COD,
pH and TDS values in surface water around irrigation schemes can be attributed to both
municipal agricultural contaminants.
Groundwater
Available data indicates that groundwater quality is generally good with a range of electrical
conductivity (EC) from 100 to 4,180 µS/cm with only a few samples (six out of 99) exceeding
the Total Dissolved Solids (TDS) limit (SMEC, 2015). Both municipal effluents and agricultural
wastes affect groundwater quality in aquifers with high water tables, such as alluvial aquifers
around Kyela Township where high EC, BOD, COD and pH values have been observed. In
addition, these aquifers experience high values of coliform bacteria due to sewerage
contamination.
1.3.2.9: LAKE TANGANYIKA BASIN
Deterioration of water quality is likely to place the beneficial uses of the basin’s water resources
at risk in some areas and have the potential to have a more serious impact in the future, including
on sustainability and biodiversity of aquatic ecosystems (SMEC, June 2015). The deterioration in
water quality is caused, among others, by: faecal contamination from poor domestic waste
management in rural and urban areas, which threatens water sources for human use. Other
sources of polution are sediment, nutrients and agrochemicals exported from catchments, due to
poor land use practices, and uncontrolled discharge of mining wastes, which threaten human,
livestock and wildlife drinking water sources and aquatic ecosystems. Eutrophication, threaten
the human use of aquatic resources, the sustainability and biodiversity of aquatic ecosystems in
large lakes; naturally occurring fluoride in potable water sources threaten the suitability of water
for human and livestock use.

61
Surface water
Surface water quality has been found to be generally good. However, pollution sources have
existed in various parts of the basin. The pollution sources are linked to urban domestic and
industrial wastewater (from Rivers Ntahangwa, Bujumbura, Burundi), Chlorinated hydrocarbons,
and pesticides (from Cotton plantations near the Rusizi River), Heavy metals (from Northern
(Burundi) lake waters), Sediment and nutrients from fertilizers (from Rusizi and Malagarasi
rivers), Mercury from gold mining operations (from Malagarasi River sub-basin), Ash residues
(from cement works, Kalemie, DR), Organic wastes, sulphur dioxide (from Sugar refinery plant,
near Uvira, DRC), and shipping operations (from Lake-wide oil depots, e.g. Bujumbura) (SMEC,
2015).
Groundwater
Groundwater quality within the basin generally falls within Tanzania standards for drinking
water, with the major components analysed being; EC generally less than 2,000 µS/cm, pH
between 6 and 9, and fluoride less than 4 mg/L. pH greater than 6, fluoride greater than 4 mg/L
and EC greater than 2000 µS/cm have been recorded in the eastern parts of the Basin and are
associated with pollution from artisanal mining and farming.
Lowest pH of 5.1 was recorded in Tabora Rural and Mpanda Districts. Only one sample in
Tabora Rural District recorded a pH of greater than 9.2. There is a high correlation between
prevalence of low pH and geology. Slightly acidic pH is found mostly within granites and
Archaean basement geology and mostly in the eastern part of the basin in the Tabora Region.
Within the Lake Tanganyika Basin, fluoride concentrations of greater than 1.5 mg/L have been
observed in Tabora urban and rural areas, and in Kahama and Nzega Districts. A correlation of
fluoride concentration with geology shows that high fluoride in groundwater is associated with
granites. Maximum groundwater fluoride in the basin is 5.5 mg/L in Tabora rural at Kukundi B
Village.
Saline groundwater is found in Uvinza where brine is being mined for salt production.
This saline groundwater is associated with deep groundwater flow. All groundwater samples
analysed in the basin predominantly show nitrate levels of less than 10 mg/L. Nitrate levels of

62
greater than 40 mg/L were observed in the villages of Mazwe-Mpanda district, Usunga and
Isanjandugu. Moreover, nitrate levels of 50 to 100 mg/L were observed in Sikonge and Tukutuku
area in Tabora urban. All these elevated nitrate levels were from shallow wells (SMEC, June
2015).
More information on the physical and chemical water quality in the nine water basin is indicated
in map 8.1.

63
Map 1. 8: Freshwater Quality
Legend
Query results
water quality
good colored
milky
salty fluoride
unknown Percentage of
good water
more then 80
50 to 80 pct
25 to 50 pct 25 pct and
less no data Water Po
OpenStreetMap layer © OpenStreetMap contributors
Source: Ministry of Water, Water Point Mapping Database

64
Table 1. 21: Freshwater Quality Data, Lake Victoria 2013 - 2017
Parameters Unit of
Measurement 2013 2014 2015 2016 2017
a. Nutrients and
chlorophyll
1. Concentration level of
nitrogen
Concentration
(mg/l) 0.18 0.16 0.22 0.24 0.21
2. Concentration level of
phosphorous
Concentration
(mg/l) 0.152 0.133 0.122 0.097 0.126
3. Concentration level of
chlorophyll A
Concentration
(mg/l) 0.0023 0.0023 0.002 0.002 0.002
b. Organic matter 1. Biochemical oxygen
demand (BOD)
Concentration
(mg/l) 3 2 1 3 2.2
2. Chemical oxygen
demand (COD)
Concentration
(mg/l) 11 9 8 10 9.5
c. Pathogens 1. Concentration levels
of faecal coliforms
Concentration
(mg/l) 30 31 10 15 21
d. Metals (e.g.,
mercury, lead,
nickel, arsenic,
cadmium)
1. Concentrations levels
in sediment and
freshwater
Concentration
(mg/l) 0 0 0 0 0
2. Concentration levels
in freshwater
organisms
Concentration
(mg/l) - - - - -
e. Organic
contaminants (e.g.
PCBs, DDT,
pesticides, furans,
dioxins, phenols,
and radioactive
waste)
1. Concentration levels
in sediment and
freshwater
Concentration
(mg/l) - - - - -
2. Concentration levels
in freshwater
organisms
Concentration
(mg/l) - - - - -
f. Physical and
chemical
characteristics
1. pH/Acidity/Alkalinity Level 8.6 8.6 6.1 7.2 7.6
2. Temperature Degrees 26.2 27 27.4 27 23.9
3.Total suspended solids
(TSS)
Concentration 18 24 32 24 24
4. Salinity Concentration 0 0 0 0 0
5. Dissolved oxygen
(DO)
Concentration 4.5 5 5.3 5.5 5

65
Key Message
Tanzania’s Development Vision
2025 plans the mining sector to
account for 10 % of the GDP in
2025. This will require more efforts
on value addition and more mineral
sector integration with other sectors
of the economy.
CHAPTER TWO
ENVIRONMENTAL RESOURCES AND THEIR USE
2.1: Mineral Resources
Tanzania has various mineral resources found on the
surface of the earth and in the subsoil. These include
metallic minerals such as gold, iron, silver, copper,
platinum, nickel and tin; gemstones such as diamonds,
Tanzanite, ruby, garnet, emerald, alexandrite and
sapphire; industrial minerals such as kaolin, phosphate,
lime, gypsum, diatomite, bentonite, vermiculite, salt
and beach sand; building materials such as stone
aggregates and sand; and energy minerals such as coal
and uranium. Mining activities in the country are of
three main types: large scale, medium and small scale
operations (MEM, 2014).
Tanzania is one of the major mining countries in the continent (4th
largest gold producer in
Africa) and a major recipient of foreign investment in its mining industry. The sector contributed
4.8 % of GDP in 2016 and about 50 % of the country’s foreign exchange earnings from exports
apart from traditional exports. Based on Tanzania’s Development Vision 2025 plan, the mining
sector is expected to account for 10 % of the GDP by 2025. The sector attracts various players
i.e. miners, prospectors, project developers and financiers, critiques and many more. The main
focus of the Mineral Policy of 2009 is to increase mineral sector integration with other sectors of
the economy in order to maximize the contribution of the sector to GDP and contribute to
poverty alleviation.

66
Since the early 1990s, changes in Government policy and the approach to the mining sector, and
increasing international investment, have led to its rapid growth and the influx of international
mining giants such as Barrick Gold Corporation and AngloGold Ashanti Limited. This, coupled
with the stable political climate and improved business environment, has made Tanzania an
increasingly attractive destination for foreign direct investment (FDI). There are now a large
number of mining operations across Tanzania, and production of gold and diamonds has
increased significantly since the 1990s. However, the recent global price volatility for
commodities such as gold has stifled the growth rate in the last two years. The Government will
strategically participate in mineral exploration, mining, smelting, refining and value addition
activities. It will also create a conducive environment for Tanzanians to participate in medium
and large scale mining operations.
Map 2.1 presents information on geological and mineral occurrences in Tanzania.
Map 2. 1: Geological and Mineral Occurences in Tanzania
Source: Ministry of Minerals

67
Key Message
Most recently the Governent has
formulated the Natural Wealth and
Resource Sovereignty Act of 2017
which recognize the permanent
sovereignty of Tanzania over all of its
natural wealth.
2.1.1- Stocks and Changes of Mineral Resources
The mineral reserves estimation are essential for
daily operation of mine, it also represent the future
asset of the mine. The Mineral Policy of 2009 will
continue to attract investment in exploration and
mining; underpin development of small scale
miners; and promote public participation in mining
activities. Furthermore, the Policy provides a clear
guidance to attract investors in exploitation and
sustainable exploitation of mineral resources of
Tanzania in a win - win situation.
Gold reserves in Tanzania are estimated to be 29
million troy ounces. Gold exploration has been centered mostly on the greenstone belts around
Lake Victoria and Lupa Gold Field in Chunya and Mpanda areas, where several large deposits
have already been discovered and are being developed. Iron reserves in Tanzania are located
mainly in Liganga, Uluguru Mountains, Mbabala near Lake Tanganyika and Itewe. The Liganga
iron ore mine holds the biggest iron resources in Tanzania with a proven reserve of 126 million
tonnes. In addition, recent exploration programmes in Tanzania are revealing presence of
substantial amounts of uranium and base metals.
Table 2.1 shows the cumulative reserves of different minerals available in Tanzania since the
commencement of mining activities until 2015.

68
Key Message
Unsustainable mining of mineral
resources can lead to adverse
adverse effects on environment and
the community.
Table 2. 1: Tanzania Mineral Reserves for Selected Minerals, 2015
Type of mineral/ indicator Unit of Measurement Reserve Quantity
Gold million troy ounces 28.57
Tanzanite million carats 109
Tsavorite million carats 1.4
Diamonds million carats 33.1
Nickel million tonnes 107
Cobalt tonnes 9,240
Uranium million pounds 156.12
Coal million tonnes 588.4
Iron Ore million tonnes 219
Titanium tonnes 175,000
Vanadium tonnes 5,000
Source: Ministry of Minerals
2.1.2- Production and Trade of Minerals
2.1.2.1: Production of Minerals
Two commonly used methods in mineral extraction are
surface and underground mining. Tanzania major
mining projects includes Geita Gold mine, North Mara
Gold mine, Williamson Diamond Limited, Bulyanhulu
Gold Mine, Buzwagi Gold mine, Kiwira Coal Mine and
Tanzanite One. Some of these mines use open cast
mining and others use underground mining technique.
Pitting is the main mining technique that is used by
artisanal and small scale miners. Pits are usually
supported by timber to prevent walls from collapsing
(MEM, 2014).
Tanzania is the sole producer country of the precious gemstone known as Tanzanite in the world
and has large amount of known reserves of gold, diamond, nickel, iron, coal, varieties of high-
value precious colored gemstones, such as emerald, ruby, tsavorite and sapphire, as well as
industrial minerals as shown in Table 2.1.
Gold production in Tanzania stands at an average of 43.5 tonnes per year from 2013-2016. This
makes the country the 4th
largest gold producer in Africa after South Africa, Ghana, and Mali.

69
The mineral policy of 2009 aims to promote and develop the mining activities and to ensure the
gemstone mines are owned by Tanzanians to not less than 50 % shares.
Mining sector activities in Tanzania have continued to grow over the years, but still face some
challenges which have led to low a relatively low contribution of the sector to the economy
compared to its growth. These challenges include: low integration with other sectors of the
economy, slow development of small scale mining, low levels of value addition of minerals, and
environmental degradation. The mineral policy recognizes the need for environmental
sustainability in mining, and promotes best practices for health, and safety and environmental
management in mining areas (MEM, 2009). Mining activities have environmental impacts such
as environmental pollution, soil erosion, loss of biodiversity, deforestation etc. so the
exploitation activities need to be sustainable. This requires, among others, that mining companies
comply with regulatory requirements, and conduct their activities while protecting the
environment, safety and health of the community (MEM, 2014).
Table 2.2 shows the mineral production in Tanzania. The analysis of the 2013-2016 mineral
production data shows fluctuations in this period. Gold production increased by 1.5 %, Diamond
(6.8 %), coal (22.1 %), Silver (11.8 %), Copper (6.2 %) whereas Tanzanite decreased by 17.1 %.
Sand production decreased in 2016 when compared to 2015 although the average production
from 2013 to 2016 shows an increase of 18.5 %.

70
Table 2. 2: Mineral Production in Tanzania, 2013 - 2016
Mineral type Unit of
Measurement 2013 2014 2015 2016
Total
Production
Weight
(000)
Weight
(000)
Weight
(000)
Weight
(000)
Weight
(000)
Diamonds carats 179.6 252.9 216.5 240.0 889.0
Gold kg 42.5 40.5 46.0 45.2 174.2
Tanzanite kg 24.8 18.5 6.4 13.9 63.6
Other Gemstones kg 2,649.5 3,069.2 1,878.41 2,541.0 10,138.0
Silver kg 11.0 14.5 15.6 18.0 59.1
Copper pounds 12,654.0 14,027.0 14,252.3 16,247.2 57,180.6
Phosphate tonnes 1,023.0 738.0 222.8 23.7 2,007.5
Bauxite tonnes 49,952.3 25.6 205.1 73.0 50,255.7
Coal tonnes 84.8 246.1 257.3 276.0 864.3
Limestone tonnes 3,899.2 1,754.5 3,174.7 4,170.1 12,998.4
Gypsum tonnes 280.5 200.2 254.8 213.7 949.2
Salt tonnes 34.0 58.6 92.2 145.7 330.5
Pozzolana tonnes 52.4 68.9 342.6 230.0 693.9
Copper ore tonnes 5.6 4.7 2.0 0.9 13.1
Galena ore kg 1.0 0.6 0.3 0.1 2.0
Marble tonnes 10.7 607.1 1,037.6 58.5 1,714.0
Carbon dioxide gas kg 5,243.6 4,744.2 2,748.3 6,193.3 18,929.4
Kaolin tonnes 1.8 3.8 2.0 0.00065 8.2
Tin kg 157.1 78.7 191.5 0.1 570.2
Calcite tonnes 0.00205 - 0.2 0.00073 0.2
Sandstone/Clay/Red soil tonnes 9,488.3 1,929.3 5,793.1 979.1 18,189.8
Sand tonnes 1,501.4 7,283.2 29,799.9 10,596.1 49,180.6
Aggregates tonnes 8,449.1 2,363.9 7,676.0 21,084.2 39,573.2
Stones tonnes 3.9 69.8 222.5 297.3 593.5
Source: Ministry of Minerals
2.1.2.2: Importation of Minerals
Importation of minerals or samples of minerals into Tanzania require an import Permit from the
ministry responsible for minerals. Most of the imported minerals shown in Table 2.3 below are
used as inputs in different industries. For example Cement Industries use coal as heating sources.
Importation of coal was restricted in 2016 by the Ministry responsible for Minerals to enhance
internal production and market for coal in the country. The drastic increase in the importation of
coal in 2015 is associated with the increase in number of cement factories in Tanzania.

71
Table 2. 3: Mineral Importation in Tanzania, 2010 - 2017 Mineral type
Unit of
Measurement
2010 2011 2012 2014 2015 2016 2017
Weight
(000)
Weight
(000)
Weight
(000)
Weight
(000)
Weight
(000)
Weight
(000)
Weight
(000)
Coal Metric tonnes 0.065 0.079 0.025 0.025 269.34 - -
Gypsum Metric tonnes - - - -
38.00 - -
Petroleum Coke Metric tonnes - - - -
51.772 - -
Coltan Metric tonnes - - - -
0.05 - -
Clinker Metric tonnes - - - -
50.00 - -
Hessonite Metric tonnes - - - -
0.01 0.008 0.039
Silicon manganese Metric tonnes - - - -
- 0.081 0.056
Source: Ministry of Minerals
“-” Not imported or not available
2.1.2.3: Exportation of Minerals
Table 2.4 presents mineral export statistics from 2013 to 2016. It is indicated that, mineral
exports amounted to USD 2.05 billion in 2016 with gold accounting for more than 89 % of all
mineral exports. The total value of diamond exports was USD 90.4 million, while other minerals
exports’ value was USD 134.7 million. Tanzania exports gold mainly to South Africa, India,
Switzerland and Australia, while diamonds are being exported almost entirely to Luxembourg.

72
Table 2. 4: Mineral Exports in Tanzania, 2013 - 2016
Mineral type
Unit of
Measure
ment
2013 2014 2015 2016
Weight
(000)
Value
(US$-
Mil)
Weight
(000)
Value
(US$-
Mil)
Weight
(000)
Value
(US$-
Mil)
Weight
(000)
Value
(US$-
Mil)
Diamonds carats 171.4 42.9 252.9 82.1 216.5 56.0 239.9 90.4
Gold kg 42.5 1,752.7 40.5 1,640.1 46.0 1,625.8 45.2 1,824.8
Tanzanite kg 24.8 39.3 14,591.7 29.2 6,370.4 25.3 13,942.6 29.1
Other Gemstones kg 2,649.5 11.1 3,069.2 20.0 1,878.4 15.1 2,541.0 45.7
Salt tonnes 34.0 2.4 54.8 5.3 92.2 4.8 145.7 4.8
Phosphate tonnes 1.0 0.2 738.0 0.1 222.8 0.1 23.7 0.7
Bauxite tonnes 49,952.3 4.4 25,641.2 2.0 204,955.5 2.1 72,778.5 1.2
Gypsum tonnes 171.6 1.1 200.2 2.5 254.8 4.5 213.7 6.3
Silver kg 11.0 17.2 14.5 10.3 15.5 7.8 18.0 9.9
Copper pounds 12,654.0 42.1 14,027.0 43.7 14,127.6 35.4 16,247.2 35.4
Copper Ore tonnes 5,559.4 1.6 4,685.3 2.2 2,000.6 0.5 885.0 0.2
Marble tonnes 10.7 0.9 607.1 0.2 1,037.5 0.7 58.5 1.4
Total Value (US$-Mil)
1,915.8
1,837.6
1,778.1
2,049.9
Source: Ministry of Minerals
2.2. Energy Resources
The energy sector is vital for the socio-economic development of any country. The Government
of Tanzania has put in place strategies and master plans to develop the sector to ensure
availability, affordability, reliability and access to modern energy services in the country. These
are: - The Power System Master Plan (PSMP) to promote generation mix in power sub-sector,
the Natural Gas Utilization Master Plan (NGUMP) 2016-2045 and the Biomass Energy Strategy
in Tanzania (BEST), (MEM, 2015).

73
Key Message
The national energy balance in
Tanzania is dominated by biomass
which accounts for 85 %, other
sources include petroleum (9 %),
electricity (5 %) and renewable
energies (1 %).
Key Message
Coals were discovered in parts of
Tanzania such as Mchuchuma,
Liganga, Kiwira and Ngaka and are
estimated to be 1.9 billion tons of
which 25 % is proven.
Tanzania has an abundance of indigenous energy
resources, both renewable and non-renewable. These
resources include hydro, coal, natural gas, uranium,
biomass, geothermal, tidal wave, wind and solar. Non-
renewable energy resources are subject to change over
time because they are being exploited, or due to new
discoveries or reclassification of previously
unrecoverable resources, or catastrophic losses.
However, renewable energy resources are not subject to
depletion in the same way as non-renewable energy
resources because these resources are naturally
replenished on a human timescale. The national energy balance is dominated by biomass which
accounts for 85 %. Other sources include petroleum (9 %), electricity (5 %) and renewable
energies (1 %). Despite these resources, the supply of modern energy services is still an
insufficient to meet the demand for it (MEM Quarter Digest Report, 2016).
2.2.1- Stocks and Changes of Energy Resources
Reserves in the energy resources, particularly non-
renewable resources can be well estimated and
described. Non-renewable energy is a finite resource,
their extraction and use in the economy depletes
resources and limiting its availability for future
generation. Statistics on the magnitude of their stocks
through time are required to assist in the sustainable
management of these resources.
Coal resource is not exploited for electricity generation
although some industries are using coal for thermal
applications. Coals were discovered in parts of
Tanzania such as Mchuchuma, Liganga, Kiwira and Ngaka and are estimated to be 1.9 billion
tonnes of which 25 % is proven. Uranium deposits, which are estimated to be 200 million pounds

74
and have not yet been utilized. Uranium deposits were discovered in Namtumbo (Mkuju), Bahi,
Galapo, Minjingu, Mbulu, Lake Natron, Songea, Tunduru, Madaba and Nachingwea. Natural gas
exploration activities in Tanzania have a history of more than 50 years. The first discovery was
made in 1974 at Songosongo Island, followed by Mnazi Bay in 1982. Table 2.5 shows statistics
on natural gas reserves for the reporting period of 2013 to 2017.
Table 2. 5: Tanzania Natural Gas Reserve, 2013 - 2017
Year Recoverable Natural Gas (est.70 % of Gas Initial
in Place (GIIP) - Trillion Cubic Feet (TCF)
Natural Gas Discovery (GIIP) –
Trillion Cubic Feet (TCF)
2013 29.89 42.7
2014 35.12 50.17
2015 35.12 55.21
2016 40.75 57.25
2017 40.75 57.25
Source: Ministry of Energy, 2017
Natural gas was discovered on onshore and offshore sites in Tanzania. Onshore gas reserves
were discovered at Songosongo, Mnazi Bay, Mkuranga, Kiliwani and Ntorya; whereas offshore
reserves were discovered in the deep sea off the coast of Tanzania (Lindi and Mtwara) (Map
2.2). The National Energy Policy, 2015 (NEP) and Power System Master Plan (2016 update) aim
to increase the use of other energy resources in electricity generation in the near future. Gas is
already being utilized for electricity generation. The NEP and PSMP furthermore, aim to develop
and maintain an efficient petroleum database, information system, infrastructure and exploitation
of local and trans-boundary petroleum resources.
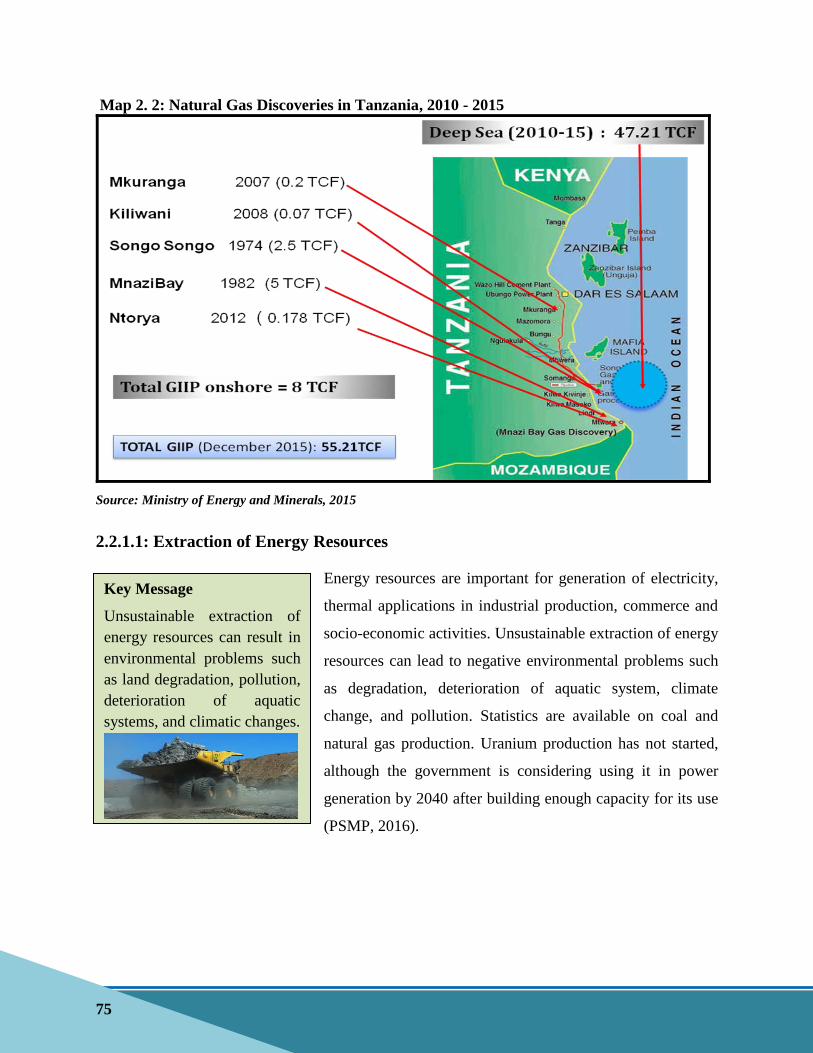
75
Key Message
Unsustainable extraction of
energy resources can result in
environmental problems such
as land degradation, pollution,
deterioration of aquatic
systems, and climatic changes.
Map 2. 2: Natural Gas Discoveries in Tanzania, 2010 - 2015
Source: Ministry of Energy and Minerals, 2015
2.2.1.1: Extraction of Energy Resources
Energy resources are important for generation of electricity,
thermal applications in industrial production, commerce and
socio-economic activities. Unsustainable extraction of energy
resources can lead to negative environmental problems such
as degradation, deterioration of aquatic system, climate
change, and pollution. Statistics are available on coal and
natural gas production. Uranium production has not started,
although the government is considering using it in power
generation by 2040 after building enough capacity for its use
(PSMP, 2016).

76
Key Message
Songosongo field has been the
major contributor of natural gas
production from 2012 to 2017 with
more than 55 % of annual
production coming from the area.
The natural gas produced in Songosongo stands at 64
to 85 Million Standard Cubic Feet per Day
(MSCFD)while Mnazi Bay stands at 50 (MSCFD).
Demand for natural gas has been increasing in recent
years due to its use in industries and power generation.
Furthermore, the completion of Mtwara-Dar es salaam
pipeline and Kiliwani gas field which started operation
in 2016 have accelerated both supply and demand of
natural gas in industries and power generations. Plans
for utilization of natural gas are outlined in the Natural
Gas Utilization Master Plan (NGUMP) (2016-2045). It
describes the strategy to supply gas to the domestic market and export to international markets,
as well as plans for construction of Liquefied Natural Gas (LNG) pipeline for domestic and
export of LNG to other countries in the region.
Table 2.6 shows statistics on natural gas production from 2012 to 2017 on three gas fields. The
trend reveals an increase innatural gas production, from 36,905.15 MCFT in 2012 to 51,041.21
MCFT in 2017 which is equivalent to an increase of 38.3 %. Songosongo field has been the
major contributor in natural gas production from 2012 to 2017 with more than 55 % of annual
production. However, there has been a noticeable decline in productions at Songosongo during
the periods.

77
Key Message
The total share of Biomass in
Primary Energy Supply is expected
to decrease by 49 % by 2040 due to
increase of modern energy
supply/services.
Table 2. 6: Natural Gas Productions in Tanzania, 2012 - 2017 Years
Gas Field (MCFT)
Total Production Songosongo Mnazi Bay Kiliwani
2012 36,233.01 672.14 - 36,905.15
2013 19,918.41 715.02 - 20,633.43
2014 33,061.00 784.69 - 33,845.69
2015 31,383.00 5,799.41 - 37,182.41
2016 29,747.48 15,732.28 2,767.45 48,247.21
2017 29,487.32 17,960.30 3,593.59 51,041.21
Source: Tanzania Petroleum Development Corporation (TPDC)
“-” Not started production
2.2.2- Production, Trade and Consumption of Energy
It is important, for both energy planning and
environment concerns, to distinguish between energy
production from non-renewable and renewable sources.
Many non-renewable energy sources emit high levels of
CO2, example coal, crude oil and natural gas, and are
therefore high contributors to Green House Gases
(GHGs) globally in 2010.
Wood and charcoal are the main sources of energy for
households in rural areas and accounts for 85 % of total
final energy consumption (NEP, 2015). Without
appropriate interventions, current projections show that
demand for charcoal will double by 2030 from approximately 2.3 million tonnes of charcoal per
year in 2012 (PSMP, 2016).
The intention of the government is to replace wood and charcoal consumption with more supply
of electric power, gas and petroleum products. This is very important since heavy dependence on
biomass contributes to deforestation. Already, there are signs of growing use of LPG as a source
of heating and cooking energy for households. Statistics show that the yearly volume of imported
LPG has increased to 90,296 MT in 2016, from 24,470 MT imported in 2011. With electricity
and gass use increasing, the government expects that the share of charcoal and wood in the final

78
energy consumption will reach 49 % in 2040 (MEM-JESR, 2013), thus helping reduce problem
of deforestation.
Production of energy is the capture, extraction or manufacture of fuels or other energy products
in forms which are ready for general consumption. In energy statistics, two types of production
are distinguished, primary and secondary energy. Primary energy products are extracted or
captured directly from natural resources such as crude oil, coal and natural gas. Secondary
energy products are produced by transforming primary energy products. Table 2.7 presents
statistics on production and consumption of primary energy in Tanzania.
Table 2. 7: Production, Trade and Consumption of Energy, 2013 - 2016
Indicator Unit
Years
2013 2014 2015 2016
Total Energy production ktoe 21,308 22,170 23,114 24,228
Production from non-renewable sources ktoe 868 913 968 1,114
Production from renewable sources ktoe 20,440 21257 22,146 23,114
Primary Energy production ktoe 20,291 21,033 21,899 22,468
Imports of energy ktoe 2,903 2,870 2768 2,694
Total energy supply ktoe 24,020 24,834 25,626 26,273
Final consumption of energy ktoe 20,636 21,456 22,461 23,108
Source: MEM & IEA
2.2.2.1: Electricity Generation and Consumption
Electricity which is produced and supplied through the national grid comes from hydro, biomass
and thermal generation units owned by Tanzania Electric Supply Company (TANESCO) and
Independent Power Producers (IPPs). Demand for electricity has been rising, both for industrial
and domestic use. Growth of demand for electric power ranges between 10-15 % per year. As a
result, the installed power capacity must increase from 1,583.0 MW (April, 2014) to at least
10,000 MW by 2025 and transmission and distribution systems must also be expanded. To
address these challenges in the electricity sub-sector the Government is attracting private
investment in the subsector and has embarked on reforming the Electricity Supply Industry
(ESI).

79
Key Message
The government plan is to increase
installed capacity from 1,583.0
MW in 2014 to 10,000 MW by
2025 and increase connection level
from 32 % in 2016 to 75 % by
2033.
The Government is planning expansion of distribution
systems and increase in connection levels from 36 % in
2016 to 60 % by 2025, and further to75 % by 2033. To
achieve the GoT is implementing rural electrification
program under Rural Energy Agency (REA). It is
anticipated that there will also be further growth of
investments by small power producers (Off-grid) to
ensure adequate, reliable, and affordable energy supply
in rural areas. Table 2.8 shows statistics from
TANESCO on electricity generation by type of fuel and
consumption by different groups.
Electricity generation from 2011 – 2017 was largely dominated by gas, which accounted for
21,817.4 GWh (51.3 %), followed by hydro power with 14,972.9 GWh (35.2 %).
Diesel/HFO/GO accounted for 5,649.4 GWh (13.3 %) and Biomass 116.9 GWh (0.3 %). It is
also revealed that, electricity generation increased from 5,057.6 GWh in 2011 to 7,006.6 GWh in
2017.
Table 2. 8: Electricity Generation (GWh) by Type of Fuel, 2011 - 2017
Fuel Source 2011 2012 2013 2014 2015 2016 2017 Total
Gas 2,265.0 2,664.0 2,872.2 2,624.0 2,873.8 4,196.4 4,322.0 21,817.4
Hydro 1,992.6 1,769.9 1,721.3 2,613.5 2,124.4 2,382.1 2,369.1 14,972.9
Diesel/HFO/GO 781.1 1,083.5 1,133.2 784.9 1,183.2 389.1 294.4 5,649.4
Biomass 19.0 20.4 6.2 6.6 14.5 29.1 21.1 116.9
Total 5,057.6 5,537.8 5,732.8 6,029.0 6,195.9 6,996.7 7,006.6 42,556.5
Source: Tanzania Electric Supply Company

80
Key Message
Tanzania has lower electricity
consumption per capita compared to
Sub-Saharan Africa and global
averages.
2.2.2.2: Electricity Consumption
In June 2017, the average electricity consumption per
capita was 138 kWh/year which is quite small
compared to 2,500 kWh/year global average and 550
kWh/year for Sub-Saharan Africa. The average
growth rate for electricity demand in Tanzania ranges
between 10 % and 15 % per annum. Electricity
consumption statistics show that the largest user group
in 2017 was general use (T1) which accounted for
36.7 % of total electricity consumption. This is
followed by high Voltage use (T3) which accounted
for 35.8 %. The lowest electricity consumption group was domestic use (D1) which accounted
for 3.6 % of total consumption in the year. Table 2.9 shows Electricity consumption in GWh for
the period of 2011-2017.
Table 2. 9: Electricity Consumption (GWh), 2011 - 2017
User Group 2011 2012 2013 2014 2015 2016 2017 Total
Domestic Use (D1) 331.2 320.8 279.8 217.3 229.8 324.5 324.7 2,028.1
General Use (T1) 1,283.5 1,510.2 1,737.6 1,921.9 2,012.7 2,080.9 2,348.1 12,894.9
Low Voltage Supply (T2) 517.7 549.4 562.9 580.7 580.9 598.6 622.4 4,012.6
High Voltage Supply (T3) 1,433.6 1,581.8 1,663.5 1,832.4 1,918.1 1,991.7 2,164.0 12,585.1
Zanzibar (T5) 278.3 298.6 352.9 348.5 344.6 360.8 383.2 2,366.9
Kahama Gold Mine (T8) 156.2 168.7 168.5 181.3 198.8 195.3 185.3 1,254.1
Total 4,000.4 4,429.5 4,765.2 5,082.1 5,284.8 5,551.7 6,027.7 35,141.4
Source: Tanzania Electric Supply Company

81
Key Message
Tanzania is encouraging the use of
renewable energy sources for
electricity generation in order to
reduce CO2 emission from non-
renewable energy sources.
2.2.2.3: The National Energy Policy issues and challenges
The National Energy Policy (2015) provides guidance
for sustainable development and utilization of energy
resources to ensure optimal benefits to Tanzanians and
to contribute towards transformation of the national
economy. The main focuses are electricity generation,
transmission, distribution, interconnection, power
trading and rural electrification.
The policy underscores five major issues related to
electricity sector in the country, one of which is
ensuring sufficient power for the domestic market and
participation in cross-border trade. During the past few decades the country has been highly
depended on hydro generation where hydropower contributed 80 % of electric power supply in
the country. However, due to discovery and commercialization of other energy resources such as
gas, biomass, geothermal and so forth as well as changes in the hydrological trends, the country’s
power system has shifted from dependence on hydropower to generation mix. Despite that cross-
border trading of electricity in the country has not changed much. Utilization of both renewable
and non-renewable energy resources has to some extent helped to ensure sufficient power supply
for domestic market.
Statistics reveal a steady increase in connections and accessibility of electricity to consumers in
recent years. As of December, 2017 the total number of customers connected to electricity,
through the National Grid, were 2,105,734. It is also estimated that 67.5 % of the country
population already have access to electricity, even though issues around reliability remain a
challenge to be addressed.
Although generation mix might contribute a solution to access issues, efficient use of energy
resources will also need to be enhanced in order to ensure sustainable development. Use of non-
renewable energy resources such as oil and gas in one way or another will continue to contribute

82
to environmental pollution. Therefore, further additions of renewable resources, such as
geothermal, hydro, wind and solar in the generation mix will be helpful in minimizing
environmental pollution and contributing to building of a green economy.
Map 2. 3: National Grid System
Source: Ministry of Energy and Minerals

83
Key Message
Sustainable irrigation is the sole
solution to rain-fed agriculture
activities for optimal crop
production.
2.3. Land
2.3.1- Land Use
2.3.1.1: Potential Irrigated Area
Introduction
In order to harness irrigation potential in Tanzania,
the Government formulated the National Irrigation
Policy (NIP) in 2010 to provide direction for the
implementation of irrigation interventions for
optimal availability of land and water resources for
agricultural production and productivity.
Subsequently, the National Irrigation Act No. 5 of
2013 was enacted to guide development of the
sector. The Act among other issues provides for
establishment of the National Irrigation Commission
and development, operation and maintenance of irrigation and drainage systems and effective
implementation of the National Irrigation Policy. For effective implementation of irrigation
activities, the National Irrigation Regulations, 2015 were formulated as per requirement of
Section 74 of the National Irrigation Act 2013. The Regulations details the procedures for
formation, registration, conduct of irrigators’ organizations, formulation of irrigation projects
and construction and maintenance of irrigation works. The Comprehensive Guideline for
irrigation schemes development (CGL 2002) revised in 2016 was also prepared as a guide to
irrigation development. The CGL is divided into three parts; project formulation,
implementation, and operation and maintenance.
Irrigation development, while a key solution to agriculture productivity, can lead to negative
environmental impacts if not well planned. Such effects may include water quality, water
quantity, unsustainable resettlement, erosion, salinity problems and water related diseases.

84
As of 2017, Tanzania’s total irrigation development potential is pegged at 29.4 million ha, of
which 2.3 million ha are classified as high potential; 4.8 million ha as medium potential; and
22.3 million ha as low potential. However, out of this potential area, only 468,338 hectares
equivalent to 1.6 % of the potential irrigation area is under irrigation and contributes about 24
% of the national food requirement as of June 2017. The area under irrigation comprises of
2,418 irrigation schemes distributed across the country of which 124 are fully operational and
provided with some basic irrigation infrastructure. The remaining 2,294 irrigation schemes
comprises partially completed and deteriorated irrigation water abstraction infrastructures,
including traditional irrigation schemes characterized with temporary irrigation water
abstraction infrastructures and hence low water and crop productivity (Table 2.10).
Table 2.11 indicates that on average, the annual irrigation development is 19,620 ha. The
National Five Year Development Plan (FYDP II – 2016/17 – 2020/21) has set the target of
1,000,000 ha to be attained by 2025 whereas 700,000 ha are to be attained by 2020 through
Government and Development Partners support. The cumulative incremental area required in
order to achieve this target is 531,662 ha over five year’s period considing with the FYPD
time frames. With the current trend of developing an average area of 19,620 ha annually, it
will take much longer to meet the target of one million hectares. This requires huge amount
of funds, for example, it is estimated that a total of TZS 6.7 trillion is required within five (5)
year period to achieve the set target by year 2021. In this case concerted efforts are required
among stakeholders including involvement of the farmers themselves, the government,
private sector and development partners.
The major factors to be considered for accelerated irrigation development are:
i) Adequate and reliable resources on part of the government, e.g. funds and technical
personnel;
ii) Proper management of irrigation funds by Local Government Authorities;
iii) Planning of irrigation schemes to include full feasibility studies;
iv) Setting irrigation investment criteria to focus on few but potential areas;
v) National coordination for irrigation development among stakeholders;
vi) Proper supervision of irrigation construction;
vii) Adequate private sector involvement in irrigation development;

85
viii) Operationalization of the Irrigation Development Fund (IDF) with sustainable sources of
funds.
Table 2. 10: Potential Irrigation Areas S/N Item Quantity Remarks
1 Total potential area for irrigation (million ha) 29.4
2 High potential area for irrigation (million ha) 2.3 Availability of water, land, irrigators and
accessibility as criteria
3 Medium potential area for irrigation (million ha) 4.8 One of the criteria above is missing
4 Low potential area for irrigation (million ha) 22.3 More than one criteria mentioned above
are missing
5 Area under irrigation (ha) 468,338 Equivalent to 1.6 % of the total potential
area
6 Total number of irrigation schemes as of July
2017
2,418 Improved and unimproved irrigation
schemes
7 Improved and Operational irrigation schemes 124 Improved irrigation schemes
Source: National Irrigation Master Plan (2002) and progress reports
Table 2. 11: Cumulative Total Area Equipped with Irrigation Infrastructure, 2007/08 –
2016/17 Year Area Developed (ha) Incremental Area (ha)
2007/08 289,245 15,300
2008/09 310,745 21,500
2009/10 331,490 20,745
2010/11 345,690 14,200
2011/12 363,514 8,522
2012/13 363,514 9,302
2013/14 450,392 86,878
2014/15 461,326 10,934
2015/16 461,326 -
2016/17 468,338 7,012
Source: NIRC annual progress reports 2017
“-” Data Not available
2.3.2 - Use of Forest Land
2.3.2.1: Forest Area by Forest Designated Functions
According to NAFORMA report (2015), forests resources are categorized by type of vegetation
cover, usage and legal status. With regard to type of vegetation cover, 93 % of the total forest
area was covered by woodlands. This was followed by Lowland forests (3.4 %), Humid Montane
forest (2.0 %), Plantation Forest (1.2 %) and Mangroves (0.3 %), which are very important for

86
sustainance of ecosystem. In terms of usage, the productive forest area comprised 60.3 % of the
total forest area while 39.7 % of the forest area was accounted for by protected forest areas most
of which are catchment areas and natural reserves. Production forest is an area of land covered
by forest, reserved or used principally for purpose of sustainable production of timber and other
forest produce while protection forest is an area of land covered by forest, reserved or used
principally for purpose of protection of watersheds, soil, and the protection of biodiversity.
Furthermore, as concerns legal status about 23.3 % of the forest area is under wildlife-protected
areas.
There are 455 National Forest Reserves that are managed by TFS (GN. 269/2010), with a total
area of 16,610,581 hectares. These forests include 12 Nature Forest Reserves; areas under
mangrove forests (115,000 ha), 9 declared bee reserves, 23 forest plantations and areas of forests
on general lands covering approximately 2,405,000 ha. It is therefore, important to maintain
these forest resources sustainably by ensuring that resources assessments are conducted in all
forests and management plans are prepared and followed accordingly for the benefit of present
and future generations (TFS 2014), Table 2.12.
Table 2. 12: Forest Areas by Designated Functions, 2013 - 2017 Forest Designated
Function Unit of
Measure 2013 2014 2015 2016 2017
(i) Production
forest
(a) Forest
plantations Area
(Ha) 189,741.7 192,748.0 196,503.0 201,147.0 206,074.0
(b) Natural forests Area
(Ha) 28,814,258.3 28,811,252.0 28,807,497.0 28,802,853.0 28,797,926.0
(ii) Protected
forest Area
(Ha) 19,096,000.0 19,096,000.0 19,096,000.0 19,096,000.0
Source: TFS
In the endeavour to bridge the gap between demand and supply of wood raw materials in the
country, TFS has continued to secure new areas for establishment of forest plantations including
changing status of degraded forest reserves for the same and acquisition of new areas. Six new
plantations namely, Morogoro (Morogoro), North Ruvu (Pwani), Korogwe (Tanga), Chato
(Geita), Mpepo (Ruvuma), and Iyondo Mswima (Mbeya) were established. A total of 121,922 ha

87
was secured for plantation establishment of the new Chato-Biharamulo plantation, and work has
since commenced by conducting awareness meetings, mapping and land compartmentation in the
planting area. Acquisition of 5,000 ha in TFS Northern Zone has also commenced by conducting
village meetings in five villages targeting at acquiring 2,000 ha from Mkinga district and 3,000
ha from Pangani district (Table 2.13).
Table 2. 13: New Forest Plantations Established by TFS Between 2014 and 2017 S/N Plantation
name
Year
established
Total area
(ha)
Area planted
(ha) to date
Remarks
1 Morogoro 2014/15 12,950 37 Forest reserve area converted to
plantation
2 North Ruvu 2014/15 20,000 523 Forest reserve area converted to
plantation
3 Chato -
Biharamulo
2017/18 50,000 440 Part of FR converted to plantation.
4 Mpepo 2017/18 2,017.21 395 Newly acquired area.
5 IyondoMswima 2017/18 12,000 200 Forest reserve area converted to
plantation.
6 Korogwe 2014/15 10,805 220 Degraded Forest reserve area converted
to plantation
7 Pagale 2017/18 12,950 - Degraded Forest reserve area converted
to plantation. It is under management of
Mtibwa forest plantation
8 Buhigwe 2016/17 1,200 60 Newly acquired area and planting to start
this FY
Total 121,922.21 1,875
Source: TFS Annual Implementation Reports
“-” Data Not available
2.3.2.2: Area Deforested
Deforestation can be defined as the conversion of forests to other land uses. In Tanzania
deforestation is driven by expansion of agricultural activities, including shifting cultivation,
wildfires, lack of clearly defined boundaries, illegal logging, and livestock grazing. Other
contributing factors are unsustainable charcoal production for domestic and industrial use, lack
of systematic management, and introduction of alien and invasive species. These driving forces
are depreciating the country’s natural stock of forest ecosystem assets. Thus, the benefits of
forests in terms of regulating water run-off, reducing soil erosion, capturing and sequestering
carbon are impared. Deforestation rate is estimated at 372,000 ha per annum between 1995 and
2010 (NAFORMA, 2015), Table 1.16.

88
2.3.2.3: Area Reforested
Reforestation is known as replanting of the previously planted trees once harvested. Table 2.14
shows that, the total area reforested between 2010 and 2017 was 37,177.7 ha with the largest
area of 6,897 ha having been replanted in 2010. In some plantations the planting of trees is
mixed with food crops such as maize, sunflower, carrots and cabbages the common terminology
for this is Taungya farming which contributes a lot to food security to communities living
adjacent to forest plantations.
Table 2. 14: Trend of Reforestation in TFS forest Plantations, 2010 - 2017 Year Area Reforested (Replanted) in Ha
2010 6,897.0
2011 5,383.0
2012 4,653.3
2013 4,219.0
2014 4,378.4
2015 2,987.0
2016 3,732.0
2017 4,927.0
Total 37,177.7
Source: TFS
2.3.2.4: Area afforested
Afforestation is an establishment of forest through planting and/or deliberate seeding on land
that, until then was not classified as forest. Plantation forest is a forest area that has been
established through afforestation or reforestation for commercial purposes. Afforestation is
commonly used when trees are planted in areas where there is either grassland or forest
degradation. The following are the major objectives of establishing forest plantations in
Tanzania:
(i) To produce timber and other forest products for domestic consumption, industrial
requirements and exports;
(ii) To complement and reduce pressure on the demand for timber and wood products
from natural forests.

89
Key Message
The total land area under forest
plantations stood at 308,442 ha
in 2017, of which Sao Hill forest
has the largest land area (45.2%)
(iii) To contribute to climate amelioration and environmental protection;
(iv) To provide employment directly and indirectly, and,
(v) As a source of government revenues.
There is a substantial increase in the number and area of
forest plantations contributed by establishment of new
forest plantations and continued planting in extension
areas annually as shown in Table 2.15 and Table 2.16.
Overall, the total land area under forest plantations
stood at 308,442 ha in 2017, of which Sao Hill has the
largest land area (45.2 %), followed by North Ruvu,
occupying 10.4%. tree planting by LGAs, village lands,
privates sector and other out growers due to difficulties
in coordinating these stakeholders.
In line with the strategies of increasing plantation areas, TFS has been collaborating with
Tanzania Forestry Research Institute (TAFORI) and Forest Development Trust (FDT) by
shifting from planting normal exotic tree species to fast growing species, which are produced
from improved seeds and clonal materials for various end uses such as Eucalyptus. The
advantages of using Eucalyptus clones are:
(i) They are fast growing thus can help bridge the gap between demand and supply for
wood materials;
(ii) Have diversified use as they can be used for saw logs, poles and pulp making;
(iii) They are self pruning thus reduces the tending cost;
(iv) Low establishment costs because once planted no weeding is needed;
(v) Seldom catches fire because the canopy closes rapidly and hinders undergrowth.

90
Table 2. 15: Areas Under Forest Plantations, 2017 S/N Name of Forest
Plantation
Location Planted
Area (Ha)
Expansion
Area (Ha)
Catchment
Forest Area
(Ha)
Total Area
(Ha)
1 Buhindi Mwanza 5,850.0 5,700.0 10,880.0 22,430.0
2 Kawetire Mbeya 2,607.0 1,135.0 1,306.0 5,048.0
3 Kiwira Mbeya 2,784.0 0.0 0.0 2,784.0
4 Korogwe Tanga 217.0 5,000.0 5,229.0 10,446.0
5 Longuza Tanga 1,992.0 400.0 440.0 2,832.0
6 Mbizi Rukwa 1,227.0 1,793.0 20,427.0 23,447.0
7 Meru/Usa Arusha 5,873.0 466.0 0.0 6,339.0
8 Mtibwa Morogoro 2,104.0 170.0 895.0 3,169.0
9 North Kilimanjaro Kilimanjaro 5,099.0 462.0 505.0 6,066.0
10 North Ruvu Pwani 323.0 19,607.0 12,000.0 31,930.0
11 Rondo Lindi 1,169.0 830.0 0.0 1,999.0
12 Rubare Kagera 2,613.0 1,842.0 2,924.0 7,379.0
13 Rubya Mwanza 2,062.0 0.0 122.0 2,184.0
14 Sao Hill Iringa 57,485.0 31,933.0 49,900.0 139,318.0
15 Shume Tanga 4,085.0 0.0 84.0 4,169.0
16 Ukaguru Morogoro 1,959.0 400.0 0.0 2,359.0
17 Morogoro Morogoro 30.0 12,920.0 0.0 12,950.0
18 West Kilimanjaro Kilimanjaro 3,410.0 600.0 2,583.0 6,593.0
19 Wino-Ifinga Ruvuma 2,838.0 14,162.0 0.0 17,000.0
Total 103,727.0 97,420.0 107,295.0 308,442.0
Source: TFS
Table 2. 16: Use of Forest Land, 2013 - 2017
Unit of
measure 2013 2014 2015 2016 2017
Area deforested Area (Ha) 372,000.0 372,000.0 372,000.0 372,000.0 372,000.0
Area reforested Area (Ha) 4,653.3 4,219.0 4,378.4 2,987.0 3,732.0
Area afforested Area (Ha) 3,006.0 3,755.0 4,644.0 4,825.0 4,927.0
Natural growth Area (Ha) 47,728,000.0 47,728,000.0 47,728,000.0 47,728,000.0 47,728,000.0
Total
48,100,000 48,100,000 48,100,000 48,100,000 48,100,000
Sourc: TFS
Note1: Sum of individual observations in the table do not necesarily add up to totals

91
Note2- It is assumed that the deforestation rate in Tanzania has remained at 372,000 ha per year
(NAFORMA, 2015), while the statistics for reforested areas and afforested areas were captured from
Central Government forests whose area is managed by TFS only.
2.3.2.5: Extension Areas in Forest Plantations
Extension areas in forest plantations are the areas which were gazetted for the purpose of tree
planting but for some reasons, these areas were not planted. Since the establishment of TFS,
about 24,779.5 ha of trees were planted (Table 2.17).
Table 2. 17: Extent of Planting in Extension Areas in Forest Plantations, 2011 - 2017 Year Area (ha)
2011 949.2
2012 2,673.0
2013 3,006.3
2014 3,755.0
2015 4,644.0
2016 4,825.0
2017 4,927.0
Total 24,779.5
Source: TFS
2.3.2.6: Forest Coverage by Region
Table 2.18 shows regional areas covered by forests. Tanzania has total forest coverage area of
48,241,299 ha. Katavi region has the largest forest coverage of 3,591,507 ha, equivalent to 82.7
% of the total regional area, followed by Lindi 5,238,431ha (77.2 %) and Mbeya region with a
forest coverage of 4,311,112 (70.6 %). Mwanza region has the least forest coverage area of
156,193 ha (14.3 %).

92
Table 2. 18: Forest Coverage (Ha) by Regions in Tanzania Mainland, 2015
Region
Total Regional
Area(Ha) Forest Coverage (Ha)
Forest and Woodland
(Percent of Total Area)
Dar es Salaam 150,809 49,013 32.5
Morogoro 6,886,883 4,380,058 63.6
Pwani 3,196,403 1,876,289 58.7
Lindi 6,785,532 5,238,431 77.2
Mtwara 1,794,853 743,069 41.4
Ruvuma 6,338,030 4,728,170 74.6
Rukwa 2,167,494 893,008 41.2
Njombe 2,194,407 811,931 37.0
Iringa 3,453,694 1,799,375 52.1
Mbeya 6,106,391 4,311,112 70.6
Manyara 4,469,962 2,033,833 45.5
Dodoma 4,183,192 1,372,087 32.8
Singida 4,856,938 2,219,621 45.7
Mara 2,189,924 343,818 15.7
Simiyu 2,345,074 422,113 18.0
Mwanza 1,092,257 156,193 14.3
Kagera 2,527,312 1,372,330 54.3
Geita 2,098,555 1,009,405 48.1
Tabora 7,595,994 4,648,748 61.2
Shinyanga 1,853,931 317,022 17.1
Kigoma 3,819,825 2,307,174 60.4
Katavi 4,342,814 3,591,507 82.7
Kilimanjaro 1,250,496 607,741 48.6
Arusha 3,822,918 1,662,969 43.5
Tanga 2,810,612 1,346,283 47.9
Total/Average 88,334,300 48,241,299 54.6
Source: NAFOMA, 2015
2.5. Biological Resources
2.5.1- Timber Resources
Forests provide a range of resources both primary and derived, such as timber and derivative
products like paper, charcoal and many others. Other benefits also arise from forest resources
and are also important for the economy, though they may not always be quantifiable or priced,
except in shadow prices. These include such aspects as the ability of forest soils to purify water
for domestic and industrial use, regulation of runoff to support hydroelectric power generation
and sequester carbon.
A study commissioned by the Tanzania Revenue Authority (TRA) in 2012 to undertake value
chain analysis of the forestry sector found that, the forestry sector’s contribution to GDP is about
4 %. The study however also concluded that the available data was too incomplete to present a

93
formal figure of the forestry sector’s GDP. Instead Industry Output Estimates for the main
forestry sectors could be used to calculate reasonable estimates. These figures do not take
account of subsistence production in forestry, such as firewood for domestic use. The estimated
forestry contribution to GDP of 4 %, used this approach, and was still greater than the
contributions from Mining and Quarrying (3.3 %); Electricity and Gas (1.8 %); and
Communications (2.2 %) as shown in Table 2.19.
Table 2. 19: Estimated Contribution of Forestry Sector to GDP in Tanzania, 2010 Forest products Total Output (TZS Billion) as
2010 GDP
Total Output (TZS Billion) as %
of 2010 GDP
Charcoal 867 2.89
Natural forest timber 44 0.15
Plantation timber 290 0.97
Tobacco fuel wood 3.7 0.01
Total 1,202 4.01
Source: TRA by JUHUDI 2012
Timber resources can be from natural forests or from plantation forests. Natural Forests are
forest areas that occur naturally while plantation forests are forest areas that have been
established through afforestation or reforestation for commercial purposes. Harvesting of timber
resources in natural forests is approved by Districts Harvesting Committees, which are headed by
District Commissioners. In forest plantations, customers are allocated volumes to harvest trees
for production of various timber resources. Haversting quotas allocated from 2014/15 to 2017/18
were 1,712,262 M3 for timber, 5,968,157 bags of charcoal and 14,210 pieces of poles. In
addition, 804,033 M3 of logs and 4,500 M
3 of firewoods were allocated for the first half of fiscal
year 2017/18 (July - December). TFS stations in both natural and plantation forests carry
supervision of harvesting, logging and revenue collection from sales of standing trees.
Harvesting Committees conducted various meetings to allocate harvesting of timber, charcoal
and poles as detailed in Table 2.20.

94
Table 2. 20: Harvesting Quota Allocated by District Harvesting Committees, 2014/15 –
2017/18 Year Number
of District
Timber
(M3)
Charcoal
(bags)
Poles
(pieces)
Logs (M3) Firewood
(M3)
Approved
dealers
2014/15 41 637,469 2,430,978 3,000 - - -
2015/16 37 246,878 1,276,894 3,000 - - -
2016/17 22 333,215 1,491,001 3,610 - - -
2017/18 July-
December 32 494,700 769,284 4,600 804,033 4,500 500
Total 132 1,712,262 5,968,157 14,210 804,033 4,500 500
Source: TFS
“-” Data not available
2.5.1.1: Forest Resources Management
Harvesting of forest resources can be from fellings, removals and felling residues. Harvesting of
trees for timber products is carried either manually or mechanically. Harvesting in forest
plantations is done by individuals/companies with harvesting permits. Collection of logs in some
compartments is done by machines/plants that move randomly in the harvested area causing soil
compaction which is more severe during the rainy season and can cause poor performance of
trees. Table 2.21 shows that about 6,917,657.5 M3 of timber resources were harvested using the
three outlined harvesting methods from 2013 to 2017.
When trees are planted they are planted with specific management objectives towards the end of
a specified maturity time which is called rotation age. Rotation age can be either biological or
economic. The biological rotation age is a specific time when the trees attain an age where there
is no more growth while economic rotation age is a time when the planted trees can be harvested
at break even point for the grower in terms of input and output costs. Trees from natural forest
take longer to mature compared to trees from forest plantations.
For example, for a natural forest trees the rotation age is more than 50 years and 25 years for soft
wood species. The rotation age for hard wood species varies with respect to productivity and
market demand (AFF, 2011). Table 2.21 indicates that, about 1,976,635.0 M3 of timber resources
were harvested by felling method from 2013 to 2014. Harvesting of timber resources through
fellings is known as clear felling where all the trees on a certain piece of land are cleared.

95
Harvesting of timber resources from removals is known as thinning or selective harvesting which
is carried out for management purposes. In this process, the weaker and crooked trees are
removed to give room to stronger trees to attain reasonable heights and widths for quality end
products. Without reliable data on the extent of felling harvesting method for 2015 to 2017,
removal or thinning seems to have been the dominant method, account for about 3,344,640.0 M3
(48.3 %) of total harvests from all methods from 2015 to 2017.
After harvesting of trees through either fellings or removals, it is technically estimated that 30 %
of the trees remain as felling residues. These residues are used for various purposes in wood
industries. They are used for production of match boxes, tooth picks, pallets, furniture, paper and
charcoal briquettes. Table 2.21 indicate the volume of timber resources which were harvested
from TFS forests between 2013 and 2017.
Table 2. 21: The Volume (M3) of Timber Resources Harvested from TFS Forests, 2013 -
2017 Method of
Harvesting 2013 2014 2015 2016 2017 Total
1. Fellings 976,890.0 999,745.0 - - - 1,976,635.0
2. Removals 77,306.0 195,400.0 1,887,934.0 252,400.0 931,600.0 3,344,640.0
3. Felling
residues 316,258.8 358,543.5 566,380.2 75,720.0 279,480.0 1,596,382.5
Total 1,370,454.8 1,553,688.5 2,454,314.2 328,120.0 1,211,080.0 6,917,657.5
Source: TFS
“-” Data not available
2.5.1.2: Forest Production by Type of Product
Apart from forests being used for environmental protection and conservation, they are also used
as sources of income for the Government. Revenues are accrued from sales of forest and bee
products and services from production forests (natural forests and commercial tree plantations).
Sales of standing trees particularly from forest plantations form the main source of revenue.
Types of forest and bee products and services including their sources and markets are
summarized in Table 2.22.

96
Table 2. 22: Types of Forest, Bees Products and Services
Types of Products/
Services Sources Markets
Sources of
Complementary of
Products and Services
Standing trees for logs,
pulp, veneer and poles
Forest plantations, Natural
forests including
Mangrove forests, Forest
Reserves and forests in
general lands
Sawmills, pulp & paper,
chip &fibre board mills,
Wood preservation plants,
construction industry,
furniture industry, foreign
market
Local Government forests,
Village land forests,
Private forests, Woodlots,
Steel & other substitutes
industry, import
Logs and sawn timbers Logging and sawmilling
Sawmills, pulp & paper,
chip &fibre board mills,
construction industry,
furniture industry, foreign
market
Wood processing
industries and other
substitute industries
Wood fuel (charcoal and
firewood)
Forest Plantations, Natural
forests and General lands
Households,
Manufacturing Industry,
Institutions, hotels and
restaurants
Electricity, Generators,
Gas supplies, coal mines,
kerosene, Solar, Biogas,
Wind
Ecotourism
Forest plantations,
Catchment forests, Nature
Reserves and Mangroves
Domestic and foreign
tourists
Private forests, local
government forests and
village land forests
Research sites and materials
Forest plantations,
Catchment forests and
Nature Reserves
Individual researchers,
Academic institutions,
research organizations and
Training Institutions
Private forests, local
government and village
land forests.
Telecommunication n tower
sites
Forest plantations,
Catchment forests and
Nature Reserves
Telecommunication
industry
Land sat receivers; Private
forests, local government
and village land forests
Mining and prospecting
sites
Forest plantations, Natural
Forests Mining companies
Private forests, local
government and village
forest reserves
Medicinal values
Forest plantations and
Natural Forests
Pharmaceutical industry,
Traditional healers
Synthetic
pharmaceuticals,
acupuncture
Honey, bees wax and bee
colonies
Bee reserves, Apiaries in
plantations and natural
forests and beekeeping
production centres
Foreign and domestic
markets; Industry
(pharmaceutical
inclusive), Traditional
healers, Households&
Hotels
Private bee reserves,
apiaries in local
government and village
land forests, Private
forests/farms
Others (bark- cinchona,
mimosa) essential oils,
palm leaves, gums, resins,
raphia and bamboo
Plantations and natural
forests Industries and households
Private forest, Local
government and village
lands forests
Source: TFS

97
2.5.1.3: Imports and Exports of Forest Products
The government of Tanzania has established protocols for licensing, issuance of permits and
registration for harvesting, trade and transportation of forest and bee products. The aim of the
protocols is to ensure compliance on the conditions and terms on possession and utilization of
forests and bee resources. Figure 2.1 shows the trend of import and export permits issued for
forest products between 2015 and 2017. The number of import permits issued increased from 24
in 2015 to 44 in 2017.
Through TFS, Tanzania is piloting identification and empowerment of primary and secondary
wood based industries. Through this initiative, the Government aims to promote internal wood
industry’s productive capacity, enhance contribution of forest sector to GDP and employment. It
is also revealed that, the number of export permits for forest products issued each year is more
than twice the number of imports.
Figure 2. 1: Number of Import and Export Permits for Forest Products, 2015 - 2017
Source: TFS Annual Implementation Reports

98
2.5.1.5: Export Quantities of Forest Products
Timber inspection and grading for export is usually carried out at ports of exit in Dar es Salaam
Port, Namanga, Holili, Horohoro, Sirari, Mtukula, Tunduma, Kasumulo, Mtambaswala, Kigoma
and Mtwara.
Table 2.23 shows export quantities of forest products and values. Data on export for 2014/15
were captured from TFS HQ office in Dar es Salaam only. The trend of quantities and values for
export of forest products shows an increase in year 2014/15 but a decline in the subsequent year.
Exports of forest products provide a source of foreign exchange for the country. Table 2.23
shows exports of wood and non-wood forest products. TFS is strategizing on commercial
beekeeping and diversification of forest products to boost the contribution of forest products to
the National economy. For example, TFS has started diversification of forest products by tapping
resin from soft wood trees specifically pines, which will be exported to earn foreign exchange.
Resin is a non-wood product harvested from living trees. Pine resin is a fluid (organic
substance) that is secreted from pine trees. Resins are used in the manufacture of a wide range of
products including paints and lacquers, rubber, soaps, linoleum, essential oils, furniture polishes
and pesticides. Recently, ATY Tanzania International LTD Company from China showed
interest on harvesting resin from Sao Hill Forest Plantation. After meeting all the requirements in
accordance with Government Notice (GN), the company was granted permits to harvest resin.
As regards bee products, tTanzania is currently exporting honey and bee wax only. However,
other bee products such as pollen, propolis and royal jelly can be exported as well. TFS is
working towards creation of a more conducive environment for the sector’s activities to thrive as
part of its contributions towards achievement of the Tanzania Vision of becoming a middle
income industrialized country by 2025. The aim for the sector is to ensure that most of the forest
products are processed within the country before being exported.

`
99
Table 2. 23: Export Quantities of Forest Products and Values
Product
2014/2015 2015/2016 2016/2017 Total
Quantity
Value (USD) Quantity
Value (USD) Quantity
Value (USD) Quantity
Value (USD)
Volume
(CBM)
Weight
(KGS)
Volume
(CBM)
Weight
(KGS)
Volume
(CBM)
Weight
(KGS)
Volume
(CBM)
Weight
(KGS)
Hard woods (other) 8,995 - 3,275,245 280,789 - 16,459,941 9,452 - 2,999,333 299,236 - 22,734,519
Teak 67,609 - 5,773,028 - - 717,340 - 8,236,140 784,949 - 14,009,168
Mpingo clarinets 76 - 456,880 73,004 - 264,296 252 - 1,202,131 73,332 - 1,923,307
Wattle bark - 2,056,612 3,885,721 - 690,965 2,475,867 - 2,423,390 3,744,952 - 5,170,967 10,106,540
Sandal wood oil - 7,700 2,428,540 - - 2,416,206 - 75,750 1,456,934 - 83,450 6,301,680
Sandal wood spent dust - 158,124 86,950 18,745 - - - - - 18,745 158,124 86,950
Handcraft - 2,592 89,492 5,336 157,634 - 9,467 105,801 - 17,395 352,927
Veneer 1,586 - 41,780 - - - 2,781 - 247,200 4,367 - 288,980
Gum arabica - 300,003 244,620 - - - - 202,000 181,430 - 502,003 426,050
Poles 512 - 72,459 74 - 12,268 - - - 585 - 84,727
Wild fruits - 51,300 - - - - - - - - 51,300 -
Carvings - 16,537 81,489 - 5,004 47,395 - 9,486 28,345 - 31,027 157,229
Furniture - 489 17,151 - 525 23,163 - 14,199 22,495 - 15,213 62,809
Baobab - 15,000 30,000 - 1,007 116,365 - 29,864 40,527 - 45,871 186,892
Medicinal - - - - - - - 84,834 1,474 - 84,834 1,474
Withies - - - - - - 100 - 278,700 100 - 278,700
Cinchona - - - - 19,720 27,411 - 2 15 - 19,722 27,426
Cinnamon - - - - - - - 10 - - 10 -
Wooden sample - - - - - - 0 - 405 0 - 405
Softwood - - - - - - 149 - 33,253 149 - 33,253
Raffia - - - - 1,480 97,536 - - - - 1,480 97,536
Honey - 152,600 574,966 - 259,860 617,992 - 240,780 580,682 - 829,240 2,289,508
Bee wax - 220,220 1,923,049 - 251,930 2,228,637 - 203,850 3,091,762 - 1,329,000 13,421,292
Total 78,778 2,981,177 18,981,370 372,612 1,235,827 24,944,711 730,074 3,293,632 22,251,579 1,181,463 8,339,636 72,871,372
Source: TFS
“-” Data is not available

`
100
2.5.1.6: Fertilizer Demand in Tanzania
Fertilizer demand (Table 2.24) reflects amount of fertiliser required for agricultural production.
In the table below, the demands for Urea fertilisers (41.1 %) and DAP (16.1 %) were higher than
other fertilizers because they were mostly supplied by the government to farmers during the
National Agricultural Inputs Voucher Scheme (NAIVS). Through that scheme, farmers who
were selected to participate in the scheme were provided with vouchers to get the required
inputs, mainly seeds and fertilizers.
Table 2. 24: Fertilizer Demand (Tonnes ) in Tanzania, 2011/12-2016/17 Type of Fertilizer 2011/12 2012/13 2013/14 2014/15 2016/17
Sulphate of Ammonia (SA) 11,690 8,771 8,771 8,771 8,771
Calcium Ammonium Nitrate (CAN) 23,400 74,612 74,612 74,612 74,612
UREA 204,640 189,706 189,706 189,706 189,706
Tripple Supper Phosphate (TSP) 10,000 24,258 24,258 24,258 24,258
Diammonium Phosphate (DAP) 50,100 80,780 80,780 80,780 80,780
Muriate of Potash (MOP)/Others 1,670 2,700 2,700 2,700 2,700
NPK 6:20:18/10:18:24 40,439 29,568 29,568 29,568 29,568
NPK 25:5:5 7,482 4,062 4,062 4,062 4,062
NPK 4:17:15 - - - - -
NPK 20:10:10 10,579 15,234 15,234 15,234 15,234
MRP 25,000 55,309 55,309 55,309 55,309
Total 385,000 485,000 485,000 485,000 485,000
Source: Agricultural Inputs Section, Ministry of Agriculture
2.5.1.7: Fertilizer Availability
Fertilizer availability increased from 275,220 tonnes in 2008/09 to 302,453 tonnes in 2011/2012,
and then later decreased to 289,795 tonnes in 2012/13, due to due to subsidisation through
implementation of NAIVS. There are important variations in compositions of fertilisers available
in each year and, in general, for many types of fertilisers, the supply did not steadily increase
throughought, except for other fertilizers category that increased from 3,703 tonnes in 2008/09 to
23,701 tonnes in 2012/13. There was noticeable decrease in availability of NPK 17-17-17
fertilizers from 3,070 tonnes in 2008/09 to just 553 tonnes in 2012/13 (Table 2.25).

`
101
Table 2. 25: Fertilizer Availability (Tonnes) in Tanzania - 2008/09-2012/13
Type of fertilizer 2008/09 2009/10 2010/11 2011/12 2012/13
S/A 6,157 15,346 4,002 10,314 7,946
CAN 31,933 26,940 35,898 32,020 24,632
UREA 91,029 104,427 90,491 81,664 92,982
TSP 1,427 769 1,962 1,436 1,821
DAP 30,121 47,858 42,909 69,918 33,318
NPK 20-10-10 11,494 12,030 7,171 9,540 6,041
NPK 25-5-5 9,033 9,257 238 4,658 -
NPK 6-20-18/10-
18-24
24,593 27,340 51,005 35,198 32,917
NPK 17-17-17 3,070 13,432 7,258 4,767 553
MOP/SOP 4,160 2,192 3,952 3,297 2,236
MRP 58,500 39,564 30,806 25,423 63,648
OTHER 3,703 2,844 3,424 24,218 23,701
Total 275,220 301,999 279,116 302,453 289,795
Source: Agricultural Inputs Section, Ministry of Agriculture
2.5.1.8: Fertilizer Utilisation
Utilisation of fertilizers, as seen in the Table 2.26 increased from 251,715 tonnes in 2011/12 to
994,898 tons in 2015/16. This increase is associated with government efforts through the
implemention of NAIVS. In 2015/16, NPK 17-17-17 was highly used with 513,030 tonnes ,
followed by MRP (259,627 tonnes ) and UREA (114,105 tonnes ).
Table 2. 26: Fertilizer Utilization (Tonnes) in Tanzania from 2011/12-2015/16 Type of fertilizer 2011/12 2012/13 2013/14 2014/2015 2015/2016
SA 4,126 3,178 5,957 6,300 6,643
CAN 12,808 9,853 9,367 8,260 7,153
UREA 69,000 65,855 100,455 107,280 114,105
TSP 1,436 728 - - -
DAP 69,918 21,000 35,911 38,824 41,736
NPK 20-10-10 9,540 2,416 6,996 7,488 8,791
NPK 25-5-5 4,658 - 1,812 1,531 1,250
NPK 6-20-18/10-18-24 35,198 32,917 30,567 32,129 33,692
NP K 4-17-15 - - - - -
NP K 17-17-17 4,000 553 80,783 197,490 513,030
MRP 20,338 64,000 190,797 222,689 259,627
MOP 1,319 894 233 324 448
Other 19,374 9,480 7,143 8,229 8,423
Total 251,715 210,874 470,021 630,544 994,898

`
102
Key Message
Fertilizer use is very important for
increasing crop production as well
as food security.
2.5.1.9: Policy and Environmental Related Issues
The government emphasizes on the use of inorganic
fertilizers byfarmers for increased crop production.
From 2008/09 the government, through the Ministry of
Agriculture, provided subsidies to farmers through the
NAIVS in some regions of Tanzania, especially those
having high potential for production of cereals like
maize and paddy. The subsidy was provided for
inorganic fertilizers and improved seeds to some
farmers who were selected to get the subsidy. Each
selected farmer got inputs (fertilizers and seeds) which enabled him/her to cultivate one acre of
land i.e. one acre package.
One of the objectives of NAIVS was to create awareness on the use of inorganic fertilizers and to
increase the use of fertilizers by the farmers, because most of the farmers have a mentality that
inorganic fertilizers destroy the soil. In order to increase availability of inorganic fertilizers to
farmers all over the country, in the fiscal year 2017/18, the government decided that the
fertilizers should be procured in bulk (bulky procurement) so as to enable most of the farmers to
afford buying fertilizers at affordable prices fixed by the government and use them on their farms
to increase food production as well as increasing food security and reduce poverty.
When inorganic fertilizers are washed off by rainfall or during irrigation and mixed with water
for domestic consumption like river water, lake water or other water bodies, they contaminate the
water and may bring bad effects to human beings, animals and other living organisms.
Fertilizers are chemical substances used to add nutrients to the soil to promote soil fertility and
increase plant growth. However, excessive use of chemical fertilizers in agriculture results in a
large number of environmental problems because some fertilizers contain heavy metals (e.g.
cadmium and chromium). Later, such heavy metals are constituted in plants and some of them
result in accumulation of inorganic pollutants.

`
103
NEGATIVE EFFECTS OF FERTILIZERS ON THE ENVIRONMENT
Water Pollution
Environmentalists are aware of harmful effects of nitrogenous fertilizers on the environment.
Nitrogen in agricultural areas reaches the water environment by three ways: Drainage, leaching
and flow. Nitrate leaching in particular is linked to agricultural practices especially after fertilizer
application and during cultivation. Nitrate accumulated in the soil is leached in varying amounts
depending on conditions. In the soil, fertilizers are converted into nitrate through nitrification by
microorganisms. Due to having negative charges, nitrate can reach groundwater. Even in ideal
conditions, plants use 50 % of nitrogenous fertilizers applied to soil; 2 to 20 % is lost through
evaporation; 15 to 25 % reacts with organic compounds in the clay soil; and the remaining 2 to
10 % interfere with surface and groundwater.
Soil Pollution
According to research findings, the effects of chemical fertilizers on the soil are not immediately
obvious. Because soils have strong buffering power due to their components, repeated inorganic
fertilizer application without additional organic amendments enhances activities of soil
microorganisms for short durations, increasing mineralization of existing soil organic matter and
depletion of carbon out of soil. Loss of soil organic carbon (humus) reduces the capacity of soil
to maintain its natural nutrient reserves (fertility), deteriorates soil structure, weakens its
resistance to erosion, reduces vegetation/biomass cover and consequently leads to land
degradation.
Excessive application of fertilizer is not a problem in Tanzanian smallholder farmer crop
production, but balanced nutrient supply is a problem. Application of nitrogen bearing fertilizer
like urea without phosphorus or potassium, as practised by some farmers, leads to dangerous
accumulation of nitrate in the soil. Nitrogen supplied as fertilizer cannot be fully utilized by the
plant as absence of phosphorus becomes the limiting factor leading to its accumulation and
pollution of the environment (Ministry of Agriculture, FAO, 2006).

`
104
Air Pollution
Fertilizers are known to be among the most important inputs in agricultural production. When
they are applied inadequately, there are losses of productivity and quality and on the other hand,
when too much fertiliser is applied, it causes air pollution by nitrogen oxides emissions. This
gas, combined with others gases, contributes to the depletion of the ozone layer.
Table 2. 27: Summary of Environmental and Social Impacts of Inorganic Fertilizers Environmental and Social Components Impacts
Physical
environmental
Soils
Water Resources
Air Quality
Salinization of soils
- Contamination of groundwater
- Pollution of surface water
Heavy metals
- Dust
- Air pollution
Biological
Environmental
Fauna and flora Promoting weed growth
- Loss of natural plant and
wildlife habitats and species
- Increased pest problems
Social
Environmental
Aesthetic & landscape
Historical/Cultural Sites. Human health
Human communities
Loss of natural recreational,
historical and archaeological
sites
- Health risks
- Increased use of labour saving
technologies
2.5.2- Aquatic Resources
2.5.2.1: Fish Capture Production
The fishery sector plays a significant role in development by contributing to the economic and
social wellbeing of the country. Among the contributions of the sector are supply of animal
protein, income generation, employment and recreation, tourism and food security all of which
are crucial for the attainment of the FYDP II and SDGs.
During 2016 the sector supported a total of 203,529 people as fishers deriving their livelihood
from the various fishery resources in the country. Also the sector supported more than 4 million
people directly and indirectly, working as fishers, traders, processors and suppliers (Fisheries
annual statistics report, 2013). The statisticsfor the sector further indicate that, total fish
production increased from 327,845 metric tonnes in 2007 to 375,158 metric tonnes in 2013, even

`
105
though it later decreased to 362,595 metric tonnes in 2016. The poor performance in 2016 is
linked to decrease in fish production in freshwaters, from 364,602 metric tonnes in 2013 to
308,772 metric tonnes in 2016.
The Tanzanian fishery is mainly artisanal. The artisanal fishery accounts for almost all the inland
and marine water catches and consequently it is currently the most important fishery in the
country. There are, however, also a few commercial/industrial vessels and long liners owned by
Distant Water Fishing Nations (DWFN) which operate under license in Tanzanian Economic
Exclusive Zone (EEZ) targeting Tuna and Tuna like species.
Tanzanian fishery is dominated by multi-species, however, only a few species dominate landings
in terms of volume. On average the quantities of fish which is caught annually is about 350,796
metric tonnes (Table 2.28). The most notable species are; Nile perch (Lates niloticus), Tilapia
(Oreochromis niloticus) and Lake sardine locally known as “dagaa” Rastrineobola argentea
from Lake Victoria. Species from Lake Tanganyika fisheries includes lake sardines (dagaa),
Stolothrissa tanganicae and Limnothrissa miodon together with their predators the L. Stappersii,
L. Marie and L. microlepis. Lake Nyasa too has good stocks of various species of Tilapia,
Haplochromis spp and Lake sardines Engraulicypris sardella. (Fisheries annual statistics report,
2013).
Marine fisheries resources also contribute to the total annual catch, the main commercial marine
species are sardine and anchovy, which together forms 30 - 50 % of the total fish landing. Other
fish species being landed include: Lethrinus rhodopterus (changu), Carrotomus spinidens
(pono), Caranx cynodon (kolekole), Siganus oramin (Tasi), Tuna (jodari), Scomberomorus
plurilineatus [(Kingfish) (nguru)], Restrelliger chrysozonus (Vibua), Carcharinus falciformis
(papa), Hypolophussephen (taa), Panulirus ornatus (kamba kochi), Penaeus bubulus (kamba)
Anchoviella commersonii (dagaa) and Octopus chromatus (Pweza), (Fisheries annual statistics
report, 2013).

`
106
Table 2. 28: Fisheries Statistics, Tanzania Mainland, 2007 - 2016 Fish Production
Freshwater Marine Totals
Years Fishers
F-
Vessels Weight Value Fishers
F-
Vessels Weight Value Fishers
F-
Vessels Weight Values
M.Tonnes (000's TZS)
M.Ton
nes (000's TZS)
M.Tonn
es (000's TZS)
2007 126,790 44,362
284,347
252,525,197 36,247 7,489 43,499 39,239,352 163,037 51,851 327,845 291,764,549
2008 133,791 44,838
281,691
319,639,171 36,247 7,489 43,130 51,756,216 170,038 52,327 324,821 371,395,387
2009 135,769 45,234
288,059
342,492,879 36,321 7,664 47,616 67,930,600 172,090 52,898 335,674 410,423,479
2010 141,206 47,635
294,474
684,844,019 36,321 7,664 52,683 89,639,934 177,527 55,299 347,157 774,483,953
2011 141,206 47,635
290,474
1,031,883,681 36,321 7,664 50,592 166,954,953 177,527 55,299 341,066 1,198,838,634
2012 147,020 49,721
322,313
1,248,903,393 36,321 7,664 50,079 195,529,127 182,741 56,985 365,023 1,444,432,520
2013 147,644 50,120
364,602
1,287,248,813 36,321 7,664 52,846 207,649,600 183,431 57,385 375,158 1,494,898,413
2014 147,479 49,627
314,062
1,551,653,651 36,321 7,664 51,912 241,563,754 183,800 57,291 365,974 1,793,217,405
2015 147,479 49,627
309,922
1,270,856,680 36,321 7,664 52,723 210,892,897 183,800 57,291 362,645 1,481,749,577
2016 149,018 49,688
308,772
1,270,856,672 54,511 9,650 53,823 211,891,899 203,529 59,338 362,595 1,486,377,303
Source: Ministry of Livestock and Fisheries
2.5.2.2: Import of Fish and Fishery Products
The per capita consumption of fish is high, between at least 25 and 40 kg/person annually. Fish
production has been increasing for the past few years, mostly attributed to fish farming, and
more people becoming fishers. Despite the increase in fish production, Tanzania still needs more
fish to meet the rising demand and supply gap due to population growth and booming tourism
industry.
Some of the constraints facing the fishery industry include inadequate technical expertise,
management skills, insufficient financial resources and lack of adequate tools to manage and
control the development process. To bridge the gap between demand and supply, the government
has put in place strategies, which include allowing importation of fish from abroad. Statistics for
the period between 2010 to 2016 show that there has been a steady rise in importation, from 1.92
million kilograms in 2010, to 13.92 million Kilograms in 2016 (Table 2.29).

`
107
Table 2. 29: Trend of Import of Fish Products from 2010-2016
Year Weight (Kg) Value in US $ Value in TZS Royalty in TZS
2010 1,919,770.00 1,229,344.00 1,668,374,629.00 657,934,406.00
2011 2,659,435.00 - - 978,402,385.00
2012 4,885,689.00 3,512,976.00 5,507,054,266.00 1,681,166,953.00
2013 6,642,398.00 5,718,245.60 9,027,183,853.10 2,649,611,644.00
2014 6,792,259.80 6,009,654.90 9,889,823,440.20 2,818,169,085.90
2015 16,743,964.40 15,338,684.90 32,211,238,339.30 7,247,564,250.00
2016 13,917,656.98 12,749,582.82 26,774,123,924.68 8,519,807,734.03
Source: Ministry of Livestock and Fisheries
“-” Data not available
2.5.2.3: Export of Fish and Fishery Products
Appart from its other contributions, the fish and toehr fishery resources contribute to foreign
exchange earnings and government revenue. For the past sixteen years (i.e. 2001 – 2016), an
average of 43,541,440 kilograms of fish and fishery products worth USD 161,752,485 was
exported (Table 2.30) every year. The most important fish and fishery products for exports
include Nile perch from Lake Victoria, sardines from Lake Tanganyika as well as shell fish from
marine waters such as prawns, lobsters and crabs; and molluscs (squids and octopus).

`
108
Table 2. 30: Trend of Export Performance from 2001 - 2016 Years Weight in Kgs Aquarium Fish in Pieces Value in US $ Value in TZS Royalty in TZS
2001 41,640,247.9 80,577.0 95,435,102.4 82,982,764,242.1 5,244,333,672.0
2002 32,662,878.2 28,301.0 105,779,930.6 99,294,249,903.5 5,957,654,995.0
2003 42,352,738.1 24,500.0 129,605,815.4 132,862,401,373.8 7,789,955,962.7
2004 46,011,033.4 15,784.0 112,761,195.1 121,922,686,607.3 7,190,356,743.1
2005 57,289,083.6 21,025.0 141,597,362.2 162,619,492,949.1 9,142,768,083.8
2006 44,495,623.4 21,741.0 138,120,145.1 170,184,661,003.1 6,236,615,179.2
2007 57,795,513.6 25,502.0 173,272,670.4 213,211,258,838.2 7,589,576,913.9
2008 51,426,207.3 33,066.0 174,409,214.4 205,054,092,453.0 6,629,846,700.1
2009 41,148,261.0 53,188.0 161,053,645.7 207,447,119,888.5 6,410,191,232.0
2010 39,771,833.7 40,552.0 187,427,053.5 263,131,442,027.7 5,876,103,557.4
2011 37,996,433.3 61,215.0 152,973,356.8 233,714,590,010.8 6,153,278,023.3
2012 41,394,267.9 45,550.0 163,299,365.5 254,901,017,111.3 6,819,926,007.1
2013 38,573,605.9 44,260.0 147,659,778.6 234,884,628,955.9 6,117,769,193.7
2014 43,354,399.5 42,100.0 188,101,262.0 314,489,903,877.1 7,490,632,355.2
2015 41,059,452.1 87,630.0 259,286,762.2 547,228,222,095.5 13,097,411,199.2
2016 39,691,462.0 65,841.0 257,257,100.5 526,228,222,095.5 14,302,761,906.9
Source: Ministry of Livestock and Fisheries
2.5.2.4: Aquaculture Production
Aquaculture is the method of breeding fish and animals in a controlled marine or freshwater
environment. As the demand for fish and fish products increased, technology has made it
possible to grow food in coastal marine waters and the open ocean. However, despite abundant
potential areas the country is endowed with, aquaculture technology adoption in Tanzania is still
at infancy stage. Its development is determined by several factors such as availability of water,
suitable land for fish farming, awareness within the community on the economic potential in fish
farming and motivation.
2.5.2.5: Freshwater Aquaculture
Freshwater aquaculture is the method of breeding fish in controlled freshwater environments.
Generally, production of fish in ponds increased significantly in the twelve-year period from
2005 to 2016, rising from 651 MT to 3,840 MT. This has been accompanied by an increase in
the number of fish farmers from 11,245 to 18,900 in the same period. Income generated from
fish farming also increased significantly from TZS 2,602 Million in 2005 to TZS 22,000 million
in 2016.

`
109
Table 2. 31: Number of Fish Ponds, Aqua Farmers and Production
Year Number of
Ponds
Number of
Farmers Production (MT)
Value (TZS)
(000,000)
2005 13,011 11,245 651 2,602
2006 14,300 11,897 715 2,860
2007 16,121 13,861 806 4,030
2008 16,800 14,136 865 4,323
2009 17,511 14,907 936 5,616
2010 18,200 15,227 952 5,711
2011 19,174 15,982 959 5,752
2012 19,800 16,873 972 5,832
2013 20,100 17,511 2,990 17,937
2014 20,493 17,840 3,000 21,000
2015 21,300 18,201 3,118 21,826
2016 22,545 18,900 3,840 22,000
Total 219,355 186,580 19,802 119,489
Source: Ministry of Livestock and Fisheries
SEAWEED FARMERS AND PRODUCTION
Seaweed farming has often been developed as an alternative to improve economic conditions and
to reduce fishing pressure and over exploitation of fisheries. Statistics in Table 2.32 indicate that
seaweed farming and production is very feasible in the country. Categorized into four years’
periods, seaweed farming and production is shown to have increased in the most recent four
years period (2013 – 2016), with both the number of farmers (14,000), and production volume
(1,979.7 MT), as well as the value of seaweeds produced (TZS 1,011,411) being much higher
compared to the earlier periods.

`
110
Table 2. 32: Seaweed Farmers and Production from 2005 – 2016
Year Number of Farmers Production Value (TZS)
(MT) (000)
2005 1,000 170.0 25,500
2006 1,000 194.3 29,145
2007 1,000 200.1 40,020
2008 1,000 329.6 65,920
Sub-Total 4,000 894 160,585
2009 2,000 449.1 112,275
2010 2,000 552.8 165,840
2011 2,000 688.5 206,550
2012 3,000 651.9 260,760
Sub-Total 9,000 2,342.3 745,425
2013 3,000 401.1 160,440
2014 3,000 179.3 89,650
2015 3,000 222.8 133,680
2016 5,000 1,176.5 627,641
Sub-Total 14,000 1,979.7 1,011,411
Grand-Total 27,000 5,216.0 1,917,421
Source: Ministry of Agriculture Livestock and Fisheries, 2016
2.5.3 Crops
2.5.3.1: Area and Production of Food Main Crops
Agriculture is the science and art of cultivating the soil to grow plants, harvesting crops and
raising livestock for human needs. It includes the cultivation and tillage of the soil, growing, and
harvesting of any agricultural or horticultural commodities, the raising of livestock or poultry
and any practices performed by farmers. The sector is the mainstay of Tanzania's economy
contributing about 29 % of GDP (2016), 30 % of export earnings, with more than US$1 billion
from cash crop exports, and employs about 75 % of the total labour force.
In 2016, Tanzania had over 44 million hectares of arable land with only 33 % of this land in
cultivation. Land is a vital asset in ensuring food security. Almost 70 % of the population lives in
rural areas and they are involved in agriculture. Among the main food crops in Tanzania are;
Maize, Sorghum, millet, rice, wheat, beans, cassava, potatoes, and bananas. The main cash crops
are coffee, sisal, cashewnuts, tea, cotton, and tobacco.
`
111
The agricultural sector faces various challenges and its development has been the governments’
top priority, in a bid to reduce poverty. Factors influencing farmers’ efficiency include
inadequate finances and lack of education on modern farming methods. Other challenges are;
low productivity of land, labour and production inputs, underdevelopment of irrigation potential,
poor rural infrastructure, infestation and outbreak of pests and diseases, environmental
degradation and fluctuations of agricultural products prices.
2.5.3.2: Annual Crops
In Tanzania Mainland, the dominant annual food crops are cereals (Maize, Paddy, Sorghum,
Millet) and legumes (Beans, Cowpeas and Pigeon peas) grown in almost all twenty six regions.
Other crops such as tubers (Cassava, Potatoes) and Banana and plantains are also grown in many
parts of the country. Production levels are normally dictated by weather conditions and other
events like draught, floods, crop diseases and pests. Other factors include; fertilizer cost, input
price, area where the crop grown, test and market of the crop.
Production of food crops has been fluctuating over the period (2012 - 2016). Table 2.33 shows
that, the production of annual food crops increased from 21, 497 thousand tonnes in 2012 to
24,356 thousand tonnes in 2014, then decreased to 22,146 thousand tonnes in 2015 and later
increased to 25,928 thousand tonnes in 2016. The decrease in production of food crops in 2015
was in part due to unfavourable cereal market conditions experienced in 2014, and in part due to
weather vagaries. In the same period, the area under cerelas cultivation increased from 9,604 ha
in 2012 to 12,067 in 2016. Moeover, there was also a significant increase in the production of
paddy from 1,800 thousand tonnes in 2012 to 3,429 thousand tonnes in 2016 (90.5 percent
change).

`
112
Table 2. 33: Annual Crops Production (Tonnes), 2012 – 2016
Annual
2012
2013
2014
2015
2016
Crop
Area
(ha) Prod Area(ha)
Production
(000) Area(ha)
Production
(000) Area(ha)
Production
(000)
Area
(ha)
Production
(000)
Maize 4,118 5,104 4,120 5,356 4,146 6,734 3,788 5,903 3,584 6,149
Paddy 799 1,800 928 2,195 957 2,586 1,154 2,980 1,122 3,429
Cassava 955 5,462 864 4,755 800 4,993 1,095 5,886 1,112 6,614
Beans 1,265 1,199 1,151 1,114 1,114 1,115 1,125 1,202 1,181 1,307
Sorghum 839 839 711 35 851 37 756 39 726 42
banana 442 2,525 470 2,679 505 3,192 453 3,585 352 3,183
I/Potato 168 1,235 203 1,768 190 1,783 175 1,481 158 1,342
P/Peas 257 206 287 247 251 248 253 262 266 285
S/Potato 651 3,018 789 3,470 736 3,501 736 736 3,501 3,501
Wheat 110 109 107 104 101 167 86 72 65 76
Total 9,604 21,497 9,630
21,723 9,651
24,356 9,621
22,146
12,067
25,928
Source: Ministry of Agriculture
2.5.3.3: Perennial Crops
Perennial crops are crops that exist for more than one year after being planted and are harvested
multiple times, thus reducing the need for replanting year after year. Perennial crops can also
reduce top soil loss due to erosion, increase biological carbon sequestration within the soil and
reduce waterway pollution through agricultural runoff. In Tanzania the main perennial crops
include Coffee, Sisal, Tea, Pyrethrum, Sugarcane and Cashew nuts. Production of perennial
crops is normally affected by fertilizer and pesticide usage, input prices, weather and demand in
the international market.

`
113
Table 2.34 shows that, production of perennial crops increased from 8,404 thousand tonnes in
2012 to 9,685 thousand tonnes in 2016. In addition, the area under perennial crop production also
increased from 1,240 ha in 2012 to 1,676 ha in 2016. It is also observed that, coffee and
sugarcane were the most dominant crops over the period, contributing production volumes of
6,614 thousand tonnes and 2,839 thousand tonnes in 2016 respectively.
Table 2. 34: Production of Perennial Crops (Tonnes “000”), 2012 - 2016 2012 2013 2014 2015 2016
CROPS
Area
(ha)
Prod Area
(ha)
Prod Area
(ha)
Prod Area
(ha)
Prod Area
(ha)
Prod
Tea 9 33 21 34 21 34 23 36 23 33
Coffee 955 5,462 864 4,755 800 4,993 1,095 5,886 1,112 6,614
Sisal 58 26 35 35 41 37 49 39 35 42
Pyrethrum 9 6 16 6 18 7 13 6 7 2
Sugar 57 2,717 59 2,992 58 2,967 44 3,133 42 2,839
Cashewnut 152 160 411 128 434 130 483 198 457 155
Total 1,240 8,404 1,406 7,950 1,372 8,168 1,707 9,298 1,676 9,685
Source: Ministry of Agriculture
Figure 2.2 shows the average production of perennial crops from 2012 to 2016. On average
coffee production had the highest contribution, making 63.7 % of the total output over the
period, followed by sugarcane with 33.7%. The remaining perennial crops production accounted
for less than 3 % of total production.
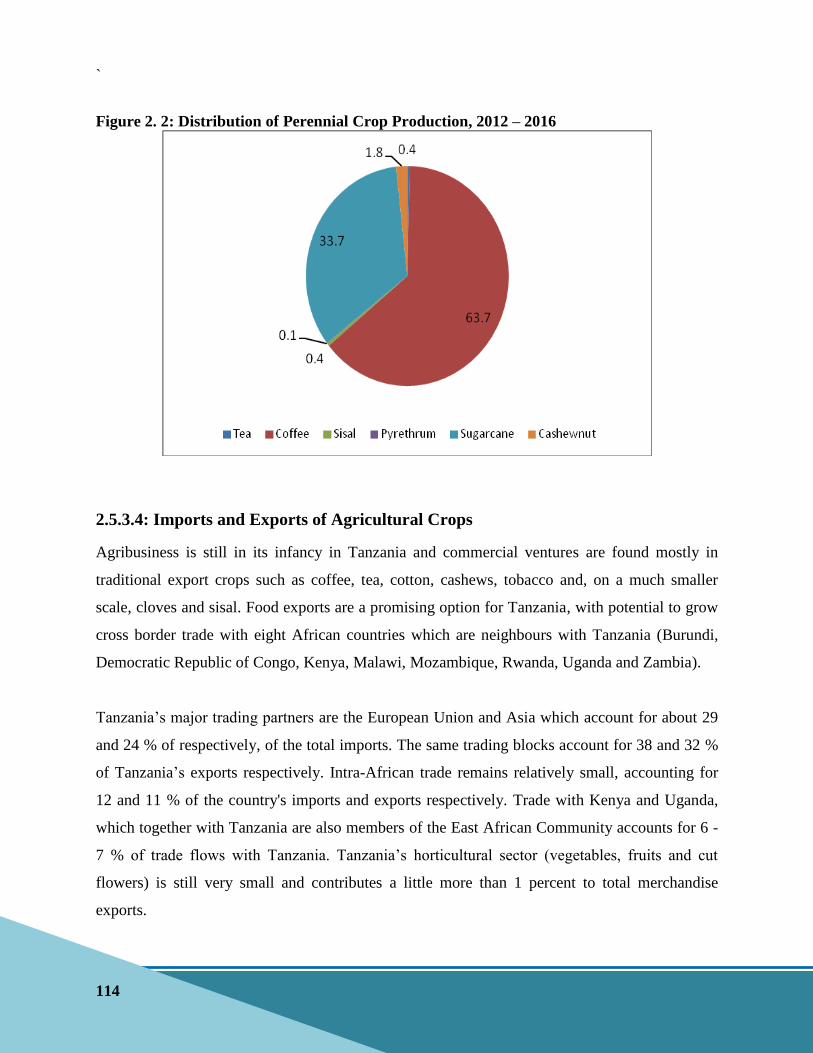
`
114
Figure 2. 2: Distribution of Perennial Crop Production, 2012 – 2016
2.5.3.4: Imports and Exports of Agricultural Crops
Agribusiness is still in its infancy in Tanzania and commercial ventures are found mostly in
traditional export crops such as coffee, tea, cotton, cashews, tobacco and, on a much smaller
scale, cloves and sisal. Food exports are a promising option for Tanzania, with potential to grow
cross border trade with eight African countries which are neighbours with Tanzania (Burundi,
Democratic Republic of Congo, Kenya, Malawi, Mozambique, Rwanda, Uganda and Zambia).
Tanzania’s major trading partners are the European Union and Asia which account for about 29
and 24 % of respectively, of the total imports. The same trading blocks account for 38 and 32 %
of Tanzania’s exports respectively. Intra-African trade remains relatively small, accounting for
12 and 11 % of the country's imports and exports respectively. Trade with Kenya and Uganda,
which together with Tanzania are also members of the East African Community accounts for 6 -
7 % of trade flows with Tanzania. Tanzania’s horticultural sector (vegetables, fruits and cut
flowers) is still very small and contributes a little more than 1 percent to total merchandise
exports.

`
115
Agricultural crop imports have been fluctuating from year to year due to various factors. Figure
2.2 indicates that, the highest importation in the five years period from 2012 was 889 thousand
tonnes, recorded in 2015 and the lowest importation was 672 thousand tonnes, recorded in 2014.
Generally, importation of agricultural crops decreased from 887 thousand tonnes in 2012 to 809
thousand tonnes in 2016.
On the other hand, agricultural crop exportation has been increasing from 857 thousand tonnes in
2012, to 1,695 thousand tonnes in 2014, but there was a decreased to 1,276 thousand tonnes in
2016. The highest agricultural crop exportation was observed in 2014 in which 1,695 thousand
tonnes were exported (Figure 2.3).
Figure 2. 3: Import and Export Data for Agricultural Crops, 2012 – 2016
Source: Tanzania Revenue Authority

`
116
2.5.3.5: Link of Agriculture and Environmental Issues
Agricultural development is strongly dependent on environmental resources such as land, forest,
air and water. Sustainable utilization of these resources in agriculture is very important to
safeguard the environment. Not only does the intensification of agriculture exert pressure on
natural resources, it also contributes to natural carbon pool, hence increasing agriculture’s
contributions to climate change mitigation. There is a scientific consensus that concentration of
greenhouse gases, human driven emissions of carbon dioxide and land-use changes are the
processes primarily responsible for climate change in the Africa region. Climate change is also
an attribute of unsustainable farming methods and systems including deforestation, land clearing
and bushfires. Tanzanian agriculture is constrained by unsustainable farming methods and
systems, unavailability of reliable methodologies for measuring and monitoring carbon
sequestration in agriculture sector and weak enforcement of laws and regulations.
The environment provides rural farmers with the resources for their farming activities, such as
marine or sea water, soil, forest, green vegetation and biodiversity. Apart from farming, which
forms the major source of income for majority of the rural population, the rural population
depends on other complementary income generation activities that rely on the environment such
as hunting, fishing, herbal medicine, craft and cottage industry.
Land degradation, particularly the deterioration of soils due to harmful agricultural practices
such as bush burning, poor irrigation systems, short fallow period and use of marginal land for
farming and grazing; cause serious challenge to agricultural environments conservation
initiatives in Tanzania. Moreover, degradation of environmental resources caused agricultural
activities in rural areas is often not given the serious attention it deserves. Careful management
of the soil is therefore necessary for sustainable food production. Some of the conservational
practices used in agricultural production include;
Planting of cover cropping –which prevent exposition of degraded land to erosion and
marsh formations
Practicing of crop rotation and shifting cultivation - which improves soil fertility and
reduces acidification of the soil.

`
117
Reduced bush burning - which lessens the effects of fire and heat on soil fertility and
texture
Longer fallow periods - which ensure the replenishment of micro - organisms and water
table after reasonably long fallow periods.
Soil management practices such as use of compost manure which improves soil fertility
instead of industrial fertilizers and other chemicals.
Reforestation– which ensures that trees which are cut down are replaced accordingly
Rotational grazing- which reduce chances of erosion due to desertification.
2.5.4- Livestock
The Livestock sector plays a significant role to the National economy and has potential to
contribute solutions to the major challenges facing the country due to rising poverty levels, food
insecurity and unemployment. The livestock industry in Tanzania is categorized into two major
production systems namely extensive and intensive. Extensive livestock production systems are
systems where animals are kept in fee-range for the most part or all the year of production cycle.
Intensive livestock production systems, on the other hand, involve zero grazing - in doors and
semi indoor - where animals are housed and fed. The main types of livestock raised are cattle,
goats, sheep, pigs and chicken of which most are indigenous. Besides meat production, other
products from livestock include hides, skin, milk, eggs and manure.
2.5.4.1: Number of Livestock by Type in Tanzania
Tanzania has the third largest population of livestock in Africa after Ethiopia and Sudan. About
50 million ha of rangelands are suitable for livestock grazing but only 24 million ha are currently
being utilized. The rest (about 40 %) of land suitable for livestock keeping is currently not being
utilized due to tsetse flies which are widespread in the country. Distribution of livestock is
therefore skewed towards areas that are mostly free from tsetse flies. The regions with the largest
heads of cattle are Shinyanga, Dodoma, Singida, Arusha and Tanga.
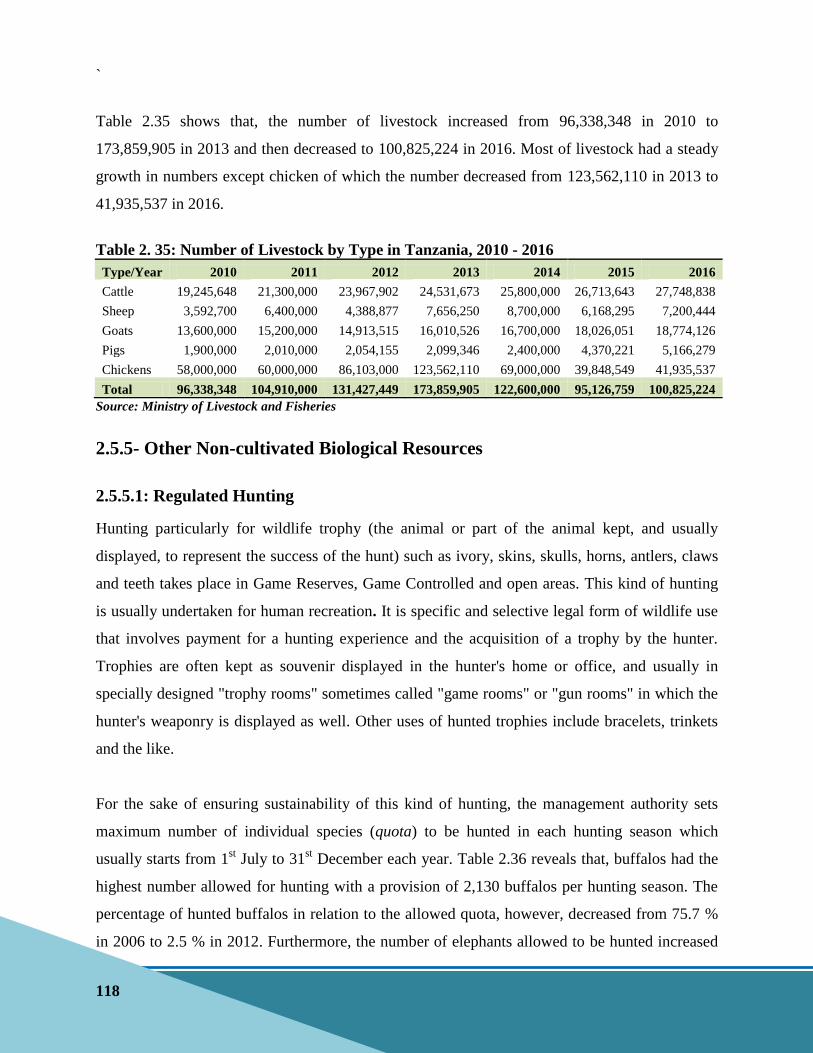
`
118
Table 2.35 shows that, the number of livestock increased from 96,338,348 in 2010 to
173,859,905 in 2013 and then decreased to 100,825,224 in 2016. Most of livestock had a steady
growth in numbers except chicken of which the number decreased from 123,562,110 in 2013 to
41,935,537 in 2016.
Table 2. 35: Number of Livestock by Type in Tanzania, 2010 - 2016
Type/Year 2010 2011 2012 2013 2014 2015 2016
Cattle 19,245,648 21,300,000 23,967,902 24,531,673 25,800,000 26,713,643 27,748,838
Sheep 3,592,700 6,400,000 4,388,877 7,656,250 8,700,000 6,168,295 7,200,444
Goats 13,600,000 15,200,000 14,913,515 16,010,526 16,700,000 18,026,051 18,774,126
Pigs 1,900,000 2,010,000 2,054,155 2,099,346 2,400,000 4,370,221 5,166,279
Chickens 58,000,000 60,000,000 86,103,000 123,562,110 69,000,000 39,848,549 41,935,537
Total 96,338,348 104,910,000 131,427,449 173,859,905 122,600,000 95,126,759 100,825,224
Source: Ministry of Livestock and Fisheries
2.5.5- Other Non-cultivated Biological Resources
2.5.5.1: Regulated Hunting
Hunting particularly for wildlife trophy (the animal or part of the animal kept, and usually
displayed, to represent the success of the hunt) such as ivory, skins, skulls, horns, antlers, claws
and teeth takes place in Game Reserves, Game Controlled and open areas. This kind of hunting
is usually undertaken for human recreation. It is specific and selective legal form of wildlife use
that involves payment for a hunting experience and the acquisition of a trophy by the hunter.
Trophies are often kept as souvenir displayed in the hunter's home or office, and usually in
specially designed "trophy rooms" sometimes called "game rooms" or "gun rooms" in which the
hunter's weaponry is displayed as well. Other uses of hunted trophies include bracelets, trinkets
and the like.
For the sake of ensuring sustainability of this kind of hunting, the management authority sets
maximum number of individual species (quota) to be hunted in each hunting season which
usually starts from 1st July to 31
st December each year. Table 2.36 reveals that, buffalos had the
highest number allowed for hunting with a provision of 2,130 buffalos per hunting season. The
percentage of hunted buffalos in relation to the allowed quota, however, decreased from 75.7 %
in 2006 to 2.5 % in 2012. Furthermore, the number of elephants allowed to be hunted increased

`
119
from 50 in 2000 to 200 in 2012 whereas the proportion of hunted elephants in relation to the
quota decreased from 64.0 % in 2000 to 20.5 % in 2012.
Table 2. 36: Trend of Some of the Wild Animals (Big five) Hunted From 2000 - 2012
SPECIES
Year/Hunting Season
2000 2001 2002 2003 2004 2005 2006 2007 2008 2009 2010 2011 2012
Elephant
Quota 50 50 50 100 100 100 100 200 200 200 200 200 200
Number of
hunted animals 32 35 41 45 36 54 65 87 99 98 96 45 41
% of Quota
64.0
70.0
82.0
45.0
36.0
54.0
65.0
43.5
49.5
49
48
22.5
20.5
Lion
Quota - - - - - - 315 315 315
315
315 315 315
Number of
hunted animals - - - - - - 278 176 105 120 98 27 37
% of Quota - - - - - - 88.3 55.9 33.3 38.1 31.1 8.6 11.7
Leopard
Quota - - - - - - 500 500 500
500
500 500 500
Number of
hunted animals
-
-
-
-
-
-
331 170
265
149
205
44
40
% of Quota - - - - - - 66.2 34.0 53.0 29.8 41.0 8.8 8.0
Hippopotamus
Quota - - - - - -
450
450
450
450
450
450
450
Number of
hunted animals
-
-
-
-
-
-
95
282
142
153
158
38
40
% of Quota - - - - - - 21.1 62.7 31.6 34.0 35.1 8.4 8.9
Buffalo
Quota - - - - - - 2,098 2,130 2,130 2,130 2,130 2,130 2,130
Number of
hunted animals - - - - - -
1,588
1,676
735
1,061
1,108
47
53
% of Quota - - - - - - 75.7 78.7 34.5 49.8 52.0 2.2 2.5
Source: Ministry of Natural Resources and Tourism
NOTE:
Some years have no allocation for quota for certain species due to the status of individual species during a
particular hunting season/year.
The number of hunted individual specie depends on various factors including availability of the animal
with desirable trophy as per hunting regulations thus not all individuals allocated in the quota are hunted
per season/year.

`
120
In order for the Tourist hunter to be allowed to hunt, she/he must obtain a relevant written
permission called hunting permit from Tanzania Wildlife Management Authority (TAWA). The
trophy hunter possessing the permit will be allowed to hunt under the guidance of a Professional
Hunter (PH) and supervision of Wildlife Ranger/Officer from TAWA.
Through trophy hunting the country is getting foreign exchange. For instance total annual
average of 16.5 USD million was earned from year 2010/2011 to 2015/2016 (Figure 2.4).
Figure 2. 4: Trends of Revenue Accrued from Tourist Hunting, 2010/11 – 2015/16
Source: Ministry of Natural Resources and Tourism
Trophy hunting plays an important role to communities neighbouring the areas where hunting is
taking place (Game Reserves, Game Controlled Areas and Open Areas). About 25 % of the
money earned by the Government from the business are disbursed to the communities through
their respective district administrations. For example, during the financial year 2015/2016 fifty
four (54) districts received TZS 1,306,395,164.20 (Table 2.37).
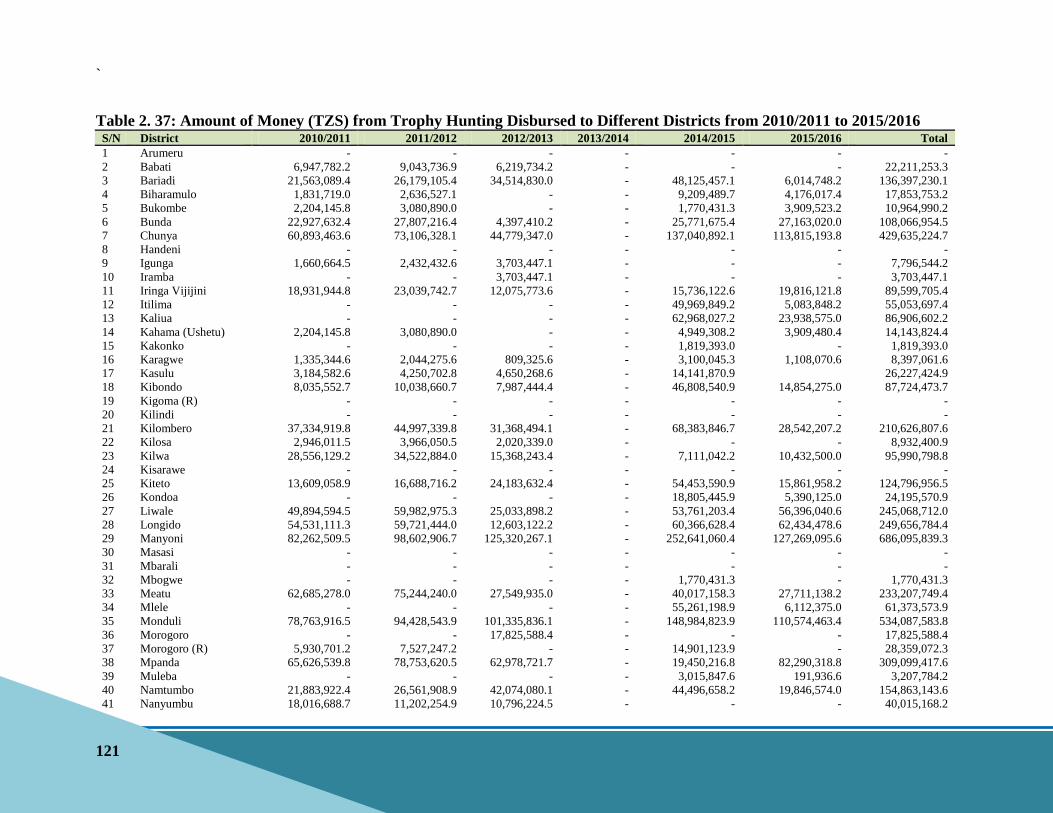
`
121
Table 2. 37: Amount of Money (TZS) from Trophy Hunting Disbursed to Different Districts from 2010/2011 to 2015/2016 S/N District 2010/2011 2011/2012 2012/2013 2013/2014 2014/2015 2015/2016 Total
1 Arumeru - - - - - - -
2 Babati 6,947,782.2 9,043,736.9 6,219,734.2 - - - 22,211,253.3
3 Bariadi 21,563,089.4 26,179,105.4 34,514,830.0 - 48,125,457.1 6,014,748.2 136,397,230.1
4 Biharamulo 1,831,719.0 2,636,527.1 - - 9,209,489.7 4,176,017.4 17,853,753.2
5 Bukombe 2,204,145.8 3,080,890.0 - - 1,770,431.3 3,909,523.2 10,964,990.2
6 Bunda 22,927,632.4 27,807,216.4 4,397,410.2 - 25,771,675.4 27,163,020.0 108,066,954.5
7 Chunya 60,893,463.6 73,106,328.1 44,779,347.0 - 137,040,892.1 113,815,193.8 429,635,224.7
8 Handeni - - - - - - -
9 Igunga 1,660,664.5 2,432,432.6 3,703,447.1 - - - 7,796,544.2
10 Iramba - - 3,703,447.1 - - - 3,703,447.1
11 Iringa Vijijini 18,931,944.8 23,039,742.7 12,075,773.6 - 15,736,122.6 19,816,121.8 89,599,705.4
12 Itilima - - - - 49,969,849.2 5,083,848.2 55,053,697.4
13 Kaliua - - - - 62,968,027.2 23,938,575.0 86,906,602.2
14 Kahama (Ushetu) 2,204,145.8 3,080,890.0 - - 4,949,308.2 3,909,480.4 14,143,824.4
15 Kakonko - - - - 1,819,393.0 - 1,819,393.0
16 Karagwe 1,335,344.6 2,044,275.6 809,325.6 - 3,100,045.3 1,108,070.6 8,397,061.6
17 Kasulu 3,184,582.6 4,250,702.8 4,650,268.6 - 14,141,870.9
26,227,424.9
18 Kibondo 8,035,552.7 10,038,660.7 7,987,444.4 - 46,808,540.9 14,854,275.0 87,724,473.7
19 Kigoma (R) - - - - - - -
20 Kilindi - - - - - - -
21 Kilombero 37,334,919.8 44,997,339.8 31,368,494.1 - 68,383,846.7 28,542,207.2 210,626,807.6
22 Kilosa 2,946,011.5 3,966,050.5 2,020,339.0 - - - 8,932,400.9
23 Kilwa 28,556,129.2 34,522,884.0 15,368,243.4 - 7,111,042.2 10,432,500.0 95,990,798.8
24 Kisarawe - - - - - - -
25 Kiteto 13,609,058.9 16,688,716.2 24,183,632.4 - 54,453,590.9 15,861,958.2 124,796,956.5
26 Kondoa - - - - 18,805,445.9 5,390,125.0 24,195,570.9
27 Liwale 49,894,594.5 59,982,975.3 25,033,898.2 - 53,761,203.4 56,396,040.6 245,068,712.0
28 Longido 54,531,111.3 59,721,444.0 12,603,122.2 - 60,366,628.4 62,434,478.6 249,656,784.4
29 Manyoni 82,262,509.5 98,602,906.7 125,320,267.1 - 252,641,060.4 127,269,095.6 686,095,839.3
30 Masasi - - - - - - -
31 Mbarali - - - - - - -
32 Mbogwe - - - - 1,770,431.3 - 1,770,431.3
33 Meatu 62,685,278.0 75,244,240.0 27,549,935.0 - 40,017,158.3 27,711,138.2 233,207,749.4
34 Mlele - - - - 55,261,198.9 6,112,375.0 61,373,573.9
35 Monduli 78,763,916.5 94,428,543.9 101,335,836.1 - 148,984,823.9 110,574,463.4 534,087,583.8
36 Morogoro - - 17,825,588.4 - - - 17,825,588.4
37 Morogoro (R) 5,930,701.2 7,527,247.2 - - 14,901,123.9 - 28,359,072.3
38 Mpanda 65,626,539.8 78,753,620.5 62,978,721.7 - 19,450,216.8 82,290,318.8 309,099,417.6
39 Muleba - - - - 3,015,847.6 191,936.6 3,207,784.2
40 Namtumbo 21,883,922.4 26,561,908.9 42,074,080.1 - 44,496,658.2 19,846,574.0 154,863,143.6
41 Nanyumbu 18,016,688.7 11,202,254.9 10,796,224.5 - - - 40,015,168.2

`
122
42 Ngara - - - - 3,015,870.6 - 3,015,870.6
43 Ngorongoro 69,098,241.0 82,895,897.3 10,928,131.2 - 170,248,103.5 219,085,089.4 552,255,462.3
44 Nkasi 8,458,444.2 10,543,235.8 - - 4,469,270.9 - 23,470,950.9
45 Nsimbo - - - - 8,955,791.3 6,941,625.0 15,897,416.3
46 Rufiji 30,148,177.2 36,422,443.7 26,309,550.4 - - - 92,880,171.2
47 Serengeti 42,348,525.5 50,979,347.1 3,048,231.8 - 114,734,124.3 139,350,722.4 350,460,951.0
48 Sikonge 48,182,871.6 57,940,625.0 35,968,933.3 - 48,346,381.6 14,380,949.8 204,819,761.3
49 Simanjiro 60,265,695.9 72,357,304.2 90,176,532.9 - 196,363,593.7 80,954,167.0 500,117,293.8
50 Songea 7,327,002.5 9,193,250.7 - - 37,804,228.6 11,620,200.0 65,944,681.8
51 Sumbawanga (R) 13,462,453.3 16,513,793.0 4,239,661.8 - - - 34,215,908.0
52 Tunduru 22,143,896.1 26,872,097.7 14,227,306.0 - 16,323,485.5 11,669,056.2 91,235,841.5
53 Ulanga 26,355,545.6 31,897,247.3 23,108,293.5 - 56,384,112.5 29,625,646.4 167,370,845.3
54 Urambo 23,103,796.7 28,017,407.6 38,433,128.5 - 28,351,081.5 15,925,623.2 133,831,037.5
Total 1,024,656,098.0 1,222,573,289.2 867,739,179.3 - 1,949,827,423.5 1,306,395,164.2 6,371,191,154.2
Source: Ministry of Natural Resources and Tourism
“-” Data not available

`
123
2.5.5.2: Importation and Exportation of Wild Animals
The other use of wildlife, which ranges from recreation to aesthetic beauty, necessitates its
exportation and importation. In most cases, exportation involves trophies obtained from controlled
hunting. Such trophies include elephant tusks, tails, skulls, feet, ears and hair products;
hippopotamus teeth, skins, skulls, tails and feet; zebra skins; lion claws, skulls, teeth, bone
carvings, and skin; buffalo skulls; crocodile skin and skulls, and leopard skins. Common uses of
these trophies include decoration and prestige.
Tanzania also imports wildlife and wildlife products from other countries of the world. Like
exportation, importation also involves trophies obtained from legal hunting undertaken elsewhere in
the world. Although rare, importation of live wild animal species have been done on occasions for
the purpose of conservation (e.g., restoration of threatened species like Rhinoceros and Kihansi
Spray Toad (Nectophrynoides asperginis) (Table 2.38).
Table 2. 38: Wildlife Products/Live Species Imported into Tanzania in 2015 and 2016
Year 2015
S/No Taxonomy Common name App. Class Term and quantity
1 Nectophrynoides asperginis Kihansi Spray Toad I Amphibia 1,500 live
2 Alligator mississippiensis
American
alligator/Common
alligator II Reptilia
15 leather products; 2
specimens
3 Chlorocebus aethiops African green monkey II Mammalia 10 specimens
4 Papio anubis Olive baboon II Mammalia 1 trophy
5 Crocodylus niloticus Crocodile II Reptilia 2 trophies
6 Panthera leo Lion II Mammalia 1 trophy
7 Hippopotamus amphibius Hippopotamus II Mammalia 12 teeth
8 Tayassu pecari II Mammalia 24 leather products
Year
2016
S/No
Taxonomy Common name App. Class Term and Quantity
1 Nectophrynoides asperginis Kihansi Spray Toad I Amphibia 2,100 live
2 Loxodonta africana African elephant I Mammalia 20 ivory pieces
3 Diceros bicornis Rhinocerous I Mammalia 1 live
4 Loxodonta africana African elephant II Mammalia 3 ivory carvings
5 Panthera leo Lion II Mammalia 1 skins
6 Ara ararauna
Blue-and-yellow
macaw/ Blue-and-gold
macaw
II Aves 1 live
7 Python reticulatus Reticulated python II Reptilia 1 leather products (small)
Note- APP - Appendix
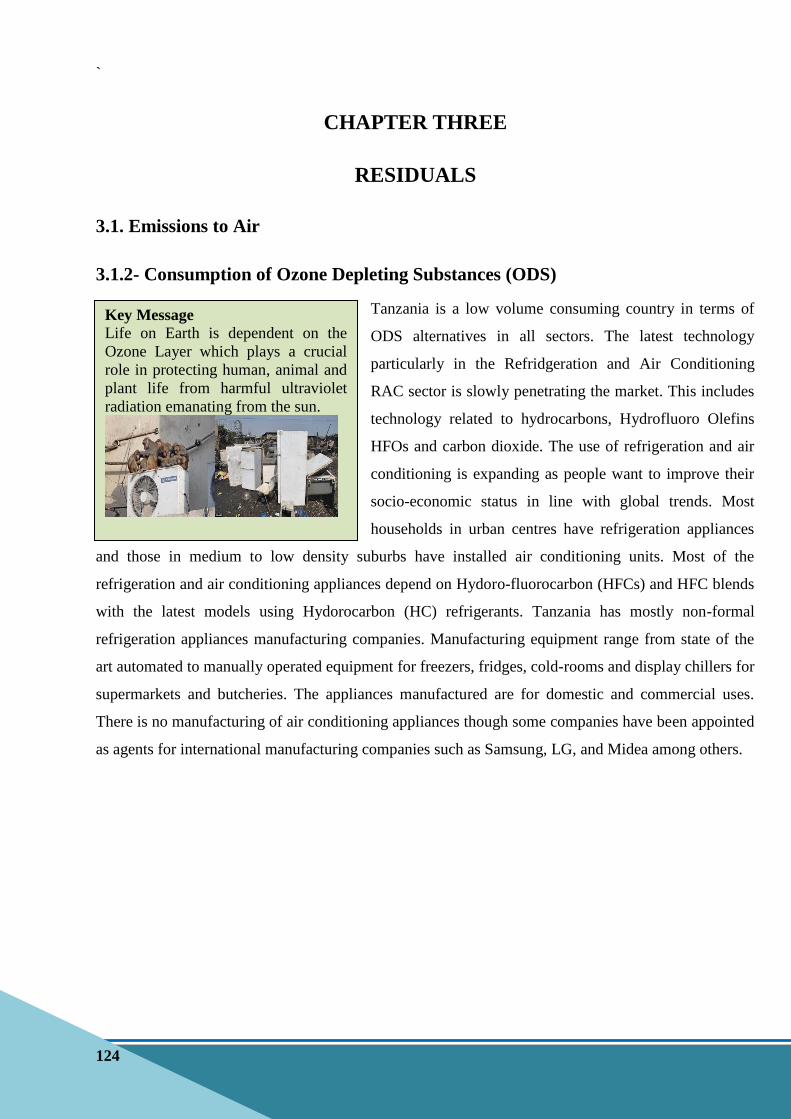
`
124
Key Message
Life on Earth is dependent on the
Ozone Layer which plays a crucial
role in protecting human, animal and
plant life from harmful ultraviolet
radiation emanating from the sun.
CHAPTER THREE
RESIDUALS
3.1. Emissions to Air
3.1.2- Consumption of Ozone Depleting Substances (ODS)
Tanzania is a low volume consuming country in terms of
ODS alternatives in all sectors. The latest technology
particularly in the Refridgeration and Air Conditioning
RAC sector is slowly penetrating the market. This includes
technology related to hydrocarbons, Hydrofluoro Olefins
HFOs and carbon dioxide. The use of refrigeration and air
conditioning is expanding as people want to improve their
socio-economic status in line with global trends. Most
households in urban centres have refrigeration appliances
and those in medium to low density suburbs have installed air conditioning units. Most of the
refrigeration and air conditioning appliances depend on Hydoro-fluorocarbon (HFCs) and HFC blends
with the latest models using Hydorocarbon (HC) refrigerants. Tanzania has mostly non-formal
refrigeration appliances manufacturing companies. Manufacturing equipment range from state of the
art automated to manually operated equipment for freezers, fridges, cold-rooms and display chillers for
supermarkets and butcheries. The appliances manufactured are for domestic and commercial uses.
There is no manufacturing of air conditioning appliances though some companies have been appointed
as agents for international manufacturing companies such as Samsung, LG, and Midea among others.

`
125
Key Message
Adoption of ODS Alternatives
such as HFCs and HFC blends
are part of the Nationally
Determined Contributions
under the United Nations
Framework Convention on
Climate Change.
The Vice President’s Office - Division of Environment serves as
the National Focal Point for the Vienna Convention, Montreal
Protocol and the United Nations Framework Convention on
Climate Change (UNFCCC). The Division of Environment also
coordinates the implementation of these commitments in the
country, and hosts the National Ozone Unit (NOU) whose
function is to coordinate and facilitate implementation of ODS
phase out programmes and projects. The Division, in collaboration
with other stakeholders, is also responsible for raising awareness
to general public on ozone and climate change related issues.
Controls for ODS alternatives in the country are now contained in the Environment Management
Regulations adopted in 2007. The Regulations control the import and export of ODS alternatives
and ODSs that were phased out in 2015 such as methyl bromide and methyl chloroform. The ODS
alternatives such as HFCs and HFC blends are included in the list of controlled substances in the
Regulations.
Table 3. 1: Sectors and Sub-Sectors Using ODS Alternatives in the Country
Sector/Subsector Entities Involved
RAC Manufacturing Manufacturing companies
RAC servicing Servicing companies and technicians
Fire suppression Companies and fire fighting organisations
Imports Importers, wholesalers and distributors

`
126
Key Message
The Environment Management
Regulations control the production,
import, export, trade, disposal and use
of ozone depleting substances (ODS)
and their products. They also make it
mandatory for importers and
exporters of ODSs, HFCs and ODS or
HFC based appliances to apply and be
allocated import or export quotas.
3.1.2.1: Refrigeration Sector
The refrigeration sector in Tanzania covers the
servicing and repairs as well as installation and
decommissioning of appliances such as domestic
fridges and cold rooms. Some refrigeration companies
buy panels from local manufacturing companies or
from other countries for installation of appliances such
as cold-rooms. The refrigeration sector includes
subsectors such as domestic refrigeration, commercial
refrigeration, industrial refrigeration and transport
refrigeration.
3.1.2.2: Domestic Refrigeration
The domestic refrigeration sub-sector comprises
domestic refrigerators and freezers mainly for food storage in households and in non-commercial
areas such as offices. Common refrigerants in domestic refrigeration in the country are HFC-134a
and Isobutene (HC-600a). This sub-sector accounts for about 55 % of the total consumption of R-
134a in the country. However, its consumption shows a general increasing pattern from 20 MT in
2012 to 33.4 MT in 2015 which is about a 67 % increase (ODS Alternatives National Survey
Report, Dec 2016).
3.1.2.3: Commercial Refrigeration
Commercial refrigeration encompasses equipment installed in malls, hotels, bars, restaurants, filling
stations, bus terminals, butcheries and supermarkets. The commercial refrigeration sub-sector
comprises equipment that are used to store and dispense frozen and fresh foods and beverages
where chilled foods are maintained in the range of 1°C−14 °C and frozen foods in the range of –
12°C to –20°C. The types of refrigerators used may be stand-alone or self-contained systems (ice-
cream freezers, ice machines, beverage vending machines, display cases and vaccine coolers),
condensing unit systems (typically installed in bakeries, butcheries), and centralized and distributed
systems (mainly supermarkets). Available refrigerant options for commercial refrigeration found in
the local market include Isobutene (R-600a), Propane (R-290), HFC blends (mainly R-404A, R-
407C, R-507A and R-508B) and Carbon dioxide (R-744).

`
127
3.1.2.4: Industrial Refrigeration
Industrial refrigeration sector covers cooling systems for production, storage or distribution of food,
beverages, chemicals, pharmaceuticals and other products, specialized cooling requirements for
mining industry; and commercial ice making. Refrigerants options for industrial refrigeration
applications typically found in Tanzania include R-134a, HFC blends (R-404A and R-410A) and
Ammonia (R-717). HCFC-22 (R-22). R-134a is mostly used in industrial chillers and ice making
machines. The amount of R-134a consumed during 2012 was 2.8 MT and increased to 4.6 MT in
2015, accounting for about 7.5 % of the total consumption of R-134a in the country (ODS
Alternatives National Survey Report, Dec 2016).
3.1.2.5: Transport Refrigeration
Transport refrigeration includes transport of chilled or frozen products by means of road vehicles,
railcars, intermodal containers, and small insulated containers and boxes. Typically the task of a
transport refrigeration system is to keep the temperature constant during transportation.
3.1.2.6: Air Conditioning Activity
The air conditioning activity in Tanzania covers the installation, servicing and repairs as well as
decommissioning. There is no manufacturing of air conditioning appliances in the country though
some companies are designated agents for SAMSUNG, DAIKIN, LG, Midea, among others. The
Air Conditioning activity includes sub-activities such as stationary air conditioning and Mobile air
conditioning.
3.1.2.7: Aerosols Activity
Significant proportions of Chloroflorocarbon (CFCs) were used as propellant gas in aerosols mainly
for non-technical applications mostlyin the cosmetics or household sub-sectors prior to their global
ban. Typical aerosol applications found in the household and cosmetic sectors include spray
deodorants, hair sprays and insecticide sprays.

`
128
Key Message
The market for ODS alternatives in
Tanzania is exclusively dominated by
imports which amounted to about 290.78
MT in 2012 as compared to 723.08 MT
in 2015.
Key Message
The market for ODS alternatives in
Tanzania is exclusively dominated by
imports which amounted to about 290.78
MT in 2012 as compared to 723.08 MT
in 2015.
In order to establish the trends in consumption of
ODS alternatives in Tanzania, the government in
collaboration with other stakeholders conducted a
national survey on consumption of Ozone Depleting
Substances (ODS) alternatives. The survey was
carried out in August – October 2016. It assessed
historical data (from 2012 to 2015) and projections
of consumption of ODS alternatives, including
medium, low and high-global warming potential
(GWP) alternatives, and their distribution by sector
and subsector. The survey was based on the "MLF
Guide for Preparation of the Surveys of ODS Alternatives" and covered the period from 2012 to
2015. A total of 10 out of 31 regions were targeted, covering both Tanzania Mainland and Zanzibar.
It covered Refrigeration and Air Conditioning (RAC) and Aerosols activities. Table 3.2 presents
some of the results obtained from the survey. It is revealed that, HC 600a is one of the most
common ODS alternatives used in Tanzania with an increasing trend from 232.6 MT in 2012 to
636.4 MT in 2015.
Table 3. 2: Estimated Use by ODS Alternative (Metric tonnes - MT)
Alternative Estimated Use (MT)
2012 2013 2014 2015
HFC
HFC-134a 18.2 20.9 27.0 30.4
HFC-227ea/HFC-365mfc - - - -
HFC blends
R-404A 0.4 0.5 0.6 0.7
R-407C 0.5 0.6 0.7 0.9
R-410A 0.8 1.4 1.8 1.9
R-507A 0.2 0.4 0.5 0.6
HFO
HFO-1234yf - - - -
OTHERS - - - - HC-290 5.1 7.2 10.1 23.0
HC-600a 232.6 330.2 587.6 636.4
Pentane (C, N, I) 0.0 0.0 0.0 24.7
R-744 0.8 0.8 0.8 1.0
R-717 16.7 23.4 27.5 30.2
Others 275.5 385.8 657.0 725.5
Source: Ozone Depleting Substances Alternative National Survey Report, Dec 2016
“-“ Data not available

`
129
3.1.2.8: The Use of ODS Alternatives in Economic Activities
Table 3.3 indicates that the use of HC-600a as a component of ODS alternatives has been on the
deline, falling fom 623.91 MT in 2012 to 323.30 MT in 2015. Results from the survey further show
that the use of HFC134a also decreased from 27.00 MT in 2012 to 20.59 MT in 2015. On the other
hand, the use of HC 290 increased from 0.43 MT in 2012 to 23.08 MT in 2015 while the use of
R717 increased from 16.79 MT in 2012 to 30.31 MT in 2015.
Table 3. 3: Summary of Refrigerants Usage in all Activities for 2012 - 2015 (MT)
Alternative
Refrigeration and Air-Conditioning Aerosol
Servicing
2012 2013 2014 2015 2012 2013 2014 2015
HFC
HFC-134a 27.00 18.50 30.44 20.59 - - - -
R-404A 0.40 0.40 0.40 0.40 - - - -
R-407C 0.45 0.90 0.45 0.45 - - - -
R-410A 0.80 1.90 1.90 1.43 - - - -
R-507A 0.24 0.40 0.40 0.40 - - - -
Others 0.35 0.35 0.35 0.35 - - - -
HFO
HC-290 0.43 - 7.13 23.08 - - - - HC-600a 12.73 8.40 11.75 6.60 623.91 411.58 575.77 323.30
R-744 - - 3.80 - - - - -
R-717 - 16.79 7.17 30.31 - - - -
Source: Ozone Depleting Substances Alternative National Survey Report, Dec 2016
“-” Data not available
3.1.2.9: Historical and Predicted Consumption of ODS Aternatives
The statistics in Table 3.4 were computed from the historical data obtained through the survey.
Projections of the estimated consumption of ODS alternatives for the years 2016-2030 in a
business-as-usual scenario, suggests that compared to 2015 values, consumption of ODS
alternatives will almost triple by 2030.
The survey on consumption ODS alternatives also revealed the following: -
The market for ODS alternatives in Tanzania is exclusively dominated by imports which
amounted to 723.08 MT in 2015 compared to 290.78 MT in 2012.
The most consumed ODS alternatives are Isobutene (R-600a) (72.7 %); Ammonia (R-717)
(6.9 %). The remaining proportion is accounted for by HFC blends (R-404A, R-407C, R-
410A and R-507A and Carbon dioxide (R-744).
The main sectors/sub-sectors that use ODS alternatives are refrigeration servicing
(domestic, commercial, industrial and transport); air conditioning servicing (stationary and

`
130
Key Message
Tanzania has put in place a licensing
system for ODS to further regulate
trade. The ODS Regulations obliges
that any person intending to import or
export a controlled substance or
product to lodge an application with
the Director of Environment (Vice
President’s Office – Division of
Environment).
mobile air conditioning); and aerosols. Comparatively, the aerosol sector accounts for about
70.5 % whereas the refrigeration and air conditioning (RAC) servicing use about 29.5 % of
the total amount of alternatives consumed in the country in 2015;
Table 3. 4: Historical and Predicted Consumption of ODS Aternatives, 2012 – 2030
ODS
Alternative
Historical data Predicted/Forecast Data
2012 2013 2014 2015 2020 2025 2030
HFC-134a 18.2 20.9 27.0 30.4 103.6 146.1 188.6
R-404A 0.4 0.5 0.6 0.4 1.3 1.8 2.4
R-407C 0.5 0.6 0.7 0.5 1.6 2.4 3.1
R-410A 0.8 1.4 1.8 0.8 3.9 5.8 7.7
R-507A 0.2 0.4 0.5 0.2 1.2 1.8 2.4
HC-290 5.1 7.2 10.1 23.0 48.2 76.6 105.0
HC-600a 232.6 330.2 587.6 636.4 700.7 1,067.9 1,435.1
R-717 0.8 0.8 0.8 1.0 1.3 1.6 1.9
R-744 16.7 23.4 27.5 30.2 53.4 75.6 97.9
Source: Ozone Depleting Substances Alternative Survey Report, Dec 2016
3.1.2.10: Challenges and Opportunities in Adopting ODS Alternatives
There are several challenges that are hindering the
adoption of ODS Alternatives in Tanzania. These
challenges range from lack of technology, lack of
capacity, unavailability, affordability, safety and health
issues to lack of policy and regulatory measures to
promote ODS alternatives. Most refrigeration technicians
lack the skills and knowledge on the correct use of HFC
blends especially on charging. There is therefore need for
capacity building on adoption of refrigerants that are
recommended for use in the country. Another challenge is
that ODS alternatives prices are much higher compared to
ODSs such as HCFC-22 forcing technicians to resort to the seemingly more affordable ODS. At the
same time, due to costs involed, refrigerants like R407C are not readily available in the local market.
There have also been some cases of contaminated R-134a refrigerants which have damaged
compressors.

`
131
Key Message
By 2016, only 10 towns/cities had
sewerage systems which covered only
20 % of total urban population.
3.2. Generation and Management of Wastewater
3.2.1- Generation and Pollutant Content of Wastewater
3.2.1.1: Sewerage Services and Sanitation in Urban Areas
The broad objective of Urban Water Supply and
Sanitation (UWSS) is to establish functional sewerage
systems as part of overall sanitation strategies in the
towns/locations where they work. By 2016, only 10
towns/cities had sewerage systems, and even then they
covered a very small proportion of the population (only
20 % of total urban population). This shows that
sewerage services in urban areas need more attention.
The use of onsite sanitation in areas where sewerage system is not provided is highly encouraged.
Rather than focusing on expensive central piped sewerage systems, utilities can plan for the future
sanitation services at town level including alternative solutions, and jointly with the LGAs, plan and
implement safe sanitation service chain in their towns. Safe removal and transport of wastewater to
waste stabilization ponds or sludge digesters for treatment is highly encouraged.
Figure 3. 1: Trends in Sewerage Connections in Regional WSSAs and Dar es Salaam

`
132
Table 3. 5: Generation, Collection, Treatment and Disposal of Wastewater for the City of Dar
es Salaam, 2013 - 2017
Unit of
Measurement 2013 2014 2015 2016 2017
Generation and Management of Wastewater
Topic 3.2.1- Generation and pollutant content of wastewater
a. Volume of
wastewater
generated
Volume (M3) 73,858,142 70,500,810 71,341,424 82,859,144 100,078,972
b. Pollutant content
of wastewater
Mass - - - - -
Topic 3.2.2- Collection and treatment of wastewater
a. Volume of
wastewater
collected Volume (M3) 16,300,673 16,190,413 16,197,881 16,199,957 16,329,545
b. Volume of
wastewater treated Volume (M3) 16,300,673 16,190,413 16,197,881 16,199,957 16,329,545
c. Total urban
wastewater
treatment capacity
1. Number of
plants Number 8 8 8 8 8
2. Capacity of
plants Volume (M3) 296,666 296,666 296,666 296,666 296,666
d. Total industrial
wastewater
treatment capacity
1. Number of
plants Number - - - - -
2. Capacity of
plants Volume (M3) - - - - -
Topic 3.2.3- Discharge of wastewater to the environment
a. Wastewater
discharge
1. Total
volume of
wastewater
discharged to
the
environment
after
treatment Volume (M3) 16,300,673 16,190,413 16,197,881 16,199,957 16,329,545
2. Total
volume of
wastewater
discharged to
the
environment
without
treatment Volume (M3) 57,557,470 54,310,397 55,143,543 66,659,187 83,749,428
b. Pollutant content
of discharged
wastewater
Mass - - - - -
a. Volume of
wastewater
generated
Volume 73,858,142 70,500,810 71,341,424 82,859,144 100,078,972
b. Pollutant content
of wastewater
Mass - - - - -
Source: DAWASCO
“-” Data not available

`
133
Key Message
About 16.3 million M3 (20 %) of
wastewater generated was collected
and treated from 2013 to 2017.
Key Message
Solid waste is a global issue which
results into serious environment
pollution with harmful effects upon
people’s health, animals, biodiversity
and the environment if not well
managed.
In 2013 Dar es Salaam City had a high demand of water
supply resulting from high population increase.
Wastewater generated is assumed to be 80 % of the
amount of water supply. Therefore, on average the
amount of wastewater generated is directly proportional
to the amount of water supplied. After completion of
the expansion of Lower Ruvu and Upper Ruvu water
supply treatment plant by 2017 the consumption of
water supply to the city became high hence an increased
volume of wastewater.
Table 3.5 indicates that, the volume of Wastewater generated is higher compared to volume of
wastewater collected in five years starting from 2013 to 2017. It is observed that generation of
wastewater increased from about 73.9 million M3 in 2013 to 100.0 million M
3 in 2017.
This is
largely attributed to the population increase. However, wastewater collection is low, with about
16.3 million M3 (20 %) of wastewater generated being collected and treated over the period.
3.3. Generation and Management of Waste
3.3.1- Generation of Waste
Introduction
Solid waste is defined as any solid, discarded material
generated by municipal, industrial, or agricultural
practices. Municipal Solid Waste (MSW) is a worldwide
problem. When solid waste is not efficiently and
effectively managed it results into serious environmental
pollution which has harmful effects upon people’s health,
animals, biodiversity and the environment. There is a high
demand for statistics on the generation and management
of waste to monitor the implementation of different
development programmes. Waste generation and
management have been emphasized under SDG Goal 12
particularly, on indicators number 12.4.1, 12.4.2 and 12.5.1. These indicators collectively call for
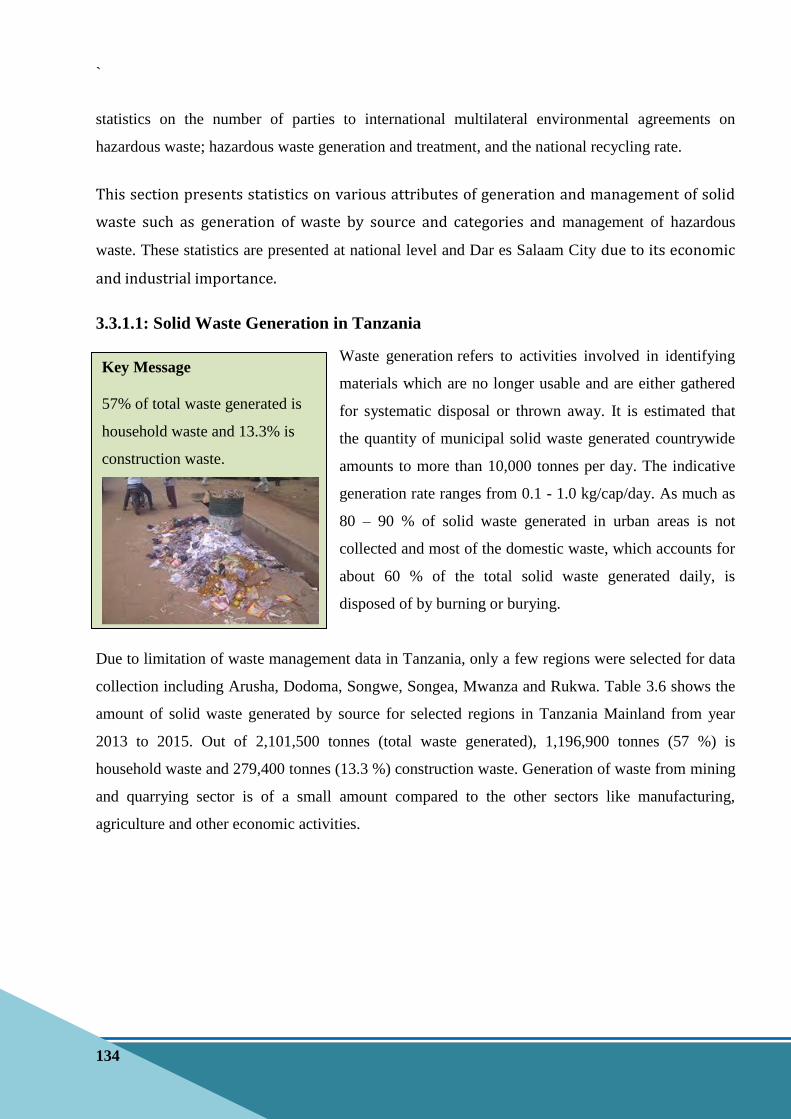
`
134
Key Message
57% of total waste generated is
household waste and 13.3% is
construction waste.
statistics on the number of parties to international multilateral environmental agreements on
hazardous waste; hazardous waste generation and treatment, and the national recycling rate.
This section presents statistics on various attributes of generation and management of solid
waste such as generation of waste by source and categories and management of hazardous
waste. These statistics are presented at national level and Dar es Salaam City due to its economic
and industrial importance.
3.3.1.1: Solid Waste Generation in Tanzania
Waste generation refers to activities involved in identifying
materials which are no longer usable and are either gathered
for systematic disposal or thrown away. It is estimated that
the quantity of municipal solid waste generated countrywide
amounts to more than 10,000 tonnes per day. The indicative
generation rate ranges from 0.1 - 1.0 kg/cap/day. As much as
80 – 90 % of solid waste generated in urban areas is not
collected and most of the domestic waste, which accounts for
about 60 % of the total solid waste generated daily, is
disposed of by burning or burying.
Due to limitation of waste management data in Tanzania, only a few regions were selected for data
collection including Arusha, Dodoma, Songwe, Songea, Mwanza and Rukwa. Table 3.6 shows the
amount of solid waste generated by source for selected regions in Tanzania Mainland from year
2013 to 2015. Out of 2,101,500 tonnes (total waste generated), 1,196,900 tonnes (57 %) is
household waste and 279,400 tonnes (13.3 %) construction waste. Generation of waste from mining
and quarrying sector is of a small amount compared to the other sectors like manufacturing,
agriculture and other economic activities.

`
135
Table 3. 6: Generation of Waste by Source for Selected Regions in Tanzania Mainland, 2013 -
2015
S/No Category Unit 2013 Key 2014 Key 2015 Key Total Average
1.
Agriculture, forestry and fishing
(ISIC 01-03) 1000 t 34.5 B 35.8 B 41.7 C 112.1 37.4
2. Mining and quarrying (ISIC 05-09) 1000 t - - - - 2.6 D - 2.6
3. Manufacturing (ISIC 10-33) 1000 t 71.8 F 72.5 F 8.0 F 155.4 51.8
4. Construction (ISIC 41-43) 1000 t 70.8 A 87.0 B 121.6 G 279.4 93.1
5.
Other economic activities
excluding ISIC 38 1000 t 7.0 H 7.0 H 18.0 I 32.0 10.7
6. Households 1000 t 363.8 K 415.3 K 417.8 K 1,196.9 399.0
7.
Total waste generation
(=1+2+3+4+5+6) 1000 t 678.9 J 733.1 L 689.5 J 2,101.5 700.5
Code Footnote text
A Data refer to Dodoma and Songwe only.
B Data refer to Dodoma, Songea and Songwe only.
C Data refer to Arusha, Dodoma, Songea and Songwe only.
D Data refer to Arusha only.
E Data refer to Dodoma only.
F Data refer to Dodoma and Moshi only.
G Data refer to Arusha, Dodoma and Songea only.
H Data refer to Songwe only.
I Data refer to Arusha and Songwe only.
J Data refer to Dodoma, Rukwa, Songea and Songwe only.
K Data refer to Dodoma, Mwanza, Songea and Songwe only.
L Data refer to Arusha, Dodoma, Rukwa, Songea and Songwe only.
Source: National Bureau of Statistics

`
136
Key Message
Solid waste generation has been
steadily increasing in Dar es Salaam
City from less than 2,000 tonnes per
day in 1998 to more than 4,600 tonnes
per day in 2017.
Dar es Salaam City Council estimated
that Dar es Salaam City could be
generating over 12,000 tonnes per day
by 2025.
3.3.1.2: Generation of Waste in Dar es Salaam City
Introduction
Dar es Salaam is the largest and most important
industrial and commercial centre with an estimated
population of more than 4.3 million (2012 census) and a
population growth rate of 4.3 %. The City has six Local
Government Authorities namely: - Dar es Salaam City
Council, Ilala, Kinondoni, Ubungo, Temeke and
Kigamboni Municipal Councils. Using a population
growth rate of 4.6 % and a generation rate of 0.815
kg/cap/day, Environment Resources Consultancy
(ERC) and Dar es Salaam City Council estimated that
Dar es Salaam City could be generating over 12,000
tonnes of waste per day by 2025.
3.3.1.3: Waste Generation and Composition
Solid waste generation has been steadily increasing in Dar es Salaam City from less than 2,000
tonnes per day in 1998 to more than 4,600 tonnes per day in 2017. The solid waste generation rate
is estimated to be about 0.815 kg/day per capita (2012 Population and Housing Census), which is
higher than typical values for developing countries, ranging from 0.4 to 0.6 kg/day per capita.
Approximately 50 – 60 % of the waste is readily biodegradable. It is estimated that 80 % of the
generated waste can be categorized as Municipal waste whereby Households constitute 75 %,
Institutions 0.5 %, Markets 3.5 %, Street sweeping 0.5 % and other sources 0.5 %. The other 20 %
is produced by the private sector (industry and commercial). Therefore, this means that every
person in Dar es Salaam produces a daily average of 0.9 kg/day per capita of household waste.
Table 3.7 shows generation of waste by institution and waste category. It is indicated that, total
generation of waste in Dar es Salaam increased slightly from 1,991 in 2013 to 2,243 in 2016. The
largest contributor institution for generation of waste is non industrial with 5,904 thousand tonnes
(69.7 %), followed by residential 2,374 thousand tonnes (28.0 %). Waste generated from industrial
sources accounted for 183 thousand tonnes (2.2 %) for the period.

`
137
Table 3. 7: Waste Generated by Source (Dar es Salaam City), 2013 - 2016
A). Waste Generated by Source
Years
2013 2014 2015 2016 Total Average
Tonnes
(000)
Tonnes
(000)
Tonnes
(000)
Tonnes
(000)
Tonnes
(000)
Tonnes
(000)
Residential Sources 558 582 605 629 2,374 594
Industrial Sources 43 45 47 48 183 46
Non Industrial Sources 1,388 1,447 1,505 1,564 5,904 1,476
Total 1,991 2,075 2,159 2,243 8,468 2,117
B). Amount of Waste Generated by Selected
Waste Category
Kitchen Waste 558 582 605 629 2,374 594
Textile 77 80 80 81 318 80
Grass and Wood 143 149 155 161 608 152
Metal 78 81 84 87 330 83
Ceramic and Stone 93 94 95 97 379 95
Paper 114 119 124 129 486 122
Plastic 242 248 254 258 1,002 251
Leather and Rubber 93 95 95 97 380 95
Glass 29 30 31 32 122 31
Other 45 47 48 48 188 47
Total 1,471 1,524 1,571 1,619 6,185 1,546
Source: Dar es Salaam City Council
3.3.1.4: Waste Composition in Dar es Salaam
Information on the composition of the solid waste is important in evaluating tools and equipment
needs, collection systems, disposal methods and management plans. The composition of solid waste
in Dar es Salaam to a great extent is food waste (kitchen waste which is 39 % of all waste
produced), garden waste, grass and wood, plastic, metal and textile as shown in Figure 3.2.
Figure 3. 2: Waste Composition in Dar es Salaam
39%
5%10%
5%
6%
8%
16%
6%
2%
3%
Kitchen waste
Textile
Grass and wood
Metal
Ceramic and stone
Paper
Plastic
Leather and Rubber
Glass
Other
Source: Dar es Salaam City Council

`
138
Key Message
The primary goal of solid waste
management is reducing and eliminating
adverse impacts of waste materials on
human health and environment to support
economic development and superior
quality of life.
3.3.2 - Management of Waste
3.3.2.1: Solid Waste Management in Tanzania
Improper solid waste management contributes to air
pollution, surface and groundwater contamination
and public health challenges. Municipal solid waste
(MSW) management is commonly the largest single
budget item for communities, and this sector is often
one of the largest employers as well. Thus, it is
imperative to move towards a green economy in the
solid waste sector by prioritizing waste avoidance,
minimization and promoting the “Three Rs”
(Reduce, Reuse and Recycle). In addition, moving this important sector towards responsible
stewardship will contribute to the main targets of the Sustainable Development Goals (SDGs): end
poverty, promote prosperity and well-being for all, protect the environment and address climate
change.
Solid waste management can be defined as a discipline associated with the control of generation,
storage, collection, transfer, processing and disposal of municipal solid waste in a way governed by
the best principles of public health, economics, engineering, aesthetics and other environment
considerations. In developing countries, solid waste management is considered to be one of the
most serious environment problems confronting most urban areas.
Waste management is gradually becoming a serious concern in Tanzania due to limited sorting at
source and improper storage, collection, transportation, treatment and final disposal. This implies
that significant proportions of the waste generated end up in the environment in unacceptable ways
of disposal which accentuate environment and public health risks. The waste management problem
is more pronounced in squatter settlements, where 70-80 % of the urban population resides without
the necessary infrastructure and waste collection services.

`
139
Figure 3. 3: Functional Elements of the Waste Management System
6. Waste Disposal The final stage of waste management that involves the activities aimed at the systematic disposal of waste materials in locations such as landfills or waste-to-energy facilities.
3. Waste collection A crucial phase of waste management includes activities such as placing waste
collection bins, collecting waste from those bins and accumulating trash in the
location where the collection vehicles are emptied. Although the collection phase
involves transportation, this is typically not the main stage of waste.
5. Waste processing and recovery Refer to the facilities, equipment, and techniques employed both to recover reusable or recyclable materials from the waste stream and to improve the effectiveness of other functional elements of waste management.
4. Waste transfer and transport Activities involved in moving waste from the local waste collection locations to the regional waste disposal site in large waste transport vehicles.
2. Onsite handling, storage and processing Activities at the point of waste generation which facilitate easier collection, for example, waste bins are placed at the sites which generate sufficient waste.
1. Waste generation Identifying materials which are no longer usable and are either gathered for systematic disposal or thrown away.

`
140
Solid waste management is one of the key duties of all urban authorities in Tanzania. This is a
legal obligation in accordance with the Local Government Act 1982 section 55 (g) and the
Environment Management Act of 2004. Efficient municipal solid waste management is an essential
public service, which should benefit all urban residents. Since the Colonial era, Solid Waste
Management in Urban areas has been regarded as a public good or service whereby the
Government has the duty to provide the Solid Waste Management Services, and the public has to
pay for that service. However, due to rapid urban growth, coupled with scarcity of funds, many
urban authorities are facing challenges including lack of coordination and waste management
awareness.
Additionally, other challenges facing solid waste management are lack of enforcement of
environmental laws, regulations, as well as unwillingness of the urban dwellers to pay for the waste
management services. While cities and towns are generating an ever-increasing volume of waste,
the effectiveness of their solid waste collection, transportation and disposal systems are declining.
Urban local Authorities’ problems are often considered as problems that need long-term solutions,
which cannot be achieved in the short run.
3.3.2.2: Legislation Governing Municipal Solid Waste (MSW) Management
The Environment Management Act (EMA) of 2004 is the umbrella law on environment
management in Tanzania. Section 114 (1), 118 and 119 of the Act stipulates the duty of local
government authorities in managing and minimizing solid waste. It provides for the existence of the
National Environment Management Council (NEMC).
Other legislations governing municipal solid waste management includes; Environment (Solid
Waste Management) Regulations, of 2009; which applies to all matters pertaining to Solid waste
and the Environment Management (Hazardous Waste Control) Regulations of 2009 which applies
to all categories of hazardous wastes, including e-waste for which currently there is no specific
policy/regulations.
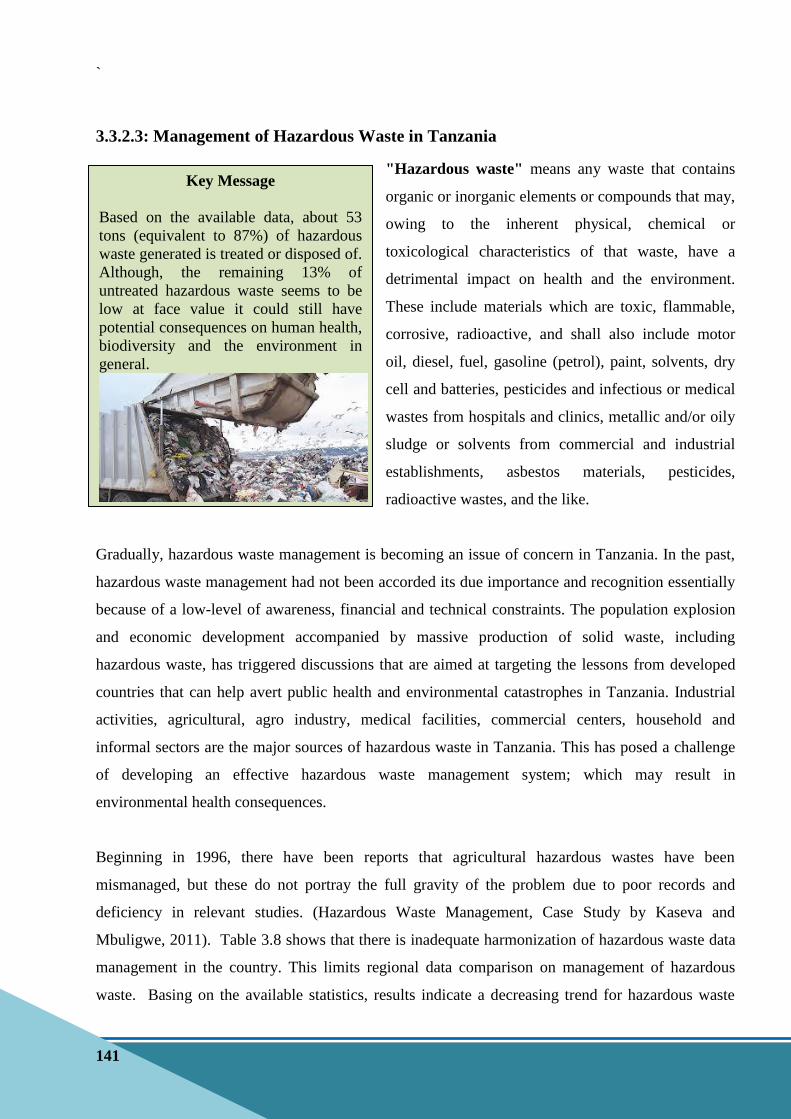
`
141
Key Message
Based on the available data, about 53
tons (equivalent to 87%) of hazardous
waste generated is treated or disposed of.
Although, the remaining 13% of
untreated hazardous waste seems to be
low at face value it could still have
potential consequences on human health,
biodiversity and the environment in
general.
3.3.2.3: Management of Hazardous Waste in Tanzania
"Hazardous waste" means any waste that contains
organic or inorganic elements or compounds that may,
owing to the inherent physical, chemical or
toxicological characteristics of that waste, have a
detrimental impact on health and the environment.
These include materials which are toxic, flammable,
corrosive, radioactive, and shall also include motor
oil, diesel, fuel, gasoline (petrol), paint, solvents, dry
cell and batteries, pesticides and infectious or medical
wastes from hospitals and clinics, metallic and/or oily
sludge or solvents from commercial and industrial
establishments, asbestos materials, pesticides,
radioactive wastes, and the like.
Gradually, hazardous waste management is becoming an issue of concern in Tanzania. In the past,
hazardous waste management had not been accorded its due importance and recognition essentially
because of a low-level of awareness, financial and technical constraints. The population explosion
and economic development accompanied by massive production of solid waste, including
hazardous waste, has triggered discussions that are aimed at targeting the lessons from developed
countries that can help avert public health and environmental catastrophes in Tanzania. Industrial
activities, agricultural, agro industry, medical facilities, commercial centers, household and
informal sectors are the major sources of hazardous waste in Tanzania. This has posed a challenge
of developing an effective hazardous waste management system; which may result in
environmental health consequences.
Beginning in 1996, there have been reports that agricultural hazardous wastes have been
mismanaged, but these do not portray the full gravity of the problem due to poor records and
deficiency in relevant studies. (Hazardous Waste Management, Case Study by Kaseva and
Mbuligwe, 2011). Table 3.8 shows that there is inadequate harmonization of hazardous waste data
management in the country. This limits regional data comparison on management of hazardous
waste. Basing on the available statistics, results indicate a decreasing trend for hazardous waste
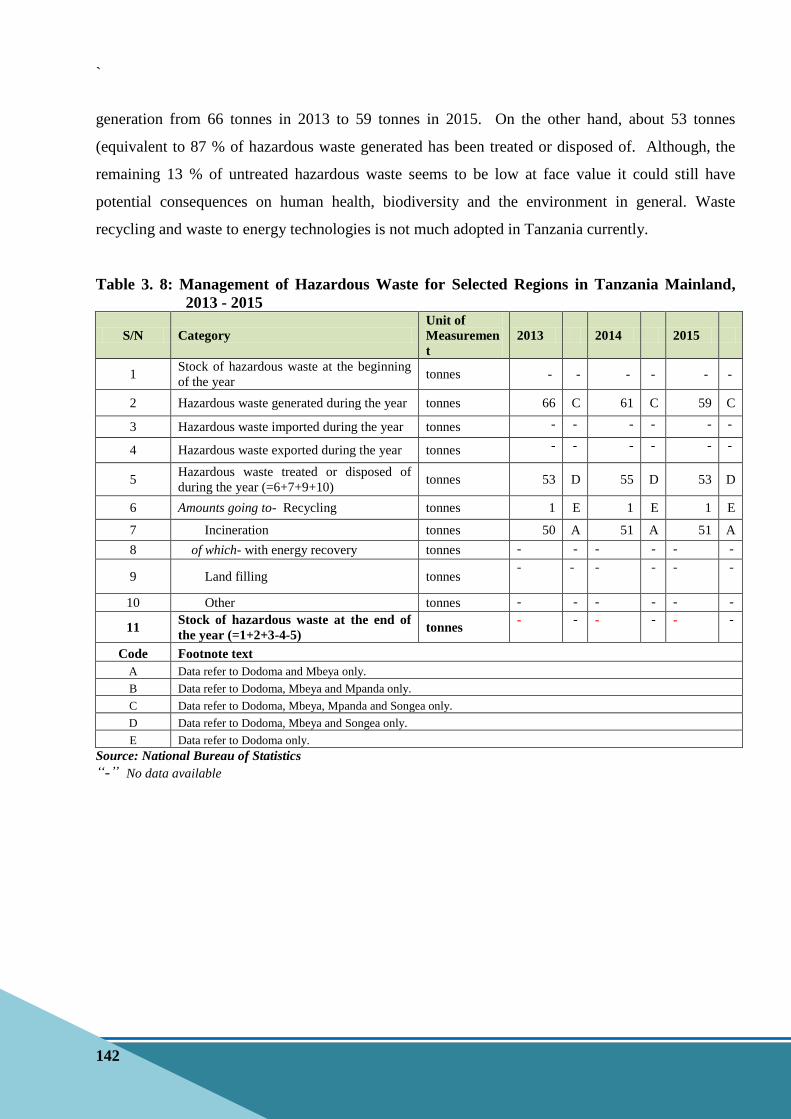
`
142
generation from 66 tonnes in 2013 to 59 tonnes in 2015. On the other hand, about 53 tonnes
(equivalent to 87 % of hazardous waste generated has been treated or disposed of. Although, the
remaining 13 % of untreated hazardous waste seems to be low at face value it could still have
potential consequences on human health, biodiversity and the environment in general. Waste
recycling and waste to energy technologies is not much adopted in Tanzania currently.
Table 3. 8: Management of Hazardous Waste for Selected Regions in Tanzania Mainland,
2013 - 2015
S/N Category
Unit of
Measuremen
t
2013 2014
2015
1 Stock of hazardous waste at the beginning
of the year tonnes - - - - - -
2 Hazardous waste generated during the year tonnes 66 C 61 C 59 C
3 Hazardous waste imported during the year tonnes - - - - - -
4 Hazardous waste exported during the year tonnes - - - - - -
5 Hazardous waste treated or disposed of
during the year (=6+7+9+10) tonnes 53 D 55 D 53 D
6 Amounts going to- Recycling tonnes 1 E 1 E 1 E
7 Incineration tonnes 50 A 51 A 51 A
8 of which- with energy recovery tonnes - - - - - -
9 Land filling tonnes - - - - - -
10 Other tonnes - - - - - -
11 Stock of hazardous waste at the end of
the year (=1+2+3-4-5) tonnes
- - - - - -
Code Footnote text
A Data refer to Dodoma and Mbeya only.
B Data refer to Dodoma, Mbeya and Mpanda only.
C Data refer to Dodoma, Mbeya, Mpanda and Songea only.
D Data refer to Dodoma, Mbeya and Songea only.
E Data refer to Dodoma only.
Source: National Bureau of Statistics
“-” No data available

`
143
Key Message
Recent economic and technological
advancements have led to increased
use of ICT. This poses a challenge on
appropriate methods to dispose end-
of- use electronic products without
destroying the environment,
jeopardize people’s health and
without loss of data and information
stored in these products.
3.3.2.4: Management of E-waste in Tanzania
E-waste: Is defined as end-of-use or end-life of
electronic products, components and peripherals such
as: computers, fax machines, phones, Personal Digital
Assistants (PDAs), radios and TVs. Recent economic
and technological advancements have led to increased
use of ICT. This is manifested by the number of mobile
subscribers, mobile services providers, internet service
providers, data operators and internet users. This poses
a challenge on appropriate methods to dispose end- of-
use electronic products without destroying the
environment, jeopardize people’s health and without
loss of data and information stored in these products.
The effects of e-waste on human health and well being include: - respiratory problems, oxidative
stress, DNA damage and the possibility of causing cancer. The reasons for the damaging effects to
human health and environment of e-waste is caused by its chemical and physical characteristics
which sets it apart from other forms of wastes that are produced by human activities or industrial
waste. The e-waste contains both hazardous and valuable component that calls for specialized skills
in handling, disposing and recycling in order to avoid contamination with the environment and safe
guard the human health.
Tanzania has no specific policy or regulation related to e-waste management. However, there are a
number of policies and regulations which aim at protecting the environment and human health.
Examples of these policies are: National Environment Policy (1997), the Sustainable Industrial
Policy (1996) and National ICT Policy (2016).
There are uncoordinated efforts to collect and disseminate e-waste statistics in the country. This has
led to challenges on the reliability of data for planning purposes. However, NBS in collaboration
with the Vice President’s Office, which is responsible for the environment in Tanzania, have started
putting efforts on capacity building for data management on e-waste. This initiative will help to
bridge the data gap on e-waste.

`
144
3.3.2.5: Management of Waste in Dar es Salaam City
Currently, waste management is a growing problem in Dar es Salaam City due to increasing
urbanization, rural-urban migration, rising standards of living and rapid development associated
with population growth, that have resulted in increased solid and liquid waste generation by
industrial, domestic and other activities.
Figure 3.4 shows the collection of municipal waste in Dar es Salaam. It is indicated that, municipal
waste collection has an increasing trend from 1.43 million tonnes in 2013 to 1.61 million tonnes in
2016.
Figure 3. 4: Municipal Waste Collected in Dar es Salaam City (000,000 Tonnes), 2013 - 2016
Source: Dar es Salaam City Council
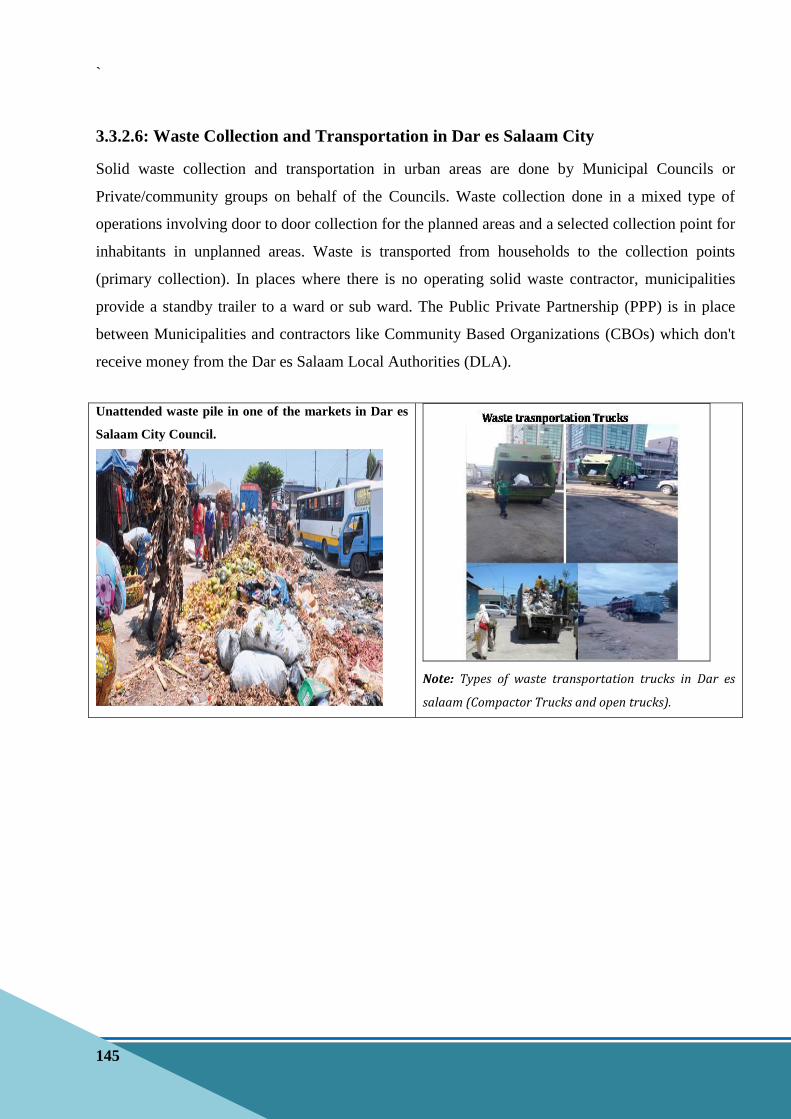
`
145
3.3.2.6: Waste Collection and Transportation in Dar es Salaam City
Solid waste collection and transportation in urban areas are done by Municipal Councils or
Private/community groups on behalf of the Councils. Waste collection done in a mixed type of
operations involving door to door collection for the planned areas and a selected collection point for
inhabitants in unplanned areas. Waste is transported from households to the collection points
(primary collection). In places where there is no operating solid waste contractor, municipalities
provide a standby trailer to a ward or sub ward. The Public Private Partnership (PPP) is in place
between Municipalities and contractors like Community Based Organizations (CBOs) which don't
receive money from the Dar es Salaam Local Authorities (DLA).
Unattended waste pile in one of the markets in Dar es
Salaam City Council.
Note: Types of waste transportation trucks in Dar es
salaam (Compactor Trucks and open trucks).

`
146
Key Message
The largest number of recycling industries is in
the category of plastic or nylon with 24
establishments (72.1 %) of all recycling
industries and the smallest number was in the
market and vegetable waste category (3.0 %).
3.3.2.7: Recovery and Recycling in Dar es Salaam
Resource recovery is the process of taking
useful discarded items for a specific next use.
These discarded items are then processed to
extract or recover materials and resources or
convert them to energy in the form of useable
heat, electricity or fuel.
Recycling is the process of converting waste
products into new products to prevent energy
usage and consumption of fresh raw
materials. It is the third component of reduce,
reuse and recycle hierarchy. The idea behind recycling is to reduce energy usage, volume of
landfills, air and water pollution, greenhouse gas emissions and preserve natural resources for
future use.
Dar es Salaam City Council has formulated a Recycling
Policy of 2016. The purpose of the policy is to encourage and
formalize recycling and composting activities. These activities
would greatly reduce the amount of solid waste that has to be
disposed, thus reducing the costs that have to be incurred by
the municipalities. Furthermore, such formalization will attach
an economic value to recyclable materials and hence encourage source separation as required by the
Environment Management Act, 2004 and the Public Health Act, 2009.
In 2017, Dar es Salaam City Council and five municipalities carried out a survey to identify
recycling centers, types and amount of waste recycled in the city. The suvey results reveal that, out
of 92,606 tonnes of waste recycled, 16,248 tonnes (17.5 %) were exported and there was no official
data for importation. Table 3.9 shows that, there were 33 recycling industries which recycled 221
tonnes of waste per day. These industries created jobs for 2,021 persons. The largest number of
recycling industries was in the category of plastic or nylon with 24 establishments (72.1 %) of all
recycling industries and the smallest number was in market and vegetable waste (3.0 %).
Typical Raw Materials for Recycling

`
147
Table 3. 9: Waste Recycling Industries in Dar es Salaam City, 2017
Type of Waste Recycled Number of Industries Amount of Waste Collected/ Day
(Tonnes)
No. of Staff
Plastic or Nylon 24 140.3 1,327
Metal 3 60.0 320
Batteries 3 20.0 324
Sandals/Slipers/ Old Shoes 2 0.3 50
Market and Vegetable Waste 1 0.4 -
Total 33 221.0 2,021
Products Made From Recycled Waste in Dar Es Salam City
Source: Dar es Salaam City Council
3.3.2.8: Waste Disposal in Dar es Salaam City
Waste collected through the formal scheme is delivered
to a large centralized dumpsite (Pugu Kinyamwezi)
which is located 30 Km from the city centre. Solid
waste is disposed in an open dump without any
engineered safety features: no liner, no soil cover, gas
collection mechanism and leachate treatment pond.
Although it was initially designed to operate as a
sanitary landfill, due to inadequate resources it is operating only as an open dumpsite.
The current disposal practices are substandard and therefore may cause threat to the environment
and public health. The area is 65 hectares of which around 45 hectares is almost covered with solid
waste heaps (2 to 3 metres high). The Dumpsite receives an average of 2,200 tonnes per day which
is only 48 % of the waste generated in the City.
`
148
3.4. Release of Chemical Substances
3.4.1- Release of Chemical Substances
3.4.1.1: Chemical Fertilizers (also in 2.5.1.b and 2.5.3.b)
The government of the United Republic of Tanzania has undertaken various initiatives to improve
agricultural sector development in efforts aimed at addressing the pressing issues of poverty and
food insecurity by increasing food production and greater diversity of food supplies (IFDC, 2012).
Increased food production has resulted in increased use of chemical fertilizers made available to
small holder farmers through various mechanisms like fertilizer and seed subsidies.
The most used fertilizers in Tanzania as shown in Table 3.10 are urea, DAP and NPK (6:20:18 /
10:18:24). The use of fertilizers inevitably leads to the release of chemical compounds in the soil
and water sources. Of all the major fertilizer nutrients, nitrogen is the main nutrient
affecting soil pH, and soils can become more acidic or more alkaline depending on the type of
nitrogen fertilizer used. Phosphoric acid is the most acidifying phosphorus fertilizer.
Potassium fertilizers have little or no effect on soil pH. Urea is one of the most used fertilizers and
has the potential of releasing Nitrogen to the soil and water sources while NPK has the potential of
releasing Phosphorus.
The main environmental problem associated with fertilizer use is contamination of water with
nitrates and phosphates. The nitrogen from fertilizers and manures are eventually converted by
bacteria in the soil to nitrates. The biggest issue facing the use of chemical fertilizers is groundwater
contamination. Nitrogen fertilizers break down into nitrates and travel easily through the soil. Since
nitrates are water-soluble and can remain in groundwater for decades, the addition of more nitrogen
over the years has a cumulative effect. Jokha (2015) found that the concentration of Nitrates and
Phosphates in Weruweru sub-catchment in Kilimanjaro region to be higher than the recommended
limits in drinking water regardless of the season.

`
149
Table 3. 10: Fertilizer Utilization (Tonnes) in Tanzania from 2011/12-2015/16
Type of fertilizer 2011/12 2012/13 2013/14 2014/2015 2015/2016
S/A 4,126 3,178 5,957 6,300 6,643
CAN 12,808 9,853 9,367 8,260 7,153
UREA 69,000 65,855 100,455 107,280 114,105
TSP 1,436 728
DAP 69,918 21,000 35,911 38,824 41,736
NPK 20-10-10 9,540 2,416 6,996 7,488 8,791
NPK 25-5-5 4,658 - 1,812 1,531 1,250
NPK 6-20-18/10-18-24 35,198 32,917 30,567 32,129 33,692
NPK 4-17-15 - - - - -
NPK 17-17-17 4,000 553 80,783 197,490 513,030
MRP 20,338 64,000 190,797 222,689 259,627
MOP 1,319 894 233 324 448
OTHERS 19,374 9,480 7,143 8,229 8,423
Total 251,715 210,876 283,579 309,088 325,919
Source: Ministry of Agriculture
`
150
CHAPTER FOUR
EXTREME EVENTS AND DISASTERS
4.1. Natural Extreme Events and Disasters
4.1.1 and 4.1.2, Occurrence of natural extreme events and disasters; and Impact
of Natural Extreme Events and Disasters
Tanzania like many other countries is not immune to natural hazards, all of which have the
potential of disrupting the community, causing casualties, and damaging or destroying
public or private property. An example of potential natural hazards may include: floods,
drought, cyclones/ strong winds, earthquakes, landslides, tsunami, beach erosion,
infestations and epidemics.
Some statistics pertaining to the occurrence of natural events and disasters such as type of
disaster, date of occurrence and their magnitude are indicated in Table 4.1. The latest natural
disasters were an earthquake which hit Kagera region in 2016 and droughts which affected
Dodoma, Kilimanjaro, Kagera, Lindi, Geita, Pwani and Simiyu regions in 2016/17. The casualities
associated with the Kagera earthquake were 17 deaths and 440 injuries. The damage to
infrastructure included total demolition of 2,072 private houses and 2,191 public buildings. On the
other hand, 14,595 private houses were partially damaged.
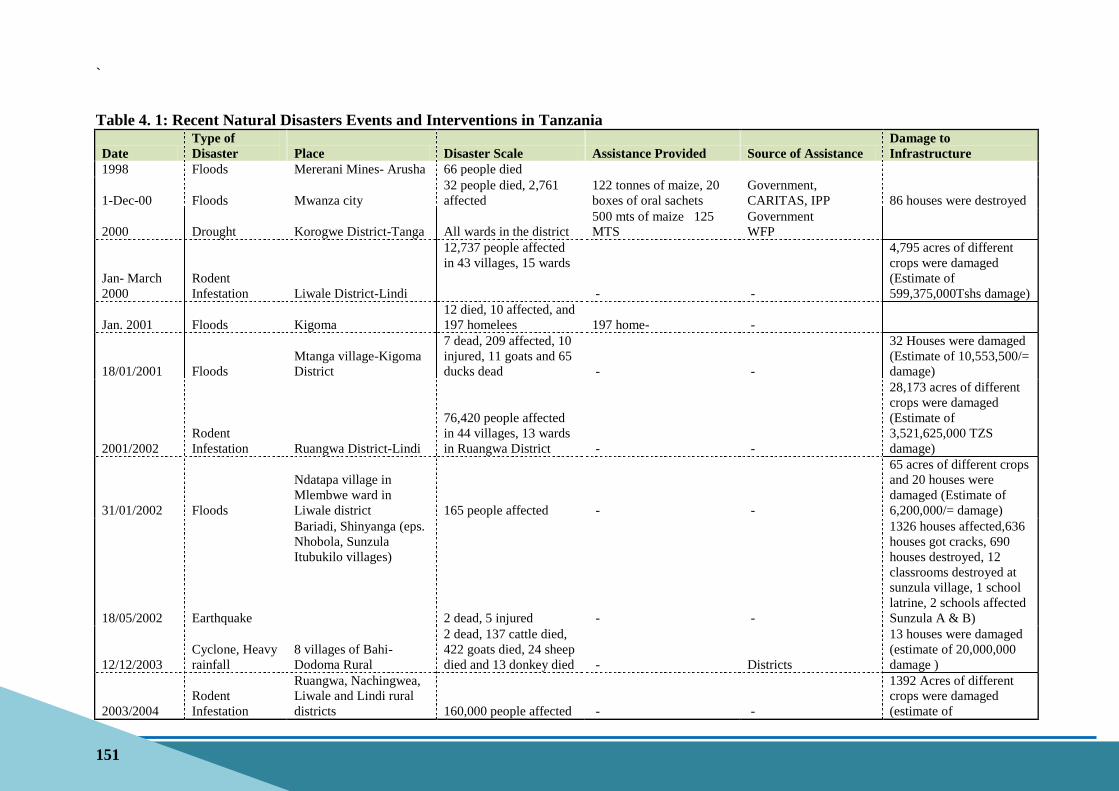
`
151
Table 4. 1: Recent Natural Disasters Events and Interventions in Tanzania
Date
Type of
Disaster Place Disaster Scale Assistance Provided Source of Assistance
Damage to
Infrastructure
1998 Floods Mererani Mines- Arusha 66 people died
1-Dec-00 Floods Mwanza city
32 people died, 2,761
affected
122 tonnes of maize, 20
boxes of oral sachets
Government,
CARITAS, IPP 86 houses were destroyed
2000 Drought Korogwe District-Tanga All wards in the district
500 mts of maize 125
MTS
Government
WFP
Jan- March
2000
Rodent
Infestation Liwale District-Lindi
12,737 people affected
in 43 villages, 15 wards
- -
4,795 acres of different
crops were damaged
(Estimate of
599,375,000Tshs damage)
Jan. 2001 Floods Kigoma
12 died, 10 affected, and
197 homelees 197 home- -
18/01/2001 Floods
Mtanga village-Kigoma
District
7 dead, 209 affected, 10
injured, 11 goats and 65
ducks dead - -
32 Houses were damaged
(Estimate of 10,553,500/=
damage)
2001/2002
Rodent
Infestation Ruangwa District-Lindi
76,420 people affected
in 44 villages, 13 wards
in Ruangwa District - -
28,173 acres of different
crops were damaged
(Estimate of
3,521,625,000 TZS
damage)
31/01/2002 Floods
Ndatapa village in
Mlembwe ward in
Liwale district 165 people affected - -
65 acres of different crops
and 20 houses were
damaged (Estimate of
6,200,000/= damage)
18/05/2002 Earthquake
Bariadi, Shinyanga (eps.
Nhobola, Sunzula
Itubukilo villages)
2 dead, 5 injured - -
1326 houses affected,636
houses got cracks, 690
houses destroyed, 12
classrooms destroyed at
sunzula village, 1 school
latrine, 2 schools affected
Sunzula A & B)
12/12/2003
Cyclone, Heavy
rainfall
8 villages of Bahi-
Dodoma Rural
2 dead, 137 cattle died,
422 goats died, 24 sheep
died and 13 donkey died - Districts
13 houses were damaged
(estimate of 20,000,000
damage )
2003/2004
Rodent
Infestation
Ruangwa, Nachingwea,
Liwale and Lindi rural
districts 160,000 people affected - -
1392 Acres of different
crops were damaged
(estimate of

`
152
Date
Type of
Disaster Place Disaster Scale Assistance Provided Source of Assistance
Damage to
Infrastructure
174,000,000/= damage)
2003/2004 Drought
All districts of Lindi
region (85 wards, 175
villages) 316,521 people affected 2,550 tonnes of maize
Government of
Tanzania
WFP
1/2/2004
Heavy rainfall
and strong wind
Village of Chamwino-
Dodoma rural
Food
Regional and National
level (Gvt of Tanzania)
97 houses and food were
destroyed (estimate of
15,000,000 damage)
2004/2005
Rodent
Infestation
All districts of Lindi
region 255,000 affected - -
101,400 acres of different
crops were damaged
(estimate of
12,675,000,000/=
damage)
2005/2006 Drought Bahi district
4,871 cattle, 1,974 goat
and sheep died, some
household were affected Food--quantify
Government of
Tanzania
Estimate of
361,000,000—provide
unit of measurement
damage
2005/2006 Army worm
infestation
All districts of Lindi
region
321,000 people affected 100 sprayers, 2,000 litres
of insecticides
Government of
Tanzania
27,974 different crops of
grass type were damaged
(estimate of
3,496,750,000/= damage)
3/8/2006 Cyclone
Village of Muungurumo,
ward of liwale in Liwale
district
225 pupils aged (5-18)
and 5 teachers affected - -
5 classrooms and 2 offices
were damaged ( estimate
of 97,722,000 damage)
July 2006-
June 2007 Drought
Arusha, Dodoma, Iringa,
Manyara, Shinyanga,
Singida, Tabora and
Mwanza, -
9,323.4 tonnes of maize
were distributed to
Affected population in the
districts - -
Julai 2007-
June 2008 Drought
Arusha, Dodoma, Iringa,
Kilimanjaro, Manyara,
Shinyanga, Lindi,
Singida, Tabora and
Mwanza, -
46,661.100 tonnes of
maize and 1,403.67
tonnes of sorghum were
distributed to affected
population in the districts
- -
1880, 1917,
1921, 1940,
1966, 1967,
2007 and
2008
Volcano
eruption at
Oldonyo Lengai
hills
Oldonyo Lengai hills-
Ngorongoro, Monduli-
Arusha - - -
Environment was
destructed
28/03/2008 Floods Mererani Mines- Arusha 74 people died Tsh. 50,000,000/= was Government of

`
153
Date
Type of
Disaster Place Disaster Scale Assistance Provided Source of Assistance
Damage to
Infrastructure
provided Tanzania
2008/2009 Drought
Longido, Ngorongoro
and Monduli districts
- Tsh. 4,349,996,650/=
were provided for buying
animals seed stock and
distributed to the affected
population
Governemnt of
Tanzania
July 2008-
June 2009 Drought
Mara, Singida,
Kilimanjaro, Arusha,
Mwanza, Shinyanga,
Iringa, Manyara, Coast,
Dodoma, Mara,
Morogoro, Mtwara and
Tanga regions -
33,347 tonnes of maize
and TZS. 2,696,116,450/=
for transportation cost
were distributed to
affected population in the
districts
Government of
Tanzania -
1/7/2009 Landslides Same district
24 people died, 60 cows
died
15 tents, 25 blankets, 25
mattresses, 1.8 tonnes of
maize and TZS.
83,000,000/=
Government of
Tanzania
15 kilometre road was
damaged, 15 Ndiva
(Irrigation reservoirs)
were damaged
27/12/2009 floods Kilosa
2 people died, 9 wards
of 5,981 households
with 25,637 people were
affected
Food, Mattresses, tents,
bed nets, Blankets,
cements, sheets, and TZS
9,803,895,160/=
Government of
Tanzania, Red Cross
5,981 houses, 4 schools
and number of dug wells
were damaged
July 2009 -
June 2010 Drought
Arusha, Dodoma,
Kilimanjaro, Iringa,
kagera, Lindi, Mara,
Manyara, Mwanza,
Mtwara, Morogoro,
Mbeya, Singida,
Shinyanga, Tanga and
Coast, -
107,451.72 tonnes of
maize and TZS.
6,532,576,360/= for
transportation cost were
distributed to affected
population in the districts
Government of
Tanzania
Farms with crops
dried….quantify
July 2010 -
June 2011 Drought
Arusha, Dodoma,
Shinyanga, Kilimanjaro,
Singida, Manyara, Mara,
Morogoro, Mwanza,
Iringa, Lindi and Tabora
-
50,524 tonnes of maize
and TZS. 2,669,935,041/=
for transportation cost
were distributed to
affected population in the
districts
Government of
Tanzania
Farms with crops
dried….quantify
1/4/2011 Floods Kilombero- Morogoro 6,643 people were
affected
Food, bed nets, clothes,
blankets, tents and TZS
756,442,000/= were
Government of
Tanzania, Plan
Tanzania, St. Andrew,
2731.5 hetres of farms
were destroyed, 6 bridges,
677 houses and roads

`
154
Date
Type of
Disaster Place Disaster Scale Assistance Provided Source of Assistance
Damage to
Infrastructure
provided Illovo, and Red Cross. were damaged
27/12/2011 Floods Dar es Salaam
41 people died, and
more than 5,000 affected
T. Sh. 1,844,111,521.80
/= and surveyed plots
were provided
Government of
Tanzania
July 2011-
June 2012 Drought
Shinyanga, Arusha,
Mara, Kilimanjaro,
Iringa, Tanga, Mwanza,
Tabora, Dodoma,
Singida, Manyara,
Kagera, Mbeya, Mtwara
and Coast, -
69,958.05 tonnes of
maize and
tsh.5,450,721,612/= for
transportation cost were
distributed to affected
population in the districts
Government of
Tanzania -
July 2012-
June 2013 Drought
Arusha, Dodoma,
Kilimanjaro, Lindi,
Mara, Manyara,
Morogoro, Mtwara,
Mwanza, Simiyu,
Singida, Shinyanga,
kagera, Iringa, Mbeya,
Tabora, Tanga, and
Coast -
70,319.08 tonnes of
maize and tsh.
4,115,566,168/= for
transportation cost were
distributed to affected
population in the districts
Government of
Tanzania -
July 2013-
June 2014 Drought
Arusha, Dodoma,
Kilimanjaro, Lindi,
Iringa, Manyara, Mara,
Morogoro, Mtwara,
Mwanza, Simiyu,
Singida, Shinyanga,
Tabora, Tanga, and
Coast
People and Livestocks
were affected
….quantify
29,871.45 tonnes of
maize and TZS.
2,505,014,771.30/= for
transportation cost were
distributed to affected
population in the districts
Government of
Tanzania -
4/12/2014 Floods Dar es Salaam 10 people died
Houses and roads were
damaged
July 2014-
June 2015 Drought
Arusha, Dodoma, Lindi,
Manyara, Mara, Mtwara,
Mwanza, Simiyu,
Shinyanga, Tabora and
Tanga
People and Livestocks
were affected
….quantify
14,530.41 tonnes of
maize and
tsh.1,466,195,875/= for
transportation cost were
distributed to affected
population in the districts
Government of
Tanzania -
23/03/2015
Hail storm
accompanied by
Mwakata,
Magung'unhwa and
47 people died, 3,500
people displaced; 67 -
Governemnt of
Tanzania 634 houses were damaged

`
155
Date
Type of
Disaster Place Disaster Scale Assistance Provided Source of Assistance
Damage to
Infrastructure
strong winds
and heavy
rainfall
Nhumbi villages in
Msalala district
cows and 236 goats were
killed
6-7 May 2015 Floods Dar es Salaam 8 people died
Houses and roads were
damaged
July 2015-
June 2016 Drought
Arusha, Dodoma,
Kilimanjaro, Iringa,
Kagera, Lindi, Manyara,
Mara, Morogoro,
Njombe, Simiyu,
Shinyanga, Singida,
Tabora and Tanga -
32,783.5 tonnes of maize
and TZS.1,152,631,870/=
for transportation cost
were distributed to
affected population in the
districts
Government of
Tanzania -
10-Sep-16 Earthquake
Kagera Region (Bukoba,
Misenyi, Muleba,
Karagwe and Kyerwa)
17 people died, 440
people were injured
TZS 6,417,327,168.60/=
was collected and used
for reconstruction and
rehabilitation of damaged
infrastructures (Primary
and Secondary Schools,
dispensaries and other
public buildings
Gvt, International
Organisations, NGOs,
CBOS, PRIVATE
Companies, Individuals
2,072 houses were totally
damaged, 14,595 houses
were partially damaged
and 2,191 public
buildings were damaged
2016/2017 Drought
Dodoma, Kilimanjaro,
Kagera, Lindi, Geita,
Coast and Simiyu -
1,135 tonnes of maize and
TZS. 45,650,000/= for
transportation cost were
distributed to affected
population in the districts
Government of
Tanzania -
Source: Prime Minister’s Office, Disaster Management Division
“-“ Data not available

`
156
4.2. Technological Disasters
4.2.1 and 4.2.2, Occurrence of Technological Disasters; and Impact of
Technological Disasters
Tanzania is equally exposed to technological hazards, all of which cause disruption. Some common
technological or man-made disasters are fire outbreaks, road accidents, power failures,
environmental degradation and pollution, marine accidents, train accidents, collapse of buildings,
oil spill, aircraft accidents, explosions and industrial accidents.
Table 4.2 present statistics on technological or manmade disasters from 1979 to 2013. The most
recent recorded event is the collapse of a 16 storey bulding in Dar es Salaam in 2013 which killed
39 people. Another event, which happened in 2012, was the capsizing of MV Skagit in Zanzibar
which killed 144 people.

`
157
Table 4. 2: Recent Technological/ Manmade Disasters Events and Interventions in Tanzania
Date Type of Disaster Place Disaster Scale Assistance Provided Source of Assistance Damage to Infrastructure
1979 Civil Strife Kagera, & Mwanza Region 6,600 people were affected
Medicines, food shelter
and clothing
West Lake Residents
Tanzania Goverments
Tanzania Red Cross
Roads, Bridges TANESCO
na TPTC poles and houses.
11/11/1983 Accident Train Derailment 20 killed and 79 injured
1984 Fire Bank of Tanzania 230 million TZS Fire Extinguishing Service
Fire Tender Service
Police -
1986 Fire Central Medical store 141 million drugs destroyed Fire Extinguishing Service Fire Tender Service -
21-May-96
MV Bukoba vessel
capsized Lake Victoria- near Bukoba
833 people died and 110
affected
Passengers and cargo were
damaged
1997 Fire Makuyuni Ward-Tanga
Sisal plantation devastated
(estimate of 4,600,000 TZS
damage)
12/08/2000
Conflict, farmers
Vs Livestock
keepers 27 deaths and 23 injured 17 tonnes maize food Gvt. 54 Houses were burnt
20/11/2001 2 boats collided Lake Tanganyika, Kigoma 20 + dead
Gvt. boats destroyed
04/11/2002
Ulanga ferry-
capsized Ifakara, Kilombero
13 dead.(Total of 58 people
bought tickets), 6 people
missing
1 Police land cruiser sank (
had 4 people all not seen
again) STJ 963 and 1 canter
lorry sank (had 2 people all
not seen again) TZQ7375
19/06/2002
Mines bad gas
inside (it happened
at 11 pm night)
Mererani Mines, Simanjiro-
Arusha 39 dead, 3 missing

`
158
Date Type of Disaster Place Disaster Scale Assistance Provided Source of Assistance Damage to Infrastructure
24/06/2002 Train Accident
Village of Msangali-
Dodoma 283 dead and 466 Injuries
Medicine, equipment,
water, flesh milk, free
communication, medics
US Gvt, African
Muslim, Vodacom,
German Embassy
Railway Line, Wagons and
Passengers properties were
damaged
24/4/2003 Fire
Makata village of Makata
ward in Lindi District 4 affected--specify
Health centre burned
(Estimate of TZS 3,000,000
damage)
10/01/2005 Fire
Village of Kineng'ene, ward
of Mtanda in Lindi district 2 affected-specify
25 acres of cashew nuts
were burned (estimate of
TZS 3,750,000 damage)
10/05/2005 Fire
Village of Mtene, Ward of
Rondo in Lindi district 12 affected-specify
2655 acres of trees,1 car,
2250 tonnes of wood and 10
Kiosks were burned were
burned (damage of TZS
27,000,000)
29-Mar-
2009
Bad Mining
practices- Blusting
of dynamites in the
mines
Mgusu Mines- Geita,
Mwanza 7 people died and 3 affected
TZS. 45,400,000 were
provided
Government of
Tanzania
29-Apr-
2009 Bomb blast
Mbagala Military camp-
Mbagala kuu Dar es Salaam
26 people died and 9,704
Affected
TZS. 11,570,435,186 were
provided to victims
Government of
Tanzania
9,519 buildings were
damaged
16/02/2011 Bomb blast
Gongo la Mboto Military
camp- Ilala, Dar es Salaam
30 people died and 1,693
households were affected
TZS 5,828,692,200 were
provided
Government of
Tanzania 1,693 houses were damaged

`
159
Date Type of Disaster Place Disaster Scale Assistance Provided Source of Assistance Damage to Infrastructure
09/10/2011
MV Spice
Iceslender vessel
capsized Zanzibar
203 people died, 1,370 missing
and 619 passengers rescued
TZS 300,000,000,
blankets, sleeping bags,
dead body bags,
medicines, tarpaulins were
provided
Government of
Tanzania
18/07/2012
MV Skagit vessel
capsized Zanzibar 144 people died
TZS 332,286,500, were
provided
Government of
Tanzania
29/03/2013 Building Collapsed Dar es Salaam 39 People died
Government of
Tanzania
16 floor residential
apartments building was
damaged
Source: Prime Minister’s Office, Disaster Management Division

`
160
Key Message
Significant growth in urban
population implies increase in
environmental pollution in
urban areas which increases the
risk to public health.
CHAPTER FIVE
HUMAN SETTLEMENTS AND ENVIRONMENTAL HEALTH
5.1. Human Settlements
A human settlement is an organized grouping of human habitation. There are two major types of
settlements which are urban and rural. Urban settlements are usually densely populated with many
people who have mostly non-agricultural occupations. Rural settlements, on the other hand, are
generally sparsely populated with a low density. Most of the rural populations are involved in
farming and livestock keeping.
5.1.1 Urban and Rural Population
5.1.1.1: Urban Population
It is noted that about 90 % of urban growth will take place in
African and Asian countries (The 2014 Edition, World
Urbanization Prospects). Table 5.1 shows that as of 2012,
29.6 % of Tanzania Mainland population was living in urban
areas. Like other urban areas of Africa and the rest of the
world, increase in urban population in the country is also
associated with increase in demand for social services as well
as increase in environmental pollution. With more people
living in a condensed space, pollution levels rise, sanitation
systems come under pressure and public health is more at
risk.

`
161
Key Message
Seven out of ten persons in Tanzania
Mainland’s live in rural areas where
agriculture is the mainstay. Therefore,
linking agriculture with sustainable
environmental protection practices is
crucial.
5.1.1.2: Rural Population
Rural population refers generally to the population in
areas that have a lower population density than urban
areas and are overall more spread out than urban areas.
These areas are typically more agricultural than urban
areas. It has also been noted that rural population is
generally higher in developing countries than in
developed countries. Furthermore, the United Nations
predict that the percentage of people living in rural areas
will steadily decrease as people migrate from rural areas
to urban areas (United Nations, World Population
Prospects Report, 2017).
According to the Population and Housing Census of 2012 Tanzania Mainland rural population
accounted for 70.4 % of the total population of 44,928,923 (Table 5.1). Farming and livestock
husbandry are the dominant sources of livelihood for the rural population. In as far as population
density in rural areas is smaller than in urban areas, level of environmental pollution is lower than
in urban areas.
Table 5. 1: Population Living in Urban and Rural Areas, Tanzania Mainland; 2012
Area Number Percent
Urban 13,305,004 29.6
Rural 31,623,919 70.4
Total 44,928,923 100.0
Source: Population and Housing Census, 2012
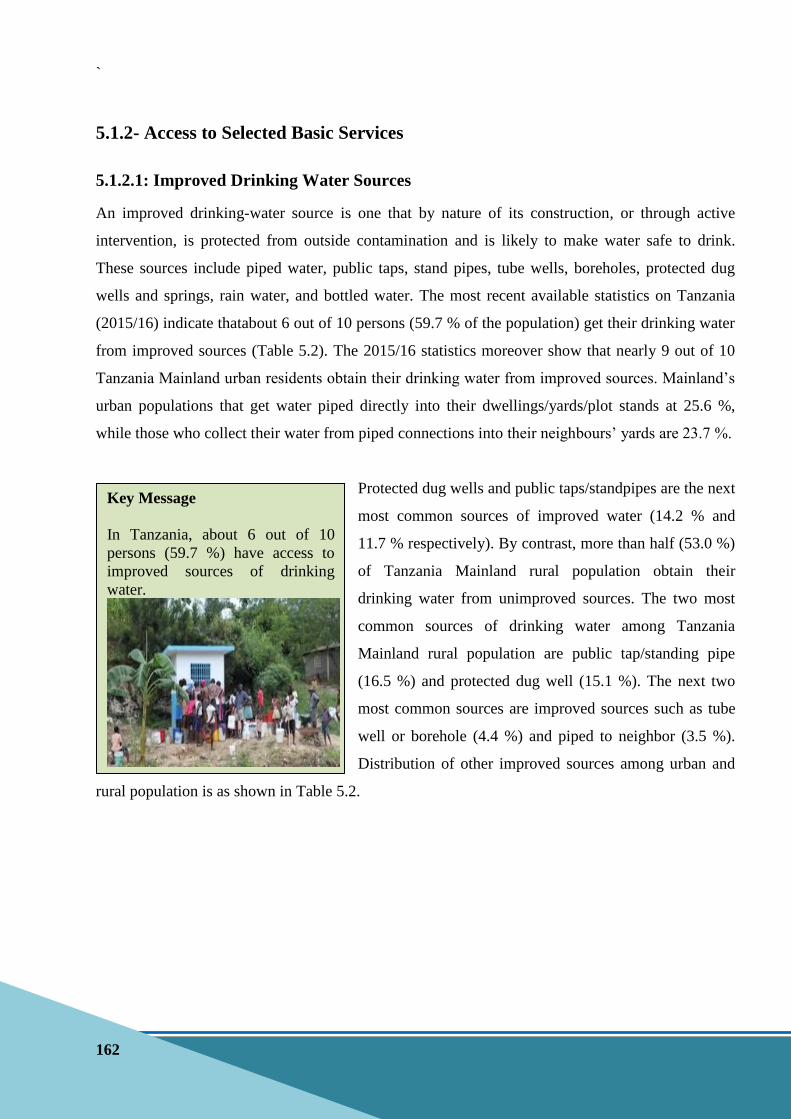
`
162
Key Message
In Tanzania, about 6 out of 10
persons (59.7 %) have access to
improved sources of drinking
water.
5.1.2- Access to Selected Basic Services
5.1.2.1: Improved Drinking Water Sources
An improved drinking-water source is one that by nature of its construction, or through active
intervention, is protected from outside contamination and is likely to make water safe to drink.
These sources include piped water, public taps, stand pipes, tube wells, boreholes, protected dug
wells and springs, rain water, and bottled water. The most recent available statistics on Tanzania
(2015/16) indicate thatabout 6 out of 10 persons (59.7 % of the population) get their drinking water
from improved sources (Table 5.2). The 2015/16 statistics moreover show that nearly 9 out of 10
Tanzania Mainland urban residents obtain their drinking water from improved sources. Mainland’s
urban populations that get water piped directly into their dwellings/yards/plot stands at 25.6 %,
while those who collect their water from piped connections into their neighbours’ yards are 23.7 %.
Protected dug wells and public taps/standpipes are the next
most common sources of improved water (14.2 % and
11.7 % respectively). By contrast, more than half (53.0 %)
of Tanzania Mainland rural population obtain their
drinking water from unimproved sources. The two most
common sources of drinking water among Tanzania
Mainland rural population are public tap/standing pipe
(16.5 %) and protected dug well (15.1 %). The next two
most common sources are improved sources such as tube
well or borehole (4.4 %) and piped to neighbor (3.5 %).
Distribution of other improved sources among urban and
rural population is as shown in Table 5.2.

`
163
Key Message
Use of improved sanitation
facilities is more common in urban
area than in rural areas.
Table 5. 2: Percentage Distribution of the Population Using an Improved Drinking Water,
Tanzania Mainland Characteristic
Urban Rural Total
Population using Improved drinking water source 86.4 47 58.6
Piped into dwelling/yard plot 25.6 3 9.6
Piped to neighbour 23.7 3.5 9.4
Public tap/standpipe 11.7 16.5 15.1
Tube well or borehole 5 4.4 4.6
Protected dug well 14.2 15.1 14.8
Protected spring 2.8 3.3 3.1
Rain water 1.2 1.3 1.2
Bottled water, improved source for cooking/washing 2.3 0 0.7
Source: Tanzania Demographic and Health Survey and Malaria Indicator Survey Report, 2015/16
5.1.2.2: Improved Sanitation Facilities
Improved sanitation facilities are ones that are used by
not more than one household and includes the following
sanitation amenities: flush or pour flush toilets to sewer
systems, septic tanks or pit latrines, ventilated improved
pit latrines, pit latrines with a slab, and composting
toilets. Generally, improved sanitation facilities ensure
better and safe management of faecal wastes by
controlling discharges of untreated wastewater into the
environment so as to prevent people from coming into
contact with human waste and thus reduce the transmission of cholera, typhoid, and other diseases.
Table 5.3 Shows that, about 19.0 % of population in Tanzania Mainland used improved sanitation
facilities. Improved sanitation facilities are more common in urban areas (41.9 %) than in rural
areas (9.5 %). Pit latrines with slabs are the most common improved sanitation facility in Tanzania
Mainland (8.3 %).

`
164
Key Message
Rapid growth of urban population
has not gone hand in hand with
urban planning processes. This
has resulted into growth of urban
population living in squatter areas
which exposed to many
environment pollution risks.
Table 5. 3: Percent Distribution of Population Using an Improved Sanitation Facility, 2015/16
Improved (Not shared toilet facility)
Tanzania Mainland
Zanzibar Tanzania Urban Rural Total
Flush/pour flush to piped sewer system 1.3 0.1 0.4 0.2 0.4
Flush/pour flush to septic tank 5.6 0.5 2.0 0.3 1.9
Flush/pour flush to pit latrine 19.6 1.8 7.0 26.5 7.6
Ventilated improved pit (VIP) latrine 2.5 0.6 1.2 6.7 1.3
Pit latrine with slab 12.9 6.4 8.3 27.3 8.8
Composting toilet 0.0 0.1 0.1 0.0 0.1
Total Percentage of population in
Tanzania using improved (not shared toilet
facility) 41.9 9.5 19.0 61.0 20.1
Source: Tanzania Demographic and Health Survey and Malaria Indicator Survey Report, 2015/16
Note- Toilet facilities would be considered improved if they were not shared by two or more households
5.1.3 - Housing Conditions
Housing condition is among the indicators usually used to determine living standards of a
household. It is also used as proxy indicator in measuring economic status of households. Housing
conditions includes the physical conditions of dwellings, types of dwellings, house tenure,
surrounding environment and availability of amenities.
5.1.3.1: Urban Population Living in Slums
According to Tanzania Ministry of Land, Housing and
Human Settlements Development, there are no slums in
Tanzania but rather unplanned settlements. Within this
framework, urban population living in slums is referred to
as population living in unplanned settlements. Rapid
urbanization and inadequate capability to cope with the
housing needs of people in urban areas have contributed to
the growth of unplanned settlements. Living in these
settlements often poses significant health risks caused by
poor sanitation and drinking water quality which exposes
inhabitants to a wide range of pathogens, as houses act as
breeding grounds for vectors.
Figure 5.1 shows the proportion of urban population living in unplanned settlements for selected
regions. Arusha (80.0 %) and Tanga (79.0 %) regions had the highest proportion of urban

`
165
population living in unplanned settlements in 2015. Singida (8.0 %) and Babati in Manyara region
(20.0 %) had comparatively lower proportions of population living in unplanned urban settlements.
Figure 5. 1: Percentage of Urban Population Living in Unplanned Settlements, 2015
Source: Tanzania Cities Network (TACINE), 2015
5.1.3.2: Population Living in Hazard Prone Areas
5.1.3.3: Hazard Prone Areas
Hazard is a potential source of harm or adverse health effect on persons. For instance, droughts and
floods are among primary hazards affecting some parts of the country. Map 5.1 presents major
hazards in Tanzania by agro ecological zones. Agro ecological zones (AEZs) are geographical areas
exhibiting similar climatic conditions influenced by latitude, elevation, temperature and rainfall.
The identified hazards are disease outbreaks, droughts, HIV/AIDS, floods and major accidents.
The central plateau agro ecological zone is more vulnerable to droughts, disease outbreaks and
HIV/AIDS with the first two hazards causing more risks to people living in the zone. Coastal and
Southern Highlands zones together are exposed to droughts, disease outbreaks and also experience
floods more frequently. Eastern plateau is mainly endangered by droughts and disease outbreaks.
Other remaining zones with respect to hazards exposure is as shown in Map 5.1.

`
166
Map 5. 1: Map of Tanzania Showing Five Main Hazards Affecting the Areas
Source: Prime Minister’s Office, Disaster Management Division

`
167
Key Message
In 2011/12 the largest proportion of
Tanzania Mainland houses’ walls were
constructed using baked/burnt bricks
(27.3 %), mud bricks (24.7 %) and mud
and poles or stones (23.6 %).
5.1.3.4: Number of Dwellings with Adequacy of Building Materials Defined by
National Standards
Adequacy of building materials refer to suitability or appropriateness of materials used in
construction. It is used to determine the quality of the physical characteristics of the building in
which households live. These characteristics include type of flooring, walls and roofings. However,
adequate building materials are crucial in controlling potential hazards associated with building
materials. It is therefore important to set construction standards which will conform to certain
essential requirements including requirements for hygiene, health and protection of environment.
Table 5.4 presents the distribution of households by
main materials used for housing construction. In
2011/12 the largest proportion of Tanzania Mainland
houses’ walls were constructed using baked/burnt
bricks (27.3 %), followed by mud bricks (24.7 %)
and mud and poles or stones (23.6 %). Larger
differences existed between Dar es Salaam and Other
Urban areas where most of the houses in Dar es
Salaam (96.9 %) had their house walls constructed
using concrete, cement bricks, and stones compared
to 25.8 % in Other Urban Areas.
It was also revealed that most of houses (42.0 %) in other urban areas were constructed using baked
or burnt bricks. In rural areas the houses with walls of concrete, cement and stones were only five
percent. Statistics in Table 5.4 makes it apparent that there has been a significant increase in the
proportion of houses constructed using mud bricks, baked or burnt bricks and concrete or cement or
stone between 2007 and 2011/12.
Overall, most of households were living in dwellings with floors made of earth (58.5 %) followed
by cement (39.4 %). However, in rural areas 77.3 % of households were in housing units with
floors made of earth. In Other urban areas, 68.4 % of the dwellings had cement floors and 30.8 %
had earth floor. It is also revealed that households living in dwellings with floor made of cement or
tiles increased by 7.6 % points between 2007 and 2011/12.

`
168
Increase in use of cement as main material used for both walls and flooring means increased
demand for cement which in turn calls for more production leading to soil degradation in quarrying
areas and ecosystem disturbance.
Table 5. 4: Percentage Distribution of Households’ by Construction Materials and Area,
Tanzania Mainland, 2000/01, 2007 and 2011/12 HBS’s
Dar es Salaam Other Urban Rural Tanzania Mainland
Construction
Material 2000/01 2007 2011/12 2000/01 2007 2011/12 2000/01 2007 2011/12 2000/01 2007 2011/12
House floor
Earth 6.7 8.7 3.2 38.3 37.1 30.8 86.6 83.1 77.3 74 67 58.5
Cement, tiles 92.4 90.4 96.5 61.1 61.9 68.4 12.5 15.6 20 25.2 31.8 39.4
Other 0.9 1 0.3 0.5 0.9 0.8 0.9 1.3 2.8 0.8 1.2 2.1
Total 100.0 100.0 100.0 100.0 100.0 100.0 100.0 100.0 100.0 100.0 100.0 100.0
House walls
Poles,
branches,
grass 0.9 1.5 0.0 5.3 4.6 0.2 19.3 16.9 1.0 16 13 0.7
Mud & poles
or stones 5.2 4.7 2.5 13.1 10.9 11.9 21.8 22 31.1 19.4 18.2 23.6
Mud only 2.2 1.9 - 12.1 10.3 - 18.1 12 - 16.1 10.7 -
Mud bricks 3.2 1.3 0.3 30.8 22.6 19 23.5 26.4 31 23.3 23.2 24.7
Baked or
burnt bricks 1.3 1.6 0.2 15.9 29.9 42 13.7 18.8 28.1 13.2 19.3 27.3
Concrete,
cement, stone 87.2 88.3 96.9 22.4 20.7 25.8 3 3.1 5.0 11.5 14.8 20.9
Other 0 0.5 0.1 0.4 1 1 0.6 0.9 3.8 0.5 0.9 2.8
Total 100.0 100.0 100.0 100.0 100.0 100.0 100.0 100.0 100.0 100.0 100.0 100.0
House Roof
Grass, leaves,
bamboo 1.1 2.1 0.8 14.3 12.3 7.4 55.7 48.2 38.6 45.8 36.8 27.5
Mud &
leaves 0.7 0.4 0.0 1.5 2.6 1.8 12.5 9.2 5.7 10.1 7.1 4.2
Concrete,
cement 3.6 1.2 0.6 0.5 0 0.3 0 0 0.1 0.3 0.1 0.2
Galvanized
metal
sheets/iron
sheets 91.7 94.4 95 81.9 84.1 88.5 31.1 41.8 54.2 42.8 55.1 66.3
Asbestos
sheets 0.5 0.3 0.4 0.3 0.3 0.3 0 0.2 0.3 0.1 0.2 0.3
Tiles 2.4 1.2 3.2 1 0.2 1.4 0.1 0 0 .2 0.4 0.2 0.8
Other 0 0.3 0.0 0.5 0.5 0.3 0.5 0.6 0.9 0.5 0.5 0.6
Total 100.0 100.0 100.0 100.0 100.0 100.0 100.0 100.0 100.0 100.0 100.0 100.0
Source: 2011/12 Household Budget Survey
“-” Data not available

`
169
Key Message
In 2015, the Tanzania Mainland
road network was 441,773 Kms.
Out of this network, 8.9 % were
paved and 91.7 % unpaved.
5.1.5- Environmental Concerns Specific to Urban Settlements
5.1.5.1: Number of Private and Public Vehicles
Improving transportation infrastructure is a key priority for
the Government. The ability of the country to upgrade and
improve its road infrastructure is one of the key factors for
economic growth. Road infrastructure is classified into four
categories: trunk/national roads, regional roads,
district/urban and feeder roads. Trunk/national roads are
primary roads or international roads/routes connecting one
region to another or region to a border or other countries.
Regional roads are secondary roads/routes connecting
centres/important centres to trunk road(s) within a region.
District/urban roads are tertiary roads providing linkage
between district headquarters to ward or important centres. Feeder roads are villages’ access roads
available in village/rural areas. Each of the defined road categories can either be paved meaning
tarmac or unpaved referring to gravel or earth roads.
Table 5.5 shows that as of 2015, Tanzania Mainland had a total of 441,773 kilometres of road
network. Out of this network, 8.9 % was paved and 91.1 % unpaved. More than a half (61.4 %) of
the road network was local roads. Trunk roads constituted the least proportion of 13.9 % of the road
network. The government intention is to further improve the road network by increasing the
network of paved roads in the country.
Despite playing a big role in economic growth, roads development too may have negative impact
on the environment. Ecological effects are the biggest disturbances on the environments caused by
roads constructions. Air pollution tends to increase with development of roads due to the associated
growth of volume of traffic on the roads. Road construction also may cause physical disturbance of
land which promotes landslides due to unstable soil and steep slopes. Paved road surfaces can
increase water discharge rates in watersheds, thus increase landslides due to floods from streams
and rivers. Furthermore, deforestation rate becomes high with improved road infrastructure as it
facilitates easy transportation of forest products such as logs and charcoal. A good example of this
is the construction of paved road from Dar es Salaam to southern regions of Lindi and Mtwara
which has increased the rate of transportation of forest products from these regions.

`
170
Key Message
From 2010 - 2016, railway lines
in Tanzania Mainland transported
about 2.7 million tons of freight
out of which 54.5 % was
transported through TAZARA.
Increased railway transport has a
good bearing on the environment
as it reduces transport carbon
related emissions.
Table 5. 5: Road Network in Kilometres by Status, Tanzania Mainland, 2010 – 2015
Category National Roads
Local Roads
Total Roads Network Year/
Road
Type
Trunk Roads Regional Roads District, Urban and Feeder
Roads
Paved Unpaved Total Paved Unpaved Total Paved Unpaved Total Paved Unpaved Overall
2010 5,377 6,822 12,199 780 20,490 21,270 842 56,798 57,640 6,999 84,110 91,109
2011 5,377 6,822 12,199 780 20,490 21,270 746 52,603 53,349 6,903 79,915 86,818
2012 6,219 5,987 12,206 1,067 20,990 22,057 1,031 53,348 54,379 8,317 80,325 88,642
2013 6,292 5,912 12,204 1,082 21,047 22,129 966 52,241 53,207 8,340 79,200 87,540
2014 6,565 6,221 12,786 1,240 20,974 22,214 988 51,676 52,664 8,793 78,871 87,664
2015 29,830 31,764 61,594 4,949 103,991 108,940 4,573 266,666 271,239 39,352 402,421 441,773
Percent 13.9
24.7
61.4 8.9 91.1 100.0
Source: TANROADS and PO-RALG
5.1.5.2: Population Using Public Modes of Transportation
5.1.5.3: Railway Transport
Table 5.6 represents the ammount of freight and number of
passengers transported by Tanzania Railways Corporation
(TRC) and Tanzania Zambia Railways (TAZARA) from
2010 to 2016. During the reference period a cumulative total
of 2,755,600 tonnes of freight were transported. Out this
transported freight, more than half (54.5 %) was transported
through TAZARA and the remaining 45.5 % through
Tanzania Railways Corporation rail line.
The freight tonnage transported by both railways kept
fluctuating, but was at its peak in 2010 when 805,000 tonnes
were transported. This is equivalent to 29.2 % of the total
tonnage of freight transported in all seven years starting
from 2010. The lowest freight tonnage of 160,000 (5.8 %)
was recorded in 2014. On the other hand, over the reference period a total of 6,854,400 passengers
were transported by both railways of which more than half (51.9 %) travelled by TAZARA and
48.1 % by Tanzania railway. The highest number of passengers, 2,147,000 persons (31.3 %) was
recorded in 2016, while the lowest number of passengers, 457,000 persons (6.7 %) was recorded in
2014.

`
171
Key Message
From 2010 – 2016, a total of
14,587 ships were operating in
three ports of Dar es Salaam,
Tanga and Mtwara. Among them,
82.0 % were operating in Dar es
Salaam port.
Due to its ability to carry large volumes of freights and number of passengers, there is potential for
reducing the transport related carbon emissions through increased use of railway as means of
transport in the country. The Government plans for construction of a standard gauge railway from
Dar es Salaam to Morogoro Region is therefore, a good start towards reducing air pollution and
accident risks caused by road transportation.
Table 5. 6: Freight and Passengers Transported by Railway, Tanzania Mainland; 2010-2016
Type of Transport 2010 2011 2012 2013 2014 2015 2016 Total
Railways Freight
(000’
tonnes) %
Passengers
(‘000’) % Tanzania Railways - - - - - - -
Freight (000 tonnes) 265 138 154 185 127 282.6 102 1,253.6 45.5 - -
Passengers (000) 284 227 339 373 170 196.4 1,707 - - 3,296.4 48.1
Tanzania Zambia
Railways (TAZARA)
Freight (000 tonnes) 540 248 259 245 33 81 96 1,502.0 54.5 - -
Passengers (000) 758 414 678 654 287 327 440 - - 3,558.0 51.9
Total- Freight (Both
Railways) 805 386 413 430 160 363.6 198 2,755.6 100.0 - -
Percent (Freight) 29.2 14.0 15.0 15.6 5.8 13.2 7.2 100 - - -
Total- Passengers (Both
Railways) 1042 641 1017 1027 457 523.4 2,147 - - 6,854.4 -
Percent (Passengers) 15.2 9.4 14.8 15.0 6.7 7.6 31.3 - - - 100.0
Source: Ministry of Works, Transport and Communication
“-” Not relevant
5.1.5.4: Marine Transport Marine transport involves both transportation of cargo and
passengers in ocean/sea. From 2010 to 2016 a total of 14,587
ships were recorded as operating or arriving from other
countries in the three major ports of Dar es Salaam, Tanga
and Mtwara, as shown in Table 5.7. Dar es Salaam port
recorded the highest proportion of ships (81.6 %) followed
by Mtwara (11.9 %) and Tanga ports (6.5 %). The highest
number of ships 4,257 (29.2 %) of the total ships in the seven
years period was recorded in 2015 while the lowest number
of 1,173 ships (8.0 %) was recorded in 2013.
Exports and imports of cargo are among major activities in the ports. Table 5.7 shows that, from
2010 – 2016, Dar es Salaam port recorded the highest proportion of cargo (92.1 %) followed by
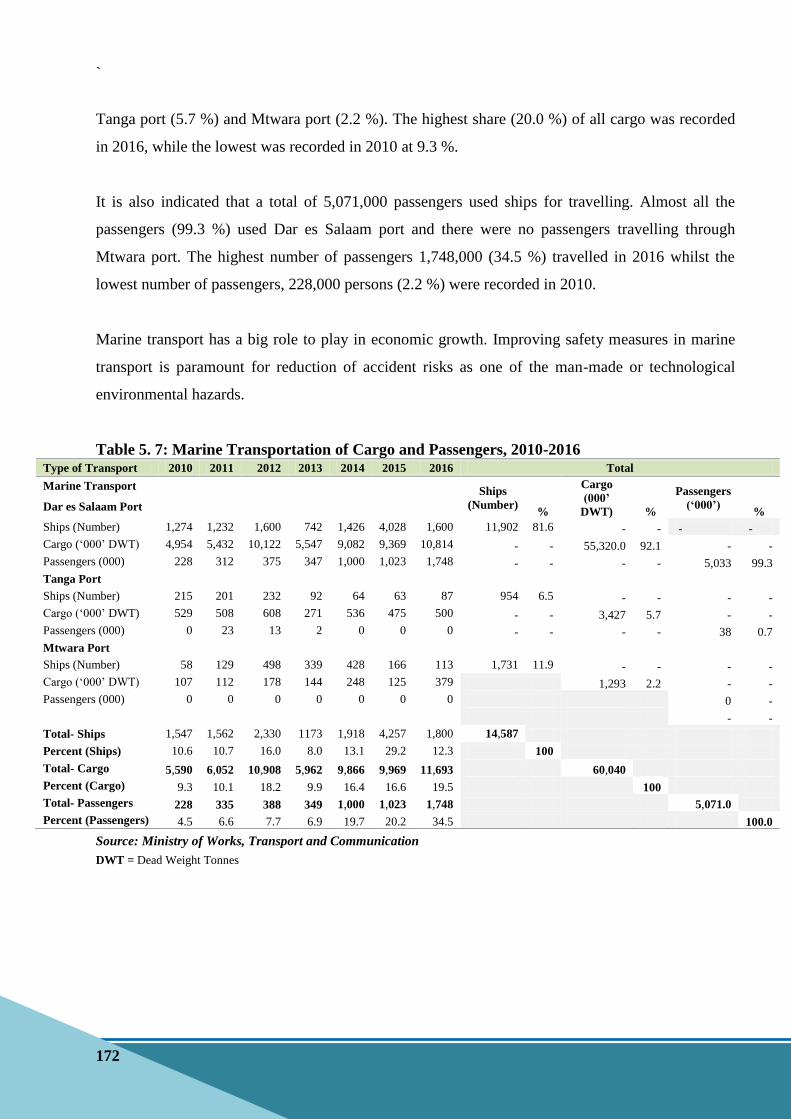
`
172
Tanga port (5.7 %) and Mtwara port (2.2 %). The highest share (20.0 %) of all cargo was recorded
in 2016, while the lowest was recorded in 2010 at 9.3 %.
It is also indicated that a total of 5,071,000 passengers used ships for travelling. Almost all the
passengers (99.3 %) used Dar es Salaam port and there were no passengers travelling through
Mtwara port. The highest number of passengers 1,748,000 (34.5 %) travelled in 2016 whilst the
lowest number of passengers, 228,000 persons (2.2 %) were recorded in 2010.
Marine transport has a big role to play in economic growth. Improving safety measures in marine
transport is paramount for reduction of accident risks as one of the man-made or technological
environmental hazards.
Table 5. 7: Marine Transportation of Cargo and Passengers, 2010-2016 Type of Transport 2010 2011 2012 2013 2014 2015 2016 Total
Marine Transport Ships
(Number) %
Cargo
(000’
DWT) %
Passengers
(‘000’) % Dar es Salaam Port
Ships (Number) 1,274 1,232 1,600 742 1,426 4,028 1,600 11,902 81.6 - - - -
Cargo (‘000’ DWT) 4,954 5,432 10,122 5,547 9,082 9,369 10,814 - - 55,320.0 92.1 - -
Passengers (000) 228 312 375 347 1,000 1,023 1,748 - - - - 5,033 99.3
Tanga Port
Ships (Number) 215 201 232 92 64 63 87 954 6.5 - - - -
Cargo (‘000’ DWT) 529 508 608 271 536 475 500 - - 3,427 5.7 - -
Passengers (000) 0 23 13 2 0 0 0 - - - - 38 0.7
Mtwara Port
Ships (Number) 58 129 498 339 428 166 113 1,731 11.9 - - - -
Cargo (‘000’ DWT) 107 112 178 144 248 125 379 1,293 2.2 - -
Passengers (000) 0 0 0 0 0 0 0 0 -
- -
Total- Ships 1,547 1,562 2,330 1173 1,918 4,257 1,800 14,587
Percent (Ships) 10.6 10.7 16.0 8.0 13.1 29.2 12.3 100
Total- Cargo 5,590 6,052 10,908 5,962 9,866 9,969 11,693 60,040
Percent (Cargo) 9.3 10.1 18.2 9.9 16.4 16.6 19.5 100
Total- Passengers 228 335 388 349 1,000 1,023 1,748 5,071.0
Percent (Passengers) 4.5 6.6 7.7 6.9 19.7 20.2 34.5 100.0
Source: Ministry of Works, Transport and Communication
DWT = Dead Weight Tonnes

`
173
CHAPTER SIX
ENVIRONMENTAL PROTECTION, MANAGEMENT AND
ENGAGEMENT
6.2. Environmental Governance and Regulation
This chapter provides a general view of government efforts towards sustaining and managing the
environment. Policymakers, analysts and civil society require statistics on environment governance
and regulation at the national level. The data on scope of these activities can inform about the
extent of institutional development, availability of resources, and the existence and enforcements of
regulatory and market instruments whose primary purpose is to protect, regulate and manage the
changing environment.
6.2.1- Institutional Strength
6.2.1.1: National Environment Management Council (NEMC)
The National Environment Management Council (NEMC) came into being in 1983 when the
Government of Tanzania enacted the National Environment Management Act No. 19 of 1983.
NEMC was established with a broad mandate in response to the national need for such an
institution to oversee environmental management issues and also implement the resolutions of the
Stockholm Conference (1972), which called upon all nations to establish and strengthen national
environment councils, so as to advise governments and the international community on
environmental issues.
The enactment of the Environment Management Act No. 20 of 2004 (EMA, 2004) by Parliament in
October 2004, repealed the National Environment Management Act No.19 of 1983 and re-
established NEMC. EMA 2004 provides for a legal and institutional framework for sustainable
management of the environment, prevention and control of pollution, waste management,
environment quality standards, public participation, environment compliance and enforcement.
Furthermore, it gives NEMC the mandate to undertake enforcement, compliance, review and
monitoring of environmental impact assessments, research, facilitate public participation in
environment decision-making, raise environmental awareness, and collect and disseminate
environment information. The objective and purpose for which NEMC is established is to

`
174
undertake environment enforcement, compliance, review and monitor environmental impact
statements, research and awareness raising.
6.2.1.2: Annual Budgets of the Main Environment Authority
A budget is the sum of money allocated for a particular purpose and the summary of intended
expenditures along with proposals for how to meet them. For many years NEMC’s budget was
dependent on the government treasury, but in 2015, the government directed NEMC to focus on
raising and utilising income from its own sources to cover its expenses, except costs for Personal
Emoluments (PE). Therefore, the council has taken several measures to expand opportunities of
revenue collection. The trend of financial resources allocated to NEMC from 2012/2013 to
2017/2018 is shown in the Table 6.1 below.
Table 6. 1: Annual Budget of the Main Environment Authority, 2012/13 – 2017/18 Year Budget (Tsh)
2012/2013 14,995,930,875
2013/2014 11,258,241,000
2014/2015 11,282,193,750
2015/2016 9,708,432,000
2016/2017 13,122,179,465
2017/2018 19,955,306,338
Source: Corporate Planning Unit (CPU)at NEMC
6.2.1.3: Number of Staff in the Main Environment Authority
Employees are valuable assets to an organization and the key to its success. The number of NEMC
staff has been changing with time due to normal reasons such as retirement, death, and other
reasons for labour turn over. The NEMC staff are divided between its headquarter and five Zonal
Offices located in Dar es salaam, Mwanza, Arusha, Mbeya and Mtwara. Table 6.2 shows the
number of NEMC staff from 2013 to 2017 and Table 6.3 shows number of staff at different NEMC
operation zones.

`
175
Table 6. 2: Number of Staff in the Main Environment Authority, 2013 - 2017 Year No of Staff
2013 137
2014 167
2015 160
2016 153
2017 142
Source: Directorate of Finance and Administration (DFA) at NEMC
Table 6. 3: NEMC Zones and Number of Staff, 2017 Zone name Eastern Zone Lake Zone Northern Zone Southern
Highlands
Zone
Southern
Zone
Regions Dar es Salaam,
Morogoro, Pwani
Tanga
Mwanza, Geita,
Simiyu,
Shinyanga,
Mara
Kagera
Arusha,
Manyara,
Kilimanjaro
Mbeya,
Sogwe, Katavi,
Iringa, Njombe
and Rukwa
Mtwara, Lindi
Ruvuma
No of staff 12 5 4 5 5
Source: NEMC
6.2.2- Environmental Regulation and Instruments
6.2.2.1: Environment Management Act No. 20 of 2004 (EMA, 2004)
The Environment Management Act (EMA) of 2004 provides the legal and institutional framework
for the sustainable management of the environment in Tanzania Mainland. It is a comprehensive
piece of legislation that includes compliance and incentive mechanisms for environmental
management from the national level to the sub-national level, involving district and village
representatives in the management of environmental resources and enforcement of the law.
6.2.2.2: Number of Applications for Licenses Received and Approved Per Year
Among the crucial functions of NEMC is to register and review Environmental Impact Assessment
(EIA) and Environment Audit (EA) for different projects. Minister of state, Vice President’s Office
Environment and Union Affairs is responsible for approving environment certificates after
receiving recommendations for the specific projects from NEMC. The number of approved EIAs
and EAs has been growing from year to year due to increase in investment activities in different
sectors and rise of environment awareness in the country. All projects with potential adverse

`
176
impacts to the environment after screening by initiating officers are subjected for EIAs. Projects
observed to have low negative impacts on the environment after the screening processes are
allowed to proceed but with some conditions. Figure 6.1 depicts statistics on approved EIAs and
EAs for the year 2013 to 2016. The number of approved EIAs and EAs increased between 2013 and
2016 from 454 to 939.
Figure 6. 1: Number of Applications for EIAs and EAs Received and Approved, 2013 - 2016
Source: NEMC
Note- EIA - Environment Impact Assessment
EA - Environment Audit
6.2.2.3: Budget and Number of Staff Dedicated to Enforcement of Environment
Regulations
NEMC has five directorates and one of them is Directorate of Environment Compliance and
Enforcement (DECE) of which staff are dedicated to compliance and enforcement of environment
regulations. The budget for this directorate mained almost constant from 2012/2013 to 2015/2016
and started to increase in 2016/17 and 2017/18 as a result of NEMC expansion of its sources of
revenue.
The number of staff from DECE changed only slightly due to new employment, retirement, death
and transfer to other directorates. Also, in a bid to increase the number of staff dedicated to
enforcement of environment regulations, the Minister has been given a mandate by law to appoint

`
177
environment inspectors from among the employees of NEMC or to designate any employee of local
authorities, ministries or any other public institution either by name or office to be an environment
inspector. Environment inspectors have more powers to deal with enforcement of environment
regulations.
Table 6. 4: Budget and Number of Staff Dedicated to Enforcement of Environment
Regulations, 2012/13 – 2017/2018 Year Budget (TZS) Number of Staff
2012/2013 344,390,000 18
2013/2014 324,390,000 22
2014/2015 326,965,000 21
2015/2016 326,965,000 17
2016/2017 633,647,500 16
2017/2018 1,930,296,000 16
Source: NEMC
6.2.3- Participation in MEAs and Environment Conventions
Tanzania being part of the international community has the obligation of ensuring that it cooperates
with the international community in addressing global environment challenges. In this regard,
Tanzania is participating in the implementation of a number of Multi-lateral Environmental
Agreements (MEAs) and other related environment conventions. The country has also ratified a
number of these MEAs through international and regional conventions aimed at addressing various
environment issues. List of MEAs ratifications is indicated in Table 6.5.
Participation in a MEA means that the country or area has become a party to the agreements under
the treaty or convention, which is achieved through various means depending on the country's
circumstances. Such circumstances include accession, acceptance, approval, formal confirmation,
ratification, and succession. Countries or areas that have signed but not become party to the
agreements under a given convention or treaty are not considered to be participating.
Tanzania is also actively participating in various international foras related to these MEAs and
projecting the national position on matters of national interest. In domesticating this MEAs
Tanzania has been formulating and implementing a number of strategies, programmes and projects

`
178
aimed at addressing environment challenges as addressed by the respective MEAs. The MEAs to
which Tanzania is a party are listed in Table 6.5.
Table 6. 5: List and Description of MEAs to which Tanzania is a Party S/N Name of MEAs Year of Ratification
1 Nagoya Protocol on Access to Genetic Resources and Benefit Sharing and the
Fair and Equitable Sharing of Benefits arising from their utilization
24th
Mar-17
2 Stockholm Convention on Persistent Organic Pollutants (POPs) 30th
April 2004
3 Convention on Sustainable Management of Lake Tanganyika 12th
June 2003
4 Cartagena Protocol on Biosafety 24th
April 2003
5 Kyoto Protocol to United Nations Framework on Climate Change 26th
August 2002
6 Rotterdam Convention on the Prior Informed Consent Procedure for Certain
Hazardous Chemicals and Pesticides in International Trade
26th
August 2002
7 Convention on Wetlands of International Importance (Ramsar Convention) 13th
August 2000
8 United Nations Convention to Combat Desertification 19th
June 1997
9 United Nations Framework Convention on Climate Change (UNFCCC) 17th
April 1996
10 Convention on Biological Diversity (CBD) 8th
Mach 1996
11 Montreal Protocol on Substances that deplete the Ozone Layer (ODS) 16th
April 1993
12 Basel Convention on the Control of Trans-boundary Movements of Hazardous
Wastes and their Disposal
7th
April 1993
13 Vienna Convention for the Protection of the Ozone Layer 7th
April 1993
14 Bamako Convention on the Ban of the Import into Africa and the Control of
Transboundary Movements of Hazardous Wastes Within Africa
17th
March 1990
15 Convention for the Protection, Management and Development of the Marine
and Coastal Environment of the Eastern African Region
15th
July 1985
16 Convention on Migratory Species (CMS) 21st October 1985
17 United Nations Convention on the Law of the Sea 30th
September 1985
18 Convention on International Trade in Endangered Species of Wild Flora and
Fauna (CITES)
29th
November 1979
Source: Vice President’s Office, MEAs Directory, April, 2007
6.3. Extreme Event Preparedness and Disaster Management
6.3.1 and 6.3.2 - Preparedness for Natural Extreme Events and Technological
Disasters
At national Level, there is a Disaster Management Department (DMD) which coordinates all
disaster management activities including preparedness for natural extreme events and technological
disasters. The following are the National Disaster Management institutional arrangements, tools
and resources which are in place for natural and technological disaster events preparedness and
disaster management.
`
179
6.3.2.1: Disaster Management Institutional Arrangement
6.3.2.2: Tanzania Disaster Management Committee (TADMAC)
Tanzania Disaster Management Committee (TADMAC) is Inter-Ministerial Committee organ,
empowered for overseeing and coordinating overall disaster and relief operations. It is supreme
body of emergency and disaster management at the national level established by Act. No.9 of 1990
and supported by Act No. 7 of 2015. The Permanent Secretary in the PMO (policy and
coordination) chairs the Committee. Members of the Committee are Permanent Secretaries from
Government disasters line Ministries and heads of Early Warning Institutions.
6.3.2.3: National Platform for Disaster Risk Reduction
Disaster Management Department formed the National Platform for Disaster Risk Reduction
(DRR) in November 2005. Members for DRR were drawn from Government Ministries,
Departments and Agencies, Civil Societies, NGOs, UN Agencies, and other DRR stakeholders.
6.3.2.4: Disaster Management Committees
Disaster Management Committees at Regional, District, Ward and Village levels have the mandate
to carryout disaster relief duties as per Act No. 9 of 1990 and Act No. 7 of 2015 and give feedback
about the general operation performance to Disaster Management Department for information
consolidation.
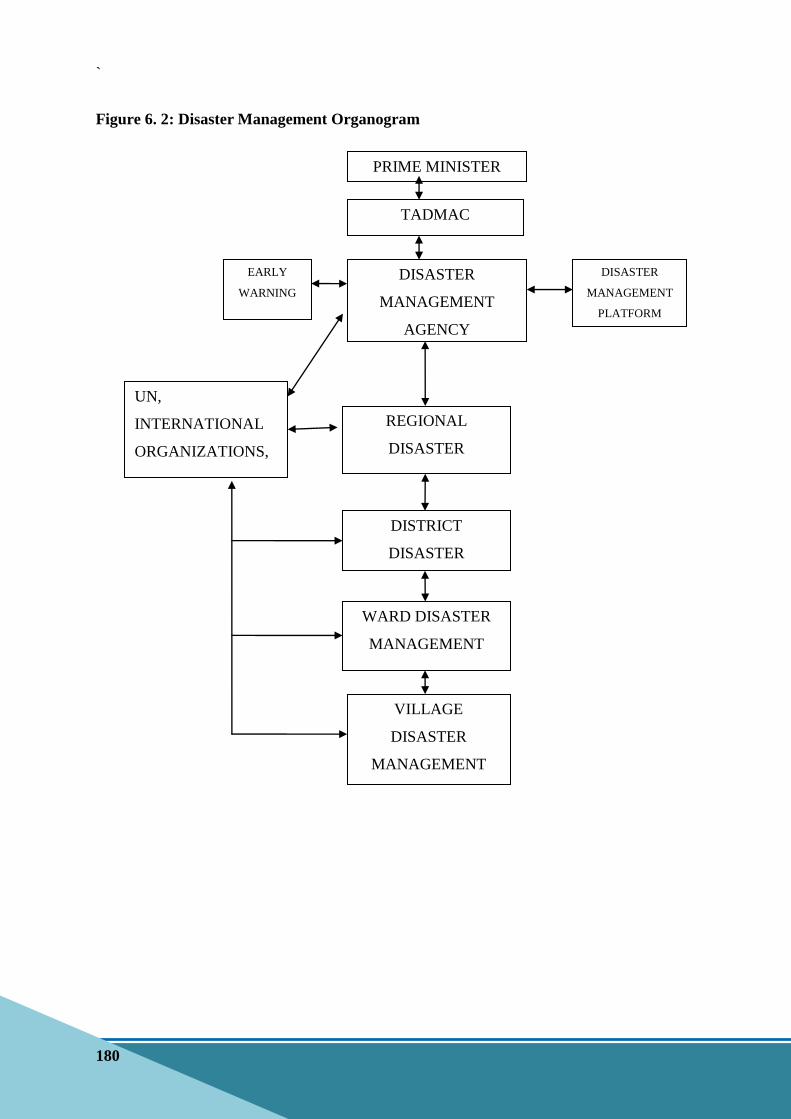
`
180
Figure 6. 2: Disaster Management Organogram
PRIME MINISTER
TADMAC
DISASTER
MANAGEMENT
AGENCY
DISASTER
MANAGEMENT
PLATFORM
EARLY
WARNING
REGIONAL
DISASTER
MANAGEMENT
COMMITTEE
DISTRICT
DISASTER
COMMITTEE
WARD DISASTER
MANAGEMENT
COMMITTEE
VILLAGE
DISASTER
MANAGEMENT
COMMITTEE
UN,
INTERNATIONAL
ORGANIZATIONS,
NGOS & PRIVATE
SECTOR

`
181
6.3.2 - Preparedness for Technological Disasters
As part of preparedness for technological disasters, the government has established the National
Disaster Management Tools and resources outlined below:-
6.3.2.1: National Disaster Management Tools
i. Disaster Management Act No. 7 of 2015;
ii. Disaster Relief Coordination Act No. 9 of 1990;
iii. National Disaster Management Policy of 2004 (Under review)
iv. National Operational Guidelines of 2014
v. Tanzania Emergency Preparedness and Response Plan (TEPRP) of 2013
vi. Tanzania Disaster Communication Strategy (TDCS) of 2013
vii. District’s Emergency Preparedness and Response Plans for eighteen (18) districts
viii. Integrated Disaster Management Training Manual (IDMTM)
ix. Disaster Rapid Damage and Need Assessment Tool and Reporting Template
x. Capacity and Need Assessment Report (2008)
xi. Vulnerability Assessment Report (2003)
6.3.2.2: National Disaster Management Resources
i. National Disaster Relief Fund - For Mitigation, Preparedness, Response and Recovery
disaster management activities
ii. Strategic Disaster Relief Warehouses located in six zones of the country stocked with non
food relief items. These warehouses are located at North Eastern (Kilimanjaro), Coast (Dar
es Salaam), Central (Dodoma), Lake (Shinyanga), Northern Highlands (Mbeya) and South
Eastern (Lindi);
iii. Emergency Operations Centre (EOC). This Department has been established to strengthen
early warning and communication for effective and efficient disaster preparedness and
response efforts. The new EOC is located in Dar es Salaam City, at Fire station building
along Morogoro road.

`
182
6.4. Environmental Information and Awareness
6.4.1- Environmental Information
6.4.1.1: National Environment Statistics Programmes
The government has been putting efforts in strengthening production of official statistics for
monitoring implementation of various development programmes. These include among others;
enactment of Statistics Act, 2015 which mandates the National Bureau of Statistics (NBS) to
coordinate production and dissemination of official statistics within the National Statistics System
(NSS) and; establishment of the Environment Statistics and Further Analysis Department at NBS in
2004 to better coordinate compilation of environment statistics within the NSS. In addition, the
need to integrate environment aspects into national development plans, policies, and strategies for
sustainable development is underscored in Tanzania’s Development Vision 2025. The Vision is
being implemented in shorter phases of Five Year Development Plans (FYDPs). For instance, about
10 % of statistical indicators for monitoring progress of the current FYDP, 2016/17– 2020/21 are
environment-related.
Other efforts undertaken in mainstreaming environment aspects include; among others, formulation
of the National Environment Policy (1997); development of the National Environment Action Plan
(NEAP, 2012 - 2017), National Environment Statistics Action Plan (NESAP, 2017/18) and
consideration of including environment statistics in the next phase of the National Strategy for the
Development of Statistics in Tanzania known as the Tanzania Statistical Master Plan (TSMP) for
2018/19 financial year. In addition, Tanzania has ratified and is implementing various Multilateral
Environment Agreements (MEAs) with the aim of ensuring global and country’s environment
sustainability.
6.4.1.2: Number and Type of Environment Statistics Products and Periodicity of
Updates
The growing pressure on environment issues and increased environmental awareness by the general
public have generated a need for reliable information on environment to facilitate scientific
planning and decision making on environment related matters.

`
183
Historical background on compilation of environment statistics dates back to 1994 when the
National Bureau of Statistics in collaboration with the Statistics Sweden compiled the first
pamphlet on Environment Statistics. Due to lack of resources, the National Bureau of Statistics
could not manage to maintain periodicity of compiling environment statistics reports. The next
publication was compiled in 2012, followed by 2014 and this publication marks the first
comprehensive National Environment Statistics Report in Tanzania Mainland which is compliant
with the international Framework for the Development of Environment Statistics (FDES 2013).
NBS is planning to update this publication after every two years and also produce environment
statistics booklet on annual basis to inform the public on the status of environment for selected high
frequency environment statistics such as climate change.
6.4.1.3: Existence and Number of Participating Institutions in Inter-agency
Environment Statistics Platforms or Committees
Environment statistics is a cross-cutting statistical domain with specific complexities. The demand
for environment statistics is increasing rapidly everywhere and its production requires combined
technical expertise on environment themes, technical and institutional coordination capacities.
Basing on the nature of compilation of environment statistics; NBS established the National
Technical Working Group (NTWG) on environment statistics (Table 6.6). Members of this group
were drawn from different institutions basing on their expertise on environmental issues. The main
objectives of the NTWG is to facilitate the harmonization of methods for compilation of
environment statistics which are in line with international standards, specifically, the Framework
for the Development of Environment Statistics (FDES 2013).

`
184
Table 6. 6: National Technical Working Group (NTWG) on Environment Statistics, 2017
S/N Name of Institution Number of
Representatives
1. Tanzania Forest Service (TFS) Agency 1
2. National Environment Management Council 1
3. Vice President’s Office 1
4. Prime Minister’s Office 1
5. Planning Commission 1
6. Dar es Salaam City Council 1
7. Ministry of Natural Resources and Tourism 1
8. University of Dar es Salaam 1
9. Ministry of Water and Irrigation 2
10. Ministry of Agriculture 2
11. Ministry of Livestock and Fisheries 1
12. Tanzania Ports Authority 1
13. Tanzania Meteorological Agency 1
14. Tanzania People's Defence Forces (TPDF) 1
15. Ministry of Energy 1
16. Ministry of Mineral 1
17. Tanzania Electric Supply Company Ltd 1
18. Tanzania Forest Research Institute 1
19. Ardhi University (ARU) 1
20. National Bureau of Statistics 6
Total 29
6.4.3- Environmental Perception and Awareness
Environmental Perception and awareness in Tanzania has increased over time attributed to the
growing understanding of the public on the importance of environment and the close link between
environment and their livelihoods. Environmental awareness proves important for several reasons;
it fosters a sense of connection to the natural world, promotes sustainable development and
encourages conservation of irreplaceable natural resources and vulnerable plant and animal species.
Environmental awareness essentially serves as an educational tool, helping people in the country
understand the economic, aesthetic and biological importance of preserving resources and reducing
or eliminating the harmful impacts of man-made alterations. It also helps the public understand the
consequences of human activities on various lands and identifies remedial solutions.
The increasing environmental awareness and perception in Tanzania has been accelerated by the
adoption of the first National Environmental Policy in 1997. The Policy among other things is
aimed at promoting public awareness and participation in environment matters. This has enabled
the formulation and implementation of a number of awareness programmes aimed at increasing

`
185
public awareness on the importance of environment conservation and sustainable use of
environment resources for their livelihoods and economic development. This has been done by both
the government and non state actors including NGOs and Community Based Organisations
(CBOs). Different strategies and mediums have been used to carry out awareness including
preparation and airing radio and TV programes, use of national and international commemoration
days, focus group discussions, newsletters, specific articles on environment in local newspapers and
involvement of leaders in environmental awareness campaigns across the country.

`
186
REFERENCES
1. PG, Dec 2013, Interim Report 2 on IWRMDP for Pangani Basin
2. WR, Nov 2013, Final Report on Water Resources Management and Development in
Wami/Ruvu Basin*1
3. RF, Dec 2015, Final Report on IWRMDP for Rufiji Basin
4. RV, Jan 2015, Final Report on IWRMDP for Ruvuma and Southern Coast Basin
5. LN, Jun 2015, Final Report on IWRMDP for Lake Nyasa Basin
6. LR, May 2016, Final Report on IWRMDP for Lake Rukwa Basin
7. LT, Jun 2015, Final Report on IWRMDP for Lake Tanganyika Basin
8. LV, May 2014, Final Report on Lake Victoria Basin Water Resources Management Plan
Phase 1 & 2
9. ID, Mar 2015, Final Report on IWRMDP for Internal Drainage Basin
10. MNRT, 1998. National Forest Policy. Ministry of Natural Resources and Tourism. Forestry
and Beekeeping Division. Dar es salaam, Tanzania. Government Press.
11. AFF. Forest Plantations and Woodlands in Tanzania. African Forest Forum Working Paper
Series. Volume 1. Issue 16, 2011.
12. MNRT, 2014. National Forest Policy. Ministry of Natural Resources and Tourism. Tanzania
Forest Services Agency. Strategic Plan II 2014/15-2018/19.
13. NAFORMA 2015. National Forest Resources Monitoring and Assessment (NAFORMA) of
Tanzania Mainland.
14. Birdlife International (2014). Country Profile- Tanzania. Available from- http-
//www.birdlife.org/datazone.country/Tanzania
15. SAN (Sustainable Agriculture Network) (2013). Interpretation of High Value Ecosystem and
Natural Ecosystem of Tanzania.
16. URT (United Republic of Tanzania) (2014). Second State of the Environment Report. Vice
President’s Office, Dar es Salaam.
17. USAID (United States Agency for International Development) (2012). Tanzania Environment
Threats and Opportunities Assessment. Dar es Salaam
18. URT, MEM (2009) National Mineral Policy. Government Publishing
19. URT, MEM (2014) Mineral sector Environment Impact Assessment (EIA) guidelines,
20. Ministry of minerals (2010) procedures for importing and exporting of minerals in Tanzania.
Available at- www.tmaa.go.tz/publications/view/procedures-for-importing-and -and-
exporting-minerals-in-Tanzania.
21. URT, Ministry of Energy and Minerals (2015) National Energy policy. Government
publisher
22. Tanzania Electric Supply Limited (TANESCO), (2017). TANESCO daily operation system
report. Unpublished paper. Ubungo, Tanzania
23. Tanzania Electric Supply Limited (TANESCO), www.tanesco.co.tz
24. Ministry of Energy and Minerals (MEM), (June, 2014). Electricity Supply Industry Reform
Strategy and Roadmap, 2014-2025. Available at- https-//mem.go.tz/tanzania-electricity-
supply-industry-reform-strategy-and-roadmap-201415/

`
187
25. Ministry of Energy and Minerals (MEM), (2016). Power System Master Plan (PSMP 2016-
Updated, 2016). Retrieved from Ministry of Energy and Minerals, United Republic of
Tanzania
26. Ministry of Energy and Minerals (MEM), (2013). Joint Energy Sector Review, Unpublished
Paper, Dar Es Salaam, August, 2013
27. Tanzania Petroleum Development (TPDC), www.tpdc-tz.com
28. Ministry of Energy and Minerals (MEM), (2014). Energy Sector- Mandate Documents.
Available at- https-//mem.go.tz/energy-sector/
29. Ministry of Energy and Minerals (MEM), (2016). Energy Quartely Bulletin Digest Report-
Available at- https-//mem.go.tz/energy-reports/
30. Petroleum (Exploration and Production) Act 1980. Available at- www.tpdc-
tz.com/psaandact1980.pdf
31. Tanzania Petroleum Development Corporation (TPDC) News, (2015). Implementation Report
for Natural Gas Infrastructure Development from Madimba-Mtwara, Songo Songo-Lindi and
Pwani to Dar Es Salaam. Retrieved at- www.tpdc-tz.com/Gasco_report.pdf
32. International Energy Agency (IEA, 2017)- Report Available at- www.iea.org/countries/non-
membercountries/tanzaniaunitedrepublicof/
33. Akwilapo, F. 2007. A comparative study on marine protected areas between Australia and
Tanzania the Nippon Foundation Fellow.
34. Daffa, J. 2011. Policy and governance assessment of coastal and marine resources sectors
within the framework of large marine ecosystems for ASCLME in Tanzania.
35. Machiwa J. F 2010 Coastal Marine Pollution in Dar es Salaam (Tanzania) relative to
Recommended Environment Quality Targets for the Western Indian Ocean.
36. TPA & TAFIRI, 2007. National report of the United Republic of Tanzania on sea level
measurements.
37. NEMC & TCMP report 2001. Tanzania State of the coast 2001 report on people and the
environment.
38. United Republic of Tanzania, 2002, The National Irrigation Master Plan
39. United Republic of Tanzania, 2010, The National Irrigation Policy
40. United Republic of Tanzania, 2013, The National Irrigation Act No. 5
41. United Republic of Tanzania, 2015, The National Irrigation Regulations
42. United Republic of Tanzania, 2002, The Comprehensive Guideline for Irrigation
Development Plan
43. United Republic of Tanzania, 2000, Tanzania Development Vision 2025
44. Government of the United Republic of Tanzania, the Environment Management Act, 2004.
45. Government of the United Republic of Tanzania, the Environment Management (Control of
Ozone Depleting Substances) Regulations, 2007.
46. Multilateral Fund for the Implementation of the Montreal Protocol, InterAgency Coordinating
Meeting “Guide for the preparation of the Surveys of ODS Alternatives”, March 2016
47. Vice President’s Office (2015), Division of Environment, National Biodiversity Strategy and
Action Plan (NBSAP) 2015-2020
48. United Republic of Tanzania (URT) 2014- Fifth National Report on the Implementation of the
Convention on Biological Diversity

`
188
49. Basic data of Agricultural Sector 2005/2006 – 2009/2010
50. National Agriculture Policy – October 2013
51. United Republic of Tanzania 2009
52. Basic data Agriculture Sector Booklet
53. Agricultural Census Report 2007/2008
54. Agriculture Annual Sample Survey Report - 2014/2015
55. Environment Resources Consultancy (ERC).,(2004) Environment Impact Assessment for
proposed Sanitary landfill at PuguKinyamwezi.
56. Senzige J.P et al., (2014) Factors Influencing solid waste generation and composition in urban
areas of Tanzania
57. R. Breeze., (2012) Improving Municipal solid waste in Dar es Salaam
58. H. Huisman et al., (2016) Expert Mission on Integrated Solid Waste Management (ISWM) to
Dar es Salaam
59. Environment Management Act., (EMA, 2004)
60. Public Health Act., (2009)
61. Dar es Salaam Recycling Policy., (2016)
62. IFDC., (2012) Tanzania Fertilizer Assessment. Alabama, USA: IFDC.
63. Jokha, M. (2015). EFFECTS OF Agricultural pesticides and nutrients residue in Weruweru
sub-catchment, Tanzania. Nairobi: Kenyatta University.