a new approach to characterizing fracture … · fracture-aperture comparator figure 10....
TRANSCRIPT

0
A NEW APPROACH TO CHARACTERIZING FRACTURE NETWORKS: AN ANALYSIS OF NATURAL FRACTURES WITHIN THE STILLWELL
ANTICLINE, WEST TEXAS
Luciana de la Rocha
A departmental senior thesis submitted to the Department of Geosciences at Trinity University.
April 19, 2013
_________________________ _________________________ Thesis Advisor Department Chair
Student Copyright Declaration: the author has selected the following copyright provision (select only one):
[ ] This thesis is licensed under the Creative Commons Attribution‐NonCommercial‐NoDerivs License, which allows some noncommercial
copying and distribution of the thesis, given proper attribution. To view a copy of this license, visit http://creativecommons.org/licenses/
or send a letter to Creative Commons, 559 Nathan Abbott Way, Stanford, California 94305, USA.
[ ] This thesis is protected under the provisions of U.S. Code Title 17. Any copying of this work other than “fair use” (17 USC 107) is
prohibited without the copyright holder’s permission.
[ ] Other:
Distribution options for digital thesis:
[ ] Open Access (full‐text discoverable via search engines)
[ ] Restricted to campus viewing only (allow access only on the Trinity University campus via digitalcommons.trinity.edu)
TABLE OF CONTENTS
ACKNOWLEDGEMENTS ................................................................................................ i
LIST OF FIGURES ......................................................................................................... ii
LIST OF TABLES ........................................................................................................... iii
ABSTRACT .................................................................................................................. iv
I. INTRODUCTION ............................................................................................... 1
II. BACKGROUND ................................................................................................. 5
Tectonic Setting ......................................................................................... 5
The Stillwell Anticline Fold System ............................................................. 8
The Santa Elena Limestone ...................................................................... 10
Fracture Formation .................................................................................. 12
Fracture Intensity .................................................................................... 13
Observational Bias in Outcrop Studies ..................................................... 14
III. RESEARCH METHODS AND DATA ................................................................... 16
Field Methods and Data ........................................................................... 17
Laboratory methods and Data ................................................................. 27
Petrographic analysis of thin sections ................................................. 27
Optical Cathodoluminescence (CL) ..................................................... 37
Scanning Electron Microscope (SEM) ...................................................... 46
IV. ANALYSIS ...................................................................................................... 55
Analysis of Fracture Variables .................................................................. 55
Normality Test ........................................................................................... 55
Two variable analysis: Kruskal – Wallis One-Way Analysis of Variance by
Ranks ......................................................................................................... 57
Observational Bias Correction .................................................................. 59
Observational bias due to orientation and observational plane .............. 60
Correction Method for bias due to rectangular observation plane ......... 62
Combination of the two weighting factors ............................................... 66
Post-weighting Fracture Orientation Distributions ................................... 67

Fracture Intensity .................................................................................... 69
V. DISCUSSION .................................................................................................. 71
VI. CONCLUSIONS ............................................................................................... 76
REFERENCES .................................................................................................. 78
APPENDIX A .................................................................................................. 83
APPENDIX B .................................................................................................. 93

i
ACKNOWLEDGMENTS
I am sincerely thankful to my thesis advisor, Dr. Benjamin Surpless, whose excellent
guidance, patience and support, from the initial to the final stages of this project, enabled
me to complete this research. I would also like to thank Dr. Kathleen Surpless for
encouraging me to start this project and for making helpful editorial suggestions as I
completed this work.
This research was funded by NSF award # 1220235 and the Murchison Summer
Research Fellowship from Trinity University. I would like to give special thanks to Mike
Pittman and Travis Smith of the Black Gap Wildlife Management Area for logistical aid and
Dr. Julia Gale from the Bureau of Economic Geology and Dr. Diane Saphire for their
intellectual support. In addition, special thanks to Rob Reed for his assistance in gathering
data on the Scanning Electron Microscope (SEM) at the Bureau of Economic Geology.
I would also like to thanks my friends Lauren Mercado and Nathan Tinker for their
support in the field and in the late nights in the Geosciences computer lab.

ii
List of Figures
Figure 1. Cross-sectional view of the Stillwell anticline, looking toward the southeast
Figure 2. Shaded relief map with major Laramide – age faults of the Big Bend region
Figure 3. Tectono-stratigraphic column of the Trans-Pecos region
Figure 4. Geologic map of the Stillwell anticline
Figure 5. Units of the Santa Elena limestone that are exposed in the Stillwell anticline
Figure 6. Diagram illustrating the influence of intersection angle on fractures counted
Figure 7. Rectangular observational plane and possible fracture orientations
Figure 8. Cross-sectional view of the Stillwell anticline
Figure 9. Fracture-aperture comparator
Figure 10. Classification of fraction morphology
Figure 11. Unit III of the mechanical stratigraphy
Figure 12. Fracture measurements at each location
Figure 13. Field photos of fractures in the Santa Elena Limestone of the Stillwell anticline
Figure 14. Field photos of fractures in the Santa Elena Limestone of the Stillwell anticline
Figure 15. Stereonet diagrams of fracture orientations
Figure 16. Cross-polarized images of full thin sections from the Forelimb
Figure 17. Cross-polarized images of full thin sections from the forelimb hinge
Figure 18. Cross-polarized images of full thin sections from the middle limb
Figure 19. Cross-polarized images of full thin sections from the back limb hinge
Figure 20. Cross-polarized images of full thin sections from the back limb
Figure 21. Photomicrograph with XPL showing thick calcite veins
Figure 22. Photomicrograph with XPL showing different type of fractures
Figure 23. Photomicrograph with XPL showing the presence of dolomite
Figure 24. PPL and SEM-CL images from the forelimb
Figure 25. PPL and SEM-CL images from the forelimb hinge
Figure 26. PPL and SEM-CL images from the middle limb
Figure 27. PPL and SEM-CL images from the back limb hinge
Figure 28. PPL and SEM-CL images from the back limb
Figure 29. EDS elemental graphs from the forelimb
Figure 30. BSE images from the forelimb
Figure 31. EDS elemental graphs from the forelimb hinge
Figure 32. EDS elemental graphs from the middle limb

iii
Figure 33. Element maps
Figure 34. EDS elemental graphs from the back limb hinge
Figure 35. Graphical Methods to test normal distributions
Figure 36. Angular relationships between bed, observation surface, and horizontal
Figure 37. Angular relationship between a given fracture and the observation surface
Figure 38. Hypothetical map view of the rectangular observation plane after the plane has been rotated to horizontal
Figure 39. Apparent strike values (Sa) and corresponding length values for fractures of 0, 90, 180,
and 270
Figure 40. Four post-rotational strike (Sr) orientations
Figure 41. Angular ranges for Sr values that lie between known observational lengths
Figure 42. . Stereo net diagrams with fracture orientation data and contours of high density regions
Figure 43. Relationship of fracture aperture and fracture intensity
Figure 44. Kinematic model of the Stillwell snticline
Figure 45. Fracture network connectivity.
List of Tables
Table 1. Angle intervals and rating factors (Palmstrom, 1995)
Table 2. Characteristics of beds at each structural position
Table 3. Summary of field-based fracture data
Table 4. Orientation of high density fracture sets
Table 5. Kruskal Wallis results
Table 6. Angle intervals and calculated rating factors based on 1/sin .
Table 7. Summary of rating factors for fracture observations within a rectangular area
Table 8. Summary of statistical data

iv
ABSTRACT
In the past twenty years, the fracture research field has experienced exponential
growth, but there is still debate about how to best sample and characterize natural fracture
networks. A vast majority of studies lack a comprehensive evaluation of variables that
control fracture behavior, and few studies take into account either fracture aperture or
observational bias in the characterization of fracture systems. In addition, most fracture
research has been limited to either the microscopic or macroscopic scale. I investigated
fracture networks at the transition between the micro- and macroscopic scale at the well-
exposed Stillwell anticline in west Texas. The excellent cross-sectional exposure of the
asymmetric anticline provided the opportunity to analyze fracture systems within a single
limestone bed at different structural positions, including the forelimb, the forelimb hinge,
the middle limb, the backlimb hinge, and the backlimb. At each structural position, I
measured fractures’ orientation, fill, morphology, length, and aperture within a rectangular
observation area. Because observational bias can strongly affect outcrop data, I used a new
multi-step method to account for the unequal probability of encountering fractures based
on each fracture’s orientation relative to the observation plane and the orientation of each
fracture within the rectangular shape of observation area. Based on these relative
orientations, I weighted each fracture, assigning an integer-based correction factor. Optical
imagery showed that these fracture systems are mostly composed of calcite veins with
multiple generations of fracture fill. Statistical data suggest that fracture intensity, aperture,
and fracture length data are significantly different at each structural position, and fracture
intensity appears to be directly related to strain. In fold hinges, where bed curvature is

v
greatest, fracture intensities are highest and fracture lengths are lowest. In contrast, in the
forelimb, where shear strain is at a maximum, fracture intensity is lowest and fracture
lengths are highest. This suggests that fracture initiation and propagation are strongly
affected by structural position, which is likely controlled by the how stresses are applied to
limestone beds throughout the formation of the fold system. These results demonstrate
that analysis of fracture networks at a transitional scale can provide significant insight about
fracture systems and their evolution at different positions in a fold system. In many low
porosity oil and gas reservoirs, natural fractures control the permeability of the system, so
these results might also help predict permeability changes in similar subsurface fold
systems.

1
I. INTRODUCTION
Natural fractures and their geologic characteristics control the hydraulic behavior of
both hydrologic and petroleum reservoirs. A better understanding of fracture systems
would help optimize the recovery of natural resources from fracture reservoirs (e.g.,
Hennings et al., 2000). Therefore, it is imperative to develop a reliable detection and
characterization model of fracture systems for the quantification of permeability. Fracture
network evolution can be affected by lithology, bed thickness, mechanical stratigraphy,
proximity to faults, structural position, the presence or absence of interlayer slip,
recrystallization, cataclasis and dissolution-reprecipitation processes (e.g., Price, 1959;
Stearns, 1968; Stearns and Friedman, 1972; Ladeira and Price, 1981; Nelson, 2001; Naar,
1996; Couples and Lewis, 1998; Underwood et al., 2003; Smart et al., 2009), so developing
transferable models for fracture network development has been an ongoing challenge in
structural geology.
In the past twenty years, the fracture research field has experienced exponential
growth, with many studies focused upon the relationships between fracture intensity,
orientation, fill, and length (e.g., Lonergan, 1999; Marrett et al., 1999; Nelson 2001; Casey
and Butler, 2004). Most of these studies have been scale-dependent, focusing either on the
microscopic or macroscopic scale (e.g., Ortega et al., 2006). Although fracture intensity is
one of the key parameters that determine fluid flow in low permeability lithologies (e.g.,
Ortega et al., 2006; Hooker et al., 2009; Ortega et al., 2010), few studies take into account
fracture aperture in their measurements of fracture intensity, a quantity that varies across
at least six orders of magnitude in natural systems (Ortega et al., 2006; Hooker et al., 2009;

2
Marrett, 1996). Since fluid flow is fundamentally controlled by the percentage of void space
in a rock, fracture aperture will have a significant and quantifiable effect on permeability.
In addition, there is still debate in the literature about the relationship between
fracture intensity and fold development. Many outcrop-based studies support a positive
correlation between fracture intensity and layer curvature (e.g., Murray, 1968; Lisle, 1994:
Stewart and Podolski, 1998). However, other workers posit that a significant number of
factors affect fracture intensity, demonstrating that the positive correlation does not hold
true in all cases (e.g., Hennings et al., 2000, Bergbauer, 2007; Keating and Fischer, 2008). In
order to perform a comprehensive analysis of fracture systems at different structural
positions in a fold system (e.g., forelimb, forelimb hinge, middle limb, backlimb hinge, and
backlimb), I have performed statistical analyses that take into account most important
factors that affect permeability. A better understanding of fracture intensity at different
structural positions would improve the prediction of changes in permeability within a
specific reservoir.
Although there have been thousands of studies of fracture systems, there is still no
reliable method to collect fracture data in outcrop that can be easily transferred to the
subsurface (e.g., Terzaghi, 1965, Palmstrom and Stromme, 1996). Observational sampling
bias in outcrop data collection is a problem that can introduce significant error. The
likelihood of a fracture intersecting a sampling domain depends on many factors, such as
the relative orientation of the fracture with respect to the observational plane, the shape
and length of the fracture, and the size and shape of the observational plane (e.g.,
Palmstrom and Stromme, 1996). In order to accurately calculate fracture intensity, to

3
analyze fracture systems, and to provide accurate analogs for subsurface studies, all
outcrop data must be corrected for known sampling biases.
I studied fractures at the macro-microscopic (intermediate) transitional scale within
the well-exposed Stillwell anticline, a Laramide-age fold system hypothesized to have
formed due to the propagation of an en echelon blind thrust fault system (e.g., Surpless and
Quiroz, 2010; Surpless et al., 2012). Previous workers showed that different segments of the
fold system preserve geometrically different but well-defined fold geometries related to
variations in thrust fault propagation displacements (Surpless and Quiroz, 2010; Surpless et
al., 2012). The dissection of the fold by a significant creek system provides easy access to
the different structural positions from a geometrically simple segment of the anticline (Fig.
1). This excellent exposure permitted investigation of fractures from a single limestone bed
at different structural positions, including the backlimb, middle limb, forelimb, and the
hinges between those limbs (Fig. 1), thus providing the opportunity to evaluate fracture
characteristics (i.e., intensity, aperture, fill, and length) relative to structural position.
Figure 1. Cross-sectional view of the Stillwell anticline, looking towards the southeast. A creek has dissected the
fold, permitting access to limestone beds at all structural positions.

4
The analysis of fracture systems was guided by several key questions:
1. Can fracture analysis at the intermediate scale provide insights about the evolution of fracture systems in the subsurface?
2. Are there quantifiable relationships between fracture orientation, fracture aperture, fracture length, and fracture intensity?
3. How do fracture characteristics vary at different structural positions within a fold system?
4. Can outcrop observational biases be reduced to the point that the information provided by outcrop studies provides accurate baselines for subsurface analysis?
To answer my research questions, I collected fracture data from nearly identical
limestone beds in five different structural positions of the Stillwell anticline, and I collected
hand samples from each location for subsequent analysis. For each in situ fracture, I
measured aperture (width), orientation, morphology, fill, and x-y position (relative to an
established position within the bed). I used thin section petrography, optical
cathodoluminescence (CL) analysis, and scanning electron microscopy (SEM) elemental
detection spectrometry (EDS) and backscattered electron (BSE) imagery to document the
fracture systems present. In order to account for potential observational biases, I used a
new weighting method to correct the sampled data. I used these data to perform fracture
intensity analysis and to complete a range of statistical analyses to obtain information
about relationships between fracture variables and the implications of these relationships
for fracture network evolution.
5
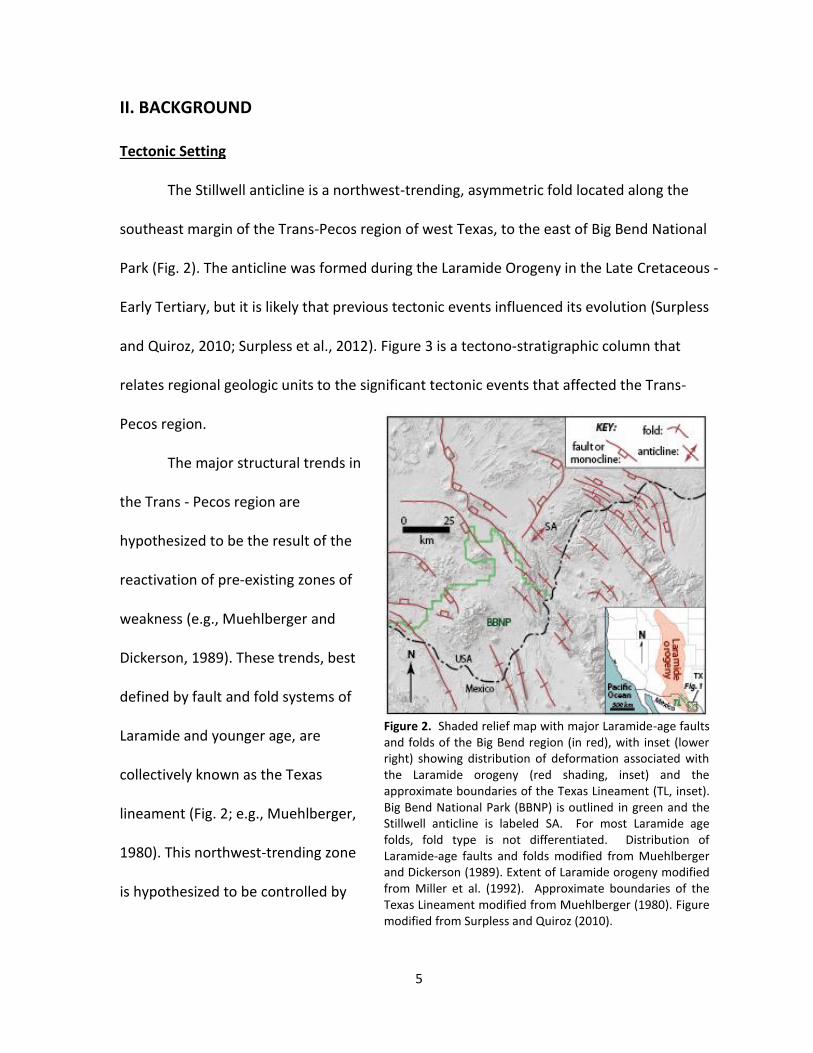
Figure 2. Shaded relief map with major Laramide-age faults and folds of the Big Bend region (in red), with inset (lower right) showing distribution of deformation associated with the Laramide orogeny (red shading, inset) and the approximate boundaries of the Texas Lineament (TL, inset). Big Bend National Park (BBNP) is outlined in green and the Stillwell anticline is labeled SA. For most Laramide age folds, fold type is not differentiated. Distribution of Laramide-age faults and folds modified from Muehlberger and Dickerson (1989). Extent of Laramide orogeny modified from Miller et al. (1992). Approximate boundaries of the Texas Lineament modified from Muehlberger (1980). Figure modified from Surpless and Quiroz (2010).
II. BACKGROUND
Tectonic Setting
The Stillwell anticline is a northwest-trending, asymmetric fold located along the
southeast margin of the Trans-Pecos region of west Texas, to the east of Big Bend National
Park (Fig. 2). The anticline was formed during the Laramide Orogeny in the Late Cretaceous -
Early Tertiary, but it is likely that previous tectonic events influenced its evolution (Surpless
and Quiroz, 2010; Surpless et al., 2012). Figure 3 is a tectono-stratigraphic column that
relates regional geologic units to the significant tectonic events that affected the Trans-
Pecos region.
The major structural trends in
the Trans - Pecos region are
hypothesized to be the result of the
reactivation of pre-existing zones of
weakness (e.g., Muehlberger and
Dickerson, 1989). These trends, best
defined by fault and fold systems of
Laramide and younger age, are
collectively known as the Texas
lineament (Fig. 2; e.g., Muehlberger,
1980). This northwest-trending zone
is hypothesized to be controlled by

6
deep structures that initially formed during rifting events in the late Proterozoic (e.g.,
Muehlberger and Dickerson, 1989; Page et al., 2008). Following early rifting and subsequent
marine deposition, the Late Paleozoic Ouachita orogeny resulted in faulting and folding of
the deep-water ocean basin rocks of the Trans-Pecos region (e.g., Page et al., 2008). Despite
north-directed collision, the structures created by the orogeny formed sub-parallel to the
present-day Texas lineament (e.g., Muehlberger and Dickerson, 1989; Page et al., 2008).
In the late Triassic, rifting between the North and South American Plates began to
form the Gulf of Mexico (e.g., Muehlberger, 1989; Page et al., 2008). By Cretaceous time,
the Trans-Pecos region had become a shallow marine environment, resulting in deposition
of both shale and more resistant limestone formations such as the Glen Rose limestone, the
Del Carmen limestone, the Sue Peaks Formation, the Santa Elena limestone, the Del Rio
claystone, and the Buda limestone (e.g., St. John, 1965; 1966; Moustafa, 1988; Page et al.,
2008).
From the Late Cretaceous through the Early Tertiary, the relatively shallow
subduction of the Farallon plate under the North American Plate affected much of the
Western U.S., including the Trans-Pecos region (e.g., Dickinson, 1981; Muehlberger, 1989;
Page et al., 2008). The east-directed compression resulted in the thick skinned Laramide
Orogeny (Fig. 2, inset), with deformation characterized by basement-core uplifts of pre-
fractured anisotropic basement blocks (e.g., Miller et al., 1992; Liu et al., 2010). In the
Trans-Pecos region, this tectonic event formed northwest trending monoclines and
anticlines sub parallel to the Texas Lineament and at an oblique angle relative to the
maximum stress (Fig. 2; e.g., Moustafa, 1983; 1988; Maler, 1990; Surpless and Quiroz,

7
Figure 3. Tectono-stratigraphic column of the Trans-Pecos region. The column relates
geologic rock units to the major tectonic events that have affected the region (from
Page et al., 2008).
2010). Most basement-involved, fault-related anticlines of the Laramide Orogeny are
characterized by narrow, steeply-dipping forelimbs and expanded, gently dipping backlimbs
(e.g., Stone, 1993), features shared by the Stillwell anticline (St. John, 1965; Moustafa, 1983;
1988; Surpless and Quiroz, 2010).

8
By middle to late Cenozoic time, collision of the North American and South American
Plates ceased and Basin and Range extensional faulting affected the Trans-Pecos region
(e.g., Page et al., 2008). During this time, the Trans-Pecos region was subject to volcanic and
plutonic activity. However, there is no evidence that any post-Laramide tectonic events
affected the Stillwell anticline (St. John, 1965; Surpless and Quiroz, 2010; Mays et al., 2012;
Surpless et al., 2012).
The Stillwell anticline fold system
The Stillwell anticline is an 8000 m long, 550 m wide and 250 m high asymmetric,
northeast-vergent fold best defined by the resistant Cretaceous Santa Elena limestone (St.
John, 1965; 1966; Surpless and Quiroz, 2010; Mays et al., 2012). The fold axis trends about
N40W and is divided into a North segment, a South segment and a transition zone that
displays three prominent left steps within a 2 km zone between segments (Fig. 4; Surpless
and Quiroz, 2010; Mays et al., 2012; Surpless et al., 2012). This map-view fold geometry was
most likely created by a shallow, subsurface en echelon thrust fault system, with complex
interactions at depth (Mays et al., 2012; Surpless et al., 2012).
Previous studies suggest that the Stillwell anticline is likely a classic fault-
propagation fold (Surpless and Quiroz, 2010; Mays et al., 2012; Surpless et al., 2012), with
cross-sectional geometries that can be related to stages of ramp-flat fault propagation.
Although most locations along the anticline system reveal a shallowly dipping backlimb to
the southwest and a steeply dipping forelimb to the northeast (Mays et al., 2012), perhaps
the best-exposed cross-sectional view of the system, shown in Figure 1, displays a geometry
that includes a backlimb, middle limb, and a forelimb.

9
Figure 4. Geologic map of the Stillwell anticline. The northwest trending anticline consists of a north and south segments with a transition zone that displays left en echelon fold axis geometry (Surpless and Quiroz, 2010; Mays et al., 2012).
Kinematic analysis by Mays et al.
(2012) indicated a total flat-ramp
propagation of approximately 200
meters, with slip accommodated primarily
along a decollement within the underlying
Sue Peaks Formation that propagated
upward to the northeast along a ramp
segment within the Santa Elena
limestone. The results of this two-
dimensional modeling also suggest that
the forelimb and adjacent hinge zone of
the anticline are the areas of greatest
shear strain (Mays et al., 2012). Related
to this work, other workers have shown

10
that strain within the anticline is likely accommodated by deformation mechanisms such as
ductile thickening, intra-bed faulting, and interlayer slip, in addition to fracturing (Hoin et
al., 2012; Surpless et al., 2012), which may have implications for fracture analyses based on
structural position.
In the north segment of the Stillwell Anticline, a stream has dissected the fold
systems across the A – A’ line, providing an excellent cross-sectional view of the Stillwell
anticline (Fig. 1). At this location the anticline is asymmetric, with a shallowly-dipping
backlimb and a steep forelimb (Surpless and Quiroz, 2010; Mays et al., 2012). Individual
limestone beds and mechanical layers can be traced along the entire cross-sectional view.
Therefore, this location was subject to many macro-scale structural studies, as well as
detailed analysis of the mechanical stratigraphy of the Santa Elena limestone (Mays et al.,
2012; Hoin et al., 2012; Surpless et al., 2012; Tinker et al., 2013).
The Santa Elena limestone
The 56 meter thick cross-sectional exposure of the Stillwell anticline is characterized
by relatively resistant Santa Elena limestone beds (Tinker et al., 2013). The massive 1-3
meters thick limestone beds interbedded with thinner 1 meter thick shale beds suggest a
neritic shallow reef depositional environment (Hoin et al., 2012). Previous studies of the
exposed stratigraphy have documented bed thickness, lithology, compressive strength,
macroscopic fracture intensity, and joint orientations for each exposed limestone bed
(Mercado and Surpless, 2012; Tinker et al., 2013). These workers concluded that a majority
of the exposed beds are composed of a light tan to light grey, fine to medium grained
limestone and have no significant variation in compressive strength. Figure 5 shows the

11
exposed Santa Elena stratigraphy in the middle limb of the anticline. Tinker et al (2013)
suggest that mechanical units with thinner average bed thickness are less resistant to
weathering. However, thinner beds display significantly greater fracture intensity relative to
thicker beds. Tinker et al. (2013) suggest that topographic profile within this section of the
Santa Elena limestone is controlled by relative fracture intensity and bed thickness (Tinker
et al., 2013).
Figure 5. Units of the Santa Elena limestone that are exposed in the Stillwell anticline. Units were
divided based on slope profiles (Mercado and Surpless, 2012).

12
Fracture Formation
Fractures are a type of brittle deformation in which rocks or minerals break due to
applied stress (e.g., Twiss and Moores, 1992). Fractures form as a result of applied
differential stress exceeding the strength of the rock, which is primarily controlled by
composition. Each rock type has an experimentally-determined failure envelope that
describes the critical strength of the material over a range of differential stresses (e.g.,
Twiss and Moores, 1992). However, the failure envelope can be shifted by changes in
temperature, strain rate, confining pressure, and pre-existing weaknesses (e.g., Fossen,
2010).
Fractures are classified by the relative motion that occurs during fracture formation.
Shear fractures are defined by a nearly parallel displacement of the fracture surface relative
to the principal stress. In contrast, extension fractures display a displacement perpendicular
to the maximum principal stress (e.g., Paterson and Wong, 2005). Therefore, classifying
different types of fractures in a formation gives information about the state of stress and
strain during fracture formation.
It is important to note that failure is the culmination of a progressive development
of cracking during loading, rather than catastrophic spread of a single crack at a peak stress
(Paterson and Wong, 2005). Analyses of rock failure and fracture propagation must take
into account several factors: (1) the location and orientation of micro-crack initiation; (2)
subsequent growth of individual micro-cracks with increased loading; (3) the increased
number of micro-cracks with increased loading; (4) the interactions between growing micro-
cracks as their lengths and numbers increase; and (5) the stability of the crack proliferation

13
process and the possibility of its localization, leading to macroscopic failure (Paterson and
Wong, 2005). Understanding such microfracturing mechanisms of initiation and spread is
crucial for the understanding of porosity and permeability in rocks.
Fracture Intensity
Fluid flow through rocks depends on the number of fractures present, their aperture
width, and their connectivity (e.g., Ortega et al., 2006; Tran, 2007). Fracture intensity,
defined as the amount of fractures per unit of length, is one of the key parameters used to
quantify permeability of rocks. There are many challenges that scientists face when trying
to measure fracture intensity in the subsurface. For example, fracture data are commonly
obtained from boreholes, but large fractures are commonly widely spaced, so the
probability of encountering such fractures is low (Laubach, 2003; Laubach et al., 2004).
Research has shown that small-scale fractures can be treated as proxies for the occurrence
of larger fractures (Ortega et al., 2010). Therefore, a systematic measurement of fractures
across scales allows scientists to compare fracture systems and intensity to geological
controls such as structural position, texture, composition and stratigraphic position (e.g.,
Nelson and Serra, 1995; Ortega et al., 2006).
In addition, previous studies of fracture intensity have failed to account for fracture
aperture size (Ortega et al., 2006). Opening size of fractures in the sub-surface vary across
at least six orders of magnitude (Gillespie et al., 1993; Marret et al., 1999). The total volume
of fractured rock relative to intact rock can be dramatically different within formations with
equal number of fractures but different aperture ranges. Therefore, it is much less accurate

14
Figure 6. Diagram illustrating the influence of intersection angle, on the number of fractures counted on a given observation surface. In both A. and B., the fracture spacing, d, is the same. A. demonstrates a relatively large angle of intersection and a correspondingly large number of fractures that intersect the surface, while the fractures shown in B. have a smaller angle of intersection and a correspondingly small number of fractures that intersect the surface. (Surpless, 2013).
and meaningful to quantify fracture intensity without including fracture aperture as part of
any calculation (Ortega et al., 2006).
Observational Bias in Outcrop Studies
Rock fractures typically cannot be observed in a complete three dimensional form,
but rather as traces on the surface of an outcrop, rock core, or mine wall (e.g., Mauldon et
al., 2001). Characteristics of fracture systems are commonly inferred from fracture trace
parameters, such as fracture trace intensity and length (e.g., Mauldon et al., 2001). The
measurement and subsequent analysis of fracture features may be subject to significant
error due to unintentional censoring and length bias on an observational plane (e.g.,
Terzaghi, 1965; Palmstrom, 1996). The orientation of a surface of observation strongly
influences the number of fractures sampled (e.g., Terzaghi, 1965; Palmstrom and Stromme,
1996). It is known that fractures perpendicular to the plane of observation have a higher
probability of intersecting such a plane. Therefore, fractures with an acute angle relative to
the observational plane will be less likely to be observed (Figs. 6A and 6B).

15
In order to account for this observational bias, many geologists like Palmstrom
(1995) developed a weighted joint density (wJd) method which includes a rating factor (fi)
to account for the bias. To simplify use of this rating factor, Palmstrom (1995) divided the
angles of intersection into four ranges (Table 1). With this scheme, each fracture is
weighted according to the corresponding rating factor, which accounts for differences in the
angle of intersection.
Fracture data obtained from outcrops should also be corrected for the error related
to the shape of the observational plane. As with the angle of intersection between the
fracture planes and the observation plane, the two-dimensional angle of intersection
between the fracture-plane line of intersection and the shape of the rectangle also affects
the number of fractures that can be observed. Figure 7 shows the orientations of four
different fracture orientations on the observation plane and where the fracture plane and
the observation plane intersect at a line. As Surpless (2013) explains, fractures oriented
similar to fracture 1 (red fracture in Fig. 7) have the lowest probability of being observed,
based on the length along which fractures of that orientation can intersect (1, dashed red
line perpendicular to fracture 1). Fractures oriented at a position of either example of
fracture 3 (green fracture in Fig. 7) have the highest probability of being observed, based on
Table 1. Angle intervals and rating factors (Palmstrom, 1995)
Angle () between fracture and observation surface
Rating factor (fi)
>60 1
31 - 60 1.5
16 - 30 3.5
<16 6

16
the length along which fractures of that orientation can
intersect the area of observation (3, dashed green
lines perpendicular to either fracture 3). Intermediate
between those orientations are fractures oriented like
fracture 2 (blue, Fig. 7), which would intersect the area
of observation along length 2 (dashed blue line
perpendicular to fracture 2; Surpless, 2013).
In order to avoid this type of observational bias,
geologists try to use circular observational surface
areas, so that the probability of observing a fracture in
any orientation is equal for all fractures (Mauldon et
al., 2001). In a circular observational plane, 1, 2, and
3 would all be equal to the radius of the circle. With
equal observational lengths, the probability of
encountering fractures at any location and orientation
would be the same, so an observational bias related to
the dimensions of the observational surface can be
avoided.
III. RESEARCH METHODS AND DATA
To answer my research questions, I collected data from fracture systems at five
different structural positions within nearly identical limestone beds of the Stillwell anticline.
I also used field photography, thin section petrography, Optical Cathodoluminescence (CL)
Figure 7. Rectangular observational plane and possible fracture orientations. Solid lines represent possible fracture orientations (from Surpless, 2013).

17
Figure 8. Cross-sectional view of the Stillwell anticline, indicating the Santa Elena unit (Unit III in Figure 5)
chosen for measurements and the locations of fracture observations. Numbers indicate different structural
positions. Location 1 is the forelimb. Location 2 is the forelimb hinge. Location 3 is the middle limb. Location
4 is the backlimb hinge. Location 5 is the backlimb.
imagery and Scanning Electron Microscopy (SEM) to document characteristics of the
fracture systems present. Moreover, I performed statistical analyses with the goal of
quantifying the relationships between the fracture variables measured.
Field Methods and Data
I collected data about fracture systems from transitional – scale within a Santa Elena
limestone beds at different structural positions within the Stillwell Anticline. These
structural positions included the forelimb (location 1), the middle-forelimb hinge (location
2), the middle limb (location 3), the middle-backlimb hinge (location 4), and the backlimb
(location 5; Fig. 8). Limiting sampling to different structural locations within the same
limestone beds enabled me to keep composition, stratigraphic position, depositional
environment and bed thickness constant.
For this transitional – scale analysis, I documented five fracture characteristics,
including the position of the fracture within the observational area, fracture orientation,
fracture aperture, fracture length, fracture morphology and fracture fill. I chose
observation locations with significant surface relief in order to best observe the three-

18
Figure 9. Fracture-aperture comparator (from Ortega et al., 2006; not to scale).
dimensional orientation of each fracture. Below, I define the five fracture variables
measured in the field:
X-Y position: I measured the relative horizontal location of each fracture by making the
left-most fracture horizontal position 0 (zero). I labeled all fractures by hand and took
digital images of each location. I obtained the vertical location of each fracture using bed
scale photographs. The lower bedding plane was used as vertical reference point 0 (zero).
Orientation: I measured dip azimuth and dip of each fracture.
Fracture Aperture: I measured opening displacements of fractures using the
logarithmically graduated fracture-aperture comparator of Ortega et al. (2006; Fig. 9). I
used this tool with a hand lens to measure fractures in the range from 0.05 to 5 mm
aperture. The comparator contains lines with increasing width starting at 0.005 mm and
ending at 5 mm. Because fracture aperture has a logarithmic relationship with fracture
intensity, increments measured by the comparator are evenly spaced on a logarithmic
scale (Ortega et al., 2006).

19
Figure 10. Classification of fraction morphology. 1
is planar; 2 is sub-planar; 3 is sinuous.
Fracture Length: I measured the length of
each fracture with a ruler.
Fracture Fill: I described each fracture as
filled, not filled, or partially filled.
Fracture Morphology: I classified each
fracture as planar, sub-planar, or sinuous
(Fig. 10).
Because previous research indicates that fracture intensity changes very little above
one hundred measurements (Ortega et al., 2006), I measured a minimum of two hundred
fractures at each location. In addition, I took field photographs at the outcrop scale, as well
as detailed fracture photographs with a Bodelin Proscope HR with a 50X macroscopic lens.
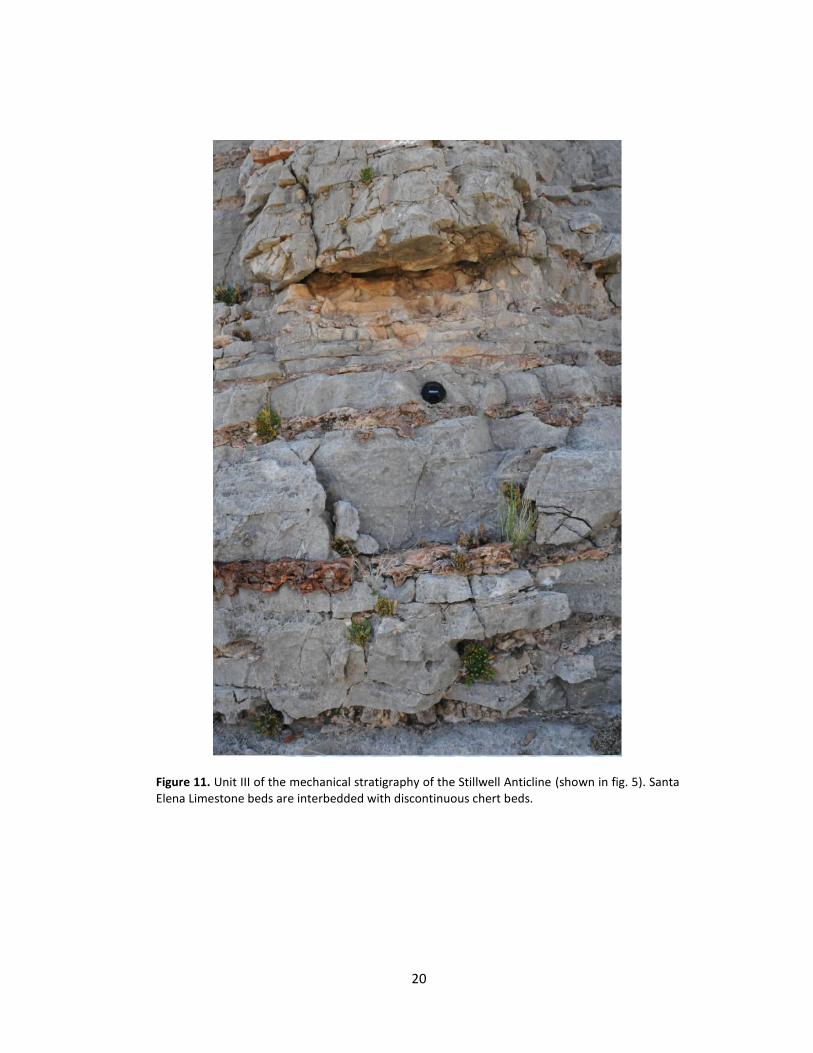
All data were collected from a dense, uniform, light gray lithographic limestone bed
in Unit III of the mechanical stratigraphy that was traced at throughout the fold formation
(Fig. 8). This unit consists of limestone layers with discontinuous nodular chert interbeds
(Fig. 11). Within unit III, the limestone bed selected at each structural position had
approximately the same thickness and nearly identical lithological characteristics. I
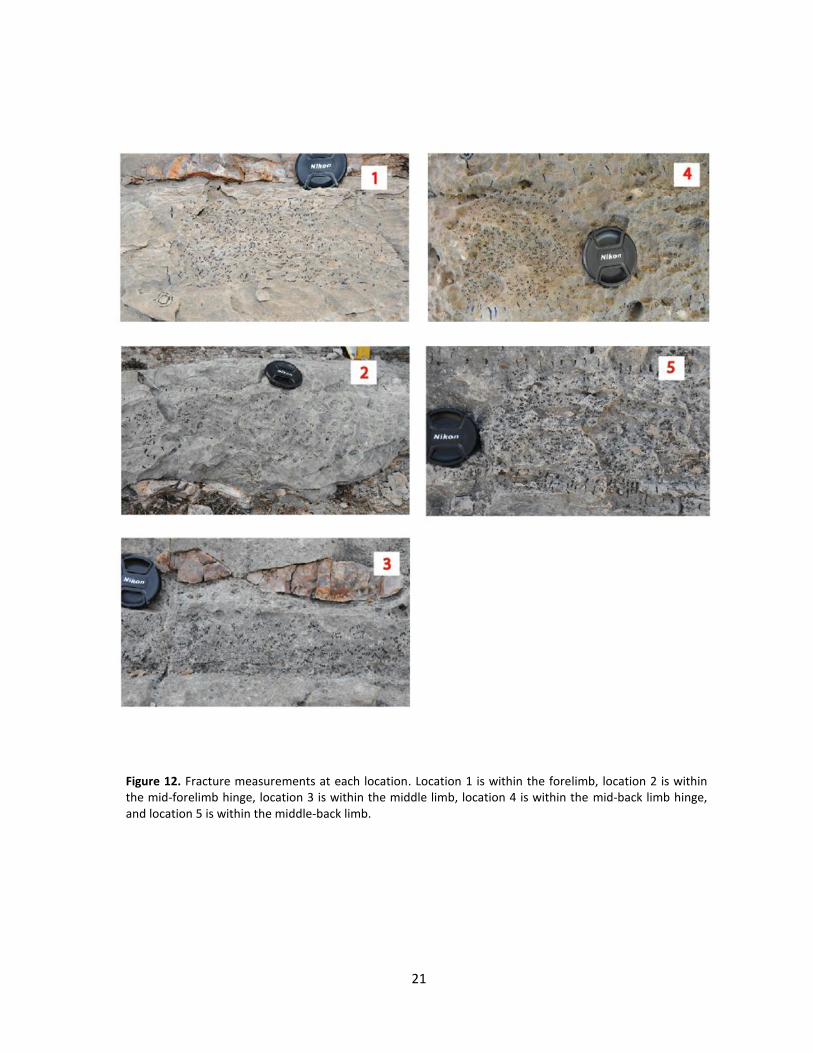
measured 5 variables for each of 1025 fractures (including all structural positions). Results
are in Appendix A. Figure 12 shows the marked fractures from the outcrop at each
structural position. The average bed thickness was 12 cm, and although the average
stratigraphic position above the base of Unit III varied, the bed lithologies from the five
structural positions were nearly identical. Table 2 shows the characteristics of the bed at
each structural position.
20
Figure 11. Unit III of the mechanical stratigraphy of the Stillwell Anticline (shown in fig. 5). Santa Elena Limestone beds are interbedded with discontinuous chert beds.
21
Figure 12. Fracture measurements at each location. Location 1 is within the forelimb, location 2 is within the mid-forelimb hinge, location 3 is within the middle limb, location 4 is within the mid-back limb hinge, and location 5 is within the middle-back limb.

22
Table 2. Characteristics of beds at each structural position
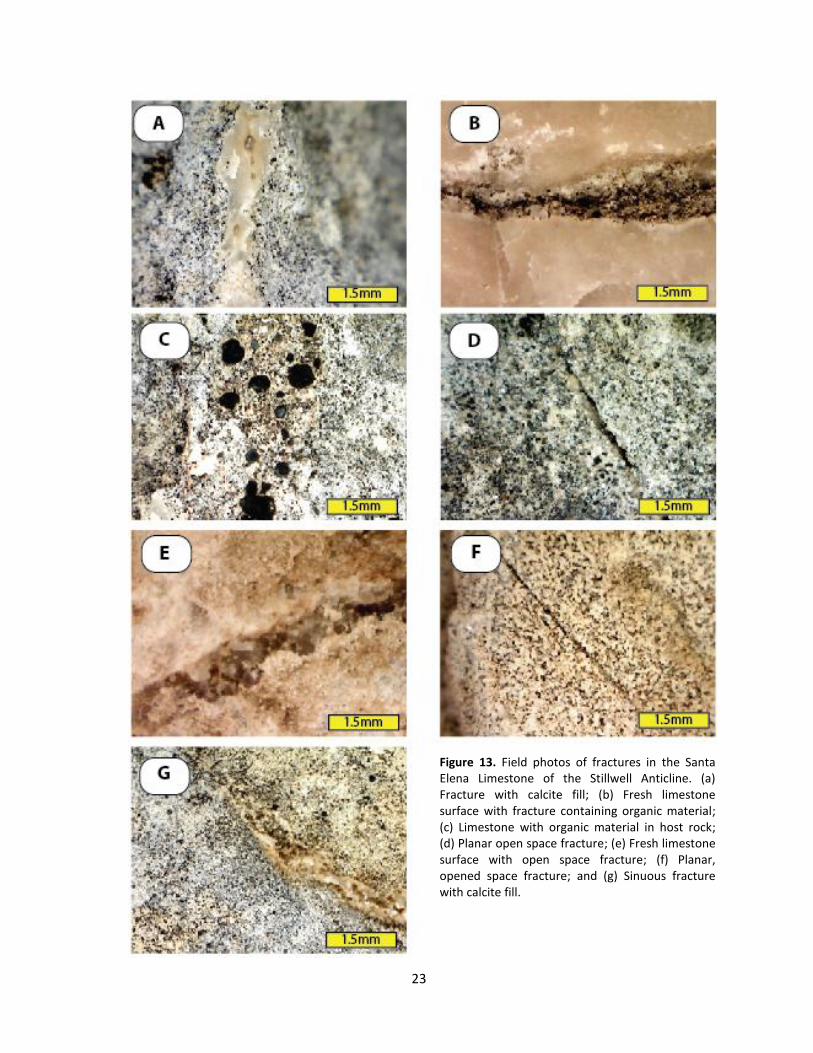
The types of fractures present in the Santa Elena limestone have a variety of textural
characteristics. Fracture fill had different color and texture than the grey lithographic
limestone. The vast majority of fractures present had a white to tan calcite fill (Fig. 13a).
Surfaces on the host rock and a significant number of fractures displayed brown/black
organic growth (Figs. 13b and 13c). Some fractures present were filled with both calcite and
organic material, commonly making the fractures more visible in outcrop. Figures 13d and
13e show that not all fractures contained fill. Some open fractures showed evidence of
euhedral calcite crystallization on fracture walls (Figs. 13e and 13g).
Fractures observed in outcrop had three primary morphologies. Planar fractures
were common as both filled and non-filled fractures (Figs. 13d, 13e, and 13f). Other
morphologies observed were sinuous fractures (Fig. 13g) and sub-planar fractures (Fig. 11),
with sub-planar fractures most common at all structural positions.
Structural Position
Stratigraphic
Position Above
Base (m)
Thickness of Bed
(cm)
Bed Orientation (azimuth,
dip)
Observation Plane
Orientation (azimuth,
dip)
Systematic Joints
(azimuth, dip)
Easting (m)
UTM Zone 13
Northing (m)
UTM Zone 13
1. Forelimb 1.75 13 052, 39 171,60 (312, 82) (266, 61)
697901 3281928
2. Mid- Forelimb
Hinge 2.05 12 041, 29 288,56
(135, 89) (230, 86)
697985 3281815
3. Middle Limb
1.55 9 147, 06 316,65 (333, 75) (087, 90)
697896 3281814
4. Mid- Backlimb
Hinge 6.04 13 278, 14 115,62
(343, 75) (086, 69)
697694 3281978
5. Backlimb 5.77 13 228, 27 178,66 (123, 85) (032, 84)
697757 3281808
23
Figure 13. Field photos of fractures in the Santa Elena Limestone of the Stillwell Anticline. (a) Fracture with calcite fill; (b) Fresh limestone surface with fracture containing organic material; (c) Limestone with organic material in host rock; (d) Planar open space fracture; (e) Fresh limestone surface with open space fracture; (f) Planar, opened space fracture; and (g) Sinuous fracture with calcite fill.

24
Fracture orientations and fills at all structural positions display evidence for multiple
generations of fracture formation, including cross-cutting relationships (Figs. 14A and 14B).
Moreover, fresh surfaces show zonation in fracture fill that is highlighted by sharp changes
in fill color. Figure 14C shows a fracture with a brown to red calcite fill on the outer margins
of the fracture, with white material bound between those margins; this pattern suggests a
temporal change in fluid composition, with the red/brown calcite precipitating in the
Figure 14. Field photos of fractures in the Santa Elena Limestone of the Stillwell Anticline. (A) Two fractures displaying cross-cutting relationships (fracture b precedes fracture a); (B) two fractures displaying cross-cutting relationships; (C)(D)(E) are fresh limestone surfaces, each showing fracture fills with different timing, fill color and possibly composition.

25
fracture prior to the later white calcite. These relatively sharp color changes suggest abrupt
changes in fluid composition following fracture propagation and opening events (Figs. 14C,
14D, and 14E).
The characteristics of fractures measured at each structural position appear to vary
between locations (Table 3). The average fracture aperture measured at all five locations
was 0.102 mm (Table 3). The highest average aperture was found in the fore limb and
middle limb and lowest in the backlimb hinge. The average fracture length observed at all
five structural positions was 3.84 cm, with the longest average fracture length at the
forelimb location and the shortest average fracture length at the fore-limb hinge location
(Table 3). At all five locations, fractures were usually filled and sub-planar.
Table 3. Summary of Field-based Fracture Data
Location Area of
observation
Total number of fractures measured
Average aperture
(mm)
Average length (cm)
fill mode
morphology mode
Fracture Intensity
(fractures/ )
Percent of Open
Pore Space
Fore-limb
hinge 239 204 0.086 2.81 filled Sub-planar 0.85 20.72
Fore limb
932 203 0.151 5.02 filled planar 0.23 17.34
Middle limb
1223 211 0.106 4.84 filled planar 0.17 8.73
Back-limb
hinge 234 204 0.076 2.77 filled Sub-planar 0.88 18.51
Back limb
372 203 0.091 3.75 filled Sub-planar 0.55 18.45
Final Average
205 0.102 3.84 filled Sub-planar 0.54 16.75

26
Figure 15. Stereonet diagrams of fracture orient-ations. Left column shows poles to planes of fracture orientations at each structural position. Orientations of observational planes are shown in red great circles. Orientations of beds are shown in green great circles. Purple squares represent orientation of macro scale joint sets. Stereonet diagrams in the right column show density contour and display high density in red and labeled.
Table. 4 Orientation of high density fracture sets
Location Sets Azimuth
Range Dip
Range
Fore-limb hinge
1a 34 53
26 62
1b 355 46
348 44
1c 354 58
343 71
Fore limb
2a 112 59
125 49
Middle limb
3a 71 85
76 90
3b 73 57
78 52
3c 151 69
156 66
3d 165 46
183 75
3e 211 85
216 78
Back-limb hinge
4a 21 75
12 88
4b 305 44
276 58
4c 272 48
258 60
Back limb
5a 119 60
146 39
5b 169 48
182 38

27
Fracture systems at different structural positions do not appear to have similar
fracture orientations. Figure 15 displays fracture orientation data as poles to planes, with
relative fracture densities contoured in order to identify fracture sets (Table 4) at each
location (contouring performed using StereoStat structural analysis software). Most fracture
data appear to cluster along great circles related to observational plane orientation and
bedding orientation. Plots of the major joint sets at each structural position reveal a
dominant north-south strike and sub-vertical dip for macro scale fractures at all locations
(Fig. 15).
Laboratory Methods and Data
I have separated my description of laboratory methods and data by structural
position (Locations 1 – 5). However, since samples obtained at each location represent such
a small percent of the bed studied, it cannot be assumed that characteristics observed in
thin section fully characterize that specific structural position.
Petrographic analysis of thin sections
I obtained images from thin sections using a petrographic microscope in order to
describe the characteristics of fractures at each structural position. All photomicrographs
were taken using a Lieca KL 2500 LCD microscope with a Leica DFC290 HD camera. I also
used a Canon 8800F flat-bed scanner with two polarizing film sheets to obtained cross-
polarized images of each entire thin section.

28
Figure 16. Cross-polarized images of full thin sections. Sample obtained at the forelimb location. (a) PPL with marked bioturbation; and (b) XPL showing dominant fracture orientation that are oblique to bedding, and the generalized strain ellipse, assuming opening mode fracture formation.
29
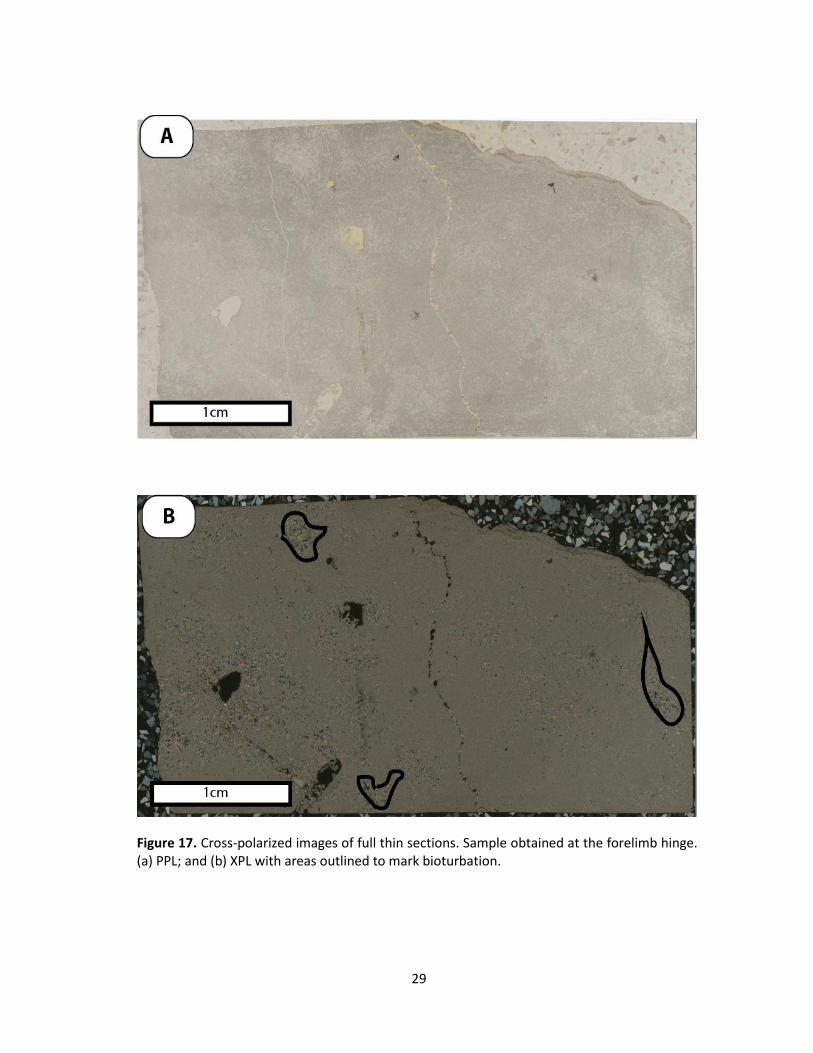
Figure 17. Cross-polarized images of full thin sections. Sample obtained at the forelimb hinge. (a) PPL; and (b) XPL with areas outlined to mark bioturbation.

30
Figure 18. Cross-polarized images of full thin sections. Sample obtained at the middle limb. (a)
PPL; and (b) XPL.

31
Figure 19. Cross-polarized images of full thin sections. Sample obtained at the backlimb hinge. (a) PPL (b)
XPL with areas that suggest bioturbation.

32
Thin section petrography revealed that bedrock and fracture characteristics are
fairly similar at all five locations (Figs. 16-20). Petrographic images show fine-grained, mud-
like limestone at all five locations, with less than 10% fossils and/or organic material. Cross-
polarized thin sections display evidence for burrowing and bioturbation (pers. comm., D.
Lehrmann, 2013; Figs. 16, 17, and 20). Based on these observations, I have classified the
limestone beds at all five locations as micritic limestone.
Although thin section petrography did not reveal the same fracture intensity
documented in the field, the thin section from the forelimb location showed evidence of a
Figure 20. Cross-polarized images of full thin sections. Sample obtained at
the backlimb. (a) PPL (b) XPL with areas marked to indicate bioturbation

33
significant fracture set (Fig. 16). Although fractures are affected by bedding, partially
controlling their propagation, the consistent oblique orientation of the fractures relative to
bedding in the forelimb sample (Fig. 16) allowed me to approximate the orientation of a
generalized strain ellipse, assuming opening mode fracture formation. No dominant
fracture set was documented at other structural positions.
Most fractures observed were filled with blocky calcite crystals (Figs. 21a, 21b, and
22a). These thick fractures were up to nearly 7 mm wide, and many of these fractures have
multiple generations of fracture fill. For example, one thick fracture has one generation of
fill that consists of blocky eu-to sub-euhedral calcite crystals and another generation with
smaller calcite crystals that appear to have characteristics similar to the host rock (Fig. 21).
Cross-cutting relationships indicate that the thick type of fracture describe above pre-dates
a second type of thinner fractures. Figures 21 and 22 reveal a thin white fracture that cross-
cuts the thicker fractures, appearing to follow calcite crystal boundaries from the thicker,
earlier fracture fill.
Petrographic thin sections showed that fractures are predominantly calcite-rich,
based on calcite staining and petrographic identification. Nevertheless, some of the thick
fractures contained pyrite crystals and organic material. Figure 21a shows three distinct
pyrite crystals (black opaque crystals) within the fracture’s calcite fill, and Figure 22a shows
possible pyrite crystals and/or organic material in between calcite crystals the fracture’s fill.
There are also smaller and less frequent dolomite fractures present in the thin sections
analyzed (Figs. 22b and 23a). In Figure 23a, the fracture to the left shows a sinuous dolomite
fracture with the inclusion of calcite crystals. This type of feature was seen in many other

34
dolomite fractures. Moreover, dolomite was seen not only in fractures but also as isolated
crystals within the host rock and as dolomitization fronts (Fig. 23b).
Figure 21. Photomicrograph with XP light showing thick calcite veins (middle limb). (a) Presence of black pyrite crystals. Thinner fracture cross-cuts thicker fracture. (b) Photomicrograph with XP light from a sample obtained in the backlimb. Thinner fracture cross-cuts thicker fracture.

35
Figure 22. Photomicrograph with XP light showing different types of fractures (Forelimb). (a) Fracture with sub- to euhedral calcite crystals, possible organic material and/ or pyrite; (b) Thinner dolomite fractures.

36
Figure 23. Photomicrograph with XP light showing the presence of dolomite (a) two dolomite fractures from a sample obtained in the Back limb hinge; (b) Dolomitization from the forelimb.
37
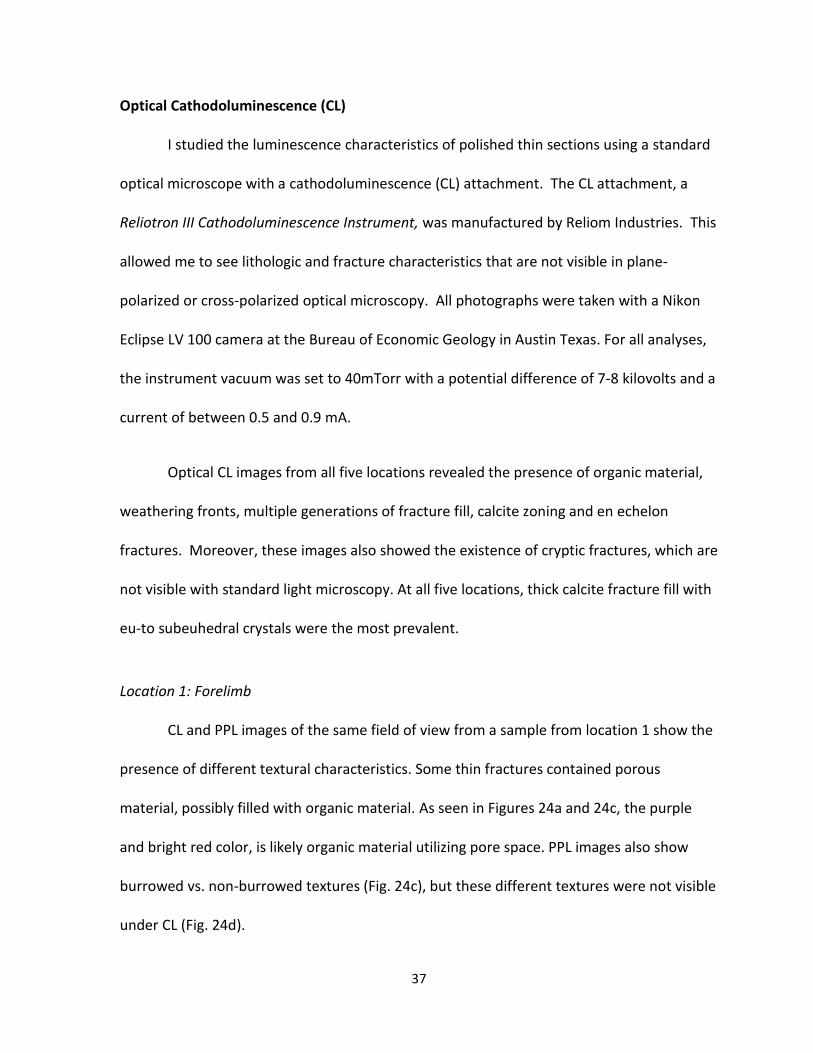
Optical Cathodoluminescence (CL)
I studied the luminescence characteristics of polished thin sections using a standard
optical microscope with a cathodoluminescence (CL) attachment. The CL attachment, a
Reliotron III Cathodoluminescence Instrument, was manufactured by Reliom Industries. This
allowed me to see lithologic and fracture characteristics that are not visible in plane-
polarized or cross-polarized optical microscopy. All photographs were taken with a Nikon
Eclipse LV 100 camera at the Bureau of Economic Geology in Austin Texas. For all analyses,
the instrument vacuum was set to 40mTorr with a potential difference of 7-8 kilovolts and a
current of between 0.5 and 0.9 mA.
Optical CL images from all five locations revealed the presence of organic material,
weathering fronts, multiple generations of fracture fill, calcite zoning and en echelon
fractures. Moreover, these images also showed the existence of cryptic fractures, which are
not visible with standard light microscopy. At all five locations, thick calcite fracture fill with
eu-to subeuhedral crystals were the most prevalent.
Location 1: Forelimb
CL and PPL images of the same field of view from a sample from location 1 show the
presence of different textural characteristics. Some thin fractures contained porous
material, possibly filled with organic material. As seen in Figures 24a and 24c, the purple
and bright red color, is likely organic material utilizing pore space. PPL images also show
burrowed vs. non-burrowed textures (Fig. 24c), but these different textures were not visible
under CL (Fig. 24d).

38
Fracture fills observed in the thin section for this location appear to have different chemical
composition than the host rock. Fracture fills have a different color than the host rock (Figs.
24b and 24f). Moreover, it appears that there are multiple generations of fracture fill. In
Figure 24b, one generation of fill appears nearly identical to the host rock (upper right
fracture) and another generation reveals brighter CL than the host rock (lower left fracture).
PPL and CL images also indicate the presence of echelon fractures that are at an oblique
angle relative to bedding (Fig. 24c). These fractures are from the fracture set documented
in the forelimb location and were documented in the thin section petrography section.
Location 2: Forelimb - Middle Hinge
CL and PPL images at location 2 indicate the presence of possible open pore space,
fractures with different compositions than the host rocks, and weathering zonation. Figure
25a shows a sinuous fracture with possible open pores or plucked grains due to thin section
polishing processes. The fracture fill of this fracture appears to have the same CL brightness
throughout the fracture, and the difference in color between the fracture and host rock
suggests different compositions (Fig. 25b). Other images suggest the presence of
weathering zones in the rock, indicated by a change in texture from the fine-grained,
unweathered host rock to the coarser-grained and weathered surface (Fig. 25c,d). The CL
image suggests that the weathered section has a significantly different composition, based
on the purple color relative to the bright red color of the unweathered host rock (Fig. 25d).

39
CL images from location 2 also show the presence of cryptic fractures. In PPL, fractures are
very difficult to see, but CL images of the same locations clearly reveal fractures with
different CL brightness than the host rock (Fig. 25e,g).
Location 3: Middle Limb
CL and PPL images observed at this location show fractures with three generations
of crystal growth. In Figure 26a, the far right section of the image is the host rock (labeled
“host rock”). The rest of the image is a single fracture with three different crystal
generations. The first generation of fracture fill can be observed to the left of the host rock
in a triangular zone with notably larger and blockier crystals than the surrounding crystals. A
second generation of fracture fill is characterized by the growth of euhedral calcite crystals
that appear to have nucleated on the fracture wall and are brighter under CL than the
preceding fracture fill. A third generation of fracture fill is characterized by smaller calcite
crystals of similar brightness to the preceding euhedral crystals (Fig. 26).
Similarly, in two other samples, the host rock is in the far left side of the image, and
the three generations of fracture fill include a first generation characterized by large, eu –to
sub-euhedral blocky calcite crystals with brightness similar to the host rock; a second
generation where euhedral calcite crystals with a brighter CL signature appear to have
nucleated on the fracture’s wall; and a third generation of smaller calcite crystals (Figs. 26c
and d). Figures 26a and 26c appear to have fracture fill generations with similar textural
characteristics. Figure 26d also shows a fracture with three generations of fracture-filling
crystallization. One generation of fracture fill consists of the large, eu-to sub-euhedral
calcite crystals. A second generation of fracture fill can be observed in the euhedral crystals

40
that appear to have grown from the fracture wall. A third generation consists of the large,
blocky, CL-bright calcite crystals along with some large pyrite crystals.
Location 4: Middle - Backlimb hinge
CL and PPL images at this location show the presence of open pores, organic
material and calcite zoning. A thick fracture with blocky, sub- to euhedral calcite crystals
also contains open space, which appears to have formed after the fracture was filled with
calcite crystals (Fig. 27). CL reveals zoning in calcite crystals, with the outer rings of crystals
appearing similar to the host rock with brighter CL signatures (Fig. 27b). The CL image also
reveals two optically bright zones sub parallel to the fracture wall. These zones suggest a
short period of crystal growth while the fracture was opening. As in other CL images, purple
color may indicate organic material.
Location 5 Backlimb
CL and PPL images at the backlimb location show the presence of sinuous fractures
(Fig. 28a), multiple generations of fractures and crystal zoning. Figure 28c shows a thick
fracture with zoned, blocky, sub-euhedral calcite crystals. CL images show that the fracture
fills have a different CL signature than the host rock (Fig. 28b,c,f). A later fracture appears to
wind through the fracture fill, utilizing crystal boundaries (Fig. 28e,f). The brown color in the
PPL image (Fig. 28e) suggests the presence of organic material.

41
Figure 24. PPL and SEM-CL images from location 1 (forelimb). Each pair of PPL images to the left and SEM-CL images to the right portray the same location under the scope. Yellow polygons are location where EDS measurements were taken. (a) PPL image showing two fractures with white fill and porous material with black fill; (b) SEM-CL image fractures show different generation of fill. Porous material shown in purple. Red grains appear to have different composition than host rock; (c) PPL image showing porous material and two different textures (burrowed vs. non-burrowed); (d) SEM-CL image displays the porous material and red grains with different composition than host rock. It does not show different textures; (e) PPL image showing echelon fractures that are at an angle relative to bedding; and (f) SEM-CL image showing echelon fractures with different signature than host rock.

42
Figure 25. PPL and SEM-CL images from location (forelimb middle hinge). Each pair of PPL images to the left and SEM-CL images to the right portray the same location under the scope. Yellow polygons are location where EDS measurements were taken. (a) PPL image of sinuous fracture with open space; (b) SEM-CL shows sinuous fracture with open space and with different CL signature than host rock; (c) PPL image of weathering ring; (d) SEM-CL shows weathering ring and a fracture sub parallel to ring; (e) PPL image of host rock with no apparent fracture present; (f) SEM-CL image revealing cryptic fracture with different CL signature than the host rock; (g) PPL image of host rock with no apparent fracture present; and (h) EM-CL image revealing cryptic fracture with different CL signature than the host rock.

43
Figure 26. PPL and SEM-CL images from location 3 (Middle Limb). Each pair of PPL images to the left and SEM-CL images to the right portray the same location under the scope. Yellow polygons are location where EDS measurements were taken. (a) PPL image showing three generations of crystal growth within a fracture. (b) SEM-CL signature also shows three generations of crystal growth. (c) PPL image shows three generations of fill with pyrite crystals on black (d) SEM-CL image shows different signatures for each generation of fill. (e) PPL image showing three generations of crystal growth within a fracture. (f) SEM-CL image shows different signatures for each generation of fill.

44
Figure 27. PPL and SEM-CL images from location 4 (middle-backlimb hinge). Each pair of PPL images to the left and SEM-CL images to the right portray the same location under the scope. Yellow polygons are location where EDS measurements were taken. (a) PPL image showing thick fracture with open pores (b) SEM-CL image of thick fracture with calcite crystals that show evidence of zoning.

45
Figure 28. PPL and SEM-CL images from location 5 (backlimb). Each pair of PPL images to the left and SEM-CL images to the right portray the same location under the scope. Yellow polygons are location where EDS measurements were taken. (a) PPL image 2 shows sinuous fractures with blocky texture (b)SEM-CL image shows that fracture has different signature than host rock (c) PPL image shows fracture with blocky sub-euhedral calcite crystal fill. Later fracture appears winds through larger fracture (d) SEM-CL shows fracture with zoned calcite crystals. Later fracture shows different CL signature than larger fracture (e) PPL shows fracture with two different textures (f)(g).

46
Scanning Electron Microscopy
I used a scanning electron microscope (SEM) in order to get a better understanding
about the compositional characteristics of the fractures under analysis. The SEM uses a
focused beam of high-energy electrons to generate signals at the surface of specimens.
These signals are created by electron-sample interactions and can reveal information about
morphology, texture, and chemical composition of the materials in a sample. All SEM
elemental analyses were taken at 20 kilovolts and spot size of 6 µm with a FEI Nova
NanoSEM 430 field-emission SEM. Mineral identifications and phase identification maps
were made using a Bruker XFlash® SDD energy dispersive spectroscopy (EDS) system that
operates under a vacuum. All measurements were taken at the SEM lab of the Bureau of
Economic Geology in Austin, TX.
I also used backscattered electron (BSE) imagery to obtain information about the
mineral content of both fracture fill and the host rock adjacent to fractures. Interaction of
an accelerated electron beam with a sample produces a variety of elastic and inelastic
collisions between electrons and atoms within in a sample. Since the number of
backscattered electrons reaching a detector is proportional to the mean atomic number of
the sample, variations in brightness can be loosely correlated with variations in elemental
composition.
The interaction of an electron beam with a sample produces not only a variety of
collisions but also the emission of photons (including x-rays). I used an energy dispersive
detector to separate the characteristic x-rays of different elements into an energy spectrum
and to determine the relative abundance of elements in the analyzed sample. Moreover, I

47
used the EDS system to create high-resolution element maps across an important location
on one thin section (Goldstein, 2003).
Sample positions for SEM analysis were guided by host rock and fracture features
observed in optical CL images. Results showed that the host rock and fracture fill were
predominantly calcium rich, consistent with calcite, and also included magnesium,
aluminum, silicon, and iron at some locations. Although backscattered electron (BSE)
images reveal some compositional and textural variations, energy dispersive spectrometry
(EDS) provided more detailed data about the presence or absence of elements in fracture
fill at each structural position.
Location 1 Forelimb
EDS graphs and BSE images for location 1 showed a calcium-rich peak for the host
rock, and revealed various compositions and elements present in the primary fills and grains
with different characteristics included in those fills. EDS of porous material indicates that
this material is calcium and magnesium rich, suggesting a dolomitic composition (Figs. 29a,
29b; Figs. 24b and 24d). EDS also showed the presence of chert within the rock, with Figure
29c showing the Si peak from that location. Figures 30a and 30b show BSE images of the
fracture, but these images do not reveal a significantly different BSE signature between the
calcite-rich and chert-rich regions. Moreover, this location showed the presence of
euhedral, rhomb-shaped dolomite crystals (Fig. 30c).

48
Location 2 Forelimb Hinge
EDS graphs from this location indicate a predominant calcium rich composition with
no distinct change in composition between weathered and unweathered surfaces
recognized under CL (Figs. 25 and 31a,b).
Location 3 Middle Limb
EDS graphs from this location are based on analyses of the host rock and the
different generations of fracture fill observed in both thin section petrography and CL
images (Fig. 26). All generations of fracture fill from this location display calcium peaks in
EDS (Fig. 32a,b,c), and the dark eu-to sub-euhedral suspected pyrite crystals documented in
both thin section petrography and optical CL reveal large Fe peaks (Fig. 32c). EDS element
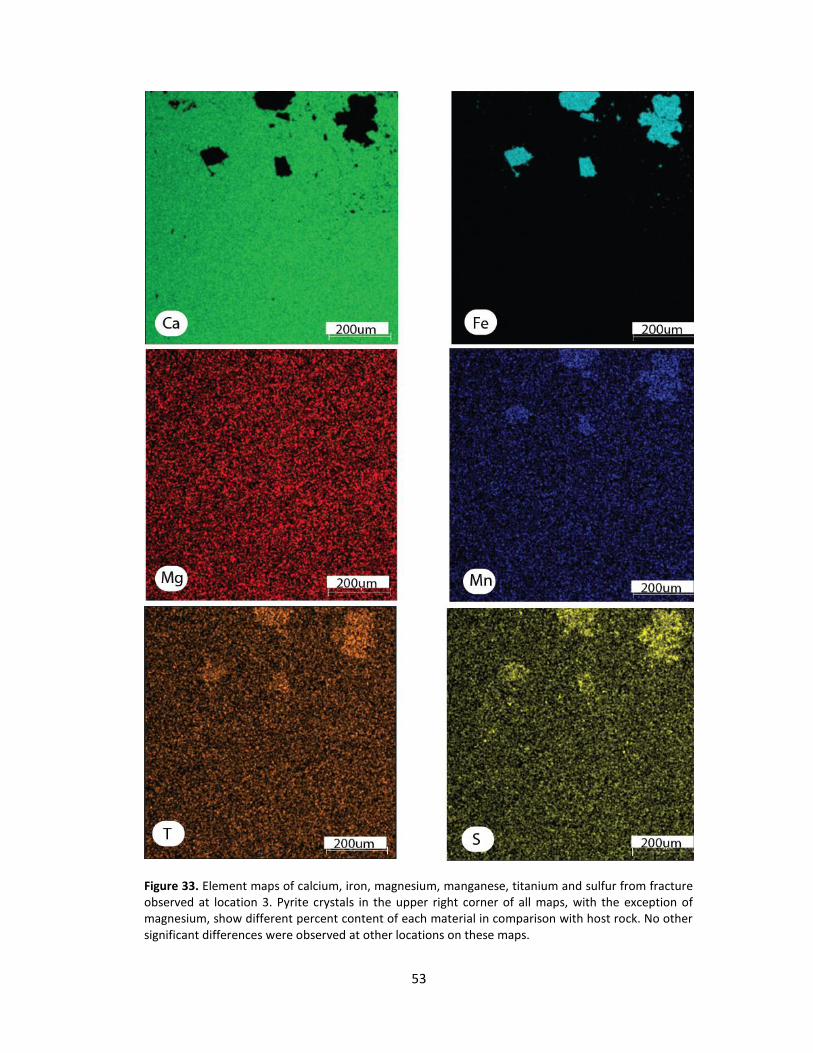
maps of multi-generational fracture fill were taken to document any variation in
composition between the three distinct fracture fill generations. With the exception of the
pyrite crystals, calcium, iron, manganese, sulfur and titanium were distributed in equal
concentrations throughout the fracture fill (Fig. 33).
Location 4 Backlimb hinge
EDS graphs from location 4 also indicate predominantly calcium-rich composition of
the host rock, fracture fills, and late, pore-filling crystallization (Fig. 34a,b). However, EDS
analysis of the suspected organic material within the pore seen in CL (Fig. 27) shows a
spectral signature with silicon, calcium, aluminum, magnesium and sulfur peaks, suggesting
clay with minor authigenic pyrite (Fig. 34c).
Location 5 Back limb
No SEM data were collected at this location.

49
Figure 29. EDS elemental graphs obtained from sample in the forelimb. Data correlate with CL images in Figure 24. (a) Host rock ;(b) porous material, with the presence of significant calcium and magnesium
suggesting dolomitic composition; and (c) Chert fracture.

50
Figure 30. BSE images from sample obtained in the Forelimb. (a) thin chert fractures; (b) thin chert fractures; and (c) dolomite crystal rhomb.

51
Figure 31. EDS elemental mineral graphs obtained from sample in the Forelimb hinge. Correlates with CL images in Figure 25. (a) weathered front showed in CL image; and (b) unweathered section.

52
Figure 32. EDS elemental graphs from sample obtained in the middle limb; Correlate with CL image in figure
26. All measurement were taken from a single fracture with different generations of fracture fill. (a)
blocky sub-to euhedral calcite crystals; (b) euhedral calcite crystals that appear to have nucleated on the
fracture; (c)zone of smaller calcite crystals; and (d) black pyrite crystals.
53
Figure 33. Element maps of calcium, iron, magnesium, manganese, titanium and sulfur from fracture observed at location 3. Pyrite crystals in the upper right corner of all maps, with the exception of magnesium, show different percent content of each material in comparison with host rock. No other significant differences were observed at other locations on these maps.

54
Figure 34. EDS elemental graphs from sample obtained in the backlimb hinge. These data correlate with CL images in Figure 27. (a) Host Rock; (b) calcite fracture; and (c) filled pore within a fracture.

55
IV. ANALYSIS
Analysis of fracture variables
The most common approach to compare parameters (variables) of multiple
populations (in this case, structural position location) is by calculating the differences in
means and/or medians. Although this method can provide information about the variability
of each parameter in different populations, a more in-depth statistical analysis is required
to evaluate the significance of such variability. I performed a significance test for fracture
length and fracture aperture data in order to statistically evaluate the difference between
parameters’ medians at each structural position. In this significance test, the null hypothesis
is that there is no significant difference in the medians of each parameter within different
populations. The alternative hypothesis is that there is a statistical difference in the medians
of each parameter within different populations.
Normality Test
In order to choose the appropriate significance test, one must first test whether or
not each variable follows a normal distribution. I used two graphical approaches to check
for normality. I compared histograms of each variable to the shape of a normal probability
curve (Fig. 35a). If a quantity follows a normal distribution, the empirical distribution of the
histogram should be symmetrical and bell-shaped. However, histograms suggest that all
distributions are right-skewed (Figs. 35a and 35b), indicating that these data fail to follow
normal distributions.

56
I also used box-and-whisker diagrams to divide the data into quartiles based on the
median of each parameter (Figs. 35c and 35d). The median for each dataset is indicated by
the black center line between yellow and green areas, and the first quartile is indicated by
the black line at the edges of the green area and third quartiles by the edges of the yellow
area. The distance between these two lines is known as the inter-quartile range (IQR). The
extreme values (within 1.5 times the IQR from the upper or lower quartile) are the
endpoints of the lines extending from the IQR. All points at a greater distance from the
median than 1.5 times the IQR are plotted individually as asterisks and represent potential
outliers. Variables with normal distributions should have green and yellow quartiles of equal
length above and below the mean. The box plots for aperture and length show that
Figure 35. Graphical methods to test normal distributions. Location numbers correspond to structural positions discussed in the text. (A) Histograms of aperture data. Graphs show right skewed distributions in all five locations; (B) Histograms of fracture length data. Graphs show with right skewed distributions in all five locations; (C) Box plots of aperture data. At all location data results in asymmetrical boxplots; and (D) Box plots of fracture length data. At all location data results in asymmetrical boxplots.

57
quartiles are not of equal length and therefore do not follow a normal distribution (Figs. 35c
and 35d). Instead, the distribution for each variable at the different locations is right-
skewed.
Two variable analysis: Kruskal – Wallis One-Way Analysis of Variance by Ranks
Kruskal - Wallis analysis is a non-parametric method for testing whether there is a
significant difference among populations’ medians. The test is appropriate for this study
because it does not require a normal distribution, and it does assume the same shape (e.g.,
right-skewed) and scaled distribution (similar total population per location) for each group
of samples (Gibbons and Chakraborti, 2003). Under these conditions, this statistical analysis
provides a valid test of the null hypothesis that all medians are equal.
I used statistical and process management software known as Minitab to compare k
number of random samples. For each variable, aperture and length, I used a k value of 5
(five different structural positions). Minitab first combines and ranks all the data, finds the
group mean rank, and then standardizes the absolute difference of these average ranks.
The following summary of the mathematical theory behind Kruskal-Wallis analysis is
from Nonparametric Statistical Inference (Gibbons and Chakraborti, 2003).The median test
for k samples uses information about the magnitude of each of the N observations relative
to a single number, which is the median of the pooled samples. Therefore, Minitab
combines the N observations into a single ordered sequence from smallest to largest,
keeping track of which observation is from which sample, and assigns the rank 1,2,…,N to
the sequence. If ranks are well distributed among the k samples, which would be true for a
random sample of a single population, the total sum of the ranks, ∑ ,

58
would be divided proportionally according to the sample size among the k samples. For the
ith sample which contains observations, the expected sum of the ranks is calculated by:
If the null hypothesis is true (all medians are equal), then the expected rank for any
observation is the average rank (N+1)/2, and for observations, the expected sum of ranks
( ) is (N+1)/2.
The Kruskal – Wallis analysis is based on a function of the deviations between the
observed and the expected rank sums, with the reciprocals of the respective sample sizes
used as weights. Thus, the Kruskal-Wallis statistic is defined as:
H=
∑
[
]
The rejection region is calculated by H ≥ .
In order to reject the null hypothesis, the computed value H= must be equal to or
greater than the tabled critical chi-square value at the pre-specified degrees of freedom k-1.
A total of 1036 aperture and 1037 length values were used in testing. The results for
both aperture and length data reveal a p value of 0.000. Therefore, the null hypothesis can
be rejected. Most authors refer to a significant standard as P < 0.05 and statistically highly
significant as P < 0.001 (less than one in a thousand chance of being wrong) (Graham, 2003).
Since the p value is lower than 0.001, there is strong evidence that both aperture and length
medians are significantly different across all locations Table 5.

59
Figure 36. Angular relationships between the bed of interest, the observation surface, and horizontal. Prior to using bias correction methods, I first rotate all data about the axis of rotation indicated above (Following the method Surpless, 2013).
Observation bias correction
In order to clearly identify fracture sets and to compare fracture intensity at
different structural positions, I used a new multi-step method developed by Surpless (2013)
to account for observational biases that are present in any outcrop-based observation. This
method accounts for the different probability of sampling fractures due to the fracture
orientations relative to the
observational plane, and for
the different probability of
sampling fractures in
reference to their
orientations with respect to
the rectangular observational
surface area.
Prior to any bias
Table 5. Kruskal Wallis Results

60
correction, all fractures were rotated about an axis parallel to the strike of the bed of
observation (angle , Fig. 36). By rotating the observational plane to horizontal, the post-
rotation dips of all fractures become the angle of the fracture relative to the plane of
observation (values listed in Appendix B).
Observational bias due to fracture orientation relative to the observational plane
I used the Surpless (2013) weighting system to account for observational bias due to
fracture orientation relative to the observational plane. Unlike previous methods, this new
approach does not multiply a predefined range of data by a single rating factor as described
in background. Instead, the method developed by Surpless (2013) uses a function to weight
fractures without any binning procedure.
First, the method uses the sine function relationship between an observed fracture
at an angle of relative to an observational plane and the apparent spacing, dA, relative to
the true fracture spacing, d (Fig. 37):
eq. (1)
The only angle at which d = dA occurs at =
90. Therefore, the fraction d / dA is 1 at that
angle. At angles below 90, the rating factor
increases with decreasing value to account
for the smaller probability of fractures at small angles intersecting the observation plane.
To address this problem of reduced probability of intersecting the observation plane,
Figure 37. Angular relationship between a given fracture and the observation surface. Abbreviations: d = true fracture spacing; dA = apparent fracture spacing; and d = angle between observation surface and fracture.

61
Surpless (2013) uses the fact that the fraction dA/d increases at a rate proportional to the
reciprocal of sin :
eq. (2)
Thus, rating factors can be based on the reciprocal of sin (Table 6). Nevertheless, this
relationship cannot be used for all fractures because as approaches to zero, 1 / sin
approaches infinity.
Table 6. Angle intervals and calculated rating factors based on 1/sin . Angle () between fracture and
observation surface Rating factor (fi)
90 1
89 1
85 1
80 1.02
70 1.06
60 1.15
50 1.30
40 1.56
30 2.00
20 2.94
10 5.88
6 9.57
5 11.11
2 33.33
1 50
Since my observation surface was not perfectly planar, I was able to sample some fractures
parallel or sub-parallel to the observation surface. Thus, if I were to use a rating factor
based directly on the reciprocal of sin , we would introduce new bias to our results for
fractures at low intersection angles. To avoid such error, Surpless (2013) recommends
using a maximum rating factor (f1i) of 11, which includes any fractures at angles of 5 or

62
less relative to the plane of observation. For all other angles, I assigned rating factor based
on the reciprocal of sin relationship.
For : f1i = 11 eq. (3)
For
eq. (4)
All post-rotation values (after the observational plane is rotated to horizontal) and the
calculated weighting factors (f1i) for fractures calculated using equations 3 and 4 are listed
in Appendix B.
Correction Method for bias due to observational plane shape
In order to avoid biases due to the shape of the observational plane, geologists
attempt to use a circular observational area. However, due to bed characteristics, I could
not obtain the requisite number of fractures within a circular area of a diameter equal to
the thickness of the bed. Instead, I sampled fractures across a rectangular area, with one of
the dimensions equal to bed thickness. Therefore, I corrected for this bias associated with
the rectangular shape of the plane of observation using the Surpless (2013) method. This
method consists of assigning a second rating factor (f2i) to each fracture based on its
orientation relative to the observational plane.
In the program StereoStat, all data were rotated to an angle about a horizontal
axis (Fig. 36). Following Surpless’ (2013) methods, I also rotated this observation area about
a vertical axis an angle degrees, so that2 is at 0 (Fig. 38). Appendix B shows the results
of the rotation of all fractures. Once all data were rotated, I used the new strike value (Sr=

63
post-rotational strike value for a given fracture) for each fracture to calculate its probability
of intersecting the observation area, based on the length of the line perpendicular to the
fracture. This means that a fracture with a strike value of 000 would have the lowest
probability of intersecting the observation area, while a strike value of 090 would have an
intermediate probability of intersecting the observation area (Fig. 38). The rating factor f2i
was based on the relationship:
eq. (5)
Figure 38. A. Hypothetical map view of the rectangular observation plane after the plane has been rotated to horizontal but before the observation area has been rotated in map view. The black outlined area represents the area of observation. In this example, fracture 1 would have the smallest probability of being observed
based on the length of the line along which that fracture could intersect the observation area,1; fracture 2
would have an intermediate probability of being observed based on the length of line 2; and fractures oriented in either #3 orientation would have the highest probability of being observed, based on the length of
3. All fractures will be rotated an angle about a vertical axis so that2 is parallel to due north (0 azimuth).
B. Post-rotation view of the observation area and fractures, with 2 parallel to due north. The plane of
observation was rotated degrees (shown in A.) (Surpless, 2013).

64
Where 3 is the maximum length of a line of
intersection on the observation plane and u is the
calculated length for a fracture of a given strike. Based
on this relationship, when u = 3, where u is the
calculated observation length for a given fracture, the
rating factor f2i is 1, while any u shorter than 3 give a
rating factor greater than 1.
For apparent strike values (Sr) of 0, 090, 180,
and 270, the rating factors were fixed and based on the
dimensions of the area of observation (1 and2; Fig. 39).
Fractures in orientation 1 with strike values of either 0 or
180 have an observation length of1, while fractures in
orientation 2 have an observation length of 2. Thus, the
rating factors for fractures of these positions become:
At 0 and 180 Sr values:
eq. (6)
At 90 and 270 Sr values:
eq. (7)
For all other fractures, I calculated the observation lengths of3. There are four apparent
strike values at which fractures would have this observation length (Fig. 40). Sr values at
these four positions were determined by the dimensions of the area of observation, 1 and
2. The first post-rotational strike orientation occurs when Sr = = tan-1 (2/1) (Fig.40a).
Since these angular relationships remain constant at the other Sr values, these Sr values
Figure 39. Apparent strike values (Sa) and corresponding length values for fractures of 0, 90, 180, and 270. Fractures in position 1 (red) would have
1 observation length
while fractures in position 2 (blue) would have 2 observation length (Surpless, 2013).

65
were expressed in terms of . In Figure 24b, Sr = 180 – ; in Figure40 c, Sr = 180 + ; and in
Figure 40d, Sr = 360 –. In all cases, = tan-1 (2/1).
Following this method, I used a total of eight Sr values for which observation length
and therefore rating factors (see eq. 5) are known for a given planar observation surface.
For Sr values other than these, however, the observation lengths will vary according to
different trigonometric functions. The range of values that lie between these known
observational lengths values are indicated by the roman numerals I. through VIII. (Fig. 41).
Figure 40. Four post-rotational strike (Sr) orientations at which a fracture would have observation length 3. A. The first Sr value, , occurs when = tan
-1 (2/1). This value will vary based on the dimensions of the area of
observation. B. The second Sr value occurs at 180 –. C. The third Sr value occurs at 180 + . D. The fourth Sr value occurs at 360 – . See text for discussion (Surpless, 2013).

66
Figure 41 . Angular ranges for Sr values that lie between known observational lengths. Angular ranges I. through VIII. have different trigonometric functions that govern the lengths of observation.
These functions and the values for the known observation lengths are listed in Table 7,
where u is the observation length based on the post-rotation strike value (Sr).
Appendix B shows the new values after rotation and the final weighting factor.
Combination of the two weighting factors
With these relationships established for the orientation between the plane of the
observation surface (rating factor f1i) and the orientation of the fracture relative to the
rectangular area of observation (rating factor f2i), I calculated a complete weighting value
for each fracture sampled by obtaining the product of the two rating factors:
eq. (8)
Appendix B shows final results for all fractures at all 5 different structural positions.

67
Post-weighting fracture orientation distributions
I created stereonet diagrams using StereoStat V1.5. I graphed weighted and
unweighted strike and dip data from each structural position. I also plotted unrotated strike
and dip and data rotated to horizontal with respect to bed orientation on equal-area stereo
net diagrams (Fig. 42). I defined sets using contours with a one percent area contouring, a
contour count of 5, an initial contour of 2 sigma and significant sigma of 3.
Table 7. Summary of rating factors for fracture observations within a rectangular area, where Sr is the post-rotation strike value. Zones I. through VIII.
Angle(s) Observation length (u) f2i
0 1 ⁄
Zone I: 0 < Sr <
⁄
3 1
Zone II: < Sr < 90
⁄
90 2 ⁄
Zone III:
90< Sr < [180 - ]
⁄
180 - 3 1
Zone IV:
[180 - ] < Sr < 180
⁄
180 1 ⁄
Zone V:
180 < Sr < [180 + ]
⁄
180 + 3 1
Zone VI:
[180 + ] < Sr < 270
⁄
270 2 ⁄
Zone VII:
270 < Sr < [360 -
⁄
360 - 3 1
Zone VIII:
[360 - < Sr < 360
⁄

68
Diagrams show significant sets of fractures at each structural position (Fig. 42).
Weighted and unweighted fracture sets do not seems to be correlated to the larger outcrop
joints measured. Diagrams show that after the weighting procedure, high density fracture
sets shown in red have slight changes. Therefore, certain fracture sets become more
predominant than previous sets.
Fracture Intensity
I determined fracture intensity by calculating the number of fractures per
centimeter measured on the observational plane, and I calculated the void space
(aperture*length) as a percent of the observational surface area (Table 8). Fracture intensity
was found to be significantly higher in the middle- backlimb hinge and forelimb positions,
and mean aperture and length were lowest in these structural locations. Conversely, the
lowest fracture intensity is the middle limb and middle-forelimb hinge position, and mean
aperture and length were higher at these locations. Percent of possible void space was
highest at the forelimb and lowest at the middle limb position. Thus, these results
demonstrate an inverse relationship between fracture intensity and fracture length.
In order to quantify the relationships between fracture aperture to fracture
intensity, I calculated the R2 of each equation by obtaining the natural log of the aperture
and intensity data in order to transform the exponential relationship into linear equations.
Graphs of aperture and fracture intensity (Fig. 43) follow a power law distribution in all five
locations, with fewer fractures having large apertures. values from linear regressions
ranged from 0.69 to 0.92.
Figure 42. Stereo net diagrams with fracture orientation data and contours of high density regions. Red great circle is observational plane orientation and green great circle is bed orientation. Purple squares are major joint sets observed at each location. First column show raw fracture data. Second column shows fracture data rotated to horizontal according to bed orientation. Third column shows fracture data that has not been rotated, but that has been weighted for observational bias corrections. Fourth Column show fracture data that has been rotated to horizontal according to bed orientation and weighted for observational bias correction.

69
Fracture Intensity
I determined fracture intensity by calculating the number of fractures per
centimeter measured on the observational plane, and I calculated the void space
(aperture*length) as a percent of the observational surface area (Table 8). Fracture intensity
was found to be significantly higher in the middle- backlimb hinge and forelimb positions,
and mean aperture and length were lowest in these structural locations. Conversely, the
lowest fracture intensity is the middle limb and middle-forelimb hinge position, and mean
aperture and length were higher at these locations. Percent of possible void space was
highest at the forelimb and lowest at the middle limb position. Thus, these results
demonstrate an inverse relationship between fracture intensity and fracture length.
Table 8. Summary of statistical data
Location Fracture Intensity
(fractures/ ) Mean
Aperture (mm)
Average Fracture Length
(cm)
Percent of Open Pore
Space
Forelimb 0.853 0.087 2.806 20.719
Mid- Forelimb
Hinge
0.230 0.151 5.003 17.343
Middle Limb
0.170 0.106 4.844 8.732
Mid- Backlimb
Hinge
0.876 0.076 2.780 18.510
Backlimb 0.551 0.090 3.722 18.445
In order to quantify the relationships between fracture aperture to fracture
intensity, I calculated the R2 of each equation by obtaining the natural log of the aperture
and intensity data in order to transform the exponential relationship into linear equations.
Graphs of aperture and fracture intensity (Fig. 43) follow a power law distribution in all five
locations, with fewer fractures having large apertures. values from linear regressions
ranged from 0.69 to 0.92.

70
Figure 43. Relationship of fracture aperture and fracture intensity. Graphs to the left show aperture of fractures measured against the fracture intensity at each structural position of the Stillwell Anticline. Graphs to the right are linear regressions of fracture data at each structural position.

71
V. DISCUSSION
The micrite limestone bed traced across different structural positions in the Stillwell
anticline contains significant intermediate-scale fracture systems at each location. Although
optical imagery did not reveal the same fracture intensities as those observed in the field, it
showed that fracture systems at all five locations have similar fracture morphology, fracture
fill, and textures. In contrast, statistical analysis proved that fracture intensity, average
aperture and length are significantly different at each structural position.
Other researchers have reported a lower visibility of fractures in optical microscopy.
Laubach (1989) found that fluid inclusions in closed microfractures are sometimes
composed of single, colorless, non-fluorescent phases. He concluded that fluid inclusions in
both transgranular and intragranular planes surrounded by quartz represent an optical
continuity with host grains and become invisible under the microscope (Laubach, 1989). The
fractures observed in the Stillwell anticline limestone beds also contained similar mineral fill
composition relative to the host rocks. As a result, there is a significant difference between
optical microscopic and field visibility of fractures. Therefore, workers performing
comprehensive fracture intensity studies of limestone should always collect data across a
range of scales, from the microscopic to the macroscopic.
Thin section petrography and CL imagery showed that most fractures present in the
Santa Elena limestone beds measured contained sub-to euhedral calcite crystals. This blocky
texture suggests that veins were formed by crystallization within open fractures, rather
than by crack seal mechanisms (e.g., Gale et al., 2008). Moreover, CL images revealed
different generations of fracture fill. The temporally separate fill events suggest that the

72
system was subject to changes in permeability due to both propagation events and fracture
fill events. Therefore, the percent void space calculated at each structural position is likely a
maximum that was never achieved during the life of the fracture-fluid system.
The results of the fracture intensity analysis indicate that fractures at an
intermediate scale can be correlated with strain. Previous studies about strain rates in the
Stillwell anticline indicate that the asymmetric fold should have maximum finite strain in the
forelimb, a slightly lesser finite strain in the forelimb hinge and backlimb hinge, and very
little, if any, fold-related strain in the middle limb of the system (Fig. 44; Mays et al., 2012).
Strain at the forelimb is primarily accommodated by simple shear, while is more complex at
the fold hinges. Data from this research reveal maximum fracture intensity at the forelimb
hinge and backlimb hinge. These results imply that fracture systems at an intermediate
scale are at least loosely correlated with the localized strain fields associated with fold
deformation.
Figure 44. Kinematic best-fit foward model of the Stillwell anticline produced by Mays et al., 2012. Cross-section represented in blue. Fault is shown in yellow. Strain ellipses shaded with deeper red indicate greater strain.

73
Rock failure is the culmination of a progressive development of cracking during
loading rather than a catastrophic spread of a single crack at a peak stress (Paterson and
Wong, 2005). Therefore, even though composition, stratigraphic position, depositional
environment and bed thickness were held constant, the type of failure observed in all five
locations is not the same. Statistical analysis of fracture variables suggests that there is a
significant difference between fracture length at all five locations (Table 5). For example,
the longest average fracture length was measured at the forelimb location and the shortest
average fracture length was at the forelimb hinge location. This variation implies that the
progressive development of fractures is different at each structural position. In fact, length
data comparisons to the kinematic model of the Stillwell anticline show that the location
with greatest curvature has the shortest fracture lengths, while the location with greatest
shear has the longest lengths. This relationship suggests that the local stress field is likely
constantly changing in the hinge, while in the forelimb, the strain rate and orientation are
much more consistent, permitting greater propagation of individual fractures.
Fracture intensity and aperture data reveal a power law relationship at each
structural position, with greater fracture intensities correlated with narrower fractures.
High R values (Fig. 43) support this relationship and indicate that populations of
microfractures could be used to predict the intensity of macro fractures. This power law
relationship has been previously described in the literature. Ortega et al. (2010) obtained
even higher R values for power law relationships between aperture and fracture intensity.

74
However, other researchers suggest that the power law relationship between
intensity and aperture is only valid within a certain range of fracture widths. Hooker et al.
(2009) suggest that most power law distribution research has been based only on micro- to
intermediate scale fractures. In their analysis of aperture-dependent fracture intensity,
Hooker et al. (2009) incorporated data primarily from micro- and macro-fracture systems.
Their results show that aperture-size data below a width of 0.012 mm and above a width of
1 mm follow a log-normal distribution. Intermediate-size fracture apertures, though
relatively sparse in their study, suggest a power-law aperture-size distribution (Hooker et
al., 2009). The results presented here support these findings and also suggest that the
power law relationships obtained may not accurately predict smaller or larger fracture
systems.
Fracture weighting procedures did not entirely remove observational bias. Research
has shown that observational bias can be a result of bed orientation, and microfractures are
generally perpendicular to bedding and are commonly subvertical (e.g., Laubach, 1989).
Figure 42 shows that fracture orientations sampled here do correlate with bed orientation.
Nevertheless, this relationship is not as strong as the correlation of each fracture systems
with the observational plane. Therefore, I conclude that observational bias is still present
after the weighting procedure. In order to properly weight fractures of lower sampling
probabilities, the data must have at least one fracture that represents such orientations. If a
data set completely lacks fractures of similar orientation to the observational plane, then no
multiplier will be calculated for those fractures and observational bias will not be corrected.

75
Although the observational surface was not planar, the relief may have not been significant
enough to permit the observation of at least one fracture from every orientation present.
Although fracture variables such as aperture, length, and intensity are influenced by
strain rate and other factors, fracture orientations can commonly be tied to stresses related
to tectonic activity (e.g., Fossen, 2010). Fracture sets present in the Stillwell anticline beds
measured here show no clear correlation to the orientation of other structures in the area.
Stereonets show that fracture sets have different orientations at all five structural positions.
Even after rotation to horizontal, fracture sets at different locations do not appear to
correlate with each other. Moreover, larger fracture systems and macroscopic, outcrop-
scale joints sets do not show strong relationships (Fig. 42). None of the joint sets overlap
with the high density fracture sets. This non-correlation between different fracture sets and
joint sets shows that although fracture intensity, aperture and length values have strong
relationships with the compressional deformation of the fold system, orientation appears to
be independent of the tectonic activity in the area.
The significant variation in fracture orientations could imply greater rock
permeability. The flow of fluids through rocks depends, in part, on fracture intensity and
fracture connectivity. For fluid flow to occur in any particular fracture network there must
be at least one interconnected sets of fractures. This condition is known as the percolation
threshold (Fig. 45). Thus, the great variety of fracture orientations I documented could
indicate the existence of interconnected fracture networks that reached a percolation
threshold. Further research and characterization of connectivity could therefore help
predict the rate and directionality of flow.

76
Figure 45. Fracture network connectivity. (a) Fracture network with poor connectivity; (b) Fracture network with high connectivity; (c) Percolation threshold is reached (Gudmundsson, 2011).
VI. CONCLUSIONS
The fracture weighting
procedure did not completely
remove observational bias from
the data, which may have affected
the analysis of fracture
orientations in the system. Since
information about fracture sets
allows scientists to characterize
fracture networks and their
connectivity, it is imperative to
develop better bias correction
procedures. Until scientists find an accurate correction model, all fracture research should
note that the results and observations may be affected by observational bias.
This research introduces a new field method that could be applied to the
characterization of fracture systems in the subsurface. Fracture systems in the Santa Elena
limestone beds measured are mostly composed of veins with multiple generations of calcite
fill. The various stages of fracture fill suggest local changes in fluid source and indicate that
the system has experienced significant changes in permeability.
These results show that style of deformation directly affects the evolution of
fracture systems. The characteristics of these fracture systems display relationships
77
between fracture intensity, fracture length, and bed curvature. Therefore, permeability in a
fold system, even within same bed units, should be highly heterogeneous as different
localities experience different deformation rates and stresses.
The results from this project could be applied to similar fold systems at other
localities. Because of the inherent difficulty in sampling fracture systems in the subsurface,
the relationships between fracture intensity, aperture and fracture length with shear strain
and bed curvature could be used as a powerful tool to assess changes in permeability across
different structural positions in unreachable areas. The ability to predict permeability across
scales should be especially useful for the oil and gas industry when trying to maximize
extraction from unconventional reservoirs.

78
REFERENCES
Bergbauer, S., 2007, Testing the predictive capability of curvature analyses, In Jolley, S., Barr, D.,
Walsh, J., and Knipe, R., Eds., Structurally complex reservoirs: Geological Society of London
Special Publication 292, p.185 – 202.
Casey, M., and Butler, R., 2004, Modeling approaches to understanding fold development:
implications for hydrocarbon reservoirs: Marine and Petroleum Geology, v. 21, p. 933 – 946.
Couples, G., and Lewis, H., 1998, Lateral variations in strain in experimental forced folds:
Tectonophysics, v. 295, p.79 – 91.
Dickinson, W., 1981, Plate tectonic evolution of the southern Cordillera, In Dickinson, W., and
Payne, W., Eds., Relations of tectonics to ore deposits of the southern Cordillera: Arizona
Geological Society Digest, v. 14, p. 113 – 135.
Fossen, H., 2010, Structural Geology. University of Bergen. Cambridge University Press. Gale, J.,
Lander, R., Reed, R., and Laubach, S., 2010, Modeling fracture porosity evolution in
dolostone: Journal of Structural Geology, v. 32, p. 1201 – 1211.
Gale, J., Lander, R., Reed, R., and Laubach, S., 2010, Modeling fracture porosity evolution in
dolostone: Journal of Structural Geology, v. 32, p. 1201 – 1211.
Gibbons, J. D., and Chakraborti, S., 2003, Nonparametric Statistical Inference: CRC Press, New York,
New York, 680 p.
Gillespie, P.A., Howard, C.B., Walsh, J.J., and Watterson, J., 1993, Measurement and
characterization of spatial distributions of fractures: Tectonophysics, v. 226, p. 113-141.
Goldstein, J., 2003, Scanning electron microscopy and x-ray microanalysis: Kluwer
Adacemic/Plenum Pulbishers, 689 p.
Graham, A., 2003, Statistics. Blacklick, Ohio: McGraw-Hill.
Gudmundsson, A., 2011, Rock fractures in geological processes: Cambridge: Cambridge University
Press.
Deepa, P., Olson, J., and Thompson, L., 2000, Combining outcrop data and three-dimensional
structural models to characterize fractured reservoirs: an example from Wyoming: American
Association of Petroleum Geologists Bulletin, v. 84, p. 830 – 849.
Hoin, D., Surpless, B., and Mays, B., 2012, The role of mechanical stratigraphy in fault-propagation
fold evolution: a case study: Southcentral Section GSA, Abstracts with Programs.

79
Hooker, J., Gale, J., Gomez, L, Laubach, S., Marrett, R., and Reed, R., 2009, Aperture-size scaling variations in a low-strain opening-mode fracture set, Cozzette Sandstone, Colorado: Journal of Structural Geology, v. 31, p. 707-718.
Keating, D. P., and M. P. Fischer, 2008, An experimental evaluation of the curvature-strain relation
in fault-related folds: AAPG Bulletin, v. 92, p. 869–884.
Ladeira, F., and Price, N., 1981, Relationship between fracture spacing and bed thickness: Journal of
Structural Geology, v. 3, p. 179 – 183.
Laubach, S., 1989, Paleostress directions from the preferred orientation of closed microfractures
(fluid-inclusion planes) in sandstone, East Texas basin, U.S.A.: Journal of Structural Geology,
v. 11, p. 603 – 611.
Laubach, S., 2003, Practical approaches to identifying sealed and open fractures: AAPG Bulletin v.
84, p. 561-79.
Laubach, S., Reed, R., Olson, R., Lander, R., and Bonnell, L., 2004, Coevolution of crack-seal texture
and fracture porosity in sedimentary rocks: Cathodoluminescence observations of regional
fractures: Journal of Structural Geology, v. 26, p. 967 – 982.
Laubach, S., Olson, J., and Gross, M., 2009, Mechanical and fracture stratigraphy: American
Association of Petroleum Geologists Bulletin, v. 93, p. 1413 – 1426.
Lehman, T., and Busbey, A., 2007, Society of Vertebrate Paleontology Fall 2007 Big Bend field trip
guide: Austin, Texas, Society of Vertebrate Paleontology, 117 p.
Lisle, R., 1994, Detection of zones of abnormal strains in structures using Gaussian curvature
anaylsis: American Association of Petroleum Geologists Bulletin, v. 78, p. 1811 – 1819.
Liu, L., Gurnis, M., Seton, M., Saleeby, J., and Muller, R., 2010, The role of oceanic plateau
subduction in the Laramide orogeny: Nature Geoscience Letters, doi: 10.1038/NGEO829.
Lonergan, L., 1999, Fractures, fluid flow and mineralization: Geological Society of London, Special
Publication 155, p. 83-103.
Maler, M., 1990, Dead horse graben: a west Texas accommodation zone: Tectonics, v. 9, p. 1357 –
1368.
Marrett, R., 1996. Aggregate properties of fracture populations. Journal of Structural Geology 18,
169e631. 178.
Marrett, R., Aranda-García, M., 1999, Structure and kinematic development of the Sierra Madre
Oriental fold-thrust belt, Mexico. In: Stratigraphy and Structure of the Jurassic and
Cretaceous Platform and Basin Systems of the Sierra Madre Oriental, Monterrey and Saltillo
Areas, Northeastern Mexico, a Field Book and Related Papers. South Texas Geological
Society. Special Publication for the Annual Meeting of the American Association of

80
Petroleum Geologists and the SEPM. Society for Sedimentary Geology, San Antonio, p. 69-
98.
Mauldon, M., Dunne, W., and Rohrbaugh, M., Jr., 2001, Circular scanlines and circular windows:
new tools for characterizing the geometry of fracture traces: Journal of Structural Geology,
v. 23, p. 247 – 258.
Mays, B., Surpless, B., and Hoin, D., 2012, Kinematic development of the Stillwell anticline, west
Texas: Southcentral Section GSA, Abstracts with Programs.
Miller, D., Nilsen, T., and Bilodeau, W., 1992, Late Cretaceous to early Eocene geologic evolution of
the U.S. Cordillera: In Burchfiel, B., Lipman, P., and Zoback, M. Eds., The Cordilleran Orogen:
conterminous U.S.:Geological Society of America, v. G-3, p. 205 – 260. 15
Mercado L., 2012., The Relationship between Topographic Profile and Mechanical Stratigraphy in
the Stillwell Anticline, West Texas. Trinity University Summer Symposium.
Moustafa, A.R., 1983, Analysis of Laramide and younger deformation of a segment of the Big Bend
region, Texas: Ph.D. Thesis, University of Texas at Austin, Austin, Texas, 278 p.
Moustafa, A.R., 1988, Structural geology of the Sierra del Carmen, Trans-Pecos, Texas: Geological
Quadrangle Map GQ-0054, University of Texas at Austin, Bureau of Economic Geology, 28 p.
Muehlberger, W.R., 1980, Texas Lineament Revisited: New Mexico Geological Society Guidebook,
31st Field Conference, Trans-Pecos Region, p. 113 – 121.
Muehlberger, W.R., and Dickerson, P.W., 1989, A tectonic history of Trans-Pecos, Texas, In
Muehlberger, W.R., andDickerson, P.W., Eds., Structure and stratigraphy of Trans-Pecos
Texas: American Geophysical Union Field Trip Guidebook T315, p. 35 – 54.
Murray, G., 1968, Quantitative fracture study – Sanish Pool, McKenzie County, North Dakota:
American Association of Petroleum Geologists Bulletin, v. 52, p. 57 – 65.
Narr, W., 1996, Estimating average fracture spacing in subsurface rock: American Association of
Petroleum Geologists Bulletin, v. 80, p. 1565 – 1586.
Nelson, R.A., and Serra, S., 1995, Vertical and lateral variations in fracture spacing in folded
carbonate sections and its relation to locating horizontal wells: Journal of Canadian
Petroleum Technology, v. 34, p. 51-56.
Nelson, R., 2001, Geologic analysis of naturally fractured reservoirs, 2nd Ed.: Gulf Professional
Publishing, Boston, Massachusetts, 332 p.
Ortega, O., Marrett, R., and Laubach, S., 2006, A scale-independent approach to fracture intensity
and average spacing measurement: American Association of Petroleum Geologists Bulletin,
v. 90, p. 193 – 208.

81
Ortega, O., Gale, J., and Marrett, R., 2010, Quantifying diagenetic and stratigraphic controls on
fracture intensity in Platform carbonates: an example from the Sierra Madre Oriental,
northeast Mexico: Journal of Structural Geology, v. 32, p. 1943 – 1959.
Page, W., Turner, K., and Bohannon, R., 2008, Geological, Geochemical, and Geophysical Studies by
the U.S. Geological Survey in Big Bend National Park, Texas, In Gray, J., and Page, W., Eds.,
U.S. Geological Survey Circular 1327, 93 p.
Palmström, A.,1995, RMi - a system for characterization of rock masses for rock engineering purposes: Ph.D. thesis, University of Oslo, Norway, 408 pp.
Palmström, A., and Stromme, B., 1996, The Weighted Joint Density Method Leads to Improved
Characterization of Jointing: Conference on Recent Advances in Tunnelling Technology,
New Delhi, India, 6p.
Paterson, M., and Wong T., 2005, Experimental Rock Deformation - The Brittle Field. Springer-
Verlag Berlin Heidelber.
Price, N., 1959, Mechanics of jointing in rocks: Geological Magazine, v. 96, p. 149 – 167.
Smart, K., Ferrill, D., and Morris, A., 2009, Impact of interlayer slip on fracture prediction from
geomechanical models of fault-related folds: American Association of Petroleum Geologists
Bulletin, v. 93, p. 1447 – 1458.
St. John, B.E., 1965, Structural geology of Black Gap area, Brewster County, Texas: Ph.D. Thesis,
University of Texas at Austin, Austin, Texas, 200 p.
St. John, 1966, Geology of Black Gap area, Brewster County, Texas: Geologic Quadrangle Map GQ-
30, University of Texas at Austin, Bureau of Economic Geology, 18 p.
Stearns, D. W., 1968, Certain aspects of fracture in naturally deformed rocks, In R. E. Riecker, Ed.,
NSF advanced science seminar in rock mechanics: Bedford, Massachusetts, Air Force
Cambridge Research Laboratories Special Report, p. 97–118.
Stearns, D., and Friedman, M., 1972, Reservoirs in fractured rocks: American Association of
Petroleum Geologists Memoir, No. 16, p. 82 – 100.
Stewart, S., and Podolski, R., 1998, Curvature analysis of gridded geological surfaces, In Coward, M.,
Daltaban, T., and Johnson, H., Eds., Structural geology in reservoir characterization:
Geological Society of London Special Publication 127, p. 133 – 147.
Stone, D. S., 1993, Basement-involved thrust-generated folds as seismically imaged in the
subsurface of the central Rocky Mountain foreland: In C. J. Schmidt, R. B. Chase, and E. A.
Erslev, Eds., Laramide basement deformation in the Rocky Mountain foreland of the
western United States: Geological Society of America Special Paper 280, p. 271–318.

82
Surpless, B.E., and Quiroz, K., 2010, Determining subsurface fault geometry from complex 3D fold
patterns: formation of the Stillwell anticline, west Texas: American Geophysical Union,
Abstracts with Programs, Abstract T51A-2022.
Surpless, B., Mays, B., and Hoin, D., 2012, Kinematic evolution of the Stillwell anticline system, west
Texas: implications for fluid flow within subsurface systems: Geological Society of America,
Abstracts with Programs, Abstract 206006.
Surpless, B., 2013, A new method to correct outcrop-scale observational bias: unpublished
manuscript.
Terzaghi R., 1965, Sources of error in joint surveys. Geotechnique, v. 15, 1965, pp 287-304.
Tinker, N., Keesling, G., Mercado, L., Surpless, B., and DeZoeten, E., 2013, Topographic profile,
mechanical stratigraphy, and interlayer slip: exploring coupled fold-fracture evolution of the
Stillwell anticline, west Texas: Abstracts with Programs, Southcentral Geological Society of
America, Abstract 217336.
Tran, N., 2007, Fracture orientation characterization: Minimizing statistical modeling errors:
Computational Statistics and Data Analysis, v. 51, p. 3187-3196.
Twiss, R., and Moores, E., 1992. Structural Geology. University of California at Davis. W.H. Freeman
and Company New York.
Underwood, C.A., Cooke, M.L., Simo, J.A., and Muldoon, M.A., 2003, Stratigraphic controls on
vertical fracture patterns in Silurian dolomite, northeastern Wisconsin: American
Association of Petroleum Geologists Bulletin, v. 87, p. 121–142.
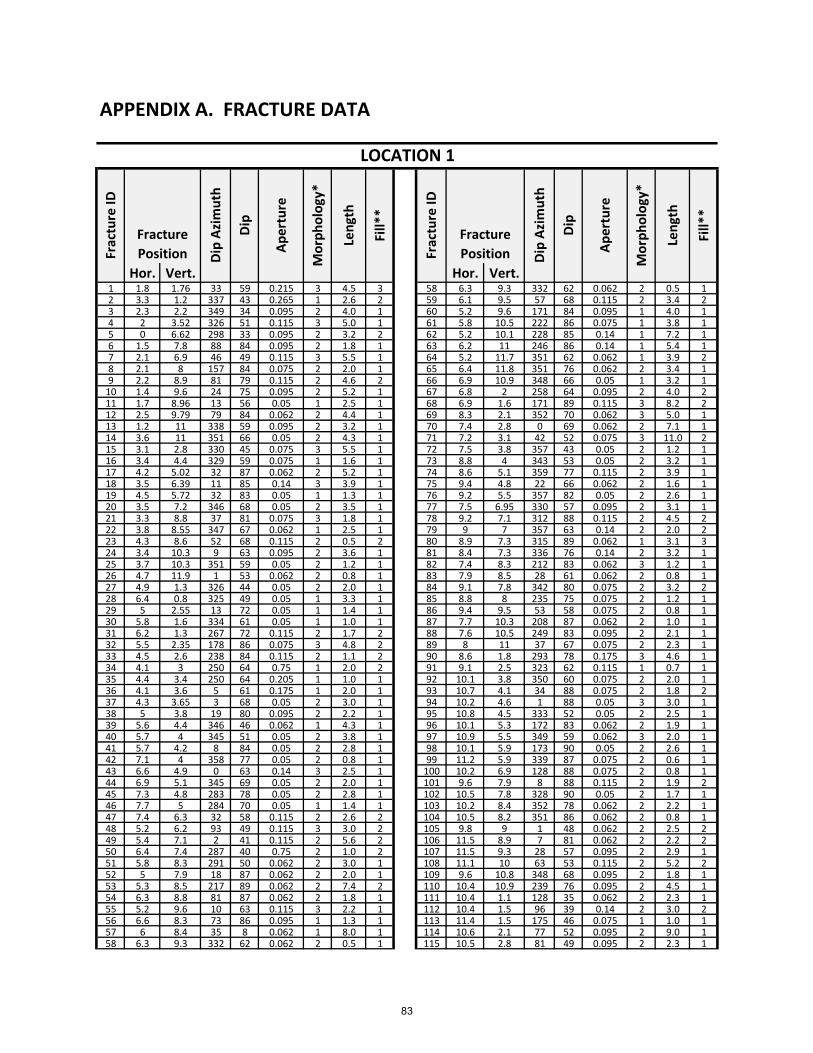
APPENDIX A. FRACTURE DATA
Hor. Vert. Hor. Vert.1 1.8 1.76 33 59 0.215 3 4.5 3 58 6.3 9.3 332 62 0.062 2 0.5 12 3.3 1.2 337 43 0.265 1 2.6 2 59 6.1 9.5 57 68 0.115 2 3.4 23 2.3 2.2 349 34 0.095 2 4.0 1 60 5.2 9.6 171 84 0.095 1 4.0 14 2 3.52 326 51 0.115 3 5.0 1 61 5.8 10.5 222 86 0.075 1 3.8 15 0 6.62 298 33 0.095 2 3.2 2 62 5.2 10.1 228 85 0.14 1 7.2 16 1.5 7.8 88 84 0.095 2 1.8 1 63 6.2 11 246 86 0.14 1 5.4 17 2.1 6.9 46 49 0.115 3 5.5 1 64 5.2 11.7 351 62 0.062 1 3.9 28 2.1 8 157 84 0.075 2 2.0 1 65 6.4 11.8 351 76 0.062 2 3.4 19 2.2 8.9 81 79 0.115 2 4.6 2 66 6.9 10.9 348 66 0.05 1 3.2 110 1.4 9.6 24 75 0.095 2 5.2 1 67 6.8 2 258 64 0.095 2 4.0 211 1.7 8.96 13 56 0.05 1 2.5 1 68 6.9 1.6 171 89 0.115 3 8.2 212 2.5 9.79 79 84 0.062 2 4.4 1 69 8.3 2.1 352 70 0.062 3 5.0 113 1.2 11 338 59 0.095 2 3.2 1 70 7.4 2.8 0 69 0.062 2 7.1 114 3.6 11 351 66 0.05 2 4.3 1 71 7.2 3.1 42 52 0.075 3 11.0 215 3.1 2.8 330 45 0.075 3 5.5 1 72 7.5 3.8 357 43 0.05 2 1.2 116 3.4 4.4 329 59 0.075 1 1.6 1 73 8.8 4 343 53 0.05 2 3.2 117 4.2 5.02 32 87 0.062 2 5.2 1 74 8.6 5.1 359 77 0.115 2 3.9 118 3.5 6.39 11 85 0.14 3 3.9 1 75 9.4 4.8 22 66 0.062 2 1.6 119 4.5 5.72 32 83 0.05 1 1.3 1 76 9.2 5.5 357 82 0.05 2 2.6 120 3.5 7.2 346 68 0.05 2 3.5 1 77 7.5 6.95 330 57 0.095 2 3.1 121 3.3 8.8 37 81 0.075 3 1.8 1 78 9.2 7.1 312 88 0.115 2 4.5 222 3.8 8.55 347 67 0.062 1 2.5 1 79 9 7 357 63 0.14 2 2.0 223 4.3 8.6 52 68 0.115 2 0.5 2 80 8.9 7.3 315 89 0.062 1 3.1 324 3.4 10.3 9 63 0.095 2 3.6 1 81 8.4 7.3 336 76 0.14 2 3.2 125 3.7 10.3 351 59 0.05 2 1.2 1 82 7.4 8.3 212 83 0.062 3 1.2 126 4.7 11.9 1 53 0.062 2 0.8 1 83 7.9 8.5 28 61 0.062 2 0.8 127 4.9 1.3 326 44 0.05 2 2.0 1 84 9.1 7.8 342 80 0.075 2 3.2 228 6.4 0.8 325 49 0.05 1 3.3 1 85 8.8 8 235 75 0.075 2 1.2 129 5 2.55 13 72 0.05 1 1.4 1 86 9.4 9.5 53 58 0.075 2 0.8 130 5.8 1.6 334 61 0.05 1 1.0 1 87 7.7 10.3 208 87 0.062 2 1.0 131 6.2 1.3 267 72 0.115 2 1.7 2 88 7.6 10.5 249 83 0.095 2 2.1 132 5.5 2.35 178 86 0.075 3 4.8 2 89 8 11 37 67 0.075 2 2.3 133 4.5 2.6 238 84 0.115 2 1.1 2 90 8.6 1.8 293 78 0.175 3 4.6 134 4.1 3 250 64 0.75 1 2.0 2 91 9.1 2.5 323 62 0.115 1 0.7 135 4.4 3.4 250 64 0.205 1 1.0 1 92 10.1 3.8 350 60 0.075 2 2.0 136 4.1 3.6 5 61 0.175 1 2.0 1 93 10.7 4.1 34 88 0.075 2 1.8 237 4.3 3.65 3 68 0.05 2 3.0 1 94 10.2 4.6 1 88 0.05 3 3.0 138 5 3.8 19 80 0.095 2 2.2 1 95 10.8 4.5 333 52 0.05 2 2.5 139 5.6 4.4 346 46 0.062 1 4.3 1 96 10.1 5.3 172 83 0.062 2 1.9 140 5.7 4 345 51 0.05 2 3.8 1 97 10.9 5.5 349 59 0.062 3 2.0 141 5.7 4.2 8 84 0.05 2 2.8 1 98 10.1 5.9 173 90 0.05 2 2.6 142 7.1 4 358 77 0.05 2 0.8 1 99 11.2 5.9 339 87 0.075 2 0.6 143 6.6 4.9 0 63 0.14 3 2.5 1 100 10.2 6.9 128 88 0.075 2 0.8 144 6.9 5.1 345 69 0.05 2 2.0 1 101 9.6 7.9 8 88 0.115 2 1.9 245 7.3 4.8 283 78 0.05 2 2.8 1 102 10.5 7.8 328 90 0.05 2 1.7 146 7.7 5 284 70 0.05 1 1.4 1 103 10.2 8.4 352 78 0.062 2 2.2 147 7.4 6.3 32 58 0.115 2 2.6 2 104 10.5 8.2 351 86 0.062 2 0.8 148 5.2 6.2 93 49 0.115 3 3.0 2 105 9.8 9 1 48 0.062 2 2.5 249 5.4 7.1 2 41 0.115 2 5.6 2 106 11.5 8.9 7 81 0.062 2 2.2 250 6.4 7.4 287 40 0.75 2 1.0 2 107 11.5 9.3 28 57 0.095 2 2.9 151 5.8 8.3 291 50 0.062 2 3.0 1 108 11.1 10 63 53 0.115 2 5.2 252 5 7.9 18 87 0.062 2 2.0 1 109 9.6 10.8 348 68 0.095 2 1.8 153 5.3 8.5 217 89 0.062 2 7.4 2 110 10.4 10.9 239 76 0.095 2 4.5 154 6.3 8.8 81 87 0.062 2 1.8 1 111 10.4 1.1 128 35 0.062 2 2.3 155 5.2 9.6 10 63 0.115 3 2.2 1 112 10.4 1.5 96 39 0.14 2 3.0 256 6.6 8.3 73 86 0.095 1 1.3 1 113 11.4 1.5 175 46 0.075 1 1.0 157 6 8.4 35 8 0.062 1 8.0 1 114 10.6 2.1 77 52 0.095 2 9.0 158 6.3 9.3 332 62 0.062 2 0.5 1 115 10.5 2.8 81 49 0.095 2 2.3 1
Morphology*
Length
Fill**
Fracture ID
Fracture
Position Dip Azimuth
Dip
Aperture
Length
Fill**
LOCATION 1
Fracture ID
Fracture
Position Dip Azimuth
Dip
Aperture
Morphology*
83

Hor. Vert. Hor. Vert.116 11.3 2.8 328 68 0.075 2 2.0 1 178 15.8 8.3 270 84 0.115 2 2.0 1117 11.7 3.7 334 63 0.05 2 1.0 1 179 16 8.4 320 88 0.05 2 2.0 1118 11.4 4.2 351 43 0.05 3 1.0 1 180 16 9.5 331 56 0.062 2 1.2 2119 11.5 4 46 84 0.062 2 1.8 1 181 16.2 10 25 72 0.05 2 2.0 1120 12 5.4 64 57 0.062 2 2.3 1 182 17 11.3 227 69 0.05 2 1.0 1121 10.5 6.3 52 87 0.05 2 2.2 1 183 17.3 11.4 227 69 0.05 1 1.5 1122 11 6.5 349 79 0.05 2 2.4 1 184 16.9 1.7 84 64 0.05 2 2.0 1123 11.5 6.6 337 90 0.115 3 3.1 1 185 17.5 0.7 118 83 0.062 1 6.0 1124 12.2 6.5 343 49 0.115 2 1.2 1 186 17.2 1.4 134 80 0.095 3 1.0 1125 12.5 6.6 335 66 0.075 2 2.9 1 187 18.5 1 51 41 0.05 3 3.0 2126 11.7 7.4 357 75 0.062 2 3.1 1 188 18.4 1.8 3 48 0.095 2 1.1 1127 13 7.9 348 46 0.095 2 2.0 2 189 17.7 2.9 266 61 0.115 2 3.0 1128 12 8 349 69 0.075 2 3.2 1 190 18.8 2.5 69 62 0.095 2 3.0 1129 12.3 8.2 28 47 0.05 2 2.8 2 191 18.9 3.2 26 56 0.062 2 2.4 1130 12.9 9.4 34 55 0.062 1 4.5 2 192 20.1 4.7 27 54 0.05 2 2.5 1131 12.7 11.1 350 58 0.062 1 2.9 1 193 19.4 6.5 356 57 0.05 2 2.3 1132 13.4 10.9 353 44 0.05 2 2.2 1 194 20.1 7 217 84 0.075 2 1.3 1133 12.5 1.3 328 65 0.075 2 1.2 1 195 19.7 7.6 38 56 0.075 2 3.5 2134 13 2.2 37 75 0.075 2 0.9 1 196 17.7 8.4 46 89 0.062 2 1.2 1135 12.1 2.8 310 74 0.075 2 1.0 1 197 17.8 9.7 11 52 0.095 2 2.0 2136 12.6 3.3 22 87 0.05 2 3.0 1 198 19.5 8.6 309 88 0.115 2 2.5 1137 13.6 2.6 36 77 0.075 2 2.5 1 199 19.8 8.3 36 70 0.14 2 2.0 1138 14.3 1.9 182 85 0.095 3 2.9 1 200 18.1 10 0 47 0.075 2 2.2 1139 14.2 1.9 351 46 0.05 2 1.8 1 201 19 9.8 48 62 0.062 3 1.0 3140 14.3 0.9 337 63 0.05 2 2.8 1 202 18.3 11.4 352 51 0.05 3 3.3 1141 14.4 3.3 358 61 0.062 2 3.0 1 203 19 10.6 27 53 0.075 2 7.0 2142 14.5 3.9 354 67 0.062 3 1.3 1 204 19.2 10.3 28 64 0.062 2 1.2 1143 14.5 4.2 355 86 0.075 3 1.0 1144 15 3.9 358 52 0.095 2 2.0 1145 12.8 3.6 202 86 0.062 1 1.2 1 **Fill *Morphology146 12.6 4.5 14 52 0.095 2 3.8 1 Filled fracture 1 Planar 1147 13.6 5.1 26 78 0.05 2 2.5 1 Partially filled fract. 2 Sub‐planar 2148 14.1 5.1 345 82 0.062 2 1.1 1 Open fracture 3 Sinuous 3149 13.8 5.9 31 78 0.095 2 3.2 1150 14.4 5.5 345 68 0.062 2 2.3 1151 14.2 5.8 346 56 0.05 1 1.5 1152 12.1 5.9 257 75 0.115 1 4.0 1153 13.8 6.8 33 61 0.075 2 2.3 1154 13.8 7.2 272 75 0.075 1 5.0 1155 13 8.2 276 78 0.115 2 2.0 1156 13.5 7.9 268 78 0.062 2 2.4 1157 14.2 7.8 33 60 0.062 2 1.0 1158 14.2 8.3 18 60 0.075 2 6.5 2159 14.5 8.9 32 74 0.075 2 2.8 1160 15 8.4 339 26 0.062 3 2.5 1161 14.6 9.2 12 51 0.062 3 5.0 1162 13.6 9.7 46 60 0.115 3 2.5 2163 15 10.5 75 84 0.062 2 2.2 1164 16 1.6 95 86 0.14 2 1.2 1165 16.1 2.6 51 62 0.062 2 4.0 1166 16.7 3.2 28 57 0.075 2 4.5 1167 18.1 2.8 28 51 0.05 2 1.8 1168 17.4 6.7 351 64 0.115 2 1.0 1169 18.2 4.3 2 37 0.075 3 6.0 2170 15.9 5.6 351 43 0.062 1 2.1 1171 16.2 4.9 51 58 0.062 2 3.1 1172 15.4 6.6 331 77 0.0115 3 11.0 2173 16.2 6.4 336 84 0.095 2 1.5 1174 17.5 6 238 64 0.095 1 3.0 1175 18 6.3 257 80 0.05 1 2.0 1176 17.7 7 95 56 0.075 3 2.0 3177 17.5 7.4 33 66 0.05 3 3.3 1
LOCATION 1 (CONTINUED)Fracture ID
Fracture
Position Dip Azimuth
Dip
Aperture
Morphology*
Aperture
Morphology*
Length
Fill**
Length
Fill**
Fracture ID
Fracture
Position Dip Azimuth
Dip
84

Hor. Vert. Hor. Vert.1 1 2.3 78 76 0.62 1 6.0 1 63 30.5 2.9 289 86 0.265 2 9.0 12 1.1 5.5 352 89 0.095 1 11.0 1 64 27 6.7 267 87 0.215 1 4.0 13 1.5 4.7 352 89 0.4 1 7.0 1 65 28.5 6.8 59 67 0.075 1 12.0 14 2 4.3 0 65 0.4 2 13.5 1 66 28.5 7.7 80 67 0.062 1 4.0 15 2.8 3 168 67 0.215 1 3.8 1 67 30 7.9 30 57 0.075 1 5.0 16 3.5 5.2 219 62 0.5 1 3.0 1 68 30.5 7.6 30 71 0.05 1 3.0 17 5 1 275 80 0.215 1 9.0 1 69 33 7.2 187 86 0.215 3 5.0 18 4 8 125 90 0.4 2 7.0 1 70 32 6.5 317 58 0.05 1 4.0 19 7.5 1.6 110 82 0.05 1 9.0 1 71 31 5.3 11 68 0.115 2 6.0 110 8 3.3 216 84 0.115 2 8.0 1 72 32 4.7 12 70 0.062 2 2.0 111 8.5 2.4 235 83 0.173 1 8.7 1 73 31.5 2 29 6 0.115 3 4.0 112 7.5 7.5 109 89 0.05 1 8.8 1 74 34.5 1.5 30 72 0.265 3 11.0 113 10 4 76 57 0.095 2 7.0 3 75 36 2.9 91 59 0.14 1 4.0 114 9 7.3 253 89 0.4 1 7.5 1 76 37 3.1 102 69 0.095 1 4.0 115 10.5 9.9 84 87 0.05 2 10.0 1 77 35 3.4 107 89 0.115 1 4.0 116 11 8.8 38 36 0.175 2 13.0 1 78 36.5 1 112 89 0.062 1 3.0 117 12 1.2 160 72 0.062 1 2.0 1 79 35.5 6.8 53 82 0.065 2 6.6 118 13 1 167 82 0.5 2 5.5 1 80 37 1.8 303 87 0.33 3 6.0 119 13.5 1.7 201 85 0.4 2 10.0 1 81 42 1 34 69 0.215 2 8.0 120 13.5 6.1 115 70 0.33 1 7.5 1 82 45 1 68 60 0.215 2 5.0 121 14.5 2.4 203 81 0.4 2 6.0 1 83 38 6.8 284 81 0.05 2 6.0 122 8 11.8 124 88 0.265 2 10.5 1 84 37 7 288 83 0.095 2 5.5 123 9.5 11.7 154 62 0.05 1 10.0 1 85 36 7.7 113 76 0.05 1 4.0 124 15 8.4 182 65 0.215 2 4.8 1 86 35 8.3 284 84 0.062 1 8.0 125 15.5 0.4 182 65 0.215 2 4.8 1 87 34.5 8.6 281 83 0.095 1 7.0 126 15.5 0.8 162 81 0.33 1 3.0 1 88 40.5 5.3 178 84 0.115 2 6.0 127 17 1.2 17 81 0.265 3 3.0 1 89 41 6.8 86 52 0.115 1 9.0 128 17 0.2 127 85 0.4 3 4.5 1 90 39.5 7 102 86 0.175 2 7.0 129 24 0.5 119 72 0.4 3 4.0 1 91 42.5 6.5 271 85 0.14 1 10.0 130 19 0.8 167 81 0.5 2 2.5 1 92 43 4.9 71 50 0.05 2 4.5 131 20.2 1.2 18 84 0.175 2 1.0 1 93 41.5 4.3 99 90 0.115 1 6.0 132 20 1.8 108 72 0.215 2 3.0 1 94 42 4 102 61 0.062 1 4.5 133 21 1.2 64 78 0.062 2 3.0 1 95 43 3.2 240 73 0.115 1 5.0 134 20.5 4.3 148 81 0.05 1 8.0 2 96 43.5 3.6 106 77 0.062 2 8.0 135 23 3 265 87 0.14 2 4.0 1 97 44 3.8 36 67 0.115 1 3.3 136 23.5 4.2 232 82 0.4 2 9.5 1 98 43.5 2.4 16 82 0.062 1 4.0 137 24 5.1 134 83 0.075 1 4.0 1 99 45 3.3 18 61 0.095 1 2.2 138 25 3.3 216 67 0.4 3 6.0 1 100 46 3.2 127 74 0.095 2 3.3 139 23.8 5.7 142 74 0.05 1 6.5 1 101 44 5.3 110 60 0.05 1 5.0 140 27 3.1 185 52 0.14 2 3.0 1 102 44.5 6.4 112 74 0.05 1 3.0 141 26 2.3 297 83 0.115 2 3.5 1 103 45 6.3 114 71 0.05 1 5.0 142 28 2.4 237 71 0.265 3 6.0 1 104 44 7.4 241 78 0.265 3 11.0 143 25 5.6 249 69 0.5 3 14.0 1 105 44 7.2 117 87 0.062 2 6.6 144 20.5 6.1 163 67 3 4.0 1 106 46.5 5.9 242 79 0.215 2 3.0 145 22 6.6 118 68 0.5 2 6.0 1 107 43 8.4 128 52 0.05 2 5.5 146 20.5 8.4 51 64 0.33 2 5.5 1 108 46 7.5 46 16 0.095 2 4.0 247 13.5 9.2 71 67 0.33 3 5.5 1 109 46 7.6 68 55 0.062 2 4.5 148 15.5 8.5 299 77 0.062 3 3.0 1 110 48 4.1 82 37 0.095 1 1.1 349 14.5 9 94 79 0.062 1 3.0 1 111 50.5 7.6 117 65 0.269 2 6.6 150 16 8.7 122 68 0.095 1 5.0 1 112 49.5 6.6 110 54 0.095 1 2.2 151 16.5 8.3 133 69 0.4 1 3.0 1 113 50 4.9 121 83 0.115 1 5.0 152 17 8.3 285 85 0.095 1 3.0 1 114 47 2.6 104 57 0.115 2 4.0 353 18 9.4 48 55 0.5 2 4.0 1 115 50 5.3 3 66 0.062 1 2.0 154 15 10.6 57 74 0.215 2 5.0 1 116 48.5 1.2 221 56 0.05 2 3.5 155 14.5 10.6 79 84 0.05 2 3.0 1 117 45.5 3.9 115 59 0.062 1 1.5 156 19.5 10.9 61 63 0.62 3 15.0 1 118 49 2.9 9 31 0.175 2 7.0 257 29 2.8 119 71 0.071 1 3.0 1 119 52 1.5 130 72 0.062 1 3.0 158 29.5 2.8 217 85 0.071 1 4.0 1 120 52 2.8 105 47 0.095 1 3.3 159 30.5 2.7 112 67 0.05 1 5.0 1 121 51 3.3 318 81 0.075 1 6.0 160 30.5 3 234 82 0.05 1 7.0 1 122 51.5 3.8 136 75 0.075 1 6.0 161 32 2.7 275 72 0.115 2 5.5 1 123 51.5 5.3 359 79 0.05 2 3.0 162 31 3.1 225 76 0.062 1 1.0 1 124 52 6 359 79 0.062 1 5.0 1
LOCATION 2Fracture ID
Fracture
Position Dip Azimuth
Dip
Aperture
Morphology*
Length
Fill**
Fracture ID
Fill**
Fracture
Position Dip Azimuth
Dip
Aperture
Morphology*
Length
85

Hor. Vert. Hor. Vert.125 54 4.2 11 63 0.062 1 4.0 1 187 76.5 1.9 132 53 0.075 1 3.5 1126 53.5 5.5 209 82 0.05 1 5.0 1 188 77.5 0.8 143 55 0.05 1 4.0 1127 55 5.9 124 40 0.062 2 4.0 1 189 78 1.3 138 59 0.062 1 4.0 1128 53 8.5 199 86 0.05 1 3.3 1 190 78.5 1.5 142 59 0.05 1 4.0 1129 57 7.1 42 75 0.075 1 2.0 1 191 79 1.8 109 67 0.075 2 2.0 1130 57 7.8 89 76 0.14 2 3.3 1 192 76 2.6 116 54 0.175 2 7.0 1131 56.5 5.1 123 58 0.4 2 10.5 1 193 75.5 2.9 34 87 0.33 2 8.0 1132 55 1.3 121 56 0.14 2 4.5 1 194 75 2.8 115 53 0.095 2 4.5 1133 58 4 125 45 0.33 3 4.0 1 195 74.5 2.5 135 57 0.062 1 5.5 1134 58.5 7.1 259 74 0.4 2 3.0 1 196 75.5 4.4 148 63 0.075 2 6.0 1135 60 4.8 196 84 0.115 1 2.2 1 197 76 4.6 139 51 0.05 1 1.0 1136 61 4 124 54 0.33 2 9.5 1 198 72.5 5 89 72 0.05 1 3.3 1137 59 8.1 190 48 0.05 1 2.0 1 199 71.5 183 58 0.075 1 2.5 1138 60.5 6.9 253 74 0.062 3 3.0 1 200 73 5.9 119 52 0.062 1 5.0 1139 61 8.4 121 59 0.062 2 3.0 1 201 72 5.3 97 76 0.075 2 5.5 1140 61.5 9.2 127 50 0.05 1 2.0 1 202 70.5 189 64 0.14 1 4.5 1141 62.5 8.2 118 50 0.115 2 4.0 1 203 72.5 7.2 84 66 0.095 1 2.4 2142 62.5 7.2 237 81 0.175 1 5.0 1 204 72.5 8.7 84 60 0.075 2 2.5 1143 62 6 119 51 0.4 2 5.0 1 205 70.5 8.8 86 62 0.05 2 4.0 1144 63 4.5 121 57 0.062 1 4.0 1 206 72 9.1 151 64 0.05 1 4.0 1145 64.5 5 119 57 0.062 1 5.0 1 207 73 8.5 240 75 0.5 3 13.0 2146 63 6 119 49 0.05 2 5.0 1 208 74.5 8 348 80 0.095 2 1.3 2147 63 3 116 66 0.05 1 2.0 1 209 75.5 6.2 348 80 0.075 1 2.3 1148 64.5 1.8 115 64 0.14 2 4.5 1 210 74.5 6.2 111 54 0.14 1 6.0 1149 64 2.7 121 50 0.05 1 4.0 1 211 77 6.5 292 76 0.14 2 4.0 1150 65 1.5 164 80 0.115 1 3.3 1 212 78 6.2 293 76 0.265 3 14.0 1151 65 1.2 91 41 0.062 2 3.0 1152 66.5 2.2 112 41 0.062 2 3.0 1153 66.5 5.5 113 44 0.095 1 1.0 1 **Fill *Morphology154 67.5 7 122 44 0.062 1 1.0 1 Filled fracture 1 Planar 1155 67 5.5 118 52 0.05 2 2.0 1 Partially filled fract. 2 Sub‐planar 2156 68.5 3.4 112 53 0.095 2 4.0 1 Open fracture 3 Sinuous 3157 68.5 3 100 49 0.062 1 6.0 1158 69 3.4 92 60 0.062 1 5.0 1159 69 2.5 112 44 0.062 1 4.0 1160 70.5 3.8 112 62 0.075 2 2.0 1161 68 4.4 289 78 0.4 3 7.0 1162 70 5.1 177 59 0.062 2 3.0 1163 69.5 6.1 126 45 0.5 2 7.5 2164 66.5 5.4 108 42 0.062 2 7.5 1165 68.5 6 134 36 0.05 1 10.0 1166 67.5 5.3 198 90 0.05 1 3.0 1167 66.5 6.5 48 72 0.14 2 1.0 1168 65 7 114 36 0.215 2 7.0 1169 66 7.3 117 39 0.14 2 3.0 1170 64 7.1 195 32 0.175 2 6.0 2171 69 6.8 38 61 0.095 1 1.0 2172 69.5 6.6 27 59 0.095 1 0.5 1173 70 6.4 116 58 0.14 3 3.0 1174 71 2.8 123 62 0.062 1 3.0 1175 70.5 2.9 179 68 0.14 2 5.5 1176 70.5 2.1 113 53 0.05 2 2.5 1177 72.5 2 124 57 0.05 1 3.0 1178 72 1.6 121 73 0.062 1 6.0 1179 72.5 1.8 223 88 0.05 1 2.5 1180 73 1.5 154 59 0.05 1 5.0 1181 70.5 1.3 200 61 0.062 1 2.5 1182 73 0.7 138 79 0.075 1 3.4 1183 76.5 1 47 88 0.05 1 3.3 1184 75 1.5 46 39 0.05 1 3.5 1185 75.5 1.5 131 52 0.062 2 4.0 1186 75.5 1.1 127 56 0.33 1 6.0 1
LOCATION 2 (continued)Fracture ID
Fracture
Position Dip Azimuth
Dip
Aperture
Morphology*
Length
Morphology*
Length
Fill**
Fill**
Fracture ID
Fracture
Position Dip Azimuth
Dip
Aperture
86

Hor. Vert. Hor. Vert.1 0 0.9 339 68 0.330 2 7.5 22 2 4.4 7 71 0.175 2 8.0 2 64 44.4 2.8 177 72 0.05 1 5.0 13 6.6 1.6 119 49 0.075 1 2.0 1 65 45 3.8 181 61 0.062 1 4.0 14 6.9 1.3 215 41 0.175 2 3.3 1 66 45.6 6.9 132 56 0.075 2 7.0 15 7.5 4.5 347 82 0.62 2 6.0 1 67 45.1 5.3 207 56 0.05 1 5.0 16 8.4 5.6 140 55 0.062 1 2.5 1 68 45.9 5.3 209 59 0.062 1 3.0 17 9.3 2 171 61 0.115 2 5.0 1 69 46.3 5.9 128 48 0.075 1 3.0 18 12 0 139 19 0.095 2 4.5 2 70 47.7 6.3 171 70 0.05 2 3.0 19 11.8 0.9 149 31 0.115 1 8.0 1 71 48.8 5.2 166 65 0.075 1 5.0 110 13 1.6 73 53 0.062 2 6.0 1 72 49.6 4.6 106 28 0.050 2 4.0 111 12.4 7.2 154 31 0.75 3 10.0 1 73 51.6 4.5 141 45 0.05 2 4.0 112 14.6 5.8 208 36 0.075 1 7.5 1 74 51.5 3.6 187 71 0.05 1 5.0 113 15.5 4.1 175 46 0.075 1 4.5 1 75 52.5 3.9 249 40 0.140 2 4.0 114 17.2 0.6 143 35 0.075 1 2.0 1 76 53.3 4.5 141 45 0.175 2 3.5 115 17.8 4.1 67 83 0.140 2 8.5 2 77 53 4.2 181 74 0.062 1 6.0 116 19.7 7.2 45 82 0.400 2 6.0 2 78 53.2 1.9 172 60 0.05 1 4.0 117 20.3 7.2 229 89 0.050 2 7.0 1 79 53.4 3.2 77 88 0.05 1 4.0 119 20 3.4 146 76 0.05 1 4.0 1 80 53.9 1.9 149 80 0.062 2 5.0 120 20.9 5.8 227 87 0.075 2 4.0 1 81 55.9 2.9 77 54 0.175 1 4.5 121 20.7 4.7 229 87 0.050 3 9.0 1 82 55.2 4.8 213 53 0.115 1 5.0 122 21.5 6.8 56 85 0.115 2 8.5 1 83 54.7 4.6 126 40 0.14 1 2.0 123 22.4 1.5 237 87 0.215 3 7.0 1 84 56.7 6.1 208 83 0.115 2 4.0 124 23 2.3 84 43 0.095 2 4.0 1 85 56.2 6 178 62 0.075 2 3.0 125 23.6 5 151 59 0.14 1 1.5 1 86 57.5 3.9 154 69 0.075 1 5.0 126 24.5 2.6 81 61 0.075 2 5.5 1 87 57 5.3 173 52 0.05 2 3.0 127 23.9 2.5 230 73 0.140 1 4.5 1 88 57.2 5 227 87 0.05 1 4.0 128 23 4.4 174 59 0.14 2 6.0 1 89 57.7 6 213 83 0.075 1 4.0 129 25.4 2 77 54 0.075 1 5.0 1 90 56.6 6.3 212 52 0.062 1 3.5 130 25.6 2.3 77 54 0.050 1 6.0 1 91 56.9 6.5 123 64 0.115 1 5.0 131 25.8 5.7 168 32 0.05 2 5.5 1 92 59 6 191 63 0.05 1 3.0 132 21.6 3.2 80 67 0.075 1 5.0 1 93 58.5 6 212 63 0.05 1 4.0 133 28.3 3.6 80 67 0.075 1 6.0 1 94 58.3 3.7 184 67 0.075 2 6.0 134 28.4 5.2 67 80 0.050 1 6.6 1 95 58.8 4 177 67 0.075 1 4.0 135 28.8 5 249 33 0.115 1 4.0 1 96 58.5 4.4 159 60 0.062 1 4.0 136 30.5 5.5 249 27 0.140 1 6.0 1 97 59.3 4.4 161 58 0.115 1 4.0 137 31.2 2.8 118 27 0.095 1 4.0 1 98 59.7 5.3 76 55 0.095 1 2.0 138 32.2 5.3 177 55 0.115 1 7.0 1 99 60.9 4.6 222 77 0.05 2 4.0 139 33.6 1.4 68 71 0.050 1 6.5 1 100 61 5.3 130 47 0.075 1 2.0 140 35 2.2 249 90 0.075 1 6.0 1 101 62.1 4.4 65 66 0.115 1 4.0 141 35.6 1.1 76 87 0.095 1 6.3 1 102 63.2 5.2 76 60 0.175 1 5.3 142 33.2 5 162 69 0.14 1 5.0 1 103 62.6 6.3 185 51 0.095 2 4.0 143 34 5 154 69 0.05 1 4.0 1 104 63.6 7.5 114 46 0.14 2 5.5 244 34.2 3.3 149 69 0.175 1 4.0 1 105 64.9 7.6 154 39 0.062 2 4.5 145 35.6 4.1 217 69 0.115 1 4.0 1 106 65.1 5.6 213 68 0.05 1 6.0 146 36.2 5.4 3 89 0.115 3 5.0 1 107 64.1 3 93 39 0.075 1 3.5 147 35.7 3.6 138 59 0.05 1 5.0 1 108 66.1 3.5 93 39 0.115 1 3.0 148 35.3 5.9 137 73 0.095 1 2.5 1 109 66.4 3.1 216 77 0.075 1 3.0 149 37.8 7.1 196 60 0.115 1 4.5 2 110 68.4 3.1 167 52 0.095 2 5.0 150 38.3 6.6 152 67 0.062 2 4.0 1 111 68.3 5.6 93 36 0.095 1 4.5 151 38.7 5.5 236 66 0.095 1 6.0 1 112 66.3 6.1 199 82 0.115 1 6.0 152 37.5 6 158 67 0.115 1 1.0 1 113 68 7.5 154 39 0.050 2 3.0 153 39.3 1.9 142 31 0.050 1 6.0 1 114 68.9 5.3 166 75 0.05 2 4.0 154 38.9 3.6 133 62 0.050 1 1.3 1 115 69.8 6.5 176 51 0.115 1 4.0 155 40.3 4.8 194 74 0.115 1 9.0 1 116 69.2 6.5 195 54 0.075 1 4.0 156 40.2 5.4 216 78 0.075 1 7.0 1 117 71.3 5.9 197 77 0.062 1 4.0 157 41.7 6 146 49 0.075 1 4.0 1 118 71.3 4.8 213 76 0.265 2 4.0 158 41.2 6.9 152 51 0.05 2 3.0 1 119 70.9 6.8 176 71 0.062 1 4.0 159 41.7 3.4 137 44 0.075 1 5.0 1 120 70.9 7.3 176 71 0.05 1 3.0 160 41.9 2.8 126 49 0.075 1 5.0 1 121 71.8 3 234 74 0.05 1 4.5 161 43.1 4.7 179 62 0.05 2 6.0 1 122 72.6 4.5 161 53 0.05 1 4.0 162 43.6 5.3 185 55 0.05 2 5.0 1 123 71.3 4.3 163 45 0.075 1 6.0 163 44.7 3.2 214 83 0.05 1 3.0 1 124 70.2 1 182 38 0.140 1 5.0 1
LOCATION 3Fracture ID
Fracture
Position Dip Azimuth
Dip
Aperture
Morphology*
Length
Fill**
Fracture ID
Fill**
Fracture
Position Dip Azimuth
Dip
Aperture
Morphology*
Length
87

Hor. Vert. Hor. Vert.125 72.1 2.8 189 80 0.065 2 3.0 1 187 109.3 7.9 222 90 0.115 2 4.0 1126 73.2 3.7 230 81 0.115 1 4.0 1 188 109 8.8 209 50 0.075 1 4.0 1127 73.8 4.5 157 38 0.062 3 3.5 1 189 109.8 7.4 212 83 0.175 2 5.0 1128 73.6 5.7 192 53 0.05 1 5.0 1 190 110.2 5.8 74 86 0.115 2 5.0 1129 69.3 6.9 201 51 0.062 1 4.0 1 191 110.4 5.2 77 84 0.062 1 5.0 1130 72.8 7.1 174 52 0.05 1 4.0 1 192 111.1 6.2 75 87 0.115 2 7.0 2131 72.9 6.7 158 66 0.075 2 5.0 2 193 112.3 5 88 74 0.33 3 10.0 1132 76.3 3.7 168 84 0.095 3 5.5 1 194 113.9 0.9 157 41 0.062 2 4.5 1133 75 3.7 171 52 0.075 2 4.0 1 195 112.6 6.3 83 82 0.115 1 5.0 1134 75.8 6 192 50 0.062 1 7.0 1 196 114.8 0.8 86 48 0.095 2 3.5 1135 75.9 5.7 183 52 0.115 1 9.0 2 197 116.6 6.5 194 55 0.05 2 3.0 1136 77.6 1.7 228 79 0.050 2 5.5 1 198 118.6 4.2 199 84 0.14 2 7.0 1137 76.7 5.4 195 72 0.095 1 5.0 1 199 119.7 5.1 223 49 0.062 2 5.0 1138 77.7 5.3 157 56 0.115 2 6.0 1 200 119.5 1.6 81 55 0.175 1 5.5 1139 78.5 3.9 171 79 0.5 3 3.0 1 201 118.3 0.7 127 52 0.115 2 5.0 1140 79.1 5.7 109 88 0.215 2 7.0 1 202 119.2 0.1 114 46 0.095 2 4.5 1141 79.6 4.5 211 90 0.215 3 5.0 1 203 119.3 0.1 209 50 0.095 1 2.0 1142 82.1 5.9 253 79 0.115 2 9.0 1 204 121.4 5.7 99 51 0.175 2 5.0 1143 84.3 5.9 214 72 0.115 3 6.0 1 205 119.7 7.3 200 52 0.095 1 2.0 1144 85.4 4.3 3 69 0.065 2 5.0 1 206 117.9 6.6 103 45 0.062 2 2.0 1145 86.2 2 73 68 0.065 1 5.0 2 207 121.4 1.7 143 46 0.175 1 2.0 1146 90.2 2.2 216 85 0.05 1 4.0 1 208 123.2 0 182 55 0.05 2 4.0 1147 88.8 2.7 134 78 0.075 1 1.5 1 209 124.8 0 229 80 0.115 2 5.0 1148 87.8 3.5 205 80 0.05 1 4.0 1149 87.8 4 183 77 0.05 1 3.0 1150 87.6 5.4 154 65 0.062 1 4.2 1 **Fill *Morphology151 88.4 5.6 201 70 0.075 1 4.0 1 Filled fracture 1 Planar 1152 87.7 6.3 211 82 0.05 1 4.0 1 Partially filled fract. 2 Sub‐planar 2153 86.6 6 178 75 0.062 1 3.0 1 Open fracture 3 Sinuous 3154 87.4 6.3 189 75 0.05 1 4.0 1155 87 7.3 169 55 0.175 2 4.0 1156 89.9 6.5 47 81 0.4 2 4.0 1157 90.5 5.9 177 71 0.05 1 3.0 1158 90.6 5.3 147 87 0.265 2 5.0 1159 91.3 2.3 159 52 0.115 2 9.0 1160 91.5 2.1 168 52 0.062 1 4.0 1161 90.9 1.1 186 68 0.062 1 4.5 1162 92 2.4 178 76 0.14 1 6.0 1163 92.2 3.5 174 58 0.115 1 5.5 1164 89.2 3.7 212 57 0.05 2 5.0 1165 92.7 4.8 32 81 0.500 1 8.0 1166 93.6 4.5 59 85 0.215 3 6.5 1167 95 1.8 73 88 0.175 2 6.0 1168 95.5 4.9 73 90 0.175 3 4.0 1169 98.2 4.1 253 49 0.05 1 4.0 1170 99.8 3.5 179 56 0.075 2 6.0 1171 99.4 2.5 154 53 0.05 1 6.0 1172 99.6 0 182 33 0.050 2 10.0 1173 101.6 1.3 202 59 0.115 1 4.5 1174 100.8 1.9 176 66 0.062 2 3.0 1175 100.9 4.4 206 64 0.05 1 6.0 1176 101.3 5.9 38 87 0.05 2 6.0 1177 101.7 6.8 199 63 0.05 2 6.0 1178 104.6 3.8 192 40 0.175 2 14.0 1179 104.7 3.3 94 80 0.062 1 6.0 1180 102.8 7.5 168 28 0.062 2 9.0 2181 110.1 1.5 194 44 0.062 1 5.0 1182 107.5 0.2 283 86 0.05 1 3.0 2183 106.6 1.5 181 68 0.115 3 4.0 1184 106.6 6.5 175 46 0.115 2 5.5 1185 106.7 6.8 175 46 0.062 2 3.0 1186 108 9.8 172 44 0.115 2 5.0 1
LOCATION 3 (continued)Fracture ID
Fracture
Position Dip Azimuth
Dip
Aperture
Morphology*
Length
Fill**
Length
Fill**
Fracture ID
Fracture
Position Dip Azimuth
Dip
Aperture
Morphology*
88

Hor. Vert. Hor. Vert.1 3.4 2.0 216 68 0.05 2 3.5 1 65 4.6 7.7 17 81 0.075 1 1.8 12 2.6 2.5 6 83 0.05 1 3.5 1 66 5.2 8.0 284 46 0.075 2 3.3 13 2.3 3.0 19 78 0.075 1 3.0 1 67 4.4 8.6 18 78 0.075 1 3.9 14 3.2 3.0 232 59 0.05 1 3.4 1 68 5 9.0 339 57 0.05 1 2.4 15 3.7 2.9 0 88 0.062 2 1.8 1 69 6 8.1 318 61 0.05 2 2.2 16 2.4 3.8 294 59 0.05 2 3.6 1 70 3.9 9.6 206 73 0.075 2 2.0 17 4.2 3.8 254 54 0.05 2 3.8 1 71 5.2 9.3 280 43 0.175 2 1.0 18 3 4.1 283 33 0.062 2 2.5 1 72 5.2 10.3 264 72 0.095 2 2.5 19 4.1 4.6 334 68 0.05 1 2.1 1 73 5.2 10.5 277 60 0.095 2 2.0 110 3.5 5.0 329 55 0.075 2 1.7 1 74 5.1 11.6 285 63 0.062 1 2.4 111 1.2 4.7 280 25 0.095 2 1.4 1 75 5.9 12.0 250 59 0.062 1 1.8 112 2.3 5.5 264 40 0.05 1 2.3 1 76 4.9 12.7 240 63 0.062 3 2.2 113 2.6 5.8 19 87 0.95 2 0.6 1 77 6.1 12.3 16 75 0.05 2 2.4 114 0.6 5.7 83 77 0.075 2 2.2 1 78 5.7 12.9 223 57 0.062 1 3.2 115 0.2 6.5 303 69 0.062 2 2.3 1 79 4.8 13.8 340 84 0.095 2 2.9 116 2.1 6.8 261 77 0.075 1 3.3 2 80 4.1 14.1 41 86 0.14 1 6.0 217 2.6 6.8 26 86 0.265 2 3.6 1 81 4.6 14.8 14 78 0.095 1 3.4 118 3.3 6.5 194 80 0.175 2 2.0 1 82 5.8 14.5 345 80 0.075 1 3.5 119 3.1 6.1 194 81 0.062 1 2.5 2 83 6.1 1.0 17 82 0.115 2 2.4 120 3.8 7.8 195 87 0.062 1 3.6 1 84 6.1 2.4 285 41 0.062 2 3.2 121 1.8 7.9 324 67 0.095 2 4.4 1 85 7.2 1.0 241 55 0.075 1 3.5 122 3.8 8.4 287 50 0.095 2 3.2 1 86 7.4 2.0 292 48 0.05 1 2.4 123 3.9 9.5 303 52 0.062 1 4.4 1 87 8.1 0.9 251 55 0.075 2 3.0 124 2.2 10.0 1 63 0.05 2 3.6 1 88 7.9 1.9 288 48 0.062 1 2.8 125 2.8 10.1 217 66 0.062 2 4.1 1 89 7.7 2.3 286 45 0.075 2 2.8 126 1.4 10.7 303 45 0.05 1 4.1 1 90 8.2 2.3 267 52 0.075 2 2.2 127 1.7 11.0 307 46 0.05 1 2.1 1 91 6.2 3.2 329 69 0.14 2 4.0 128 2.2 11.0 3 78 0.062 1 2.9 1 92 7.7 4.1 285 48 0.062 2 2.8 129 2.4 11.2 3 78 0.05 2 3.2 1 93 7.6 4.9 200 63 0.062 2 4.1 130 3.4 10.6 276 52 0.05 2 2.6 1 94 8.7 4.3 262 58 0.095 2 5.5 131 3.8 10.3 245 71 0.05 2 2.8 1 95 9 4.2 20 79 0.062 2 4.2 132 3.7 11.2 53 90 0.062 1 2.5 1 96 8.4 4.8 13 78 0.05 1 2.2 133 3.8 11.3 24 78 0.062 1 1.1 1 97 7.4 5.5 17 84 0.075 2 2.4 134 4.4 11.2 300 48 0.05 1 2.2 1 98 6.9 6.5 248 52 0.062 1 1.1 135 4 11.5 24 75 0.075 1 3.2 1 99 6.7 6.8 258 54 0.05 1 3.1 136 3 12.0 301 46 0.095 2 2.7 1 100 7.1 6.8 255 57 0.062 2 2.3 137 2.9 12.6 329 61 0.062 1 0.5 1 101 8.2 6.9 303 64 0.062 2 3.0 138 3.7 12.2 264 49 0.05 2 3.0 1 102 8.5 6.8 264 41 0.075 2 3.3 139 1.2 13.4 335 50 0.062 1 4.4 1 103 6.1 8.0 319 57 0.05 1 2.6 140 2.1 14.0 251 79 0.115 1 4.7 1 104 7.4 7.9 338 78 0.062 1 2.9 141 2.9 13.3 345 57 0.05 2 3.0 1 105 8.5 8.2 339 37 0.075 2 2.9 142 2.9 12.7 338 39 0.062 1 2.4 1 106 8.8 8.1 212 82 0.095 2 3.1 143 3.1 12.7 217 88 0.05 1 2.8 1 107 6.2 9.3 256 48 0.062 2 2.6 144 3.7 12.9 308 47 0.05 1 2.3 1 108 6.9 9.0 280 50 0.05 1 2.1 145 3.9 13.5 24 73 0.05 2 2.9 1 109 7.6 9.3 247 60 0.265 2 1.9 246 3.6 14.0 271 51 0.062 2 2.9 1 110 8.6 9.1 309 45 0.062 1 3.0 147 2.2 15.0 326 58 0.075 2 2.0 1 111 9.7 9.0 248 73 0.05 2 2.9 148 3.2 14.5 308 41 0.05 2 2.9 1 112 9.8 9.6 248 73 0.05 2 2.3 149 4.2 2.0 278 60 0.05 1 3.0 1 113 9 9.4 242 80 0.05 1 2.1 150 5.1 1.6 17 81 0.05 2 2.0 1 114 8.4 9.5 312 54 0.062 2 2.7 151 4.9 2.5 44 86 0.05 1 2.2 1 115 6.4 10.2 279 57 0.115 2 1.3 152 5.2 2.6 270 61 0.05 1 1.8 1 116 7 10.0 284 55 0.062 2 2.8 155 5.7 4.0 304 43 0.05 1 3.1 1 117 7.4 10.2 262 66 0.05 2 2.4 156 6.8 3.7 308 57 0.062 2 2.2 1 118 6.1 11.3 240 74 0.075 1 2.5 157 5.4 5.2 297 49 0.33 2 2.2 1 119 6.5 10.7 238 75 0.215 2 3.1 158 6.6 5.8 299 45 0.062 2 3.7 1 120 7 10.8 272 74 0.05 1 3.1 159 4.8 6.0 299 43 0.062 2 2.0 1 121 8.1 10.6 287 57 0.062 1 2.8 160 5.3 6.6 271 42 0.05 2 3.7 1 122 6.5 11.4 261 63 0.115 1 3.8 161 6 6.5 319 35 0.05 2 2.2 1 123 7.6 12.6 282 63 0.075 2 2.9 162 4.8 6.6 276 45 0.062 2 3.1 1 124 8.2 13.0 306 68 0.062 1 3.2 163 5.1 7.2 317 51 0.062 2 2.3 1 125 8.2 13.3 31 73 0.062 2 3.5 164 6.3 7.4 265 57 0.115 2 3.3 1 126 6.9 14.5 289 54 0.062 2 2.3 1
LOCATION 4Fracture ID
Fracture
Position Dip Azimuth
Dip
Aperture
Morphology*
Length
Fill**
Fracture ID
Fill**
Fracture
Position Dip Azimuth
Dip
Aperture
Morphology*
Length
89

Hor. Vert. Hor. Vert.127 7.8 13.6 261 55 0.062 1 3.4 1 190 13.1 4.5 269 51 0.095 1 2.2 1128 8.4 13.4 262 54 0.062 1 3.4 1 191 14 5.3 257 48 0.05 2 2.1 1129 9.8 13.8 210 77 0.05 1 3.0 1 192 14.8 5.3 263 49 0.062 1 2.5 1130 9.7 1.3 297 49 0.05 2 5.1 1 193 14.1 7.1 267 63 0.062 1 4.6 1131 10.4 1.6 298 64 0.062 2 3.2 1 194 14.5 7.0 237 63 0.062 1 3.6 1132 9.8 2.9 279 55 0.05 1 3.0 1 195 15.1 6.9 242 62 0.062 2 3.0 1133 10.4 2.5 14 89 0.062 2 2.5 1 196 15.5 5.9 268 56 0.062 2 2.6 2134 11.1 2.7 16 88 0.062 1 2.9 1 197 13.7 7.5 243 60 0.075 1 4.5 1135 11.5 2.9 21 89 0.062 2 2.0 1 198 14.1 7.9 242 75 0.05 2 2.9 1136 11.4 3.8 312 62 0.062 2 3.0 1 199 13.9 8.5 258 65 0.062 1 4.0 1137 10.8 4.4 283 51 0.075 1 2.2 1 200 14.6 7.9 264 53 0.062 1 5.1 1138 10.3 5.0 273 57 0.062 1 0.8 1 201 14.8 8.9 266 60 0.05 2 4.0 1139 9.6 5.4 262 45 0.075 1 1.1 1 202 14.4 9.2 19 72 0.062 1 4.9 1140 9.8 5.5 261 43 0.062 1 3.4 1 203 15.6 8.8 279 58 0.075 1 5.1 1141 10.5 5.6 18 85 0.062 2 2.4 1 204 13.7 10.1 340 73 0.062 1 4.9 1143 11.4 5.1 239 69 0.062 1 3.1 1144 10.8 6.3 270 49 0.075 1 1.1 1145 9.1 7.9 287 58 0.075 2 2.5 1 **Fill *Morphology146 9.5 8.0 328 57 0.095 1 0.5 1 Filled fracture 1 Planar 1147 10 7.2 295 49 0.062 2 2.1 1 Partially filled fract. 2 Sub‐planar 2148 11.5 6.5 262 51 0.05 1 2.6 1 Open fracture 3 Sinuous 3149 12.1 6.3 241 57 0.14 1 0.9 2150 11.3 7.0 302 47 0.05 2 1.6 1151 10.4 8.3 310 62 0.05 2 2.0 1152 10.3 8.8 289 57 0.05 2 1.0 1153 11.1 8.5 286 46 0.05 2 2.3 1154 11.5 8.3 13 84 0.05 1 2.2 1155 11.4 7.8 222 63 0.095 1 1.4 1156 12.1 8.5 294 46 0.05 2 2.5 1157 12 7.3 300 49 0.062 2 2.4 1158 10.7 9.4 302 56 0.062 1 2.0 1159 11 9.2 298 65 0.05 1 2.0 1160 11.9 8.8 214 89 0.062 1 2.5 1161 12.1 9.6 284 59 0.05 2 2.2 1162 10.6 10.1 14 82 0.062 2 2.3 1163 11.7 10.2 255 56 0.062 1 3.3 1164 12.7 9.9 298 53 0.05 1 1.2 1165 11.7 10.5 262 62 0.05 1 3.2 1166 11.1 11.2 288 48 0.075 1 2.9 1167 11.6 10.8 239 60 0.062 2 2.5 1168 12.6 10.4 246 57 0.075 2 2.4 1169 9.2 11.8 268 71 0.062 2 2.2 1170 9.9 12.3 266 56 0.075 2 3.5 1171 9.7 12.5 273 57 0.062 2 3.6 1172 9.8 13.0 249 49 0.05 1 3.4 1173 9.3 13.4 235 85 0.062 1 4.2 1174 10.3 12.4 3 86 0.062 1 4.0 1175 10.7 12.1 247 70 0.075 1 2.2 1176 10.7 12.4 309 63 0.062 2 3.1 1177 11 13.4 271 88 0.062 2 2.2 1178 9.7 14.4 16 71 0.05 1 2.1 1179 11.3 14.4 282 56 0.095 2 4.2 1180 12.2 15.0 265 57 0.062 1 2.5 1181 11.4 13.8 20 86 0.05 1 1.8 1182 11.8 13.9 174 90 0.075 1 1.0 1183 13.2 12.0 112 59 0.14 3 5.1 1184 12.2 1.7 273 44 0.05 2 1.1 1185 13.1 2.0 16 76 0.062 1 2.8 2186 13.2 0.9 11 77 0.14 1 2.7 1187 13.7 1.5 11 78 0.062 1 2.8 1188 14.5 2.9 281 71 0.062 2 2.6 1189 12.2 4.0 287 68 0.075 2 2.1 1
LOCATION 4 (continued)Fracture ID
Fracture
Position Dip Azimuth
Dip
Aperture
Morphology*
Length
Fill**
Length
Fill**
Fracture ID
Fracture
Position Dip Azimuth
Dip
Aperture
Morphology*
90

Hor. Vert. Hor. Vert.1 0.2 10.6 258 77 0.075 1 3.9 1 63 5.8 8.0 236 67 0.175 1 3.5 12 0.3 11.0 238 73 0.75 2 5.6 1 64 5.8 2.5 181 44 0.062 1 4.9 13 0.4 9.9 138 83 0.062 2 2.6 1 65 5.9 10.0 165 61 0.14 2 4.0 24 0.5 3.1 78 87 0.095 1 3.4 1 66 6.0 8.6 82 86 0.062 2 0.8 15 0.6 7.4 149 44 0.14 2 3.6 1 67 6.0 12.0 128 71 0.05 2 3.0 16 0.7 3.4 191 57 0.062 1 1.8 1 68 6.2 12.5 162 34 0.05 2 3.5 17 0.7 3.5 192 57 0.062 1 1.7 1 69 6.4 11.5 168 85 0.05 2 3.0 18 1.0 6.3 177 86 1.15 3 10.5 1 70 6.6 11.5 137 46 0.05 2 3.2 19 1.0 9.1 258 75 0.115 1 2.6 1 71 6.6 12.0 303 41 0.05 2 5.0 110 1.1 2.2 258 31 0.05 1 1.2 1 72 7.0 10.2 99 59 0.062 1 1.0 111 1.1 7.6 207 53 0.075 1 2.4 1 73 7.0 12.4 202 25 0.05 3 7.5 112 1.3 3.4 134 59 0.062 2 2.1 1 74 7.0 3.5 177 39 0.062 2 4.0 113 1.3 4.9 106 67 0.095 2 2.2 1 75 7.2 9.2 100 69 0.215 1 2.5 214 1.4 1.0 98 70 0.075 1 1.7 1 76 7.3 4.1 256 53 0.062 2 4.5 115 1.6 7.5 205 71 0.05 1 4.0 1 77 7.4 5.5 210 46 0.062 2 3.4 116 1.7 5.8 209 59 0.05 2 2.3 1 78 7.4 13.6 216 31 0.075 1 6.0 217 1.8 12.0 177 35 0.062 2 2.0 1 79 7.5 6.0 205 32 0.05 1 4.0 118 1.9 4.8 213 45 0.05 1 1.9 1 80 7.6 8.8 176 65 0.4 3 6.0 119 2.1 2.5 129 60 0.05 1 2.5 1 81 7.6 12.6 179 37 0.05 1 4.0 120 2.1 1.3 271 76 0.05 1 3.0 1 82 7.6 1.8 62 90 0.05 1 2.5 121 2.1 4.4 138 41 0.05 1 3.1 1 83 7.6 0.8 172 40 0.075 2 3.0 122 2.2 4.4 138 41 0.05 1 3.1 1 84 7.9 11.7 248 58 0.075 2 3.0 123 2.2 4.2 245 71 0.05 1 2.6 1 85 8.0 4.8 243 62 0.062 2 2.5 124 2.3 10.8 204 57 0.062 2 2.4 1 86 8.5 9.7 91 68 0.075 1 4.2 125 2.4 1.8 271 76 0.075 1 2.4 2 87 8.6 3.7 142 43 0.05 1 3.0 126 2.4 3.8 276 84 0.062 2 3.9 1 88 8.6 8.9 113 51 0.115 2 2.0 127 2.8 13.0 134 29 0.062 2 2.6 1 89 8.6 11.0 134 47 0.05 2 4.5 128 2.8 1.8 271 76 0.05 1 1.8 1 90 8.8 4.4 237 44 0.075 1 5.0 129 2.9 6.2 251 58 0.05 2 3.4 1 91 8.9 10.7 94 70 0.062 1 3.5 130 3.0 2.3 171 49 0.05 2 6.1 1 92 9.0 4.9 123 53 0.062 1 3.5 131 3.1 3.2 278 89 0.075 1 2.6 1 93 9.0 11.4 235 59 0.095 2 3.0 132 3.4 2.9 279 89 0.05 1 1.8 1 94 9.0 11.9 176 43 0.075 1 7.5 133 3.4 5.0 169 59 0.075 2 3.4 1 95 9.1 13.6 236 33 0.265 2 3.5 134 3.5 5.4 173 53 0.075 2 2.2 1 96 9.2 12.0 123 58 0.05 2 3.4 135 3.6 4.3 197 53 0.05 1 3.8 1 97 9.3 10.0 123 38 0.05 2 4.0 136 3.7 8.5 244 70 0.062 2 3.0 1 98 9.4 8.9 124 58 0.075 2 2.8 137 3.9 3.9 237 61 0.115 1 1.9 1 99 9.5 2.3 219 40 0.062 2 4.0 138 3.9 4.3 259 50 0.062 1 2.9 1 100 9.6 5.9 250 67 0.075 1 3.5 139 3.9 6.5 209 69 0.062 2 2.7 1 101 9.8 8.9 131 48 0.05 1 3.5 140 3.9 8.0 179 71 0.075 2 3.0 1 102 9.9 8.8 125 42 0.05 2 2.4 141 3.9 9.7 112 75 0.33 2 3.6 1 103 10.0 11.4 177 31 0.05 2 4.0 142 3.9 10.8 211 61 0.05 1 3.0 1 104 10.0 14.2 238 53 0.175 2 3.0 143 4.0 10.4 207 57 0.05 1 5.0 1 105 10.1 7.4 248 62 0.062 2 1.4 144 4.1 5.2 207 52 0.05 2 2.4 1 106 10.2 12.8 262 80 0.075 2 5.5 145 4.1 6.2 169 61 0.05 2 3.0 1 107 10.2 1.7 116 46 0.062 1 6.6 146 4.1 10.2 219 54 0.05 2 3.7 1 108 10.3 1.3 137 37 0.05 1 3.0 147 4.2 12.1 191 37 0.05 1 4.0 1 109 10.4 14.2 216 67 0.062 2 4.0 148 4.4 13.2 125 53 0.05 1 5.0 1 110 10.6 7.3 115 49 0.05 1 3.4 149 4.5 9.3 203 58 0.062 2 3.4 1 111 10.6 9.5 137 44 0.05 1 3.0 150 4.6 8.1 106 86 0.265 2 5.0 1 112 10.6 9.8 152 39 0.062 2 2.9 151 4.6 12.6 126 48 0.062 1 3.5 1 113 10.6 13.4 183 52 0.062 2 3.5 152 4.7 11.0 109 75 0.05 1 2.3 1 114 10.7 1.8 154 51 0.062 2 7.0 153 4.8 6.0 181 58 0.05 2 0.8 1 115 10.7 3.0 307 79 0.33 2 2.0 354 5.1 8.0 74 84 0.05 1 1.4 1 116 10.9 12.1 183 82 0.062 2 4.0 155 5.2 10.7 97 50 0.05 2 2.0 1 117 11.0 6.3 115 50 0.062 2 3.2 156 5.3 13.4 122 54 0.075 1 5.0 2 118 11.0 11.2 132 35 0.05 2 4.0 157 5.3 10.8 174 47 0.05 1 3.0 1 119 11.1 10.1 152 39 0.05 1 4.0 158 5.4 9.5 212 34 0.062 1 5.8 1 120 11.3 4.9 104 57 0.095 2 3.5 159 5.6 1.5 168 43 0.062 2 5.5 1 121 11.4 1.2 219 41 0.095 2 4.6 160 5.6 5.1 162 47 0.095 2 3.2 1 122 11.4 6.1 132 45 0.05 2 2.5 161 5.6 5.5 164 56 0.062 2 4.0 1 123 11.6 2.4 177 58 0.075 2 2.4 162 5.7 4.2 134 84 0.14 2 3.0 1 124 11.7 7.5 119 65 0.062 2 3.0 1
LOCATION 5Fracture ID
Fracture
Position Dip Azimuth
Dip
Aperture
Morphology*
Length
Fill**
Fracture ID
Fill**
Fracture
Position Dip Azimuth
Dip
Aperture
Morphology*
Length
91

Hor. Vert. Hor. Vert.125 11.8 11.6 32 90 0.5 3 10.0 1 187 21.4 6.1 198 30 0.05 2 4.5 1126 11.8 13.5 90 70 0.115 2 2.4 1 188 21.5 11.4 187 46 0.05 2 4.4 1127 12.0 6.2 125 62 0.05 2 3.4 1 189 21.6 2.5 198 43 0.075 2 4.5 1128 12.1 6.6 130 50 0.05 2 3.6 1 190 22.0 8.9 128 57 0.14 2 2.5 1129 12.2 14.4 127 59 0.14 3 2.0 1 191 22.0 10.2 178 62 0.05 2 3.3 1130 12.2 5.2 283 86 0.075 1 1.2 1 192 22.0 2.1 116 90 0.075 1 3.3 1131 12.2 6.0 93 78 0.05 1 3.0 1 193 22.3 12.5 187 49 0.062 2 6.0 1132 12.4 2.4 103 78 0.075 2 3.0 1 194 22.6 13.0 124 41 0.075 1 4.4 1133 13.0 3.0 112 54 0.075 1 3.0 1 195 23.5 5.3 216 53 0.075 1 2.5 1134 13.4 4.3 83 52 0.062 2 2.0 1 196 24.0 13.4 247 51 0.095 2 6.0 1135 13.8 2.3 271 83 0.115 3 10.0 1 197 24.0 2.5 77 77 0.075 1 5.0 1136 14.4 3.7 140 49 0.05 2 1.2 1 198 24.0 4.0 259 81 0.14 1 10.0 1137 14.4 8.2 222 38 0.062 2 4.0 1 199 24.4 2.5 84 42 0.05 1 5.0 1138 14.4 11.1 147 48 0.062 2 5.5 1 200 24.5 13.4 258 44 0.075 2 4.5 1139 14.5 4.4 248 47 0.062 2 4.0 1140 14.8 10.6 156 46 0.05 2 5.5 1141 14.8 13.8 226 62 0.4 2 1.5 1 **Fill *Morphology142 15.0 8.3 159 42 0.05 2 4.5 1 Filled fracture 1 Planar 1143 15.3 10.7 160 56 0.075 2 6.0 1 Partially filled fract. 2 Sub‐planar 2144 15.3 4.6 277 49 0.075 2 1.3 1 Open fracture 3 Sinuous 3145 15.4 13.5 117 57 0.05 2 3.4 1146 15.4 14.2 222 62 0.5 2 1.8 1147 15.5 11.5 252 73 0.062 2 3.3 1148 15.6 1.7 134 75 0.05 2 5.5 1149 16.0 8.0 296 88 0.095 2 3.5 2150 16.0 11.9 235 55 0.14 2 3.3 1151 16.0 14.0 237 60 0.062 2 6.0 1152 16.0 3.6 123 53 0.062 2 4.5 1153 16.2 9.4 169 52 0.062 2 4.0 1154 16.4 13.1 237 68 0.075 2 7.0 1155 16.4 14.2 127 40 0.05 2 3.5 1156 16.6 2.5 115 43 0.075 2 4.4 1157 16.8 5.1 264 59 0.075 2 3.0 1158 16.9 14.6 181 44 0.115 2 4.4 1159 17.0 9.8 253 79 0.062 2 4.0 1160 17.2 9.2 253 79 0.115 2 3.5 1161 17.7 14.1 189 52 0.095 2 3.0 1162 17.8 3.3 115 69 0.05 2 4.0 1163 17.8 8.5 252 51 0.05 2 3.5 1164 18.0 5.8 115 41 0.062 1 4.0 1165 18.0 11.6 147 49 0.075 2 3.0 1166 18.1 5.6 102 47 0.062 1 4.0 1167 18.2 7.6 178 44 0.05 1 4.0 1168 18.3 13.5 171 82 0.075 3 5.0 1169 18.4 4.4 227 40 0.075 2 5.0 1170 18.5 13.0 138 48 0.075 2 5.5 1171 18.5 2.7 145 44 0.075 2 4.5 1172 18.5 3.3 177 48 0.05 2 4.0 1173 18.6 2.5 171 45 0.05 2 6.0 1174 18.9 7.1 119 45 0.062 3 6.0 1175 18.9 10.0 169 36 0.075 2 5.0 1176 19.5 6.6 262 58 0.05 2 2.2 1177 19.5 12.0 155 50 0.062 1 5.5 1178 19.5 14.5 131 42 0.062 2 4.5 1179 19.6 10.6 164 41 0.062 2 5.5 1180 20.0 10.0 141 47 0.062 2 7.0 1181 20.2 13.6 119 37 0.05 2 3.4 1182 20.4 12.5 262 82 0.215 2 5.0 1183 20.4 14.0 159 39 0.05 2 1.2 1184 20.6 5.4 102 32 0.095 2 7.5 1185 20.6 7.7 212 38 0.062 2 3.5 1186 21.0 10.0 317 45 0.14 2 3.5 3
LOCATION 5 (continued)Fracture ID
Fracture
Position Dip Azimuth
Dip
Aperture
Morphology*
Length
Fill**
Length
Fill**
Fracture ID
Fracture
Position Dip Azimuth
Dip
Aperture
Morphology*
92

Strike Dip Strike Dip
1 270 63 90 58 1.18 155 58 6.56 1.84 2.17
2 270 69 92 52 1.27 157 52 6.46 1.87 2.37
3 270 47 88 73 1.05 153 73 6.67 1.81 1.89
4 271 53 90 68 1.08 155 68 6.56 1.84 1.98
5 271 88 99 33 1.84 164 33 6.19 1.95 3.58
6 271 48 89 73 1.05 154 73 6.61 1.82 1.91
7 272 41 88 80 1.02 153 80 6.67 1.81 1.84
8 272 37 88 84 1.01 153 84 6.67 1.81 1.82
9 273 68 95 53 1.25 160 53 6.33 1.91 2.39
10 273 48 90 73 1.05 155 73 6.56 1.84 1.92
11 275 61 95 60 1.15 160 60 6.33 1.91 2.20
12 277 81 105 42 1.49 170 42 6.04 2.00 2.99
13 278 84 108 40 1.56 173 40 5.99 2.01 3.13
14 278 88 111 36 1.70 176 36 5.96 2.02 3.44
15 279 63 100 60 1.15 165 60 6.16 1.96 2.26
16 280 63 101 60 1.15 166 60 6.13 1.97 2.27
17 281 85 113 40 1.56 178 40 5.95 2.03 3.15
18 281 52 98 71 1.06 163 71 6.22 1.94 2.05
19 282 51 98 72 1.05 163 72 6.22 1.94 2.04
20 283 56 101 67 1.09 166 67 6.13 1.97 2.14
21 283 72 108 52 1.27 173 52 5.99 2.01 2.56
22 284 52 100 71 1.06 165 71 6.16 1.96 2.07
23 288 87 124 42 1.49 189 42 6.03 2.00 2.99
24 288 60 107 65 1.10 172 65 6.01 2.01 2.22
25 289 80 119 48 1.35 184 48 5.97 2.02 2.72
26 292 66 113 62 1.13 178 62 5.95 2.03 2.30
27 292 87 128 44 1.44 193 44 6.11 1.98 2.84
28 294 75 121 55 1.22 186 55 5.98 2.02 2.46
29 295 72 120 58 1.18 185 58 5.97 2.02 2.38
30 296 78 125 54 1.24 190 54 6.04 2.00 2.47
31 296 56 111 72 1.05 176 72 5.96 2.02 2.13
32 297 54 111 74 1.04 176 74 5.96 2.02 2.11
33 297 53 110 75 1.04 175 75 5.97 2.02 2.09
34 298 61 115 69 1.07 180 69 5.95 2.03 2.17
35 298 57 113 72 1.05 178 72 5.95 2.03 2.13
36 298 47 108 81 1.01 173 81 5.99 2.01 2.04
37 298 57 113 72 1.05 178 72 5.95 2.03 2.13
38 298 51 110 77 1.03 175 77 5.97 2.02 2.07
39 298 64 117 66 1.09 182 66 5.95 2.03 2.22
40 301 78 130 57 1.19 195 57 6.16 1.96 2.34
41 302 87 138 51 1.29 203 51 6.47 1.87 2.40
42 302 83 135 54 1.24 200 54 6.34 1.91 2.35
43 302 58 117 73 1.05 182 73 5.95 2.03 2.12
44 302 74 127 61 1.14 192 61 6.08 1.98 2.27
45 303 59 118 73 1.05 183 73 5.96 2.03 2.12
Appendix B. Location 1
Fracture
IDStrike Dip
Rotation to
horizontalWeighting
factor (f1)
Rotation about
vertical Axis obs. lengthWeight
factor (f2)f1*f2
93

Strike Dip Strike Dip
46 303 61 119 71 1.06 184 71 5.97 2.02 2.14
47 303 60 119 72 1.05 184 72 5.97 2.02 2.13
48 303 66 122 67 1.09 187 67 6.00 2.01 2.19
49 304 88 141 52 1.27 206 52 6.63 1.82 2.31
50 304 55 116 77 1.03 181 77 5.95 2.03 2.08
51 305 8 267 66 1.09 332 66 6.73 1.79 1.96
52 306 77 133 61 1.14 198 61 6.26 1.93 2.20
53 306 70 128 66 1.09 193 66 6.11 1.98 2.16
54 307 81 137 59 1.17 202 59 6.42 1.88 2.19
55 307 67 126 69 1.07 191 69 6.06 1.99 2.13
56 307 75 132 63 1.12 197 63 6.22 1.94 2.18
57 308 56 119 78 1.02 184 78 5.97 2.02 2.07
58 312 52 119 83 1.01 184 83 5.97 2.02 2.04
59 316 49 119 87 1.00 184 87 5.97 2.02 2.03
60 316 84 146 64 1.11 211 64 6.95 1.74 1.93
61 316 60 127 80 1.02 192 80 6.08 1.98 2.01
62 316 89 151 61 1.14 216 61 7.36 1.64 1.87
63 318 62 130 80 1.02 195 80 6.16 1.96 1.99
64 321 62 132 82 1.01 197 82 6.22 1.94 1.96
65 321 58 129 84 1.01 194 84 6.13 1.97 1.98
66 321 41 296 85 1.00 1 85 5.95 2.03 2.04
67 322 68 137 78 1.02 202 78 6.42 1.88 1.92
68 322 87 153 67 1.09 218 67 7.56 1.60 1.73
69 323 58 130 85 1.00 195 85 6.16 1.96 1.97
70 327 68 140 82 1.01 205 82 6.57 1.84 1.86
71 333 53 311 85 1.00 16 85 6.19 1.95 1.96
72 334 57 314 87 1.00 19 87 6.29 1.92 1.92
73 339 62 321 86 1.00 26 86 6.62 1.82 1.83
74 343 86 164 85 1.00 229 85 9.09 1.33 1.33
75 345 84 163 88 1.00 228 88 8.91 1.35 1.36
76 347 52 316 75 1.04 21 75 6.37 1.89 1.96
77 349 84 345 89 1.00 50 89 9.26 1.30 1.30
78 351 79 341 85 1.00 46 85 8.57 1.41 1.41
79 351 87 348 89 1.00 53 89 9.89 1.22 1.22
80 351 49 314 71 1.06 19 71 6.29 1.92 2.03
81 354 64 329 75 1.04 34 75 7.18 1.68 1.74
82 358 84 349 81 1.01 54 81 10.12 1.19 1.21
83 3 49 317 62 1.13 22 62 6.42 1.88 2.13
84 5 86 355 76 1.03 60 76 12.07 1.00 1.03
85 5 56 325 63 1.12 30 63 6.87 1.76 1.97
86 6 39 307 58 1.18 12 58 6.08 1.98 2.34
87 28 83 5 55 1.22 70 55 11.17 1.08 1.32
88 38 88 17 49 1.33 82 49 10.60 1.14 1.51
89 38 35 299 39 1.59 4 39 5.96 2.02 3.22
90 44 80 13 40 1.56 78 40 10.73 1.12 1.75
Weight
factor (f2)f1*f2
Appendix B. Location 1 (continued)
Fracture
IDStrike Dip
Rotation to
horizontalWeighting
factor (f1)
Rotation about
vertical Axis obs. length
94

Strike Dip Strike Dip
91 67 84 49 27 2.20 114 27 11.50 1.05 2.31
92 81 84 81 24 2.46 146 24 7.17 1.68 4.14
93 81 89 81 29 2.06 146 29 7.17 1.68 3.47
94 82 83 84 23 2.56 149 23 6.93 1.74 4.45
95 83 90 85 30 2.00 150 30 6.86 1.76 3.52
96 85 46 249 14 4.13 314 14 8.54 1.41 5.84
97 88 86 97 27 2.20 162 27 6.25 1.93 4.25
98 92 85 106 27 2.20 171 27 6.02 2.00 4.41
99 112 86 135 39 1.59 200 39 6.34 1.91 3.03
100 118 87 141 44 1.44 206 44 6.63 1.82 2.62
101 122 83 149 45 1.41 214 45 7.18 1.68 2.38
102 127 89 146 52 1.27 211 52 6.95 1.74 2.20
103 127 84 151 49 1.33 216 49 7.36 1.64 2.17
104 132 86 153 55 1.22 218 55 7.56 1.60 1.95
105 137 69 175 51 1.29 240 51 12.07 1.00 1.29
106 137 69 175 51 1.29 240 51 11.59 1.04 1.34
107 138 85 158 59 1.17 223 59 8.15 1.48 1.73
108 145 75 172 60 1.15 237 60 10.95 1.10 1.27
109 148 84 165 67 1.09 230 67 9.27 1.30 1.41
110 148 64 185 58 1.18 250 58 10.69 1.13 1.33
111 149 76 173 64 1.11 238 64 11.26 1.07 1.19
112 156 86 167 75 1.04 232 75 9.68 1.25 1.29
113 159 83 171 76 1.03 236 76 10.67 1.13 1.17
114 160 64 189 68 1.08 254 68 10.45 1.16 1.25
115 160 64 189 68 1.08 254 68 10.45 1.16 1.25
116 167 75 182 79 1.02 247 79 10.91 1.11 1.13
117 167 80 178 82 1.01 243 82 11.27 1.07 1.08
118 168 64 193 75 1.04 258 75 10.27 1.18 1.22
119 176 61 199 80 1.02 264 80 10.10 1.19 1.21
120 177 72 190 86 1.00 255 86 10.40 1.16 1.16
121 178 78 185 90 1.00 250 90 10.69 1.13 1.13
122 180 84 1 85 1.00 66 85 11.49 1.05 1.05
123 182 75 9 88 1.00 74 88 10.92 1.11 1.11
124 186 78 9 83 1.01 74 83 10.92 1.11 1.11
125 193 78 13 78 1.02 78 78 10.73 1.12 1.15
126 194 70 20 82 1.01 85 82 10.54 1.15 1.16
127 197 40 225 82 1.01 290 82 10.70 1.13 1.14
128 201 50 39 89 1.00 104 89 10.82 1.12 1.12
129 203 78 19 70 1.06 84 70 10.56 1.14 1.22
130 208 33 235 82 1.01 300 82 11.83 1.02 1.03
131 219 88 22 51 1.29 87 51 10.51 1.15 1.48
132 220 74 35 61 1.14 100 61 10.66 1.13 1.29
133 222 88 25 49 1.33 90 49 10.50 1.15 1.52
134 225 89 27 46 1.39 92 46 10.51 1.15 1.60
135 230 88 33 44 1.44 98 44 10.60 1.14 1.64
Appendix B. Location 1 (continued)
Fracture
IDStrike Dip
Rotation to
horizontalWeighting
factor (f1)
Rotation about
vertical Axis obs. lengthWeight
factor (f2)f1*f2
95

Strike Dip Strike Dip
136 233 62 54 64 1.11 119 64 12.01 1.00 1.12
137 235 49 61 75 1.04 126 75 10.10 1.19 1.24
138 236 51 61 73 1.05 126 73 10.10 1.19 1.25
139 236 44 64 79 1.02 129 79 9.44 1.28 1.30
140 238 90 41 37 1.66 106 37 10.93 1.10 1.84
141 238 68 55 56 1.21 120 56 12.07 1.00 1.21
142 238 65 57 59 1.17 122 59 11.20 1.08 1.26
143 239 59 60 64 1.11 125 64 10.35 1.17 1.30
144 240 45 66 77 1.03 131 77 9.05 1.33 1.37
145 240 57 62 66 1.09 127 66 9.87 1.22 1.34
146 241 77 54 47 1.37 119 47 12.01 1.00 1.37
147 241 56 63 67 1.09 128 67 9.64 1.25 1.36
148 242 62 62 61 1.14 127 61 9.87 1.22 1.40
149 243 52 66 70 1.06 131 70 9.05 1.33 1.42
150 244 61 64 61 1.14 129 61 9.44 1.28 1.46
151 244 63 63 59 1.17 128 59 9.64 1.25 1.46
152 245 66 63 56 1.21 128 56 9.64 1.25 1.51
153 246 76 61 46 1.39 126 46 10.10 1.19 1.66
154 246 84 57 39 1.59 122 39 11.20 1.08 1.71
155 247 43 71 78 1.02 136 78 8.26 1.46 1.49
156 247 90 54 33 1.84 119 33 12.01 1.00 1.85
157 247 63 66 59 1.17 131 59 9.05 1.33 1.56
158 248 59 68 62 1.13 133 62 8.71 1.39 1.57
159 249 87 60 35 1.74 125 35 10.35 1.17 2.03
160 249 26 256 86 1.00 321 86 7.64 1.58 1.58
161 252 80 67 41 1.52 132 41 8.88 1.36 2.07
162 253 53 74 67 1.09 139 67 7.87 1.53 1.67
163 253 49 75 71 1.06 140 71 7.76 1.56 1.65
164 255 51 76 69 1.07 141 69 7.65 1.58 1.69
165 255 69 74 51 1.29 139 51 7.87 1.53 1.97
166 255 82 71 38 1.62 136 38 8.26 1.46 2.37
167 255 68 74 52 1.27 139 52 7.87 1.53 1.95
168 256 68 75 52 1.27 140 52 7.76 1.56 1.97
169 256 46 77 74 1.04 142 74 7.54 1.60 1.67
170 256 56 76 64 1.11 141 64 7.65 1.58 1.76
171 257 67 76 53 1.25 141 53 7.65 1.58 1.98
172 258 66 78 54 1.24 143 54 7.44 1.62 2.00
173 258 68 77 52 1.27 142 52 7.54 1.60 2.03
174 258 46 79 74 1.04 144 74 7.35 1.64 1.71
175 259 34 80 86 1.00 145 86 7.26 1.66 1.67
176 259 59 79 61 1.14 144 61 7.35 1.64 1.88
177 259 79 78 41 1.52 143 41 7.44 1.62 2.47
178 259 69 79 51 1.29 144 51 7.35 1.64 2.11
179 260 60 80 60 1.15 145 60 7.26 1.66 1.92
180 260 58 80 62 1.13 145 62 7.26 1.66 1.88
Appendix B. Location 1 (continued)
Fracture
IDStrike Dip
Rotation to
horizontalWeighting
factor (f1)
Rotation about
vertical Axis obs. lengthWeight
factor (f2)f1*f2
96

Strike Dip Strike Dip
181 261 66 81 54 1.24 146 54 7.17 1.68 2.08
182 261 59 81 61 1.14 146 61 7.17 1.68 1.92
183 261 62 81 58 1.18 146 58 7.17 1.68 1.99
184 261 76 81 44 1.44 146 44 7.17 1.68 2.42
185 261 86 81 34 1.79 146 34 7.17 1.68 3.01
186 261 43 81 77 1.03 146 77 7.17 1.68 1.73
187 261 46 81 74 1.04 146 74 7.17 1.68 1.75
188 261 64 81 56 1.21 146 56 7.17 1.68 2.03
189 261 43 81 77 1.03 146 77 7.17 1.68 1.73
190 262 70 82 50 1.31 147 50 7.09 1.70 2.22
191 262 78 82 42 1.49 147 42 7.09 1.70 2.55
192 262 51 82 69 1.07 147 69 7.09 1.70 1.82
193 263 44 82 76 1.03 147 76 7.09 1.70 1.76
194 264 67 84 53 1.25 149 53 6.93 1.74 2.18
195 265 86 88 34 1.79 153 34 6.67 1.81 3.23
196 266 57 86 63 1.12 151 63 6.80 1.78 1.99
197 267 43 85 77 1.03 150 77 6.86 1.76 1.80
198 267 82 91 38 1.62 156 38 6.51 1.85 3.01
199 267 63 87 57 1.19 152 57 6.73 1.79 2.14
200 267 75 89 45 1.41 154 45 6.61 1.82 2.58
201 268 77 91 44 1.44 156 44 6.51 1.85 2.67
202 268 61 88 59 1.17 153 59 6.67 1.81 2.11
203 268 52 87 68 1.08 152 68 6.73 1.79 1.93
204 269 77 92 44 1.44 157 44 6.46 1.87 2.69
Appendix B. Location 1 (continued)
Fracture
IDStrike Dip
Rotation to
horizontalWeighting
factor (f1)
Rotation about
vertical Axis obs. lengthWeight
factor (f2)f1*f2
97

Strike Dip Strike Dip
1 348 76 162 56 1.21 172 56 5.96 6.71 8.09
2 262 89 274 68 1.08 284 68 24.08 1.66 1.79
3 262 89 274 68 1.08 284 68 24.08 1.66 1.79
4 270 65 301 62 1.13 311 62 8.96 4.46 5.05
5 78 67 252 81 1.01 262 81 39.94 1.00 1.01
6 129 62 94 58 1.18 104 58 24.23 1.65 1.94
7 185 80 169 27 2.20 179 27 5.90 6.77 14.91
8 35 90 227 38 1.62 237 38 10.86 3.68 5.97
9 20 82 201 42 1.49 211 42 6.89 5.80 8.66
10 126 84 113 72 1.05 123 72 10.81 3.70 3.89
11 145 83 124 56 1.21 134 56 8.48 4.71 5.68
12 19 89 200 35 1.74 210 35 6.82 5.86 10.21
13 346 57 170 73 1.05 180 73 5.90 6.77 7.08
14 163 89 146 46 1.39 156 46 6.45 6.19 8.60
15 354 87 162 43 1.47 172 43 5.96 6.71 9.83
16 308 36 343 73 1.05 353 73 5.94 6.72 7.03
17 70 72 250 72 1.05 260 72 34.29 1.16 1.22
18 77 82 263 70 1.06 273 70 39.56 1.01 1.07
19 111 85 106 85 1.00 116 85 13.42 2.98 2.99
20 25 70 206 54 1.24 216 54 7.30 5.47 6.76
21 113 81 103 81 1.01 113 81 15.04 2.65 2.69
22 34 88 224 39 1.59 234 39 10.06 3.97 6.31
23 64 62 239 76 1.03 249 76 16.53 2.42 2.49
24 92 65 79 88 1.00 89 88 39.51 1.01 1.01
25 92 65 79 88 1.00 89 88 39.51 1.01 1.01
26 72 81 258 67 1.09 268 67 39.52 1.01 1.10
27 287 81 295 84 1.01 305 84 10.24 3.90 3.92
28 37 85 226 43 1.47 236 43 10.58 3.78 5.54
29 29 72 211 53 1.25 221 53 7.83 5.10 6.39
30 77 81 262 70 1.06 272 70 39.53 1.01 1.08
31 288 84 293 87 1.00 303 87 10.78 3.70 3.71
32 18 72 198 52 1.27 208 52 6.69 5.97 7.58
33 334 78 148 62 1.13 158 62 6.36 6.28 7.11
34 58 81 247 57 1.19 257 57 26.41 1.51 1.80
35 175 87 158 38 1.62 168 38 6.03 6.62 10.76
36 142 82 121 58 1.18 131 58 8.98 4.45 5.25
37 44 83 234 48 1.35 244 48 13.50 2.96 3.98
38 126 67 97 63 1.12 107 63 20.08 1.99 2.23
39 52 74 237 60 1.15 247 60 15.16 2.64 3.04
40 95 52 70 79 1.02 80 79 33.98 1.18 1.20
41 207 83 217 28 2.13 227 28 8.67 4.61 9.82
42 147 71 113 48 1.35 123 48 10.81 3.70 4.97
43 159 69 118 37 1.66 128 37 9.56 4.18 6.94
44 73 67 249 77 1.03 259 77 31.18 1.28 1.31
45 28 68 209 57 1.19 219 57 7.60 5.25 6.26
Appendix B. Location 2
Fracture
IDStrike Dip
Rotation to
horizontalWeighting
factor (f1)
Rotation about
Vertical Axis obs. length
Weight
factor
(f2)
f1*f2
98

Strike Dip Strike Dip
46 321 64 148 81 1.01 158 81 6.36 6.28 6.36
47 341 67 161 67 1.09 171 67 5.97 6.69 7.27
48 209 77 226 23 2.56 236 23 10.58 3.78 9.67
49 4 79 179 47 1.37 189 47 5.98 6.68 9.14
50 32 68 213 58 1.18 223 58 8.08 4.94 5.83
51 43 69 225 60 1.15 235 60 10.31 3.87 4.47
52 195 85 192 29 2.06 202 29 6.37 6.27 12.94
53 318 55 153 89 1.00 163 89 6.17 6.48 6.48
54 327 74 145 70 1.06 155 70 6.51 6.14 6.53
55 349 84 158 48 1.35 168 48 6.03 6.62 8.91
56 331 63 156 76 1.03 166 76 6.08 6.57 6.77
57 29 71 211 54 1.24 221 54 7.83 5.10 6.31
58 127 85 115 71 1.06 125 71 10.26 3.89 4.12
59 22 67 202 57 1.19 212 57 6.96 5.74 6.84
60 144 82 123 56 1.21 133 56 8.64 4.62 5.58
61 185 72 159 20 2.92 169 20 6.01 6.65 19.44
62 135 76 111 60 1.15 121 60 11.43 3.50 4.04
63 199 86 200 30 2.00 210 30 6.82 5.86 11.71
64 177 87 161 37 1.66 171 37 5.97 6.69 11.11
65 329 67 152 74 1.04 162 74 6.20 6.44 6.70
66 350 67 169 63 1.12 179 63 5.90 6.77 7.60
67 300 57 322 81 1.01 332 81 6.67 5.99 6.06
68 300 71 310 89 1.00 320 89 7.68 5.20 5.20
69 97 86 278 83 1.01 288 83 18.91 2.11 2.13
70 227 58 291 24 2.46 301 24 11.40 3.51 8.62
71 281 68 303 72 1.05 313 72 8.62 4.63 4.87
72 282 70 302 74 1.04 312 74 8.79 4.55 4.73
73 299 6 11 57 1.19 21 57 6.32 6.32 7.54
74 300 72 310 89 1.00 320 89 7.68 5.20 5.20
75 1 59 182 67 1.09 192 67 6.03 6.62 7.19
76 12 69 191 55 1.22 201 55 6.32 6.32 7.71
77 17 89 196 35 1.74 206 35 6.57 6.08 10.60
78 22 89 205 35 1.74 215 35 7.21 5.54 9.66
79 323 82 136 67 1.09 146 67 7.11 5.62 6.10
80 4 88 175 38 1.62 185 38 5.92 6.74 10.95
81 184 79 166 26 2.28 176 26 5.91 6.75 15.41
82 213 87 226 34 1.79 236 34 10.58 3.78 6.75
83 304 69 134 89 1.00 144 89 7.28 5.48 5.48
84 338 60 163 74 1.04 173 74 5.94 6.72 6.99
85 194 81 189 25 2.37 199 25 6.24 6.40 15.14
86 198 83 198 27 2.20 208 27 6.69 5.97 13.15
87 23 76 205 48 1.35 215 48 7.21 5.54 7.45
88 194 84 190 28 2.13 200 28 6.28 6.36 13.54
89 191 83 183 28 2.13 193 28 6.06 6.59 14.04
Appendix B. Location 2 (continued)
Fracture
IDStrike Dip
Rotation to
horizontalWeighting
factor (f1)
Rotation about
Vertical Axis obs. length
Weight
factor
(f2)
f1*f2
99

Strike Dip Strike Dip
90 88 84 271 77 1.03 281 77 30.42 1.31 1.35
91 356 52 180 75 1.04 190 75 5.99 6.66 6.90
92 12 86 188 38 1.62 198 38 6.21 6.43 10.45
93 181 85 166 33 1.84 176 33 5.91 6.75 12.40
94 341 50 170 81 1.01 180 81 5.90 6.77 6.85
95 9 90 182 35 1.74 192 35 6.03 6.62 11.54
96 12 61 192 63 1.12 202 63 6.37 6.27 7.04
97 150 73 117 46 1.39 127 46 9.78 4.08 5.68
98 16 77 195 47 1.37 205 47 6.51 6.13 8.38
99 306 67 137 89 1.00 147 89 7.03 5.68 5.68
100 286 82 294 84 1.01 304 84 10.50 3.80 3.82
101 288 61 313 74 1.04 323 74 7.37 5.42 5.64
102 37 74 221 53 1.25 231 53 9.39 4.25 5.32
103 20 60 200 64 1.11 210 64 6.82 5.86 6.52
104 22 74 203 50 1.31 213 50 7.04 5.67 7.40
105 24 71 205 53 1.25 215 53 7.21 5.54 6.94
106 151 78 124 48 1.35 134 48 8.48 4.71 6.34
107 27 87 213 38 1.62 223 38 8.08 4.94 8.03
108 152 79 126 48 1.35 136 48 8.19 4.88 6.56
109 38 52 214 74 1.04 224 74 8.21 4.86 5.06
110 316 16 2 65 1.10 12 65 6.03 6.62 7.31
111 338 55 165 78 1.02 175 78 5.92 6.74 6.90
112 352 37 183 90 1.00 193 90 6.06 6.59 6.59
113 27 65 207 60 1.15 217 60 7.40 5.40 6.24
114 20 54 200 70 1.06 210 70 6.82 5.86 6.23
115 31 83 217 43 1.47 227 43 8.67 4.61 6.76
116 14 57 194 67 1.09 204 67 6.46 6.18 6.71
117 273 66 301 65 1.10 311 65 8.96 4.46 4.92
118 131 56 88 54 1.24 98 54 39.89 1.00 1.24
119 25 59 205 65 1.10 215 65 7.21 5.54 6.11
120 279 31 341 57 1.19 351 57 5.97 6.69 7.98
121 40 72 223 56 1.21 233 56 9.82 4.07 4.90
122 15 47 196 77 1.03 206 77 6.57 6.08 6.24
123 228 81 253 37 1.66 263 37 39.79 1.00 1.67
124 46 75 231 56 1.21 241 56 12.20 3.27 3.95
125 269 79 287 68 1.08 297 68 12.92 3.09 3.34
126 269 79 287 68 1.08 297 68 12.92 3.09 3.34
127 281 63 308 70 1.06 318 70 7.92 5.05 5.37
128 119 82 107 76 1.03 117 76 12.96 3.08 3.18
129 34 40 208 85 1.00 218 85 7.50 5.33 5.35
130 109 86 105 87 1.00 115 87 13.91 2.87 2.87
131 312 75 134 80 1.02 144 80 7.28 5.48 5.57
132 359 76 174 51 1.29 184 51 5.92 6.75 8.69
133 33 58 212 67 1.09 222 67 7.95 5.02 5.46
Appendix B. Location 2 (continued)
Fracture
IDStrike Dip
Rotation to
horizontalWeighting
factor (f1)
Rotation about
Vertical Axis obs. length
Weight
factor
(f2)
f1*f2
100

Strike Dip Strike Dip
134 31 56 210 69 1.07 220 69 7.71 5.18 5.55
135 35 45 210 80 1.02 220 80 7.71 5.18 5.26
136 169 74 135 32 1.89 145 32 7.19 5.55 10.48
137 106 84 102 88 1.00 112 88 15.69 2.55 2.55
138 34 54 212 72 1.05 222 72 7.95 5.02 5.28
139 100 48 68 73 1.05 78 73 28.38 1.41 1.47
140 163 74 129 36 1.70 139 36 7.81 5.12 8.70
141 31 59 210 66 1.09 220 66 7.71 5.18 5.67
142 37 50 213 76 1.03 223 76 8.08 4.94 5.09
143 28 50 206 75 1.04 216 75 7.30 5.47 5.66
144 147 81 124 53 1.25 134 53 8.48 4.71 5.90
145 29 51 207 74 1.04 217 74 7.40 5.40 5.62
146 31 57 210 68 1.08 220 68 7.71 5.18 5.59
147 29 57 208 68 1.08 218 68 7.50 5.33 5.75
148 29 49 207 76 1.03 217 76 7.40 5.40 5.57
149 26 66 207 58 1.18 217 58 7.40 5.40 6.37
150 25 64 205 60 1.15 215 60 7.21 5.54 6.40
151 31 50 208 75 1.04 218 75 7.50 5.33 5.52
152 74 80 259 69 1.07 269 69 39.50 1.01 1.08
153 1 41 187 84 1.01 197 84 6.17 6.47 6.51
154 22 41 201 83 1.01 211 83 6.89 5.80 5.84
155 23 44 202 80 1.02 212 80 6.96 5.74 5.82
156 32 44 208 81 1.01 218 81 7.50 5.33 5.39
157 28 52 206 73 1.05 216 73 7.30 5.47 5.72
158 22 53 201 71 1.06 211 71 6.89 5.80 6.13
159 10 49 192 75 1.04 202 75 6.37 6.27 6.49
160 2 60 183 66 1.09 193 66 6.06 6.59 7.22
161 22 44 201 80 1.02 211 80 6.89 5.80 5.89
162 22 62 202 62 1.13 212 62 6.96 5.74 6.50
163 199 78 201 22 2.67 211 22 6.89 5.80 15.47
164 87 59 71 88 1.00 81 88 37.72 1.06 1.06
165 36 45 211 81 1.01 221 81 7.83 5.10 5.17
166 18 42 198 82 1.01 208 82 6.69 5.97 6.03
167 44 36 33 89 1.00 43 89 8.07 4.95 4.95
168 108 90 288 90 1.00 298 90 12.49 3.20 3.20
169 318 72 140 77 1.03 150 77 6.81 5.87 6.02
170 24 36 202 88 1.00 212 88 6.96 5.74 5.74
171 27 39 204 85 1.00 214 85 7.12 5.61 5.63
172 105 32 54 63 1.12 64 63 13.46 2.97 3.33
173 308 61 323 89 1.00 333 89 6.61 6.04 6.04
174 297 59 319 80 1.02 329 80 6.87 5.81 5.90
175 26 58 205 66 1.09 215 66 7.21 5.54 6.06
176 33 62 213 64 1.11 223 64 8.08 4.94 5.50
177 89 68 259 88 1.00 269 88 39.50 1.01 1.01
178 23 53 202 71 1.06 212 71 6.96 5.74 6.07
Appendix B. Location 2 (continued)
Fracture
IDStrike Dip
Rotation to
horizontalWeighting
factor (f1)
Rotation about
Vertical Axis obs. length
Weight
factor
(f2)
f1*f2
101

Strike Dip Strike Dip
179 34 57 212 69 1.07 222 69 7.95 5.02 5.38
180 31 73 214 52 1.27 224 52 8.21 4.86 6.17
181 133 88 121 68 1.08 131 68 8.98 4.45 4.80
182 64 59 237 78 1.02 247 78 15.16 2.64 2.69
183 110 61 84 73 1.05 94 73 39.60 1.01 1.05
184 48 79 236 53 1.25 246 53 14.56 2.74 3.44
185 317 88 127 68 1.08 137 68 8.06 4.96 5.35
186 316 39 344 79 1.02 354 79 5.93 6.73 6.86
187 41 52 217 75 1.04 227 75 8.67 4.61 4.77
188 37 56 215 70 1.06 225 70 8.36 4.78 5.09
189 42 53 218 74 1.04 228 74 8.83 4.52 4.70
190 53 55 227 76 1.03 237 76 10.86 3.68 3.79
191 48 59 225 71 1.06 235 71 10.31 3.87 4.10
192 52 59 228 72 1.05 238 72 11.16 3.58 3.76
193 19 67 199 57 1.19 209 57 6.75 5.92 7.05
194 26 54 205 70 1.06 215 70 7.21 5.54 5.89
195 304 87 120 79 1.02 130 79 9.16 4.36 4.44
196 25 53 204 71 1.06 214 71 7.12 5.61 5.93
197 45 57 222 72 1.05 232 72 9.60 4.16 4.37
198 58 63 235 72 1.05 245 72 14.01 2.85 3.00
199 49 51 222 78 1.02 232 78 9.60 4.16 4.25
200 5 79 180 47 1.37 190 47 5.99 6.66 9.11
201 359 72 176 55 1.22 186 55 5.93 6.73 8.22
202 93 58 74 83 1.01 84 83 39.71 1.01 1.01
203 29 52 207 73 1.05 217 73 7.40 5.40 5.65
204 7 76 184 49 1.33 194 49 6.08 6.57 8.70
205 99 64 82 83 1.01 92 83 39.53 1.01 1.02
206 354 66 173 62 1.13 183 62 5.91 6.76 7.66
207 354 60 176 68 1.08 186 68 5.93 6.73 7.26
208 356 62 177 65 1.10 187 65 5.95 6.72 7.41
209 61 64 238 73 1.05 248 73 15.81 2.53 2.64
210 150 75 120 47 1.37 130 47 9.16 4.36 5.96
211 258 80 279 60 1.15 289 60 17.96 2.22 2.57
212 258 80 279 60 1.15 289 60 17.96 2.22 2.57
213 21 54 201 70 1.06 211 70 6.89 5.80 6.17
214 202 76 209 20 2.92 219 20 7.60 5.25 15.36
215 203 76 212 20 2.92 222 20 7.95 5.02 14.69
Appendix B. Location 2 (continued)
Fracture
IDStrike Dip
Rotation to
horizontalWeighting
factor (f1)
Rotation about
Vertical Axis obs. length
Weight
factor
(f2)
f1*f2
102

Strike Dip Strike Dip
1 273 89 296 51 1.29 249 51 13.67 4.58 5.89
2 273 69 321 43 1.47 274 43 62.56 1.00 1.47
3 277 71 319 47 1.37 272 47 62.44 1.00 1.37
4 337 83 152 74 1.04 271 74 62.41 1.00 1.04
5 356 48 191 81 1.01 268 81 62.43 1.00 1.02
6 119 50 93 86 1.00 276 86 45.50 1.38 1.38
7 122 57 101 87 1.00 278 87 34.43 1.82 1.82
8 139 80 128 83 1.01 98 83 35.21 1.78 1.79
9 118 36 81 80 1.02 99 80 31.32 2.00 2.03
10 49 19 47 84 1.01 119 84 10.11 6.19 6.23
11 73 45 245 74 1.04 105 74 18.93 3.31 3.44
12 133 49 97 76 1.03 107 76 16.76 3.73 3.85
13 140 73 122 79 1.02 116 79 11.18 5.60 5.70
14 119 50 93 86 1.00 133 86 7.18 8.71 8.73
15 343 68 168 77 1.03 121 77 9.51 6.58 6.75
16 343 88 150 67 1.09 103 67 21.78 2.87 3.12
17 343 90 148 66 1.09 101 66 25.68 2.44 2.67
18 344 86 153 67 1.09 106 67 17.78 3.52 3.82
19 345 87 152 65 1.10 105 65 18.93 3.31 3.65
20 346 87 153 65 1.10 106 65 17.78 3.52 3.88
21 140 81 129 83 1.01 133 83 7.18 8.71 8.78
22 329 85 146 80 1.02 129 80 7.79 8.04 8.16
23 326 85 145 83 1.01 135 83 6.93 9.03 9.10
24 346 55 180 83 1.01 135 83 6.93 9.03 9.10
25 347 88 152 63 1.12 105 63 18.93 3.31 3.71
26 347 54 182 83 1.01 135 83 6.93 9.03 9.10
27 347 84 156 65 1.10 109 65 15.05 4.16 4.59
28 146 66 117 72 1.05 126 72 8.34 7.51 7.89
29 350 67 173 72 1.05 126 72 8.34 7.51 7.89
30 144 74 125 76 1.03 131 76 7.47 8.38 8.64
31 147 87 138 79 1.02 136 79 6.81 9.19 9.36
32 163 79 137 61 1.14 115 61 11.59 5.40 6.17
33 139 87 135 86 1.00 146 86 5.91 10.59 10.62
34 102 53 268 81 1.01 144 81 6.06 10.33 10.46
35 358 74 172 62 1.13 125 62 8.54 7.33 8.30
36 122 52 96 85 1.00 153 85 5.50 11.38 11.42
37 123 53 97 85 1.00 153 85 5.50 11.38 11.42
38 139 89 136 87 1.00 155 87 5.41 11.58 11.59
39 163 49 102 54 1.24 124 54 8.76 7.14 8.83
40 9 51 197 73 1.05 150 73 5.66 11.06 11.57
41 337 80 154 76 1.03 156 76 5.36 11.67 12.03
42 16 28 32 90 1.00 345 90 5.07 12.35 12.35
43 193 86 164 38 1.62 131 38 7.47 8.38 13.61
Appendix B. Location 3
Fracture ID Strike Dip
Rotation to
horizontalWeighting
factor (f1)
Rotation about
Vertical Axis obs. lengthWeight
factor (f2)f1*f2
103

Strike Dip Strike Dip
44 350 67 173 72 1.05 163 72 5.12 12.22 12.84
45 24 46 210 72 1.05 163 72 5.12 12.22 12.84
46 78 28 60 89 1.00 171 89 4.96 12.62 12.62
47 29 49 212 68 1.08 165 68 5.07 12.34 13.31
48 33 64 211 53 1.25 164 53 5.10 12.28 15.37
49 36 49 218 67 1.09 171 67 4.96 12.62 13.71
50 351 61 178 76 1.03 172 76 4.95 12.65 13.04
51 37 52 218 64 1.11 171 64 4.96 12.62 14.04
52 38 48 220 67 1.09 173 67 4.94 12.68 13.77
53 40 47 221 68 1.08 174 68 4.93 12.70 13.70
54 42 56 222 59 1.17 175 59 4.92 12.72 14.85
55 43 62 223 53 1.25 176 53 4.91 12.74 15.96
56 44 78 223 37 1.66 176 37 4.91 12.74 21.17
57 47 73 227 42 1.49 180 42 4.90 12.77 19.09
58 47 44 227 71 1.06 180 71 4.90 12.77 13.51
59 48 59 228 56 1.21 181 56 4.90 12.77 15.41
60 138 79 127 84 1.01 0 84 4.90 12.77 12.84
61 50 55 230 60 1.15 183 60 4.91 12.76 14.73
62 51 45 230 70 1.06 183 70 4.91 12.76 13.57
63 51 45 230 70 1.06 183 70 4.91 12.76 13.57
64 335 66 166 84 1.01 182 84 4.90 12.77 12.84
65 346 60 176 80 1.02 183 80 4.91 12.76 12.95
66 159 90 146 69 1.07 184 69 4.91 12.74 13.65
67 56 76 241 40 1.56 194 40 5.05 12.39 19.28
68 56 49 234 67 1.09 187 67 4.94 12.68 13.77
69 57 87 248 30 2.00 201 30 5.25 11.93 23.85
70 3 39 200 85 1.00 186 85 4.93 12.70 12.75
71 59 69 242 48 1.35 195 48 5.07 12.34 16.60
72 59 80 247 37 1.66 200 37 5.21 12.00 19.94
73 159 27 76 58 1.18 194 58 5.05 12.39 14.61
74 62 67 245 50 1.31 198 50 5.15 12.15 15.86
75 62 51 240 66 1.09 193 66 5.03 12.45 13.62
76 3 39 200 85 1.00 188 85 4.95 12.65 12.70
77 64 69 248 49 1.33 201 49 5.25 11.93 15.80
78 64 69 248 49 1.33 201 49 5.25 11.93 15.80
79 125 41 87 78 1.02 190 78 4.98 12.58 12.86
80 64 39 237 78 1.02 190 78 4.98 12.58 12.86
81 64 65 247 53 1.25 200 53 5.21 12.00 15.03
82 64 53 242 64 1.11 195 64 5.07 12.34 13.73
83 338 71 163 79 1.02 192 79 5.01 12.49 12.73
84 67 56 246 62 1.13 199 62 5.18 12.08 13.68
85 13 45 203 76 1.03 193 76 5.03 12.45 12.83
86 68 66 251 53 1.25 205 53 5.41 11.58 14.50
Appendix B. Location 3 (continued)
Fracture ID Strike Dip
Rotation to
horizontalWeighting
factor (f1)
Rotation about
Vertical Axis obs. lengthWeight
factor (f2)f1*f2
104

Strike Dip Strike Dip
87 68 67 252 53 1.25 204 53 5.36 11.67 14.61
88 69 60 249 59 1.17 202 59 5.28 11.84 13.82
89 69 52 246 67 1.09 199 67 5.18 12.08 13.12
90 71 58 250 62 1.13 203 62 5.32 11.76 13.32
91 71 53 248 66 1.09 201 66 5.25 11.93 13.05
92 72 69 257 52 1.27 210 52 5.66 11.06 14.04
93 86 51 257 74 1.04 198 74 5.15 12.15 12.64
94 61 59 241 58 1.18 211 58 5.72 10.95 12.91
95 76 75 265 50 1.31 218 50 6.22 10.07 13.14
96 53 46 231 69 1.07 205 69 5.41 11.58 12.40
97 3 36 202 87 1.00 195 87 5.07 12.34 12.36
98 78 84 275 44 1.44 228 44 7.32 8.55 12.30
99 78 52 252 70 1.06 205 70 5.41 11.58 12.32
100 92 33 69 89 1.00 13 89 5.03 12.45 12.45
101 79 55 255 68 1.08 208 68 5.55 11.28 12.16
102 81 61 260 64 1.11 213 64 5.84 10.71 11.92
103 81 70 266 56 1.21 219 56 6.31 9.93 11.97
104 81 52 255 71 1.06 208 71 5.55 11.28 11.93
105 81 79 274 50 1.31 227 50 7.18 8.71 11.37
106 82 60 260 65 1.10 213 65 5.84 10.71 11.82
107 64 39 237 78 1.02 204 78 5.36 11.67 11.93
108 24 46 210 72 1.05 209 72 5.60 11.17 11.75
109 84 59 261 67 1.09 214 67 5.91 10.59 11.50
110 83 52 256 72 1.05 210 72 5.66 11.06 11.63
111 84 58 260 68 1.08 213 68 5.84 10.71 11.55
112 82 44 251 78 1.02 207 78 5.50 11.38 11.64
113 85 46 254 78 1.02 207 78 5.50 11.38 11.64
114 85 46 254 78 1.02 207 78 5.50 11.38 11.64
115 92 55 264 74 1.04 210 74 5.66 11.06 11.51
116 86 71 271 59 1.17 224 59 6.81 9.19 10.72
117 86 71 271 59 1.17 224 59 6.81 9.19 10.72
118 86 66 267 62 1.13 220 62 6.40 9.79 11.08
119 87 55 261 71 1.06 214 71 5.91 10.59 11.20
120 87 71 272 59 1.17 226 59 7.05 8.87 10.35
121 87 67 269 62 1.13 222 62 6.59 9.49 10.75
122 87 72 273 59 1.17 225 59 6.93 9.03 10.54
123 88 62 266 67 1.09 219 67 6.31 9.93 10.78
124 159 33 83 57 1.19 229 57 7.47 8.38 9.99
125 159 40 91 57 1.19 230 57 7.62 8.21 9.79
126 89 62 267 67 1.09 220 67 6.40 9.79 10.63
127 84 52 257 72 1.05 216 72 6.06 10.33 10.87
128 77 52 252 69 1.07 220 69 6.40 9.79 10.48
129 91 74 278 60 1.15 231 60 7.79 8.04 9.28
Appendix B. Location 3 (continued)
Fracture ID Strike Dip
Rotation to
horizontalWeighting
factor (f1)
Rotation about
Vertical Axis obs. lengthWeight
factor (f2)f1*f2
105

Strike Dip Strike Dip
130 91 68 273 64 1.11 226 64 7.05 8.87 9.87
131 78 32 242 87 1.00 205 87 5.41 11.58 11.59
132 127 69 113 89 1.00 22 89 5.28 11.84 11.85
133 101 63 275 74 1.04 217 74 6.14 10.20 10.61
134 93 52 262 77 1.03 215 77 5.98 10.46 10.74
135 93 77 282 60 1.15 235 60 8.54 7.33 8.46
136 94 67 274 67 1.09 227 67 7.18 8.71 9.46
137 36 40 219 76 1.03 219 76 6.31 9.93 10.23
138 351 55 183 79 1.02 216 79 6.06 10.33 10.53
139 96 68 276 68 1.08 229 68 7.47 8.38 9.04
140 97 71 279 66 1.09 232 66 7.96 7.86 8.61
141 99 80 289 62 1.13 242 62 10.44 6.00 6.79
142 99 75 284 65 1.10 237 65 9.00 6.96 7.68
143 302 81 318 74 1.04 228 74 7.32 8.55 8.89
144 104 55 271 81 1.01 221 81 6.49 9.64 9.76
145 347 54 182 83 1.01 219 83 6.31 9.93 10.00
146 102 40 258 90 1.00 211 90 5.72 10.95 10.95
147 104 74 286 70 1.06 239 70 9.51 6.58 7.00
148 132 77 123 88 1.00 215 88 5.98 10.46 10.47
149 123 83 304 81 1.01 224 81 6.81 9.19 9.30
150 347 54 182 83 1.01 223 83 6.70 9.34 9.41
151 89 56 263 72 1.05 238 72 9.25 6.77 7.12
152 53 35 230 80 1.02 229 80 7.47 8.38 8.51
153 107 77 291 71 1.06 244 71 11.18 5.60 5.92
154 109 82 296 70 1.06 249 70 13.67 4.58 4.87
155 106 60 276 80 1.02 233 80 8.14 7.69 7.81
156 91 61 267 69 1.07 251 69 15.05 4.16 4.45
157 92 38 252 87 1.00 224 87 6.81 9.19 9.20
158 137 87 134 88 1.00 224 88 6.81 9.19 9.19
159 85 46 254 78 1.02 240 78 9.80 6.39 6.53
160 52 31 229 84 1.01 231 84 7.79 8.04 8.08
161 67 41 240 76 1.03 251 76 15.05 4.16 4.29
162 59 31 233 85 1.00 237 85 9.00 6.96 6.98
163 117 56 278 90 1.00 231 90 7.79 8.04 8.04
164 109 63 280 80 1.02 34 80 5.91 10.59 10.75
165 118 83 302 77 1.03 255 77 18.93 3.31 3.39
166 28 27 218 89 1.00 234 89 8.34 7.51 7.51
167 343 53 180 86 1.00 46 86 7.05 8.87 8.89
168 354 43 193 86 1.00 46 86 7.05 8.87 8.89
169 95 55 266 76 1.03 263 76 40.21 1.56 1.60
170 121 82 302 80 1.02 255 80 18.93 3.31 3.36
171 64 31 235 85 1.00 49 85 7.47 8.38 8.41
172 122 63 286 90 1.00 239 90 9.51 6.58 6.58
Appendix B. Location 3 (continued)
Fracture ID Strike Dip
Rotation to
horizontalWeighting
factor (f1)
Rotation about
Vertical Axis obs. lengthWeight
factor (f2)f1*f2
106

Strike Dip Strike Dip
173 110 52 271 87 1.00 54 87 8.34 7.51 7.52
174 122 83 304 80 1.02 257 80 21.78 2.87 2.92
175 116 64 284 85 1.00 50 85 7.62 8.21 8.24
176 308 87 315 81 1.01 257 81 21.78 2.87 2.91
177 137 87 134 88 1.00 244 88 11.18 5.60 5.60
178 123 76 298 85 1.00 251 85 15.05 4.16 4.17
179 124 83 304 82 1.01 257 82 21.78 2.87 2.90
180 124 72 295 87 1.00 248 87 13.08 4.79 4.79
181 111 70 287 78 1.02 40 78 6.40 9.79 10.00
182 126 78 301 86 1.00 254 86 17.78 3.52 3.53
183 126 77 300 87 1.00 253 87 16.76 3.73 3.74
184 102 50 266 83 1.01 260 83 28.22 2.22 2.23
185 119 59 281 89 1.00 66 89 12.05 5.20 5.20
186 104 44 262 88 1.00 76 88 20.25 3.09 3.09
187 132 90 314 86 1.00 267 86 62.48 1.00 1.00
188 115 80 298 76 1.03 50 76 7.62 8.21 8.46
189 111 51 271 88 1.00 87 88 62.48 1.00 1.00
190 123 68 291 88 1.00 87 88 62.48 1.00 1.00
191 112 59 278 84 1.01 80 84 28.22 2.22 2.23
192 317 81 325 87 1.00 89 87 62.41 1.00 1.00
193 315 82 323 86 1.00 88 86 62.44 1.00 1.00
194 105 54 270 83 1.01 81 83 31.32 2.00 2.01
195 67 38 239 79 1.02 75 79 18.93 3.31 3.37
196 126 85 307 83 1.01 82 83 35.21 1.78 1.79
197 121 90 310 76 1.03 78 76 23.57 2.66 2.74
198 105 72 285 72 1.05 70 72 14.33 4.37 4.59
199 95 51 263 79 1.02 91 79 62.41 1.00 1.02
200 88 75 276 57 1.19 36 57 6.06 10.33 12.32
201 76 65 258 58 1.18 29 58 5.60 11.17 13.17
202 109 84 298 69 1.07 99 69 31.32 2.00 2.14
203 88 76 277 57 1.19 44 57 6.81 9.19 10.96
204 353 82 162 61 1.14 90 61 62.40 1.00 1.15
205 4 80 171 54 1.24 55 54 8.54 7.33 9.06
206 19 88 178 38 1.62 117 38 10.79 5.80 9.42
207 249 68 313 21 2.79 266 21 62.59 1.00 2.79
208 257 82 291 34 1.79 244 34 11.18 5.60 10.01
Appendix B. Location 3 (continued)
Fracture ID Strike Dip
Rotation to
horizontalWeighting
factor (f1)
Rotation about
Vertical Axis obs. lengthWeight
factor (f2)f1*f2
107

Strike Dip Strike Dip
1 126 68 139 89 1.00 109 89 8.25 0.91 0.91
2 276 83 100 77 1.03 70 77 8.30 0.90 0.93
3 289 78 282 90 1.00 252 90 8.20 0.92 0.92
4 142 59 335 84 1.01 305 84 9.54 0.79 0.79
5 270 88 101 69 1.07 71 69 8.25 0.91 0.97
6 204 59 24 59 1.17 354 59 7.54 0.99 1.16
7 164 54 352 75 1.04 322 75 9.49 0.79 0.82
8 193 33 18 86 1.00 348 86 7.66 0.98 0.98
9 244 68 66 63 1.12 36 63 9.27 0.81 0.91
10 239 55 54 71 1.06 24 71 8.21 0.91 0.97
11 190 25 199 86 1.00 169 86 7.64 0.98 0.98
12 174 40 6 83 1.01 336 83 8.20 0.91 0.92
13 289 87 110 86 1.00 80 86 7.92 0.95 0.95
14 156 54 347 79 1.02 317 79 10.22 0.73 0.75
15 353 77 315 33 1.84 285 33 8.08 0.93 1.70
16 213 69 35 50 1.31 5 50 7.53 1.00 1.30
17 171 77 342 53 1.25 312 53 10.52 0.71 0.89
18 296 86 292 87 1.00 262 87 7.87 0.95 0.95
19 104 80 119 76 1.03 89 76 7.80 0.96 0.99
20 104 81 118 76 1.03 88 76 7.80 0.96 0.99
21 105 87 113 80 1.02 83 80 7.86 0.95 0.97
22 234 67 57 58 1.18 27 58 8.42 0.89 1.05
23 197 50 18 68 1.08 348 68 7.66 0.98 1.06
24 213 52 32 66 1.09 2 66 7.50 1.00 1.09
25 271 63 80 84 1.01 50 84 10.18 0.74 0.74
26 127 66 142 89 1.00 112 89 8.42 0.89 0.89
27 213 45 31 73 1.05 1 73 7.50 1.00 1.05
28 217 46 34 73 1.05 4 73 7.52 1.00 1.04
29 273 78 94 77 1.03 64 77 8.67 0.86 0.89
30 273 78 94 77 1.03 64 77 8.67 0.86 0.89
31 186 52 9 68 1.08 339 68 8.02 0.93 1.01
32 155 71 333 67 1.09 303 67 9.31 0.81 0.87
33 323 90 309 66 1.09 279 66 7.90 0.95 1.04
34 294 78 284 85 1.00 254 85 8.11 0.92 0.93
35 210 48 29 70 1.06 359 70 7.50 1.00 1.06
36 294 75 281 84 1.01 251 84 8.24 0.91 0.91
37 211 46 30 72 1.05 0 72 7.50 1.00 1.05
38 239 61 57 66 1.09 27 66 8.42 0.89 0.98
39 174 49 1 75 1.04 331 75 8.56 0.88 0.91
40 245 50 55 77 1.03 25 77 8.28 0.91 0.93
41 161 79 331 58 1.18 301 58 9.11 0.82 0.97
Appendix B. Location 4
obs.
length
Weight
factor (f2)f1*f2Strike Dip
Rotation to
horizontalWeighting
factor (f1)
Rotation about
Vertical AxisFracture
ID
108

Strike Dip Strike Dip
42 255 57 66 77 1.03 36 77 9.27 0.81 0.83
43 248 39 50 88 1.00 20 88 7.98 0.94 0.94
44 127 88 302 80 1.02 272 80 7.81 0.96 0.98
45 218 47 35 72 1.05 5 72 7.53 1.00 1.05
46 294 73 279 83 1.01 249 83 8.35 0.90 0.91
47 181 51 5 71 1.06 335 71 8.26 0.91 0.96
48 236 58 53 67 1.09 23 67 8.15 0.92 1.00
49 218 41 34 78 1.02 4 78 7.52 1.00 1.02
50 188 60 8 60 1.15 338 60 8.08 0.93 1.07
51 287 81 103 87 1.00 73 87 8.15 0.92 0.92
52 314 86 301 71 1.06 271 71 7.80 0.96 1.02
53 180 61 0 62 1.13 330 62 8.64 0.87 0.98
54 209 51 28 67 1.09 358 67 7.50 1.00 1.09
55 94 85 109 69 1.07 79 69 7.94 0.94 1.01
56 214 43 31 75 1.04 1 75 7.50 1.00 1.04
57 218 57 37 62 1.13 7 62 7.56 0.99 1.12
58 207 49 27 69 1.07 357 69 7.51 1.00 1.07
59 209 45 28 73 1.05 358 73 7.50 1.00 1.05
60 209 43 28 75 1.04 358 75 7.50 1.00 1.03
61 181 42 9 79 1.02 339 79 8.02 0.93 0.95
62 229 35 39 86 1.00 9 86 7.59 0.99 0.99
63 186 45 11 75 1.04 341 75 7.92 0.95 0.98
64 227 51 43 70 1.06 13 70 7.70 0.97 1.04
65 175 57 358 67 1.09 328 67 8.83 0.85 0.92
66 287 81 103 87 1.00 73 87 8.15 0.92 0.92
67 194 46 17 73 1.05 347 73 7.69 0.98 1.02
68 288 78 101 90 1.00 71 90 8.25 0.91 0.91
69 249 57 62 74 1.04 32 74 8.84 0.85 0.88
70 228 61 48 61 1.14 18 61 7.89 0.95 1.09
71 116 73 131 83 1.01 101 83 7.95 0.94 0.95
72 190 43 15 76 1.03 345 76 7.76 0.97 1.00
73 174 72 348 55 1.22 318 55 10.06 0.75 0.91
74 187 60 7 60 1.15 337 60 8.14 0.92 1.06
75 195 63 14 56 1.21 344 56 7.80 0.96 1.16
76 160 59 346 73 1.05 316 73 10.39 0.72 0.75
77 150 63 336 76 1.03 306 76 9.66 0.78 0.80
78 286 75 98 89 1.00 68 89 8.41 0.89 0.89
79 133 57 152 88 1.00 122 88 9.20 0.82 0.82
80 250 84 84 55 1.22 54 55 9.64 0.78 0.95
81 311 86 299 74 1.04 269 74 7.80 0.96 1.00
82 284 78 99 86 1.00 69 86 8.35 0.90 0.90
f1*f2
Appendix B. Location 4 (continued)
Fracture
IDStrike Dip
Rotation to
horizontalWeighting
factor (f1)
Rotation about
Vertical Axisobs.
length
Weight
factor (f2)
109
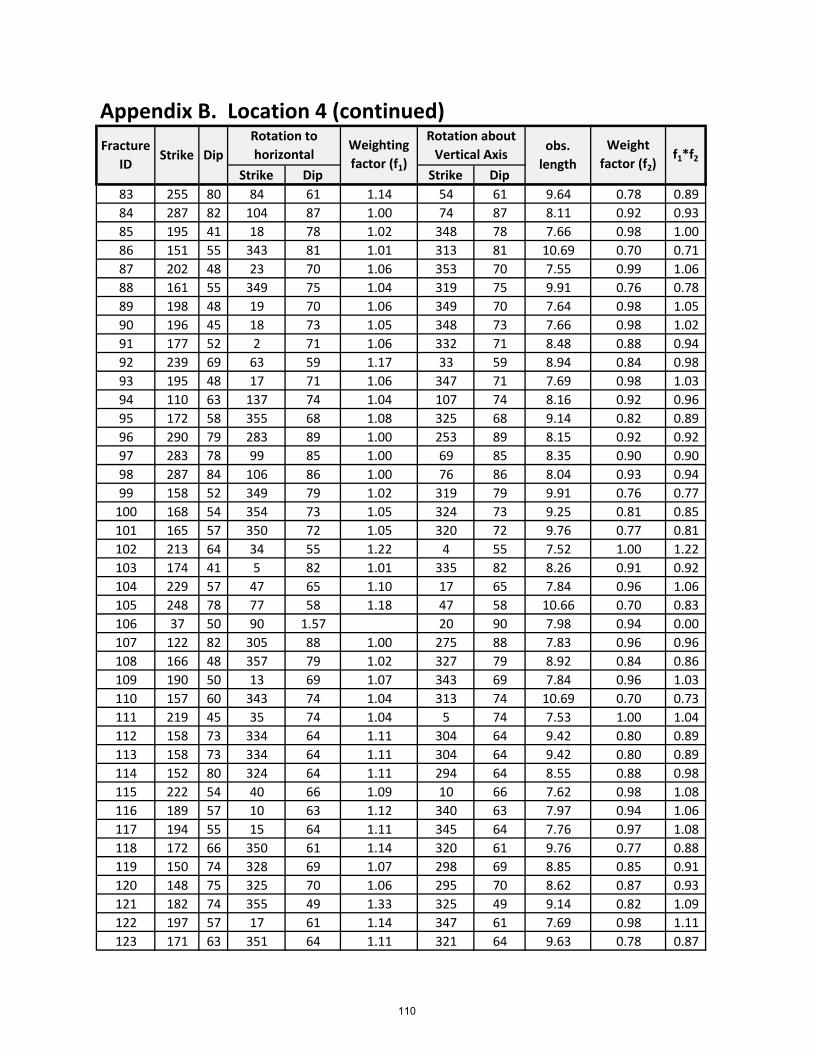
Strike Dip Strike Dip
83 255 80 84 61 1.14 54 61 9.64 0.78 0.89
84 287 82 104 87 1.00 74 87 8.11 0.92 0.93
85 195 41 18 78 1.02 348 78 7.66 0.98 1.00
86 151 55 343 81 1.01 313 81 10.69 0.70 0.71
87 202 48 23 70 1.06 353 70 7.55 0.99 1.06
88 161 55 349 75 1.04 319 75 9.91 0.76 0.78
89 198 48 19 70 1.06 349 70 7.64 0.98 1.05
90 196 45 18 73 1.05 348 73 7.66 0.98 1.02
91 177 52 2 71 1.06 332 71 8.48 0.88 0.94
92 239 69 63 59 1.17 33 59 8.94 0.84 0.98
93 195 48 17 71 1.06 347 71 7.69 0.98 1.03
94 110 63 137 74 1.04 107 74 8.16 0.92 0.96
95 172 58 355 68 1.08 325 68 9.14 0.82 0.89
96 290 79 283 89 1.00 253 89 8.15 0.92 0.92
97 283 78 99 85 1.00 69 85 8.35 0.90 0.90
98 287 84 106 86 1.00 76 86 8.04 0.93 0.94
99 158 52 349 79 1.02 319 79 9.91 0.76 0.77
100 168 54 354 73 1.05 324 73 9.25 0.81 0.85
101 165 57 350 72 1.05 320 72 9.76 0.77 0.81
102 213 64 34 55 1.22 4 55 7.52 1.00 1.22
103 174 41 5 82 1.01 335 82 8.26 0.91 0.92
104 229 57 47 65 1.10 17 65 7.84 0.96 1.06
105 248 78 77 58 1.18 47 58 10.66 0.70 0.83
106 37 50 90 1.57 20 90 7.98 0.94 0.00
107 122 82 305 88 1.00 275 88 7.83 0.96 0.96
108 166 48 357 79 1.02 327 79 8.92 0.84 0.86
109 190 50 13 69 1.07 343 69 7.84 0.96 1.03
110 157 60 343 74 1.04 313 74 10.69 0.70 0.73
111 219 45 35 74 1.04 5 74 7.53 1.00 1.04
112 158 73 334 64 1.11 304 64 9.42 0.80 0.89
113 158 73 334 64 1.11 304 64 9.42 0.80 0.89
114 152 80 324 64 1.11 294 64 8.55 0.88 0.98
115 222 54 40 66 1.09 10 66 7.62 0.98 1.08
116 189 57 10 63 1.12 340 63 7.97 0.94 1.06
117 194 55 15 64 1.11 345 64 7.76 0.97 1.08
118 172 66 350 61 1.14 320 61 9.76 0.77 0.88
119 150 74 328 69 1.07 298 69 8.85 0.85 0.91
120 148 75 325 70 1.06 295 70 8.62 0.87 0.93
121 182 74 355 49 1.33 325 49 9.14 0.82 1.09
122 197 57 17 61 1.14 347 61 7.69 0.98 1.11
123 171 63 351 64 1.11 321 64 9.63 0.78 0.87
Appendix B. Location 4 (continued)
Fracture
IDStrike Dip
Rotation to
horizontalWeighting
factor (f1)
Rotation about
Vertical Axisobs.
length
Weight
factor (f2)f1*f2
110

Strike Dip Strike Dip
124 192 63 11 56 1.21 341 56 7.92 0.95 1.14
125 216 68 38 51 1.29 8 51 7.57 0.99 1.27
126 301 73 282 77 1.03 252 77 8.20 0.92 0.94
127 199 54 20 64 1.11 350 64 7.61 0.99 1.10
128 171 55 356 71 1.06 326 71 9.03 0.83 0.88
129 172 54 357 71 1.06 327 71 8.92 0.84 0.89
130 120 77 129 88 1.00 99 88 7.90 0.95 0.95
131 207 49 27 69 1.07 357 69 7.51 1.00 1.07
132 208 64 28 54 1.24 358 54 7.50 1.00 1.24
133 189 55 11 65 1.10 341 65 7.92 0.95 1.04
134 284 89 109 81 1.01 79 81 7.94 0.94 0.96
135 286 88 109 83 1.01 79 83 7.94 0.94 0.95
136 291 89 112 87 1.00 82 87 7.88 0.95 0.95
137 222 62 43 58 1.18 13 58 7.70 0.97 1.15
138 193 51 15 68 1.08 345 68 7.76 0.97 1.04
139 183 57 5 64 1.11 335 64 8.26 0.91 1.01
140 172 45 2 79 1.02 332 79 8.48 0.88 0.90
141 171 43 2 81 1.01 332 81 8.48 0.88 0.90
142 288 85 107 86 1.00 77 86 8.00 0.94 0.94
143 288 85 107 86 1.00 77 86 8.00 0.94 0.94
144 149 69 331 73 1.05 301 73 9.11 0.82 0.86
145 180 49 5 73 1.05 335 73 8.26 0.91 0.95
146 197 58 17 60 1.15 347 60 7.69 0.98 1.13
147 238 57 54 69 1.07 24 69 8.21 0.91 0.98
148 205 49 25 69 1.07 355 69 7.53 1.00 1.07
149 172 51 359 74 1.04 329 74 8.73 0.86 0.89
150 151 57 341 80 1.02 311 80 10.36 0.72 0.74
151 212 47 30 71 1.06 0 71 7.50 1.00 1.06
152 220 62 41 58 1.18 11 58 7.64 0.98 1.16
153 199 57 19 61 1.14 349 61 7.64 0.98 1.12
154 196 46 18 72 1.05 348 72 7.66 0.98 1.03
155 283 84 104 82 1.01 74 82 8.11 0.92 0.93
156 132 63 327 89 1.00 297 89 8.76 0.86 0.86
157 204 46 24 72 1.05 354 72 7.54 0.99 1.05
158 210 49 29 69 1.07 359 69 7.50 1.00 1.07
159 212 56 32 62 1.13 2 62 7.50 1.00 1.13
160 208 65 28 53 1.25 358 53 7.50 1.00 1.25
161 124 89 300 83 1.01 270 83 7.80 0.96 0.97
162 194 59 14 60 1.15 344 60 7.80 0.96 1.11
163 284 82 103 84 1.01 73 84 8.15 0.92 0.92
164 165 56 351 73 1.05 321 73 9.63 0.78 0.81
f1*f2
Appendix B. Location 4 (continued)
Fracture
IDStrike Dip
Rotation to
horizontalWeighting
factor (f1)
Rotation about
Vertical Axisobs.
length
Weight
factor (f2)
111

Strike Dip Strike Dip
165 208 53 28 65 1.10 358 65 7.50 1.00 1.10
166 172 62 353 64 1.11 323 64 9.37 0.80 0.89
167 198 48 19 70 1.06 349 70 7.64 0.98 1.05
168 149 60 338 79 1.02 308 79 9.92 0.76 0.77
169 156 57 344 77 1.03 314 77 10.82 0.69 0.71
170 178 71 353 54 1.24 323 54 9.37 0.80 0.99
171 176 56 359 68 1.08 329 68 8.73 0.86 0.93
172 183 57 5 64 1.11 335 64 8.26 0.91 1.01
173 159 49 352 81 1.01 322 81 9.49 0.79 0.80
174 145 85 315 66 1.09 285 66 8.08 0.93 1.02
175 273 86 101 73 1.05 71 73 8.25 0.91 0.95
176 157 70 336 67 1.09 306 67 9.66 0.78 0.84
177 219 63 40 57 1.19 10 57 7.62 0.98 1.17
178 181 88 343 38 1.62 313 38 10.69 0.70 1.14
179 286 71 274 89 1.00 244 89 8.67 0.87 0.87
180 192 56 13 63 1.12 343 63 7.84 0.96 1.07
181 175 57 358 67 1.09 328 67 8.83 0.85 0.92
182 290 86 109 87 1.00 79 87 7.94 0.94 0.95
183 84 90 99 63 1.12 69 63 8.35 0.90 1.01
184 22 59 245 4 14.34 215 4 9.17 0.82 11.73
185 183 44 9 77 1.03 339 77 8.02 0.93 0.96
186 286 76 98 89 1.00 68 89 8.41 0.89 0.89
187 281 77 97 84 1.01 67 84 8.47 0.89 0.89
188 281 78 98 84 1.01 68 84 8.41 0.89 0.90
189 191 71 7 49 1.33 337 49 8.14 0.92 1.22
190 197 68 15 51 1.29 345 51 7.76 0.97 1.24
191 179 51 4 71 1.06 334 71 8.33 0.90 0.95
192 167 48 357 78 1.02 327 78 8.92 0.84 0.86
193 173 49 1 75 1.04 331 75 8.56 0.88 0.91
194 177 63 356 61 1.14 326 61 9.03 0.83 0.95
195 147 63 334 78 1.02 304 78 9.42 0.80 0.81
196 152 62 338 76 1.03 308 76 9.92 0.76 0.78
197 178 56 1 67 1.09 331 67 8.56 0.88 0.95
198 153 60 340 76 1.03 310 76 10.20 0.74 0.76
199 152 75 328 67 1.09 298 67 8.85 0.85 0.92
200 168 65 348 64 1.11 318 64 10.06 0.75 0.83
201 174 53 359 71 1.06 329 71 8.73 0.86 0.91
202 176 60 357 64 1.11 327 64 8.92 0.84 0.94
203 289 72 276 87 1.00 246 87 8.53 0.88 0.88
204 189 58 10 62 1.13 340 62 7.97 0.94 1.07
205 250 73 75 63 1.12 45 63 10.61 0.71 0.79
Appendix B. Location 4 (continued)
Fracture
IDStrike Dip
Rotation to
horizontalWeighting
factor (f1)
Rotation about
Vertical Axisobs.
length
Weight
factor (f2)f1*f2
112

Strike Dip Strike Dip
1 302 90 147 41 1.52 151 90 8.35 1.76 2.68
2 332 90 167 66 1.09 181 90 7.30 2.01 2.20
3 344 84 167 80 1.02 193 84 7.49 1.96 1.99
4 347 77 162 86 1.00 196 77 7.59 1.93 1.94
5 348 87 171 82 1.01 197 87 7.63 1.92 1.94
6 352 86 172 86 1.00 201 86 7.82 1.88 1.88
7 353 52 321 79 1.02 202 52 7.87 1.87 1.90
8 354 42 312 75 1.04 203 42 7.93 1.85 1.92
9 357 51 321 76 1.03 206 51 8.12 1.81 1.86
10 0 70 340 80 1.02 209 70 8.35 1.76 1.79
11 1 68 339 79 1.02 210 68 8.43 1.74 1.78
12 3 78 349 81 1.01 212 78 8.61 1.71 1.73
13 4 70 342 77 1.03 213 70 8.70 1.69 1.73
14 7 50 323 68 1.08 216 50 9.02 1.63 1.76
15 8 70 343 73 1.05 217 70 9.14 1.61 1.68
16 9 59 332 69 1.07 218 59 9.26 1.59 1.70
17 10 69 343 71 1.06 219 69 9.39 1.56 1.65
18 12 47 320 64 1.11 221 47 9.67 1.52 1.69
19 12 32 303 62 1.13 221 32 9.67 1.52 1.72
20 13 78 353 72 1.05 222 78 9.82 1.50 1.57
21 14 57 331 64 1.11 223 57 9.98 1.47 1.64
22 16 67 343 65 1.10 225 67 10.32 1.42 1.57
23 16 86 2 72 1.05 225 86 10.32 1.42 1.50
24 18 57 332 61 1.14 227 57 10.70 1.37 1.57
25 19 75 352 65 1.10 228 75 10.91 1.35 1.49
26 22 75 353 62 1.13 231 75 11.60 1.27 1.43
27 22 54 329 57 1.19 231 54 11.60 1.27 1.51
28 23 51 326 56 1.21 232 51 11.86 1.24 1.49
29 25 50 325 55 1.22 234 50 12.42 1.18 1.44
30 25 49 324 55 1.22 234 49 12.42 1.18 1.44
31 25 43 316 55 1.22 234 43 12.42 1.18 1.44
32 25 69 347 58 1.18 234 69 12.42 1.18 1.39
33 25 41 314 55 1.22 234 41 12.42 1.18 1.44
34 26 46 320 54 1.24 235 46 12.73 1.15 1.43
35 26 90 10 65 1.10 235 90 12.73 1.15 1.27
36 27 57 334 54 1.24 236 57 13.05 1.13 1.39
37 29 65 344 53 1.25 238 65 13.78 1.07 1.34
38 29 45 319 52 1.27 238 45 13.78 1.07 1.35
39 29 37 309 53 1.25 238 37 13.78 1.07 1.34
40 32 54 330 49 1.33 241 54 14.56 1.01 1.34
41 33 53 329 48 1.35 242 53 14.42 1.02 1.37
42 33 38 309 50 1.31 242 38 14.42 1.02 1.33
43 33 58 336 49 1.33 242 58 14.42 1.02 1.35
Fracture
IDStrike Dip
Appendix B. Location 5
Rotation to horizontalRotation about
Vertical Axis f1*f2Weight
factor (f2)obs.
length
Weighting
factor (f1)
113

Strike Dip Strike Dip
44 33 53 329 48 1.35 242 53 14.42 1.02 1.37
45 34 58 336 48 1.35 243 58 14.29 1.03 1.38
46 34 41 313 49 1.33 243 41 14.29 1.03 1.36
47 35 53 329 47 1.37 244 53 14.17 1.04 1.42
48 35 42 314 48 1.35 244 42 14.17 1.04 1.40
49 35 62 341 47 1.37 244 62 14.17 1.04 1.42
50 36 48 322 46 1.39 245 48 14.05 1.05 1.45
51 37 59 337 45 1.41 246 59 13.94 1.05 1.49
52 37 40 311 47 1.37 246 40 13.94 1.05 1.44
53 38 71 354 47 1.37 247 71 13.84 1.06 1.45
54 38 57 335 44 1.44 247 57 13.84 1.06 1.53
55 39 60 339 44 1.44 248 60 13.74 1.07 1.54
56 40 50 324 43 1.47 249 50 13.64 1.08 1.58
57 41 48 321 43 1.47 250 48 13.56 1.08 1.59
58 41 42 313 44 1.44 250 42 13.56 1.08 1.56
59 42 35 303 46 1.39 251 35 13.47 1.09 1.52
60 42 45 317 43 1.47 251 45 13.47 1.09 1.60
61 44 59 338 39 1.59 253 59 13.32 1.10 1.75
62 44 29 295 48 1.35 253 29 13.32 1.10 1.48
63 44 84 14 46 1.39 253 84 13.32 1.10 1.53
64 44 47 319 41 1.52 253 47 13.32 1.10 1.68
65 44 75 2 42 1.49 253 75 13.32 1.10 1.65
66 47 46 317 39 1.59 256 46 13.13 1.12 1.78
67 47 44 314 40 1.56 256 44 13.13 1.12 1.74
68 47 37 304 42 1.49 256 37 13.13 1.12 1.67
69 48 41 309 40 1.56 257 41 13.08 1.12 1.75
70 48 83 15 42 1.49 257 83 13.08 1.12 1.68
71 48 48 320 38 1.62 257 48 13.08 1.12 1.82
72 50 49 320 36 1.70 259 49 12.98 1.13 1.93
73 51 47 317 36 1.70 260 47 12.94 1.14 1.93
74 52 43 310 37 1.66 261 43 12.90 1.14 1.89
75 55 44 310 34 1.79 264 44 12.82 1.15 2.05
76 57 48 315 31 1.94 266 48 12.78 1.15 2.23
77 57 49 317 31 1.94 266 49 12.78 1.15 2.23
78 59 44 307 32 1.89 268 44 12.76 1.15 2.17
79 62 39 298 34 1.79 271 39 12.75 1.15 2.06
80 62 39 298 34 1.79 271 39 12.75 1.15 2.06
81 64 51 316 25 2.37 273 51 12.77 1.15 2.72
82 65 50 313 25 2.37 274 50 12.78 1.15 2.72
83 66 46 305 27 2.20 275 46 12.80 1.15 2.53
84 68 48 306 24 2.46 277 48 12.85 1.14 2.81
85 69 42 295 28 2.13 278 42 12.88 1.14 2.43
86 69 39 292 31 1.94 278 39 12.88 1.14 2.21
Appendix B. Location 5 (continued)
Fracture
IDStrike Dip
Rotation to horizontal Weighting
factor (f1)
Rotation about
Vertical Axisobs.
length
Weight
factor (f2)f1*f2
114

Strike Dip Strike Dip
87 70 56 321 19 3.07 279 56 12.91 1.14 3.49
88 72 47 299 23 2.56 281 47 12.99 1.13 2.89
89 72 34 284 34 1.79 281 34 12.99 1.13 2.02
90 74 56 315 16 3.63 283 56 13.09 1.12 4.07
91 74 41 288 27 2.20 283 41 13.09 1.12 2.47
92 75 61 332 13 4.45 284 61 13.15 1.12 4.97
93 78 43 285 24 2.46 287 43 13.34 1.10 2.71
94 78 85 60 21 2.79 287 85 13.34 1.10 3.07
95 79 59 315 11 5.24 288 59 13.42 1.09 5.74
96 79 61 324 9 6.39 288 61 13.42 1.09 7.00
97 79 52 295 16 3.63 288 52 13.42 1.09 3.97
98 79 36 278 31 1.94 288 36 13.42 1.09 2.13
99 81 49 285 18 3.24 290 49 13.58 1.08 3.50
100 81 82 64 17 3.42 290 82 13.58 1.08 3.70
101 81 45 281 22 2.67 290 45 13.58 1.08 2.89
102 82 40 277 26 2.28 291 40 13.67 1.07 2.45
103 83 53 285 14 4.13 292 53 13.76 1.07 4.41
104 84 47 277 19 3.07 293 47 13.87 1.06 3.25
105 86 65 329 2 28.65 295 65 14.08 1.04 29.89
106 86 43 271 23 2.56 295 43 14.08 1.04 2.67
107 87 86 85 20 2.92 296 86 14.20 1.03 3.02
108 87 35 269 31 1.94 296 35 14.20 1.03 2.01
109 87 39 269 27 2.20 296 39 14.20 1.03 2.28
110 87 31 269 35 1.74 296 31 14.20 1.03 1.80
111 87 58 274 8 7.19 296 58 14.20 1.03 7.43
112 87 48 270 18 3.24 296 48 14.20 1.03 3.35
113 88 44 268 22 2.67 297 44 14.33 1.03 2.74
114 88 62 268 4 14.34 297 62 14.33 1.03 14.70
115 89 71 99 5 11.47 298 71 14.46 1.02 11.66
116 89 37 267 29 2.06 298 37 14.46 1.02 2.10
117 91 58 250 8 7.19 300 58 7.30 2.01 14.46
118 91 44 262 22 2.67 300 44 7.30 2.01 5.37
119 91 44 262 22 2.67 300 44 7.30 2.01 5.37
120 93 82 105 17 3.42 302 82 13.71 1.07 3.67
121 93 52 252 15 3.86 302 52 13.71 1.07 4.14
122 97 46 250 21 2.79 306 46 12.37 1.19 3.31
123 97 49 246 19 3.07 306 49 12.37 1.19 3.65
124 99 52 237 17 3.42 308 52 11.81 1.24 4.25
125 101 57 219 15 3.86 310 57 11.31 1.30 5.02
126 101 37 253 31 1.94 310 37 11.31 1.30 2.52
127 105 43 242 27 2.20 314 43 10.47 1.40 3.09
128 106 43 240 27 2.20 315 43 10.29 1.43 3.14
129 107 53 221 21 2.79 316 53 10.12 1.45 4.05
Appendix B. Location 5 (continued)Rotation about
Vertical Axisobs.
length
Weight
factor (f2)f1*f2
Fracture
IDStrike Dip
Rotation to horizontal Weighting
factor (f1)
115
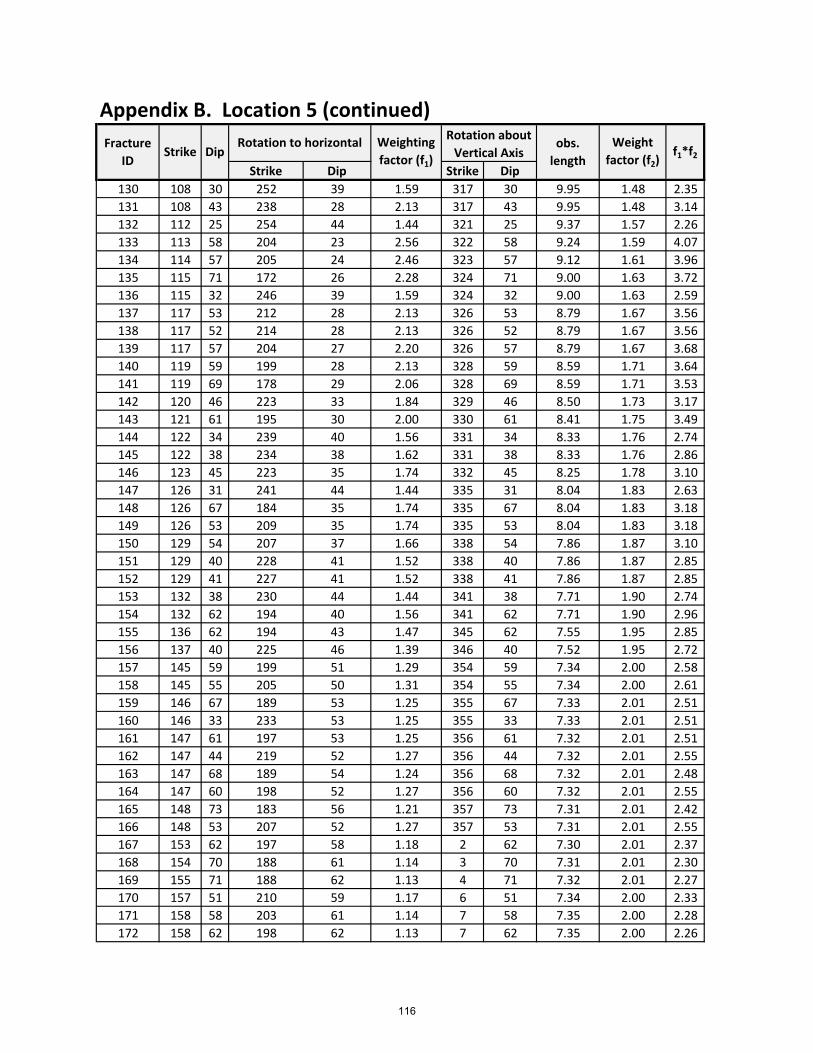
Strike Dip Strike Dip
130 108 30 252 39 1.59 317 30 9.95 1.48 2.35
131 108 43 238 28 2.13 317 43 9.95 1.48 3.14
132 112 25 254 44 1.44 321 25 9.37 1.57 2.26
133 113 58 204 23 2.56 322 58 9.24 1.59 4.07
134 114 57 205 24 2.46 323 57 9.12 1.61 3.96
135 115 71 172 26 2.28 324 71 9.00 1.63 3.72
136 115 32 246 39 1.59 324 32 9.00 1.63 2.59
137 117 53 212 28 2.13 326 53 8.79 1.67 3.56
138 117 52 214 28 2.13 326 52 8.79 1.67 3.56
139 117 57 204 27 2.20 326 57 8.79 1.67 3.68
140 119 59 199 28 2.13 328 59 8.59 1.71 3.64
141 119 69 178 29 2.06 328 69 8.59 1.71 3.53
142 120 46 223 33 1.84 329 46 8.50 1.73 3.17
143 121 61 195 30 2.00 330 61 8.41 1.75 3.49
144 122 34 239 40 1.56 331 34 8.33 1.76 2.74
145 122 38 234 38 1.62 331 38 8.33 1.76 2.86
146 123 45 223 35 1.74 332 45 8.25 1.78 3.10
147 126 31 241 44 1.44 335 31 8.04 1.83 2.63
148 126 67 184 35 1.74 335 67 8.04 1.83 3.18
149 126 53 209 35 1.74 335 53 8.04 1.83 3.18
150 129 54 207 37 1.66 338 54 7.86 1.87 3.10
151 129 40 228 41 1.52 338 40 7.86 1.87 2.85
152 129 41 227 41 1.52 338 41 7.86 1.87 2.85
153 132 38 230 44 1.44 341 38 7.71 1.90 2.74
154 132 62 194 40 1.56 341 62 7.71 1.90 2.96
155 136 62 194 43 1.47 345 62 7.55 1.95 2.85
156 137 40 225 46 1.39 346 40 7.52 1.95 2.72
157 145 59 199 51 1.29 354 59 7.34 2.00 2.58
158 145 55 205 50 1.31 354 55 7.34 2.00 2.61
159 146 67 189 53 1.25 355 67 7.33 2.01 2.51
160 146 33 233 53 1.25 355 33 7.33 2.01 2.51
161 147 61 197 53 1.25 356 61 7.32 2.01 2.51
162 147 44 219 52 1.27 356 44 7.32 2.01 2.55
163 147 68 189 54 1.24 356 68 7.32 2.01 2.48
164 147 60 198 52 1.27 356 60 7.32 2.01 2.55
165 148 73 183 56 1.21 357 73 7.31 2.01 2.42
166 148 53 207 52 1.27 357 53 7.31 2.01 2.55
167 153 62 197 58 1.18 2 62 7.30 2.01 2.37
168 154 70 188 61 1.14 3 70 7.31 2.01 2.30
169 155 71 188 62 1.13 4 71 7.32 2.01 2.27
170 157 51 210 59 1.17 6 51 7.34 2.00 2.33
171 158 58 203 61 1.14 7 58 7.35 2.00 2.28
172 158 62 198 62 1.13 7 62 7.35 2.00 2.26
Appendix B. Location 5 (continued)
Fracture
IDStrike Dip
Rotation to horizontal Weighting
factor (f1)
Rotation about
Vertical Axisobs.
length
Weight
factor (f2)f1*f2
116

Strike Dip Strike Dip
173 158 47 215 60 1.15 7 47 7.35 2.00 2.31
174 160 67 193 65 1.10 9 67 7.39 1.99 2.19
175 161 58 203 64 1.11 10 58 7.41 1.98 2.20
176 162 73 188 69 1.07 11 73 7.44 1.98 2.12
177 162 51 211 63 1.12 11 51 7.44 1.98 2.22
178 163 79 182 72 1.05 12 79 7.46 1.97 2.07
179 163 79 182 72 1.05 12 79 7.46 1.97 2.07
180 166 53 210 67 1.09 15 53 7.56 1.94 2.11
181 168 31 234 65 1.10 17 31 7.63 1.92 2.12
182 168 75 188 75 1.04 17 75 7.63 1.92 1.99
183 168 77 186 76 1.03 17 77 7.63 1.92 1.98
184 168 44 220 66 1.09 17 44 7.63 1.92 2.11
185 168 44 220 66 1.09 17 44 7.63 1.92 2.11
186 169 50 213 68 1.08 18 50 7.68 1.91 2.06
187 169 81 183 78 1.02 18 81 7.68 1.91 1.96
188 172 80 185 81 1.01 21 80 7.82 1.88 1.90
189 172 58 206 73 1.05 21 58 7.82 1.88 1.96
190 172 82 183 81 1.01 21 82 7.82 1.88 1.90
191 174 59 206 75 1.04 23 59 7.93 1.85 1.92
192 177 85 182 87 1.00 26 85 8.12 1.81 1.81
193 181 76 192 87 1.00 30 76 8.43 1.74 1.75
194 181 76 192 87 1.00 30 76 8.43 1.74 1.75
195 181 76 192 87 1.00 30 76 8.43 1.74 1.75
196 181 83 186 90 1.00 30 83 8.43 1.74 1.74
197 186 84 7 85 1.00 35 84 8.91 1.65 1.65
198 187 49 219 81 1.01 36 49 9.02 1.63 1.65
199 188 89 3 81 1.01 37 89 9.14 1.61 1.63
200 189 89 3 80 1.02 38 89 9.26 1.59 1.61
201 193 86 8 78 1.02 42 86 9.82 1.50 1.53
202 206 88 12 66 1.09 55 88 12.73 1.15 1.26
203 213 41 55 88 1.00 62 41 14.43 1.02 1.02
204 217 79 27 61 1.14 66 79 13.95 1.05 1.20
205 227 45 60 78 1.02 76 45 13.14 1.12 1.14
Rotation about
Vertical Axisobs.
length
Weight
factor (f2)f1*f2
Appendix B. Location 5 (continued)
Fracture
IDStrike Dip
Rotation to horizontal Weighting
factor (f1)
117