a new approach to urban pedestrian detection for automatic braking
TRANSCRIPT

594 IEEE TRANSACTIONS ON INTELLIGENT TRANSPORTATION SYSTEMS, VOL. 10, NO. 4, DECEMBER 2009
A New Approach to Urban PedestrianDetection for Automatic Braking
Alberto Broggi, Senior Member, IEEE, Pietro Cerri, Member, IEEE, Stefano Ghidoni, Member, IEEE,Paolo Grisleri, Member, IEEE, and Ho Gi Jung, Member, IEEE
Abstract—This paper presents an application of a pedestrian-detection system aimed at localizing potentially dangerous situa-tions under specific urban scenarios. The approach used in thispaper differs from those implemented in traditional pedestrian-detection systems, which are designed to localize all pedestriansin the area in front of the vehicle. Conversely, this approachsearches for pedestrians in critical areas only. The environment isreconstructed with a standard laser scanner, whereas the followingcheck for the presence of pedestrians is performed due to thefusion with a vision system. The great advantages of such anapproach are that pedestrian recognition is performed on limitedimage areas, therefore boosting its timewise performance, and noassessment on the danger level is finally required before providingthe result to either the driver or an onboard computer for au-tomatic maneuvers. A further advantage is the drastic reductionof false alarms, making this system robust enough to controlnonreversible safety systems.
Index Terms—Artificial intelligence (AI), computer vision, fuzzylogic, image processing, pattern recognition, pedestrian detection.
I. INTRODUCTION
EXISTING pedestrian-detection systems are based on thesearch for pedestrians in the whole area in front of a
vehicle. Candidates are located using pedestrian characteristics[1], such as shape, symmetry, texture, motion, and periodicityof human leg motion. When fusion between different sensingtechnologies is used, whether it is high level [2], [3] or lowlevel [4], each sensor searches for pedestrian-specific featuresin the whole area in front of the vehicle.
In this paper, we describe a system for the detection ofpedestrians based on a new approach. It is designed to work ina particularly challenging urban scenario, in which traditionalpedestrian-detection approaches would yield nonoptimal re-sults. Instead of searching for pedestrians in a large area in front
Manuscript received September 30, 2008; revised February 26, 2009,July 13, 2009, and August 31, 2009. First published October 20, 2009; currentversion published December 3, 2009. The Associate Editors for this paper wasB. de Schutter and S. Shladover.
A. Broggi, P. Cerri, and P. Grisleri are with the Artificial Visionand Intelligent Systems Laboratory (VisLab), Dipartimento di Ingegneriadell’Informazione, Università di Parma, 43124 Parma, Italy (e-mail: [email protected]; [email protected]; [email protected]).
S. Ghidoni was with the Artificial Vision and Intelligent Systems Laboratory(VisLab), Dipartimento di Ingegneria dell’Informazione, Università di Parma,43124 Parma, Italy. He is now with the Intelligent Autonomous SystemsLaboratory (IAS-Lab), Department of Information Engineering, University ofPadua, 35131 Padova, Italy (e-mail: [email protected]).
H. G. Jung was with MANDO Corporation Global R&D Headquarters,777 Yongin, Korea. He is now with Yonsei University, Seoul 120-749, Korea(e-mail: [email protected]).
Color versions of one or more of the figures in this paper are available onlineat http://ieeexplore.ieee.org.
Digital Object Identifier 10.1109/TITS.2009.2032770
of the vehicle, making no assumption on the external environ-ment, the system presented in this paper focuses on a specificurban scenario in which not only is the detection of a pedestrianof basic importance, but the danger of the situation can alsoclearly be assessed. In fact, in an advanced driving-assistancesystem, correct detection is just the first phase of a successfulproduct: The localization of a traffic sign, a traffic light, anobstacle, or a pedestrian with no corresponding indication ontheir position with respect to the vehicle and the environmentprovides incomplete information. As an example, a pedestriandetection system that is able to correctly localize all pedestrianspresent in the scene provides a huge amount of information,which still needs to be filtered to be useful to either the driveror the onboard computer in charge of automatic maneuvers.A possible filter may be implemented by fusing informationcoming from other systems, such as lane detection or othersituation analysis engines, and controller area network (CAN)data: A pedestrian exactly in front of the vehicle may or maynot be considered dangerous, depending on the surroundingenvironment, as shown in Fig. 1.
In this paper, the Artificial Vision and Intelligent SystemsLaboratory (VisLab) at the University of Parma approached theproblem in the opposite way: Instead of detecting all possiblecandidates and filtering them after the analysis of the environ-ment, we first analyze the scenario and then search for possiblepedestrians in specific positions for that particular scenario. Wecall this approach scenario-driven search (SDS). This way, alldetected pedestrians represent possible threats, and no furtherfiltering is needed (apart from a validation and a possible finaltracking step).
The scenarios that are considered here refer to the most com-mon urban situations: When vehicles are moving on an urbanroad, the most common threat that a pedestrian may pose, there-fore requiring successful detection, is road crossing. Stoppedvehicles on the road or on the road edges may occlude visibility,thus making the detection of the pedestrian more complex.
The underlying idea of our SDS approach applied to thisspecific scenario is to localize stopped vehicles and then searchfor pedestrians in their close proximity or in the areas partlyhidden by them. The stopped vehicles, whose edges will triggerthe search for pedestrians, may be parked cars on the road edge,vehicles temporarily stopped on the road, vehicles queued ina line in front of a traffic light or zebra crossing, or simplyjammed cars.
The first row of Fig. 2 shows some examples of situations inwhich the visibility of a crossing pedestrian is partly or com-pletely occluded by stopped vehicles. The second row of Fig. 2highlights, for each situation, the areas on which the system willperform a check for the presence of a possible pedestrian.
1524-9050/$26.00 © 2009 IEEE
Authorized licensed use limited to: Yonsei University. Downloaded on December 2, 2009 at 22:10 from IEEE Xplore. Restrictions apply.

BROGGI et al.: NEW APPROACH TO URBAN PEDESTRIAN DETECTION FOR AUTOMATIC BRAKING 595
Fig. 1. When a pedestrian is localized but no reference with respect to the environment is provided like in (a), the detector is not able to assess the danger level.When environmental information are available, the very same pedestrian may (b) become a threat or (c) be in a safe position.
Fig. 2. (First row) Situations considered in this paper. (Second row) Areas of interest considered for the detection of a possible pedestrian. (a) A crossingpedestrian is hidden by a parked vehicle. (b) A pedestrian is crossing the road behind a stopped bus. (c) A pedestrian is appearing between two parked vehicles.(d) A pedestrian is crossing the road between two vehicles stopped on the other side of the road. It is important to note that situations (a) and (b) refer to specificand predetermined urban areas (zebra crossings and bus stops). Situations (c) and (d) may happen in any portion of the road network.
In other words, this paper focuses on the detection of pedes-trians appearing just behind occluding obstacles; pedestriansthat are clearly visible in the frontal area of the vehicle alsoneed to be detected, but this function, which is also available onother systems [5], [6], is currently out of the scope of this paper.
The idea of focusing on a specific scene or scenario(referring to a dynamic or a static environment, respectively)is not new to pedestrian detection systems; in 2002, Frankeand Heinrich [7] developed a module that is able to detect balls(which are usually a strong sign of the presence of a child).Another example of very specific systems is that developed byCurio et al. [8], which was based on the visual localization ofthe specific moving pattern of human legs.
It is known [9] that parked vehicles, blocking the visibil-ity of pedestrians, are one of the main causes of accidents.Agran et al. [10] shows that the number of parked vehiclesalong a street is the strongest risk factor for pedestrian injuryoccurring on residential areas. Although, in these areas, parkingspaces should diagonally be arranged, there are situations, asshown in Fig. 2, in which vehicles temporarily stop on the
road, and their position cannot strategically be organized andcarefully controlled, as in the case of parking lots. Althoughsome of the situations of Fig. 2 refer to specific urban areas(i.e., zebra crossings and bus stops) that could specificallybe enhanced by intelligent infrastructures aimed at warningoncoming vehicles, other situations can happen in any part ofthe road network, making the installation of specific warninginfrastructures impractical.
The main characteristic required by our system is the capa-bility to perform the following:
1) quickly detect pedestrians, given the short working rangeand the particularly high danger of collision with a pedes-trian suddenly appearing behind an obstacle;
2) detect pedestrians as soon as they appear, even when theyare still partly occluded;
3) limit the search to specific areas, which are determinedby a quick preprocessing.
Fig. 3 shows the coverage of different sensing technologies(laser and vision) in a specific scenario considered in this paper.
Authorized licensed use limited to: Yonsei University. Downloaded on December 2, 2009 at 22:10 from IEEE Xplore. Restrictions apply.

596 IEEE TRANSACTIONS ON INTELLIGENT TRANSPORTATION SYSTEMS, VOL. 10, NO. 4, DECEMBER 2009
Fig. 3. Pedestrian partially hidden by parked cars may not be detected by alaser scanner positioned in the front bumper but can be detected using vision,even if partially occluded.
The fusion of laser scanner and vision can provide a quick androbust detection in case of suddenly appearing pedestrians: Thelaser scanner provides a list of areas in which a pedestrian mayappear, whereas the camera is able to detect the pedestrian, evenwhen he/she is not yet visible to the laser scanner.
A. Final Goal and Additional Requirements
The final goal of our pedestrian-detection system is to savelives and increase road safety through the use of both reversibleand nonreversible driving-assistance systems. Once the pedes-trian is detected with a sufficiently high confidence level, awarning is sent to the driver. In our system, we use audiblewarnings, but the final human machine interface is still to bedefined. Should the driver not promptly react to the warning,the system would issue a second level of warning by blowingthe vehicle’s horn. This second warning is still considered areversible system, although it is much more invasive than theformer. The aim of this loud warning is to attract the attentionof both the pedestrian itself and, once again, the driver. In casethe danger level is not reduced due to a prompt action of thedriver (or the pedestrian), the intelligent vehicle will trigger anonreversible system, such as automatic braking.
Being a nonreversible and very invasive system, its triggeringmust be preceded by an extremely careful analysis of the dangerlevel. Furthermore, the use of a nonreversible system requiresthe complete processing to be thoroughly tested with respect tofalse detections.
The false positive rate (i.e., the number of wrong detectionsper second) is a parameter that is gaining increasingly more
Fig. 4. (a) Hyundai Grandeur test vehicle equipped in Parma, Italy, and(b) the replica in Seoul, Korea.
interest as the research progresses toward the integration ofhigher levels of automation (i.e., nonreversible system). In thecase of automatic braking, the number of false positives is evenmore important than the number of correct detections.
In the literature [1], many different pedestrian detectionsystems have been surveyed, and a large number of test methodsfor pedestrian detection systems have been proposed, which arebased on single-frame analysis, temporal analysis of continuousvideo streams, or an event. Nevertheless, none of these methodsprovide sufficiently high performance to be considered safeenough to be fielded on a vehicle with a nonreversible safetysystem. Although the performance of each method in terms offalse positive rate depends on a number of different parameters(such as the desired correct detection rate), the best systemsare characterized by a false positive rate of about 0.01/frame.Considering a system running at 10 Hz, it would provide onefalse positive every 10 s. Clearly, this performance is very farfrom the ideal system.
The approach described in this paper is an alternative to con-ventional systems and aims to detect pedestrians in situations ofclear danger by limiting the search to specific areas. In additionto being quicker than other systems, this method also aims toreduce the number of false detections to zero.
The system presented in this paper has been developed andtested by VisLab on a Hyundai Grandeur prototype vehicle;Mando is using an exact replica of this system in Korea (seeFig. 4) to double test time.
Section II presents the test vehicle setup. Section III de-scribes the risky-area-detection subsystem.
In Section IV, considerations about vision fusion are dis-cussed. In Section V, experimental results are presented, where-as Section VI concludes this paper with some final remarks.
II. TEST VEHICLE
This section describes the perception system installed on ourtest vehicle and the guidelines used to choose the sensors, theactuators, and the processing system.
A. Sensing Technologies
Being designed to address an urban scenario in which theprototype vehicle is running close to stopped vehicles, a lim-itation on vehicle speed and detection range can be accepted.Low-to-medium vehicle speeds of up to 50 km/h and a detectionrange of about 40 m can be considered as a safe choice.
Environmental sensing requires stopped vehicles and otherstanding obstacles to be detected; a laser-based solution issufficiently strong to localize large obstacles, such as vehicles,
Authorized licensed use limited to: Yonsei University. Downloaded on December 2, 2009 at 22:10 from IEEE Xplore. Restrictions apply.

BROGGI et al.: NEW APPROACH TO URBAN PEDESTRIAN DETECTION FOR AUTOMATIC BRAKING 597
and classify them due to their shape. To overcome the lackof speed information associated with laser scans, we selecteda particular laser scanner with the specific characteristic ofproviding interlaced data. It groups a number of interlacedscans together to form a single higher resolution scan. Theanalysis of this interlaced data coupled with vehicle inertialdata allows the estimation of obstacle speed and, therefore,localizing static objects.
The best technology to check for the presence of evenpartly occluded pedestrians in given areas is vision. Monocularvision is sufficient since no 3-D reconstruction is needed, withdistance measurements being already available. Although thesystem is now being tested under daylight conditions, the useof a near-infrared (NIR) camera and proper illumination allowsthe extension of its operational range to the night.
B. Sensor Selection
The camera, i.e., an AVT Guppy F-036B, has been chosenfor several reasons. The sensor of 752 × 480 pixels has anaspect ratio of slightly less than 15/9, which is particularlysuitable for automotive applications since it frames a largelateral area, which often contains relevant information. Thesensitivity covers both the visible and NIR spectra. At night,a high response to the NIR radiation allows the detection ofobjects due to a specific illumination.
To achieve this, additional headlamps are mounted in frontof the vehicle. An NIR light-emitting diode headlight withan aperture of about 25◦ is mounted in front of the radiator,whereas headlamp blocks are customized by LS and consist oftwo modules: 1) a visible-range bifunctional lamp acting as lowbeam and high beam and 2) a NIR spectrum-range-only lamp.
The laser scanner is a SICK LMS 211-30206. The detectioncapabilities (scanning angle of 100◦, minimum angular resolu-tion of 0.25◦, up-to-80-m range, and fog correction) are suitablefor our goal.
The laser scanner is capable of 1◦ resolution, but due to foursubsequent rotations, the use of an interlacing system, and aphase gap of 0.25◦, it is possible to decrease the final granularityto 0.25◦. Every rotation takes 13.32 ms; therefore, in 53.28 ms,four rotations are performed. The time difference betweenmeasurements of the same scan is not negligible. Moreover,when the vehicle is moving, the shift between the laser scannerposition when the first pulse is measured and its position whenthe last pulse is measured is appreciable: The laser scannerinterlacing system makes this problem even more evident.
The camera and the laser scanner are not synchronized inhardware to relax the set of requirements. This means thata variable time shift exists between the data acquired by thetwo sensors; displacement due to the nonsynchronization isnegligible, because the vehicle moves at a low speed, and theprocessing rate is sufficiently high.
C. Vehicle Setup
The laser scanner and NIR headlamps are located in the frontbumper, as shown in Fig. 5. The NIR camera is placed insidethe driving cabin near the rear-view mirror, as shown in Fig. 6.
A compact PC (an Intel Core 2 Duo–based Mini-ITX) isinstalled in the boot. The onboard FireWire A controller is
Fig. 5. Detail of the front bumper showing the laser scanner integration andthe headlights.
Fig. 6. How the camera is installed inside the cabin.
used to connect the camera. An RS422-to-Universal-Serial-Bus(USB) adapter provides an easy connection with the laser. Inaddition, inertial data are gathered through the CAN bus usinga USB adapter.
Mando modified the vehicle braking system, allowing con-trol of the braking strength by sending appropriate CAN mes-sages from the processing box to the actuators. The brakingsystem installed on the test vehicle was replaced with Mando’sMGH-40 ESC plus to control vehicle deceleration via CAN.The braking system incorporates a deceleration control inter-face (DCI) for high-level system functions, such as adaptivecruise control (ACC) and precrash safety. As DCI receivesmultiple deceleration commands, the deceleration coordinatorselects the desired deceleration based on priorities and vehiclestatus. Once the desired deceleration is set, a feedforwardcontroller with a feedback loop controls vehicle decelerationby controlling wheel brake pressures. The DCI braking rangeextends up to 1.0 g, with a resolution of 0.01 g, a stableerror lower than 0.05 g, and a response time of 0.3 s. TheDCI cooperatively controls deceleration with vehicle-stabilitycontrol functions, such as electronic brake distribution, antilockbraking system, and electronic stability control (ESC).
The horn was also modified so that it can also be controlledthrough a USB I/O board shown in Fig. 7(a). The processingsystem controls the horn by simply writing on a serial port.
An additional 100-Hz yaw rate sensor, which was manu-factured by Siemens VDO and Mando, was also installed inthe car’s center of mass to get more accurate yaw measure-ments. The sensor is connected through the processing systemvia the CAN bus. The yaw rate sensor provides both lateralacceleration and yaw rate. Yaw rate values are provided withan accuracy of 0.0625◦/s. Fig. 7(b) shows the sensor.
Authorized licensed use limited to: Yonsei University. Downloaded on December 2, 2009 at 22:10 from IEEE Xplore. Restrictions apply.

598 IEEE TRANSACTIONS ON INTELLIGENT TRANSPORTATION SYSTEMS, VOL. 10, NO. 4, DECEMBER 2009
Fig. 7. (a) USB I/O board used to control the horn. (b) Special yaw rate sensor.
Fig. 8. Laser data (a) without correction and (b) with correction.
III. FOCUS OF ATTENTION
Two different laser data classifications are developed to makethe algorithm robust. Both methods are based on clusteringpulses into straight lines, but while the first method considersthe last scan only to classify obstacles, the second method usesa number of subsequent scans to verify obstacle positions andhence estimate their speed.
A. Data Alignment
As already explained in Section II, shifts between subsequentlaser scanner measurements can be appreciable and may causeclustering or classification problems since obstacle shapes mayappear distorted.
By using ego-motion data provided by the ESP CAN box,it is possible to estimate vehicle rototranslation and thereforecorrect the position measured for each pulse. The vehicle speedis used to correct translation, whereas the steering wheel angleallows calculating the yaw rate and, therefore, the rotationcorrection matrix. The yaw rate can be computed as
yaw rate =Vfr + Vfl
tw cos δ
where Vfr and Vfl are the front right and front left wheel speeds,respectively; δ indicates the wheel angle; and tw is the vehiclefront track.
As yaw rate measurements are affected by noise, an addi-tional yaw rate sensor is installed on the vehicle to increaseprecision and perform a sharper data correction.
Fig. 8 shows raw and corrected laser data referring to non-moving obstacles: The four laser rotations that create a scan
Fig. 9. Moving obstacle is represented by four different lines, even after datacorrection.
are clearly visible before the correction, whereas the obstacleappears as a single line after the correction.
Pulses echoed by moving obstacles cannot be compactedinto a single line since the obstacle position changes duringthe multiscan: Moving obstacles are still characterized by fourparallel lines after data correction, as shown in Fig. 9. Thisinformation will be used for obstacle classification.
B. Data Clustering
First, the pulses that belong to the same rotation are con-nected together: Moving obstacles are then identified by fourdifferent and parallel clusters, whereas standing obstacles areidentified by four overlapping clusters. The pulses are clusteredas chains of segments. The points that cannot be joined into anychain of the same rotation are then checked for merging withpoints of other rotations, considering proximity only. The pointsthat cannot be connected to any other point or are close to thelimit of the laser scanner range (about 80 m) are permanentlydiscarded.
C. Segment Merging
Up to now, pulses are joined into chains of segments withoutany other information. Adjacent segments with approximatelythe same orientation can be merged into a longer segment, pre-serving the obstacle shape but reducing both the data-structurecomplexity and the details of the representation. Consideringa chain of segments, it is possible to compute the straight linethat connects the chain start and end points. Then, the distancebetween this line and all the internal points is computed, andif the maximum distance is larger than the threshold, the line issplit into two lines. These steps are iterated while the maximumdistance is larger than the threshold. The result is that eachchain is therefore finally segmented into a polyline.
Fig. 10 shows a moving vehicle: The rear bumper is framedas four parallel lines, whereas its side, which is parallel to thevehicle movement direction, is marked by a single line.
D. Line Merging
Every obstacle in the laser scanner field of view is identifiedby four lines, i.e., one for each laser rotation that composes thewhole high-resolution scan. In the case of static obstacles, thefour lines are almost perfectly overlapping, due to the previousdata correction, and can be merged. Conversely, in the case ofmoving obstacles, the lines are parallel but not overlapping;therefore, static and moving obstacles can be located and cor-rectly classified. Fig. 11 shows the algorithm steps. This quick,simple, yet very effective process aimed at identifying static
Authorized licensed use limited to: Yonsei University. Downloaded on December 2, 2009 at 22:10 from IEEE Xplore. Restrictions apply.

BROGGI et al.: NEW APPROACH TO URBAN PEDESTRIAN DETECTION FOR AUTOMATIC BRAKING 599
Fig. 10. Moving vehicle and its motion direction. The four parallel lines cor-respond to its rear bumper, whereas the single line corresponds to its left side.The blue points are polyline start points, the cyan points are corner points, thered points are polyline endpoints, and the violet points are generic line points.
Fig. 11. Steps of the algorithm. (a) Data clustering. (b) Approximation usingpolylines. (c) Line merging. All the points are merged into a single line. Tosimplify the following steps, small drifts are ignored.
obstacles may generate false negatives when the vehicle’s pitchis not negligible. Section IV will discuss this issue.
E. Early Obstacle Classification
The polylines obtained so far can be classified according onlyto their size and shape. It is possible to divide obstacles into thefollowing categories:
1) possible pedestrian;2) road infrastructure;3) L-shaped obstacle;4) generic obstacle.Obstacles that are eventually classified as pedestrians are
supposed to have a limited size, whereas obstacles that have alarge size and are almost parallel to the vehicle are assumed tobe road edges (guardrails, buildings, road infrastructures, etc.).A simple and fast method based on line orientation is usedto detect L-shaped obstacles. All obstacles that have yet to beclassified are tagged as generic obstacles. The results obtainedso far are satisfactory; Fig. 12 shows an example.
Fig. 12. Obstacle classification. All possible classifications based on shapeare represented in the image.
Information about obstacle movement that was already esti-mated in the previous step is also stored for further usage.
F. Temporal and Shape-Based Correlation
The classification explained in the previous section classifiesall small obstacles as possible pedestrians. Even if it is possiblethat all pedestrians are correctly classified, a number of falsepositives may indeed be present.
Fixed obstacles along the road (particularly parked vehicles)are used here to localize critical areas in front of the vehicle sothat attention can be focussed on the immediate proximity ofthe edges of these risky areas, in which pedestrians can appearand become dangerous.
Polylines provided by the previous scans are aligned andrototranslated according to ego-motion; then, the overlap be-tween the current and previous polylines is checked to providea new classification in the following four classes: 1) movingobstacle; 2) static obstacle; 3) changing-shape obstacle; and4) new obstacle.
Scan data referring to moving obstacles should have little orno spatial overlap when the time window is large, but unfortu-nately, the side of a moving vehicle appears as static (high spa-tial overlap). Anyway, due to the previous labeling of L-shapedobjects, the bumper and the sides of the same vehicle belong tothe same object, which therefore inherits the moving label.
Obstacles that are represented by overlapping scans in thegiven time window are marked as static, even when the newerscan lines are longer and more accurate than the older scan lines(due to the vehicle getting closer to the obstacle).
When there is no correspondence between the current and theold polyline, the object is classified as a new obstacle.
Static obstacles are important to locate the areas of interestin which vision will search for pedestrians; changing-shapeobstacles are also of basic importance since they may contain apedestrian in a very precise region of their shape.
Authorized licensed use limited to: Yonsei University. Downloaded on December 2, 2009 at 22:10 from IEEE Xplore. Restrictions apply.

600 IEEE TRANSACTIONS ON INTELLIGENT TRANSPORTATION SYSTEMS, VOL. 10, NO. 4, DECEMBER 2009
Fig. 13. Obstacle classification. All possible classifications based on move-ment are shown. Note that moving polylines change their position in worldcoordinates.
To trace obstacles, the centroid of each polyline is computed.Centroids are used to simplify the computation: more complexlaser scanner data processing based on comparison betweeneach point of the polylines are presented in [11]. The distancesbetween the centroid of the last scan and the centroids ofprevious scans are computed and used for classification.
Polylines are labeled, considering all their points, asfollows:
1) fixed obstacle;2) moving obstacle;3) unknown obstacle.
A polyline is labeled as fixed if all the distances between itscurrent centroid and all the past centroids are below a threshold,whereas it is labeled as moving if the same distances increasewith time. Another check is made to detect fixed obstacles: Thethreshold is increased according to the distance to the vehicle(to compensate for a decreasing accuracy) and the time gap (topartly compensate for errors in ego-motion reconstruction). Apolyline is labeled as unknown if it can be labeled as neitherfixed nor moving; this may happen the first time an obstacleappears or when the detection is not stable due to bad reflectionsof the laser beam. To compensate for inaccurate results in laserdata processing, the five previous labels are also used; thepolyline is labeled with the most common label.
A result obtained with this classification is shown in Fig. 13,which also shows an estimation of the speed of the objectrepresented by the polyline.
Fig. 14. Highlighted zone represents the driving corridor.
G. Driving Corridor
Polylines labeled according to their shape, size, and historyrepresent a high-level and easy-to-use structure containing allthe information needed for the following steps of the algorithm.This information can be used to identify the environment (staticobstacles and vehicles) and the moving obstacles (pedestriansand vehicles). Obstacles identified as static by the secondclassification stage are used to define the environment structure.Fixed obstacles are used to build the driving corridor, i.e., thearea that may be reached by the vehicle in the near future, asshown in Fig. 14.
The driving corridor can be composed of multiple forks, butthe width of each subcorridor must be larger than the vehiclewidth; forks with a width narrower than this threshold arediscarded. It is important to note that the corridor does notalways overlap with the free space in front of the vehicle since itis built using only fixed obstacles and may also include movingobstacles.
H. Dangerous Areas and Possible Pedestrians
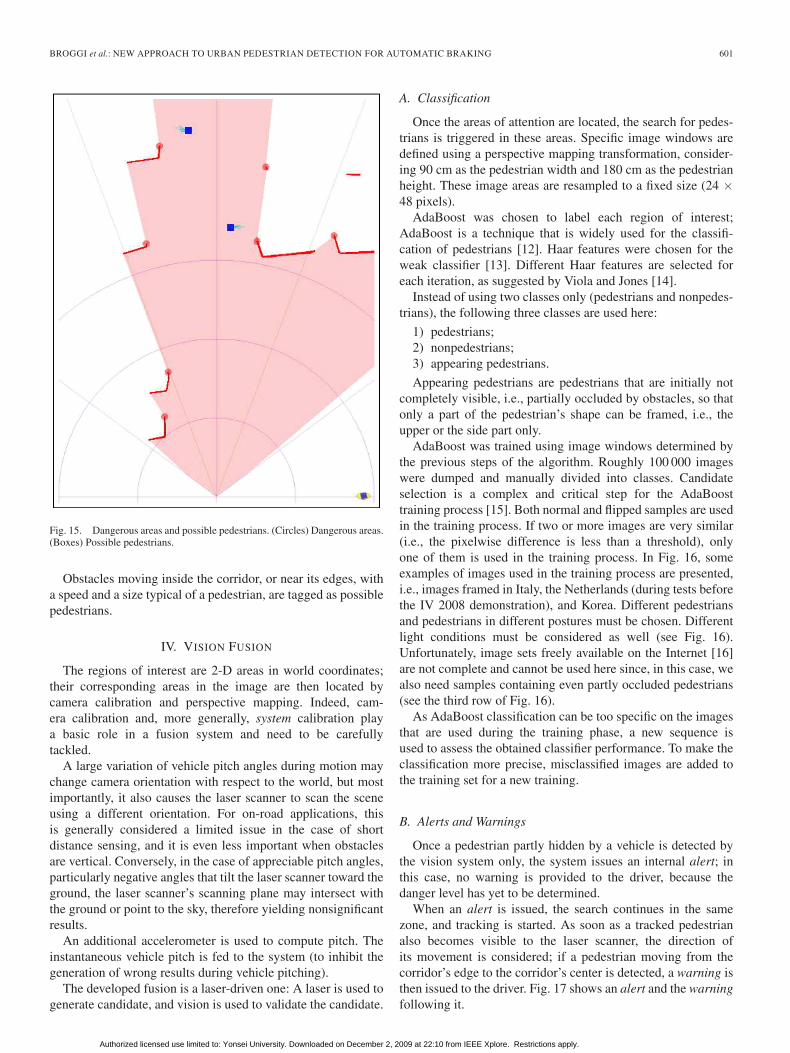
As already explained in the introduction, the algorithm isfocused on the detection of suddenly appearing pedestriansand on areas hidden by a static obstacle or between two staticobstacles. These areas are located along the corridor edges.Static obstacles that are used to build the corridor are also usedto identify dangerous areas, i.e., areas in which pedestrians mayappear. Dangerous areas are located behind the furthest point ofeach static polyline, as shown in Fig. 15.
Authorized licensed use limited to: Yonsei University. Downloaded on December 2, 2009 at 22:10 from IEEE Xplore. Restrictions apply.
BROGGI et al.: NEW APPROACH TO URBAN PEDESTRIAN DETECTION FOR AUTOMATIC BRAKING 601
Fig. 15. Dangerous areas and possible pedestrians. (Circles) Dangerous areas.(Boxes) Possible pedestrians.
Obstacles moving inside the corridor, or near its edges, witha speed and a size typical of a pedestrian, are tagged as possiblepedestrians.
IV. VISION FUSION
The regions of interest are 2-D areas in world coordinates;their corresponding areas in the image are then located bycamera calibration and perspective mapping. Indeed, cam-era calibration and, more generally, system calibration playa basic role in a fusion system and need to be carefullytackled.
A large variation of vehicle pitch angles during motion maychange camera orientation with respect to the world, but mostimportantly, it also causes the laser scanner to scan the sceneusing a different orientation. For on-road applications, thisis generally considered a limited issue in the case of shortdistance sensing, and it is even less important when obstaclesare vertical. Conversely, in the case of appreciable pitch angles,particularly negative angles that tilt the laser scanner toward theground, the laser scanner’s scanning plane may intersect withthe ground or point to the sky, therefore yielding nonsignificantresults.
An additional accelerometer is used to compute pitch. Theinstantaneous vehicle pitch is fed to the system (to inhibit thegeneration of wrong results during vehicle pitching).
The developed fusion is a laser-driven one: A laser is used togenerate candidate, and vision is used to validate the candidate.
A. Classification
Once the areas of attention are located, the search for pedes-trians is triggered in these areas. Specific image windows aredefined using a perspective mapping transformation, consider-ing 90 cm as the pedestrian width and 180 cm as the pedestrianheight. These image areas are resampled to a fixed size (24 ×48 pixels).
AdaBoost was chosen to label each region of interest;AdaBoost is a technique that is widely used for the classifi-cation of pedestrians [12]. Haar features were chosen for theweak classifier [13]. Different Haar features are selected foreach iteration, as suggested by Viola and Jones [14].
Instead of using two classes only (pedestrians and nonpedes-trians), the following three classes are used here:
1) pedestrians;2) nonpedestrians;3) appearing pedestrians.
Appearing pedestrians are pedestrians that are initially notcompletely visible, i.e., partially occluded by obstacles, so thatonly a part of the pedestrian’s shape can be framed, i.e., theupper or the side part only.
AdaBoost was trained using image windows determined bythe previous steps of the algorithm. Roughly 100 000 imageswere dumped and manually divided into classes. Candidateselection is a complex and critical step for the AdaBoosttraining process [15]. Both normal and flipped samples are usedin the training process. If two or more images are very similar(i.e., the pixelwise difference is less than a threshold), onlyone of them is used in the training process. In Fig. 16, someexamples of images used in the training process are presented,i.e., images framed in Italy, the Netherlands (during tests beforethe IV 2008 demonstration), and Korea. Different pedestriansand pedestrians in different postures must be chosen. Differentlight conditions must be considered as well (see Fig. 16).Unfortunately, image sets freely available on the Internet [16]are not complete and cannot be used here since, in this case, wealso need samples containing even partly occluded pedestrians(see the third row of Fig. 16).
As AdaBoost classification can be too specific on the imagesthat are used during the training phase, a new sequence isused to assess the obtained classifier performance. To make theclassification more precise, misclassified images are added tothe training set for a new training.
B. Alerts and Warnings
Once a pedestrian partly hidden by a vehicle is detected bythe vision system only, the system issues an internal alert; inthis case, no warning is provided to the driver, because thedanger level has yet to be determined.
When an alert is issued, the search continues in the samezone, and tracking is started. As soon as a tracked pedestrianalso becomes visible to the laser scanner, the direction ofits movement is considered; if a pedestrian moving from thecorridor’s edge to the corridor’s center is detected, a warning isthen issued to the driver. Fig. 17 shows an alert and the warningfollowing it.
Authorized licensed use limited to: Yonsei University. Downloaded on December 2, 2009 at 22:10 from IEEE Xplore. Restrictions apply.

602 IEEE TRANSACTIONS ON INTELLIGENT TRANSPORTATION SYSTEMS, VOL. 10, NO. 4, DECEMBER 2009
Fig. 16. Images used for training. (First row) Pedestrians. (Second row) Nonpedestrians. (Third row) Partly occluded pedestrians or, as defined in this paper,appearing pedestrians.
Fig. 17. Two subsequent frames of a sequence. (a) The system detects thepartly occluded pedestrian and issues an internal alert but no warning to thedriver. (b) When a detection of a fully visible pedestrian follows the internalalert, a warning is promptly sent to the driver.
It is of basic importance to note that the driver is warned onlywhen the pedestrian is completely visible, like in other systems.However, the system presented in this paper is more reactivethan others since the tracking starts when the pedestrian is onlypartially visible to one of the sensors; in an urban situationlike this, promptness is an important key to the success of thesystem.
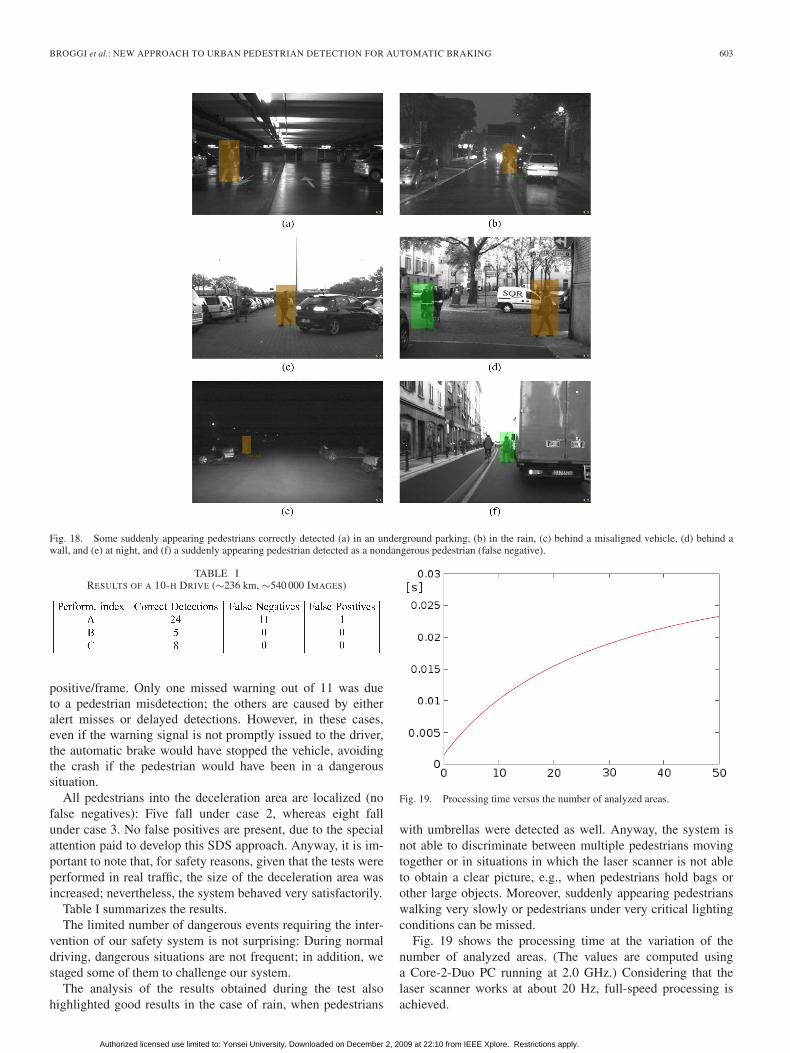
Fig. 18 shows some results obtained under complex condi-tions (bad weather condition, poor light condition, etc.) and a
misclassification, i.e., a suddenly appearing pedestrian detectedas a normal pedestrian.
V. RESULTS
Usually, performance assessment of pedestrian-detectionsystems provides the percentage of correctly localized pedes-trians and the false alarm rate. As this system is developedunder a new perspective, performance figures are provided asthe percentage of appearing pedestrians correctly identifiedand the false alarm rate. Indeed, it is not important to detectall the pedestrians present in the scene but only the dangerouspedestrians.
A set of sequences (different from that used for the training)was considered for extensive performance assessment, for atotal driving time of about 10 h in complex urban scenarios.An entire week was dedicated to the final test; a total of 236 kmwas driven during the day and at night, under different weatherconditions (sunny, cloudy, rain, and fog). Various scenarioswere included: downtown, large and narrow roads, undergroundcar parks, highways, and rural roads. During night tests, sce-narios with and without external illumination were acquired.To complete the test sets, some specific situations were staged(such as very dangerous pedestrian crossings), but a numberof dangerous scenarios were framed during normal drivinganyway.
In the tests, the following performance indexes wereconsidered:
1) number of pedestrians suddenly appearing in front of thevehicle (that must generate warnings to the driver);
2) number of pedestrians that appeared in front of the ve-hicle that have successfully been tracked and which canbe hit by the vehicle (that must trigger the automaticbrake);
3) number of fully visible pedestrians, which can be hit bythe vehicle (that must trigger the automatic brake).
For each performance index, the number of correct detec-tions, false positives, and false negatives were computed.
A total of 24 suddenly appearing pedestrians were correctlydetected in the tests (case 1). Only one false positive is present(due to a misclassification of a parked scooter).
Considering the actual camera frame rate of 15 frame/s andthe test duration, the false positive rate is about 2 × 10⁻⁶ false
Authorized licensed use limited to: Yonsei University. Downloaded on December 2, 2009 at 22:10 from IEEE Xplore. Restrictions apply.
BROGGI et al.: NEW APPROACH TO URBAN PEDESTRIAN DETECTION FOR AUTOMATIC BRAKING 603
Fig. 18. Some suddenly appearing pedestrians correctly detected (a) in an underground parking, (b) in the rain, (c) behind a misaligned vehicle, (d) behind awall, and (e) at night, and (f) a suddenly appearing pedestrian detected as a nondangerous pedestrian (false negative).
TABLE IRESULTS OF A 10-H DRIVE (∼236 km, ∼540 000 IMAGES)
positive/frame. Only one missed warning out of 11 was dueto a pedestrian misdetection; the others are caused by eitheralert misses or delayed detections. However, in these cases,even if the warning signal is not promptly issued to the driver,the automatic brake would have stopped the vehicle, avoidingthe crash if the pedestrian would have been in a dangeroussituation.
All pedestrians into the deceleration area are localized (nofalse negatives): Five fall under case 2, whereas eight fallunder case 3. No false positives are present, due to the specialattention paid to develop this SDS approach. Anyway, it is im-portant to note that, for safety reasons, given that the tests wereperformed in real traffic, the size of the deceleration area wasincreased; nevertheless, the system behaved very satisfactorily.
Table I summarizes the results.The limited number of dangerous events requiring the inter-
vention of our safety system is not surprising: During normaldriving, dangerous situations are not frequent; in addition, westaged some of them to challenge our system.
The analysis of the results obtained during the test alsohighlighted good results in the case of rain, when pedestrians
Fig. 19. Processing time versus the number of analyzed areas.
with umbrellas were detected as well. Anyway, the system isnot able to discriminate between multiple pedestrians movingtogether or in situations in which the laser scanner is not ableto obtain a clear picture, e.g., when pedestrians hold bags orother large objects. Moreover, suddenly appearing pedestrianswalking very slowly or pedestrians under very critical lightingconditions can be missed.
Fig. 19 shows the processing time at the variation of thenumber of analyzed areas. (The values are computed usinga Core-2-Duo PC running at 2.0 GHz.) Considering that thelaser scanner works at about 20 Hz, full-speed processing isachieved.
Authorized licensed use limited to: Yonsei University. Downloaded on December 2, 2009 at 22:10 from IEEE Xplore. Restrictions apply.

604 IEEE TRANSACTIONS ON INTELLIGENT TRANSPORTATION SYSTEMS, VOL. 10, NO. 4, DECEMBER 2009
TABLE IIMAIN STEPS OF THE ALGORITHM AND THE MAIN ADVANTAGES
OVER TRADITIONAL SYSTEMS
VI. CONCLUSION
This paper has presented a new scheme to increase safety andpossibly avoid collisions with vulnerable road users. Instead ofimplementing a generic pedestrian-detection system, followedby both a validation step and the assessment of the danger level,this work has proposed an innovative approach: Whenever aspecific environment structure is detected (i.e., stopped vehiclesthat may hide pedestrians), the possible presence of pedestriansis checked in specific areas only.
Not only does this solution approach the problem from adifferent perspective with respect to traditional implementa-tions, but it also focuses on a particularly critical environment,which is typical of urban accidents. In addition to directlyproviding detections of dangerous situations, it also booststiming performance since the computationally intensive part,i.e., vision-based pedestrian recognition, is performed only onlimited portions of the image.
The system was developed to tackle a very specific yet verycommon scenario, whereas it does not cover the many otherdangerous situations that may occur in an urban environment.The search for all the pedestrians present inside the so-calleddriving corridor can generalize the system yet maintain thescenario-driven approach, as the search is performed only ina corridor dynamically built using laser scanner data. As a con-clusion, Table II summarizes the main steps of this system andhighlights the specific advantages over traditional pedestrian-detection systems.
REFERENCES
[1] T. Gandhi and M. M. Trivedi, “Pedestrian protection systems: Issues,survey, and challenges,” IEEE Trans. Intell. Transp. Syst., vol. 8, no. 3,pp. 413–430, Sep. 2007.
[2] M. Szarvas, U. Sakai, and J. Ogata, “Real-time pedestrian detection usingLIDAR and convolutional neural networks,” in Proc. IEEE Intell. VehiclesSymp., Tokyo, Japan, Jun. 2006, pp. 213–218.
[3] S. Milch and M. Behrens, Pedestrian Detection With Radar andComputer Vision. [Online]. Available: http://www.smart-microwave-sensors.de/Pedestrian_Detection.pdf
[4] A. Broggi, A. Cappalunga, C. Caraffi, S. Cattani, S. Ghidoni, P. Grisleri,P. P. Porta, M. Posterli, P. Zani, and J. Beck, “The passive sensing suite ofthe TerraMax autonomous vehicle,” in Proc. IEEE Intell. Vehicles Symp.,Eindhoven, The Netherlands, Jun. 2008, pp. 769–774.
[5] C. Premebida, G. Monteiro, U. Nunes, and P. Peixoto, “A lidar and vision-based approach for pedestrian and vehicle detection and tracking,” in
Proc. IEEE Int. Conf. Intell. Transp. Syst., Seattle, WA, Sep./Oct. 2007,pp. 1044–1049.
[6] J. P. Hwang, S. E. Cho, K. J. Ryu, S. Park, and E. Kim, “Multi-classifierbased LIDAR and camera fusion,” in Proc. IEEE Int. Conf. Intell. Transp.Syst., Seattle, WA, Sep./Oct. 2007, pp. 467–472.
[7] U. Franke and S. Heinrich, “Fast obstacle detection for urban trafficsituations,” IEEE Trans. Intell. Transp. Syst., vol. 3, no. 3, pp. 173–181,Sep. 2002.
[8] C. Curio, J. Edelbrunner, T. Kalinke, C. Tzomakas, and W. von Seelen,“Walking pedestrian recognition,” IEEE Trans. Intell. Transp. Syst., vol. 1,no. 3, pp. 155–163, Sep. 2000.
[9] R. A. Retting, S. A. Ferguson, and A. T. McCartt, “A review of evidence-based traffic engineering measures designed to reduce pedestrian’s motorvehicle crashes,” Amer. J. Public Health, vol. 93, no. 9, pp. 1456–1463,Sep. 2003.
[10] P. F. Agran, D. G. Winn, C. L. Anderson, C. Tran, and C. P. Del Valle, “Therole of the physical and traffic environment in child pedestrian injuries,”Pediatrics, vol. 98, no. 6, pp. 1096–1103, Dec. 1996.
[11] A. Broggi, P. Cerri, S. Ghidoni, P. Grisleri, and H. G. Jung, “Localizationand analysis of critical areas in urban scenarios,” in Proc. IEEE Intell.Vehicles Symp., Eindhoven, The Netherlands, Jun. 2008, pp. 1074–1079.
[12] L. Leyrit, C. Chateau, C. Tournayre, and J.-T. Lapresté, “Association ofAdaBoost and kernel based machine learning methods for visual pedes-trian recognition,” in Proc. IEEE Intell. Vehicles Symp., Eindhoven, TheNetherlands, Jun. 2008, pp. 67–72.
[13] P. Geismann and G. Schneider, “A two-staged approach to vision-based pedestrian recognition using Haar and HOG features,” in Proc.IEEE Intell. Vehicles Symp., Eindhoven, The Netherlands, Jun. 2008,pp. 554–559.
[14] P. Viola and M. Jones, “Rapid object detection using a boosted cascadeof simple features,” in Proc. Int. Conf. Comput. Vis. Pattern Recog.,Dec. 2001, vol. 1, pp. 511–518.
[15] G. M. Overett, L. Petersson, N. Brewer, L. Andersson, and N. Pettersson,“A new pedestrian dataset for supervised learning,” in Proc. IEEE Intell.Vehicles Symp., Eindhoven, The Netherlands, Jun. 2008, pp. 373–378.
[16] INRIA, INRIA Person Dataset2005. [Online]. Available: http://pascal.inrialpes.fr/data/human
Alberto Broggi (SM’89–S’93–A’96–SM’06) re-ceived the Dr.Eng. degree in electronic engineeringand the Ph.D. degree in information technology fromthe Università di Parma, Parma, Italy, in 1990 and1994, respectively.
He is currently a Full Professor of computer sci-ence with the Università di Parma, where he wasan Associate Researcher with the Dipartimento diIngegneria dell’Informazione from 1994 to 1998 andan Associate Professor of artificial intelligence withthe Dipartimento di Informatica e Sistemistica from
1998 to 2001. He is the President and Chief Executive Officer of the ArtificialVision and Intelligent Systems Laboratory (VisLab), which is a spin-off com-pany of the Università di Parma, working in the field of signal processing forvehicular applications. He has authored more than 150 refereed publicationsin international journals, book chapters, and conference proceedings and hasdelivered invited talks at many international conferences. His research interestsinclude real-time computer vision approaches for the navigation of unmannedvehicles and the development of low-cost computer systems to be used inautonomous agents.
Dr. Broggi was the Editor-in-Chief of the IEEE TRANSACTIONS ONINTELLIGENT TRANSPORTATION SYSTEMS from 2004 to 2008. He is amember of the IEEE Intelligent Transportation Systems Society ExecutiveCommittee as President Elect, becoming President for the term 2010–2011.
Pietro Cerri (S’05–M’07) received the Dr.Eng. de-gree in computer engineering from the Universitàdi Pavia, Pavia, Italy, in 2003 and the Ph.D. degreein information technologies from the Università diParma, Parma, Italy, in 2007.
In 2003, he received a research grant from theAssociazione Tecnica dell’Automobile, Italy. He iscurrently a Temporary Researcher with the ArtificialVision and Intelligent System Laboratory (VisLab),Dipartimento di Ingegneria dell’Informazione, Uni-versità di Parma. His research interests are computer
vision and sensor fusion approaches for the development of advanced driver-assistance systems.
Authorized licensed use limited to: Yonsei University. Downloaded on December 2, 2009 at 22:10 from IEEE Xplore. Restrictions apply.

BROGGI et al.: NEW APPROACH TO URBAN PEDESTRIAN DETECTION FOR AUTOMATIC BRAKING 605
Stefano Ghidoni (S’04–M’09) ) received the M.S.degree in telecommunication engineering and thePh.D. degree in information technology from theUniversità di Parma, Parma, Italy, in 2004 and 2008,respectively.
During 2004–2007, he worked on artificial visionapplied to the automotive field as a Ph.D. studentwith the Artificial Vision and Intelligent SystemsLaboratory (VisLab), Università di Parma. From2008 to 2009, he worked in the artificial intelligencefield at Henesis s.r.l., Parma, which is a spin-off
company of the Scuola Superiore S. Anna di Pisa, Pisa, Italy. In March 2009,he joined the Intelligent Autonomous Systems Laboratory, University of Padua,Padua, Italy, as a Temporary Researcher, where he is currently working onintelligent video-surveillance systems and camera networks.
Paolo Grisleri (S’03–M’09) received the Dr.Eng.degree in electronic engineering and the Ph.D.degree in information technology from the Uni-versità di Parma, Parma, Italy, in 2002 and 2006,respectively.
He was a Temporary Researcher with the ArtificialVision and Intelligent System Laboratory (VisLab),Dipartimento di Ingegneria dell’Informazione,Università di Parma. He is responsible for softwaretechnologies of VisLab, which is a spin-off companyof the Università di Parma, working in the field of
signal processing for vehicular applications. His research interests includecomputer vision and software engineering applied to autonomous vehicles.
Ho Gi Jung (M’05) received the B.S., M.S., andPh.D. degrees in electronic engineering from YonseiUniversity, Seoul, Korea, in 1995, 1997, and 2008,respectively.
From 1997 to April 2009, he was with theMANDO Corporation Global R&D Headquarters,Yongin, Korea. From 1997 to 2000, he devel-oped environment-recognition algorithms for lane-departure warning systems and adaptive cruisecontrol. From 2000 to 2004, he developed an elec-tronic control unit and embedded software for an
electrohydraulic braking system. Since 2003, he has developed environment-recognition algorithms for intelligent parking-assist systems, collision warningand avoidance, and an active pedestrian-protection system. Since May 2009,he has been with Yonsei University as a Senior Research Engineer. Hisresearch interests are automotive vision, driver-assistance systems, active safetyvehicles, and intelligent surveillance.
Dr. Jung is a member of the International Society of Automotive Engineer-ing; The International Society for Optical Engineers, which is an internationalsociety advancing an interdisciplinary approach to the science and applicationof light; the Institute of Electronics Engineers of Korea; and the Korean Societyof Automotive Engineering.
Authorized licensed use limited to: Yonsei University. Downloaded on December 2, 2009 at 22:10 from IEEE Xplore. Restrictions apply.