a new financial reality - the pew charitable...
TRANSCRIPT

A report from Sept 2014
A New Financial RealityThe balance sheets and economic mobility of Generation X
The Pew Charitable TrustsSusan K. Urahn, executive vice president Travis Plunkett, senior director
Project teamErin Currier Joanna Biernacka-Lievestro Diana Elliott Sheida Elmi
External reviewerThe report benefited from the insights and expertise of Bhashkar Mazumder, senior economist and research adviser in the Economic Research Department of the Federal Reserve Bank of Chicago and executive director of the Chicago Census Research Data Center, who commented on an earlier draft. Neither he nor his organization necessarily endorses its conclusions.
Acknowledgments The financial security and mobility team thanks Pew staff members Daniel Berger, Mark Wolff, Andrea Risotto, and David Merchant for providing valuable feedback on the report. We also thank Dan Benderly, Jennifer V. Doctors, Sara Flood, Bernard Ohanian, Lisa Plotkin, and Jennifer Peltak for their thoughtful suggestions and production assistance. Many thanks also to other current and former colleagues who made this work possible.
Contact: Mark Wolff, communications director Email: [email protected] Project website: pewtrusts.org/mobility
The Pew Charitable Trusts is driven by the power of knowledge to solve today’s most challenging problems. Pew applies a rigorous, analytical approach to improve public policy, inform the public, and stimulate civic life.
For additional information, please visit: pewtrusts.org/mobility
Cover photos: 1. Getty Images/iStockphoto 2. Getty Images 3. Getty Images
Clinton Key Walter Lake Sarah Sattelmeyer
1
2
3
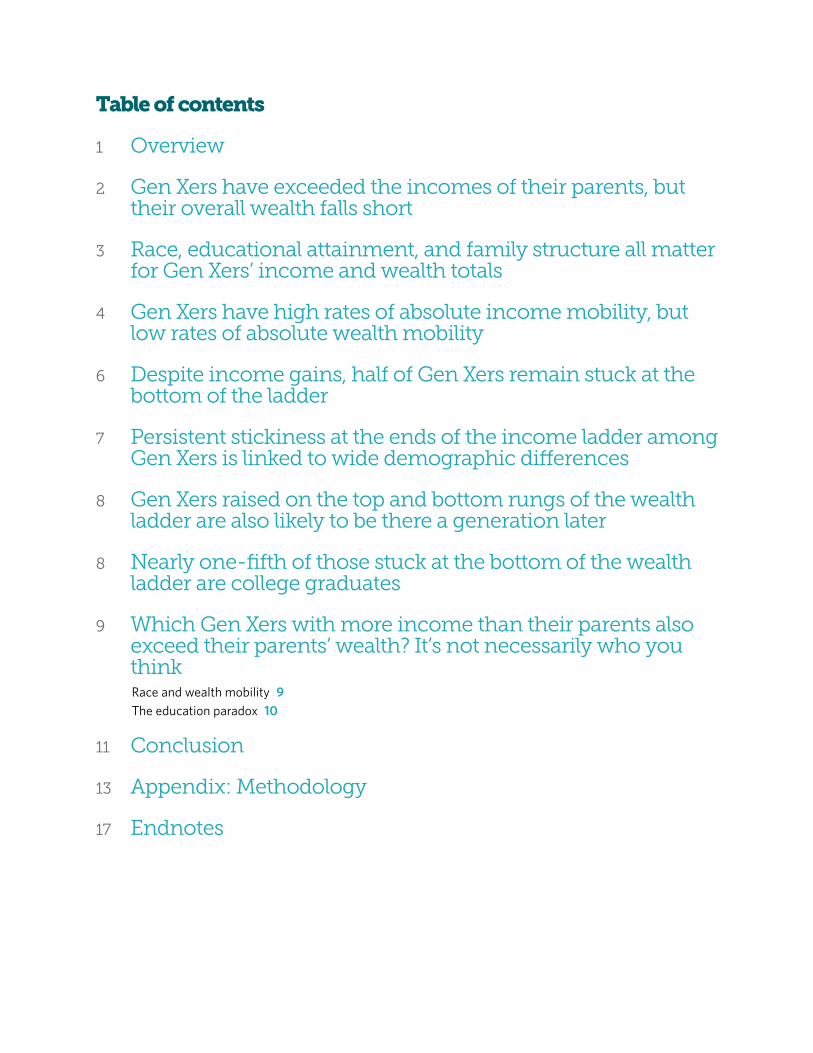
Table of contents
1 Overview
2 Gen Xers have exceeded the incomes of their parents, but their overall wealth falls short
3 Race, educational attainment, and family structure all matter for Gen Xers’ income and wealth totals
4 Gen Xers have high rates of absolute income mobility, but low rates of absolute wealth mobility
6 Despite income gains, half of Gen Xers remain stuck at the bottom of the ladder
7 Persistent stickiness at the ends of the income ladder among Gen Xers is linked to wide demographic differences
8 Gen Xers raised on the top and bottom rungs of the wealth ladder are also likely to be there a generation later
8 Nearly one-fifth of those stuck at the bottom of the wealth ladder are college graduates
9 Which Gen Xers with more income than their parents also exceed their parents’ wealth? It’s not necessarily who you thinkRace and wealth mobility 9The education paradox 10
11 Conclusion
13 Appendix: Methodology
17 Endnotes
1
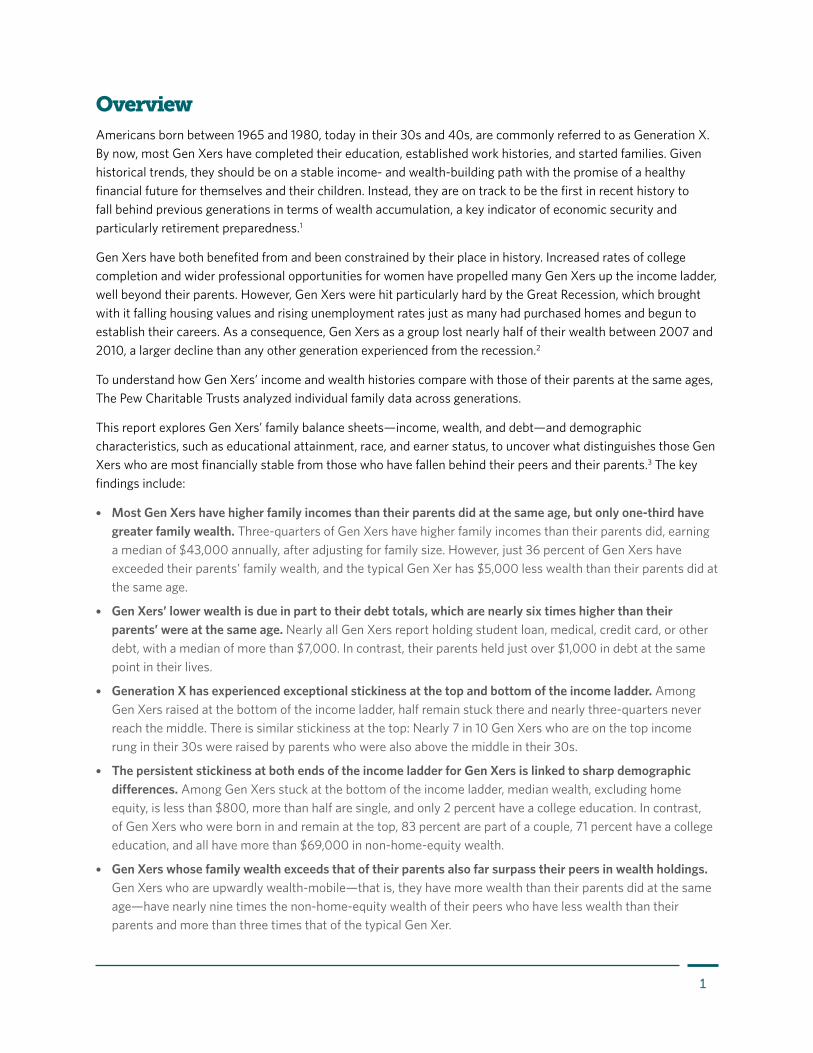
OverviewAmericans born between 1965 and 1980, today in their 30s and 40s, are commonly referred to as Generation X. By now, most Gen Xers have completed their education, established work histories, and started families. Given historical trends, they should be on a stable income- and wealth-building path with the promise of a healthy financial future for themselves and their children. Instead, they are on track to be the first in recent history to fall behind previous generations in terms of wealth accumulation, a key indicator of economic security and particularly retirement preparedness.1
Gen Xers have both benefited from and been constrained by their place in history. Increased rates of college completion and wider professional opportunities for women have propelled many Gen Xers up the income ladder, well beyond their parents. However, Gen Xers were hit particularly hard by the Great Recession, which brought with it falling housing values and rising unemployment rates just as many had purchased homes and begun to establish their careers. As a consequence, Gen Xers as a group lost nearly half of their wealth between 2007 and 2010, a larger decline than any other generation experienced from the recession.2
To understand how Gen Xers’ income and wealth histories compare with those of their parents at the same ages, The Pew Charitable Trusts analyzed individual family data across generations.
This report explores Gen Xers’ family balance sheets—income, wealth, and debt—and demographic characteristics, such as educational attainment, race, and earner status, to uncover what distinguishes those Gen Xers who are most financially stable from those who have fallen behind their peers and their parents.3 The key findings include:
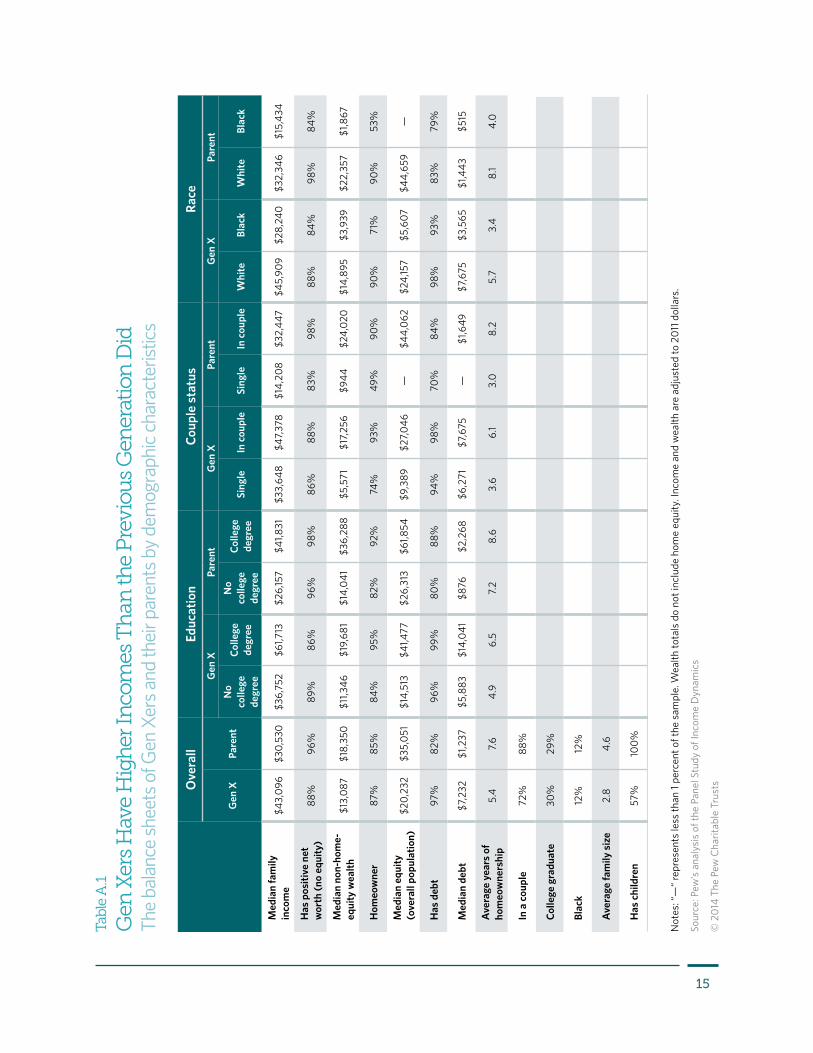
• Most Gen Xers have higher family incomes than their parents did at the same age, but only one-third have greater family wealth. Three-quarters of Gen Xers have higher family incomes than their parents did, earning a median of $43,000 annually, after adjusting for family size. However, just 36 percent of Gen Xers have exceeded their parents’ family wealth, and the typical Gen Xer has $5,000 less wealth than their parents did at the same age.
• Gen Xers’ lower wealth is due in part to their debt totals, which are nearly six times higher than their parents’ were at the same age. Nearly all Gen Xers report holding student loan, medical, credit card, or other debt, with a median of more than $7,000. In contrast, their parents held just over $1,000 in debt at the same point in their lives.
• Generation X has experienced exceptional stickiness at the top and bottom of the income ladder. Among Gen Xers raised at the bottom of the income ladder, half remain stuck there and nearly three-quarters never reach the middle. There is similar stickiness at the top: Nearly 7 in 10 Gen Xers who are on the top income rung in their 30s were raised by parents who were also above the middle in their 30s.
• The persistent stickiness at both ends of the income ladder for Gen Xers is linked to sharp demographic differences. Among Gen Xers stuck at the bottom of the income ladder, median wealth, excluding home equity, is less than $800, more than half are single, and only 2 percent have a college education. In contrast, of Gen Xers who were born in and remain at the top, 83 percent are part of a couple, 71 percent have a college education, and all have more than $69,000 in non-home-equity wealth.
• Gen Xers whose family wealth exceeds that of their parents also far surpass their peers in wealth holdings. Gen Xers who are upwardly wealth-mobile—that is, they have more wealth than their parents did at the same age—have nearly nine times the non-home-equity wealth of their peers who have less wealth than their parents and more than three times that of the typical Gen Xer.
2
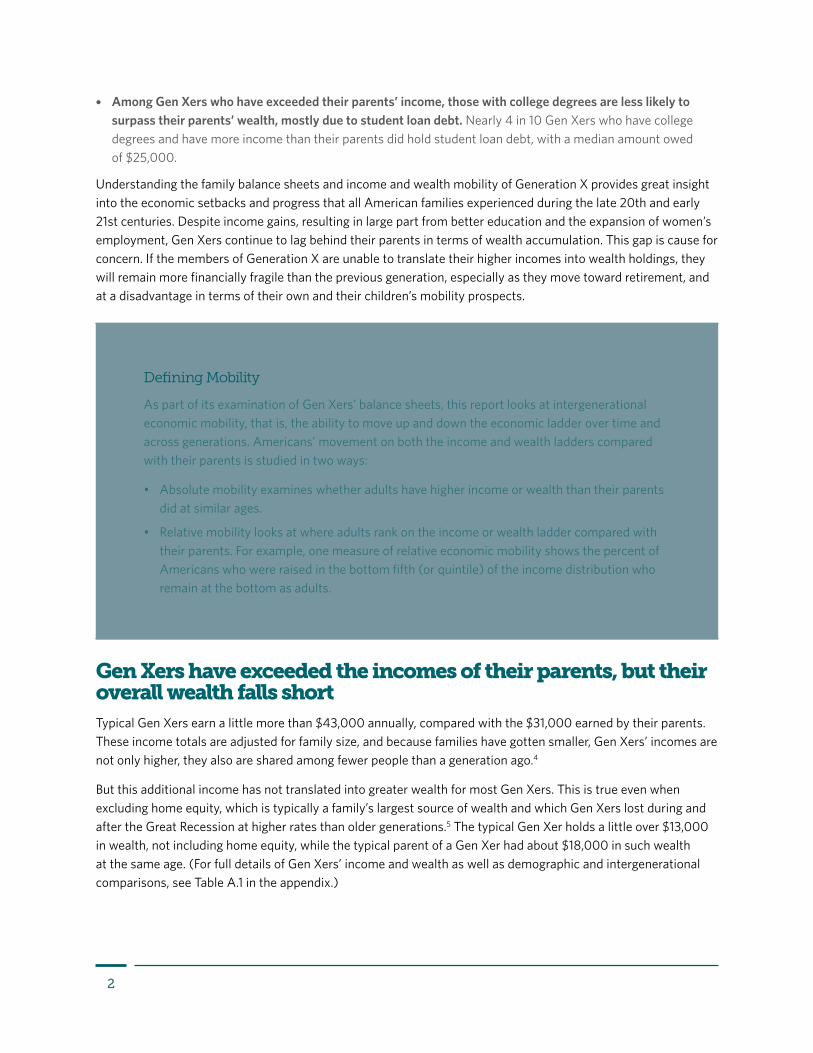
• Among Gen Xers who have exceeded their parents’ income, those with college degrees are less likely to surpass their parents’ wealth, mostly due to student loan debt. Nearly 4 in 10 Gen Xers who have college degrees and have more income than their parents did hold student loan debt, with a median amount owed of $25,000.
Understanding the family balance sheets and income and wealth mobility of Generation X provides great insight into the economic setbacks and progress that all American families experienced during the late 20th and early 21st centuries. Despite income gains, resulting in large part from better education and the expansion of women’s employment, Gen Xers continue to lag behind their parents in terms of wealth accumulation. This gap is cause for concern. If the members of Generation X are unable to translate their higher incomes into wealth holdings, they will remain more financially fragile than the previous generation, especially as they move toward retirement, and at a disadvantage in terms of their own and their children’s mobility prospects.
Gen Xers have exceeded the incomes of their parents, but their overall wealth falls shortTypical Gen Xers earn a little more than $43,000 annually, compared with the $31,000 earned by their parents. These income totals are adjusted for family size, and because families have gotten smaller, Gen Xers’ incomes are not only higher, they also are shared among fewer people than a generation ago.4
But this additional income has not translated into greater wealth for most Gen Xers. This is true even when excluding home equity, which is typically a family’s largest source of wealth and which Gen Xers lost during and after the Great Recession at higher rates than older generations.5 The typical Gen Xer holds a little over $13,000 in wealth, not including home equity, while the typical parent of a Gen Xer had about $18,000 in such wealth at the same age. (For full details of Gen Xers’ income and wealth as well as demographic and intergenerational comparisons, see Table A.1 in the appendix.)
Defining Mobility
As part of its examination of Gen Xers’ balance sheets, this report looks at intergenerational economic mobility, that is, the ability to move up and down the economic ladder over time and across generations. Americans’ movement on both the income and wealth ladders compared with their parents is studied in two ways:
• Absolute mobility examines whether adults have higher income or wealth than their parents did at similar ages.
• Relative mobility looks at where adults rank on the income or wealth ladder compared with their parents. For example, one measure of relative economic mobility shows the percent of Americans who were raised in the bottom fifth (or quintile) of the income distribution who remain at the bottom as adults.
3
In part, the wealth declines are a function of increased debt accumulation, which encompasses both the likelihood of having debt and the amount owed. Nearly all Gen Xers (97 percent) reported holding some form of student loan, medical, credit card, or other debt, but just 82 percent of their parents said the same. Further, among those who have debt, Gen Xers owe nearly six times as much as their parents did: $7,232 compared with $1,237.
Wealth and Home Equity
Home equity is a significant part of families’ overall balance sheets, and as such, is included in the wealth totals discussed in most of the analyses in this report.
In select sections of this paper, however, home equity is separated from other components of wealth for one of two reasons:
1. To understand home equity in comparison with all other forms of wealth.
2. To improve comparisons of wealth between populations with notable differences in homeownership. This approach is particularly useful when considering families at the bottom of the wealth ladder.
Home equity is included in wealth totals except where “non-home-equity wealth” is specified.
Race, educational attainment, and family structure all matter for Gen Xers’ income and wealth totalsCollege-educated, partnered, or white Gen Xers typically have higher income and wealth totals than do their counterparts who have less education, are single, or are black. Those with a college degree have $25,000 a year more in family income, $9,000 more in non-home-equity wealth, and $26,000 more in home equity than do their noncollege-educated peers. Gen Xers who are part of a couple have $13,000 more income and three times both the non-home-equity wealth and home equity of their single peers. Typical white Gen Xers have about $17,000 more in family income and hold over four times both the non-home-equity wealth and home equity of typical black Gen Xers, underscoring persistent racial wealth gaps.6 (See Table A.1 in the appendix.)
However, comparing Generation X with similar families in the previous generation reveals again that although Gen Xers have surpassed their parents’ income, they lag in wealth. (See Figure 1.) This is true across the demographic groups studied; however, when looking at racial groups, it is important to note that while black Gen Xers have higher wealth than their parents, the typical black family in both generations had substantially lower levels of wealth compared with white families.

4
Figure 1
Gen Xers’ Incomes Are Well Above the Last Generation, but Their Wealth LagsMedian income and non-home-equity wealth differences between Gen Xers and their parents’ generation, in 2011 dollars
Non-home-equity wealth
Income
-$20,000
$20,000
-$15,000
$15,000
-$10,000
$10,000
-$5,000
$5,000
$0
College degree In a couple White Black
$19,882
$14,931$13,563 $12,806
-$16,607
-$6,764 -$7,462
$2,072
Note: Wealth totals do not include home equity. Income and wealth are adjusted to 2011 dollars.
Source: Pew’s analysis of the Panel Study of Income Dynamics
© 2014 The Pew Charitable Trusts
Gen Xers have high rates of absolute income mobility, but low rates of absolute wealth mobilityThe income and wealth of actual child-parent pairs mirror the overall intergenerational trends of greater income but less wealth among Gen Xers. Overall, three-quarters of Gen Xers have exceeded their own parents’ family income at the same ages. This is especially true for those raised at the middle and lower rungs of the income ladder, where majorities have higher incomes than did the last generation. (See Figure 2.)
Looking at absolute wealth mobility among parent-child pairs reveals a less rosy picture of change over time. Just over one-third of Gen Xers have more wealth, including home equity, than their parents did, but when looking at where on the wealth ladder Gen Xers were raised, the wealth outcomes differ significantly. Among those raised at the bottom, two-thirds exceed the wealth and home equity of their own parents, but fewer than 3 in 10 of those raised at the middle and higher rungs have more assets than their parents held at the same age.

5
Figure 2
Most Gen Xers Have More Income Than Their Own Parents Did, but Far Fewer Have More WealthPercent of Gen Xers with higher family incomes and wealth than their parents, by parents’ quintile
Notes: Wealth totals include home equity. Income and wealth are adjusted to 2011 dollars.
Source: Pew’s analysis of the Panel Study of Income Dynamics
© 2014 The Pew Charitable Trusts
0% 20% 40% 60% 80% 100%
Bottom 86%
69%
2nd quintile 82%
43%
Middle 79%
30%
4th quintile 72%
24%
Top 55%
11%
Overall 75%
36%
WealthIncome
Gen Xers Who Exceed Their Parents’ Family Wealth Also Far Surpass Their Peers in Wealth Holdings
There are few demographic differences between those Gen Xers who do and do not exceed their parents’ family wealth, with one notable exception: Those who have exceeded their parents’ wealth have nearly nine times the non-home-equity wealth of their peers who experienced downward wealth mobility and more than three times the non-home-equity wealth of the typical Gen Xer. Upwardly wealth-mobile Gen Xers also have greater home equity than do their peers, which further strengthens their already more robust balance sheets.
6
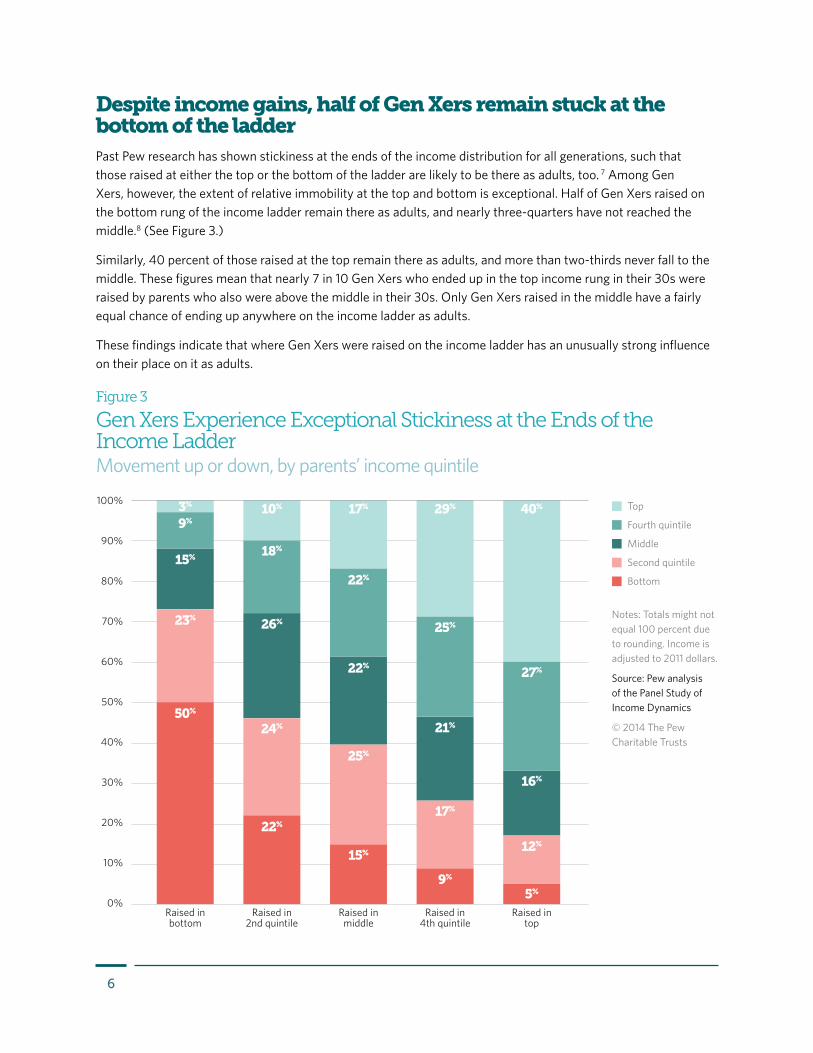
Despite income gains, half of Gen Xers remain stuck at the bottom of the ladderPast Pew research has shown stickiness at the ends of the income distribution for all generations, such that those raised at either the top or the bottom of the ladder are likely to be there as adults, too. 7 Among Gen Xers, however, the extent of relative immobility at the top and bottom is exceptional. Half of Gen Xers raised on the bottom rung of the income ladder remain there as adults, and nearly three-quarters have not reached the middle.8 (See Figure 3.)
Similarly, 40 percent of those raised at the top remain there as adults, and more than two-thirds never fall to the middle. These figures mean that nearly 7 in 10 Gen Xers who ended up in the top income rung in their 30s were raised by parents who also were above the middle in their 30s. Only Gen Xers raised in the middle have a fairly equal chance of ending up anywhere on the income ladder as adults.
These findings indicate that where Gen Xers were raised on the income ladder has an unusually strong influence on their place on it as adults.
Raised inbottom
Raised in2nd quintile
Raised inmiddle
Raised in4th quintile
Raised intop
0%
10%
20%
30%
40%
50%
60%
70%
90%
80%
100% Top
Fourth quintile
Second quintile
Bottom
Middle
9%
15%
23%
50%
22%
24%
26%
18%
10% 17% 29% 40%
27%
16%
12%
25%
21%
17%
9%
22%
22%
25%
15%
5%
3%
Figure 3
Gen Xers Experience Exceptional Stickiness at the Ends of the Income LadderMovement up or down, by parents’ income quintile
Notes: Totals might not equal 100 percent due to rounding. Income is adjusted to 2011 dollars.
Source: Pew analysis of the Panel Study of Income Dynamics
© 2014 The Pew Charitable Trusts
7
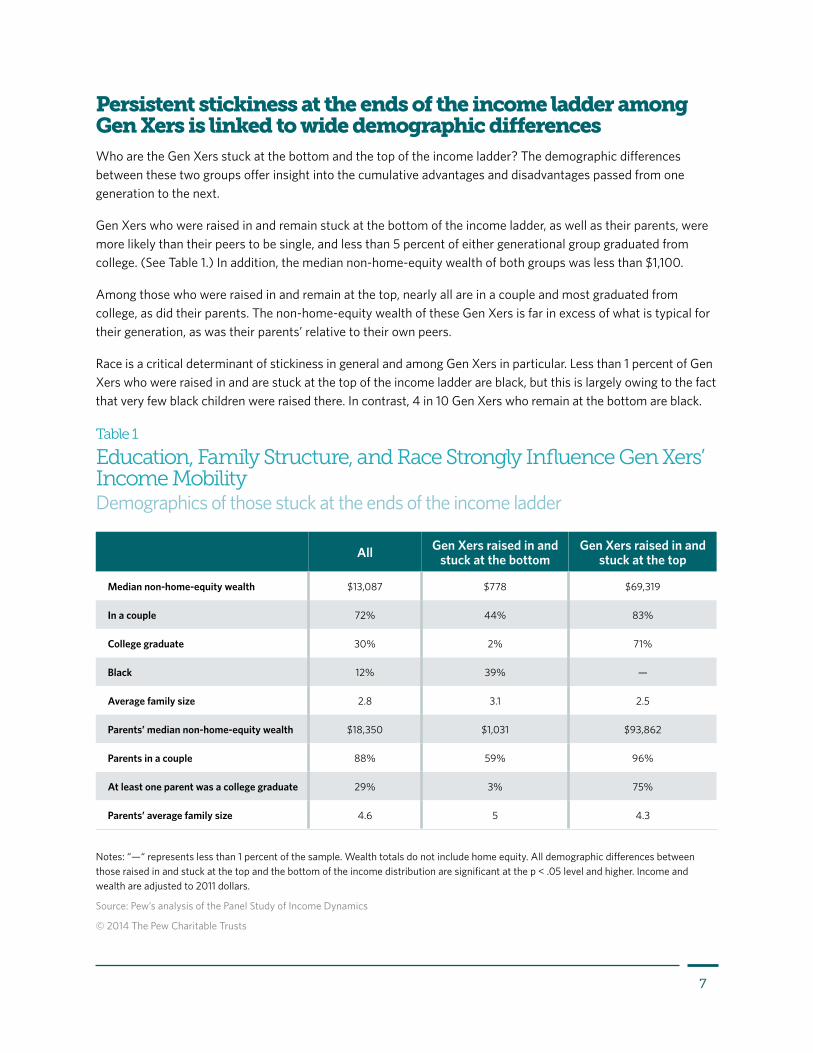
Persistent stickiness at the ends of the income ladder among Gen Xers is linked to wide demographic differencesWho are the Gen Xers stuck at the bottom and the top of the income ladder? The demographic differences between these two groups offer insight into the cumulative advantages and disadvantages passed from one generation to the next.
Gen Xers who were raised in and remain stuck at the bottom of the income ladder, as well as their parents, were more likely than their peers to be single, and less than 5 percent of either generational group graduated from college. (See Table 1.) In addition, the median non-home-equity wealth of both groups was less than $1,100.
Among those who were raised in and remain at the top, nearly all are in a couple and most graduated from college, as did their parents. The non-home-equity wealth of these Gen Xers is far in excess of what is typical for their generation, as was their parents’ relative to their own peers.
Race is a critical determinant of stickiness in general and among Gen Xers in particular. Less than 1 percent of Gen Xers who were raised in and are stuck at the top of the income ladder are black, but this is largely owing to the fact that very few black children were raised there. In contrast, 4 in 10 Gen Xers who remain at the bottom are black.
Table 1
Education, Family Structure, and Race Strongly Influence Gen Xers’ Income MobilityDemographics of those stuck at the ends of the income ladder
Notes: “—“ represents less than 1 percent of the sample. Wealth totals do not include home equity. All demographic differences between those raised in and stuck at the top and the bottom of the income distribution are significant at the p < .05 level and higher. Income and wealth are adjusted to 2011 dollars.
Source: Pew’s analysis of the Panel Study of Income Dynamics
© 2014 The Pew Charitable Trusts
All Gen Xers raised in and stuck at the bottom
Gen Xers raised in and stuck at the top
Median non-home-equity wealth $13,087 $778 $69,319
In a couple 72% 44% 83%
College graduate 30% 2% 71%
Black 12% 39% —
Average family size 2.8 3.1 2.5
Parents’ median non-home-equity wealth $18,350 $1,031 $93,862
Parents in a couple 88% 59% 96%
At least one parent was a college graduate 29% 3% 75%
Parents’ average family size 4.6 5 4.3
8
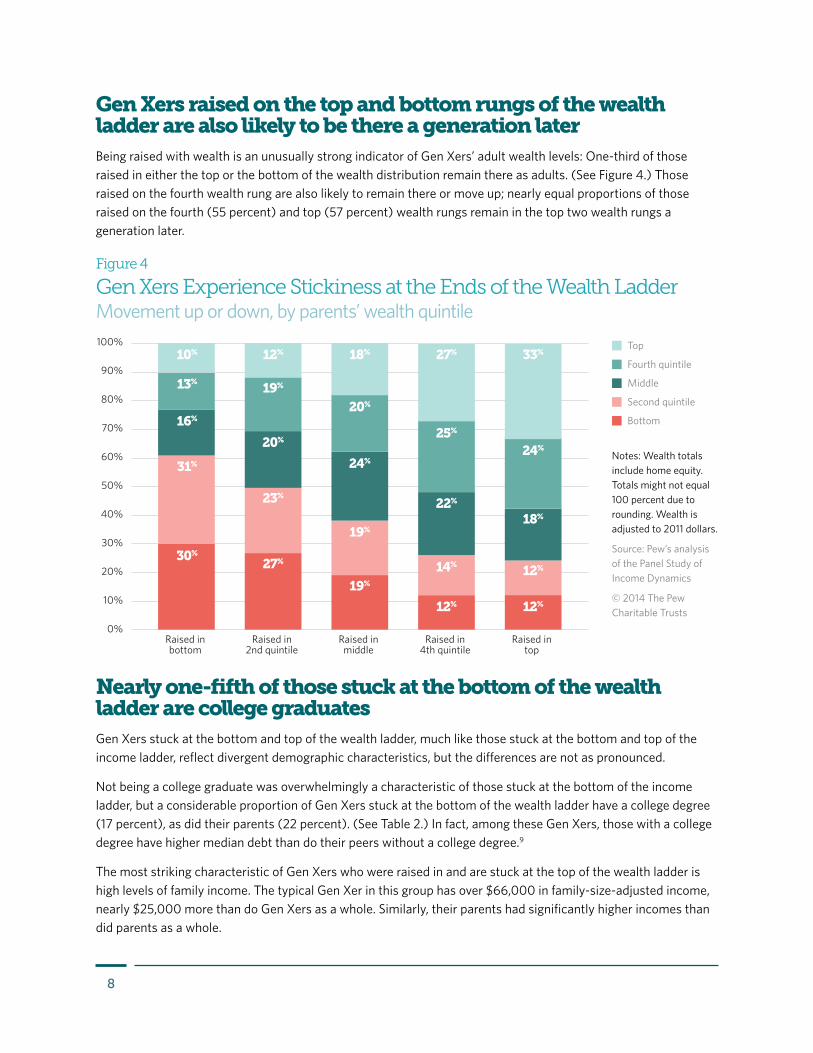
Gen Xers raised on the top and bottom rungs of the wealth ladder are also likely to be there a generation laterBeing raised with wealth is an unusually strong indicator of Gen Xers’ adult wealth levels: One-third of those raised in either the top or the bottom of the wealth distribution remain there as adults. (See Figure 4.) Those raised on the fourth wealth rung are also likely to remain there or move up; nearly equal proportions of those raised on the fourth (55 percent) and top (57 percent) wealth rungs remain in the top two wealth rungs a generation later.
Nearly one-fifth of those stuck at the bottom of the wealth ladder are college graduatesGen Xers stuck at the bottom and top of the wealth ladder, much like those stuck at the bottom and top of the income ladder, reflect divergent demographic characteristics, but the differences are not as pronounced.
Not being a college graduate was overwhelmingly a characteristic of those stuck at the bottom of the income ladder, but a considerable proportion of Gen Xers stuck at the bottom of the wealth ladder have a college degree (17 percent), as did their parents (22 percent). (See Table 2.) In fact, among these Gen Xers, those with a college degree have higher median debt than do their peers without a college degree.9
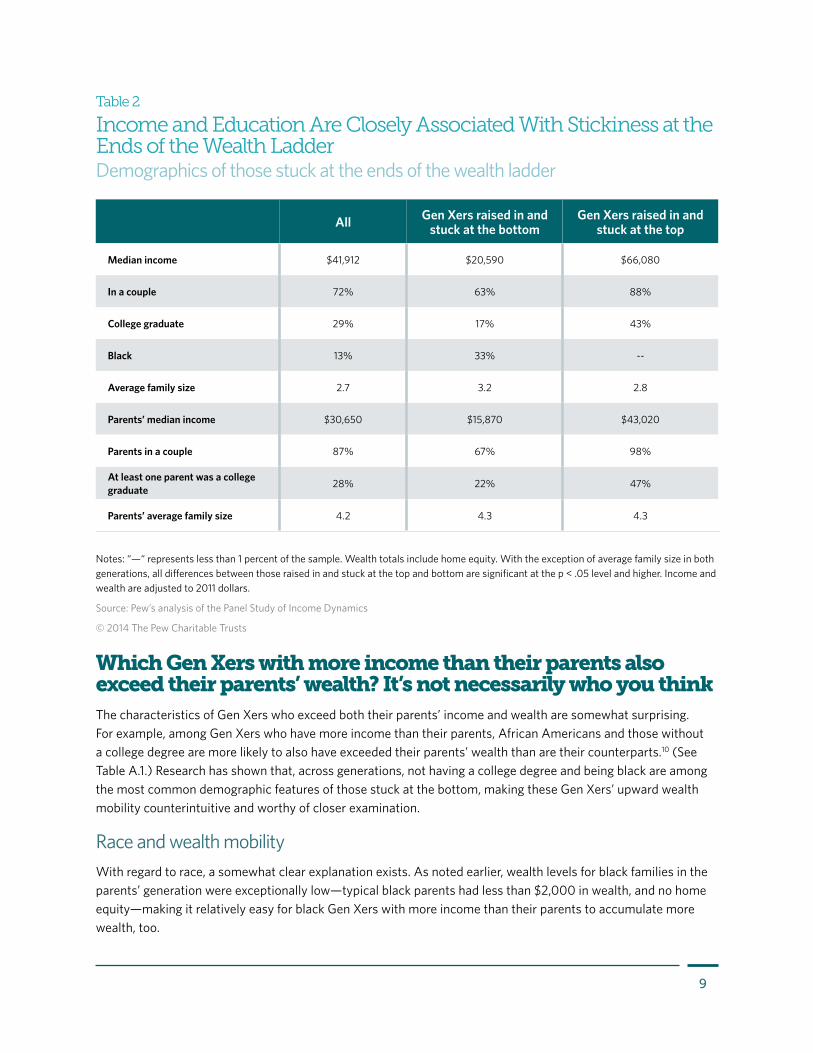
The most striking characteristic of Gen Xers who were raised in and are stuck at the top of the wealth ladder is high levels of family income. The typical Gen Xer in this group has over $66,000 in family-size-adjusted income, nearly $25,000 more than do Gen Xers as a whole. Similarly, their parents had significantly higher incomes than did parents as a whole.
Raised inbottom
Raised in2nd quintile
Raised inmiddle
Raised in4th quintile
Raised intop
0%
10%
20%
30%
40%
50%
60%
70%
90%
80%
100% Top
Fourth quintile
Second quintile
Bottom
Middle
10%
13%
16%
31%
30%
27%
23%
20%
19%
12% 18% 27% 33%
24%
18%
12%
25%
22%
14%
12%
20%
24%
19%
19%
12%
Figure 4
Gen Xers Experience Stickiness at the Ends of the Wealth LadderMovement up or down, by parents’ wealth quintile
Notes: Wealth totals include home equity. Totals might not equal 100 percent due to rounding. Wealth is adjusted to 2011 dollars.
Source: Pew’s analysis of the Panel Study of Income Dynamics
© 2014 The Pew Charitable Trusts
9
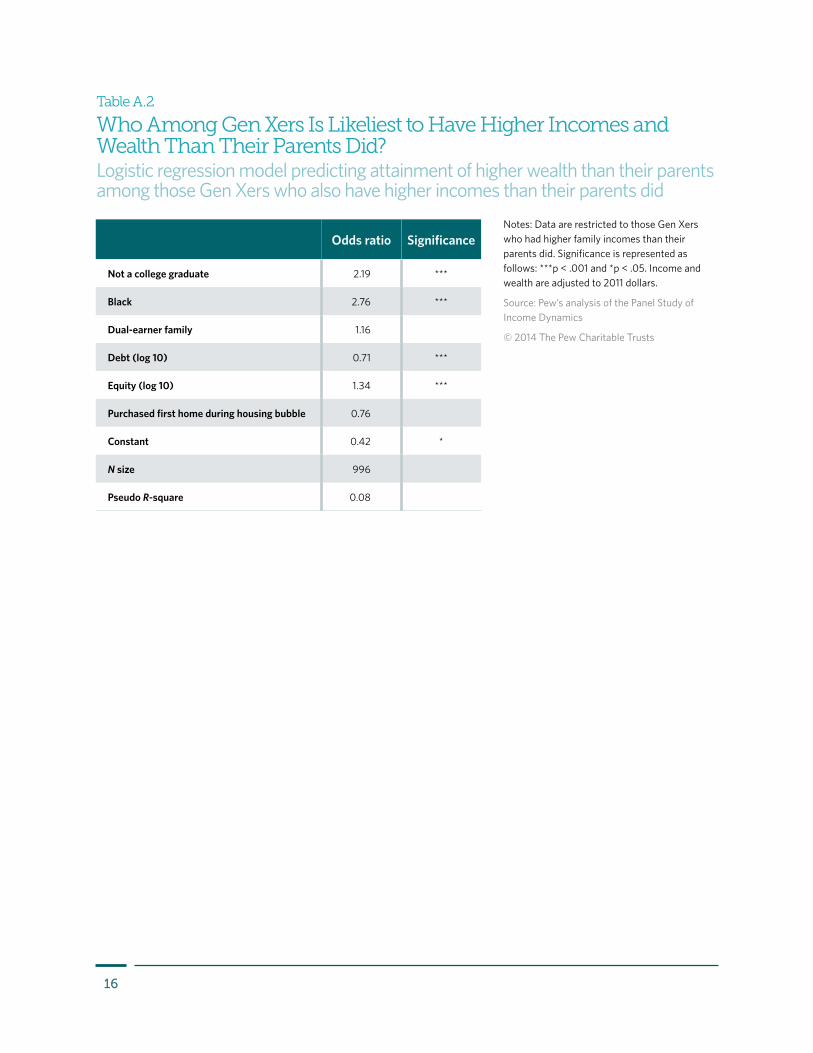
Which Gen Xers with more income than their parents also exceed their parents’ wealth? It’s not necessarily who you thinkThe characteristics of Gen Xers who exceed both their parents’ income and wealth are somewhat surprising. For example, among Gen Xers who have more income than their parents, African Americans and those without a college degree are more likely to also have exceeded their parents’ wealth than are their counterparts.10 (See Table A.1.) Research has shown that, across generations, not having a college degree and being black are among the most common demographic features of those stuck at the bottom, making these Gen Xers’ upward wealth mobility counterintuitive and worthy of closer examination.
Race and wealth mobilityWith regard to race, a somewhat clear explanation exists. As noted earlier, wealth levels for black families in the parents’ generation were exceptionally low—typical black parents had less than $2,000 in wealth, and no home equity—making it relatively easy for black Gen Xers with more income than their parents to accumulate more wealth, too.
Table 2
Income and Education Are Closely Associated With Stickiness at the Ends of the Wealth LadderDemographics of those stuck at the ends of the wealth ladder
Notes: “—“ represents less than 1 percent of the sample. Wealth totals include home equity. With the exception of average family size in both generations, all differences between those raised in and stuck at the top and bottom are significant at the p < .05 level and higher. Income and wealth are adjusted to 2011 dollars.
Source: Pew’s analysis of the Panel Study of Income Dynamics
© 2014 The Pew Charitable Trusts
All Gen Xers raised in and stuck at the bottom
Gen Xers raised in and stuck at the top
Median income $41,912 $20,590 $66,080
In a couple 72% 63% 88%
College graduate 29% 17% 43%
Black 13% 33% --
Average family size 2.7 3.2 2.8
Parents’ median income $30,650 $15,870 $43,020
Parents in a couple 87% 67% 98%
At least one parent was a college graduate 28% 22% 47%
Parents’ average family size 4.2 4.3 4.3
10
College degree
No college degree
0%
60%
10%
20%
30%
50%
40%
Credit card Student loan Medical Legal or family
50%
11%
4%2%
53%
4%
27%
38%
$6,000 $3,000 $4,000 $10,000$6,000 $1,100$16,000 $25,000Median debt
College degree
No college degree
0%
60%
10%
20%
30%
50%
40%
Credit card Student loan Medical Legal or family
$6,00050%
$3,00011%
$4,0004%
$10,0002%
$6,00053%
$1,1004%
$16,00027%
$25,000
$6,000Mediandebt
38%
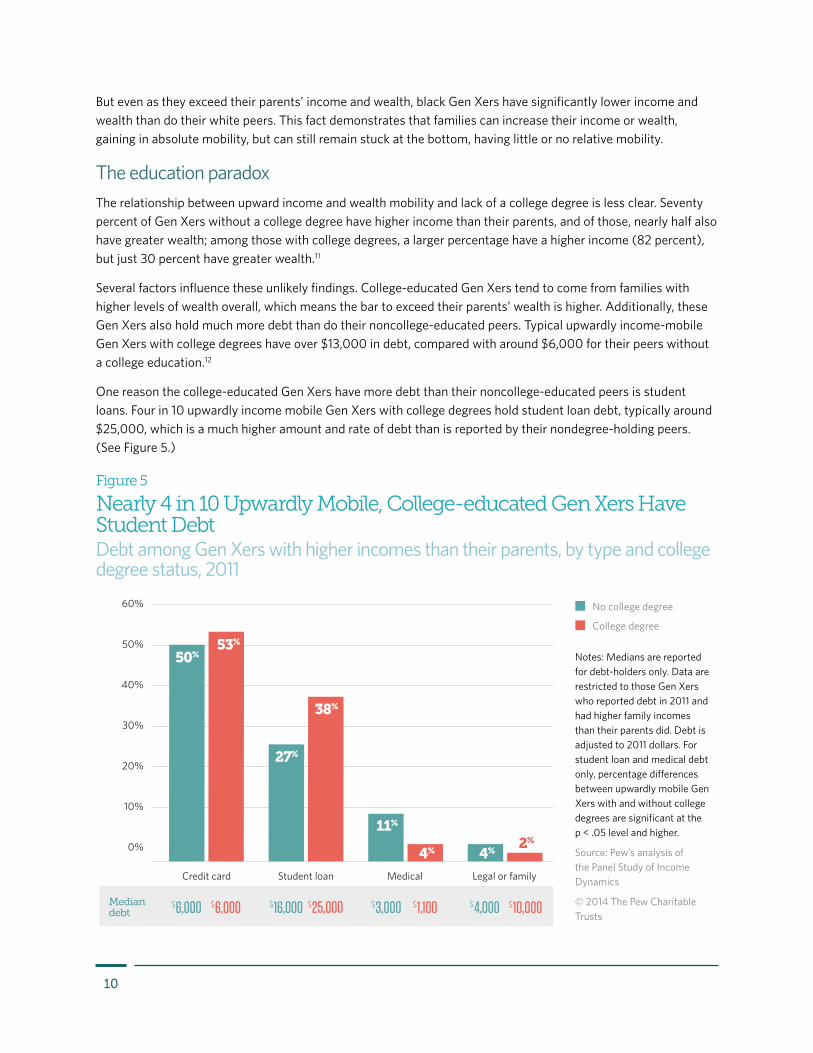
Figure 5
Nearly 4 in 10 Upwardly Mobile, College-educated Gen Xers Have Student DebtDebt among Gen Xers with higher incomes than their parents, by type and college degree status, 2011
Notes: Medians are reported for debt-holders only. Data are restricted to those Gen Xers who reported debt in 2011 and had higher family incomes than their parents did. Debt is adjusted to 2011 dollars. For student loan and medical debt only, percentage differences between upwardly mobile Gen Xers with and without college degrees are significant at the p < .05 level and higher.
Source: Pew’s analysis of the Panel Study of Income Dynamics
© 2014 The Pew Charitable Trusts
But even as they exceed their parents’ income and wealth, black Gen Xers have significantly lower income and wealth than do their white peers. This fact demonstrates that families can increase their income or wealth, gaining in absolute mobility, but can still remain stuck at the bottom, having little or no relative mobility.
The education paradoxThe relationship between upward income and wealth mobility and lack of a college degree is less clear. Seventy percent of Gen Xers without a college degree have higher income than their parents, and of those, nearly half also have greater wealth; among those with college degrees, a larger percentage have a higher income (82 percent), but just 30 percent have greater wealth.11
Several factors influence these unlikely findings. College-educated Gen Xers tend to come from families with higher levels of wealth overall, which means the bar to exceed their parents’ wealth is higher. Additionally, these Gen Xers also hold much more debt than do their noncollege-educated peers. Typical upwardly income-mobile Gen Xers with college degrees have over $13,000 in debt, compared with around $6,000 for their peers without a college education.12
One reason the college-educated Gen Xers have more debt than their noncollege-educated peers is student loans. Four in 10 upwardly income mobile Gen Xers with college degrees hold student loan debt, typically around $25,000, which is a much higher amount and rate of debt than is reported by their nondegree-holding peers. (See Figure 5.)
11
Conclusion Generation X is discussed significantly less in the media than are baby boomers or millennials, the much larger generational cohorts that bookend it. Despite its small size, however, Gen X provides critical insights for researchers and policymakers into changing family balance sheets. Gen X may also be a harbinger of declining opportunity for many American families now and in the future.
The findings of this research are that Gen X reflects the growing divergence of economic fortunes for American families. Many Gen Xers have been exceptionally prosperous, reaping the successes of the economy and benefitting tremendously from being raised by families at the top of the economic ladder. But many other Gen Xers, like their parents, have failed to gain an economic foothold and remain stuck at the bottom of the economic ladder with few prospects of moving to the top.
However, across the economic diversity of Gen Xers, a common thread exists relative to the preceding generation. Although Gen Xers have outpaced their parents in terms of income, they have fallen far short on accumulating wealth. Their debt burdens and inadequate savings cause a ripple effect throughout their balance sheets. Low levels of savings mean that many Gen Xers could have difficulties weathering unexpected and costly life events such as unemployment or a health issue. An inadequate financial cushion could also put Gen Xers’ future economic security at risk, given that they are already behind previous generations with respect to their
Gen Xers’ Student Loan Debt Could Span Generations
Recent research suggests that student debt may be holding many young adults back from homeownership and car purchases.* Other studies have maintained that student loans are manageable for most, given that over the past two decades, the typical borrower has consistently spent just 3 to 4 percent of overall monthly income on repayment.†
Studies have not often looked specifically at Gen Xers; most focused on recent college graduates under the age of 30, who as of 2012 held one-third of all student loan debt.‡ As this study shows, even among the most successful Gen Xers, some of whom finished college nearly two decades ago, student loan debt continues to hamper overall wealth accumulation. This debt may be manageable for Gen Xers on a day-to-day basis, but implications could arise for the generational reach of student loans if they prohibit Gen Xers from saving to send their own children to college.
* Meta Brown and Sydnee Caldwell, “Young Student Loan Borrowers Retreat From Housing and Auto Markets,” Liberty Street Economics, April 17, 2013, http://libertystreeteconomics.newyorkfed.org/2013/04/young-student-loan-borrowers-retreat-from-housing-and-auto-markets.html#.U9Eqw_ldVHU.
† “Beth Akers and Matthew M. Chingos, Is a Student Loan Crisis on the Horizon? Brown Center on Education Policy at Brookings (June 2014), http://www.brookings.edu/research/reports/2014/06/24-student-loan-crisis-akers-chingos.
‡ Meta Brown et al., “Measuring Student Debt and Its Performance,” Federal Reserve Bank of New York Staff Reports, 668 (2014): 1–21, http://www.newyorkfed.org/research/staff_reports/sr668.pdf.

12
retirement preparedness.13 The drag of student loan debt could prevent many Gen Xers from providing for their own children’s college aspirations, creating an intergenerational reach of student debt.
Without adequate wealth among Gen Xers, the mobility of not just the current generation, but also the next, could be at risk. Exactly how all of this will affect equality of opportunity in the future is unclear, but it indicates a strong need for policies that create wealth-building opportunities for Gen Xers and the younger cohorts who are following them into financial maturity.
13
Appendix: MethodologyAll data reported in this paper are from the Panel Study of Income Dynamics (PSID) collected by the University of Michigan. The PSID data have been collected continuously from the same families since 1968, and the study switched from annual to biennial data collection in 1997. Although additional samples have been added periodically over the years, the data used in this paper come from the study’s original families only.
In this paper, data files from every year of the PSID, or 1968 through 2011, were used. In order to properly study Generation X, or those born between 1965 and 1980, all children of householders who were 3 and younger as of the start of the 1968 survey were included. Then, from 1969 until 1980, any children who were born into study households were included as well, in order to include Gen Xers born in the following years.
Family income in the PSID includes the total earnings, transfers, investments, and other nonwage sources of money as reported by all family members for the previous calendar year. In each generation, income data were used for both parents and children when they were aged 26 to 39 and were then averaged across all valid years to create one income measure. While only 7 percent of Gen Xers and 2 percent of their parents in the final sample had just one year of income data, the income for Gen Xers was based on five years of data and for their parents was based on 11 years of data, on average.
For children, income was selected between 1995 and 2011, provided the Gen Xer was of age and a head of household. For parents, income was selected between 1968 and 1990, provided that the parent was head or spouse of the household and that the Gen X child was living with him or her. The average age when income was measured was 31 for children and 32 for parents. In the final analyses of income, only parent-child pairs with complete income data were used.
Some recoding and cleaning was performed on the income data. In the few cases of negative and zero family income in a given survey year, such data were recoded to $1. Family size adjustments were performed on income in both the parent and child generations. These adjustments account for economies of scale and also create a more level benchmark for how income is distributed within families, especially important because families were much larger in the previous generation. The method used in this report to adjust income for family size was to divide income by the square root of the size of the family in every applicable survey year, before totaling and averaging income.
Wealth is defined as the total assets families hold, minus any nonmortgage debts or liabilities they may have. For example, wealth can include the positive value of checking or savings accounts, retirement accounts (including defined benefit and defined contribution plans), real estate, home equity, farms or businesses, vehicles, and other valuables. In some cases, wealth was examined with home equity included, and in other cases, wealth and home equity were described separately. (See “Wealth and Home Equity” on Page 3.) Debt, while included in total wealth amounts, was listed separately in Table 1 to provide greater insights into how liabilities have shifted in a generation’s time. Debt in this study is defined as outstanding credit card, student loan, legal, medical, or family debts. As of 2011, the types of debt were asked separately of respondents, so Figure 5 conveys such detail for Gen Xers based only on 2011 data.
The use of wealth data in this study required multiple steps and decisions. Wealth was introduced as a variable to the PSID in 1984, after some Gen Xers had already left their childhood households. Consequently, wealth data were selected for the parents’ generation in 1984 based upon who the head of household was in the last year their Gen X child lived with them. Furthermore, because wealth was collected sporadically on the PSID until 1999, only the 1984 and 1989 wealth data were used for the parents’ generation if the parents were aged 26 to 39
14
during those years. So, there were more instances of missing wealth data for the parents’ generation in this study than was the case for income data, resulting in a smaller sample for the final wealth analyses.
For the Gen Xers themselves, wealth data were used from the 1999 through 2011 survey years, provided they were aged 26 to 39. Wealth data were collected sporadically until 1999, but from 1999 through 2011, the data were collected biennially in every survey year. All wealth analyses in the final paper include Gen Xers and their parents, provided both generations had complete and valid data.
Age adjustments were performed as a check on the wealth data because the average age of the parents when wealth was measured was 36, while for the children it was 32. Although the percentage of Gen Xers with more wealth than their parents increased slightly when the data were age-adjusted, a great majority of Gen Xers still had less wealth than their parents. Because the results were similar, Pew decided to use the unadjusted results. By restricting the ages of both parents and children to 26 to 39 during the years in which wealth was measured, the generational analyses of wealth are comparable.
The designation of a household as being coupled, having children present, having a female head, and being a dual-earner family reflects averages over the years in which income was measured. For example, if any of these conditions applied to more than half of the survey years, the household was categorized as such.
All of the data that report dollar amounts (i.e., income, wealth, equity, and debt) were adjusted to 2011 constant dollars. All data reported in this study were weighted using the individual-level panel weight for the Gen Xers.
Additional tables are included below to provide descriptive and statistical detail not shown in the report. Table A.1 describes the family balance sheets for Gen Xers overall and according to various demographic characteristics. Table A.2 includes the results from a logistic regression model performed in order to understand who among Gen Xers with higher family incomes than their parents also had higher wealth.
15
Tabl
e A
.1
Gen
Xer
s H
ave
Hig
her
Inco
mes
Th
an th
e P
revi
ous
Gen
erat
ion
Did
The
balan
ce sh
eets
of G
en X
ers a
nd th
eir p
aren
ts b
y dem
ogra
phic
char
acte
ristic
s
Not
es: “
—“ r
epre
sent
s le
ss th
an 1
perc
ent o
f the
sam
ple.
Wea
lth to
tals
do
not i
nclu
de h
ome
equi
ty. I
ncom
e an
d w
ealth
are
adj
uste
d to
201
1 dol
lars
.
Sour
ce: P
ew’s
anal
ysis
of t
he P
anel
Stu
dy o
f Inc
ome
Dyn
amic
s
© 2
014
The
Pew
Cha
ritab
le T
rust
sOve
rall
Educ
atio
nCo
uple
sta
tus
Race
Gen
XPa
rent
Gen
XPa
rent
Gen
XPa
rent
Gen
XPa
rent
No
colle
ge
degr
ee
Colle
ge
degr
ee
No
colle
ge
degr
ee
Colle
ge
degr
eeSi
ngle
In c
oupl
eSi
ngle
In c
oupl
eW
hite
Blac
kW
hite
Blac
k
Med
ian
fam
ily
inco
me
$43,
096
$30,
530
$36,
752
$61,7
13
$26,
157
$41,8
31
$33,
648
$47,
378
$14,
208
$32,
447
$45,
909
$28,
240
$32,
346
$15,
434
Has
pos
itive
net
w
orth
(no
equi
ty)
88%
96%
89%
86%
96%
98%
86%
88%
83%
98%
88%
84%
98%
84%
Med
ian
non-
hom
e-eq
uity
wea
lth$1
3,08
7 $1
8,35
0 $1
1,346
$1
9,68
1 $1
4,04
1 $3
6,28
8 $5
,571
$1
7,25
6 $9
44
$24,
020
$14,
895
$3,9
39
$22,
357
$1,8
67
Hom
eow
ner
87%
85%
84%
95%
82%
92%
74%
93%
49%
90%
90%
71%
90%
53%
Med
ian
equi
ty
(ove
rall
popu
latio
n)$2
0,23
2 $3
5,05
1 $1
4,51
3 $4
1,477
$2
6,31
3 $6
1,854
$9
,389
$2
7,04
6 —
$44,
062
$24,
157
$5,6
07
$44,
659
—
Has
deb
t97
%82
%96
%99
%80
%88
%94
%98
%70
%84
%98
%93
%83
%79
%
Med
ian
debt
$7,2
32
$1,2
37
$5,8
83
$14,
041
$876
$2
,268
$6
,271
$7
,675
—
$1,6
49
$7,6
75
$3,5
65
$1,4
43
$515
Ave
rage
yea
rs o
f ho
meo
wne
rshi
p5.
47.
64.
96.
57.
28.
63.
66.
13.
08.
25.
73.
48.
14.
0
In a
cou
ple
72%
88%
Colle
ge g
radu
ate
30%
29%
Blac
k12
%12
%
Ave
rage
fam
ily s
ize
2.8
4.6
Has
chi
ldre
n57
%10
0%
16
Table A.2
Who Among Gen Xers Is Likeliest to Have Higher Incomes and Wealth Than Their Parents Did?Logistic regression model predicting attainment of higher wealth than their parents among those Gen Xers who also have higher incomes than their parents did
Notes: Data are restricted to those Gen Xers who had higher family incomes than their parents did. Significance is represented as follows: ***p < .001 and *p < .05. Income and wealth are adjusted to 2011 dollars.
Source: Pew’s analysis of the Panel Study of Income Dynamics
© 2014 The Pew Charitable Trusts
Odds ratio Significance
Not a college graduate 2.19 ***
Black 2.76 ***
Dual-earner family 1.16
Debt (log 10) 0.71 ***
Equity (log 10) 1.34 ***
Purchased first home during housing bubble 0.76
Constant 0.42 *
N size 996
Pseudo R-square 0.08
17
Endnotes1 The Pew Charitable Trusts, “Retirement Security Across Generations: Are Americans Prepared for their Golden Years?” (May 2013),
http://www.pewtrusts.org/en/research-and-analysis/reports/0001/01/01/retirement-security-across-generations.
2 Signe-Mary McKernan et al., “Impact of the Great Recession and Beyond: Disparities in Wealth Building by Generation and Race,” Urban Institute Working Paper (April 2014), http://www.urban.org/publications/413102.html.
3 Macro-level economic shocks from the housing and stock markets may affect generational wealth differences, as well as diverseness in financial behaviors, preferences, and the timing of life events. The exploration of such factors was beyond the scope of this study.
4 All dollar amounts have been adjusted for inflation and are expressed as 2011 dollars. All income numbers in this report have also been adjusted for family size in order to account for the distribution of resources within families. We have not adjusted wealth for family size because it is not necessarily shared among all family members the way income is.
5 The Pew Charitable Trusts, Retirement Security Across Generations; and McKernan et al., “Impact of the Great Recession and Beyond.”
6 Thomas Shapiro, Tatjana Meschede, and Sam Osoro, “The Roots of the Widening Racial Wealth Gap: Explaining the Black-White Economic Divide,” Institute on Assets and Social Policy at Brandeis University (February 2013), http://iasp.brandeis.edu/pdfs/Author/shapiro-thomas-m/racialwealthgapbrief.pdf.
7 The Pew Charitable Trusts, Pursuing the American Dream: Economic Mobility Across Generations (July 2012), http://www.pewstates.org/research/reports/pursuing-the-american-dream-85899403228.
8 Ibid. By comparison, among working-age adults, 43 percent raised in the bottom quintile remain there, and 70 percent do not reach the middle.
9 Separate significance tests were performed on Gen Xers who were stuck at the bottom of the wealth ladder to understand if median debt totals were significantly different for those with and without a college degree. Debt totals were much higher for Gen Xers stuck at the bottom of the wealth ladder if they had a college degree (p < .001).
10 These analyses control for a number of balance sheet and demographic factors. Controlling for the housing bubble is one way to address macro-level economic shocks that might have affected Generation X differently from their parents, but other macro-level shocks are difficult to measure with these data and were beyond the scope of the paper.
11 These statistics were run separately and are not shown in tables in this report.
12 These statistics were run separately and are not shown in tables in this report.
13 The Pew Charitable Trusts, Retirement Security Across Generations.