a new patient monitoring framework and energy …zkhan/downloads/zkhan-epr.pdf · original research...
TRANSCRIPT

ORIGINAL RESEARCH
A new patient monitoring framework and Energy-aware PeeringRouting Protocol (EPR) for Body Area Network communication
Zahoor A. Khan • Shyamala Sivakumar •
William Phillips • Nauman Aslam
Received: 10 December 2012 / Accepted: 17 May 2013
� Springer-Verlag Berlin Heidelberg 2013
Abstract The recent research in Body Area Networks
(BANs) is focused on making its communication more
reliable, energy efficient, secure, and to better utilize system
resources. In this paper we propose a novel BAN archi-
tecture for indoor hospital environments, and a new
mechanism of peer discovery with routing table construc-
tion that helps to reduce network traffic load, energy con-
sumption, and improves BAN reliability. The three
scenarios with fixed and variable number of packets sent by
source nodes are considered for better analysis. Static nodes
are considered in first and second scenarios whereas mobile
nodes are used in third scenario. We have performed
extensive simulations in the OMNeT?? based Castalia-3.2
simulation environment to show that our proposed protocol
has better performance in terms of reduced BAN traffic
load, increased successful transmission rate, reduced num-
ber of packets forwarded by intermediate nodes, no packets
dropped due to buffer overflow, and overall lower energy
consumption when compared with a similar protocols.
Keywords Body Area Network � BAN � Hospital BAN
communication � ZK-BAN � ZK-BAN peering framework �EPR � Energy-aware Peering Routing Protocol
1 Introduction
The monitoring of physiological and biochemical param-
eters in the human body using Wireless Sensor Networks
(WSNs) is a challenging problem. Some of these chal-
lenges discussed in Ko et al. (2010) are high level of data
reliability, small size of implantable nodes, access to nodes
due to difficult sensor replacement, context awareness due
to the sensitivity of body physiology, power supply to
implanted sensors, and mobility of patient. These chal-
lenges are addressed in the new sub-field of WSN known as
Body Area Network (BAN).
The IEEE 802.15 Task Group 6 is working to develop a
low power and low frequency short range communication
standard protocol for BAN. The goal is to optimize BAN
operations related to inside or outside of the human body
but also to be compatible with other medical and consumer
electronics devices (IEEE 2007). Several projects such as
SMART (Curtis et al. 2008), CareNet (Jiang et al. 2008),
AID-N (Gao et al. 2007), and ALARM-NET (Wood et al.
2006) are proposed to monitor patient’s data. The goal of
these projects is to collect and analyze BAN data. The
general BAN architecture used in these projects is to send
the data to the central database for monitoring. However,
these projects have not addressed the displaying in real-
time of BAN data in hospital environment. Traffic con-
gestion and database server or link failure can cause delay
or stop displaying the patient’s data which can affect the
patient’s treatment. The mobility of the patient in the
hospital may require a change of the dedicated display unit
Z. A. Khan (&)
Internetworking Program, Faculty of Engineering,
Dalhousie University, Halifax, Canada
e-mail: [email protected]
S. Sivakumar
Saint Mary’s University, Halifax, Canada
e-mail: [email protected]
W. Phillips
Department of Engineering Mathematics and Internetworking,
Faculty of Engineering, Dalhousie University, Halifax, Canada
e-mail: [email protected]
N. Aslam
Northumbria University, Newcastle upon Tyne, UK
e-mail: [email protected]
123
J Ambient Intell Human Comput
DOI 10.1007/s12652-013-0195-6

used to display patient data. In order to resolve these
problems, a new BAN network architecture and a routing
protocol is required.
Our proposed Zahoor Khan BAN (ZK-BAN) peering
framework and routing protocol (EPR) are designed to
display in real-time BAN data, avoid a fully centralized
system, and discover the dedicated BAN data display unit
dynamically. Both centralized and distributed approaches
are used in the proposed scheme. The central computer
only holds the information of BANs and display units
thereby improving privacy and helps better control on
BAN communication. However, the BAN data is displayed
on the display unit in a distributed manner which reduces
traffic load and helps to improve patient mobility.
The remaining part of the paper is organized as follows.
Related work is discussed in Sect. 2. The proposed BAN
peering framework (ZK-BAN) and the associated Energy-
aware Peering Routing protocol (EPR) are given in Sects. 3
and 4 respectively. Section 5 presents performance evalu-
ation of the proposed BAN architecture and conclusions
are presented in Sect. 6.
2 Related work
Typically, in BAN, the body implant and wearable sensors
send their data to a central device known as the coordi-
nator. The coordinator is a computationally more powerful
device and behaves as a router in BAN networks. BAN
communication factors include the combination of reli-
ability, short range transmission, low data rate, less energy
consumption, and noninterference with other devices. The
current Personal Area Network (PAN) standards do not
support BAN communication (Zhen et al. 2011). However
the IEEE 802.15 task group 6 is working to develop a
standard for BAN which should be compatible with a low
transmission range of 3 m, data rates of up to 10 Kbps, and
support for QoS (IEEE 2007).
To address the challenges related to the management of
patients’ medical information, an intelligent monitoring of
BAN data in hospital environment is required (Chen et al.
2010). Motion recognition using sensors in hospital envi-
ronment is discussed in the literature (Ugolotti et al. 2013;
Amoretti et al. 2013). Security-enhanced ambient assisted
living supporting school activities during hospitalization is
given in (Anton et al. 2012). The projects (Curtis et al.
2008; Jiang et al. 2008) use two communication tiers to
send the data from body sensors to the web server or
database server. SMART (Curtis et al. 2008) provides a
monitoring system for indoor hospital environment but it
only covers the emergency rooms. The patient data is
displayed on the PDAs of the patient and healthcare pro-
fessional. SMART (Curtis et al. 2008) is not
implementable in the areas like ICU, ORs where highly
sensitive equipment is used. This is due to the possible
disturbances of high transmitting power devices, such as
PDAs, on the highly sensitive hospital devices. IEEE
802.15.6 is newly proposed standard for BAN. The trans-
mission range of BAN is 3 m. Our proposed BAN peering
framework provides a solution for the whole hospital and it
is compatible with BAN standard. Only outdoor BAN
communication is considered in (Gao et al. 2007) which
uses a GPS module. It uses the approach of first sending the
data to the server and then the authenticated users analyze
the patient data from the servers. The link or server failure
can stop the monitoring process. On the other hand, our
proposed monitoring system provides a real-time moni-
toring system in indoor (hospital) environment. ALARM-
NET (Wood et al. 2006) introduces an automatic moni-
toring system by using WSN. ALARM-NET combines the
environmental and wearable sensors to provide a solution
of continuous monitoring for assisted-living and residential
monitoring. Heterogeneous devices are used with the
integration of mobile body networks, wireless environ-
mental sensors, and IP-networks. The goal of this project
(Wood et al. 2006) is to collect and analyze BAN data. The
general BAN architecture used in this project is to send the
data to the central database for monitoring. However the
display of real-time BAN data in hospital environment is
not addressed. Traffic congestion and database server or
link failure can cause delay or stop displaying the patient’s
data which can affect the patient’s treatment. Our proposed
BAN peering framework emphasizes the real-time display
of BAN data and discusses the different scenarios in hos-
pital environment.
In Agarwal et al. (2010), the store and display idea is
used to send the BAN data to the database and then from
the database, the healthcare devices can be used to display
it. The network architectures used in existing projects
(Curtis et al. 2008; Jiang et al. 2008; Gao et al. 2007; Wood
et al. 2006; Agarwal et al. 2010) consider only centralized
approaches for monitoring the patients’ data. However, as
mentioned previously no mechanism is provided for dis-
playing the BAN data when there is no connectivity of
healthcare system with the central database.
In Kim and Cho (2009), the proposed BAN network
architecture explains the mechanism of combining or
splitting a BAN in inter-BAN communication. It seems a
reasonable idea for internetworking of BANs however it
does not consider the real time display of BAN data in
hospital environment. There are other ideas (Chen et al.
2006, 2007, 2008, 2009; Liang et al. 2008; Huang and Fang
2008; Felemban et al. 2006; Razzaque et al. 2008) for
efficient routing in WSN but these do not consider the
requirements of BAN communication in a hospital
scenario.
Z. A. Khan et al.
123

A routing protocol is required to implement our pro-
posed BAN peering framework. In Razzaque et al. (2011),
a routing protocol is proposed in which different packet
classes are handled differently depending on their QoS
requirements. Hello packets are used to broadcast the
information of a node to its neighbor nodes. After receiving
the Hello packets, a node updates its routing table with the
help of the information received by Hello packets. How-
ever, a disadvantage of the method used for broadcasting
the Hello packets increases network traffic which results in
higher BAN energy consumption. The next hops consid-
ered by DMQoS in the BAN communication are only BAN
Coordinators (BANCs) and every node broadcasts its Hello
packets after a certain period of time. In a real BAN
communication scenario, the next hop can be a different
device like Nursing Station Computer (NSC), Medical
Display Coordinator (MDC) or BANC. The features and
requirements of NSC, MDC and BANC are different in a
hospital environment. Our proposed routing protocol EPR
addresses these shortcomings, with the consideration of all
possible next hop devices (i.e. NSC, MDCs and BANCs) in
the hospital environment, by controlling the broadcast of
Hello packets.
3 Proposed BAN peering framework (ZK-BAN)
A general BAN communication framework is shown in
Fig. 1. It is a hierarchical model with three communication
tiers (Chen et al. 2010). In tier 1, the implanted and
wearable sensors send data to the BAN coordinator. The
possible next hop of a BAN coordinator can be any device
shown in tier 2. The communication devices with the
exception of BAN coordinator in tier 2 forward the BAN
data to tier 3 communication devices. The two possible
BAN communication scenarios are indoor and outdoor.
The BAN in the hospital and at home is considered to be an
indoor scenario. There are two kinds of communication,
point-to-point and point-to-multipoint. Point-to-point (p-p)
means the BAN coordinator sends data packets to the next
hop for a single destination. In point-to-multipoint (p-mp),
the BAN coordinator sends data packets to the next hops
for multiple destinations.
The requirements of BAN communication in indoor-
hospital environment are different from the outdoor or
indoor-home BAN communication. In the hospital envi-
ronment, typically, every patient’s BAN needs a Medical
Display Coordinator (MDC) for displaying the patient’s
data. Normally this device is placed within 3 m of BAN
coordinator. For example, when a patient comes to the
hospital’s Emergency Room (ER) the BAN data is dis-
played on the MDC of the ER. Thereafter the patient may
be transferred to the Operation Room (OR), Patient Room
(PR), or Intensive Care Unit (ICU) for further treatment. It
is then required to display the BAN data on the new MDC.
Due to the availability of many MDCs in the hospital,
we need a mechanism to display in real time BAN data on
the MDC dedicated to the patient. For this we propose a
hybrid peering method. In this method the BAN will be
peered with a display device (MDC). The BAN commu-
nication has two modes: centralized and distributed. In the
centralized mode, the BAN will connect to the Nursing
Station Coordinator (NSC) to obtain peering information
and in the distributed mode it will discover and send data to
its peer. The mechanism is explained below by considering
the different possible communication scenarios.
3.1 Point-to-point communications in ZK-BAN
In the hospital, initially the BAN communication is in a
centralized mode and no data is displayed on any MDC.
The BAN coordinator will try to connect to the Nursing
Station Coordinator (NSC). The purpose of this connection
is to obtain the information about its peer (MDC) and
communication type (p-p or p-mp).
The NSC is a centralized system that holds the peering
and communication information in its NSC peer table for
all BANs in the hospital. By keeping this information on
the NSC, the privacy of the data is ensured. The Nurse/
operator is responsible for entering the peering (MDC) and
communication (p-p or p-mp) information of BAN on the
NSC. After getting the peering information from the NSC,
the BAN coordinator will immediately switch to a dis-
tributed mode and will start searching for its peer. After
discovering its peer MDC, the data will be displayed on the
MDC. Each MDC is also connected with a wireless access
point which can transfer patient data to tier 3 communi-
cation devices. As the communication type is p-p, the BAN
coordinator sends data packets to its respective peer. Fig-
ure 2a explains the process when BAN B1 in steps 1 and 2
gets the information from NSC about its peer (i.e. MDC1)
and communication type (i.e. p-p). In step 3, the BAN
coordinator will discover MDC1 and display the data on it.
The data from B1 will always be displayed on MDC1 even
when B1 moves away from MDC1. The timing diagram of
this process is shown in Fig. 2b.
Three steps shown in Fig. 2a are given below.
1. My Peer(s)? Communication type (p-p or p-mp)?
2. Look NSC peer table and send info to B1.
3. Look B1 routing table and send data for MDC1.
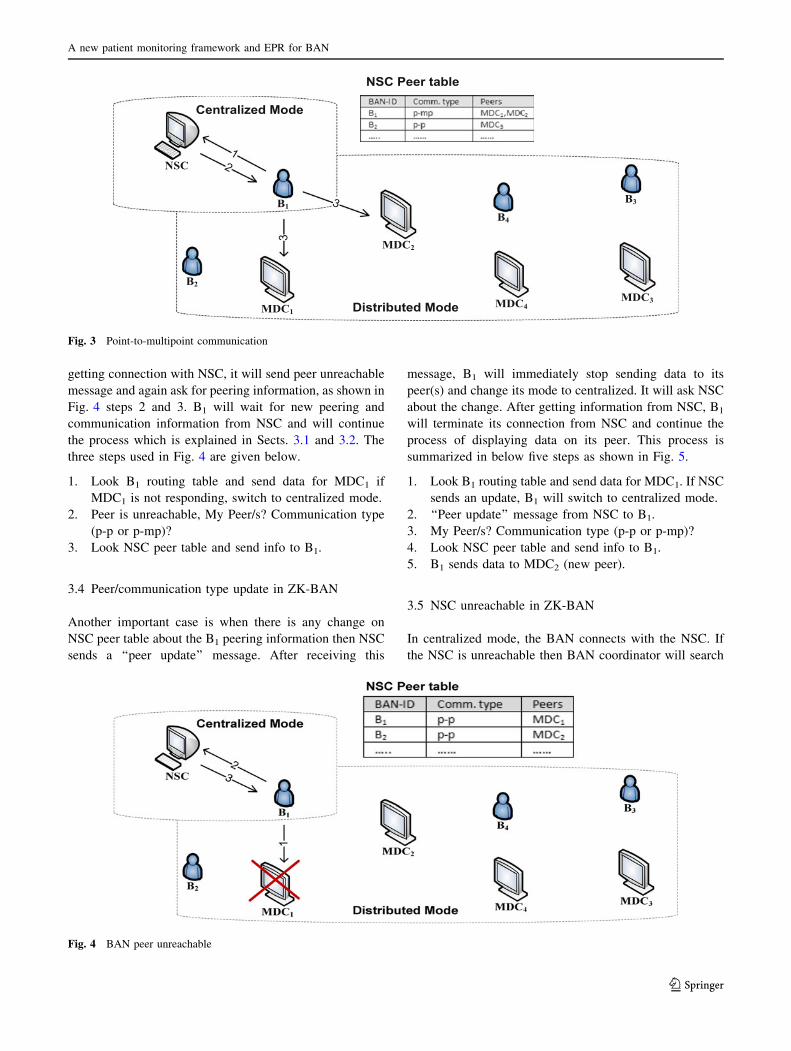
3.2 Point-to-multipoint communications in ZK-BAN
In some cases we need to display the BAN data on more
than one display units. When a doctor wants to see the
A new patient monitoring framework and EPR for BAN
123

patient’s data on his/her office MDC, we need p-mp as
communication type and MDC1 and MDC2 as its peers.
The operator should enter these changes in NSC. The B1
will send two copies of data packets, one for MDC1 and
other for MDC2. The below scenario explains it clearly. B1
will first contact to NSC and gets information about its
peers and communication type. It will then send two copies
of data packets for both MDC1 and MDC2 after searching
these peers. This process can summarize in three steps as
shown in Fig. 3.
1. My Peer(s)? Communication type (p-p or p-mp)?
2. Look NSC peer table and send info to B1.
3. Look B1 routing table and send data for MDC1, MDC2.
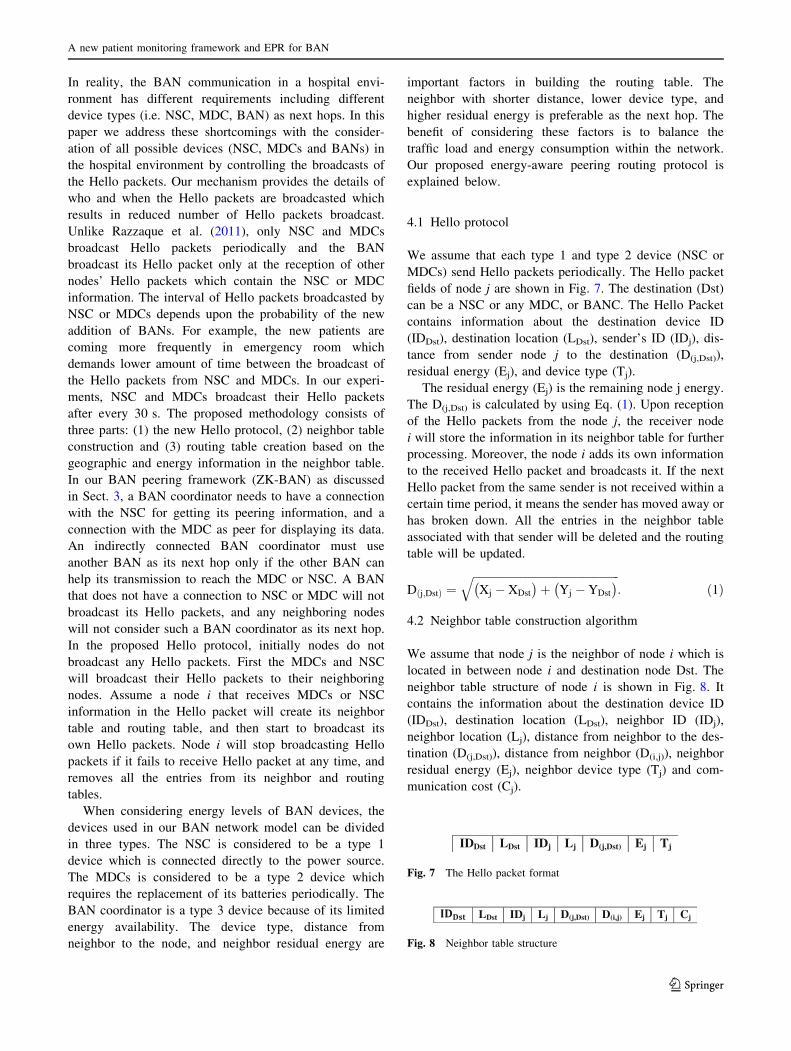
3.3 Peer unreachable in ZK-BAN
When B1 is displaying its data on its peer MDC1 and
suddenly MDC1 is unreachable, B1 will change its mode to
centralized from distributed. It will immediately stop
sending the data to MDC1 and search the NSC. After
Fig. 1 BAN communication system
Fig. 2 Point-to-point communication
Z. A. Khan et al.
123
getting connection with NSC, it will send peer unreachable
message and again ask for peering information, as shown in
Fig. 4 steps 2 and 3. B1 will wait for new peering and
communication information from NSC and will continue
the process which is explained in Sects. 3.1 and 3.2. The
three steps used in Fig. 4 are given below.
1. Look B1 routing table and send data for MDC1 if
MDC1 is not responding, switch to centralized mode.
2. Peer is unreachable, My Peer/s? Communication type
(p-p or p-mp)?
3. Look NSC peer table and send info to B1.
3.4 Peer/communication type update in ZK-BAN
Another important case is when there is any change on
NSC peer table about the B1 peering information then NSC
sends a ‘‘peer update’’ message. After receiving this
message, B1 will immediately stop sending data to its
peer(s) and change its mode to centralized. It will ask NSC
about the change. After getting information from NSC, B1
will terminate its connection from NSC and continue the
process of displaying data on its peer. This process is
summarized in below five steps as shown in Fig. 5.
1. Look B1 routing table and send data for MDC1. If NSC
sends an update, B1 will switch to centralized mode.
2. ‘‘Peer update’’ message from NSC to B1.
3. My Peer/s? Communication type (p-p or p-mp)?
4. Look NSC peer table and send info to B1.
5. B1 sends data to MDC2 (new peer).
3.5 NSC unreachable in ZK-BAN
In centralized mode, the BAN connects with the NSC. If
the NSC is unreachable then BAN coordinator will search
Fig. 3 Point-to-multipoint communication
Fig. 4 BAN peer unreachable
A new patient monitoring framework and EPR for BAN
123

for an alternate path to the geographically closest MDC.
All MDCs and NSC are connected via Wi-Fi as shown in
Fig. 1. BAN sends the NSC unreachable message to the
central server.
The two steps shown in Fig. 6 are explained below.
1. B1 sends data to the NSC. B1 does not receive any
response in case of if NSC is unreachable.
2. Look B1 routing table and send data for NSC via
closest MDC.
4 Proposed Energy-aware Peering Routing Protocol
(EPR)
The proposed routing protocol is intended to be employed
in the indoor hospital environment for BAN communica-
tion. The data-centric multi-objective QoS-aware routing
protocol proposed in Razzaque et al. (2011) is used to
select the next hop node and forwards data packets by
taking into consideration the QoS requirements of the data.
The higher residual energy and geographic position were
the two important factors used for choosing the down-
stream hop. Network traffic is differentiated into different
classes including Ordinary Packets (OPs), Critical Packets
(CPs), Reliability-driven Packets (RPs), and Delay-driven
Packets (DPs) according to their generated data types. The
reliability and delay control modules introduced in Razz-
aque et al. (2011) result in better performance than several
state-of-the-art approaches (Chen et al. 2006, 2007, 2008,
2009; Liang et al. 2008; Huang and Fang 2008; Felemban
et al. 2006; Razzaque et al. 2008) in terms of lower bit
error rates, traffic load, and operation energy overload.
However, a disadvantage of (Razzaque et al. 2011) is that
the method used for sending the Hello packets and creating
the routing table results in increased network traffic,
thereby increasing BAN energy consumption. In Razzaque
et al. (2011), the next hops considered in the BAN com-
munication are only BAN coordinators and every node
broadcasts its Hello packets after a specific period of time.
Fig. 5 Peer/communication type update
Fig. 6 NSC unreachable
Z. A. Khan et al.
123
In reality, the BAN communication in a hospital envi-
ronment has different requirements including different
device types (i.e. NSC, MDC, BAN) as next hops. In this
paper we address these shortcomings with the consider-
ation of all possible devices (NSC, MDCs and BANs) in
the hospital environment by controlling the broadcasts of
the Hello packets. Our mechanism provides the details of
who and when the Hello packets are broadcasted which
results in reduced number of Hello packets broadcast.
Unlike Razzaque et al. (2011), only NSC and MDCs
broadcast Hello packets periodically and the BAN
broadcast its Hello packet only at the reception of other
nodes’ Hello packets which contain the NSC or MDC
information. The interval of Hello packets broadcasted by
NSC or MDCs depends upon the probability of the new
addition of BANs. For example, the new patients are
coming more frequently in emergency room which
demands lower amount of time between the broadcast of
the Hello packets from NSC and MDCs. In our experi-
ments, NSC and MDCs broadcast their Hello packets
after every 30 s. The proposed methodology consists of
three parts: (1) the new Hello protocol, (2) neighbor table
construction and (3) routing table creation based on the
geographic and energy information in the neighbor table.
In our BAN peering framework (ZK-BAN) as discussed
in Sect. 3, a BAN coordinator needs to have a connection
with the NSC for getting its peering information, and a
connection with the MDC as peer for displaying its data.
An indirectly connected BAN coordinator must use
another BAN as its next hop only if the other BAN can
help its transmission to reach the MDC or NSC. A BAN
that does not have a connection to NSC or MDC will not
broadcast its Hello packets, and any neighboring nodes
will not consider such a BAN coordinator as its next hop.
In the proposed Hello protocol, initially nodes do not
broadcast any Hello packets. First the MDCs and NSC
will broadcast their Hello packets to their neighboring
nodes. Assume a node i that receives MDCs or NSC
information in the Hello packet will create its neighbor
table and routing table, and then start to broadcast its
own Hello packets. Node i will stop broadcasting Hello
packets if it fails to receive Hello packet at any time, and
removes all the entries from its neighbor and routing
tables.
When considering energy levels of BAN devices, the
devices used in our BAN network model can be divided
in three types. The NSC is considered to be a type 1
device which is connected directly to the power source.
The MDCs is considered to be a type 2 device which
requires the replacement of its batteries periodically. The
BAN coordinator is a type 3 device because of its limited
energy availability. The device type, distance from
neighbor to the node, and neighbor residual energy are
important factors in building the routing table. The
neighbor with shorter distance, lower device type, and
higher residual energy is preferable as the next hop. The
benefit of considering these factors is to balance the
traffic load and energy consumption within the network.
Our proposed energy-aware peering routing protocol is
explained below.
4.1 Hello protocol
We assume that each type 1 and type 2 device (NSC or
MDCs) send Hello packets periodically. The Hello packet
fields of node j are shown in Fig. 7. The destination (Dst)
can be a NSC or any MDC, or BANC. The Hello Packet
contains information about the destination device ID
(IDDst), destination location (LDst), sender’s ID (IDj), dis-
tance from sender node j to the destination (D(j,Dst)),
residual energy (Ej), and device type (Tj).
The residual energy (Ej) is the remaining node j energy.
The D(j,Dst) is calculated by using Eq. (1). Upon reception
of the Hello packets from the node j, the receiver node
i will store the information in its neighbor table for further
processing. Moreover, the node i adds its own information
to the received Hello packet and broadcasts it. If the next
Hello packet from the same sender is not received within a
certain time period, it means the sender has moved away or
has broken down. All the entries in the neighbor table
associated with that sender will be deleted and the routing
table will be updated.
Dðj;DstÞ ¼ffiffiffiffiffiffiffiffiffiffiffiffiffiffiffiffiffiffiffiffiffiffiffiffiffiffiffiffiffiffiffiffiffiffiffiffiffiffiffiffiffiffiffiffiffiffiffiffiffiffiffiffiffi
Xj � XDst
� �
þ Yj � YDst
� �
q
: ð1Þ
4.2 Neighbor table construction algorithm
We assume that node j is the neighbor of node i which is
located in between node i and destination node Dst. The
neighbor table structure of node i is shown in Fig. 8. It
contains the information about the destination device ID
(IDDst), destination location (LDst), neighbor ID (IDj),
neighbor location (Lj), distance from neighbor to the des-
tination (D(j,Dst)), distance from neighbor (D(i,j)), neighbor
residual energy (Ej), neighbor device type (Tj) and com-
munication cost (Cj).
Dst Dst j j (j,Dst) jID L ID L D E Tj
Fig. 7 The Hello packet format
LDst j j (j,Dst) (i,j) j jID L D D E T Cj
Fig. 8 Neighbor table structure
A new patient monitoring framework and EPR for BAN
123

After receiving a Hello packet, the node i’s neighbor
table constructor algorithm will compare the distance from
neighbor to the destination (DDst(hp)) with the direct
distance of node i to the destination D(i,Dst). It will add a
record if DDst from Hello packet is less than the distance
between the node i to the destination i.e.
DDstðht) \ Dðj;DstÞ:
Dði;jÞ ¼ffiffiffiffiffiffiffiffiffiffiffiffiffiffiffiffiffiffiffiffiffiffiffiffiffiffiffiffiffiffiffiffiffiffiffiffiffiffiffiffiffiffiffiffiffiffiffiffi
Xi � Xj
� �2þ Yi � Yj
� �2q
ð2Þ
Cj ¼Tj � D2
ði;jÞ
� �
Ej
: ð3Þ
The algorithm for Neighbor Table Constructor for
node i is shown in Algorithm 1. We assume that node
i receives a Hello packet from neighbor node j. The hp
and nt used in this algorithm stand for Hello packet and
neighbor table respectively. Xi, Yi represent the X, Y
coordinates of node i. XDST, YDST stand for the X, Y
coordinates of the destination. It is assumed that the
locations of NSC and MDCs are known. The values of
Xi, and Yi of the node i are calculated by the RSSI
localization technique given in Xu et al. (2010). The
other fields of the neighbor table have the same
meanings as in Hello packet. D(i,j) and Cj are
calculated by using formula 2 and 3. The values of Tj,
D(i,j) and Ej are used to find the communication cost
(Cj). The shorter distance (D(i,j)), lower device type (Tj),
and higher residual energy (Ej) will generate a lower
communication cost (Cj). The node j with lowest value
of Cj is the best choice for next hop. The neighbor table
constructor calculates the communication cost and
updates the neighbor table periodically after receiving
every new Hello packet.
Z. A. Khan et al.
123

4.3 Routing table construction algorithm
There are many records in the neighbor table for the same
destination. The routing table construction algorithm filters
the neighbor table, and only chooses entry with the lowest
communication cost. The routing table structure of node
i is shown in Fig. 9. It contains destination ID (IDDst),
destination location (LDst), and next hop (NH). As shown in
algorithm 2, a new record is added in the routing table for
each destination Dst [ {MDC, NSC, BAN}. If the desti-
nation (Dst) and node i are directly connected with each
other, the next hop (NH) will be the destination ID (IDDst).
Otherwise neighbor node j with the lowest communication
cost (Cj) will be selected as next hop (NH).
5 Performance evaluation
The performance of our proposed routing protocol is com-
pared with the DMQoS routing protocol (Razzaque et al.
2011) using simulations performed in the OMNeT?? based
Castalia-3.2 simulator (NICTA 2011). We also compared the
performance of energy-aware based routing ‘‘EPR’’ with no
energy-aware based routing ‘‘noRouting’’. In noRouting, the
data packets are forwarded to random next hop devices
instead of algorithm’s next hop based on energy-aware
routes. The comparison of EPR with noRouting is used to
verify whether sending the packets to a random next hop
device results in a better successful transmission rate than
our proposed energy-aware routing protocol. The network
parameters used in our simulations are shown in Table 1.
The total area used in DMQoS (Razzaque et al. 2011) is
2,000 m 9 2,000 m = 4,000,000 m2 and each coordinator
is placed in 63.3 m 9 63.3 m = 4,000 m2 which is not
feasible for indoor-hospital environment considered in this
paper. Typically, an MDC is placed within 3 m of the
patient’s bed. We consider a typical hospital scenario in
which NSC, MDCs and BAN coordinators are used within
an area of 9 m 9 9 m = 81 m2. The overall energy con-
sumption during construction and update of the routing
tables are shown in Table 2.
We used different values of transmit power i.e. -10,
-15 and -25 dBm in our simulations. Three scenarios are
considered: in the first scenario a fixed number of packets
are sent and all nodes are static, in the second and third
scenarios a variable number of packets are sent. Scenario 3
is similar to scenario 2 but has movable BANs. The results
are then observed and compared. We measure the suc-
cessful transmission rate, buffer overflow, packets for-
warded by intermediate nodes, traffic load, and overall
energy consumption for the three scenarios by sending a
fixed number of packets and a variable number of packets
from 4 to 80 K range. The results of these scenarios are
discussed below.
Scenario 1: In this case, each BAN coordinator sends
1,000 packets to the corresponding MDC or NSC. The
deployment of the nodes is given in Table 1. B1 is the
closest node to the NSC or MDCs. In DMQoS (Razzaque
et al. 2011), B1 is responsible for forwarding the data
packets from other nodes to NSC or MDCs. This results in
more energy consumption for B1 and increased congestion
experienced by B1. EPR resolves these problems by
choosing the most appropriate next hop. In the proposed
EPR scheme, the BAN coordinator does not send data to
another BAN coordinator unless it is necessary. Figure 10a
shows the number of packets forwarded by the intermedi-
ate nodes. It is seen from Fig. 10a that 332 data packets go
through the intermediate nodes before reaching to the
IDDst DstL NH
Fig. 9 Routing table structure
A new patient monitoring framework and EPR for BAN
123

destinations in EPR when the transmit power is -25 dBm.
For transmit power of -15 and -10 dBm, there is no any
packet which goes through the intermediate nodes in EPR
because the destinations are in range due to the high
transmit powers. In comparison, there are 2,526, 3,922, and
3,849 packets forwarded by intermediate nodes in DMQoS
for the transmit powers of -25, -15, and -10 dBm
respectively. The packets forwarded by intermediate nodes
in noRouting are 4,553, 6,497, and 6,838 for transmit
powers of -25, -15, and -10 dBm respectively. Due to
the reduced numbers of broadcast Hello packets and fewer
data packets forwarded by intermediate nodes, EPR results
in reduced network traffic load and overall energy con-
sumption as shown in Fig. 10b and c respectively.
Figure 10b shows that the traffic load reduction in EPR as
compared to DMQoS is 40, 47, and 47 % when the
transmit power is -25, -15, and -10 dBm respectively.
The network traffic load in noRouting is almost double
than the EPR for all three transmit powers. The saved
energy by all nodes in EPR is 93, 201 and 216 mJ for the
transmit power of -25, -15 and -10 dBm respectively as
shown in Fig. 10d. The buffer overflow due to traffic
congestion is negligible in EPR when compared to DMQoS
and noRouting as shown in Fig. 10e. The consequent
reduction in overall reduced BAN traffic load increases the
probability of successful data transmission. The amount of
data packets received by the destination (i.e. successful
transmission rate) is shown in Fig. 10f. The successful
transmission rate in EPR as compared to DMQoS is
increased by 6, 11 and 13 % when the transmit power is
-25, -15 and -10 dBm respectively. EPR delivers 19, 40,
and 39 % more packets than noRouting for transmit power
of -25, -15, and -10 dBm respectively. We observed
that EPR delivered more packets successfully than DMQoS
and noRouting.
Scenario 2: The devices (BANs) B1, B2, B3, and B4 are
considered as source nodes and devices (NSC and MDCs)
are the destination nodes. B1 sends packets to MDC1, B2
sends packets to MDC2, B3 sends packets to MDC3, and B4
sends packets to NSC. The data of B4 has to go through the
other devices to reach NSC. The source nodes send a total
of 80 K packets. The successful transmission rate, buffer
overflow, packets forwarded by intermediate nodes, traffic
load, and overall energy consumption are calculated after
every 4,000 packets until 28 K are transmitted and there-
after when 40, 60, and 80 K packets are sent by all BANs.
Figure 11 shows that the EPR provides better results of the
successful transmission rate for all the three transmit
powers i.e. -25, -15, and -10 dBm.
From Fig. 11a it is observed that for low transmit power
of -25 dBm, EPR maintain its throughput from 67 to 76 %
whereas DMQoS provides throughput from 61 to 67 % and
noRouting has 47–51 %. When transmit power is -15 and
-10 dBm, as shown in Figs. 11b and c, EPR provides
consistently successful transmission rate of 95 %. Whereas
DMQoS has a successful transmission rate ranging from 83
to 88 % and 82 to 88 % for the transmit power of -15 and
-10 dBm, respectively. The successful transmission rate
of noRouting is 56–66 % for both transmit powers (i.e.
-15 and -10 dBm).
Figure 12 shows the number of packets forwarded by
intermediate nodes. In EPR protocol, when the transmit
power is -25 dBm and for 4–80 K packets sent from
source nodes, 332–7,843 packets are forwarded by the
intermediate nodes. In comparison, the intermediate nodes
in DMQoS and noRouting forward 2.5–55.5 and
4.5–97.7 K packets respectively as shown in Fig. 12a.
Table 1 Parameters information
Deployment
Area 9 m 9 9 m
Deployment type Case 1 and 2: All nodes are static
Case 3: NSC and MDCs are fixed
but BANs are movable
Number of nodes 4 BANs, 3 MDCs, 1 NSC
Initial node locations NSC (0,1), MDC1 (0,5), MDC2 (0,3),
MDC3 (1,3), B1 (2,3), B2 (3,5), B3 (3,0),
B4 (6,3)
Initial node energy 18720 J (=2 AA batteries)
Buffer size 32 packets
Link layer trans. rate 250 kbps
Transmit power Different transmission power
(-10, -15, -25 dBm)
Reception power 7 dBm
Task
Application type Event—driven
Max. packet size 32 Bytes
Traffic type CBR (Constant Bit Rate)
MAC
IEEE 802.15.4 Default values
Simulation
Time 2003 Seconds including 3 s for nodes
initialization (simulation results are
the average of three rotations)
Table 2 Overall energy consumption during construction and
update of the routing tables
Transmit power (dBm) EPR (mJ) DMQoS (mJ)
-25 10,930 10,928
-15 11,016 11,013
-10 11,033 11,043
Z. A. Khan et al.
123

Unlike DMQoS (Razzaque et al. 2011) which sends the
data to the closest neighbor node, EPR chooses the most
appropriate next hop. The BAN coordinator in the pro-
posed EPR sends data to another BAN coordinator only if
it is necessary. The BAN coordinators send the data
packets directly to the destinations when the transmit
power is -15 dBm or higher. Figure 12b and c show that
the number of packets forwarded by intermediate nodes in
EPR is zero as compared to DMQoS and noRouting in
which the intermediate nodes forward 4–87 K and
6.5–160 K packets respectively, for the same 4–80 K
packets sent by the source nodes. Some of the BANs must
send the data packets to the destination through an inter-
mediate node for transmit power less than -15 dBm. The
exchange of Hello packets is used to update the routing
table of the nodes. The number of Hello packets and the
number of packets forwarded by the intermediate nodes
effect the total network traffic load. The mechanism of
EPR reduces the number of Hello packets and data packets
forwarded by intermediate nodes which results in lower
traffic load than DMQoS as shown in Fig. 13.
For 80 K packets, EPR generates about 37, 52 and 52 %
less network traffic when transmit powers of -25, -15 and
-10 dBm are used respectively, compared to DMQoS. The
network traffic load generated by noRouting is more than
double of EPR generated traffic load for all transmit
powers. Figure 13a compares the performance of EPR and
DMQoS in terms of traffic load. It is seen that EPR has a
0–27 % lower traffic load for the low to high offered traffic
when the transmit power is -25 dBm. Due to the lower
transmit power; more data packets need to go through the
intermediate nodes before reaches to destination node.
Fig. 10 Performance comparisons for different parameters
A new patient monitoring framework and EPR for BAN
123

Figure 13b and c show that EPR consistently reduces the
network traffic by 52 % for all offered traffic when the
transmit powers are -15 and -10 dBm.
The buffer overflow as a function of offered traffic is
shown in Fig. 14. The Figs. 14a shows that there is no
buffer overflow in EPR for all transmit powers. DMQoS
performs well for transmit power of -25 dBm by not
having any buffer overflow. However, for high transmit
powers of -15 and -10 dBm, due to the traffic congestion,
MAC buffer overflow causes 0.7–22 K packets to be
dropped in EPR and 0.9–15 K packets dropped in DMQoS
as shown in Figs. 14b and c. EPR drops 16–38 % less
packets than DMQoS for low to medium–high traffic load.
The packets dropped in noRouting are very high for all
transmit powers. EPR performs well in terms of packets
dropped for low transmit power. The recommended trans-
mit power of BAN nodes in hospital environment is
-25 dBm.
Scenario 3: In this scenario, the source node B4 is
moving at the speed of 1 m/s vertically. The successful
transmission rate, forwarded packets by intermediate
Fig. 11 Successful transmission rates as a function of offered traffic
Fig. 12 Packets forwarded by intermediate nodes as a function of
offered traffic
Z. A. Khan et al.
123

nodes, traffic load, and MAC buffer overflow are observed
during the simulations of this scenario. The transmit power
used for this scenario is -25 dBm. Once again, it is
observed that EPR provides better results than DMQoS and
noRouting in case of mobile source node. Figure 15a
shows that EPR has 70–82 % successful transmission rate
as compared to 63–66 % of DMQoS and 47–51 % of
noRouting. In EPR, the intermediate nodes forwards very
low packets which reduce the traffic load as shown in
Fig. 15b and c. Figure 15d shows that there is no any
packet drops due to the MAC buffer overflow. Only few
packets are drops in DMQoS whereas 2.15 K packets are
dropped in noRouting. In summary, EPR outer performs
DMQoS and noRouting when the source node is mobile.
6 Conclusions
In this paper we have proposed a novel patient monitoring
framework (ZK-BAN) for the indoor hospital BAN
Fig. 13 Traffic load as a function of offered traffic
Fig. 14 Buffer overflow as a function of offered traffic
A new patient monitoring framework and EPR for BAN
123

environment, and a new Energy-aware Peering Routing
protocol (EPR) which includes three parts (1) the new Hello
protocol, (2) neighbor table construction algorithm, and (3)
routing table construction algorithm. The new Hello pro-
tocol and the technique used to choose the next hop that
considers both residual energy and geographic information
of the neighbor nodes, thereby reducing the traffic load and
energy consumption while simultaneously increasing the
number of packets successfully received by the destina-
tions. We have performed extensive simulations in the
OMNeT?? based Castalia simulator for three scenarios
with fixed and variable number of packets to test our pro-
tocol. Both static and mobile patient scenarios are consid-
ered. The results show that for different transmit powers the
EPR reduces average traffic load by 44 %, and the number
of packets received successfully by the destinations has
increased on average by 20 % for transmit powers of -15
and -10 dBm. The energy saved in EPR is on average 93,
201 and 216 mJ for the transmit power of -25, -15, and
-10 dBm respectively, in 120 s. There is no buffers over-
flow at the intermediate nodes in EPR for very low transmit
power of -25 dBm in both static and mobile scenarios.
EPR consistently reduces the network traffic by 53 % for all
offered traffic when the transmit power is -15 and
-10 dBm. These results signify that our proposed protocol
has better performance compared to similar protocols.
References
Agarwal S, Divya, Pandey GN (2010) SVM based context awareness
using body area sensor network for pervasive healthcare mon-
itoring. In: Proceedings of the First International Conference on
Intelligent Interactive Technologies and multimedia (IITM ‘10),
Allahabad, India
Amoretti M, Copelli S, Wientapper F, Furfari F, Lenzi S, Chessa S
(2013) Sensor data fusion for activity monitoring in the
PERSONA ambient assisted living project. J Ambient Intell
Human Comput 4(1):67–84
Anton P, Munoz A, Mana A, Koshutanski H (2012) Security-
enhanced ambient assisted living supporting school activities
during hospitalisation. J Ambient Intell Human Comput
3(3):177–192
Chen M, Kwon T, Choi Y (2006) Energy-efficient differentiated
directed diffusion (EDDD) for real-time traffic in wireless sensor
networks. Elsevier Comput Commun 29(2):231–245
Chen M, Leung V, Mao S, Yuan Y (2007) Directional geographical
routing for real-time video communications in wireless sensor
networks. Comput Commun (JCC) 30(17):3368–3383
Chen M, Kwon T, Mao S, Yuan Y, Leung V (2008) Reliable and
energy-efficient routing protocol in dense wireless sensor
networks. Int J Sensor Netw 4(1/2):104–117
Chen M, Leung V, Mao S, Xiao Y, Chlamtac I (2009) Hybrid
geographical routing for flexible energy-delay trade-offs. IEEE
Trans Veh Technol 58(9):4976–4988
Chen M, Gonzalez S, Vasilakos A, Cao H, Leung VCM (2010) Body
area networks: a survey. ACM/Springer Mobile Networks and
Applications (MONET) 16(2):171–193
Curtis D, Shih E, Waterman J, Guttag J, Bailey J, Stair T, Ohno-
Machado L (2008) Physiological signal monitoring in the
waiting areas of an emergency room. In: Proceedings of the
Fig. 15 Performance comparisons for different parameters when
BAN is mobile
Z. A. Khan et al.
123

ICST 3rd international conference on Body area networks
(BodyNets ‘08), Arizona, USA
Felemban E, Lee CG, Ekici E (2006) MMSPEED: multipath multi-
SPEED protocol for QoS guarantee of reliability and timeliness
in wireless sensor networks. IEEE Trans Mobile Comput
5(6):738–754
Gao T, Massey T, Selavo L, Crawford D, Chen B-r, Lorincz K, Welsh
M (2007) The advanced health and disaster aid network: a light-
weight wireless medical system for triage. IEEE Trans Biomed
Circuits Syst 1(3):203–216
Huang X, Fang Y (2008) Multiconstrained QoS multipath routing in
wireless sensor networks. Wirel Netw 14(4):465–478
IEEE, 8. T. (2007, November) IEEE 802.15 WPANTM Task Group 6
(TG6) Body Area Networks. (IEEE standards) Retrieved 20 Nov
2012. http://www.ieee802.org/15/pub/TG6.html
Jiang S, Cao Y, Lyengar S, Kuryloski P, Jafari R, Xue Y, Wicker S
(2008) CareNet: an integrated wireless sensor networking
environment for remote healthcare. In: Proceedings of ICST
3rd international conference on body area networks (BodyNets
‘08), Tempe, Arizona, USA
Kim D-Y, Cho J (2009) WBAN meets WBAN: smart mobile space
over wireless body area networks. In: IEEE 70th Vehicular
Technology Conference Fall (VTC 2009-Fall), Anchorage,
Alaska, USA
Ko J, Lu C, Srivastava M, Stankovic J, Terzis A, Welsh M (2010)
Wireless sensor networks for healthcare. Proc IEEE
98(11):1947–1960
Liang X, Balasingham I, Byun S-S (2008) A reinforcement learning
based routing protocol with QoS support for biomedical sensor
networks. In: First International Symposium on Applied Sci-
ences on Biomedical and Communication Technologies, 2008.
ISABEL ‘08, Aalborg, Denmark
NICTA (2011, March) Castalia. (National ICT Australia) Retrieved
28 Sept 2012. http://castalia.npc.nicta.com.au
Razzaque M, Alam M, Rashid M, Hong C (2008) Multi-constrained
QoS geographic routing for heterogeneous traffic in sensor
networks. In: The 5th IEEE Consumer Communications and
Networking Conference (CCNC 2008), pp 2589–2601, Kyung
Hee University, Seoul
Razzaque MA, Hong CS, Lee S (2011) Data-centric Multiobjective
QoS-aware routing protocol for body sensor networks. Sensors
11(1):917–937
Ugolotti R, Sassi F, Mordonini M, Cagnoni S (2013) Multi-sensor
system for detection and classification of human activities.
J Ambient Intell Human Comput 4(1):27–41
Wood A, Virone G, Doan T, Cao Q, Selavo L, Wu Y, Stankovic J
(2006) ALARM-NET: wireless sensor networks for assisted-
living and residential monitoring. Department of Computer
Science, University of Virginia, Virgina
Xu J, Liu W, Lang F, Zhang Y, Wang C (2010) Distance
measurement model based on RSSI in WSN. Wirel Sens Netw
2(8):606–611. doi:10.4236/wsn.2010.28072
Zhen B, Patel M, Lee S, Won ET, Astrin A (2011) 15-08-0644-09-
0006-tg6-technical-requirements (IEEE Project: IEEE P802.15
Working Group for Wireless Personal Area Networks
(WPANs)). Retrieved 28 Sept 2012, from IEEE: http://mentor.
ieee.org/802.15/dcn/11/15-11-0307-00-0006-tg6-closing-report-
march-2011.ppt
A new patient monitoring framework and EPR for BAN
123