a novel device for mr foot perfusion stress testing
TRANSCRIPT

Washington University in St. Louis Washington University in St. Louis
Washington University Open Scholarship Washington University Open Scholarship
Engineering and Applied Science Theses & Dissertations McKelvey School of Engineering
Summer 8-17-2017
A Novel Device for MR Foot Perfusion Stress Testing A Novel Device for MR Foot Perfusion Stress Testing
David John Muccigrosso Washington University in St. Louis
Follow this and additional works at: https://openscholarship.wustl.edu/eng_etds
Part of the Engineering Commons
Recommended Citation Recommended Citation Muccigrosso, David John, "A Novel Device for MR Foot Perfusion Stress Testing" (2017). Engineering and Applied Science Theses & Dissertations. 249. https://openscholarship.wustl.edu/eng_etds/249
This Thesis is brought to you for free and open access by the McKelvey School of Engineering at Washington University Open Scholarship. It has been accepted for inclusion in Engineering and Applied Science Theses & Dissertations by an authorized administrator of Washington University Open Scholarship. For more information, please contact [email protected].

WASHINGTON UNIVERSITY IN ST. LOUIS
School of Engineering and Applied Science
Department of Biomedical Engineering
Thesis Examination Committee:
Jie Zheng, Chair
Mark Anastasio
Patricia Widder
A Novel Device for MR Foot Perfusion Stress Testing
by
David John Muccigrosso
A thesis presented to the School of Engineering
of Washington University in St. Louis in partial fulfillment of the
requirements for the degree of
Master of Science in Biomedical Engineering
August 2017
St. Louis, Missouri

© 2017, David John Muccigrosso

ii
Contents
List of Figures …………………………………………………………………………………. iii
List of Tables …………………………………………………………………………………... iv
List of Abbreviations …………………………………………………………………………... v
Acknowledgements ……………………………………………………………………………. vi
Dedication ……………………………………………………………………………………... vii
Abstract ………………………………………………………………………………………. viii
1 Background …………………………………………………………………………….. 1
1.1 Overview of Diabetes Mellitus ………………………………………………….. 1
1.2 Foot Ulcers & Diabetic Neuropathy …………………………………………….. 1
1.3 Foot Perfusion Imaging of the Microcirculation ………………………………... 3
1.4 Objective ………………………………………………………………………… 4
2 Materials & Methods …………………………………………………………………... 5
2.1 Foot Perfusion Stress Device ……………………………………………………. 5
2.2 Study Design …………………………………………………………………….. 9
2.3 Raw Data Analysis ……………………………………………………………... 11
2.4 Statistical Analysis ……………………………………………………………... 14
3 Results …………………………………………………………………………………. 16
3.1 Pressure-Voltage Curve ………………………………………………………... 16
3.2 Evaluation Study ……………………………………………………………….. 17
4 Discussion ……………………………………………………………………………... 26
4.1 Device Design ………………………………………………………………….. 26
4.2 Statistical Analysis ……………………………………………………………... 29
5 Conclusion …………………………………………………………………………….. 33
References ……………………………………………………………………………………... 35

iii
List of Figures
Figure 1 .………………………………………………………….…………………...…………. 2
Figure 2 .………………………………………………………….…………………...…………. 6
Figure 3 .………………………………………………………….…………………...…………. 7
Figure 4 .………………………………………………………….…………………...…………. 8
Figure 5 .………………………………………………………….…………………...………... 10
Figure 6 .………………………………………………………….…………………...………... 11
Figure 7 .………………………………………………………….…………………...………... 12
Figure 8 .………………………………………………………….…………………...………... 13
Figure 9 .………………………………………………………….…………………...……....... 16
Figure 10 ...……………………………………………………….…………………...………... 18
Figure 11 ...……………………………………………………….…………………...………... 19
Figure 12 ..…………………………………………………….…………………...………........ 20
Figure 13 ..…………………………………………………….…………………...………........ 21
Figure 14 ...……………………………………………………….…………………...………... 23
Figure 15 ...……………………………………………………….…………………...………... 24
Figure 16 ...……………………………………………………….…………………...………... 25
Figure 17 ...……………………………………………………….…………………...………... 27

iv
List of Tables
Table 1 ………………………………………………………………………………….………. 17
Table 2 ………………………………………………………...………………………………... 22

v
List of Abbreviations
DAQ Data Acquisition
GUI Graphical User Interface
MVC Maximum Vulnerable Contraction
TC Calibration Time
CB Calibrated Baseline
CM Calibrated Maximum
TCM Time until Calibrated Maximum
CEP Calibrated Exerted Pressure
QC Quality Calibration
TS Total Scan time
TSS Time until Stable Stress
TPSS Time Post Stable Stress
%TiRPSS Percent Time in Range Post Stable Stress
EPSS Exerted Pressure during Stable Stress
MEPSS Mean Exerted Pressure during Stable Stress
VEPSS Variance of Exerted Pressure during Stable Stress
SSEEPSS Sum of Squared Errors of Exerted Pressure during Stable Stress
TEP Target Exerted Pressure
%VAR(SI) Percent Variance of Signal Intensity
SMBF Skeletal Muscle Blood Flow
T Training scan
P1 Perfusion (stress) scan 1
P2 Perfusion (stress) scan 2
R1 Rest scan 1
R2 Rest scan 2

vi
Acknowledgments
I would like to thank Jie Zheng for helping me build my career and motivating this research; all
of my professors and advisors who got me through pre-med and grad school; Jasmine Park for
helping me figure out how to work a sewing machine; Zack Marlow and Professor Ramesh
Agarwal for their help on the leak modeling, Washington University for providing me this
unique opportunity; my family – especially Mom, Dad, and Grandma – for all of the blessings
they have given me throughout my life; my stepbrother Phil, for picking up the slack at home;
and Beth for her patience, support, and for always demanding the best from me.
This research was funded by NIH grant 5R01DK105322
David Muccigrosso
Washington University in St. Louis
August 2017

vii
For Beth.

viii
ABSTRACT OF THE THESIS
A Novel Device for MR Foot Perfusion Stress Testing
by
David John Muccigrosso
Master of Science in Biomedical Engineering
School of Engineering Arts and Sciences
Washington University in St. Louis, 2017
Professor Jie Zheng, Chair
Foot ulcers are a serious complication of diabetes mellitus (DM). Perfusion impairment
in muscles and bone below the ulcer strongly predicts wound healing, but no modalities can
currently probe deeply enough into the foot to adequately assess perfusion. We developed and
validated an MR-compatible device for quantitative, noninvasive regional perfusion
measurement in the diabetic foot. We conducted an evaluation study with 4 control and 9
DM/ulcer patients, and developed statistical measures to quantify subject performance. Subjects
successfully achieved consistent exertion during stress MR scans, as measured by a strong
correlation between their mean exerted pressure and the target pressure. DM patients had
significantly elevated skeletal muscle blood flow (SMBF) over controls, and higher exerted
pressure variance from target. Areas of future improvement were identified. This device is a
promising step towards clinical MR foot perfusion stress testing that may lead to improved
diagnostics and treatment for diabetic foot ulcer diagnostics.

1
1. Background
1.1 OVERVIEW OF DIABETES MELLITUS
Diabetes mellitus (DM) is a progressive metabolic disease that is primarily characterized
by two types - innate insulin deficiency (I) and acquired insulin resistance (II). It affected 29.1
million Americans in 2012, and there are 1.4 million new diagnoses annually; DM and its
complications are the 7th leading cause of death as well [1]. Foot ulcerations are among the more
serious complications of DM, and between 15-25% of DM patients will develop an ulcer or
require a hospitalization because of one in the course of their disease [1, 2]. For the purposes of
this study, we will focus on perfusion abnormalities in the ulcerated diabetic foot.
1.2 FOOT ULCERS
A foot ulcer is defined as a breakdown in the skin of the foot, which may extend into the
subcutaneous tissue, bone, and even muscle. The prime contributors to ulcer formation and
impaired ulcer healing in the diabetic foot are: neuropathy, biomechanical pressure,
microtrauma, infection, immune cellular dysfunction and impaired regional perfusion. Impaired
regional perfusion results in decreased delivery of oxygen, nutrients, and immune cells critical to
wound bed healing [3, 4]. Impaired regional perfusion also contributes to diabetic neuropathy,
which may play a reciprocal role by causing arteriolar constriction. The extension of the wound
bed well into the dermis and muscles of the foot is evidence for the importance of skeletal
muscle perfusion to ulcer formation [5]. In patients with DM, reduced capillary size and
basement membrane thickening cause impaired resting perfusion and/or vasodilatory response to
challenge [6]. Using intra-arterial injections of radioactive microspheres, it was found that ulcers

2
healed in 90% of patients with high lesion perfusion, versus only 10% of ulcers that healed in
patients with low lesion perfusion [7]. In a study of 2511 diabetic foot ulcer patients, 48.8% were
ischemic; amputation was associated with peripheral vascular disease (PVD) and ulcer type, but
not age, sex, duration of diabetes, neuropathy, deformity, or duration of ulcer [4]. Importantly,
ulcers are often associated with diffuse and/or distal capillary narrowing, rendering them
unsuitable for revascularization surgery. This subset of patients may receive prolonged medical
treatment with no guarantee of wound-healing success. If the disease escapes control and
becomes life-threating, amputation is inevitable. Taking all of these studies together, a
generalized model of the impact of regional perfusion on diabetic foot ulceration can be
illustrated (Figure 1).
Figure 1. The central role of wound perfusion on the development and healing of pedal wounds
in diabetics.

3
1.3 FOOT PERFUSION IMAGING OF THE MICROCIRCULATION
Macrocirculation in the peripheral vascular system can be measured using standard
angiographic techniques (X-ray, CT, MR), but is not a complete measure of regional perfusion.
Direct assessment of the microcirculation is a key to early detection of decreased perfusion in
identifying patients with poor ulcer healing and high amputation risk. Traditionally,
microcirculation is assessed using ankle/brachial index (ABI) or toe pressure [8],
plethysmography [9, 10], capillaroscopy [11, 12], thermography [13], laser doppler flowmetry
(LDF) [14], laser doppler Imaging (LDI) [15], transcutaneous oximetry (TcPO2) [16], skin
perfusion pressure [17], or orthogonal polarization spectral imaging [18]. Although these
techniques (except toe pressure, which assesses microvasculature) assess either focal skin
perfusion or oxygenation (< 3 mm depth), they have relatively low spatial resolution, reliability,
and sensitivity, and provide little information on regional perfusion or oxygenation in deep
skeletal muscle [19]. TcPO2 has been used to assess skin perfusion and oxygenation in the
diabetic foot for amputation level selection [20, 21]. A hyperspectral imaging technique was
used to observe a decrease in oxyhemoglobin at ulceration sites, and an increase in
oxyhemoglobin around the ulcer as it healed and closed [22]. However, these results are
qualitative and greatly influenced by many factors that inhibit the transmission of oxygen,
including obesity, subcutaneous inflammation, and swelling; and which are often seen in
ulcerated diabetic feet. In a comparative study with control subjects, subjects with DM and foot
ulcers, and subjects with DM and without foot ulcers, neither TcPO2 nor microvascular
hyperemic responses in the skin were able to discriminate between individuals with or without
ulceration [23]. Conversely, it is reasonable to assume that the changes related specifically to

4
diabetes would be identifiable in muscle tissue. In an early study, an intra-arterial injection of
99mTc-macroaggregated albumin was performed in patients with DM and foot ulcers [24]. This
perfusion technique allowed evaluation of the whole capillary circulation in the foot. It was
found that normal or increased perfusion muscle near the ulcer was significantly associated with
successful healing (26/35 healed ulcers), whereas poor local muscle perfusion was always
associated with non-healing ulcers (5/5 non-healed ulcers). However, this technique suffers from
low spatial resolution, the use of radiation, and invasive intra-arterial injection. Using a high-
resolution 31P-MR spectroscopy technique [25], the Pi/PCr ratio was observed to significantly
increase in the metatarsal head muscle region in diabetic patients with and without neuropathy,
versus normal controls. This result indicated reduced energy reserve and/or oxygen supply in the
muscle of the diabetic foot. Taken together, these studies suggest that perfusion assessment of
the bone and/or muscle tissue beneath the ulcer may be equally or more important in predicting
ulcer healing than perfusion assessment of the boundary area around the wound bed.
1.4 OBJECTIVE
The ultimate goal of this research was to create more accurate methods than the current
standard of care for the diagnosis and risk stratification of DM patients with foot ulcers. An MR
perfusion test would allow for spatially localized, accurate, and noninvasive measurement of the
ulcerative wound bed without ionizing radiation. The result would be an efficient and informed
wound management plan that minimizes the patient and medical system burden. One strategy to
assess whether tissue perfusion is adequate is to measure perfusion during the stress. This is
because the rest perfusion value may not change for mild and moderate disease conditions, and

5
can be too small to measure accurately. Stress perfusion, on the other hand, can reveal perfusion
impairment in damaged or diseased tissues.
In our previous work, we have developed MR methods for quantitative skeletal muscle
blood flow (SMBF) mapping in calf, using arterial spin labeling (ASL) MR techniques [26, 27,
28, 29]. The stress in calf imaging was induced by isometric flexion of a foot on a pedal with
specified resistance using a custom-made MRI compatible exercise system. Since foot perfusion
stress testing is a special challenge due to the anatomy of the foot muscles, we set out to develop
a method for inducing localized and non-pharmacological stress, while quantifying foot
perfusion with our MR perfusion techniques.
2. Materials & Methods
2.1 Foot Perfusion Stress Device
The device had 4 components: 1) the foot assembly, 2) pneumatic pressure sensor, 3)
digital gauge and DAQ, and 4) laptop, projector, and custom software.
The foot assembly was essentially a large housing of clear plastic boards for the subject’s
foot, the MR coil, and the sensor. It was produced by the Washington University School of
Medicine’s machine shop with input from Prof. Zheng, Professors from Physical Therapy
(Professor Michael Mueller and Mary Hastings), and myself. Later redesigns used the Autodesk
Inventor Student Edition to incorporate a number of ideas for improvement. The foot device
consisted of a base, and an insert mounted with an adjustable sensor stage (Figure 2A). The

6
clearance between the insert and base was designed to ensure that the MR coil and sensor bulb
could fit comfortably and stably around the foot to maximize RF reception. The stage had several
axes of freedom to accommodate varying foot geometry. It featured a bar for the toes to curl
around, ensuring that the correct muscle would be exercised.
The sensor was a rubber half-bulb (Figure 2B). The bulb was mated to a plastic tube and
a coupler, with all joints sealed and tested for airtightness.
Figure 2. Photos of (A) foot assembly, (B) sensor bulb, (C) gauge and DAQ circuitry, and (D)
feedback GUI interface.
The other end of the coupler was connected to an assembly of ¼’ brass pipe fittings to
form a sealed system between the coupler, digital gauge, and air inlet valve. The number of
A B
C D
7
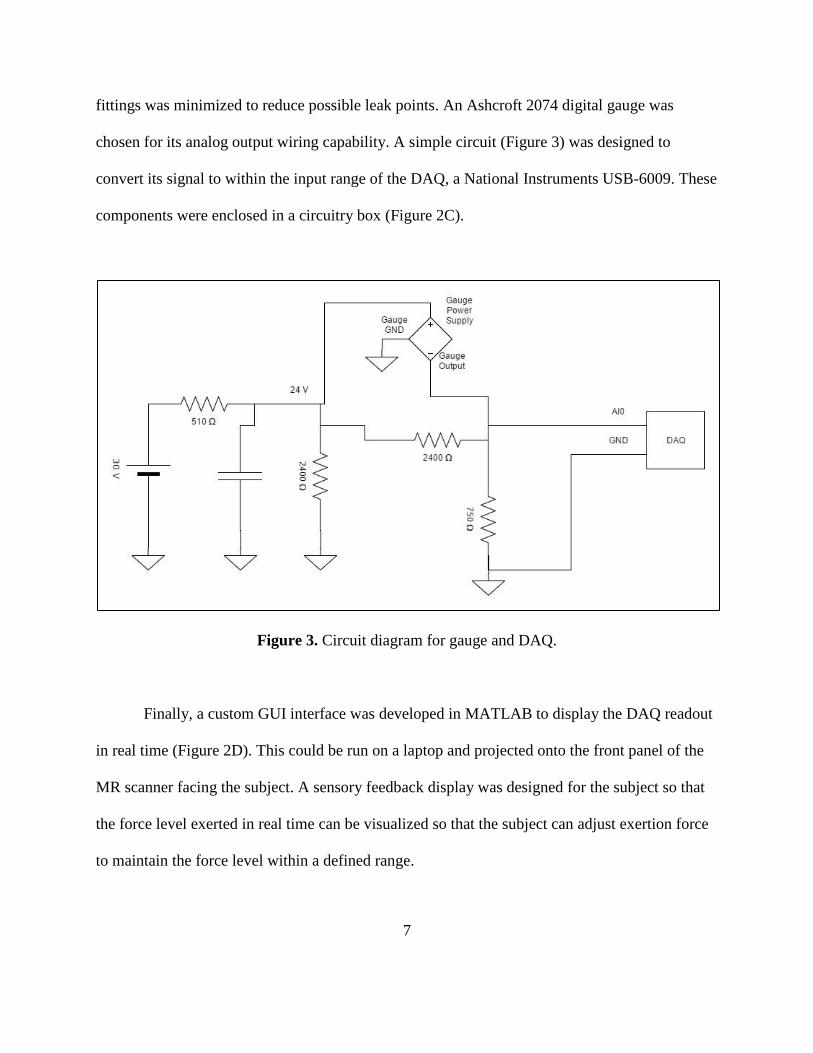
fittings was minimized to reduce possible leak points. An Ashcroft 2074 digital gauge was
chosen for its analog output wiring capability. A simple circuit (Figure 3) was designed to
convert its signal to within the input range of the DAQ, a National Instruments USB-6009. These
components were enclosed in a circuitry box (Figure 2C).
Figure 3. Circuit diagram for gauge and DAQ.
Finally, a custom GUI interface was developed in MATLAB to display the DAQ readout
in real time (Figure 2D). This could be run on a laptop and projected onto the front panel of the
MR scanner facing the subject. A sensory feedback display was designed for the subject so that
the force level exerted in real time can be visualized so that the subject can adjust exertion force
to maintain the force level within a defined range.

8
The voltage time series data was autosaved in a “.mat” and a “.xlsx” file after each
acquisition. A 5-pole median averaging filter step was used to smooth out the raw voltage curve
to prevent system noise from creating a positive feedback loop with the subject – like an airline
pilot overcorrecting previous inputs in reaction to a single perturbation. The two main acquisition
modes were already mentioned: “calibration” and “scan”. Calibration mode calculated a baseline
voltage from the average of the first five seconds, and then used a max value to determine the
maximal contraction force or maximal vulnerable contraction (MVC) (Figure 4A). Scan mode
presented a force range displayed with two red dashed lines at a specified fraction above and
below a percentage of the calibrated max (Figure 4B). These percentages were adjustable, but
were each set at 20% for the entirety of this study, i.e., at 20% MVC. The sampling rate was also
adjustable; originally scans were sampled at 5 Hz, but this was later increased in to 20 Hz to
reduce the delay induced by the median averaging filter.
Figure 4. (A) Calibration mode. (B) Scan mode.
A B

9
2.2 Study Design
The study consisted of two main elements: a validation experiment to ensure that the
stress device was properly working, and an evaluation study in subjects using the stress device.
In the validation experiment, two tests were performed. The first was leak testing to ensure that
the pneumatic parts of the device were adequately sealed. The second test was to create a
pressure-voltage curve between the pressures measured by the digital gauge and the voltages
measured by the DAQ circuits. The pneumatic sensor bulb was pressurized to 4 psi, and then
allowed to slowly deflate to 1 psi while acquiring voltage data in real time.
The evaluation study was approved by the Institutional Review Board at Washington
University in Saint Louis. For the study, 13 subjects were recruited: 4 were healthy controls and
the other 9 were DM patients with and without ulcers. All subjects were scanned on a Siemens
Trio 3T system in the Center for Clinical Imaging Research of the Mallinckrodt Institute of
Radiology at Washington University School of Medicine.
The study protocol consisted of a training stage, then scout and rest imaging for three
slices (3 min), and finally the stress test portion (3 min).
10
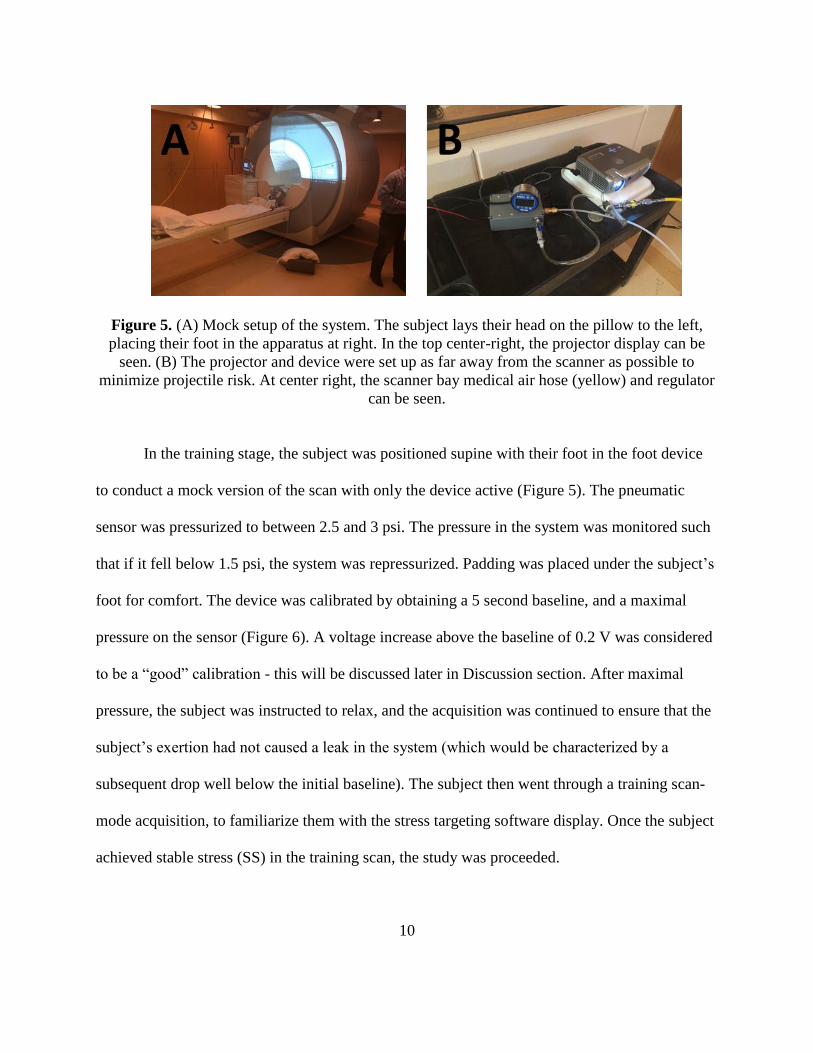
Figure 5. (A) Mock setup of the system. The subject lays their head on the pillow to the left,
placing their foot in the apparatus at right. In the top center-right, the projector display can be
seen. (B) The projector and device were set up as far away from the scanner as possible to
minimize projectile risk. At center right, the scanner bay medical air hose (yellow) and regulator
can be seen.
In the training stage, the subject was positioned supine with their foot in the foot device
to conduct a mock version of the scan with only the device active (Figure 5). The pneumatic
sensor was pressurized to between 2.5 and 3 psi. The pressure in the system was monitored such
that if it fell below 1.5 psi, the system was repressurized. Padding was placed under the subject’s
foot for comfort. The device was calibrated by obtaining a 5 second baseline, and a maximal
pressure on the sensor (Figure 6). A voltage increase above the baseline of 0.2 V was considered
to be a “good” calibration - this will be discussed later in Discussion section. After maximal
pressure, the subject was instructed to relax, and the acquisition was continued to ensure that the
subject’s exertion had not caused a leak in the system (which would be characterized by a
subsequent drop well below the initial baseline). The subject then went through a training scan-
mode acquisition, to familiarize them with the stress targeting software display. Once the subject
achieved stable stress (SS) in the training scan, the study was proceeded.

11
Figure 6. Diagram of calibration curve, scale slightly exaggerated for clarity.
The MR scan protocol began with traditional scout imaging and continued with rest
perfusion imaging. The specific MR sequence used for the perfusion imaging was an ASL
sequence that has been developed in our lab [28, 29]. Lastly, the stress imaging portion began
with recalibrating the device (due to the system’s intrinsic leak rate) and starting a new
acquisition scan. The subject was instructed to keep the stress targeting software display within
the range presented, and once they achieved SS for approximately 10-15 seconds, or if it
appeared that their reaching SS was unlikely due to either technical complications or DM-related
neurological deficit, the aforementioned MR protocol of perfusion imaging was begun.
Afterwards, the subject was removed from the scanner, the device acquisitions were backed up,
and the MR data was backed up. The MR scans were analyzed with custom software developed
in our lab.
2.3 Raw Data Analysis
For the pressure-voltage curve, two sets of data were obtained. The DAQ was run in
calibration mode starting at exactly 4.0 psi (read on the digital gauge) and allowed to leak until

12
exactly 1.0 psi, with no force exerted on the sensor. A smartphone (iPhone 7, iOS 10) stopwatch
was run simultaneous to the DAQ scan, starting at exactly 4.0 psi with the time noted for every
0.1 psi of pressure lost. This gave a large set of paired voltage-time measurements. Since the
pressure and voltage were recorded known at each time point on the stopwatch, a pressure-
voltage curve could be calculated, along with a trendline and R2 value.
The analysis of the evaluation study data was much more extensive. Several statistical
measures were identified and calculated for the testing of various hypotheses (Figure 7). For
calibrations, the measures included: calibration time (TC), calibrated baseline (CB), calibrated
maximum (CM), time to calibrated maximum (TCM), calibrated exerted pressure (CEP), and
quality calibration (QC). The calibrated exerted pressure was defined as CM - CB. A QC was
defined as whether CEP exceeded 0.2, which as mentioned earlier was observed to be a practical
predictor of subject performance.
Figure 7. Diagram of selected statistical measures.
CB
CM
TCM
CEP A
TPSS TSS
TEP B

13
For scan mode, the measures included: the total scan time (TS), time until stable stress
(TSS), time post stable stress (TPSS), percentage of time in range post stable stress (%TiRPSS),
exerted pressure during stable stress (EPSS) and its mean (MEPSS), variance (VEPSS), and sum
of squared errors (SSEEPSS), and target exerted pressure (TEP).
Lastly, the SMBF values were calculated using our custom-made perfusion mapping
software, the ImPro MR Analysis Suite, written in MATLAB. Because a simple ROI (region of
interest) variance measurement for each image would not have been meaningful, a composite
measure had to be developed, %VAR(SI) (Figure 8). This was due to the nature of the 4-average
ASL sequence used to acquire the MR images. Each set of 64 images was split into 4 averaging
groups of 16, which were further divided into equal sets of 8 slice-selective and non-slice-
selective frames. Each set of 8 images captured was a sample of a time point along a T1 recovery
curve; thus, both the mean signal level and variance are constantly changing from frame to
frame. Thus, the percent variance differences were calculated between each image in each set of
8 images and its corresponding other three averaging sets, and then averaged those eight values
together to create a total of 6 sequential %VAR(SI) values. Since 3 slices were obtained for each
4-minute rest or perfusion scan, this led to a total of 18 %VAR(SI) values.

14
Figure 8. Breakdown of %VAR(SI) calculation, as represented by the M values at the bottom,
for a single ASL slice.
2.4 Statistical Analysis
As mentioned, a number of hypothesis tests were done to answer specific questions about
the relationships between each measure. These questions break down into three broad groups:
training, performance, and perfusion. Unless stated otherwise, two-tailed Student’s t-tests were
performed for each hypothesis test, with homoscedasticity tested for each distribution based on
its variance. For correlations, measures were plotted and regressed against each other, with R2
values reported. Mean and standard deviations were calculated for all measures, but CM, CB,
TC, and TS were omitted from the rest of the analysis because they were not inherently related to
subject training or performance. The measures were grouped into three categories: calibration
(CEP, QC, TCM), performance (TSS, %TiRPSS, VEPSS, SSEEPSS), and perfusion
(%VAR(SI), SMBF).
For the training phase, we tested the hypothesis that there would be any significant
differences between the control and DM (C/DM) groups during training (T) for the relevant
measures – TC, CEP, and TSS. The same tests were run for the larger set of measures applicable
to each perfusion group (P1/P2), including TC, CEP, and the performance measures.
In analyzing performance, we broadly sought to find (1) trends in performance, (2)
correlations between calibrations and subsequent scan performance, and (3) links between
training and performance. The first (1) was done by comparing the TSS differences for T/P1 and

15
P1/P2 (TSS was the only measure calculated for T), testing for significant differences for C/DM
and P1/P2 with the other three performance measures (%TiRPSS, VEPSS, and SSEEPSS), and
plotting and regressing the correlation between MEPSS and TEP. The second (2) was done by
plotting and regressing P1/P2 calibration measures against the performance of the subsequent
scan. For CEP vs. VEPSS and CEP vs. SSEEPSS, the intercepts were set to zero for both
trendlines because linear regression would have predicted a negative intercept, which would not
have been meaningful for these measures; this reduced the R2 values as a result. For QC vs.
%TiRPSS, VEPSS, and SSEEPSS, we tested for significant differences between the QC=TRUE
and QC=FALSE sets within P1, P2, DM, and the global group (there were not enough
QC=TRUE degrees of freedom for C). The third (3) was done by plotting and regressing T
calibration measures against all P1/P2 calibration and performance measures. A special set of χ2-
tests was performed for the T QC vs QC of the P1/P2, C/DM, and global sets. Again, no
hypothesis tests could be done for C QC against any other measure.
For perfusion, we sought to (1) confirm perfusion elevation from the rest (R1/R2) to
stress state, and (2) identify correlations between perfusion and performance measures. The first
(1) was accomplished by testing for significant differences between R1/R2 and P1/P2 perfusion
measures, and further broke these tests down into the global and C/DM sets. Additionally, we
created a timewise boxplot of the absolute value of %VAR(SI) along its 18-point time course.
For the second (2), we plotted and regressed P1/P2 perfusion measures against performance
measures.

16
3. Results
There were 2 main results to report from this study: 1) the pressure-voltage curve, and 2)
the evaluation study analysis. It is noted that the air-bubble leak testing during the device
building process resulted in no visible leaks. Many results have been omitted due to lack of
significance; this will be noted where relevant.
3.1 Pressure-Voltage Curve
The linear model equation, below, summarizes the correlation that was found between
pressure and voltage (Figure 9), for which the R2 value was 0.9998:
𝑉𝑂𝐿𝑇𝐴𝐺𝐸 = 0.2587 (𝑉/𝑝𝑠𝑖) × 𝑃𝑅𝐸𝑆𝑆𝑈𝑅𝐸 + 5.6398 (𝑉) Equation 1
Figure 9. Pressure-voltage curve with trendline.
y = 0.2587x + 5.6398R² = 0.9998
5.8
5.9
6
6.1
6.2
6.3
6.4
6.5
6.6
6.7
6.8
0 0.5 1 1.5 2 2.5 3 3.5 4 4.5
Vo
ltag
e (V
)
Pressure (psi)
Pressure vs. Voltage

17
3.2 Evaluation Study
There were a total of n = 13 subjects. Table 1, below, gives a summary of the statistics
that were calculated from our DAQ and MR data.
n = 13 T P1 P2
TC (s) 19.8 ± 9.10 21.2 ± 5.51 19.9 ± 3.38
CB (V) 6.31 ± 0.046 6.13 ± 0.0858 6.10 ± 0.108
CM (V) 6.44 ± 0.114 6.30 ± 0.128 6.28 ± 0.136
TCM (s) 10.5 ± 2.36 15.0 ± 4.15 14.4 ± 3.25
CEP (V) 0.125 ± 0.090 0.163 ± 0.0718 0.188 ± 0.0828
QC 2 4 3
TS (s) 87.6 ± 51.6 317 ± 36.5 266 ± 17.7
TSS (s) 51.2 ± 54.1 33.1 ± 31.6 14.3 ± 5.09
%TiRPSS 78.7% ± 20.3% 86.3% ± 15.9%
MEPSS (V) 6.17 ± 0.0884 6.13 ± 0.110
VEPSS (V) 4.62E-5 ± 7.52E-5 6.84E-5 ± 1.18E-4
SSEEPSS (V) 0.0987 ± 0.152 0.0973 ± 0.164
%VAR(SI) -0.132 ± 3.19 -0.0138 ± 1.62
SMBF (ml/min/100g) 0.362 ± 0.195 0.260 ± 0.163
Table 1. Summary of mean ± standard deviation for each measure collected.
There were no significant differences for C/DM in the T and P1/P2 groups. TSS
improved from T/P1 to P1/P2, with p = 0.31 and 0.055, respectively. Removing the two most
extreme outliers lowered these to p = 0.17 and 0.055 each (no change). For the other

18
performance measures (Figure 10), %TiRPSS did not have any significant relationships, but
VEPSS had p = 0.026, and SSEEPS had p 0.020 in C/DM, respectively.

19
Figure 10. Boxplots of (A) %TiRPSS, (B) VEPSS, and (C) SSEEPSS) for P1/P2 and C/DM.
Dots are outliers.
The regression of TEP vs. MEPSS had an R2 of 0.97 (Figure 11).
Figure 11. Plot of global TEP vs. MEPSS.
y = 1.0003xR² = 0.9719
5.95
6
6.05
6.1
6.15
6.2
6.25
6.3
6.35
6.4
6.45
6.5
5.9 6 6.1 6.2 6.3 6.4 6.5
MEP
SS
TEP
Global TEP vs MEPSS

20
The correlations between calibration and subsequent scan performance were weak, and
thus their plots were omitted. The two strongest correlations were CEP vs. VEPSS and CEP vs.
SSEEPSS (Figure 12), with R2 values of 0.31 and 0.30, respectively.
Figure 12. (A) Plot of CEP vs. VEPSS. (B) Plot of CEP vs. SSEEPSS.
y = 0.0004xR² = 0.3061
0
0.00005
0.0001
0.00015
0.0002
0.00025
0.0003
0.00035
0.0004
0.00045
0 0.05 0.1 0.15 0.2 0.25 0.3 0.35 0.4
VEP
SS
CEP
(A) CEP vs VEPSS
y = 0.6734xR² = 0.3028
0
0.1
0.2
0.3
0.4
0.5
0.6
0.7
0 0.05 0.1 0.15 0.2 0.25 0.3 0.35 0.4
SSEE
PSS
CEP
(B) CEP vs SSEEPSS

21
There were several significant relationships found between QC and subsequent scan
%TiRPSS, VEPSS, and SSEEPSS in the P1, P2, DM, and global sets (Figure 13 and Table 2).

22
Figure 13. QC vs. %TiRPSS (A), vs. VEPSS (B), and vs. SSEEPSS (C).
QC vs. %TiRPSS VEPSS SSEEPSS
P1 0.19 0.39 0.43
P2 0.081 0.23 0.24
DM 0.033 0.11 0.13
GLOBAL 0.058 0.098 0.10
Table 2. QC vs. %TiRPSS, VEPSS, and SSEEPSS, for P1, P2, DM, and global groups, p-values.
The correlations for T calibration measures vs. P1/P2 were weak and thus their plots were
omitted. The only statistically significant t hypothesis tests were p = 0.078 for T QC vs. DM
CEP, and p = 0.041 and 0.061 for T QC vs. the global set VEPSS and SSEEPSS, respectively
(Figure 14). The most statistically significant χ2 result was p = 0.14 for T QC vs. C/DM QC.

23

24
Figure 14. Boxplots T QC vs. %TiRPSS (A), VEPSS (B), and SSEEPSS (C) for P1, P2, C, DM,
and global groups.
In our perfusion results, global P1/P2 SMBF was significantly elevated over that of
R1/R2 at a p = 0.0011 level (Figure 15). Similarly, P1/P2 SMBF was significantly elevated over
R1/R2 for both C and DM at p = 0.044 and 0.0094, respectively.

25
Figure 15. Boxplot of Rest vs. Stress SMBF.
There were no significant t-tests for global %VAR(SI). The timewise boxplot showed
higher variance between rest and stress values, and their variance also trended up towards the
end of the scan (Figure 16).
Figure 16. Timewise boxplot of %VAR(SI).
There were no significant correlations between the perfusion measures and performance
measures, and thus these plots were omitted.

26
4. Discussion
4.1 Device Design
The pneumatic sensor proved to be an effective approach. The advantage of pneumatics
was that they allow mechanical force to be measured while all electronic components to be well
beyond the range of RF or B-field interference. In fact, this is a common approach in other MR
compatible applications such as the emergency stop controls found in most scanner beds. A
number of ideas for the pneumatic sensor were entertained, including a bladder with a hinged
push panel, but ultimately the half-bulb design was settled on as the both most compatible with
the desired muscle action and easiest to find commercially available components for.
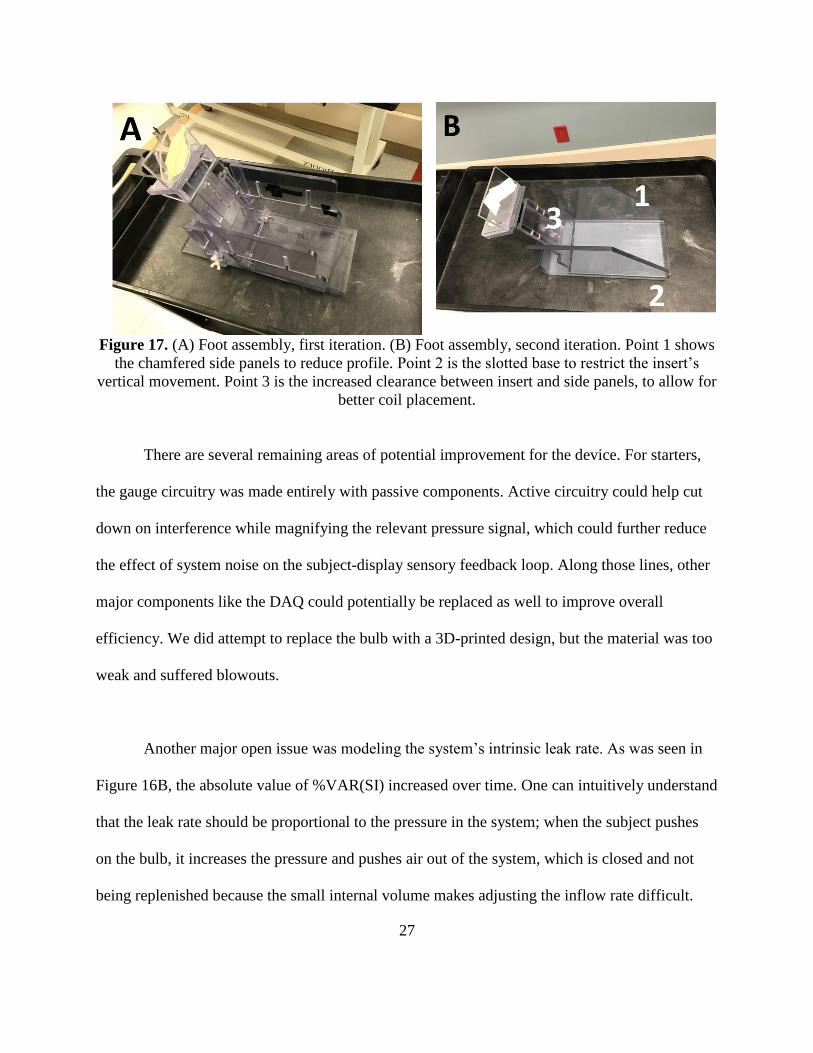
Numerous improvements based on our clinical experience have been performed with the
device. The photos in Figure 17A and 17B are annotated to point out some visible improvements
to the foot assembly. The improvements’ objectives were better biomechanical coupling, leak-
proofing, signal filtering, and “quality-of-life” software and hardware improvements, like a
newer-model laptop from which to control the device, dulled colors on the GUI to reduce subject
eyestrain, and fully integrating the sensor coupling, gauge and fittings, and DAQ circuitry
components into a single box.
27
Figure 17. (A) Foot assembly, first iteration. (B) Foot assembly, second iteration. Point 1 shows
the chamfered side panels to reduce profile. Point 2 is the slotted base to restrict the insert’s
vertical movement. Point 3 is the increased clearance between insert and side panels, to allow for
better coil placement.
There are several remaining areas of potential improvement for the device. For starters,
the gauge circuitry was made entirely with passive components. Active circuitry could help cut
down on interference while magnifying the relevant pressure signal, which could further reduce
the effect of system noise on the subject-display sensory feedback loop. Along those lines, other
major components like the DAQ could potentially be replaced as well to improve overall
efficiency. We did attempt to replace the bulb with a 3D-printed design, but the material was too
weak and suffered blowouts.
Another major open issue was modeling the system’s intrinsic leak rate. As was seen in
Figure 16B, the absolute value of %VAR(SI) increased over time. One can intuitively understand
that the leak rate should be proportional to the pressure in the system; when the subject pushes
on the bulb, it increases the pressure and pushes air out of the system, which is closed and not
being replenished because the small internal volume makes adjusting the inflow rate difficult.

28
Even if the system were being replenished, no inflow regulator could reactively respond in real
time to the increased leak rate during stress.
As a result, we suspect that as the perfusion scan goes on, the growing leak rate forces the
subject to exert more and more force, rather than achieving a constant level of exertion as would
be desired. Indeed, we noted several subjects with our prototype who saw severe leaking and
were unable to press hard enough to complete the 4-minute perfusion scans. After a
comprehensive leak-proofing effort in our latest iteration of the pneumatic system, this was
greatly reduced, but the system still leaks enough over any given 4-minute scan that the baseline
pressure – the equilibrium measurement when the subject is not exerting any force at all – was
often much lower after the scan than where it started.
Several attempts have been made to model this under first a Bernoulli model, and then an
effusion model, neither of which could accurately explain the exponential-like decay seen in the
voltage-time data from the validation experiment. We are currently consulting with one of the
faculty of the chemistry department at our institution to find a solution to this problem. The
ultimate goal would be to develop a model which would allow us to slowly adjust the display
window downwards throughout each 4-minute scan based on an estimate of the additional
amount of gas that has leaked due to the subject over that due to the intrinsic leak rate.
The last open question was how biomechanical coupling between the foot and the sensor
bulb can be improved. The original version of the stage had the bulb mounted at an angle and

29
could adjust up or down to accommodate subjects with different foot lengths, but this allowed
the subject to arch their entire foot, exerting their calf muscles, instead of forcing them to curl
their toes and exert the digital flexor muscles in the sole of the foot, as desired. The solution to
this, a tarsal curl bar and some restraining straps, have had some success, but introduced a new
problem: because the toes are oriented diagonally, not every toe can curl around the bar. As yet
we have been unable to devise a solution that can maintain the system’s ambipedal flexibility
and allow for rotation of the curl bar to accommodate the incline of the subject’s toe line.
4.2 Statistical Analysis
The experimentally determined pressure-voltage curve boasted the most significant
correlation coefficient of this entire research project. This result also agreed with the
manufacturer’s specifications.
The evaluation study was a small sample size, which likely reduced the power in finding
relationships between the various measures studied. Also because of this, it was not possible to
examine age, gender, or racial differences in the subject set. This was not likely to be a
confounding factor in training or performance measures, but epidemiologically-driven racial
differences and gender dimorphisms in the general subject population may play some small part
in stress testing response. A much larger, racially- and gender-representative study would be able
to rule out these unlikely factors, but at this stage of development, the cost would not be justified.
Each of the measures used in the statistical analysis was chosen because it could describe a
specific aspect of the acquisition. For instance, TEP-MEPSS and SSEEPSS measured how well

30
the subject matched the target on average, and VEPSS measured the subject’s ability to maintain
a stable pressure regardless of the actual mean pressure level, while %TiRPSS measured how
well the subject stayed in the target range. TCM indicated how long it took for the subject to
achieve their calibrated maximum, a potential measure of performance. QC was a discretized
version of CEP, both measuring the quality of a calibration. TSS was a potential performance
measure of training efficiency and subject learning ability – presumably, the more practice a
subject got, the less time they would initially need to achieve stable stress. Lastly, %VAR(SI)
was somewhat a measure of movement, though not entirely, since variance could increase due to
subject exertion, and SMBF was a direct measure of perfusion, though sometimes a highly
variable one between subjects and measurements – because it was calculated through a nonlinear
regression, such an algorithm is vulnerable to false minima.
An interesting note was that the number of successful calibrations on the first try, NFC,
which was mentioned earlier but not included for analysis, consecutively increased between the
training (T) and each stress (P1/P2) scan, but the relationship was not statistically significant.
Similarly, another way of describing this was that the average number of calibrations per scan
steadily reduced between each group. However, this was not further explored because of the
limited data and thus limited statistical significance.
Curiously, the reported averages for TSS would lead one to believe that a statistically
significant relationship could easily be found for both T vs. P1 and P1 vs. P2. However, even

31
without outliers, T vs. P1 was not as significant as its counterpart. A larger sample and more
stringent training protocols might further illuminate this phenomenon.
Of the relationships between the C and DM groups for T and P1/P2, none were
statistically significant at the p = 0.05 level. A few, including P1 %TiRPSS and P2 CEP, were
close to the p = 0.10 level, but could not be repeated in their counterpart group (P2 and P1,
respectively). The most significant relationships for both P1 and P2 were for VEPSS and
SSEEPSS. This may reflect better muscle control among the control subjects than the DM ones.
This was reinforced by the even more significant global C/DM p-values, both near the p = 0.025
threshold.
As Figure 11 showed, global TEP vs. MEPSS had a very high correlation with only a
single outlier that was likely due to either a study failure or a tabulation error that was
overlooked in the analysis stage. This result, paired with our VEPSS and SSEEPSS findings and
anecdotal observations, suggests that subjects overall did a good job of staying within the target
range. The relationships between CEP/VEPSS and CEP/SSEEPSS were very notable; since they
are so similar, this was very surprising. However, the upward trend between CEP and these two
was notable. A commensurate increase in variance and error to the increase in CEP should be
expected, since CEP determines both the TEP and the scale of the target range. But instead there
was a flatter trend, which suggests that subject accuracy does increase with the CEP. This agrees
with our experimental observation that the effect of the remaining inherent noise in the DAQ
signal on the subject-display feedback loop was lessened at higher CEP because it directly

32
determined the vertical limits of the interactive display axes, reducing their contribution to the
subject’s visual distraction. Similarly, the link between QC and %TiRPSS, VEPSS, and
SSEEPSS likely captured some of this effect, as well as showing some justification for our
observed link between QC and overall performance; many of the p-values (Table 3) were
statistically significant at the 0.1 level and below. Given the paucity of quality calibrations,
however, we believe this merits further study before enshrinement as a golden standard.
Unfortunately, while some more superficial training measures like NC, NFC, and TSS
reduced with each consecutive acquisition, none of the training measures could reliably predict
later performance, with the exception again of QC and its partners VEPSS and SSEEPSS. While
the global result was strong, the lack of relationship with CEP suggests that this could potentially
be spurious nonetheless, though this is still an unlikelihood.
In looking at our perfusion measures, a significant difference was only found between
rest and stress, both globally and between the C and DM groups. This was somewhat surprising,
as the strong relationships between calibration and VEPSS and SSEEPSS suggested that they
might be reactive to %VAR(SI); instead, the weak correlations to %VAR(SI), which as
mentioned was primarily a measure of in-scan movement, leads us to the hypothesis that the
majority of SMBF influence on VEPSS and SSEEPSS was due to actual changes in perfusion,
not movement. This would be good news, since it would mean that perfusion can be measured
over moderate periods of time without image quality suffering due to the inherent instability of

33
muscle control in older subjects and those with impaired neural foot muscle control, two features
of the DM and ulcer patient populations.
There are several limitations in this study. First, a larger sample size would be needed to
resolve some of the open analysis questions and zero in on other potential relationships. More
advanced statistical measures could also influence design directions by illuminating areas for
improvement. The device itself could be further refined with better leak sealing, biomechanical
coupling, comfort and ergonomics, and more sensitive circuitry, possibly involving active
electronics – along with the protocol modifications these features would necessitate. Lastly, as
mentioned we are currently working on a leakage model to correct the most serious issue with
the current prototype in achieving a stable sensory feedback loop to ensure consistent stress.
Finally, the absolute value boxplots for %VAR(SI) suffered from numerous outliers, but
the key takeaway was that it was much higher for stress vs. rest. It is possible, though unlikely in
light of the above discussion, that this could be due to in-scan motion. If so, these could be
mitigated by a better-designed restraint system as well as a stricter training and stress acquisition
protocol.
5. Conclusion
In conclusion, we have achieved our goal of building an MR-compatible pneumatic
sensor device to create a sensory feedback loop for consistent foot perfusion stress testing. The
device itself was very economical to build, and relied on widely available materials. The linearity

34
of the device’s pressure-voltage correlation was validated and a working protocol was
developed, with minimal setup required. This prototype could pave the way towards a clinically
viable solution for MR foot perfusion stress testing, and its principle could even be expanded to
other applications in the broader fields of imaging and stress testing.

35
References
1. “Statistics About Diabetes.” American Diabetes Association, 2017. URL:
http://www.diabetes.org/diabetes-basics/statistics/
2. ME Mitchell. “Lower Extremity Major Amputations.” In: AN Sidaway (ed). “Diabetic
Foot: Lower Extremity Arterial Disease and Limb Salvage.” Philadelphia: Lippincott
Williams & Wilkins, 2006; 341-50.
3. C Grunfeld. “Diabetic foot ulcers: etiology, treatment and prevention.” Adv Intern Med,
1992; 37:103–32.
4. ME Edmonds, AVM Foster. “Managing the Diabetic Foot.” Blackwell Science Press,
2000.
5. T Dinh, A Veves. “Microcirculation of the Diabetic Foot.” Curr Pharm Des, 2005;
11:2301–9.
6. RA Malik, PG Newrick, AK Sharma, A Jennings, AK Ah-See, TM Mayhew, J
Jakubowski, AJ Boulton, JD Ward. “Microangiopathy in Human Diabetic Neuropathy:
Relationship Between Capillary Abnormalities and the Severity of Neuropathy.”
Diabetologia, 1989; 32:92-102.
7. FW LoGerfo, JD Coffman. “Current Concepts. Vascular and Microvascular Disease of
the Foot in Diabetes. Implications for Foot Care.” N Engl J Med, 1984; 311:1615-9.
8. KA Arsenault, J McDonald, PJ Devereaux, K Thorlund, JG Tittley, RP Whitlock. “The
use of Transcutaneous Oximetry to Predict Complications of Chronic Wound Healing: A
Systematic Review and Meta-Analysis.” Wound Repair Regen, 2011; 19:657–63.

36
9. A Challoner. “Photoelectric Plethysmography for Estimating Cutaneous Blood Flow.” In:
P Rolfe (ed). “Non-Invasive Physiological Measurement.” London: Academic Press,
1979; 125–51.
10. CI Wright, CI Kroner, R Draijer. “Non-invasive Methods and Stimuli for Evaluating the
Skin’s Microcirculation.” J Pharmacol Toxicol Methods 2006; 54:1–25.
11. AC Shore. “Capillaroscopy and the Measurement of Capillary Pressure.” Br J Clin
Pharmacol, 2000; 50:501–13.
12. GB Yvonne-Tee, AH Rasool, AS Halim, AR Rahman. “Noninvasive Assessment of
Cutaneous Vascular Function in vivo using Capillaroscopy, Plethysmography and Laser-
Doppler Instruments: Its Strengths and Weaknesses.” Clin Hemorheol Microcirc, 2006;
34:457–73.
13. RE Pecoraro, JH Ahroni, EJ Boyko, VL Stensel. “Chronology and Determinants of
Tissue Repair in Diabetic Lower-Extremity Ulcers.” Diabetes, 1991; 40:1305-13.
14. B Fagrell. “Peripheral Vascular Disease.” In: AP Shepherd, AA Oberg (eds). “Laser:
Doppler Flowmetry” Kluwer Academic Publishers, Boston, 1990; 201–14.
15. A Humeau, W Steenbergen, H Nilsson, T Stromberg. “Laser Doppler Perfusion
Monitoring and Imaging: Novel Approaches.” Med Biol Eng Comput, 2007; 45:421–35.
16. J Cobb, D Claremont. “Noninvasive Measurement Techniques for Monitoring of
Microvascular Function in the Diabetic Foot.” Int J Low Extrem Wounds, 2002; 1:161–9.
17. JJ Jr Castronuovo, HM Adera, JM Smiell, RM Price. “Skin Perfusion Pressure
Measurement is Valuable in the Diagnosis of Critical Limb Ischemia.” J Vasc Surg,
1997; 26:629-37.

37
18. W Groner, JW Winkelman, AG Harris, et al. “Orthogonal Polarization Spectral Imaging:
A New Method for Study of the Microcirculation.” Nat Med, 1999; 5:1209–12.
19. CYL Chao, GLY Cheing. “Microvascular Dysfunction in Diabetic Foot Disease and
Ulceration.” Diabetes Metabolism Res Rev, 2009; 25:604 –14.
20. EJ Boyko, JH Ahroni, VL Stensel, DG Smith, DR Davignon, RE Pecoraro. “Predictors of
Transcutaneous Oxygen Tension in the Lower Limbs of Diabetic Subjects.” Diabet Med,
1996; 13:549–54.
21. E Faglia, G Clerici, M Caminiti, A Quarantiello, V Curci, A Morabito. “Predictive
Values of Transcutaneous Oxygen Tension for Above-the-Ankle Amputation in Diabetic
Patients with Critical Limb Ischemia.” Eur J Vasc Endovasc Surg, 2007; 33:731–6.
22. D Yudovsky, A Nouvong, K Schomacker, L Pilon. “Monitoring Temporal Development
and Healing of Diabetic Foot Ulceration Using Hyperspectral Imaging.” J Biophotonics,
2011; 4:565-76.
23. ST Krishnan, NR Baker, AL Carrington, G Rayman. “Comparative Roles of
Microvascular and Nerve Function in Foot Ulceration in Type 2 Diabetes.” Diabetes
Care, 2004; 27:1343-8.
24. KT Moriarty, AC Perkins, AM Robinson, ML Wastie, RB Tattersall. “Investigating the
Capillary Circulation of the Foot with 99mTc-Macroaggregated Albumin: A Prospective
Study in Patients with Diabetes and Foot Ulceration.” Diabet Med, 1994; 11:22-7.
25. RL Greenman, S Panasyuk, X Wang, TE Lyons, T Dinh, L Longoria, JM Giurini, J
Freeman, L Khaodhiar, A Veves. “Early Changes in the Skin Microcirculation and
Muscle Metabolism of the Diabetic Foot.” Lancet, 2005; 366:1711-7.

38
26. J Zheng, H An, A Coggan, X Zhang, A Bashir, D Muccigrosso, L Peterson, R Gropler.
“Noncontrast Skeletal Muscle Oximetry.” Magnetic Resonance in Medicine, Jan 2014;
71(1):318-25. doi: 10.1002/mrm.24669. Epub 2013 Feb 19.
27. D Muccigrosso, X He, D Abendschein, A Bashir, W Chen, RJ Gropler, J Zheng.
“Methods for Quantification of Absolute Myocardial Oxygen Consumption with O17
MRI.” Oral Presentation, ISMRM Annual Meeting, 2011.
28. J Zheng, MK Hasting, X Zhang, A Coggan, H An, D Muccigrosso, D Snozek, A Bashir,
RJ Gropler, J Curci, MJ Mueller. “Regional Perfusion and Oxygenation in Calf Muscles
are Attenuated in Diabetes.” J Vasc Surg, 2014; 59:419-26.
29. J Zheng, MK Hastings, D Muccigrosso, ZY Fan, J Curci, CF Hildebolt, MJ Mueller.
“Non-contrast MRI Perfusion Angiosome in Diabetic Feet.” European Radiology, 2015;
25:99-105.