a novel method for identifying snp disease association ... · a novel method for identifying snp...
TRANSCRIPT

©FUNPEC-RP www.funpecrp.com.brGenetics and Molecular Research 13 (4): 10863-10877 (2014)
A novel method for identifying SNP disease association based on maximal information coefficient
H.M. Liu1,2, N. Rao1, D. Yang2, L. Yang1, Y. Li1 and F. Ou1
1School of Life Science and Technology, University of Electronic Science and Technology of China, Chengdu, Sichuan, China2School of Mathematics and Computer Science, Gannan Normal University, Ganzhou, Jiangxi, China
Corresponding author: N. RaoE-mail: [email protected]
Genet. Mol. Res. 13 (4): 10863-10877 (2014)Received January 16, 2014Accepted July 7, 2014Published December 19, 2014DOI http://dx.doi.org/10.4238/2014.December.19.7
ABSTRACT. To improve single-nucleotide polymorphism (SNP) association studies, we developed a method referred to as maximal information coefficient (MIC)-based SNP searching (MICSNPs) by employing a novel statistical approach known as the MIC to identify SNP disease associations. MIC values varied with minor allele frequencies of SNPs and the odds ratios for disease. We used a Monte Carlo-based permutation test to eliminate the effects of fluctuating MIC values and included a sliding-window-based binary search whose time-cost was 0.58% that of a sequential search to save time. The experiments examining both simulation and actual data demonstrated that our method is computationally and statistically feasible after reducing the resampling count to 4 times the number of markers and applying a
10864
©FUNPEC-RP www.funpecrp.com.brGenetics and Molecular Research 13 (4): 10863-10877 (2014)
H.M. Liu et al.
sliding-window-based binary search to the method. We found that our method outperforms existing approaches.
Key words: Sliding-windows; Maximal information coefficient (MIC); Fluctuation of MIC values; Monte Carlo-based permutation test; Binary search; SNP disease association studies
INTRODUCTION
Since publication of a study examining age-related macular degeneration by Klein et al. (2005) in 2005, several single-nucleotide polymorphism (SNP) disease association studies have been conducted to identify disease-associated markers in the genome. Increasing evidence suggests that association studies are an effective approach for identifying genes involved in common human diseases. Examples include breast cancer (Ritchie et al., 2001; Thomas et al., 2009; Fletcher et al., 2011), coronary artery disease (Kumar et al., 2011), type 1 diabetes (Barrett et al., 2009), obesity (Meyre et al., 2009), Parkinson’s disease (Simón-Sánchez et al., 2009), schizophrenia (Schizophrenia Psychiatric Genome-Wide Association Study (GWAS) Consortium, 2011), and body measurement traits (Xue et al., 2011).
SNP disease studies search for patterns of genetic variation/markers, i.e., SNPs, be-tween cases and controls. Several algorithms/approaches have been developed to search for patterns of genetic variation, including logic regression (LogicReg) (Kooperberg et al., 2007), Bayesian epistasis association mapping (BEAM) (Zhang and Liu, 2007), multifactor dimen-sionality reduction (Ritchie et al., 2001), tool set PLINK for whole-genome association and population-based linkage analyses (Purcell et al., 2007), Boolean operation-based screening and testing (Wan et al., 2010), maximum entropy conditional probability modeling (Miller et al., 2009), support vector machine, random forest rankings (Roshan et al., 2011), and Hierar-chical Naïve Bayes Classifier (Malovini et al., 2012).
In this study, we developed the maximal information coefficient (MIC)-based SNP searching (MICSNPs) method by employing a novel statistical approach known as the MIC (Reshef et al., 2011) to identify disease-associated markers in case-control genotype marker data to further optimize these studies. MIC is an exploratory statistical analysis tool proposed by Reshef et al. in 2011. MIC is an excellent approach for detecting undiscovered associa-tions in large data sets. We attempted to identify the threshold of MIC for identifying disease-associated markers while directly applying the approach to SNP disease association studies. We found that MIC values can fluctuate widely as minor allele frequencies (MAFs) of mark-ers or the odds ratios (ORs) for diseases change. Thus, we mapped the MIC values onto P values to eliminate the effects of the fluctuation. Although an MIC-P table was provided by the authors of MIC studies, we used a Monte Carlo (MC)-based permutation test to generate empirical P values because the MIC values of genotype data sets are out of the range of the table. MICSNP infers disease-associated markers based on P values calculated from the MIC value representing the degree of association of a marker with disease risks. In addition, we combined a sliding-window and a binary search method as a sliding-window-based binary and time-saving search to identify disease-associated markers.
Using extensive simulations, we demonstrated that: i) it was impossible to identify a feasible threshold for selecting significant markers from a genotype data set when we intro-

10865
©FUNPEC-RP www.funpecrp.com.brGenetics and Molecular Research 13 (4): 10863-10877 (2014)
Method of identifying SNP disease association based on MIC
duced MIC into SNP disease association studies, ii) the effects of fluctuation of MIC values can be eliminated by mapping MIC values onto P values using the MC-based permutation test, iii) using 4 times the number of SNPs as the resampling count for the MC-based permutation test and employing the sliding-window-based binary search method are feasible and save time, and iv) MICSNP comprehensively outperforms existing methods for identifying associations between SNPs and disease. We also applied MICSNPs to an association study of coronary artery disease (CAD) (Wellcome Trust Case Control Consortium, 2007), which included ap-proximately 500,000 SNP markers, and our method identified 8 disease-associated SNPs that were not found in the benchmarks.
In addition to MICSNPs, under the constraint of monotonicity between P values and tested variables, the MC-based permutation test with the sliding-window-based binary search suggests potential uses in cases where a traditional permutation test can be used.
MATERIAL AND METHODS
Simulation data
PLINK enables the generation of large-scale SNP/marker data sets for case-control studies or other purposes. We used 2 simulation scenarios to generate data sets using PLINK.
Scenario 1: Included 4 groups of data sets with 10, 20, 500, and 1000 SNPs. For each group, there were 10 ORs (1.1, 1.2, …, 2.0, respectively), each composed by 5 data sets. By lim-iting the range to 0.05-0.50, the MAFs of all data sets were randomly generated using PLINK. The number of cases in each data set was 1000 and an equal number of controls was included.
Scenario 2: A total of 500 independent data sets, each composed of 1000 cases, 1000 controls, and 1000 SNPs, were included. A total of 10 ORs (1.1, 1.2, …, 2.0, respectively), each composed by 10 MAFs (0.05, 0.10, …, 0.5 respectively), were used as parameters for PLINK. For each combination of ORs and MAFs, 5 simulated data sets were generated by 5 re-generations.
First scenario data sets were used to determine an acceptable resampling count for the MC-based permutation test. In addition, other scenario data sets were designed to assess the performance of MICSNPs and compare its performance with the BEAM, PLINK, and BoNB methods.
Real data
To assess the performance of our method for detecting disease-associated markers involved in real case-control data sets, a ground-truth data set was used in our experiments. The data set included CAD data in the WTCCC1 study data set from the Wellcome Trust Case Control Consortium (WTCCC), which was described previously (Wellcome Trust Case Con-trol Consortium, 2007).
As a case-control data set, CAD data were composed of 1988 cases and 1500 controls; 490,032 autosomal SNPs were mapped onto chromosomes 1-22. To ensure the validity of the data, several pre-processing steps were conducted for the CAD data in this study. The steps included analysis of Hardy-Weinberg equilibrium, an MAF test, allele missing rate test for each SNP, and SNP missing rate test for each sample, with thresholds of 0.01, 0.05, 0.05, and

10866
©FUNPEC-RP www.funpecrp.com.brGenetics and Molecular Research 13 (4): 10863-10877 (2014)
H.M. Liu et al.
0.05, respectively. Here, the allele missing rate test was used to calculate the percentage of missing alleles within an SNP and then delete SNPs whose percentages were higher than the preset threshold. Similarly, an SNP missing rate test was used to calculate the percentage of missing SNPs within a sample and then remove the samples whose percentages were higher than the preset threshold. Furthermore, we excluded SNPs included on the SNP exclusion list provided by the WTCCC.
MICSNP consists of 3 modules: i) MIC, ii) MC-based permutation test, and iii) slid-ing-window-based binary search. The MICSNP algorithm uses case-control genotype marker data as input and produces, using the MIC method, MIC values of all markers, and then infers which markers are associated with disease risks based on the MIC values tested using the MC-based permutation test with a sliding-window-based binary search.
MIC in MICSNPs
Using nonparametric properties, MIC is suitable for SNP disease association studies that do not depend on real models of genetic effects. MIC is used to explore a data set that includes tens of thousands of variables, which may contain important, undiscovered relation-ships. MIC is based on the idea that if a relationship exists between 2 variables, a grid can be drawn on the scatter plot of the 2 variables that partitions the data to enclose the relation-ship (Reshef et al., 2011). Reshef et al. (2011) defined MIC of a set D of 2-variable data with sample size n and x-by-y grid size less than B(n) as
( ) ( ){ }yxnBxyDMDMIC ,)(
max<
= (Equation 1)
where )()()1( 1 εω −<< nOnB for some 0 < ɛ < 1, and M(D) denotes the characteristic matrix of D.
With sufficiently large samples, MIC values generally converge at both ends of the interval [0, 1] of MICs, rather than being spread over the entire interval. Thus, if we employ MIC to identify associations between variables, performance will be improved.
Suppose n samples were genotyped at l SNP markers. Let the phenotypes be:
( )1 2, , , TnS s s s= with
=casescontrols
si ,1,0
(i = 1, 2, …, n)
denoting the phenotype of the ith sample, and let genotypes be 1 2( , , , )lG g g g= with the jth SNP’s genotypes
1 2( , , , )Tj j j njg g g g= (j = 1, 2, …, l), where gij denotes the count of the
minor alleles of the jth SNP in the ith sample, then the model of genetic effect will be written as )( jgfS = . Based on this model, regardless of the real model of genetic effects, the MIC value Mj can be calculated between gj and S and the degree of the association between SNP j and disease risk can be determined. Here, with 2 phenotypes and 3 genotypes at most in a marker data set, the xy < B(n) in (Equation 1) can be simplified into xy ≤ 6.
10867
©FUNPEC-RP www.funpecrp.com.brGenetics and Molecular Research 13 (4): 10863-10877 (2014)
Method of identifying SNP disease association based on MIC
MC-based permutation test for MIC
Our experiments showed, however, that the MIC values fluctuate roughly with MAFs and ORs when applying MICs in SNP disease association studies, and we failed to identify a feasible threshold of MIC for selecting significant markers from the genotype data set. We mapped MIC values onto P values to overcome this limitation. The authors of MIC studies provided an MIC-P table with an MIC range of 0.15-1.0 and a sample range of 20-760. As a genotype data set with thousands of samples exceeding 760, the MIC range of the real CAD data was 1.81 x 10⁻⁸-0.75, as calculated based on our experiments. Although the maximum MIC was 0.75 in the real data, most MIC values were lower than the lower limit of 0.15 in the MIC-P table, as the mean of the MIC values was 0.02. The range of MIC values in genotype data was out of the range of the MIC values in the MIC-P table. Thus, we employed a permuta-tion test to generate P values for MIC values.
Using the permutation test to generate empirical P values for the exploratory tool MIC, we examined how to reduce the time necessary to run the algorithm. We used the more efficient MC-based permutation test in MICSNPs, which scaled-up well.
Sliding-window-based binary search
Although the MC-based permutation test performed faster, the computational time cost was still significant because of the core difficulty resulting from the very large size of the genome-wide data. If a genotype data set contains n samples and l SNPs, for an MIC with a runtime of t, the time cost of the MC-based permutation test with m resamplings for MIC can be represented as:
T = (m + 1)nlt (Equation 2)
For a given genotype data set, Equation 2 suggested that T is directly proportional to t if m ≥ 1.The time cost of the algorithm decreased as m, n, or l decreased.
For a given data set, n, l, and t were constant (in fact, for different SNPs involved with the same data, there were very small differentials among ts, and we omitted the difference here); thus, m was found to be a unique factor affecting T. Because not all SNPs in a genotype data set are associated with disease risk, we generated P values for partial SNPs rather than overall P values, which lowered the value of l. The methods for reducing m were experimental, and the results are described below in the Results section.
After sorting the sequence by l MIC values, disease-associated SNPs were gathered at one end of the ordered sequence as a monotonic relationship between MIC values and the degrees of SNPs associated with disease risk was observed. Therefore, once the junction v (Figure 1) was used, all disease-associated markers could be extracted entirely at once rather than relying on individual extraction, which costs additional time. The binary search algorithm was highly efficient and fast, and is widely used when analyzing very large data sets. In this study, we used a binary search to accelerate the steps for identifying the junction v. Compared with the complexity O(l) in the sequential search, the complexity of the binary search was only leading to dramatic reductions in computation time.
2(log )O l (Equation 3)

10868
©FUNPEC-RP www.funpecrp.com.brGenetics and Molecular Research 13 (4): 10863-10877 (2014)
H.M. Liu et al.
In our study, P values were generated from MIC values, forming a single-valued map-ping of an MIC value into a P value (We used an MIC-P pair to describe mapping in this pa-per). With a requirement of sorting in the binary search, it is logically required that the P values monotonically change with the MIC values. Fortunately, this requirement was well satisfied for the MIC-P pairs (Figure 2).
Figure 1. Principle of sliding-window-based binary search. A. Raw MIC-P pairs (disordered). Based on this sequence, all P values were generated to search for significant markers. B. Ordered MIC-P pairs (descending order by MICs). Based on the inverted sequence, significant markers were gathered at the first end of the ordered pairs. The junction v denotes the dividing point, which was used to represent the boundary between significant and non-significant markers. The dashed frame was the first location of the window, and the solid was the last. All markers were significant in the windows except for the last, so we only applied a binary search algorithm to identify the junction v based on the subsequence contained in the last window and skipped the others. In the search method, only the P values that were useful in identifying the junction v were generated.
Figure 2. Monotonicity of MIC-P.

10869
©FUNPEC-RP www.funpecrp.com.brGenetics and Molecular Research 13 (4): 10863-10877 (2014)
Method of identifying SNP disease association based on MIC
Although a binary search can greatly reduce computational complexity, the time cost will not be underestimated in searching a genome-wide data set because of the very large markers l shown in Equation 3. This raises the question of how to further reduce the time cost in association studies. Because disease-associated SNPs gathered at one end of the ordered sequence, we implemented a binary search for the smaller sequence containing the junction v rather than the entire sequence to save time. This is why we combined a sliding-window and binary search.
Let the size of the sliding-window be w (w ≤ l) and the significance level be Ps. The framework of the sliding-window-based binary search can be described as follows:
Sort the sequence of MIC values in descending order.Generate the P value P0 of the first MIC value in the inverted sequence. If 0 sP P> ,
then go to step (v), which denotes that all SNPs are not associated with disease risks.Generate the P values for the MIC values located at
1( , 1,2, , )liw iw l i
w − ≤ =
in the sequence until i sP P> or
liw =
. Next, apply a binary search to the subsequence con-tained in the window i (the solid frame in Figure 1) to identify the junction v when i sP P> , or let v = l when
liw =
and i sP P≤ .Take all SNPs located at the front of the junction v as significant SNPs.
Algorithm ends
Using this method, the very large l-value can be mapped onto the smaller w; thus, l is greatly decreased in practice. Therefore, a sliding-window-based binary search may be more efficient than a traditional binary search. It is easy to demonstrate that the complexity of sliding-window-based binary search is determined by:
++
1log 2 w
wdO (Equation 4)
where d is the number of disease-associated markers and “1” denotes the procedure for gener-ating P0. In practice, when d ≤ l, it is possible that w ≤ l. This means that with an appropriate value for w, the complexity of the sliding-window-based binary search method may be lower than that of a traditional binary search.
RESULTS
To assess the performance of MICSNPs, we chose 3 typical methods, BEAM, PLINK, and BoNB, as benchmarks in our experiments. BEAM is a method used to identify markers as-sociated with disease risk via a Bayesian partition model. In this model, each posterior probabil-ity of disease-associated markers is computed using the Markov Chain Monte Carlo approach (Zhang and Liu, 2007), and then significant markers are filtered according to the preset threshold of the posterior probability. The experiments conducted by the authors showed that BEAM out-performs all other existing methods, including multifactor dimensionality reduction and logic regression (Zhang and Liu, 2007). PLINK, an important tool set for genome-wide association studies or other genetic studies, was issued in 2007 (Purcell et al., 2007). Its latest version, 1.07,
10870
©FUNPEC-RP www.funpecrp.com.brGenetics and Molecular Research 13 (4): 10863-10877 (2014)
H.M. Liu et al.
provides an approach for association analysis by logistic regression. PLINK imposes the clas-sical Newton-Raphson iteration for estimating the parameters of the logistic regression model. PLINK, with logistic regression, was used as a benchmark in our study and is a classical and widely used algorithm in the biomedical field (Agresti, 2002). By testing the genotype data set type 1 diabetes released by the WTCCC, BoNB obtained significantly higher accuracy than both the standard Naïve Bayes algorithm and HyperLASSO. BoNB uses the Naïve Bayes algo-rithm as a base classifier for Bagging and majority voting with a threshold of 5% for selecting biomarkers, and then tests these markers by running a Wilcoxon test procedure.
In our experiments, all benchmarks were implemented according to the source codes provided by the authors without modification. Unless otherwise stated, we set i) the parameter SINGLE_ONLY in BEAM to 1 to test for marginal associations only, ii) the MC resampling count to 4 times the number of SNPs, iii) the size of sliding-window for MICSNPs to 6, and iv) the significance level of all methods to P ≤ 0.05 (all P values of MICSNPs as well as of PLINK were corrected based on Bonferroni’s correction). In addition to these settings, other values were set to default values according to the benchmarks.
Selecting an acceptable resampling count for an MC-based permutation test
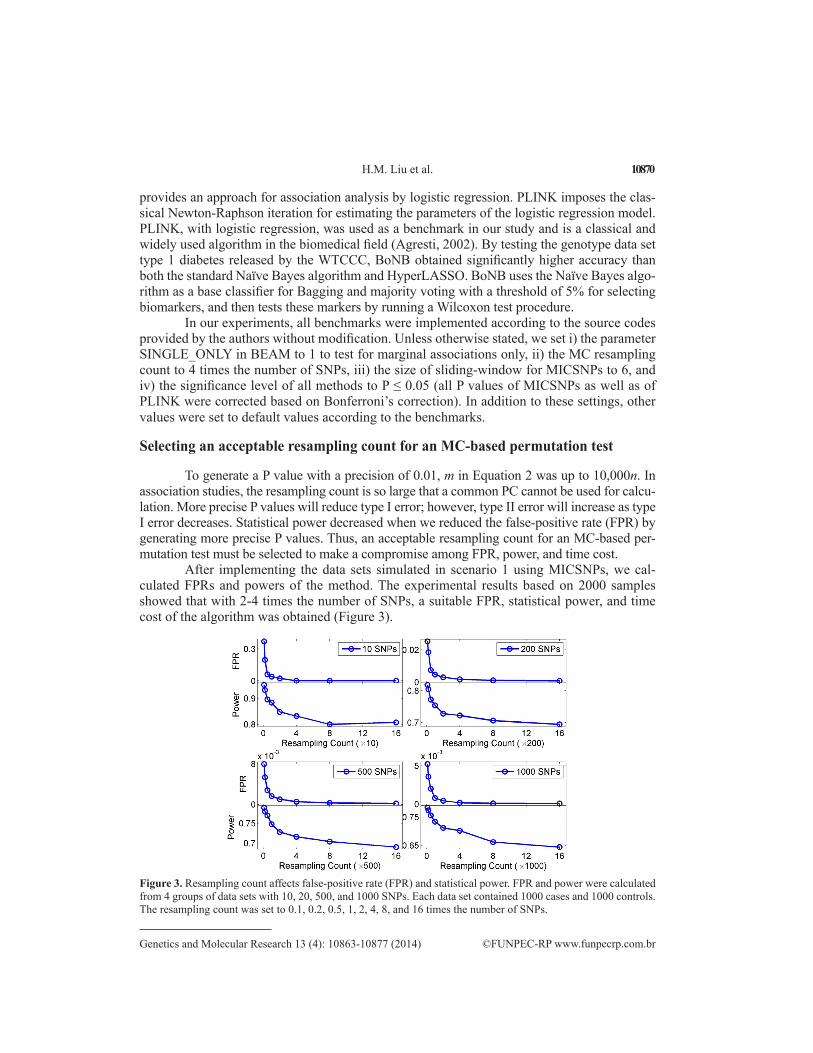
To generate a P value with a precision of 0.01, m in Equation 2 was up to 10,000n. In association studies, the resampling count is so large that a common PC cannot be used for calcu-lation. More precise P values will reduce type I error; however, type II error will increase as type I error decreases. Statistical power decreased when we reduced the false-positive rate (FPR) by generating more precise P values. Thus, an acceptable resampling count for an MC-based per-mutation test must be selected to make a compromise among FPR, power, and time cost.
After implementing the data sets simulated in scenario 1 using MICSNPs, we cal-culated FPRs and powers of the method. The experimental results based on 2000 samples showed that with 2-4 times the number of SNPs, a suitable FPR, statistical power, and time cost of the algorithm was obtained (Figure 3).
Figure 3. Resampling count affects false-positive rate (FPR) and statistical power. FPR and power were calculated from 4 groups of data sets with 10, 20, 500, and 1000 SNPs. Each data set contained 1000 cases and 1000 controls. The resampling count was set to 0.1, 0.2, 0.5, 1, 2, 4, 8, and 16 times the number of SNPs.

10871
©FUNPEC-RP www.funpecrp.com.brGenetics and Molecular Research 13 (4): 10863-10877 (2014)
Method of identifying SNP disease association based on MIC
The experiments based on 200, 500, and 1000 samples showed the same results (Figure S1).
Fluctuation of MIC threshold
After calculating all MICs for the 500 data sets simulated in scenario 2, the 500 MIC sequences were sorted in descending order. For each sequence, we extracted a pair of MIC values located in the junction between disease- and null-SNPs (each for the 2 SNP types). Next, the following procedures were implemented.
Categorize the 500 pairs of MIC values into 10 categories by ORs, group each cat-egory into 10 groups by MAFs, and then respectively calculate the average of the disease- and null-disease MICs for each group (Figure 4).
Figure 4. MICs fluctuate MAFs. MICs were calculated from 500 data sets. Each data set contained 1000 SNPs genotyped from 1000 cases and 1000 controls. The null- and disease-associated SNPs were adjacent to each other on the inverted sequence of MICs. Each point was averaged from 5 MICs calculated from 5 data sets with the same MAF and OR.
Similarly, categorize these pairs of MIC values into 10 categories by MAFs, group each category into 10 groups by ORs, and then respectively calculate the average of the dis-ease- and null-disease MICs for each group (Figure S2).
As shown in Figure 4 and Figure S2, junctions fluctuated as MAFs/ORs changed. As a result, we could not draw a horizontal line to identify disease- and null-SNPs for all cases. Thus, we failed to pursue an MIC-threshold to identify the disease- and null-SNPs.
Comparison of BEAM, PLINK, and BoNB with respect to FPR and power
We used all of the methods, including MICSNPs, to search for significant associations in the simulated data sets using scenario 2. Based on the groups of MAFs, we calculated the
10872
©FUNPEC-RP www.funpecrp.com.brGenetics and Molecular Research 13 (4): 10863-10877 (2014)
H.M. Liu et al.
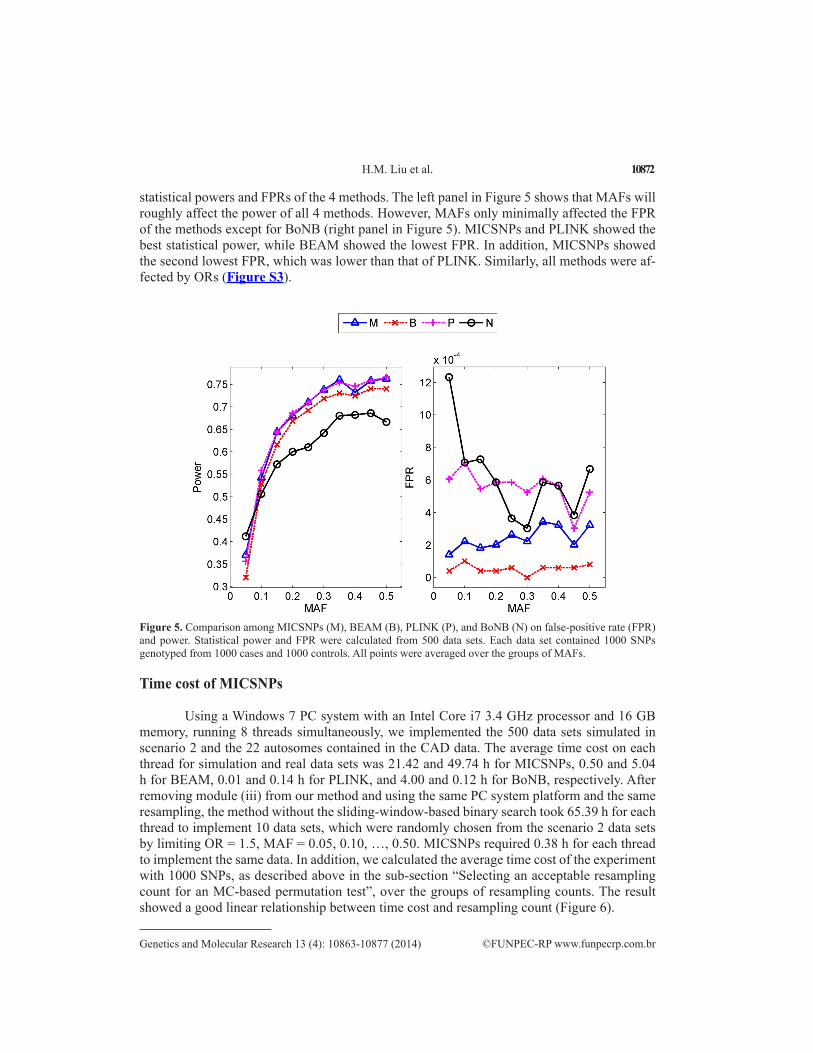
statistical powers and FPRs of the 4 methods. The left panel in Figure 5 shows that MAFs will roughly affect the power of all 4 methods. However, MAFs only minimally affected the FPR of the methods except for BoNB (right panel in Figure 5). MICSNPs and PLINK showed the best statistical power, while BEAM showed the lowest FPR. In addition, MICSNPs showed the second lowest FPR, which was lower than that of PLINK. Similarly, all methods were af-fected by ORs (Figure S3).
Figure 5. Comparison among MICSNPs (M), BEAM (B), PLINK (P), and BoNB (N) on false-positive rate (FPR) and power. Statistical power and FPR were calculated from 500 data sets. Each data set contained 1000 SNPs genotyped from 1000 cases and 1000 controls. All points were averaged over the groups of MAFs.
Time cost of MICSNPs
Using a Windows 7 PC system with an Intel Core i7 3.4 GHz processor and 16 GB memory, running 8 threads simultaneously, we implemented the 500 data sets simulated in scenario 2 and the 22 autosomes contained in the CAD data. The average time cost on each thread for simulation and real data sets was 21.42 and 49.74 h for MICSNPs, 0.50 and 5.04 h for BEAM, 0.01 and 0.14 h for PLINK, and 4.00 and 0.12 h for BoNB, respectively. After removing module (iii) from our method and using the same PC system platform and the same resampling, the method without the sliding-window-based binary search took 65.39 h for each thread to implement 10 data sets, which were randomly chosen from the scenario 2 data sets by limiting OR = 1.5, MAF = 0.05, 0.10, …, 0.50. MICSNPs required 0.38 h for each thread to implement the same data. In addition, we calculated the average time cost of the experiment with 1000 SNPs, as described above in the sub-section “Selecting an acceptable resampling count for an MC-based permutation test”, over the groups of resampling counts. The result showed a good linear relationship between time cost and resampling count (Figure 6).

10873
©FUNPEC-RP www.funpecrp.com.brGenetics and Molecular Research 13 (4): 10863-10877 (2014)
Method of identifying SNP disease association based on MIC
Consistency test between with and without sliding-window-based binary search
The theoretical basis of applying a sliding-window-based binary search (module iii, see Material and Methods section) to our method was that the disease-associated markers were gathered in ordered MIC-P pairs, allowing the algorithm to skip a large number of markers rather than scanning each marker, which saves time while generating P values. To assess the bias of this theory in practice, we used the same data sets as inputs for MIC with modules ii and iii (namely, without and with sliding-window-based binary search, respectively), and compared their outputs to examine consistency. The data sets were selected from the data sets generated in scenario 2. We randomly selected one data set from each combination of MAFs and ORs, obtaining 100 data sets as inputs for this test.
Here, consistency requires that not only the number but also the position of the markers (P ≤ 0.05) detected by the 2 algorithms be the same. We employed statistical power and specificity as 2 measures, and used the outputs of MIC without the sliding-window-based binary search as the “gold standard” for calculating the 2 measures of the method with sliding-window-based binary search (i.e., MICSNPs). Therefore, higher power and specificity indicate greater consistency among the 2 algorithms. In our experiment, based on the “gold standard”, the average power and specificity of MICSNPs were respectively 1.0000 and 0.9998, which was close to 1. Furthermore, we plotted the SNP numbers detected using the 2 algorithms on the same scatter plot with different colors, which showed consistency by counting the number of overlapping points (Figure 7). Figure 7 shows that there were few non-overlapping points (blue in left panel and red in right panel).
Figure 6. Linear relationship between time cost and resampling count. The time cost was averaged over the groups of 100, 200, 500, 1000, 2000, 4000, 8000, and 16,000 resamplings of MC-based permutation test for testing 50 data sets. Each data set contained 1000 SNPs genotyped from 1000 cases and 1000 controls.

10874
©FUNPEC-RP www.funpecrp.com.brGenetics and Molecular Research 13 (4): 10863-10877 (2014)
H.M. Liu et al.
MICSNPs for real data
The real data set, case-control CAD data in WTCCC1, was composed of 22 in-dependent smaller data sets (each for 1 autosome). Because of the limitations of marker amount using BEAM (Zhang and Liu, 2007), smaller data sets were used one by one rather than being spliced together in our study. To capture the sets of SNPs with the strongest joint effect on the disease, we calculated the correlation coefficients r between any 2 SNPs us-ing the methods MICSNPs, BEAM, and PLINK, similarly to BoNB. If there were several correlation coefficients in a set of SNPs that exceeded the threshold (r2 > 0.1), we used the SNP with maximum MIC (for MICSNPs) or with minimum P (for BEAM and PLINK) as the result. We found that for MICSNPs, BEAM, PLINK, and BoNB, 63, 65, 44, and 52 SNPs, respectively, were associated with disease risks and a total of 52 SNPs showed the strongest joint effect on the disease in the CAD data set (Tables S1 and S2). Eight of the 63 SNPs found using MICSNPs were not identified using other methods, and did not exist in the results of the benchmarks (Table 1).
Figure 7. Consistency between conditions with and without sliding-window-based binary search. All SNPs in the figure were significant at P ≤ 0.05. The degree of overlapping between the points with different colors denotes the degree of consistency between the 2 algorithms. A. Left panel. The “without sliding-window-based binary search (without SW)” (red) is plotted over the “with sliding-window-based binary search (with SW)” (blue). B. Right panel is the contrast to (A).
Chromosome SNPs SNPs with the strongest joint effect
Chr. 2 rs41464947 rs41373446Chr. 7 rs2030711 -a
rs34100060Chr. 10 rs7894018 -Chr. 16 rs237179 -Chr. 21 rs2088843 -Chr. 22 rs5752792 - rs688034aIndicates “none”.
Table 1. Risk SNPs found only by MICSNPs.
10875
©FUNPEC-RP www.funpecrp.com.brGenetics and Molecular Research 13 (4): 10863-10877 (2014)
Method of identifying SNP disease association based on MIC
DISCUSSION
The MICSNPs method has 3 essential components: i) MIC, a novel nonparametric statistical tool, as the measure used to infer the degree of association of the markers with dis-ease risks, ii) an MC-based permutation test for mapping MIC values onto P values, and iii) a sliding-window-based binary search to save time. Although MIC showed promise in statisti-cal analysis, our experiments based on case-control genotype marker data showed that MIC values fluctuated for both MAFs and ORs, suggesting that it is possible to identify a threshold for using MIC directly to measure and identify risk SNPs in SNP disease association studies. Previously, MIC has been successfully applied to data sets in gene expression studies (Reshef et al., 2011). This may be because a gene expression data set contains continuous variables, while a genotype data set contains discrete variables including 6 combinations at most. More information involved in calculating an MIC value can be provided by a gene expression data set compared to a genotype marker data set, leading to lower deviation of the MIC value pro-duced by the former than by the latter. After mapping the MIC values onto P values using the MC-based permutation test, the effects of the fluctuating MICs were eliminated.
In simulation experiments, we found that MICSNPs and PLINK had the best sta-tistical power and that MICSNPs has the second lowest FPR, which was lower than that of PLINK. Thus, MICSNPs outperformed the benchmarks in comprehensive performance. Fur-thermore, in the experiment for real data of CAD, our method detected 8 SNPs that were not detected by the benchmarks. Of the 8 SNPs, rs41464947 correlated strongly with rs41373446, suggesting that these polymorphisms function together in disease.
Notably, in the simulation experiments, some of the benchmarks showed better scores than that of the original studies conducted by the author(s). This may have resulted from the different simulation models between the original studies and our studies.
For the MC-based permutation test procedure in association studies, to produce a P value with precision of ± 0.01, a large number of resamplings is required, which may overload a common PC system. As the precision of P values increased, type I error decreased, but type II error increased. Thus, there must be a compromise among time cost, type I error, and type II error. The experiments involving 200, 500, 1000, and 2000 samples showed that the best compromise may be made while the resampling is set to 2-4 times the number of SNPs.
We combined sliding-window and binary search as a sliding-window-based binary search to accelerate the steps for searching for significant SNPs. Compared to a sequential search, the time cost of our search method was related to window size and the number of risk SNPs, but was not related to total SNPs (Equation 4). Risk SNPs are typically far lower than the value of total SNPs, indicating that our method will save time (the time cost of MICSNPs was 0.58% that of a sequential search, satisfying the relationship between Equation 4 and O(l), representing the complexity of a sequential search).
Although the time cost of MICSNPs was higher than that of the benchmarks, the value was acceptable. For comparison, we set maximum entropy conditional probability modeling’s parameter MAX_DEGREE to 1 and implemented one of the data sets simulated in scenario 2. For maximum entropy conditional probability modeling, 439.45 h was required, which is 1292.49 times the time required for MICSNPs to process the data set, whose size was less than that of any chromosome in the CAD data set.
For MICSNPs, the consistency of identifying SNP disease associations between con-ditions with and without the sliding-window-based binary search was very high. Thus, sig-

10876
©FUNPEC-RP www.funpecrp.com.brGenetics and Molecular Research 13 (4): 10863-10877 (2014)
H.M. Liu et al.
nificant markers will gather together after sorting MIC-P pairs by MIC values. The sliding-window-based binary search used here is feasible and saves time.
Nevertheless, there are several limitations and unanswered questions in this study. For example, a permutation test must be applied to MICSNPs, resulting in a large increase in time cost. In principle, the MIC value may be used directly to detect disease-associated markers if we improve the stability of MICs in the limited amount of combinations of the discrete variables.
CONCLUSION
MIC is a novel, recently identified measure that may be used in statistical analysis. Our experiments suggested that MIC values fluctuate for both MAFs and ORs of a case-control genotype marker data set. MICSNPs eliminated the fluctuation, leading to successful application of MIC to SNP disease association studies. By testing MICSNPs on simulated data sets and a CAD genome-wide association data set, we found that MICSNPs outperformed existing approaches in comprehensive performance and were both computationally and statis-tically feasible on a genome-wide case-control data set.
ACKNOWLEDGMENTS
We would like to thank the Wellcome Trust Case Control Consortium for providing the case-control data set. Research supported by the National Natural Science Foundation of China (Grant #81171411).
Supplementary material
REFERENCES
Agresti A (2002). Categorical Data Analysis. John Wiley & Sons, New York.Barrett JC, Clayton DG, Concannon P, Akolkar B, et al. (2009). Genome-wide association study and meta-analysis find
that over 40 loci affect risk of type 1 diabetes. Nat. Genet. 41: 703-707.Fletcher O, Johnson N, Orr N, Hosking FJ, et al. (2011). Novel breast cancer susceptibility locus at 9q31.2: results of a
genome-wide association study. J. Natl. Cancer Inst. 103: 425-435.Klein RJ, Zeiss C, Chew EY, Tsai JY, et al. (2005). Complement factor H polymorphism in age-related macular
degeneration. Science 308: 385-389.Kooperberg C, Bis JC, Marciante KD, Heckbert SR, et al. (2007). Logic regression for analysis of the association between
genetic variation in the renin-angiotensin system and myocardial infarction or stroke. Am. J. Epidemiol. 165: 334-343.Kumar J, Yumnam S, Basu T, Ghosh A, et al. (2011). Association of polymorphisms in 9p21 region with CAD in North
Indian population: replication of SNPs identified through GWAS. Clin. Genet. 79: 588-593.Malovini A, Barbarini N, Bellazzi R and de Michelis F (2012). Hierarchical Naive Bayes for genetic association studies.
BMC Bioinformatics 13: 6.Meyre D, Delplanque J, Chèvre JC, Lecoeur C, et al. (2009). Genome-wide association study for early-onset and morbid
adult obesity identifies three new risk loci in European populations. Nat. Genet. 41: 157-159.Miller DJ, Zhang Y, Yu G, Liu Y, et al. (2009). An algorithm for learning maximum entropy probability models of disease
risk that efficiently searches and sparingly encodes multilocus genomic interactions. Bioinformatics 25: 2478-2485.Purcell S, Neale B, Todd-Brown K, Thomas L, et al. (2007). PLINK: a tool set for whole-genome association and
population-based linkage analyses. Am. J. Hum. Genet. 81: 559-575.Reshef DN, Reshef YA, Finucane HK, Grossman SR, et al. (2011). Detecting novel associations in large data sets. Science
334: 1518-1524.

10877
©FUNPEC-RP www.funpecrp.com.brGenetics and Molecular Research 13 (4): 10863-10877 (2014)
Method of identifying SNP disease association based on MIC
Ritchie MD, Hahn LW, Roodi N, Bailey LR, et al. (2001). Multifactor-dimensionality reduction reveals high-order interactions among estrogen-metabolism genes in sporadic breast cancer. Am. J. Hum. Genet. 69: 138-147.
Roshan U, Chikkagoudar S, Wei Z, Wang K, et al. (2011). Ranking causal variants and associated regions in genome-wide association studies by the support vector machine and random forest. Nucleic Acids Res. 39: e62.
Schizophrenia Psychiatric Genome-Wide Association Study (GWAS) Consortium (2011). Genome-wide association study identifies five new schizophrenia loci. Nat. Genet. 43: 969-976.
Simón-Sánchez J, Schulte C, Bras JM, Sharma M, et al. (2009). Genome-wide association study reveals genetic risk underlying Parkinson’s disease. Nat. Genet. 41: 1308-1312.
Thomas G, Jacobs KB, Kraft P, Yeager M, et al. (2009). A multistage genome-wide association study in breast cancer identifies two new risk alleles at 1p11.2 and 14q24.1 (RAD51L1). Nat. Genet. 41: 579-584.
Wan X, Yang C, Yang Q, Xue H, et al. (2010). BOOST: A fast approach to detecting gene-gene interactions in genome-wide case-control studies. Am. J. Hum. Genet. 87: 325-340.
Wellcome Trust Case Control Consortium (2007). Genome-wide association study of 14,000 cases of seven common diseases and 3,000 shared controls. Nature 447: 661-678.
Xue M, Zan LS, Gao L and Wang HB (2011). A novel polymorphism of the myogenin gene is associated with body measurement traits in native Chinese breeds. Genet. Mol. Res. 10: 2721-2728.
Zhang Y and Liu JS (2007). Bayesian inference of epistatic interactions in case-control studies. Nat. Genet. 39: 1167-1173.