a novel pet tracer - ejnmmi research
TRANSCRIPT

Wang et al. EJNMMI Res (2020) 10:126 https://doi.org/10.1186/s13550-020-00710-5
ORIGINAL RESEARCH
A novel PET tracer 18F-deoxy-thiamine: synthesis, metabolic kinetics, and evaluation on cerebral thiamine metabolism statusChangpeng Wang1, Siwei Zhang2, Yuefei Zou2, Hongzhao Ma2, Donglang Jiang3, Lei Sheng4, Shaoming Sang1, Lirong Jin1, Yihui Guan3, Yuan Gui2, Zhihong Xu2 and Chunjiu Zhong1*
Abstract
Background: Some neuropsychological diseases are associated with abnormal thiamine metabolism, including Korsakoff–Wernicke syndrome and Alzheimer’s disease. However, in vivo detection of the status of brain thiamine metabolism is still unavailable and needs to be developed.
Methods: A novel PET tracer of 18F-deoxy-thiamine was synthesized using an automated module via a two-step route. The main quality control parameters, such as specific activity and radiochemical purity, were evaluated by high-performance liquid chromatography (HPLC). Radiochemical concentration was determined by radioactivity calibrator. Metabolic kinetics and the level of 18F-deoxy-thiamine in brains of mice and marmosets were studied by micro-posi-tron emission tomography/computed tomography (PET/CT). In vivo stability, renal excretion rate, and biodistribution of 18F-deoxy-thiamine in the mice were assayed using HPLC and γ-counter, respectively. Also, the correlation between the retention of cerebral 18F-deoxy-thiamine in 60 min after injection as represented by the area under the curve (AUC) and blood thiamine levels was investigated.
Results: The 18F-deoxy-thiamine was stable both in vitro and in vivo. The uptake and clearance of 18F-deoxy-thiamine were quick in the mice. It reached the max standard uptake value (SUVmax) of 4.61 ± 0.53 in the liver within 1 min, 18.67 ± 7.04 in the kidney within half a minute. The SUV dropped to 0.72 ± 0.05 and 0.77 ± 0.35 after 60 min of injec-tion in the liver and kidney, respectively. After injection, kidney, liver, and pancreas exhibited high accumulation level of 18F-deoxy-thiamine, while brain, muscle, fat, and gonad showed low accumulation concentration, consistent with previous reports on thiamine distribution in mice. Within 90 min after injection, the level of 18F-deoxy-thiamine in the brain of C57BL/6 mice with thiamine deficiency (TD) was 1.9 times higher than that in control mice, and was 3.1 times higher in ICR mice with TD than that in control mice. The AUC of the tracer in the brain of marmosets within 60 min was 29.33 ± 5.15 and negatively correlated with blood thiamine diphosphate levels (r = − 0.985, p = 0.015).
Conclusion: The 18F-deoxy-thiamine meets the requirements for ideal PET tracer for in vivo detecting the status of cerebral thiamine metabolism.
Keywords: Thiamine, 18F-deoxy-thiamine, Tracer, Positron emission tomography
© The Author(s) 2020. Open Access This article is licensed under a Creative Commons Attribution 4.0 International License, which permits use, sharing, adaptation, distribution and reproduction in any medium or format, as long as you give appropriate credit to the original author(s) and the source, provide a link to the Creative Commons licence, and indicate if changes were made. The images or other third party material in this article are included in the article’s Creative Commons licence, unless indicated otherwise in a credit line to the material. If material is not included in the article’s Creative Commons licence and your intended use is not permitted by statutory regulation or exceeds the permitted use, you will need to obtain permission directly from the copyright holder. To view a copy of this licence, visit http://creativecommons.org/licenses/by/4.0/.
IntroductionThiamine, also named vitamin B1, is an essential nutrient that can be acquired only via diet. After being absorbed from gastrointestinal tract, thiamine is delivered to all organs and tissues and converted into bioactive thia-mine diphosphate (TDP) [1]. Thiamine deficiency (TD) is associated with some neuropsychological diseases, such
Open Access
*Correspondence: [email protected] Department of Neurology, Zhongshan Hospital, State Key Laboratory of Medical Neurobiology and Institute of Brain Science, Fudan University, Shanghai 200032, ChinaFull list of author information is available at the end of the article
Page 2 of 14Wang et al. EJNMMI Res (2020) 10:126
as Wernicke–Korsakoff syndrome, Alzheimer’s disease (AD), beriberi, Leigh syndrome, and so forth, and results in lactic acidosis, mitochondrial dysfunction, and energy deficits in brain, muscle, and heart, causing a broad range of clinical manifestations, such as anorexia, agitation, diminished tendon reflexes, ataxia, disturbance of con-sciousness, muscle pain, and heart failure. [2–4].
Glucose is the predominant substrate of brain energy metabolism and plays a pivotal role in maintaining cer-ebral function [5], which makes the brain vulnerable to glucose dysmetabolism. TDP is the common coenzyme of the three key enzymes in glucose catabolism: pyru-vate dehydrogenase and α-ketoglutarate dehydrogenase in the Krebs cycle that is responsible for producing ATP in mitochondria, and transketolase in pentose phosphate pathway that generates antioxidants and the substrates of biosynthesizing DNA, RNA, and fatty acid in cytosol [6]. Therefore, the brain also is susceptible to TD by disturb-ing glucose metabolism [2, 7–12]
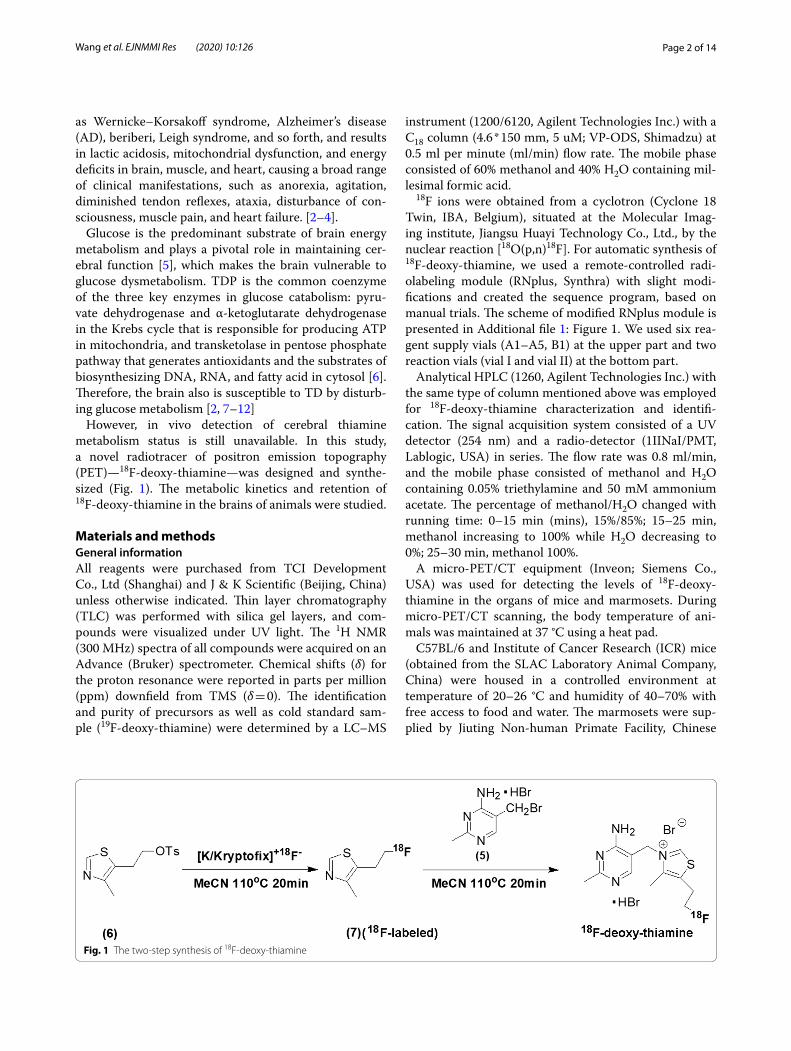
However, in vivo detection of cerebral thiamine metabolism status is still unavailable. In this study, a novel radiotracer of positron emission topography (PET)—18F-deoxy-thiamine—was designed and synthe-sized (Fig. 1). The metabolic kinetics and retention of 18F-deoxy-thiamine in the brains of animals were studied.
Materials and methodsGeneral informationAll reagents were purchased from TCI Development Co., Ltd (Shanghai) and J & K Scientific (Beijing, China) unless otherwise indicated. Thin layer chromatography (TLC) was performed with silica gel layers, and com-pounds were visualized under UV light. The 1H NMR (300 MHz) spectra of all compounds were acquired on an Advance (Bruker) spectrometer. Chemical shifts (δ) for the proton resonance were reported in parts per million (ppm) downfield from TMS (δ = 0). The identification and purity of precursors as well as cold standard sam-ple (19F-deoxy-thiamine) were determined by a LC–MS
instrument (1200/6120, Agilent Technologies Inc.) with a C18 column (4.6 * 150 mm, 5 uM; VP-ODS, Shimadzu) at 0.5 ml per minute (ml/min) flow rate. The mobile phase consisted of 60% methanol and 40% H2O containing mil-lesimal formic acid.
18F ions were obtained from a cyclotron (Cyclone 18 Twin, IBA, Belgium), situated at the Molecular Imag-ing institute, Jiangsu Huayi Technology Co., Ltd., by the nuclear reaction [18O(p,n)18F]. For automatic synthesis of 18F-deoxy-thiamine, we used a remote-controlled radi-olabeling module (RNplus, Synthra) with slight modi-fications and created the sequence program, based on manual trials. The scheme of modified RNplus module is presented in Additional file 1: Figure 1. We used six rea-gent supply vials (A1–A5, B1) at the upper part and two reaction vials (vial I and vial II) at the bottom part.
Analytical HPLC (1260, Agilent Technologies Inc.) with the same type of column mentioned above was employed for 18F-deoxy-thiamine characterization and identifi-cation. The signal acquisition system consisted of a UV detector (254 nm) and a radio-detector (1IINaI/PMT, Lablogic, USA) in series. The flow rate was 0.8 ml/min, and the mobile phase consisted of methanol and H2O containing 0.05% triethylamine and 50 mM ammonium acetate. The percentage of methanol/H2O changed with running time: 0–15 min (mins), 15%/85%; 15–25 min, methanol increasing to 100% while H2O decreasing to 0%; 25–30 min, methanol 100%.
A micro-PET/CT equipment (Inveon; Siemens Co., USA) was used for detecting the levels of 18F-deoxy-thiamine in the organs of mice and marmosets. During micro-PET/CT scanning, the body temperature of ani-mals was maintained at 37 °C using a heat pad.
C57BL/6 and Institute of Cancer Research (ICR) mice (obtained from the SLAC Laboratory Animal Company, China) were housed in a controlled environment at temperature of 20–26 °C and humidity of 40–70% with free access to food and water. The marmosets were sup-plied by Jiuting Non-human Primate Facility, Chinese
Fig. 1 The two-step synthesis of 18F-deoxy-thiamine

Page 3 of 14Wang et al. EJNMMI Res (2020) 10:126
Academy of Sciences, Shanghai. Four marmosets aged 3.1–10.8 years old were employed for micro-PET/CT scanning (M1: 3.1 year, female; M2: 3.5 year, male; M3: 5.4 year, female; M4: 10.8 year, male). At the day of exper-iment, the marmosets were fetched from the facility and were sent back when the scanning finished.
All animal care and experimental procedures were car-ried out according to the guidelines of the Animal Care Committee of Fudan University. This study was approved by Medical Experimental Animal Administrative Com-mittee of Fudan University, and the committee on medi-cal ethics of Zhongshan Hospital, Fudan University.
Synthesis of cold standard sample of 18F‑deoxy‑thiamine as well as precursors (5) and (6).We synthesized cold standard sample of 18F-deoxy-thiamine as well as precursors (5) and (6) according to the work of Cline JK, et al. [13], with minor modifica-tions (Additional file 2: Figure 2). The purity of the cold standard sample is > 99.9%, and the purity of two precur-sors > 99%, identified via HNMR and LC–MS (Additional files 4, 5, 6, 7, 8, 9: Figure 3B–G). The details of the syn-thetic route were described in the Additional file 14: sup-plementary text.
Automated radiosynthesis of 18F‑deoxy‑thiamineWe adopted a two-step synthesis route (Fig. 1). The scheme of automated synthesis was shown in Additional file 1: Figure 1. Reagents were added into supply vials as follows: A1: 1.1 ml eluent (3.08 mg KHCO3, 11 mg Kryptofix 2.2.2, 0.88 mL MeCN, 0.22 mL H2O); A2: 1 ml MeCN; A3: 5 mg precursor (6) in 0.5 ml MeCN; A4: 1 ml MeCN; A5: 0.5 ml MeCN; B1: 0.5 ml H2O. 5 mg pre-cursor (5) powder was also added into reaction vial II beforehand. When the first step synthesis finished, the intermediate product [18F]-compound (7) was trans-ferred from reaction vial I to reaction vial II via distil-lation. The whole automated synthesis duration was 100 min. The details of synthesis and purification were described in the Additional file 14: supplementary text.
Characterization and quality control of 18F‑deoxy‑thiamineRadiochemical yield (RCY, decay-correction to the end of bombardment) and radiochemical concentration (RCC) were measured by the radioactivity calibrator (CRC-55tR, CAPINTEC, INC., USA). 18F-deoxy-thiamine was identi-fied by co-injecting final product with cold standard sam-ple into analytical HPLC. Radiochemical purity (RCP) and specific radioactivity (SA) were calculated by means of the area under curve (AUC) of radio-signals and UV-signals of final product in analytical HPLC, respectively. Bacteria and endotoxin detections were carried out by means of anaerobic/aerobic bacteria media and Limulus
reagent gel methods, respectively, according to Chinese Pharmacopoeia.
In vitro stability18F-deoxy-thiamine solution was stored at room temper-ature (RT) and injected into analytical HPLC for evaluat-ing RCP and peak shape at 0 h (h), 2 h, 4 h, 6 h, 8 h, and 10 h, respectively, after synthesized.
Thiamine deficiency mouse modelEight-week-old male C57BL/6 and ICR mice were ran-domly divided into two groups: TD mouse models (n = 2 for C57BL/6, one died due to anesthesia during micro-PET/CT scanning; n = 3 for ICR) were established by feeding thiamine-deprived diet (Trophic Animal Feed High-tech Co., Ltd., China). Control mice (n = 3 for each strain) were fed the general diet. Twenty-eight days later, all mice received PET/CT scanning.
Micro‑PET/CT imagingMicro-PET/CT imaging using 18F-deoxy-thiamine as the tracer was performed in the mice with TD and control mice, as well as in marmosets. The animals were anes-thetized by inhaling 1.5–2% of isoflurane in air (1.5 L/min) and received CT scan for acquiring structure image and attenuation correction data. Then, the mice were injected with 7.4–14.8 MBq of 18F-deoxy-thiamine in 0.1 ml volume (diluted by normal saline) through the tail vein. Brain PET imaging was immediately performed and dynamically acquired for 90 min with an energy window of 350–650 KeV and a time window of 3.438 ns. A total of 35 frames were setup: 20 f, 3 s; 4 f, 60 s; 5 f, 300 s; 6 f, 600 s. Dynamic images were reconstructed by OSEM3D/SP-MAP algorithm with two iterations. After scanning, the mice were sacrificed.
The marmosets were injected with 46.3–74.0 MBq of 18F-deoxy-thiamine in 0.5–0.8 ml volume through the femoral vein. Brain PET imaging was immediately scanned and dynamically acquired for 60 min. A total of 18 frames were setup: 6 f, 10 s; 4 f, 60 s; 5 f, 300 s; 6 f, 600 s. The blood samples of the marmosets were taken from femoral vein for measuring the levels of thiamine, TMP, and TDP. The other conditions for marmosets were the same as that for mice.
Regions of interest (ROIs) were drawn manually over the whole brain (for mice and marmosets) and in the left ventricular cavity (for marmosets) based on the PET/CT co-registered images using IRW 4.2 software (Sie-mens Medical Solutions USA, Inc.). Radioactivity was expressed as standard uptake value (SUV): (ROI radio-activity/ROI volume)/(injected radioactivity/gram of body weight). The time-activity curve (TAC) and AUC (SUV * mins) were also calculated.

Page 4 of 14Wang et al. EJNMMI Res (2020) 10:126
The TACs of the marmosets blood (Radioactivity was expressed as SUV) were taken as input functions (IF) [14–16] for fitting Patlak plots [17, 18], in order to ana-lyze transfer constants (Ki) of brains in marmosets (IRW 4.2 software). The details of Patlak model were described in the Additional file 14: supplemental text.
Measurement of thiamine, TMP, and TDP in whole blood samples of marmosetsThiamine, TMP, and TDP levels in whole blood samples were measured using HPLC, based on the established method [4] with slight modification. Briefly, blood sam-ples were collected using heparin-anticoagulated tubes; 150 ul sample was vibrated for 30 s with equal volume of 5.2% perchloric acid (PCA) added dropwise for depro-teinization. Then, the mixture was stored at − 80 °C until assay within 1 month. The mixture was centrifuged at 12,000 rpm for 8 min at 4 °C; the supernatant was pipet-ted. Thiamine, TMP, and TDP in supernatant were deri-vatized into thiochromes using potassium ferricyanide and analyzed by gradient elusion with C18 reversed-phase analytical column (250 * 4.6 mm). The derivatives were identified by HPLC fluoroscopy (1100, Agilent Technolo-gies Inc., ex: 367 nm, em: 435 nm). The thiamine, TMP, and TDP levels were quantified using standard samples (Sigma-Aldrich, St. Louis, MO). The analyzers were blinded to samples information.
Studies of pharmacokinetic and metabolic kinetics in liver and kidney of miceNine-week-old male ICR mice (n = 5) were dynami-cally scanned using micro-PET/CT for 60 min. A total of 18 frames were reconstructed: 6 f, 10 s; 4 f, 60 s; 5 f, 300 s; 6 f, 600 s. The scanning conditions were the same as those mentioned above. The ROIs of liver and renal parenchyma as well as left ventricular cavity were manu-ally drawn.
For pharmacokinetic study, the TACs of the blood were fitted. The radioactivity was evaluated as %IA/g (the per-centage of injected activity per gram of blood). Pharma-cokinetics parameters were counted through the software PKSolver (version 2.0, China Pharmaceutical University) [19].
For metabolic kinetics study, SUV, TAC, AUC, maxi-mum radioactivity (Cmax), and time to Cmax (Tmax) were calculated. The TACs of the blood (Radioactivity expressed as SUV) were taken as IFs for fitting Logan plots [20, 21], in order to analyze the distribution vol-umes (VD) of 18F-deoxy-thiamine in liver and kidney, respectively (IRW 4.2 software). The details of Logan model were described in the Additional file 14: supple-mental text.
Biodistribution studyThe biodistribution of 18F-deoxy-thiamine was stud-ied in ICR mice (n = 36 in total; 18 males, 9-week-old, 33.5 ± 4.0 g; 18 females, 7-week-old, 27.7 ± 5.0 g). For each mouse, 0.1 ml of 18F-deoxy-thiamine solution (37 MBq/ml) was injected into the tail vein under iso-flurane anesthesia. The mice were sacrificed at 5 min, 10 min, 30 min, 1 h, 2 hs, and 4 hs after injection (3 males and 3 females for each time point). The tissues of heart, liver, spleen, lung, kidney, stomach, duodenum, pancreas, femur, muscle (from thigh), artery blood, brain, fat, and gonad (ovary or testicle) were harvested, weighted, and measured for radioactivity by γ-counter. %IA/g was cal-culated referring to the counts of standard samples.
In vivo stability and the renal excretion rateAfter metabolic kinetics study (Heading 9, Materials and Methods section), the mice were stopped to expo-sure to isoflurane and woke up several mins later. The urine accumulated in the bladder of the mice during the whole anesthetization period would be excreted. Some mice were softly rubbed the lower bowel in order to pro-mote urination as completely as possible. The duration from the injection of 18F-deoxy-thiamine to mouse uri-nation was about 85 min. The urine samples from three ICR mice were collected using syringes and measured in the radioactivity calibrator. Then, 0.1 ml urine for each mouse was added in an Eppendorf tube, vibrated for 30 s with equal volume of PCA added dropwise for depro-teinization. After centrifuging at 12,000 rpm for 8 min at 4 °C, the supernatant was filtered and analyzed using HPLC.
Statistical analysisFor the continuous data, mean ± standard error of mean (SEM) was applied for statistical description. Student’s t test was employed to compare the AUC values between TD mice and controls in ICR strain. The Pearson cor-relation was utilized to analyze the correlation between the cerebral accumulation of 18F-deoxy-thiamine and the levels of blood thiamine, TMP, and TDP in marmosets. Repeated measurement of ANOVA with Tukey’s post hoc was used to analyze the AUC values of 18F-deoxy-thiamine in brain, liver, and kidney in ICR mice. All sta-tistical analyses were performed using SPSS (Statistical Package for the Social Sciences) software (version 22.0; SPSS Inc., Chicago IL).
ResultsCharacterization and quality control of 18F‑deoxy‑thiamineThe solution of 18F-deoxy-thiamine was clear and free of any particulate matter. All relevant items of

Page 5 of 14Wang et al. EJNMMI Res (2020) 10:126
characterization are shown in Table 1. The RCP and SA were 98.28 ± 0.39% and > 55.5 GBq/umol, respectively (Fig. 2). The RCY was 5.17 ± 1.04% (decay-corrected to the end of bombardment), and the RCC was 740–1110 MBq/ml. The bacteria and endotoxin tests were negative. For exploring the expiration time, we tested the stability in vitro. 18F-deoxy-thiamine final product was stable at RT, with the RCP > 95% 6 h, and > 93% 10 h after synthesis (Table 2).
Evaluation of cerebral thiamine metabolism statusC57BL/6 miceThe cerebral retention of 18F-deoxy-thiamine was increasing and approached to Cmax at the terminal time of 90 min in the two mice with TD. The SUVsmax of the last frame (80–90 min) were 0.48 (TD 3 mouse), and 0.55
Table 1 Characterization and quality control of 18F-deoxy-thiamine
a Decay-corrected to the end of bombardment
Items Results
Physical character Clear and transpar-ent, no macroscopic impurity
pH value 4.5
Alcohols 0%
RCP (n = 3) 98.28 ± 0.39%
SA > 55.5 GBq/umol
RCY (n = 3)a 5.17 ± 1.04%
RCC (n = 3) 986.67 ± 123.33 MBq/ml
Bacteria test Negative
Endotoxin test Negative
Fig. 2 The identity of 18F-deoxy-thiamine and the measurements of radioactivity purity and specific activity. a, b Results of co-injection of 18F-deoxy-thiamine with cold standard sample. a was the radio-signal, and the retention time was 9 min 24 s; b was the UV-signal, and the retention time was 8 min 47 s. Radio-signal acquisition system was installed behind UV-signal acquisition system, and the time-lag was about half-minute at the flow rate of 0.8 ml/min. Note that the peak shapes of a, b were the same. c the UV signal of 18F-deoxy-thiamine. UV = 254 nm

Page 6 of 14Wang et al. EJNMMI Res (2020) 10:126
(TD 5 mouse). The AUC values within 90 min were 34.99 (TD 3 mouse) and 42.46 (TD 5 mouse). In contrast, the cerebral retention was stable within 90 min in the three
control mice; the SUVsmax were about 0.17 (Ctrl 2 mouse), 0.25 (Ctrl 4 mouse), and 0.3 (Ctrl 1 mouse). The AUC val-ues within 90 min were 14.52 (Ctrl 2 mouse), 20.96 (Ctrl 4 mouse), and 25.67 (Ctrl 1 mouse) (Fig. 3a, b). The mean of AUC values in TD mice was 1.9 times higher than that in control mice (38.73 ± 3.74 vs. 20.38 ± 3.23).
ICR miceThe values of cerebral SUVsmax in three mice with TD were 0.98 at 28th frame (TD 3 mouse, 20–25 min), 0.97 at 30th frame (TD 4 mouse, 30–40 min), and 0.61 at the 33th frame (TD1 mouse, 60–70 min), and then, the SUVs declined slowly. The AUC values within 90 min were 79.28 (TD 3 mouse), 78.75 (TD 4 mouse), and 46.81 (TD
Table 2 In vitro stability test of 18F-deoxy-thiamine
Time after synthesis (h) RCP (%)
0 97.68
2 96.89
4 96.11
6 95.03
8 94.01
10 93.38
Fig. 3 The evaluation of cerebral thiamine metabolism status in mice and marmosets. a, b C57BL/6 mice. A: the cerebral TACs of 18F-deoxy-thiamine in 90 min. The average AUC value in two mice with TD was 1.9 times higher than that in control mice (38.73 ± 3.74 vs. 20.38 ± 3.23). b The representative PET/CT images in TD and control groups (TD 5 and Ctrl 2, both at 50–60 min). c, d ICR mice. c The cerebral TACs of 18F-deoxy-thiamine in 90 min. The AUC values in mice with TD were significantly higher than those in controls (68.28 ± 10.74 vs. 21.88 ± 4.25, P = 0.016). d The representative PET/CT images in TD and control mice (TD 4 and Ctrl 1, 50–60 min). e, j Marmosets. e The cerebral TACs of 18F-deoxy-thiamine in 60 min. f The representative PET/CT images (M4, 30–60 min). g–i The correlations between cerebral AUC values of 18F-deoxy-thiamine within 60 min and blood levels of thiamine, TMP, and TDP. j The correlation between cerebral transfer constant Ki and age

Page 7 of 14Wang et al. EJNMMI Res (2020) 10:126
1 mouse), respectively. The SUVsmax of ICR control mice were 0.36 (Ctrl 1 mouse), 0.27 (Ctrl 5 mouse), and 0.18 (Ctrl 3 mouse) within 90 min, respectively. The TACs in control mice were stable, similar to that in the C57BL/6 strain mice. The AUC values within 90 min were 29.58 (Ctrl 1 mouse), 21.14 (Ctrl 5 mouse) and 14.92 (Ctrl 3 mouse), respectively (Fig. 3c, d). The mean of AUC val-ues in TD mice was 3.1 times higher than that in controls (68.28 ± 10.74 vs. 21.88 ± 4.25, P = 0.016).
MarmosetsThe retention of 18F-deoxy-thiamine in the cerebrum of three marmosets had been increasing within 60 min (M1, M3, M4) and reached plateau at 16th frame (30–40 min) in M2. The values of SUVmax were between 0.33 and 0.90, and the AUC values within 60 min were between 17.07 and 42.28 (29.33 ± 5.15; Fig. 3e, f ). There was a signifi-cantly negative correlation between cerebral AUC values within 60 min and TDP levels in whole blood samples (r = − 0.985, p = 0.015, Fig. 3i). No significant correla-tion was found between the AUC values of 18F-deoxy-thiamine in cerebrum and blood thiamine and TMP levels (Fig. 3g, h). In order to quantitatively evaluate the uptake of 18F-deoxy-thiamine in the cerebrum of mar-mosets, the Patlak model was utilized to analyze the blood-to-brain transfer rate represented by constant Ki based on the characteristics of metabolic kinetics in the brain. The regression plots were fitted automatically by software from 20 to 60 min. Ki was between 0.0030 and 0.0102 ml/g/min, and significantly correlated with age (r = 0.986, P = 0.014, Fig. 3j, see the fitted Patlak plots in Additional file 10: Figure 4).
Pharmacokinetic study and metabolic kinetics study in liver and kidney of miceTable 3 shows the pharmacokinetic parameters. Figure 4a shows the TAC of 18F-deoxy-thiamine (radioactivity as IA%/g) within 60 min in the ICR mice blood represented by the ROI in left ventricle. The pharmacokinetic profiles of 18F-deoxy-thiamine fitted a two-compartment open model. The value of AUC 0–60 min was 37.313, account-ing for 99.77% of the value of AUC 0–inf (37.399), which implies that the 60 min observation be sufficient to depict the pharmacokinetic characters. The Tmax was in the first frame (0–10 s) and the Cmax was 18.12 ± 2.20 IA%/g, respectively. The half-life of distribution (t1/2α) and half-life of elimination (t1/2β) were 0.082 and 6.379 min. The volume of distribution (VD1) and clearance rate (CL1) of central compartment were 3.058 g and 2.674 g/min. The VD2 and CL2 of peripheral compartment were 19.308 g and 20.162 g/min. These results revealed that 18F-deoxy-thiamine could be absorbed and eliminated rapidly.
The representative images of dynamic micro-PET/CT whole-body scanning of ICR mice within 60 min are shown in Fig. 5. Initially, 18F-deoxy-thiamine distributed mainly into liver and bladder. Then, the radioactivities in the liver quickly declined, while that in bladder was increasing over time. These results demonstrated that the uptake and elimination of 18F-deoxy-thiamine in vivo were fast and mainly occurred in liver and kidney.
The Tmax in liver was approximately 1 min post-injec-tion. The value of SUVmax was 4.61 ± 0.53. Then, the SUV dropped fast to 3.23 ± 0.50 at approximately 5 min. The radioactivity continued to decline afterward. The SUV was 0.72 ± 0.05 at the terminal time (60 min). The AUC value within 60 min was 79.94 ± 5.43 (Fig. 4b). The Tmax in the kidney was approximately 30 s, and the SUVmax was 18.67 ± 7.04. The SUV dropped fast to 3.29 ± 0.50 in 10 min and continued to drop slowly. At the termi-nal time (60 min), the SUV dropped to 0.77 ± 0.35. The AUC value was 113.4 ± 15.56 (Fig. 4c). The AUC values of liver and kidney within 60 min were significantly higher than that of whole brain (P < 0.001). Also, the AUC val-ues in kidney were significantly higher than that in liver (P < 0.05, Fig. 4d).
Logan plot was applied to analyze the distribution volume (VD) of liver and kidney based on the character-istics of metabolic kinetics. The regression plots were fit-ted automatically by software from 10 to 60 min, and VD were 4.573 ± 0.34 ml/g in the liver and 6.17 ± 0.88 ml/g in the kidney (Additional file 11, 12: Figure 5A–E, 6A–E). The results indicated that the “steady-state” of uptake/clearance was reached in the 10th min, and the mean
Table 3 Pharmacokinetic parameters of 18F-deoxy-thiamine in ICR mice (n = 5)
a Data were expressed as mean ± SEMb K10, elimination rate constant; K12, elimination rate constant from central compartment to peripheral compartment; K21, elimination rate constant from peripheral compartment to central compartment
Parameters (units) Values
Tmax (s) 0–10
Cmax (IA%/g) 18.12 ± 2.20a
VD1 (g) 3.058
CL1 (g/min) 2.674
VD2 (g) 19.308
CL2 (g/min) 20.162
t1/2(α) (min) 0.082
t1/2(β) (min) 6.379
AUC 0–60 min (%IA/g * min) 37.313
AUC 0–inf (%IA/g * min) 37.399
k10 (min−1)b 0.874
k12 (min−1)b 6.593
k21 (min−1)b 1.044

Page 8 of 14Wang et al. EJNMMI Res (2020) 10:126
uptake amount of 18F-deoxy-thiamine per gram tissue was equivalent to the amount contained in 4.573 ml (for liver) or 6.17 ml (for kidney) of blood.
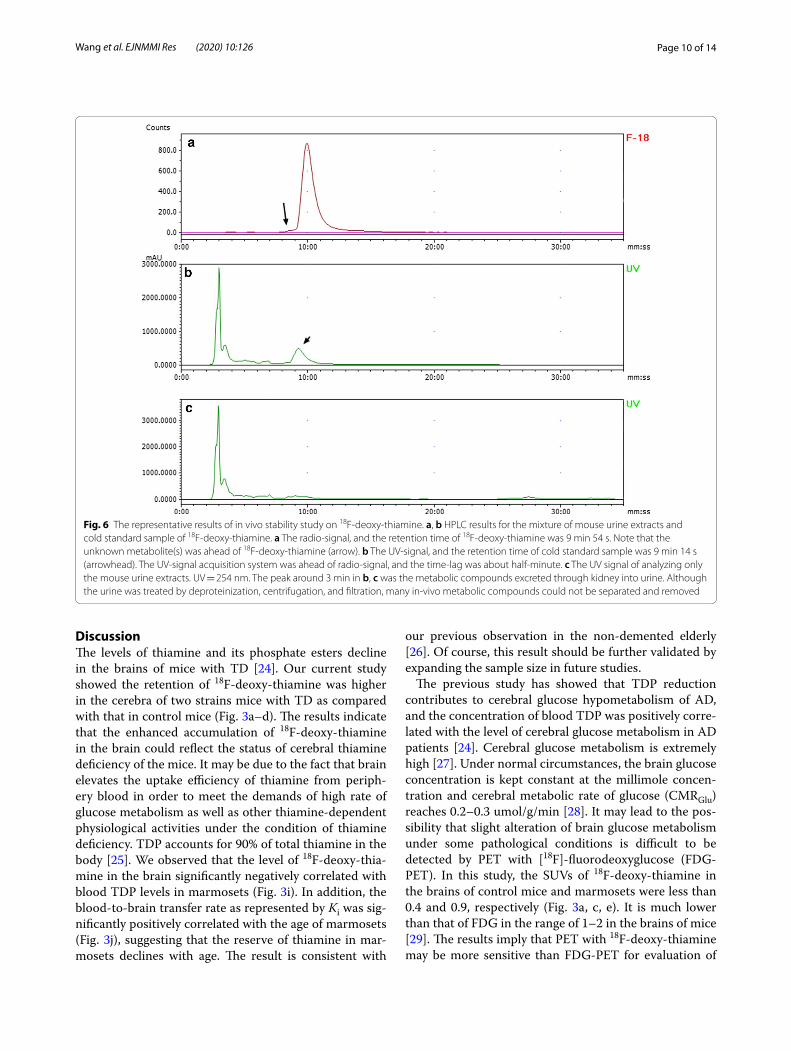
In vivo stability and renal excretion rateSince the -OH group of thiamine is replaced by -18F, 18F-deoxy-thiamine cannot enter the known meta-bolic pathways of thiamine till 18F decays back to 18O− [22, 23]. The radioactivity in the collected urine was 34.16 ± 3.84% of total injected radioactivity measured by radioactivity calibrator (decay-correction), and no cor-relation was found between the excreted radioactivity in urine and the injected radioactivity (Additional file 14: Table 1). The RCP of renal excreted 18F-deoxy-thiamine was 94.53 ± 0.81% determined by HPLC. In addition, an unknown trace substance (3.30 ± 0.60% in RCP) was found ahead of 18F-deoxy-thiamine, which could not be 18F− ions according to its retention time and shape (Fig. 6). The percentage of intact tracer was 96.63%. These results indicated that about one-third of 18F-deoxy-thi-amine was excreted by kidney and that 18F-deoxy-thia-mine was stable within 85 min in vivo.
Biodistribution studyAs a derivative of an essential vitamin, 18F-deoxy-thia-mine distributed widely in vivo. In most of the organs and tissues of ICR mice, the Cmax of 18F-deoxy-thia-mine achieved between 5 and 15 min, then 18F-deoxy-thiamine was cleared rapidly, and the accumulation was very low in these organs and tissues till 4 h after injection (Fig. 7, Additional file 14: Table 2). The mus-cular radioactivity in female ICR mice began to decline 5 min after injection, differentiating from that in male ICR mice, in which the radioactivity increased within 60 min, then declined rapidly.
Consistent with the results of PET/CT scanning, the biodistributions of liver and kidney were higher than that in the other organs investigated. The biodistribu-tions of 18F-deoxy-thiamine in brain, fat, and gonad were less than those in other organs or tissues observed in this study. Interestingly, the level of 18F-deoxy-thia-mine in the ovary was higher than that in the testicle, indicating the difference in 18F-deoxy-thiamine metab-olism between male and female gonads.
Fig. 4 Studies of pharmacokinetics and metabolic kinetics of 18F-deoxy-thiamine in ICR mice. a The TAC of 18F-deoxy-thiamine in blood (radioactivity expressed as IA%/g). b, c The TACs of 18F-deoxy-thiamine in liver and kidney, respectively (radioactivity expressed as SUV). D. Comparisons of AUC values within 60 min between brain, liver, and kidney. Note that the scale of X axes in a, c was changed properly. *P < 0.05. ***P < 0.001. Repeated measurement of ANOVA with Tukey’s post hoc, n = 5 for each graph

Page 9 of 14Wang et al. EJNMMI Res (2020) 10:126
Fig. 5 Dynamic micro-PET/CT Scanning within 60 min. The representative results from one ICR mouse. a The 11th frame (5–10 min). b The 12th frame (10–15 min). c The 13th frame (15–20 min). d The 14th frame (20–25 min). e The 15th frame (25–30 min). f The 16th frame (30–40 min). g The 17th frame (40–50 min). h The 18th frame (50–60 min)
Page 10 of 14Wang et al. EJNMMI Res (2020) 10:126
DiscussionThe levels of thiamine and its phosphate esters decline in the brains of mice with TD [24]. Our current study showed the retention of 18F-deoxy-thiamine was higher in the cerebra of two strains mice with TD as compared with that in control mice (Fig. 3a–d). The results indicate that the enhanced accumulation of 18F-deoxy-thiamine in the brain could reflect the status of cerebral thiamine deficiency of the mice. It may be due to the fact that brain elevates the uptake efficiency of thiamine from periph-ery blood in order to meet the demands of high rate of glucose metabolism as well as other thiamine-dependent physiological activities under the condition of thiamine deficiency. TDP accounts for 90% of total thiamine in the body [25]. We observed that the level of 18F-deoxy-thia-mine in the brain significantly negatively correlated with blood TDP levels in marmosets (Fig. 3i). In addition, the blood-to-brain transfer rate as represented by Ki was sig-nificantly positively correlated with the age of marmosets (Fig. 3j), suggesting that the reserve of thiamine in mar-mosets declines with age. The result is consistent with
our previous observation in the non-demented elderly [26]. Of course, this result should be further validated by expanding the sample size in future studies.
The previous study has showed that TDP reduction contributes to cerebral glucose hypometabolism of AD, and the concentration of blood TDP was positively corre-lated with the level of cerebral glucose metabolism in AD patients [24]. Cerebral glucose metabolism is extremely high [27]. Under normal circumstances, the brain glucose concentration is kept constant at the millimole concen-tration and cerebral metabolic rate of glucose (CMRGlu) reaches 0.2–0.3 umol/g/min [28]. It may lead to the pos-sibility that slight alteration of brain glucose metabolism under some pathological conditions is difficult to be detected by PET with [18F]-fluorodeoxyglucose (FDG-PET). In this study, the SUVs of 18F-deoxy-thiamine in the brains of control mice and marmosets were less than 0.4 and 0.9, respectively (Fig. 3a, c, e). It is much lower than that of FDG in the range of 1–2 in the brains of mice [29]. The results imply that PET with 18F-deoxy-thiamine may be more sensitive than FDG-PET for evaluation of
Fig. 6 The representative results of in vivo stability study on 18F-deoxy-thiamine. a, b HPLC results for the mixture of mouse urine extracts and cold standard sample of 18F-deoxy-thiamine. a The radio-signal, and the retention time of 18F-deoxy-thiamine was 9 min 54 s. Note that the unknown metabolite(s) was ahead of 18F-deoxy-thiamine (arrow). b The UV-signal, and the retention time of cold standard sample was 9 min 14 s (arrowhead). The UV-signal acquisition system was ahead of radio-signal, and the time-lag was about half-minute. c The UV signal of analyzing only the mouse urine extracts. UV = 254 nm. The peak around 3 min in b, c was the metabolic compounds excreted through kidney into urine. Although the urine was treated by deproteinization, centrifugation, and filtration, many in-vivo metabolic compounds could not be separated and removed

Page 11 of 14Wang et al. EJNMMI Res (2020) 10:126
mild brain hypometabolism status. The advantages and disadvantages of these two methods for detecting brain metabolic status should be further investigated in future studies.
In both genders of ICR mice, kidney, liver, and pan-creas exhibit high accumulation level of 18F-deoxy-thiamine, while brain, muscle, fat, and gonad show low accumulation concentration (Fig. 7; Additional file 14: Table 2, 3). These results are consistent with previ-ous reports on the biodistributions of thiamine and
its phosphate esters [30–32]. Besides, we found that 3.37% of 18F-deoxy-thiamine in urine was metabolized to more polar compounds after 85 min in vivo pro-cess (Fig. 6). To our knowledge, the –OH group is the active site for thiamine converting into bioactive TDP in vivo [22, 23]. Thus, before –18F decays back to sta-ble isotope –18O, 18F-deoxy-thiamine could not enter the known metabolic routes. The presence of this 3.37% compounds implied other unknown metabolic routes might exist. 18F-deoxy-thiamine could help for further
Fig. 7 Biodistribution of 18F-deoxy-thiamine in ICR mice. a–c Male. d–f Female. Radioactivity accumulation was expressed as %IA/g at 5, 15, 30, 60, 120, 240 min after tail-vein injection of 3.7 MBq 18F-deoxy-thiamine in 0.1 ml volume. n = 3 for each organ or tissue at each time point, except for kidney, lung at 5 min of male, and kidney, liver, duodenum, lung, ovary at 5 min of female (n = 2)

Page 12 of 14Wang et al. EJNMMI Res (2020) 10:126
exploration on the metabolism and biodistribution of thiamine.
Stability is important for PET tracer. 18F-deoxy-thia-mine was stable at RT. The RCP was > 95% 6 h, and > 93% 10 h after synthesis, which means no significant radi-olysis effect exists in vitro (Table 2) [33]. In addition, no 18F-deflourination of 18F-deoxy-thiamine in vivo was observed based on the phenomenon that the accu-mulation of radioactivity signal in bone was decreas-ing over time [34] (Fig. 7b, e). Also, the prototype form of 18F-deoxy-thiamine excreted in urine reached 96.63% within 85 min after vein injection (Fig. 6). These results demonstrated that 18F-deoxy-thiamine was highly stable both in vitro and in vivo.
Pharmacokinetic and metabolic kinetics studies as well as biodistribution study indicated that the uptake and clearance of 18F-deoxy-thiamine in vivo were fast, which is another important requirement. The t1/2β was 6.379 min; CL1 and CL2 were 2.674 g/min and 20.162 g/min, respectively (Table 3). The values of Cmax in various tissues and organs of ICR mice reached within 15 min (except for muscle of males, reached within 1 h), and the accumulation of 18F-deoxy-thiamine was very low in these tissues and organs till 4 h after injection (Fig. 7, Additional file 14: Table 2 and 3). Besides, at least one-third of 18F-deoxy-thiamine was excreted through kidney 85 min after injection. (A small amount of urine may be retained in bladder and not be collected.) See Additional file 14: supplementary Table 1.
Graphical analysis technique has been extensively applied in the analyses of nuclear medicine imaging data. It is especially suitable for pharmacokinetic stud-ies of novel tracers before the compartmental models are fully described, because it is independent of any specific model configuration [21]. We analyzed the important kinetic parameters Ki and VD in the brain of marmosets and in the liver and kidney of ICR mice employing Patlak and Logan plots, respectively, based on the characteris-tics of TACs in these organs (Figs. 3e, 4b, c). The VD in the kidney and liver of ICR mice were 6.17 ± 0.88 ml/g and 4.573 ± 0.34 ml/g, respectively. The results showed that the uptake and clearance of 18F-deoxy-thiamine in vivo were fast.
Thiamine consists of a pyrimidine ring with an elec-tronegative amidogen and a thiazole ring. The structural complexity determines the difficulty of artificially synthe-sizing and modifying thiamine. Since the first synthesis route was reported in 1937 [13], only a few studies on thiamine synthesis and modification have been pub-lished [35–37]. Recently, Doi et al. [37] synthesized radio-labeled thiamine with 11C and conducted heart imaging study in rats [38]. Although 11C-thiamine possesses the same molecular structure as thiamine itself, the short
half-life of 11C (20.4 min) limits its application. Also, 11C-thiamine would be phosphorylated to 11C-TDP fast via the –OH group in vivo [38], which complicates the interpretation of the radio-signal. Here, 18F-deoxy-thia-mine was successfully synthesized by a two-step route, in which –OH group of thiamine replaced by –18F (Fig. 1). Although the RCY was not high enough, the RCP, SA, and RCC were high (Table 1). The bacteria and endo-toxin tests were negative. These results indicated that 18F-deoxy-thiamine was safe and suitable for in vivo studies.
The most difficult part in our two-step route is the isolation and purification of the intermediate product 18F-compound (7). Though we have tried various solid phase extractions as well as preparative HPLC, either the isolation failed or the process became too compli-cated to be automated. The molecule of 4-methyl-5(beta-hydroxyethyl)-thiazole is solid, and its boiling point is 135 °C under vacuum [39]. Once –OH is changed to –F, however, this compound becomes oil and volatile at RT. We speculated that it was because the H bond connect-ing H and N was broken (Additional file 13: Figure 7). By distillation, we successfully isolated 18F-compound (7) and realized the automation of the radiosynthesis route.
ConclusionIn this study, we synthesized a novel PET tracer of 18F-deoxy-thiamine and established its automated syn-thesis route. Further, 18F-deoxy-thiamine was stable in vitro and in vivo, and possessed ideal characteristics of metabolic kinetics. The PET with 18F-deoxy-thiamine could evaluate the status of cerebral thiamine metabolism and might be more suitable for evaluating cerebral energy metabolism than FDG-PET due to the low abundance of cerebral thiamine metabolism. However, the sample size of marmosets in this study was not large enough, and we lack of TD model of marmosets to further investigate thiamine metabolism in non-human primates. This study laid the foundation for further studies on diseases related to thiamine dysmetabolism.
Supplementary informationSupplementary information accompanies this paper at https ://doi.org/10.1186/s1355 0-020-00710 -5.
Additional file 1: Figure 1. The scheme of radio-synthesis using an automated module.
Additional file 2: Figure 2. The synthesis route of cold standard sample of 18F-deoxy-thiamine as well as precursors (5) and (6).
Additional file 3: Figure 3A. A: The TLC analyses results of inter-mediate products in the synthesis route of cold standard sample of 18F-deoxy-thiamine.
Additional file 4: Figure 3B. B: HNMR result of precursor 5.

Page 13 of 14Wang et al. EJNMMI Res (2020) 10:126
Additional file 5: Figure 3C. C: LC-MS result of precursor 5, the purity has been highlighted.
Additional file 6: Figure 3D. D: HNMR result of precursor 6.
Additional file 7: Figure 3E. E: LC-MS result of precursor 6, the purity has been highlighted.
Additional file 8: Figure 3F. F: HNMR result of cold standard sample of 18F-deoxy-thiamine.
Additional file 9: Figure 3G. G: LC-MS result of cold standard sample of 18F-deoxy-thiamine, the purity has been highlighted.
Additional file 10: Figure 4. Blood-to-brain transfer rate constant Ki of 18F-deoxy-thiamine analyzed by Patlak plot in marmosets. A: M1, 3.1 years old. B: M2, 3.5 years old. C: M3, 5.4 years old. D: M4, 10.8 years old. The unit of Ki is ml/g/min.
Additional file 11: Figure 5. Distribution volume (VD) of 18F-deoxy-thiamine in liver analyzed by Logan plot in ICR mice. A–E: Each figure is for one of five ICR mice, respectively. The unit of VD is ml/g.
Additional file 12: Figure 6. Distribution volume (VD) of 18F-deoxy-thiamine in kidney analyzed by Logan plot in ICR mice. A–E: Each figure is for one of five ICR mice, respectively. The unit of VD is ml/g.
Additional file 13: Figure 7. The H bond connecting H and N of 4-methyl-5(beta-hydroxyethyl)-thiazole is broken.
Additional file 14.
AbbreviationsTDP: Thiamine diphosphate; TMP: Thiamine monophosphate; TD: Thiamine deficiency; PPP: Pentose phosphate pathway; TLC: Thin layer chromatography; ppm: Parts per million; ml/min: Ml per minute; RCY : Radiochemical yield; RCC : Radiochemical concentration; RCP: Radiochemical purity; SA: Specific radioactivity; AUC : Area under curve; RT: Room temperature; ROI: Region of interest; SUV: Standard uptake value; TAC : Time-activity curve; IF: Input func-tion; Ki: Transfer constants; PCA: Perchloric acid; VD: Distribution volume; SEM: Standard error of mean; CL: Clearance rate.
AcknowledgementsWe thank Profess Fengling Qing, Profess Xiuhua Xu, and Doctor Zenghao Chen for their assistance in synthesis routes.
Authors’ contributionsZC conceived the study. ZC and WC designed the study. WC, ZS, ZY, MH, GY, and XZ were responsible for radiosynthesis. WC, JD, SL, SS, JL, and GY was responsible for animal studies. The manuscript was drafted by WC and ZC. All authors read and approved the final manuscript.
FundingThis study was supported by grants from the National Key Research and Development Program Foundation of China (2016YFC1306403) to Chunjiu Zhong, Science and Technology Commission of Shanghai Municipality (20ZR1411300) to Changpeng Wang, National Natural Science Foundation of China (91332201) to Chunjiu Zhong, and Zhongshan Hospital Science Foun-dation (2018ZSQN28) to Changpeng Wang.
Availability of data and materialsThe datasets used in the current study are available from the corresponding author on reasonable request.
Ethical approval and consent to participateAll animal care and experimental procedures were carried out according to the guidelines of the Animal Care Committee of Fudan University. This study was approved by Medical Experimental Animal Administrative Committee of Fudan University, and the committee on medical ethics of Zhongshan Hospital, Fudan University.
Consent for publicationNot applicable.
Competing interestsChunjiu Zhong holds shares of Shanghai Rixin Biotech Co., Ltd., which focuses on the development of new drugs against Alzheimer’s disease. The other authors declare that he/she has no conflict of interest.
Author details1 Department of Neurology, Zhongshan Hospital, State Key Laboratory of Medical Neurobiology and Institute of Brain Science, Fudan University, Shanghai 200032, China. 2 Jiangsu Huayi Technology Co., Ltd., Jiangsu 215519, China. 3 PET Center, Huashan Hospital, Fudan University, Shanghai 200235, China. 4 Department of Clinical Pharmacology, Zhongshan Hospital, Fudan University, Shanghai 200032, China.
Received: 6 May 2020 Accepted: 24 September 2020
References 1. Talwar D, Davidson H, Cooney J, St JD. Vitamin B(1) status assessed by
direct measurement of thiamin pyrophosphate in erythrocytes or whole blood by HPLC: comparison with erythrocyte transketolase activation assay. Clin Chem. 2000;46:704–10.
2. Dhir S, Tarasenko M, Napoli E, Giulivi C. Neurological, psychiatric, and biochemical aspects of thiamine deficiency in children and adults. Front Psychiatry. 2019;10:207.
3. Hiffler L, Rakotoambinina B, Lafferty N, Martinez GD. Thiamine deficiency in tropical pediatrics: new insights into a neglected but vital metabolic challenge. Front Nutr. 2016;3:16.
4. Pan X, Fei G, Lu J, Jin L, Pan S, Chen Z, et al. Measurement of blood thiamine metabolites for Alzheimer’s disease diagnosis. EBio Med. 2016;3:155–62.
5. Bouzier-Sore AK, Voisin P, Bouchaud V, Bezancon E, Franconi JM, Pellerin L. Competition between glucose and lactate as oxidative energy substrates in both neurons and astrocytes: a comparative NMR study. Eur J Neurosci. 2006;24:1687–94.
6. Butterworth RF, Kril JJ, Harper CG. Thiamine-dependent enzyme changes in the brains of alcoholics: relationship to the Wernicke-Korsakoff syn-drome. Alcohol Clin Exp Res. 1993;17:1084–8.
7. Martin PR, Singleton CK, Hiller-Sturmhofel S. The role of thiamine defi-ciency in alcoholic brain disease. Alcohol Res Health. 2003;27:134–42.
8. Kril JJ, Harper CG. Neuroanatomy and neuropathology associated with Korsakoff’s syndrome. Neuropsychol Rev. 2012;22:72–80.
9. Opdenakker G, Gelin G, De Surgeloose D, Palmers Y. Wernicke encepha-lopathy: MR findings in two patients. Eur Radiol. 1999;9:1620–4.
10. Kornreich L, Bron-Harlev E, Hoffmann C, Schwarz M, Konen O, Schoenfeld T, et al. Thiamine deficiency in infants: MR findings in the brain. AJNR Am J Neuroradiol. 2005;26:1668–74.
11. Jankowska-Kulawy A, Bielarczyk H, Pawelczyk T, Wroblewska M, Szutowicz A. Acetyl-CoA deficit in brain mitochondria in experimental thiamine deficiency encephalopathy. Neurochem Int. 2010;57:851–6.
12. Gibson GE, Blass JP, Beal MF, Bunik V. The alpha-ketoglutarate-dehydroge-nase complex: a mediator between mitochondria and oxidative stress in neurodegeneration. Mol Neurobiol. 2005;31:43–63.
13. Cline JK, Williams RR, Finkelstein J. Studies of crystalline vitamin B1. XVII. Synthesis of vitamin B1. J Am Chem Soc. 1937;59:1052–4.
14. Laforest R, Sharp TL, Engelbach JA, Fettig NM, Herrero P, Kim J, et al. Meas-urement of input functions in rodents: challenges and solutions. Nucl Med Biol. 2005;32:679–85.
15. Lee YJ, Maeda J, Kusuhara H, Okauchi T, Inaji M, Nagai Y, et al. In vivo eval-uation of P-glycoprotein function at the blood-brain barrier in nonhuman primates using [11C]verapamil. J Pharmacol Exp Ther. 2006;316:647–53.
16. Wanek T, Traxl A, Bankstahl JP, Bankstahl M, Sauberer M, Langer O, et al. [(18)F]FDG is not transported by P-glycoprotein and breast cancer resistance protein at the rodent blood-brain barrier. Nucl Med Biol. 2015;42:585–9.
17. Patlak CS, Blasberg RG, Fenstermacher JD. Graphical evaluation of blood-to-brain transfer constants from multiple-time uptake data. J Cereb Blood Flow Metab. 1983;3:1–7.

Page 14 of 14Wang et al. EJNMMI Res (2020) 10:126
18. Patlak CS, Blasberg RG. Graphical evaluation of blood-to-brain transfer constants from multiple-time uptake data. J Cereb Blood Flow Metab. 1985;5:584–90.
19. Zhang Y, Huo M, Zhou J, Xie S. PKSolver: an add-in program for phar-macokinetic and pharmacodynamic data analysis in Microsoft Excel. Comput Methods Programs Biomed. 2010;99:306–14.
20. Logan J, Fowler JS, Volkow ND, Wolf AP, Dewey SL, Schlyer DJ, et al. Graphical analysis of reversible radioligand binding from time-activity measurements applied to [N-11C-methyl]-(-)-cocaine PET studies in human subjects. J Cereb Blood Flow Metab. 1990;10:740–7.
21. Logan J. A review of graphical methods for tracer studies and strategies to reduce bias. Nucl Med Biol. 2003;30:833–44.
22. Bettendorff L, Wins P. Thiamin diphosphate in biological chemistry: new aspects of thiamin metabolism, especially triphosphate derivatives acting other than as cofactors. FEBS J. 2009;276:2917–25.
23. Manzetti S, Zhang J, van der Spoel D. Thiamin function, metabolism, uptake, and transport. Biochemistry. 2014;53:821–35.
24. Sang S, Pan X, Chen Z, Zeng F, Pan S, Liu H, et al. Thiamine diphosphate reduction strongly correlates with brain glucose hypometabolism in Alzheimer’s disease, whereas amyloid deposition does not. Alzheimers Res Ther. 2018;10:26.
25. Lu J, Frank EL. Rapid HPLC measurement of thiamine and its phosphate esters in whole blood. Clin Chem. 2008;54:901–6.
26. Lu J, Pan X, Fei G, Wang C, Zhao L, Sang S, et al. Correlation of thiamine metabolite levels with cognitive function in the non-demented elderly. Neurosci Bull. 2015;31:676–84.
27. de Castro IP, Martins LM, Tufi R. Mitochondrial quality control and neurological disease: an emerging connection. Expert Rev Mol Med. 2010;12:e12.
28. Dienel GA. Brain glucose metabolism: integration of energetics with function. Physiol Rev. 2019;99:949–1045.
29. Wong KP, Sha W, Zhang X, Huang SC. Effects of administration route, dietary condition, and blood glucose level on kinetics and uptake of 18F-FDG in mice. J Nucl Med. 2011;52:800–7.
30. Klooster A, Larkin JR, Wiersema-Buist J, Gans RO, Thornalley PJ, Navis G, et al. Are brain and heart tissue prone to the development of thiamine deficiency? Alcohol. 2013;47:215–21.
31. Gangolf M, Czerniecki J, Radermecker M, Detry O, Nisolle M, Jouan C, et al. Thiamine status in humans and content of phosphorylated thiamine derivatives in biopsies and cultured cells. PLoS ONE. 2010;5:e13616.
32. Hilbig R, Rahmann H. Comparative autoradiographic investigations on the tissue distribution of benfotiamine versus thiamine in mice. Arzneim-ittelforschung. 1998;48:461–8.
33. Jacobson MS, Dankwart HR, Mahoney DW. Radiolysis of 2-[18F]fluoro-2-deoxy-D-glucose ([18F]FDG) and the role of ethanol and radioactive concentration. Appl Radiat Isot. 2009;67:990–5.
34. Chien DT, Szardenings AK, Bahri S, Walsh JC, Mu F, Xia C, et al. Early clinical PET imaging results with the novel PHF-tau radioligand [F18]-T808. J Alzheimers Dis. 2014;38:171–84.
35. Archer S, Perianayagam C. An attempt to apply lethal synthesis to the design of chemotherapeutic agents. Fluorinated 5 beta-(hydroxyethyl)-4-methylthiazoles. J Med Chem. 1979;22:306–9.
36. Lowe G, Potter BVL. Bacteriostatic activity of fluoro-analogues of 5-(2-hydroxyethyl)-4-methylthiazole, a metabolic intermediate in the biosynthesis of thiamine. J Chem Soc Perkin Trans. 1980;1:2026–8.
37. Doi H, Mawatari A, Kanazawa M, Nozaki S, Nomura Y, Kitayoshi T, et al. Synthesis of (11)C-labeled thiamine and fursultiamine for in vivo molecular imaging of vitamin B1 and its prodrug using positron emission tomography. J Org Chem. 2015;80:6250–8.
38. Nozaki S, Mawatari A, Nakatani Y, Hayashinaka E, Wada Y, Nomura Y, et al. PET imaging analysis of vitamin B1 kinetics with [(11)C]thiamine and its derivative [(11)C]thiamine tetrahydrofurfuryl disulfide in rats. Mol Imag-ing Biol. 2018;20:1001–7.
39. Amos WJ, Neal RA. Isolation and identification of 3-(2’-methyl-4’-amino-5’-pyrimidylmethyl)-4-methylthiazole-5-acetic acid (thiamine acetic acid) and 2-methyl-4-amino-5-formylaminomethylpyrimidine as metabolites of thiamine in the rat. J Biol Chem. 1970;245:5643–8.
Publisher’s NoteSpringer Nature remains neutral with regard to jurisdictional claims in pub-lished maps and institutional affiliations.