a ph-independent dna nanodevice for quantifying chloride transport in organelles of living cells
TRANSCRIPT

A pH-independent DNA nanodevice forquantifying chloride transport in organellesof living cellsSonali Saha1, Ved Prakash2, Saheli Halder1, Kasturi Chakraborty2 and Yamuna Krishnan1,2*
The concentration of chloride ions in the cytoplasm and subcellular organelles of living cells spans a wide range(5–130 mM), and is tightly regulated by intracellular chloride channels or transporters. Chloride-sensitive protein reportershave been used to study the role of these chloride regulators, but they are limited to a small range of chlorideconcentrations and are pH-sensitive. Here, we show that a DNA nanodevice can precisely measure the activity andlocation of subcellular chloride channels and transporters in living cells in a pH-independent manner. The DNAnanodevice, called Clensor, is composed of sensing, normalizing and targeting modules, and is designed to localize withinorganelles along the endolysosomal pathway. It allows fluorescent, ratiometric sensing of chloride ions across the entirephysiological regime. We used Clensor to quantitate the resting chloride concentration in the lumen of acidic organelles inDrosophila melanogaster. We showed that lumenal lysosomal chloride, which is implicated in various lysosomal storagediseases, is regulated by the intracellular chloride transporter DmClC-b.
Lumenal chloride is critical to organelle function and is regulatedby intracellular chloride transporters such as Cl−/H+ exchangersor chloride channels1–3. The small size of organelles and the dif-
ficulty in obtaining contamination-free intracellular membranes hasmade the study of subcellular chloride and its regulators technicallychallenging to address by electrophysiology. An alternative route toaddress the activity of a given intracellular chloride regulator ofinterest would be to quantify resting lumenal chloride within the rel-evant subcellular organelle. Chloride-sensitive protein reporters doexist, such as Clomelon4, Cl-Sensor5 and ClopHensor6. However,most are valid only over a limited range of chloride and are pH-sensitive. Subcellular organelles span a wide range of pH. Forexample, lysosomal pH is close to 5.0, the trans-Golgi networkhas a pH of 6.0, and the endoplasmic reticulum has a pH of 7.27.Moreover, chloride accumulation is frequently coupled to lumenalacidity and so pH-dependent chloride reporters cannot be used toassay intracellular chloride regulators8. ClopHensor—a possibleexception—is a chloride reporter with a built-in pH reporter,whereby chloride may be estimated using relatively complex pH cor-rection factors. However, because it is a binding-based sensor, it isnot applicable to all physiological chloride concentrations6.Chloride-sensitive small-molecule dyes such as 6-methoxy-N-(3-sulphopropyl) quinolinium (SPQ)9, 6-methoxy-quinolyl acetoethylester (MQAE)10 and lucigenin11 are other possibilities. They are pH-insensitive, function by collisional quenching, and are therefore uni-formly sensitive to chloride across the entire physiological regime12.However, these dyes cannot be specifically localized within orga-nelles. Attempts to target these dyes to specific organelles by chemi-cal conjugation to ligands or polymers lead to either massivefluorescence quenching and/or highly variable sensor character-istics, because the location and degree of functionalization on thepolymer cannot be controlled8,13. There is therefore an unmetneed for a fluorescent chloride sensor that (1) has uniform perform-ance characteristics, (2) operates over the entire physiological range
of [Cl−] and (3) is pH-independent so that it is able to quantifyorganellar chloride in living cells.
Nucleic acids are modular, targetable and programmable, and aretherefore well-suited for the design of specific, sensitive and quanti-tative reporters for molecular inputs that can be transduced intofluorescent readouts14,15. With nucleic acids one can realizemolecularly identical assemblies with negligible batch-to-batch vari-ation16–19. This results in nanodevices with highly uniform reportercharacteristics that are preserved across diverse cells and pathways,predisposing them to studies based on comparative assays.Molecularly identical sensors are critical for the study of inherentheterogeneities or spreads in resting analyte concentrationspresent in biological systems of different genetic backgrounds. Wehave realized nucleic-acid-based nanodevices that precisely reportthe pH associated with endosomal maturation16,20 and addresstheir crosstalk with the secretory pathway17. These moleculardevices can be coupled to simple organelle localization strategiesthat co-opt specific cellular trafficking pathways17,21. Here, weintegrate these trafficking strategies to specifically localize achloride-sensitive DNA-based nanodevice—called Clensor—within organelles along the endolysosomal pathway. We delineatea generalizable methodology to investigate the activity of intracellu-lar chloride regulators in living cells using this pH-independent,fluorescent, ratiometric DNA-based chloride reporter. We demon-strate this by identifying the localization and function of the CLCfamily of proteins along the endolysosomal pathway in Drosophilamelanogaster.
Design and in vitro characterization of ClensorClensor is composed of three modules: (1) sensing (P), (2) normal-izing (D2) and (3) targeting (D1) modules (Fig. 1a). Sensing moduleP is a 12-mer peptide nucleic acid (PNA) sequence conjugated to afluorescent, chloride-sensitive molecule 10,10′-bis[3-carboxypropyl]-9,9′-biacridinium dinitrate (BAC)8. Normalizing module D2 is a
1National Centre for Biological Sciences, TIFR, GKVK, Bellary Road, Bangalore 560065, India. 2Department of Chemistry, University of Chicago, 929E,57th Street, E305A, GCIS, Chicago, Illinois 60637, USA. *e-mail: [email protected]
ARTICLESPUBLISHED ONLINE: 22 JUNE 2015 | DOI: 10.1038/NNANO.2015.130
NATURE NANOTECHNOLOGY | VOL 10 | JULY 2015 | www.nature.com/naturenanotechnology 645
© 2015 Macmillan Publishers Limited. All rights reserved

38-mer DNA sequence bearing an Alexa 647 fluorophore (A647)that is Cl−-insensitive. Targeting module D1 is a 26-mer DNAsequence. P and D1 are hybridized to adjacent sites on D2, asshown in Fig. 1a. The dsDNA domain on Clensor, comprising D1and D2, functions as a negatively charged ligand for traffickingalong the endolysosomal pathway mediated by anionic ligandbinding receptors (ALBRs)16. To traffic Clensor along the transfer-rin pathway, we molecularly programmed the targeting module(D1) of Clensor by conjugating its 5′ terminus to a well-character-ized RNA aptamer (Tfapt) to the human transferrin receptor22 togive a DNA–RNA chimeric oligonucleotide called D1Tfapt(Fig. 1b). The chloride sensor thus programmed to target the trans-ferrin pathway consists of P, D2 and D1Tfapt , and is calledClensorTf. The formation of Clensor and ClensorTf was confirmedby a gel shift assay (Supplementary Fig. 1).
BAC undergoes collisional quenching specific to Cl− that isexpected to reduce its fluorescence intensity, G, linearly with [Cl−]8.In contrast, the fluorescence intensity of A647, R, remains constant(Fig. 1c). This results in different ratios of the emission intensities(R/G) for A647 (λEm = 670 nm, R) and BAC (λEm = 505 nm, G)over physiological [Cl−] (Fig. 1c,d). This ratiometric approachenables the quantitation of lumenal chloride, [Cl−]lumen, withinendolysosomal compartments. The fluorescence properties ofClensor (200 nM) were investigated as a function of [Cl−] to evalu-ate its Cl− sensitivity. As expected, R is unaffected with increasing[Cl−], while G decreases linearly (Fig. 1c). A plot of the normalizedR/G values as a function of [Cl−] yielded the in vitro Cl− calibrationprofile for Clensor (Fig. 1d). We see that the Cl− sensitivity ofClensor varies linearly with [Cl−] up to at least 120 mM, with aapparent Stern–Volmer quenching constant KSV of 12.9 M−1. To
check the pH sensitivity of Clensor’s chloride response, fluorescencespectra were recorded for Clensor (200 nM) in 1× modified Cl−-clamping buffer (buffer Cl− replaced with NO3
−), pH 5, containingdifferent added [Cl−] ranging from 5 mM to 200 mM. The plot ofnormalized R/G as a function of [Cl−], at pH 5, varies linearlywith Cl− from 0–200 mM with negligible change in Cl− sensitivitycompared to pH 7.4 (Supplementary Fig. 2). Furthermore, KSV
values obtained from the calibration profile of Clensor as a functionof pH reveal that the Cl− sensitivity of Clensor is pH-independentfrom pH 5 to 7.4 (Fig. 1e). This leaves Clensor well positioned toquantitate resting [Cl−]lumen in the background of changinglumenal pH.
Clensor enables first measurement of lysosomal [Cl−]We next proceeded to quantitate [Cl−] within specific endolyso-somal compartments, including early endosomes (EEs), late endo-somes (LEs), lysosomes (LYs) and recycling endosomes (REs). Totarget Clensor within specific endocytic compartments along theALBR23 and the transferrin receptor pathways24, we used two mol-ecular programming strategies. We have previously shown thatDNA nanodevices are endocytosed in Drosophila haemocytesthrough the ALBR pathway and can map pH along the endolyso-somal pathway16,25. We therefore chose Drosophila haemocytes toevaluate the intracellular performance of Clensor. Competitionexperiments with excess maleylated BSA (mBSA) confirmed thatClensor is internalized via this pathway (Fig. 2a). The residencetimes of internalized Clensor were determined in compartmentsalong this pathway, namely EEs, LEs and LYs. Drosophila haemo-cytes expressing fluorescent fusions of molecular markers such asYFP-Rab5 for EEs, YFP-Rab7 for LEs/LYs and GFP-LAMP for
a b c
d e
P
P
− CI−
+ CI−
D1Tfapt
D2
D2
D1
5.00
0 20 40 60 80
Nor
mal
ized
R/G
100 120
5
10
4
8
12
16
0 mM20 mM40 mM60 mM80 mM
15
20
25
1.0
1.5
2.0
2.5
5.5 6.0 6.5
pH[CI−] (mM)K sv
(M−1
)7.0 7.5
450 500 660 680
Wavelength (nm)
Inte
nsity
×10
5 (a.
u.)
700
Figure 1 | Design and characterization of Clensor and ClensorTf. a, Structure and working principle of Clensor. P, sensing module (pink line) containing aCl−-sensitive fluorophore, BAC (green filled circle); D2, normalizing module (brown line) containing a Cl−-insensitive fluorophore, Alexa 647 (red filledcircle); D1, targeting module (orange line). In the presence of Cl−, BAC undergoes collisional quenching, whereas fluorescence of Alexa 647 isCl−-independent. b, Modified sensor design for targeting to the recycling pathway (ClensorTf ). D1Tfapt, targeting module modified with an RNA aptamer(Tfapt) against the human transferrin receptor (cyan line). c, Fluorescence emission spectra of Clensor at the indicated [Cl−] obtained using λEx
BAC = 435 nm(green) and λEx
Alexa 647 = 650 nm (red). d, In vitro Cl− calibration profile of Clensor showing normalized Alexa 647 and BAC fluorescence intensity ratio (R/G)versus [Cl−]. R/G values at different chloride concentrations were normalized to the value at 5 mM chloride. e, Plot of KSV for Clensor versus pH. Error barsindicate the mean of three independent experiments ± s.e.m.
ARTICLES NATURE NANOTECHNOLOGY DOI: 10.1038/NNANO.2015.130
NATURE NANOTECHNOLOGY | VOL 10 | JULY 2015 | www.nature.com/naturenanotechnology646
© 2015 Macmillan Publishers Limited. All rights reserved

LYs26 were labelled with a Clensor scaffold carrying only A647(ClensorA647). Time-dependent co-localization revealed that inDrosophila haemocytes, Clensor is resident predominantly in theEEs, LEs and LYs at 5 min, 60 min and 120 min, respectively(Supplementary Fig. 8). Figure 2b shows representative co-localization images in haemocytes between the indicated fluorescentcompartment marker and ClensorA647 at the indicated chase times,which are consistent with previous studies16.
To quantify [Cl−] in REs ([Cl−]RE) using ClensorTf, we exploitedthe transferrin pathway in Drosophila S2R+ cells stably expressingthe human transferrin (Tf) receptor27. When co-pulsing S2R+ cellswith ClensorTf carrying only A647 (ClensorTfA647) and excess transfer-rin (+Tf), uptake of ClensorTfA647 was efficiently abolished, confirminginternalization via the transferrin receptor (Fig. 2c). NotablyClensorA647 was not endocytosed by S2R+ cells, indicating thatuptake was due to the transferrin aptamer engaging the transferrinreceptor (Fig. 2c). Co-localization experiments with a mixture ofAlexa 568 labelled transferrin (TfA568) and Clensor
TfA647 showed signifi-
cant co-localization (∼80%), revealing that ClensorTfA647 predominantlyresides in the REs 15 min post-endocytosis (Fig. 2d).
To check the intracellular functionality of Clensor, a standard Cl−
calibration profile was generated by clamping the [Cl−]lumen to that ofan externally added buffer containing known [Cl−] and a mixture ofnigericin, valinomycin and tributyltin chloride (TBT-Cl) at high [K+]28.Post endocytosis of Clensor, haemocytes were incubated in theclamping buffer for 1 h at room temperature and then imaged.The representative bitmap images presented in Fig. 3a indicatethat cells clamped at different [Cl−] show distinct R/G maps.Figure 3b shows a histogram of R/G ratios obtained from popu-lations of endosomes clamped at 5 mM, 40 mM and 80 mM[Cl−]. Endosomal R/G ratios showed a linear dependence on[Cl−], with an ∼2.5-fold change in R/G values from 5 mM to120 mM [Cl−] (Fig. 3c,d, red). A standard Cl− calibration profile
for ClensorTf in S2R+ cells also recapitulated these characteristics(Supplementary Fig. 10d). The intracellular and in vitro standardR/G profiles showed excellent correspondence, indicatingthat, post internalization, both Clensor and ClensorTf recapitulatein vitro sensing properties quantitatively within cells. The intra-cellular R/G versus [Cl−] calibration profile is used for allsubsequent determinations of endosomal chloride underphysiological conditions.
Spatiotemporal [Cl−] changes were acquired in organelles alongthe ALBR pathway in haemocytes isolated from wild-typeD. melanogaster (CS) larvae. Compartments along this pathway pro-gressively acidify, yielding a pH ranging from ∼6.0 in EEs to nearly∼5.0 in LYs16. Consistent with Cl− being the dominant counterionfor H+ entry, the concentration of [Cl−]lumen also increases alongthe endocytic pathway8. However, [Cl−]lumen in lysosomes([Cl−]LY) has not been reported thus far due to the lack of a suitablesensor3. In haemocytes, [Cl−] measurements were taken at chasetimes of 5, 60 and 120 min, corresponding to its residence in theEEs, LEs and LYs, respectively. Representative pseudocolourimages of the haemocytes indicate the progressive accumulationof Cl− (Fig. 4a). Histograms showing the spread of R/G ratioswere obtained from a population of endosomes in each organelle,as indicated in Fig. 4b. The distribution of R/G ratios revealed a dis-tinct shift to higher values, corresponding to an increase in[Cl−]lumen during maturation along the endosomal/lysosomalpathway, where the mean [Cl−]EE and [Cl−]LE of 37.0 ± 1.6 mMand 60.4 ± 2 mM, respectively, are consistent with previous studies(Supplementary Table 3)8,13. Similarly, ClensorTf reported a mean[Cl−]RE of 39.9 ± 1.2 mM, consistent with the literature (Table 1)13.Overall, this indicates that Clensor can reliably measure [Cl−] insubcellular compartments. Given that Clensor functionality isunaffected at lysosomal pH, we measured [Cl−]LY. Quantificationof the mean R/G values obtained from a population of lysosomes
ba
d
c
Nor
mal
ized
inte
nsity
5 m
in60
min
120
min
1.2
0.8
0.4
0.0
Nor
mal
ized
inte
nsity
1.2
AF
AF
−mBSA
−Tf +Tf Clensor
+mBSA
0.8
0.4
0.0
YFP-Rab5
YFP-Rab7
GFP-LAMP
TfA568 ClensorTfA647
ClensorA647
ClensorA647
ClensorA647 Merge
Merge
Merge
Merge
Figure 2 | Programming Clensor delivery to specific endocytic organelles. a, ClensorA647 internalization by haemocytes in the presence (+mBSA) andabsence (−mBSA) of excess competitor ligand maleylated BSA (mBSA, 10 μM) and autofluorescence (AF) in Drosophila haemocytes. Error bars indicate themean of three independent experiments ± s.e.m. (n = 20 cells). b, Trafficking of Clensor (ClensorA647) in haemocytes isolated from flies expressing YFP-Rab5(upper row), YFP-Rab7 (middle row) and GFP-LAMP (lower row) at the indicated chase times. ClensorA647-positive vesicles are shown in red and YFP-Rab5/YFP-Rab7/GFP-LAMP vesicles are shown in green. Scale bars, 10 μm. c, Competition experiments with ClensorTfA647 and excess unlabelled transferrin (Tf, 25 μM).Normalized intensities of cells pulsed with ClensorTfA647 in the presence (+Tf) and absence (–Tf) of Tf and ClensorA647 are shown. Error bars indicate themean of three independent experiments ± s.e.m. (n = 15 cells). d, Co-localization of ClensorTfA647 with transferrin (TfA568) in S2R+ cells. Scale bars, 10 μm.
NATURE NANOTECHNOLOGY DOI: 10.1038/NNANO.2015.130 ARTICLES
NATURE NANOTECHNOLOGY | VOL 10 | JULY 2015 | www.nature.com/naturenanotechnology 647
© 2015 Macmillan Publishers Limited. All rights reserved

revealed a mean [Cl−]LY of 108.5 ± 1.4 mM (Supplementary Table 3).To our knowledge, this is the first measurement of [Cl−]LY and is alsoconsistent with a theoretically computed of lysosomal [Cl−]29.
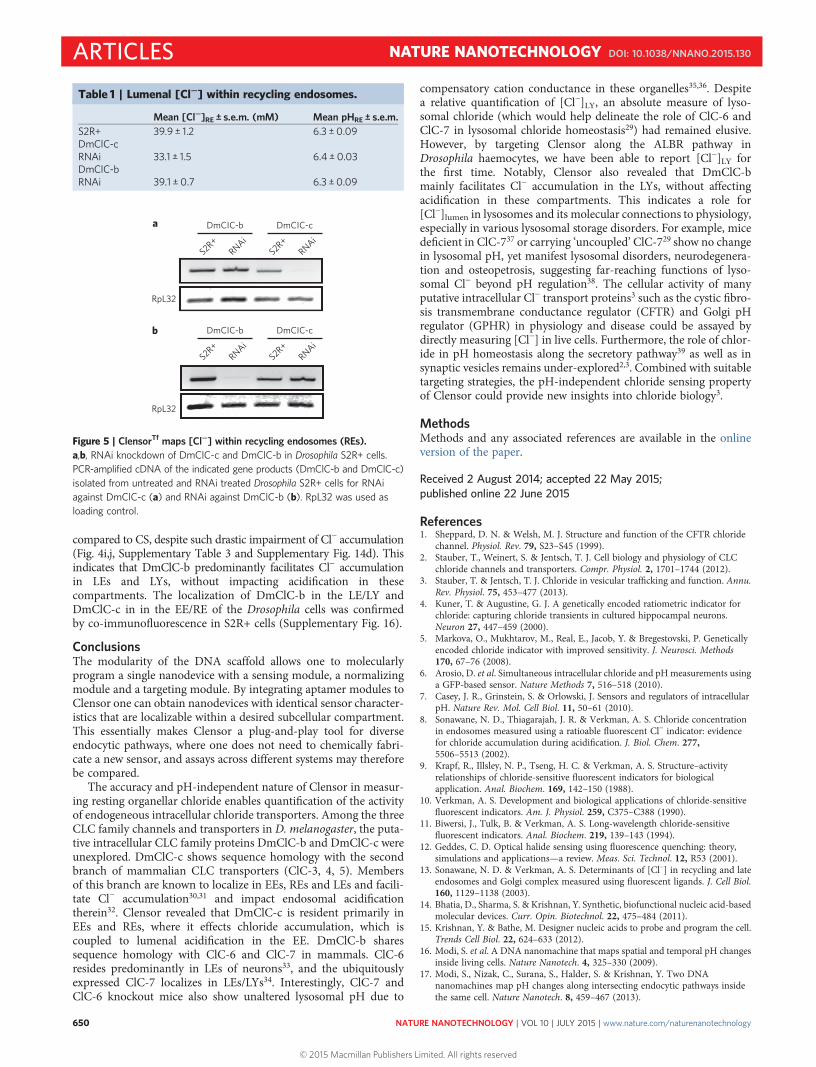
Localization and activity of DmClC-b and DmClC-cGiven that Clensor can reliably map absolute [Cl−] in specific endo-lysosomal compartments, as well as differences in [Cl−] in thesecompartments when Cl− conductance is chemically perturbed(Supplementary Table 4), we used it to pinpoint the localizationand activity of the putative intracellular CLC family proteins,DmClC-b and DmClC-c, in Drosophila (Supplementary Fig. 12).We investigated the function of DmClC-b and DmClC-c by geneti-cally perturbing each of these genes and specifically measuringdifferences in [Cl−] in EEs, LEs, LYs and REs. DmClC-b andDmClC-c were specifically and efficiently knocked down in S2R+cells by RNAi (Fig. 5a,b and Supplementary Fig. 13). [Cl−]RE wasmeasured in DmClC-c and DmClC-b knockdown S2R+ cellsusing ClensorTf. When DmClC-c was knocked down in S2R+cells, ClensorTf clearly revealed a modest reduction in Cl− accumu-lation in these compartments, from 39.9 ± 1.2 mM to 33.1 ± 1.5 mM,indicating its high sensitivity (Table 1). Interestingly, [Cl−]RE inDmClC-b RNAi cells remained unaltered (Table 1) indicating thatDmClC-c is responsible for Cl− accumulation in REs. To studythe impact of Cl− accumulation within REs on endosomal acidifica-tion, we carried out pH measurements in these compartments using
fluorescein isothiocyanate (FITC) conjugated to transferrin (Tf-FITC)25. Table 1 shows a negligible increase in pHRE (6.4 ± 0.03) in DmClC-c RNAi cells compared to untreated (6.3 ± 0.09) and DmClC-bRNAi (6.3 ± 0.09) cells.
To understand the role of DmClC-b and DmClC-c at each stageof endolysosomal maturation, we used UAS-RNAi-based depletionof DmClC-b and DmClC-c in Drosophila larvae and measured Cl−
accumulation using Clensor within EEs, LEs and LYs along theALBR pathway in haemocytes from these larvae. Analysis by poly-merase chain reaction with reverse transcription (RT-PCR) showedsignificant and specific reduction of the DmClC-b and DmClC-ctranscripts (Fig. 4c,d). In EEs of DmClC-c RNAi haemocytes, Cl−
accumulation was significantly decreased to 28.9 ± 0.8 mM com-pared to 37.0 ± 1.6 mM in CS (Fig. 4e, Supplementary Fig. 11aand Table 3). However, Cl− accumulation in LEs and LYs remainedunaltered (Fig. 4f,g, Supplementary Fig. 11b,c and SupplementaryTable 3). Notably, [Cl−]EE in haemocytes depleted of DmClC-bremained unaltered (Fig. 4e, Supplementary Fig. 11a andSupplementary Table 3), indicating that DmClC-c predominantlyfacilitates Cl− accumulation in EEs and REs.
To study the effect of Cl− accumulation on pHEE, haemocyteswere co-pulsed with FITC dextran (FD10) and ClensorA647 tomark EEs of the ALBR pathway. Compartmental pH was obtainedfrom λEx = 480/λEx = 430 intensity ratios from only those endo-somes containing FD10 as well as ClensorA647 (Fig. 4h and
a b
c d
Fold
cha
nge
in R
/G(5
–120
mM
CI− )
Nor
mal
ized
R/G
0.0In vitro
In vitro
Intracellular
Intracellular
0.5
1.0
1.5
2.0
2.5
1.00 40 80 120
1.5
2.0
2.5
[CI−] (mM)
No.
of v
esic
les
No.
of v
esic
les
No.
of v
esic
les
00 5 10 15 20
10
2020
0
30
R/G
00 5 10 15 20
10
20
5 mM
5 m
M40 mM
40 m
M
80 mM
80 m
M
00 5 10 15 20
20
40
60Alexa 647 R/G
Figure 3 | Quantitative performance of Clensor within subcellular organelles. a, Alexa 647 channel and respective pseudocolour R/G map of Drosophilahaemocytes pulsed with Clensor and clamped at 5, 40 and 80 mM Cl−. Scale bars, 10 μm. b, Histograms showing typical spread of R/G ratios of vesiclesclamped at 5, 40 and 80 mM Cl– (n≈ 10 cells, ≥50 endosomes). c, In vitro and intracellular fold change in R/G ratios of Clensor at 5 and 120 mM Cl−.d, Normalized R/G intensity (Alexa 647/BAC) ratios inside the endosomes, plotted as a function of [Cl−], yield the intracellular calibration profile (red),which is overlaid on the in vitro chloride calibration profile (black). Error bars indicate the mean of three independent experiments ± s.e.m. (n≈ 10 cells,≥50 endosomes).
ARTICLES NATURE NANOTECHNOLOGY DOI: 10.1038/NNANO.2015.130
NATURE NANOTECHNOLOGY | VOL 10 | JULY 2015 | www.nature.com/naturenanotechnology648
© 2015 Macmillan Publishers Limited. All rights reserved
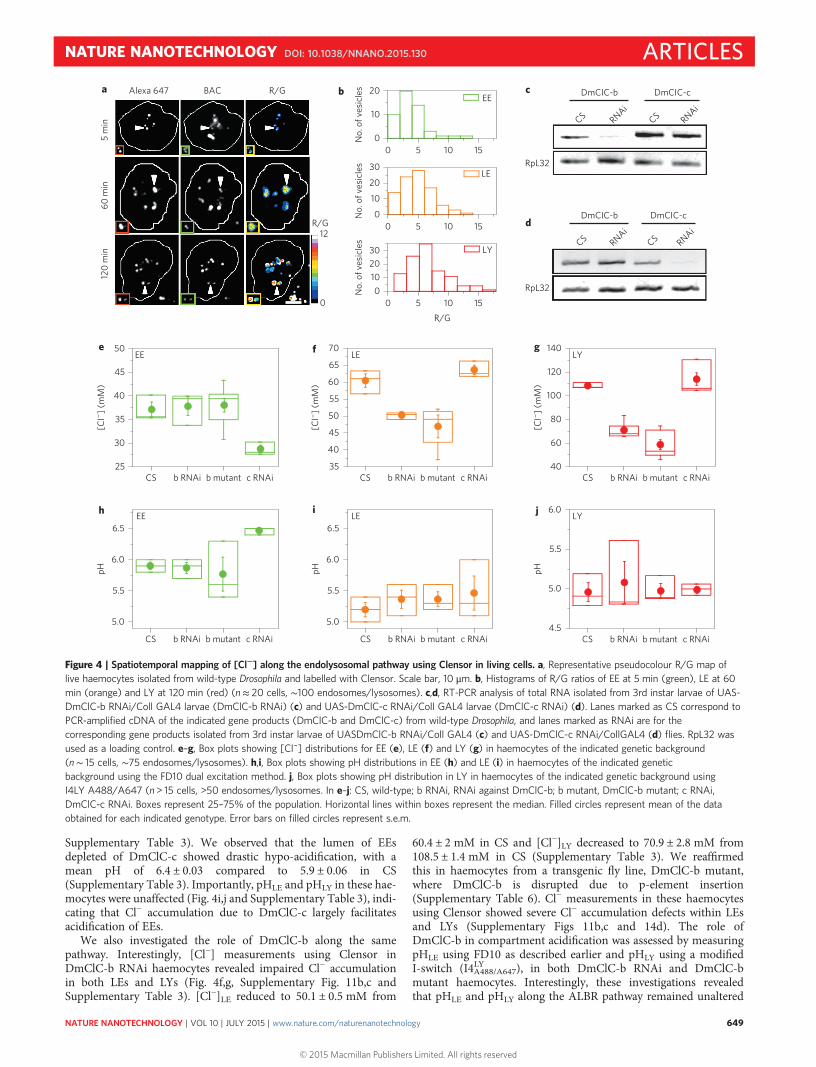
Supplementary Table 3). We observed that the lumen of EEsdepleted of DmClC-c showed drastic hypo-acidification, with amean pH of 6.4 ± 0.03 compared to 5.9 ± 0.06 in CS(Supplementary Table 3). Importantly, pHLE and pHLY in these hae-mocytes were unaffected (Fig. 4i,j and Supplementary Table 3), indi-cating that Cl− accumulation due to DmClC-c largely facilitatesacidification of EEs.
We also investigated the role of DmClC-b along the samepathway. Interestingly, [Cl−] measurements using Clensor inDmClC-b RNAi haemocytes revealed impaired Cl− accumulationin both LEs and LYs (Fig. 4f,g, Supplementary Fig. 11b,c andSupplementary Table 3). [Cl−]LE reduced to 50.1 ± 0.5 mM from
60.4 ± 2 mM in CS and [Cl−]LY decreased to 70.9 ± 2.8 mM from108.5 ± 1.4 mM in CS (Supplementary Table 3). We reaffirmedthis in haemocytes from a transgenic fly line, DmClC-b mutant,where DmClC-b is disrupted due to p-element insertion(Supplementary Table 6). Cl− measurements in these haemocytesusing Clensor showed severe Cl− accumulation defects within LEsand LYs (Supplementary Figs 11b,c and 14d). The role ofDmClC-b in compartment acidification was assessed by measuringpHLE using FD10 as described earlier and pHLY using a modifiedI-switch (I4LYA488/A647), in both DmClC-b RNAi and DmClC-bmutant haemocytes. Interestingly, these investigations revealedthat pHLE and pHLY along the ALBR pathway remained unaltered
a b c
d
e f g
i jh
RpL32
RpL32
CS b RNAi c RNAib mutant
CS RNAi
DmCIC-b
CS RNAi
DmCIC-c
CS RNAi
DmCIC-b
CS RNAi
DmCIC-c
pH
6.5
6.0
5.5
5.0
CS b RNAi c RNAib mutant
pH
6.5
6.0
5.5
5.0
CS b RNAi c RNAib mutant
pH
6.0LYLEEE
5.5
5.0
4.5
CS b RNAi c RNAib mutant
[CI− ]
(mM
)
25
30
35
40
45
50
CS b RNAi c RNAib mutant
[CI− ]
(mM
)
35
40
45
50
55
60
65
70
CS b RNAi c RNAib mutant
[CI− ]
(mM
)
LY
LY
LE
LE
EE
EE
40
60
80
100
120
140N
o. o
f ves
icle
s
0102030
00
12
5 10 15
No.
of v
esic
les
0
10
20
30
0 5 10 15
No.
of v
esic
les
0
10
20
0 5 10 15
R/G
R/G
R/GAlexa 647 BAC5
min
60 m
in12
0 m
in
Figure 4 | Spatiotemporal mapping of [Cl−] along the endolysosomal pathway using Clensor in living cells. a, Representative pseudocolour R/G map oflive haemocytes isolated from wild-type Drosophila and labelled with Clensor. Scale bar, 10 μm. b, Histograms of R/G ratios of EE at 5 min (green), LE at 60min (orange) and LY at 120 min (red) (n≈ 20 cells, ∼100 endosomes/lysosomes). c,d, RT-PCR analysis of total RNA isolated from 3rd instar larvae of UAS-DmClC-b RNAi/Coll GAL4 larvae (DmClC-b RNAi) (c) and UAS-DmClC-c RNAi/Coll GAL4 larvae (DmClC-c RNAi) (d). Lanes marked as CS correspond toPCR-amplified cDNA of the indicated gene products (DmClC-b and DmClC-c) from wild-type Drosophila, and lanes marked as RNAi are for thecorresponding gene products isolated from 3rd instar larvae of UASDmClC-b RNAi/Coll GAL4 (c) and UAS-DmClC-c RNAi/CollGAL4 (d) flies. RpL32 wasused as a loading control. e–g, Box plots showing [Cl¯] distributions for EE (e), LE (f) and LY (g) in haemocytes of the indicated genetic background(n∼ 15 cells, ∼75 endosomes/lysosomes). h,i, Box plots showing pH distributions in EE (h) and LE (i) in haemocytes of the indicated geneticbackground using the FD10 dual excitation method. j, Box plots showing pH distribution in LY in haemocytes of the indicated genetic background usingI4LY A488/A647 (n > 15 cells, >50 endosomes/lysosomes. In e–j: CS, wild-type; b RNAi, RNAi against DmClC-b; b mutant, DmClC-b mutant; c RNAi,DmClC-c RNAi. Boxes represent 25–75% of the population. Horizontal lines within boxes represent the median. Filled circles represent mean of the dataobtained for each indicated genotype. Error bars on filled circles represent s.e.m.
NATURE NANOTECHNOLOGY DOI: 10.1038/NNANO.2015.130 ARTICLES
NATURE NANOTECHNOLOGY | VOL 10 | JULY 2015 | www.nature.com/naturenanotechnology 649
© 2015 Macmillan Publishers Limited. All rights reserved
compared to CS, despite such drastic impairment of Cl− accumulation(Fig. 4i,j, Supplementary Table 3 and Supplementary Fig. 14d). Thisindicates that DmClC-b predominantly facilitates Cl− accumulationin LEs and LYs, without impacting acidification in thesecompartments. The localization of DmClC-b in the LE/LY andDmClC-c in in the EE/RE of the Drosophila cells was confirmedby co-immunofluorescence in S2R+ cells (Supplementary Fig. 16).
ConclusionsThe modularity of the DNA scaffold allows one to molecularlyprogram a single nanodevice with a sensing module, a normalizingmodule and a targeting module. By integrating aptamer modules toClensor one can obtain nanodevices with identical sensor character-istics that are localizable within a desired subcellular compartment.This essentially makes Clensor a plug-and-play tool for diverseendocytic pathways, where one does not need to chemically fabri-cate a new sensor, and assays across different systems may thereforebe compared.
The accuracy and pH-independent nature of Clensor in measur-ing resting organellar chloride enables quantification of the activityof endogeneous intracellular chloride transporters. Among the threeCLC family channels and transporters in D. melanogaster, the puta-tive intracellular CLC family proteins DmClC-b and DmClC-c wereunexplored. DmClC-c shows sequence homology with the secondbranch of mammalian CLC transporters (ClC-3, 4, 5). Membersof this branch are known to localize in EEs, REs and LEs and facili-tate Cl− accumulation30,31 and impact endosomal acidificationtherein32. Clensor revealed that DmClC-c is resident primarily inEEs and REs, where it effects chloride accumulation, which iscoupled to lumenal acidification in the EE. DmClC-b sharessequence homology with ClC-6 and ClC-7 in mammals. ClC-6resides predominantly in LEs of neurons33, and the ubiquitouslyexpressed ClC-7 localizes in LEs/LYs34. Interestingly, ClC-7 andClC-6 knockout mice also show unaltered lysosomal pH due to
compensatory cation conductance in these organelles35,36. Despitea relative quantification of [Cl−]LY, an absolute measure of lyso-somal chloride (which would help delineate the role of ClC-6 andClC-7 in lysosomal chloride homeostasis29) had remained elusive.However, by targeting Clensor along the ALBR pathway inDrosophila haemocytes, we have been able to report [Cl−]LY forthe first time. Notably, Clensor also revealed that DmClC-bmainly facilitates Cl− accumulation in the LYs, without affectingacidification in these compartments. This indicates a role for[Cl−]lumen in lysosomes and its molecular connections to physiology,especially in various lysosomal storage disorders. For example, micedeficient in ClC-737 or carrying ‘uncoupled’ ClC-729 show no changein lysosomal pH, yet manifest lysosomal disorders, neurodegenera-tion and osteopetrosis, suggesting far-reaching functions of lyso-somal Cl− beyond pH regulation38. The cellular activity of manyputative intracellular Cl− transport proteins3 such as the cystic fibro-sis transmembrane conductance regulator (CFTR) and Golgi pHregulator (GPHR) in physiology and disease could be assayed bydirectly measuring [Cl−] in live cells. Furthermore, the role of chlor-ide in pH homeostasis along the secretory pathway39 as well as insynaptic vesicles remains under-explored2,3. Combined with suitabletargeting strategies, the pH-independent chloride sensing propertyof Clensor could provide new insights into chloride biology3.
MethodsMethods and any associated references are available in the onlineversion of the paper.
Received 2 August 2014; accepted 22 May 2015;published online 22 June 2015
References1. Sheppard, D. N. & Welsh, M. J. Structure and function of the CFTR chloride
channel. Physiol. Rev. 79, S23–S45 (1999).2. Stauber, T., Weinert, S. & Jentsch, T. J. Cell biology and physiology of CLC
chloride channels and transporters. Compr. Physiol. 2, 1701–1744 (2012).3. Stauber, T. & Jentsch, T. J. Chloride in vesicular trafficking and function. Annu.
Rev. Physiol. 75, 453–477 (2013).4. Kuner, T. & Augustine, G. J. A genetically encoded ratiometric indicator for
chloride: capturing chloride transients in cultured hippocampal neurons.Neuron 27, 447–459 (2000).
5. Markova, O., Mukhtarov, M., Real, E., Jacob, Y. & Bregestovski, P. Geneticallyencoded chloride indicator with improved sensitivity. J. Neurosci. Methods170, 67–76 (2008).
6. Arosio, D. et al. Simultaneous intracellular chloride and pHmeasurements usinga GFP-based sensor. Nature Methods 7, 516–518 (2010).
7. Casey, J. R., Grinstein, S. & Orlowski, J. Sensors and regulators of intracellularpH. Nature Rev. Mol. Cell Biol. 11, 50–61 (2010).
8. Sonawane, N. D., Thiagarajah, J. R. & Verkman, A. S. Chloride concentrationin endosomes measured using a ratioable fluorescent Cl− indicator: evidencefor chloride accumulation during acidification. J. Biol. Chem. 277,5506–5513 (2002).
9. Krapf, R., Illsley, N. P., Tseng, H. C. & Verkman, A. S. Structure–activityrelationships of chloride-sensitive fluorescent indicators for biologicalapplication. Anal. Biochem. 169, 142–150 (1988).
10. Verkman, A. S. Development and biological applications of chloride-sensitivefluorescent indicators. Am. J. Physiol. 259, C375–C388 (1990).
11. Biwersi, J., Tulk, B. & Verkman, A. S. Long-wavelength chloride-sensitivefluorescent indicators. Anal. Biochem. 219, 139–143 (1994).
12. Geddes, C. D. Optical halide sensing using fluorescence quenching: theory,simulations and applications—a review. Meas. Sci. Technol. 12, R53 (2001).
13. Sonawane, N. D. & Verkman, A. S. Determinants of [Cl–] in recycling and lateendosomes and Golgi complex measured using fluorescent ligands. J. Cell Biol.160, 1129–1138 (2003).
14. Bhatia, D., Sharma, S. & Krishnan, Y. Synthetic, biofunctional nucleic acid-basedmolecular devices. Curr. Opin. Biotechnol. 22, 475–484 (2011).
15. Krishnan, Y. & Bathe, M. Designer nucleic acids to probe and program the cell.Trends Cell Biol. 22, 624–633 (2012).
16. Modi, S. et al. A DNA nanomachine that maps spatial and temporal pH changesinside living cells. Nature Nanotech. 4, 325–330 (2009).
17. Modi, S., Nizak, C., Surana, S., Halder, S. & Krishnan, Y. Two DNAnanomachines map pH changes along intersecting endocytic pathways insidethe same cell. Nature Nanotech. 8, 459–467 (2013).
RpL32
a
b
RpL32
S2R+RNAi
DmCIC-b
S2R+RNAi
DmCIC-c
S2R+RNAi
DmCIC-b
S2R+RNAi
DmCIC-c
Figure 5 | ClensorTf maps [Cl−] within recycling endosomes (REs).a,b, RNAi knockdown of DmClC-c and DmClC-b in Drosophila S2R+ cells.PCR-amplified cDNA of the indicated gene products (DmClC-b and DmClC-c)isolated from untreated and RNAi treated Drosophila S2R+ cells for RNAiagainst DmClC-c (a) and RNAi against DmClC-b (b). RpL32 was used asloading control.
Table 1 | Lumenal [Cl−] within recycling endosomes.
Mean [Cl−]RE ± s.e.m. (mM) Mean pHRE ± s.e.m.S2R+ 39.9 ± 1.2 6.3 ± 0.09DmClC-cRNAi 33.1 ± 1.5 6.4 ± 0.03DmClC-bRNAi 39.1 ± 0.7 6.3 ± 0.09
ARTICLES NATURE NANOTECHNOLOGY DOI: 10.1038/NNANO.2015.130
NATURE NANOTECHNOLOGY | VOL 10 | JULY 2015 | www.nature.com/naturenanotechnology650
© 2015 Macmillan Publishers Limited. All rights reserved
18. Bhatia, D. et al. Icosahedral DNA nanocapsules by modular assembly.Angew. Chem. Int. Ed. 48, 4134–4137 (2009).
19. Lee, H. et al. Molecularly self-assembled nucleic acid nanoparticles for targetedin vivo siRNA delivery. Nature Nanotech. 7, 389–393 (2012).
20. Surana, S., Bhat, J. M., Koushika, S. P. & Krishnan, Y. An autonomous DNAnanomachine maps spatiotemporal pH changes in a multicellular livingorganism. Nature Commun. 2, 340 (2011).
21. Modi, S., Halder, S., Nizak, C. & Krishnan, Y. Recombinant antibody mediateddelivery of organelle-specific DNA pH sensors along endocytic pathways.Nanoscale 6, 1144–1152 (2014).
22. Wilner, S. E. et al. An RNA alternative to human transferrin: a new tool fortargeting human cells. Mol. Ther. Nucleic Acids 1, e21 (2012).
23. Guha, A., Sriram, V., Krishnan, K. S. & Mayor, S. Shibire mutations revealdistinct dynamin-independent and -dependent endocytic pathways inprimary cultures of Drosophila hemocytes. J. Cell Sci. 116, 3373–3386 (2003).
24. Mayle, K. M., Le, A. M. & Kamei, D. T. The intracellular trafficking pathway oftransferrin. Biochim. Biophys. Acta 1820, 264–281 (2012).
25. Bhatia, D., Surana, S., Chakraborty, S., Koushika, S. P. & Krishnan, Y. A syntheticicosahedral DNA-based host–cargo complex for functional in vivo imaging.Nature Commun. 2, 339 (2011).
26. Huotari, J. & Helenius, A. Endosome maturation. EMBO J. 30,3481–3500 (2011).
27. Gupta, G. D. et al. Analysis of endocytic pathways in Drosophila cells reveals aconserved role for GBF1 in internalization via GEECs. PLoSONE 4, e6768 (2009).
28. Krapf, R., Berry, C. A. & Verkman, A. S. Estimation of intracellular chlorideactivity in isolated perfused rabbit proximal convoluted tubules using afluorescent indicator. Biophys J. 53, 955–962 (1988).
29. Weinert, S. et al. Lysosomal pathology and osteopetrosis upon loss of H+-drivenlysosomal Cl– accumulation. Science 328, 1401–1403 (2010).
30. Hara-Chikuma, M. et al. ClC-3 chloride channels facilitate endosomalacidification and chloride accumulation. J. Biol. Chem. 280, 1241–1247 (2005).
31. Hara-Chikuma, M., Wang, Y., Guggino, S. E., Guggino, W. B. & Verkman, A. S.Impaired acidification in early endosomes of ClC-5 deficient proximal tubule.Biochem. Biochem. Biophys. Res. Commun. 329, 941–946 (2005).
32. Mohammad-Panah, R. et al. An essential role for ClC-4 in transferrin receptorfunction revealed in studies of fibroblasts derived from Clcn4-null mice. J. CellSci. 122, 1229–1237 (2009).
33. Poët, M. et al. Lysosomal storage disease upon disruption of the neuronalchloride transport protein ClC-6. Proc. Natl Acad. Sci. USA 103,13854–13859 (2006).
34. Kasper, D. et al. Loss of the chloride channel ClC-7 leads to lysosomal storagedisease and neurodegeneration. EMBO J. 24, 1079–1091 (2005).
35. Mindell, J. A. Lysosomal acidification mechanisms. Annu. Rev. Physiol.74, 69–86 (2012).
36. DiCiccio, J. E. & Steinberg, B. E. Lysosomal pH and analysis of the counter ionpathways that support acidification. J. Gen. Physiol. 137, 385–390 (2011).
37. Kornak, U. et al. Loss of the ClC-7 chloride channel leads to osteopetrosis inmice and man. Cell 104, 205–215 (2001).
38. Scott, C. C. & Gruenberg, J. Ion flux and the function of endosomes andlysosomes: pH is just the start. BioEssays 33, 103–110 (2011).
39. Weisz, O. A. Acidification and protein traffic. Int. Rev. Cytol. 226,259–319 (2003).
AcknowledgementsThe authors thank the Central Imaging and Flow Facility at the National Centre forBiological Sciences (NCBS) for imaging. This work was funded by the Wellcome TrustDepartment of Biotechnology (DBT), the India Alliance and the University of Chicago.S.S., S.H. and V.P. acknowledge the Council of Scientific and Industrial Research (CSIR),Government of India, for fellowship. FLIM experiments were performed at theNorthwestern University Center for Advanced Microscopy supported by NCI CCSG P30CA060553 awarded to the Robert H. Lurie Comprehensive Cancer Center.
Author contributionsS.S., K.C., V.P. and Y.K. conceived and designed the experiments. S.S., V.P. and K.C.performed the experiments. S.H. designed the I4LYA488/A647 used herein. S.S., V.P., K.C. andY.K. analysed the data. S.S. and Y.K. co-wrote the paper. All authors commented onthe manuscript.
Additional informationSupplementary information is available in the online version of the paper. Reprints andpermissions information is available online at www.nature.com/reprints. Correspondence andrequests for materials should be addressed to Y.K.
Competing financial interestsThe authors declare no competing financial interests.
NATURE NANOTECHNOLOGY DOI: 10.1038/NNANO.2015.130 ARTICLES
NATURE NANOTECHNOLOGY | VOL 10 | JULY 2015 | www.nature.com/naturenanotechnology 651
© 2015 Macmillan Publishers Limited. All rights reserved

MethodsFly stocks and cell culture. All fly stocks were obtained from Bloomington StockCentre at Indiana University, unless otherwise indicated (Supplementary Table 6),and were maintained as described earlier40. Haemocytes were obtained fromDrosophila 3rd instar larvae as described previously40. S2R+ cells were a gift fromSatyajit Mayor’s laboratory27 and were maintained as described previously27.
Sample preparation. High-performance liquid chromatography (HPLC) purifiedand lyophilized oligonucleotides (IBA GmbH) and PNA oligomer were dissolved inMilli-Q water (Millipore), aliquoted and stored at −20 °C until further use. Stocksolutions of Clensor were prepared at a final concentration of 10 μM by mixing D1,D2 and P in an equimolar ratio in 10 mM sodium phosphate buffer, pH 7.4. ForClensorTf samples, D1Tfapt, D2 and P were mixed in equimolar ratios at a finalconcentration of 10 μM in 10 mM sodium phosphate buffer, pH 7.4, containing1 mM EDTA, pH 8. For I4LYA488/A647 sample preparation, 5 μM of I4 and I4′ weremixed in equimolar ratios in 20 mM potassium phosphate buffer, pH 5.5, containing100 mM KCl. Annealing was performed by heating the solution at 90 °C for 5 minand cooling at a rate of 5 °C/15 min.
Steady-state fluorescence measurements. All fluorescence studies were carried outon a Fluoromax-4 (Horiba Scientific) spectrophotometer. A 10 μM stock of Clensorwas diluted to a final concentration of 200 nM using 10 mM sodium phosphatebuffer, pH 7.4 or 1× modified pH clamping buffer with pH ranging from 5 to 7, andincubated for 30 min at room temperature before experiments. The emission spectraof BAC and A647 were acquired by exciting the samples at 435 nm (λEx
BAC) and650 nm (λEx
A647), respectively. Emission spectra of BAC and A647 were collectedbetween 495 and 550 nm and 650 and 700 nm, respectively. To study the chloridesensitivity of Clensor, final values of [Cl−] ranging between 5 mM to 200 mM wereachieved by adding microlitre aliquots of a 1 M stock of NaCl to the samples. Theemission intensity of BAC at 505 nm (G) was normalized to the emission intensity ofA647 at 670 nm (R). The fold change in R/G ratio was calculated from the ratio ofR/G values at two specific values of [Cl−].
Co-localization assays. Transgenic flies expressing UAS-YFP.Rab5 (BloomingtonDrosophila Stock Center at Indiana University), UAS-YFP.Rab7 (BloomingtonDrosophila Stock Center at Indiana University) and UAS-GFP.LAMP1 were crossedwith flies expressing haemocytes-specific driver Collagen-GAL4. All crosses weremaintained at 25 °C. Haemocytes from larvae obtained from these crosses wereisolated and pulsed with 1 μM ClensorA647 (Clensor scaffold carrying only Alexa647) for 5 min, followed by chase periods of 5, 60 and 120 min, as specified, at 20 °C.The cells were then washed with 1× M1 buffer and imaged.
S2R+ cells were labelled with a mixture of 1 μM ClensorTfA647 (ClensorTf scaffold
carrying only Alexa 647) and 100 nM TfA568, as described earlier.
Chloride clamping of cells. Haemocytes and S2R+ cells were pulsed with 2 μMClensor and ClensorTf, respectively. Haemocytes were then fixed withparaformaldehyde (2.5% PFA) for 2 min at room temperature and clamped at thedesired [Cl−] by incubation in appropriate chloride clamping buffer containing
10 μM nigericin, 10 μM valinomycin and 10 μM TBT-Cl for 1 h atroom temperature.
Cells were fixed with 2.5% PFA for 20 min at room temperature and clamped atthe desired [Cl−] by incubation in appropriate chloride clamping buffer containing10 μMnigericin, 10 μMvalinomycin, 5 μMcarbonyl cyanide-m-chlorophenylhydrazone,10 μMmonensin and 200 nM bafilomycin for 3 h at room temperature.
Chloride measurements. For chloride measurements, haemocytes were pulsed with2 μM Clensor and then chased for (1) 5 min (EE), (2) 60 min (LE) and (3) 120 min(LY). Each set of cells was then imaged in BAC as well as A647 channels for eachfield of view, as described in the image analysis section. To measure chlorideconcentrations in REs, S2R+ cells were pulsed with ClensorTf , chased for 15 minand then imaged.
RNAi in S2R+ cells. Depletions were performed as described previously41.
pH clamping and measurement. For the intracellular pH calibration curve,haemocytes and S2R+ cells were labelled with FD10 (2 mg ml–1)/I4LYA488/A647 (1 μM)and Tf-FITC (100 nM), respectively. The cells were then clamped at the desired pHas described earlier16. pHEE, pHLE and pHRE measurements using FD10/ Tf-FITCwere performed as described earlier25. pHLY measurements using I4LYA488/A647 wereperformed as described earlier16.
Fluorescence microscope set-up. For chloride measurements, cells were imaged onan Olympus IX81 (Olympus) inverted microscope equipped with a mercury halidelamp (Olympus) and a 512 × 512, iXonEMCCD camera (Andor) using Micro-Manager 1.4.7 software (The University of California, San Francisco). BAC channelimages (referred to as ‘G’) were acquired using a 480/20 band pass excitation filter, a535/40 band pass emission filter and an 86023bs-FITC/Cy5 as dichroic filter. A647channel images (referred to as ‘R’) were obtained using a 640/30 band pass excitationfilter, a 690/50 band pass emission filter and an HQ665lp-665 long passdichroic filter.
For pH measurements, two sets of images were acquired by exciting the cellsusing 430/30 (λEx430) and 480/30 (λEx480) band pass excitation filters. In both cases,emissions were collected using a 535/40 band pass emission filter and an 89006bs-CFP/YFP/RFP dichroic filter. For pH measurements in haemocytes, one extra set ofimages was acquired in the A647 channel.
Image analysis. Images were analysed with ImageJver 1.47 (NIH).
References40. Sriram, V., Krishnan, K. S. & Mayor, S. Deep-orange and carnation define
distinct stages in late endosomal biogenesis in Drosophila melanogaster.J. Cell Biol. 161, 593–607 (2003).
41. Clemens, J. C. et al. Use of double-stranded RNA interference in Drosophila celllines to dissect signal transduction pathways. Proc. Natl Acad. Sci. USA 97,6499–6503 (2000).
ARTICLES NATURE NANOTECHNOLOGY DOI: 10.1038/NNANO.2015.130
NATURE NANOTECHNOLOGY | www.nature.com/naturenanotechnology
© 2015 Macmillan Publishers Limited. All rights reserved