a phylogeographic and taxonomic assessment of the squirrel ...accurate biogeographic narrative....
TRANSCRIPT
This file is part of the following reference:
Ferraro, Paul Anthony (2012) A phylogeographic and
taxonomic assessment of the squirrel - mahogany glider
complex. Masters (Research) thesis, James Cook
University.
Access to this file is available from:
http://eprints.jcu.edu.au/29137/
The author has certified to JCU that they have made a reasonable effort to gain
permission and acknowledge the owner of any third party copyright material
included in this document. If you believe that this is not the case, please contact
[email protected] and quote http://eprints.jcu.edu.au/29137/
ResearchOnline@JCU

A phylogeographic and taxonomic assessment of
the squirrel – mahogany glider complex
Thesis submitted by
Paul Anthony FERRARO BSc (Hons)
In August 2012
For the degree of Master of Science
In the School of Marine and Tropical Biology
James Cook University

II
DECLARATIONS
Declarations
Statement of Access
I, the undersigned, the author of this thesis, understand that James Cook University
will make this thesis available for use within the University Library and Australian
Digital Thesis Network for use elsewhere.
I understand that, as an unpublished work, a thesis has significant protection under
the Copyright Act and;
I do not wish to place any further restrictions on access to this work.
Statement of Sources
I declare that this thesis is my own work and has not been submitted in any form for
another degree or diploma at any university or other institution of tertiary education.
Information derived from the published or unpublished work of others has been
acknowledged in the text and a list of references is given.
Declaration of Ethics
I also declare that all research reported in the thesis complied with the guidelines of,
and was approved by, the Animal Ethics Committee of James Cook University under
Ethics Approval No. A1044.
_______________ Paul A Ferraro Date

III
STATEMENT ON THE CONTRIBUTION OF OTHERS
Statement on the Contribution of Others
Financial Support
Financial support for this research was provided primarily by the Rainforest Co-
operative Research Centre (CRC) through their Research Support Scheme. Funding
was also awarded by James Cook University through a Supplemental IRA, Museum
Victoria’s 1854 Student Scholarship, the Linnean Society of NSW via the Joyce W
Vickery Scientific Research Fund, the Environmental Protection Agency and the
Thorsborne Trust.
Data Acquisition
The highly endangered mahogany glider is notoriously difficult to trap, requiring large
investments of both time and money to gather sufficient samples for robust
morphological and genetic datasets. As such, field work for this research was
conducted in conjunction with Queensland Parks and Wildlife Services (QPWS),
namely Mark Parsons (QPWS Wet Tropics) and Tina Ball (QPWS Mackay), who
provided morphological information and tissue samples from 78 mahogany gliders.
Additional morphological and genetic data for the mahogany glider was sourced from
Queensland Museum (20 individuals) and the personal collection of Dr Steve
Jackson (33 individuals). QPWS also collected morphological and molecular data
from 89 squirrel gliders. Further squirrel glider data was sourced from a number of
eastern Australian research institutions, specifically Queensland Museum (35
individuals), Australia Museum (104 individuals) and Museum Victoria (24
individuals). Jane DeGabriel also provided tissue samples and morphological
measurements from 16 adult squirrel gliders.

IV
STATEMENT ON THE CONTRIBUTION OF OTHERS
Supervisors
Each of the following supervisors provided both general advice and specialist
assistance throughout the period of this research: Dr Adnan Moussalli, Professor
Christopher Johnson, Associate Professor John Winter, Dr Janette Norman, Mr
Peter Latch and Professor Lin Schwarzkopf.

V
ACKNOWLEDGEMENTS
Acknowledgements
There are many people that I wish to formally acknowledge for their assistance and
support during my time as an MSc student.
I am extremely grateful for the support and guidance of my rotating roster of
supervisors: Christopher Johnson, Adnan Moussalli, John Winter, Peter Latch,
Janette Norman and Lin Schwarzkopf. This thesis would not have been possible
without their collective assistance.
I am indebted to the following funding bodies for their financial support: the Linnean
Society of NSW, the Rainforest CRC, Museum Victoria, the Environmental
Protection Agency and the Thorsborne Trust. Supplementary Internal Research
Allocation funds from James Cook University were also greatly appreciated.
I recognise the ‘in-kind’ contribution of my institutional partner, Museum Victoria, for
the provision of laboratory and desk space. Undoubtedly, conversations with, and
advice from, Dr. Joanna Sumner, Frank Rheindt, Vanessa White, Fiona Hogan,
Joshua Hale, Katie Smith, Susi Maldonaldo and Linzi Wilson-Wilde have made their
way into this thesis – thanks guys and girls. Numerous chats with the Museum’s in-
house mammal men, Wayne Longmore and Rory O’Brien, greatly helped shape my
understanding of the ecology of eastern Australia’s endemic fauna. A round of
applause must also go to Stella Claudius; key-bearer, treasure-keeper and conduit to
the daily activities of Melbourne Museum.

VI
ACKNOWLEDGEMENTS
As an interstate off-campus student, I have been greatly assisted by members of the
School’s administrative arm, both past and present. Above all others, Debbie Ford
patiently and promptly responded to my every emailed question, query and quiz.
I am grateful for the efforts of Mark Parsons (Queensland Parks and Wildlife
Services Wet Tropics) and his network of assistants and co-workers for the collection
of mahogany glider tissue samples and morphological information. Mark’s efforts laid
the foundations for both the molecular and taxonomic components of my study of the
highly endangered mahogany glider. Thanks also to Stephen Jackson, a rare
individual who combines a friendly demeanour with professional passion and an
encyclopaedic knowledge of all things mahogany glider.
Finally, my thanks to the following institutions for providing me with critical tissue and
morphological data: Queensland Parks and Wildlife Services, James Cook
University, Australian National Wildlife Collection, Australian Museum and Museum
Victoria.

VII
ABSTRACT
Abstract
Quaternary climate fluctuations, such as the contraction-expansion cycles of eastern
Australia’s widespread forested biome, are widely cited as driving factors in
speciation and extinction. Incorporating morphological and molecular data, I
examined two representatives of an eastern Australian open forest species complex
with contrasting distributional patterns, the geographically restricted mahogany glider
(Petaurus gracilis) and its widespread congener, the squirrel glider (P. norfolcensis),
with the aim of assessing existing taxonomic boundaries and establishing an
accurate biogeographic narrative.
Current taxonomy of the squirrel – mahogany glider complex, as defined by existing
distributional, behavioural and ecological data, support species status for each
glider. However, molecular and morphological data presented in this study intimate a
more nuanced evolutionary scenario. Mitochondrial (mtDNA) sequences assorted
independent of taxonomy yet identified two partially overlapping, geographically
oriented lineages, one restricted to north-eastern Australia and the other more
widespread across eastern Australia. MtDNA substructure was also observed among
south-eastern Australian squirrel glider populations. Although less clearly defined,
geographic orientation among nuclear (nDNA) sequences was also detected. In
contrast, morphological variation within the complex clearly differentiated the
mahogany glider from the squirrel glider, with the former significantly larger. Minor
morphological variation was also detected in squirrel glider populations in south-
eastern Australia, mirroring mtDNA substructure.

VIII
ABSTRACT
Phylogeographic structure of the squirrel – mahogany glider complex was then
compared to that of two co-distributed open forest congeners, namely the sugar (P.
breviceps) and yellow-bellied (P. australis) gliders. MtDNA diversity was similarly
structured across all species, with each represented by two divergent mtDNA
lineages, although the depth of divergence differed. Biogeographic subdivisions in
the squirrel – mahogany glider complex were more similar to those of the patchily
distributed yellow-bellied glider than the widespread sugar glider. In the squirrel –
mahogany glider complex, north-eastern Australian populations were clearly isolated
from eastern and south-eastern populations by the Burdekin Gap, an expanse of dry,
open woodland habitat well documented as a biogeographic barrier to open forest
fauna. South-north introgression across the Burdekin Gap, not detected in other
Petaurus gliders, was interpreted as evidence of intermittent open forest habitat
connectivity in line with Quaternary contraction-expansion cycles. MtDNA
substructure in south-eastern Australia was associated with the Hunter River Valley
and Great Dividing Range, both biogeographic barriers to the sugar glider. MtDNA
and morphological substructure also supports the recent recognition of the south-
eastern Australian populations of the squirrel glider as a distinct evolutionary
significant entity for conservation and management purposes.
In conclusion, results presented here do not reflect the clearly defined taxonomy of
the squirrel – mahogany glider complex as currently recognised. When considering
the taxonomic status of the mahogany glider, the available data permits two largely
complementary interpretations. Firstly, the mahogany glider as a geographic variant
of the widespread squirrel glider. The absence of reciprocal monophyly therefore
represents evidence of ongoing gene flow between the two gliders, specifically

IX
ABSTRACT
between neighbouring populations, while the observed ecological and morphological
differentiations are a consequence of the distinct environmental profile of the
mahogany gliders’ coastal lowland habitat. Secondly, the data available does not
preclude a scenario whereby the clear morphological divergence observed between
the two gliders reflects character displacement driven by strong divergent selection
across a steep moisture gradient. In this scenario, minor partitioning of phylogenetic
diversity between the mahogany and squirrel gliders reflects incipient speciation of
two allopatric species that are only recently isolated. It is arguably premature,
however, to suggest changes to Petaurus systematics without data from more
rapidly evolving loci and greater representation of north-eastern Australian
populations of the squirrel – mahogany glider complex.

X
TABLE OF CONTENTS
Table of Contents
DECLARATIONS II STATEMENT ON THE CONTRIBUTION OF OTHERS III ACKNOWLEDGEMENTS V
ABSTRACT VII TABLE OF CONTENTS X
LIST OF TABLES XI LIST OF FIGURES XII LIST OF PLATES XIII INTRODUCTION 1
1.1 Historical biogeography of eastern Australia’s mesic biome 1
1.2 The petaurid gliders of eastern Australia 5
1.3 Molecular systematic of the petaurid gliders 8
1.4 Thesis aims 10
METHODOLOGICAL APPROACH 12
2.1 Study region 12
2.2 Lab procedures 12
2.3 Phylogeographic analyses 14
2.4 Comparative phylogeography 17
2.5 Morphometrics 18
RESULTS 20
3.1 Phylogeography 20
3.1.1 Sequence characteristics 20
3.1.2 Analysis of phylogenetic diversity and phylogeographic structure 22
3.2 Comparative phylogeography 32
3.3 Morphometrics 35
DISCUSSION 42
4.1 Phylogeography of the squirrel glider – mahogany glider complex 42
4.2 Taxonomic implications for the squirrel glider – mahogany glider complex 47
4.3 Conclusions and future actions 53
BIBLIOGRAPHY 56
APPENDICES 77
Appendix I: Raw genetic data 77
Appendix II: Raw morphological data 83

XI
LIST OF TABLES
List of Tables
Table 1: Genetic diversity data for the squirrel - mahogany glider complex..............27
Table 2: Biogeographic scenarios, as determined by SAMOVA...............................29
Table 3: Genetic structure across the squirrel – mahogany glider complex.........30-31
Table 4: Comparative phylogeography of eastern Australia’s petaurid gliders..........34
Table 5: Morphological measurements for six external characters in the squirrel –
mahogany glider complex.....................................................................................37-38
Table 6: Two-factor ANOVA of six external morphological characters of the squirrel –
mahogany glider complex..........................................................................................39

XII
LIST OF FIGURES
List of Figures
Figure 1: Distribution of the squirrel glider and mahogany glider with the approximate
position of five major biogeography breaks in eastern Australia.................................4
Figure 2: ND2 phylogeny of the squirrel – mahogany glider complex, including
posterior probability (>0.9).........................................................................................21
Figure 3: mtDNA haplotype networks for the squirrel – mahogany glider
complex.....................................................................................................................23
Figure 4: Location and composition of mtDNA admixture in north-eastern
Australia.....................................................................................................................24
Figure 5: nDNA haplotype network for the squirrel - mahogany glider
complex.....................................................................................................................26
Figure 6: Pairwise comparisons of nDNA and mtDNA variation in the squirrel -
mahogany glider complex..........................................................................................28
Figure 7: Comparative phylogeography of eastern Australia’s petaurid
gliders........................................................................................................................33
Figure 8: Regional morphological variation in the squirrel - mahogany glider
complex.....................................................................................................................40

XIII
LIST OF PLATES
List of Plates
Plate 1: Typical mahogany glider habitat, north-eastern Australia...........................XIV
Plate 2: Mounted mahogany glider............................................................................11
Plate 3: An assortment of mahogany glider and squirrel glider specimens...............19
Plate 4: Squirrel glider (left, centre) and mahogany glider skins (right).....................41

XIV
Plate 1: Typical mahogany glider habitat, north-eastern Australia
Photo: P. Ferraro

1
INTRODUCTION
1. Introduction
1.1 Historical biogeography of eastern Australia’s mesic biome
Composed primarily of a mosaic of relictual rainforest remnants distributed among
widespread sclerophyllous woodland and forest (Byrne et al., 2008, 2011; Bowman
et al., 2010), Australia’s eastern seaboard is recognised as a critical component in
understanding the evolution of the continent’s biodiversity (Blakers et al., 1984; Van
Dyck and Strahan, 2008; Cogger, 2000; Slayter et al., 2007). At the broad
biogeographic scale, and relative to the arid and semi-arid environments that
dominate the greater part of the Australian continent, this largely continuous forest
biome spans tropical to temperate latitudes (Nix, 1982) and parallels the western
edge of the region’s dominant topological feature, the Great Dividing Range (Frakes,
et al., 1987; Taylor, 1994). Nevertheless, climate and topography are highly variable
across this region and interact to generate a rich mosaic of varying ecological
conditions and barriers to dispersal (Keast, 1981; Bowler, 1982; Kershaw et al.,
1994; Schodde, 2006, Byrne et al., 2008; Mackey et al., 2008; Williams et al., 2009).
Historical biogeography recognises several prominent biogeographic barriers
throughout the forested biomes of eastern Australia, each associated with a unique
set of topographic and bioclimatic features (Kershaw, 1981; Nix, 1982; Ford, 1987a,
1987b; Cracraft, 1991; Crisp et al., 1995; Lambeck and Chappell, 2001; Dickinson et
al., 2002). Perhaps the most prominent and well documented of these breaks is the
Burdekin Gap, a dry lowland corridor separating the Wet Tropics of north-eastern
Queensland from the sclerophyll forests of mid-eastern Queensland (Figure 1).
Across this barrier strong taxonomic and deep phylogeographic turnover is well
documented for a wide spectrum of taxa endemic to both wet and dry forest biomes

2
INTRODUCTION
(e.g. Joseph and Moritz, 1994; James and Moritz, 2000; Schäuble and Moritz, 2001;
Brown et al., 2006; Dolman and Moritz, 2006; Chapple et al., 2011a; Edwards and
Melville, 2010). Although not as pronounced, the relatively dry corridors of the St
Lawrence Gap, Hunter River Valley and the Gippsland and Murray basins have also
contributed prominently to biogeographic subdivision of the eastern Australian biota
(e.g. McGuigan et al., 1998; Donnellan et al., 1999; Keogh et al., 2003, 2005;
Chapple et al., 2005; Moussalli et al., 2005; Symula et al., 2008; Dubey and Shine,
2010).
The influence of such biogeographic barriers is most evident in the closed forest
communities, with considerable concordance in geographic orientation in
phylogenetic diversity (both inter- and intraspecifically) having been documented
across a broad spectrum of rainforest restricted taxa (see review in Moritz et al.,
2005). There is increasing appreciation, however, that dispersal barriers typically
associated with closed forest fauna have also influenced biogeographic subdivisions
among open forest fauna (e.g. James and Moritz, 2000; Schäuble and Moritz, 2001;
Edwards and Melville et al., 2010), though concordance across taxa tends to be
more idiosyncratic. High altitude wet forest barriers such as the McPherson Range
and the temperate uplands of the southern reaches of the Great Dividing Range
have contributed to phylogenetic subdivisions among open forest taxa (McGuigan et
al., 1998; Donnellan et al., 1999; Keogh et al., 2003; Symula et al., 2008; Chapple et
al., 2011b). For instance, phylogeographic analysis of a non-rainforest anuran
identified the McPherson Range, an east-west aligned montane block of wet forest
on the Queensland / New South Wales border, as a dispersal barrier to Litoria fallax
(James and Moritz, 2000). A subsequent study, however, found no comparable

3
INTRODUCTION
phylogeographic structure across two closely related and broadly sympatric frogs
(Limnodynastes tasmaniensis and L. peronii; Schäuble and Moritz, 2001) but
identified an alternative phylogenetic break in the south-eastern region of the frogs’
range not present in L. fallax.
Such advances in the field of historical biogeography stem from the recent advent of
comparative phylogeography (Zink, 1996; Bermingham and Moritz, 1998;
Bernatchez and Wilson, 1998; Moritz and Faith, 1998; Schneider et al., 1998; Avise,
2000; Riddle et al., 2000; Sullivan et al., 2000; Arbogast and Kenagy, 2001).
Comparative phylogeography provides comparisons of geographically oriented
phylogenetic diversity across co-distributed species, thereby identifying common
spatial patterns of evolutionary subdivision. This ‘quantitative and integrative
approach’ (Arbogast and Kenagy, 2001) to the elucidation of cross-species
biogeographic processes has been utilised to great effect in north-eastern Australia’s
Wet Tropics (e.g. Schneider et al., 1998; Moritz et al., 2000; Hugall et al., 2002; Bell
et al., 2004; Hoskin et al., 2005; Moussalli et al., 2005; Dolman and Moritz, 2006;
Bell et al., 2007; Krosch et al., 2009) in addition to the sclerophyll forests of eastern
Australia (e.g. Donnellan et al., 1999; Fowler et al., 2000; Keogh et al., 2003; Symula
et al., 2008; Sumner et al., 2010).

4
INTRODUCTION
Figure 1: Distribution of the squirrel glider (yellow) and mahogany glider (pink) with the approximate position of five major biogeographic breaks in eastern Australia (italicised text) and the Great Dividing Range (broken line). Sampling regions represented by coloured areas (see legend for details). A map
of Australia is inset (top right).

5
INTRODUCTION
Due largely to the paucity of species with distributions that span eastern Australia’s
forests there remains few phylogeographic studies encompassing the greater part of
that biome (see Chapple et al., 2011a). In one such example, Joseph and Moritz
(1994) identified comparable phylogeographic structure across the Burdekin Gap in
two closed forest Sericornis scrubwrens. Results were not consistent across all
species, however, with a third scrubwren exhibiting markedly lower levels of
phylogenentic divergence across the Burdekin Gap. This variation was attributed to
the broader habitat preferences of the third species, specifically its capacity to exploit
both the wet and dry components of eastern Australia’s forest biome. Outside of this
example, however, the majority of related studies limit their focus to a single
component; where the weight of research is skewed toward the remnant wet forests
(e.g. Nicholls and Austin, 2005; Joseph and Omland, 2009; Eldridge et al., 2011;
Krosch, 2011) over the widespread dry forests (James and Moritz, 2000; Schäuble
and Moritz, 2001; Taylor and Foulkes, 2004; Chapple et al., 2011a). Fewer again
focus on the region’s widely distributed mammals (e.g. Houlden et al., 1999; Spencer
et al., 2001; Potter et al., 2012) with the marsupial gliders of the genus Petaurus one
of the few taxonomic groupings well represented in the phylogeographic literature
(Brown et al., 2006; Malekian et al., 2010a; Pavlova et al., 2010).
1.2 The petaurid gliders of eastern Australia
Considered as keystone taxa in Australia’s forest biome (Goldingay and Jackson,
2004), the arboreal petaurid gliders (genus Petaurus) represent ideal taxa for
phylogeographic studies of open forest fauna at the broad biogeographic scale. Of
the seven recognised petaurid species, four are strongly associated with eastern

6
INTRODUCTION
Australia’s sclerophyll habitats (P. australis, P. breviceps, P. norfolcensis and P.
gracilis; Goldingay and Jackson, 2004), where they utilise mature Eucalyptus stands
for breeding, migration, diet and shelter (e.g. Quin et al., 1996a; Jackson, 2001;
Goldingay and Quin, 2004; Eyre, 2007; Ball et al., 2009, 2011). Although these
species are co-distributed to varying degrees at the broad scale, there exist
divergent habitat preferences at the ecological scale, particularly when in sympatry
(Jackson, 2000a; Lindenmayer, 2002; Rowston and Catterall, 2004). The
geographically widespread sugar glider (P. breviceps), for example, also exploits
Acacia species across much of its distribution (Goldingay and Jackson, 2004) and
exhibits a preference for a more enclosed canopy and mid-storey rainforest flora
than its larger congeners when in sympatry (Jackson, 2000a). In a study of petaurid
habitat preferences, Davey (1984) observed niche partitioning whereby the sugar
glider foraged in the lower stratum, while the much larger squirrel glider (P.
norfolcensis) spent its time predominantly in the upper stratum, a partition also
observed between the sugar and mahogany glider, P. gracilis (Jackson, 2000b).
Within Petaurus, the squirrel glider and mahogany glider are of particular interest
given that they collectively cross the wet-dry open forest continuum of eastern
Australia (see Figure 1). Like the sugar glider, the squirrel glider is widely distributed
across eastern Australia’s open sclerophyllous communities (van der Ree and
Suckling, 2008), including transitional wet sclerophyll forests bordering the rainforest
remnants of Queensland’s Wet Tropics (Suckling, 1983a). Conversely the mahogany
glider (Plate 2) has a highly limited distribution, endemic to northern Queensland and
restricted to coastal open forests characterised by very high seasonal rainfall and

7
INTRODUCTION
high floral diversity (e.g. Plate 1); both conditions traditionally associated with
rainforest communities (Van Dyck, 1993).
Morphological variation among the lesser gliding possums is generally low, with body
size, pelage colouration, tail length and the length of tail fur considered as the key
diagnostic characters separating the squirrel, sugar and mahogany gliders (Van
Dyck, 1993; Quin et al., 1996b; Lindenmayer, 2002). With such subtle morphological
variation (see Plate 3, Plate 4), there remained an element of uncertainty in the
taxonomic validity of the mahogany glider during the preceding century. The species
was first described in 1883 (De Vis, 1883), although the subsequent loss of the type
specimens and the brevity of De Vis’ description saw the mahogany glider
considered a geographic variant of the squirrel glider by Thomas (1888), a view later
reinforced by Iredale and Troughton (1934) and more recently Van Dyck (1990). The
rediscovery of the De Vis’ missing type specimens and subsequent identification of
live specimens engendered a comprehensive review of the taxonomy of the
mahogany glider, leading to its resurrection to specific status (Van Dyck, 1993).
Arising from Van Dyck’s (1993) revision was a greater appreciation of the extent to
which habitat loss and fragmentation had caused a substantial decline in the
geographic range and abundance of the mahogany glider from pre-European levels
(Van Dyck, 1993; Jackson et al., 2011), leading to its IUCN red listing as an
endangered species in 1996 (see Burnett et al., 2008). The mahogany glider was
subsequently listed as Endangered under both state and federal law (via the Nature
Conservation Act 1992 and Environment Protection and Biodiversity Conservation
Act 1999, respectively), thereby providing an impetus for a series of comprehensive

8
INTRODUCTION
ecological studies (Jackson and Claridge, 1999; Jackson, 2000a, 2000b, 2000c,
2001; Jackson and Johnson, 2002). Securing existing mahogany glider populations
and expanding currently protected habitat remains a state and federal priority (see
Parsons and Latch, 2006).
Despite its widespread distribution the squirrel glider has also been affected by the
expansion of agricultural and residential development (Gibbons and Lindenmayer,
2002; Rowston et al., 2002); and is now limited to non-continuous habitat along
eastern Australia’s forest biome (van der Ree, 2002; van der Ree and Bennett, 2003;
Claridge and van der Ree, 2004). Consequently, it is listed as vulnerable in New
South Wales (Threatened Species Conservation Act 1995) and threatened in
Victoria (Flora And Fauna Guarantee Act 1988), while presumed extinct in South
Australia (Malekian et al., 2010b). The scarce data for Queensland populations
indicates that implications of ongoing habitat loss and fragmentation remain a
serious concern (Eyre, 2004; Winter et al., 2004).
1.3 Molecular systematic of the petaurid gliders
Recent molecular work supports the monophyly of Petaurus within Petauridae
(Osborne and Christidis, 2001; Osborne et al., 2002; Malekian et al., 2010b), with the
yellow bellied glider (P. australis) basal to all remaining petaurids. However, the
evolutionary relationships among the three closely allied species – the sugar, squirrel
and mahogany gliders – remain unresolved; a situation further complicated by the
fact that the squirrel and sugar gliders are known to interbreed (Fleay, 1947;
Suckling, 1983b). Further, a recent phylogeny of the genus Petaurus (Malekian et

9
INTRODUCTION
al., 2010b) identified potential nDNA and mtDNA introgression between the two,
suggesting hybridisation in eastern Australia’s open forest gliders may be more
widespread than currently recognised. Indeed, contrary to Colgan and Flannery’s
(1992) allozyme work which showed three fixed differences across 21 loci between
the squirrel and mahogany gliders, recent mitochondrial (ND2 and ND4 genes) and
nuclear (omega-globin gene) data exhibit levels of genetic differentiation between
the mahogany and squirrel glider (Malekian et al., 2010b) that, in contrast with the
large difference in body mass, is comparable to intraspecific divergence in the
yellow-bellied glider (Brown et al., 2006).
Further, recent assessments of intraspecific taxonomy of the polytypic yellow-bellied
glider (Brown et al., 2006) and sugar glider (Malekian et al., 2010a) found little
concordance between phylogeographic structure and current subspecific delineation,
recommending instead the recognition of two highly divergent, geographically
oriented lineages as Evolutionary Significant Units (ESUs). While no subspecific
units are recognised in the squirrel glider, Pavlova et al. (2010) similarly identified
strong phylogeographic structure among southern populations of the squirrel glider,
also arguing for the recognition of two ESUs. In each instance, the revised
intraspecific distributional limits coincided with documented eastern Australia open
forest barriers, namely the Burdekin Gap (yellow-bellied glider) and the Great
Dividing Range (sugar and squirrel gliders).

10
INTRODUCTION
1.4 Thesis aims
In this study I present a phylogeographic investigation of the squirrel – mahogany
glider complex, with representation spanning its entire distribution, based on the
complete mitochondrial ND2 gene and the partial sequence of the nuclear ApoB1
gene. Phylogeographic patterns in the complex are also compared and contrasted
with those of other broadly co-distributed petaurid gliders, with particular interest in
whether a correlation exists between habitat specialisation and phylogeographic
structure across the petaurids. The objective of the study is not only to further our
understanding of the historical biogeography of eastern Australia’s forest biome but
to also provide a more detailed investigation of the taxonomic placement of the
mahogany glider within Petaurus. To this end, I also collate and revise the
morphometrics underpinning the squirrel – mahogany glider complex, with a
particular emphasis on assessing interpopulation variance across its entire
distribution. It is only with such measures of regional variance that the apparent
morphological divergence of the mahogany glider can be effectively assessed. It is
hoped this work will contribute to the conservation effort of both the mahogany and
squirrel gliders and guide future research into the evolution and conservation of
Australia’s more iconic species.

11
Plate 2: Mounted mahogany glider (Museum Victoria)
Photo: P. Ferraro

12
METHODOLOGICAL APPROACH
2. Methodological Approach
2.1 Study region
Tissue samples were obtained from 67 squirrel gliders and 92 mahogany gliders
from a range of sources (full sampling information is presented in Appendix I). The
large number of samples enabled an investigation of phylogeographic structure of
the squirrel – mahogany glider complex at two geographic scales: a distribution-wide
broadscale analysis encompassing eastern Australia; plus a finescale analysis
focused exclusively on north-eastern Australia – a zone of potential contact between
the two taxa. Squirrel glider sampling incorporated the majority of the species’
widespread yet patchy (Lindenmayer et al., 2003) open forest distribution (Figure 1).
To aid comparison to existing studies squirrel glider samples were assigned to the
seven pre-defined eastern Australian bioregions detailed in James and Moritz (2000)
and Moussalli et al. (2005): Einasleigh Uplands (EU), Hervey Range (HR), mid-
eastern Queensland (MEQ), south-eastern Queensland (SEQ), north-eastern New
South Wales (NEN), central coast New South Wales (CCN) and Victoria (VIC).
Mahogany glider representation encompassed its limited distribution in the Cardwell
Lowlands (CL) of north-eastern Australia (Figure 1), with samples originating from
one of four areas: Tully (Tu), Two Creeks (Tc), Rangeview (Ra) and Bambaroo (Ba).
2.2 Lab procedures
Total genomic DNA was extracted from all samples following the phenol-chloroform
protocol outlined in Gemmell and Akiyama (1996). Sequences from the complete
mitochondrial ND2 gene (1,040bp) were amplified using a combination of the
following primers: mrND2F, ACCCCGAAAATGTTGGTTTA; pND2R,

13
METHODOLOGICAL APPROACH
TGATTTGCGTTCGAATGATG; pND2iF, AATTGCCCCAACAGCATTAC; pND2iR,
CATGTGGGCAATTGATGAGT. With the exception of mrND2F (Osborne and
Christidis, 2001), primers were designed using the programs Primer3 v0.4.0 (Rozen
and Skaletsky, 2000) and Amplify v3.1.4 (Engels, 2005). A 720 base pair fragment of
the nuclear ApoB1 marker was amplified using primers F90 and R820
(AATTCCTGAAATGACTCTGCC and TYGTCCCATCTAACTTATACTG,
respectively) (Amrine-Masden et al., 2003). ND2 was preferred over other mtDNA
markers due to its previous application to Petaurus (Osborne and Christidis, 2001;
Osborne et al., 2002), while ApoB1 was selected for its ability to generate species-
level distinctions within Diprotodontia (Wilson-Wilde, 2010). All primers incorporated
M13 tails to optimise amplification efficacy. Polymerase chain reaction (PCR)
protocol was as follows: 10.3ul of DNA template (1/100 dilution) was combined with
13ul GoTaq Green Master Mix (Promega) plus 0.35ul (10uM) of each primer and the
targeted fragment amplified using an initial denaturing step for two minutes at 95oC,
40 cycles of 95oC denaturing for 20 seconds / 50oC annealing for 20 seconds / 72oC
extension for 90 seconds, and a final extension for three minutes at 72oC. PCR
products were then purified with the GFX PCR DNA and gel band purification kits
(Amersham Biosciences). Sequence reaction and capillary separation was
undertaken by either Macrogen Inc. (Seoul, Korea) or the Australian Genome
Research Facility (AGRF). Sequences were aligned and translated using
SEQUENCHER 4.2 (Gene Codes Corporation, USA). PHASE v2.1 (Stephens et al.,
2001) was used to resolve haplotypes from heterozygous individuals at the ApoB1
locus.

14
METHODOLOGICAL APPROACH
2.3 Phylogeographic analyses
The program NETWORK v4.6 (www.fluxus-engineering.com) was used to construct
median joining networks for each dataset. The default median joining (MJ) algorithm
(Bandelt et al., 1999) was employed for mtDNA sequences and the reduced median
(RM) algorithm (Bandelt et al., 1995) for nDNA sequences. The maximum parsimony
(MP) algorithm (Polzin and Daneschmand, 2003) was applied to each dataset before
finalising each network to purge superfluous links and median vectors. Haplotype
connection ambiguities were resolved according to the criteria defined by Crandall
and Templeton (1993). During this analysis a single MEQ squirrel glider mtDNA
sequence grouped unexpectedly. This outlier was excluded from further analyses
due to concerns over the validity of the sample’s origin and identity.
The program BEAST v1.5.4 (Drummond and Rambaut, 2007) was used to assess
the phylogenetic depth underlying the mtDNA diversity within the squirrel –
mahogany glider complex dataset. The Hasegawa, Kishino and Yano model of
sequence evolution (HKY; Hasegawa et al., 1985) was selected as the most
parsimonious based on AIC criteria using the program jMODELTEST v0.1.1
(Posada, 2008; incorporating PHYML (Guindon and Gascuel, 2003)). To exclude
uninformative parameters, thereby maximising the MCMC search efficiency,
preliminary BEAST runs (not shown) indicated that the dataset conformed to a
constant population size and a strict molecular clock rate. The standard mtDNA
substitution rate of 1% per lineage per million years (Brown et al., 1979) was
preferred over more recent alternatives (e.g. 0.7% per lineage per million years,
Bininda-Emonds, 2007) due to its application in marsupial studies (e.g. Krajewski et
al., 2000; Malekian et al., 2010a, 2010b). Three randomly seeded runs of 10 million

15
METHODOLOGICAL APPROACH
generations were logged every 1,000 generations and convergence and mixing was
checked in TRACER v1.5 (Drummond and Rambaut, 2007). The resultant raw files
were combined within LOGCOMBINER v 1.5.4 and summarised with
TREEANNOTATOR v1.5.4 (excluding a 10% burn-in). The final tree was visualised
within FIGTREE v1.3.1 (Rambaut, 2006).
Standard diversity indices, incorporating the number of haplotypes (H) (Tajima,
1983) and haplotype (h) and nucleotide (πx) diversities plus standard deviations (Nei,
1987) were calculated within ARLEQUIN v3.5.1.2 (Excoffier and Lischer, 2010), as
were pairwise genetic distances (ΦST) and Nei's net sequence divergence (DA). As
the HKY model of sequence evolution is not offered by the current version of
ARLEQUIN the Tamura-Nei (TrN) model (Tamura and Nei, 1993) was used as a
surrogate. Statistical significance was tested after 10,000 permutations with
Bonferroni correction (Rice, 1989).
Spatial structuring of mtDNA diversity was estimated using SAMOVA v1.0
(Dupanloup et al., 2002). For a given number of groupings (K) this method uses a
simulated annealing procedure to maximise the FCT index (the proportion of total
genetic variance due to the difference between groups of populations). More
importantly, geographical locations are explicitly taken into account within the
simulated annealing procedure. An indirect outcome of this analysis therefore is the
identification of potential biogeographic barriers, reflecting relatively high genetic
differentiation over a short geographic distance. SAMOVA was preferred over
alternative approaches for the following reasons: a) it relies solely upon genetic data
to determine population groupings, thereby removing the requirement for pre-defined

16
METHODOLOGICAL APPROACH
biogeographic assumptions, as it the case in the classic AMOVA approach; and b) it
does not utilise interpolation-driven methodology; an approach that can generate
biologically inaccurate results when sampling points are not regularly spaced
(Dupanloup et al., 2002), as is the case in this study. Six groupings were assessed
(i.e. K=2 through to K=7), with the lowest grouping to exhibit significant FCT index in
conjunction with non-significant FSC (i.e. proportion of variance among populations
within groups) assumed to reflect the most probable set of geographic subdivisions.
To assess whether the SAMOVA-derived scenario provided the most parsimonious
partitioning of molecular variance, it was compared to the following a priori
biogeographic scenarios, generated via analysis of molecular variation (AMOVA) in
ARELQUIN. Firstly, a simple unstructured analysis of the seven regions was
conducted, labelled Unstructured. Next, regions were clustered to assess the
influence of three major east Australian biogeographic barriers upon the squirrel –
mahogany glider complex; the Wet Tropics, Burdekin Gap and Hunter River Valley.
These scenarios were: Biogeography A, the Burdekin Gap only; Biogeography B, the
Burdekin Gap and Hunter River Valley; Biogeography C, the Wet Tropics and the
Burdekin Gap; Biogeography D, the Wet Tropics, Burdekin Gap and Hunter River
Valley. A final AMOVA was run along taxonomic lines, labelled Taxa.
To complement the SAMOVA analysis I also calculated Hudson’s nearest neighbour
statistic (Snn; Hudson, 2000) using the program DNASP v5.10.01 (Librado and
Rozas, 2009). This statistic is shown to be more robust in cases of low sample sizes
and high haplotype diversity. High values of Snn (i.e. approaching one) reflect a high
degree of population structure, while low values (i.e. half to one-third) indicate

17
METHODOLOGICAL APPROACH
panmixia. The significance of Snn was evaluated via 10,000 permutations where
significance was defined as the proportion of permuted values to be equal to or
larger than the observed value.
2.4 Comparative phylogeography
To provide a wider comparative context for the observed phylogeographic structure
between the squirrel glider and mahogany glider, mtDNA sequences from two recent
petaurid phylogeographies were examined (yellow-bellied glider, Brown et al., 2006;
and sugar glider, Malekian et al., 2010a). To complement the northern focus of this
study, mtDNA (CytB) sequences from a recent study of the evolutionary
distinctiveness of southern squirrel populations (Pavlova et al., 2010) were also
included. Unless otherwise noted, ARLEQUIN was employed to generate all
statistics using the methodologies described above. For ease of interpreting
interspecific phylogeographic patterns, sequences were grouped into one of three
biogeographic subdivisions - north-eastern Australia (NEA; regions north of the
Burdekin Gap), eastern Australia (EA; regions between the Burdekin Gap and the
Hunter River Valley) or south-eastern Australia (SEA; regions south of the Hunter
River Valley). The Burdekin Gap and Hunter River Valley were selected because of
their recognition as important dry habitat barriers in a diverse range of eastern
Australian taxa (see Chapple et al., 2011a).

18
METHODOLOGICAL APPROACH
2.5 Morphometrics
Body measurements of six external characters were made available from 252 adult
squirrel gliders and 107 adult mahogany gliders from a range of sources (see
Appendix II for full morphological information). These measurements were: snout-
vent length (SVL), the distance in centimetres from the tip of the nose to the base of
the tail; vent-tail length (VTL), the distance in centimetres from the base of the tail to
the tip of the tail; snout-tail length (STL), the distance in centimetres from the tip of
the nose to the tip of the tail; head length (HL), the distance in centimetres from the
tip of the nose to the base of the head; body weight (WT), the total weight in grams;
and body to tail ratio (BTR), calculated by dividing SVL by VTL. This final measure
represents an additional proxy for body mass, where lower measures of BTR
correspond with higher body mass and vice versa (Jackson, 1999).
The software package SYSTAT 12.02 (Systat Software Inc., 2007) was used for all
morphological analyses. Outliers were identified (studentized residuals, SYSTAT)
and removed to minimise type II errors associated with interobserver measurement
variances in both small mammals (Blackwell et al., 2006) and multi-source
morphological data (Palmeirim, 1998). For both species, all external characters
except BTR were regressed with SVL to control for the effects of body size. The
normal distribution of each variable was confirmed via Shapiro-Wilk test (Shapiro
and Wilk, 1965). Either residuals (STL, VTL, HL and WT) or raw data (SVL and BTR)
were then used in a two-factor analysis of variation (ANOVA) to assess the
differences between sex and regions (i.e. pre-defined eastern Australian bioregions;
Figure 1). Tukey’s post hoc Honestly-Significant-Difference (HSD) pairwise
comparisons were then conducted for all significant effects.

19
Plate 3: As assortment of mahogany glider and squirrel glider specimens (Museum Victoria)
Photo: P. Ferraro

20
RESULTS
3. Results
3.1 Phylogeography
3.1.1 Sequence characteristics
A total of 159 mitochondrial (mtDNA, ND2) and 59 nuclear (nDNA, ApoB1)
sequences were generated from the available tissue samples. All sequences were
free of ambiguous nucleotides, indels or internal stop codons, while it was
considered unlikely that PHASE generated underestimates of πx in the nDNA
dataset as all genotypes were fully resolved (see Garrick et al., 2010). At the
broadscale, 44 mtDNA haplotypes and 76 polymorphic sites (41 of which were
parsimony informative) were identified across 62 ND2 sequences, with 13 nDNA
haplotypes and eight polymorphic sites (seven parsimony informative) detected
across 59 ApoB1 sequences. Three samples in the ApoB1 dataset failed to produce
complete ApoB1sequences (EU03, VIC05, VIC06). The seven regions comprising
the finescale mtDNA dataset contained 137 ND2 sequences, with 37 haplotypes and
64 polymorphic sites documented. Due to the markedly lower phylogenetic signal in
the ApoB1 dataset, it was determined that nDNA phylogeographic analyses be
conducted exclusively at the broadscale level. Full sequence information from all
datasets can be found in Appendix I.

Figure 2: ND2 phylogeny of the squirrel – mahogany glider complex, including posterior probability (>0.9), obtained with Bayesian analysis. Divergence estimates of three noteworthy nodes presented below the tree. Samples coloured according to origin. See text for details.

22
RESULTS
3.1.2 Analysis of phylogenetic diversity and phylogeographic structure
Sequences assorted into two taxonomically independent lineages across eastern
Australia, thereby providing no support for a reciprocally monophyletic clade
representing the mahogany glider. This pattern was most evident in the mtDNA
phylogeny, with divergence between the two lineages estimated as early Pleistocene
(0.65 - 1.39 million years before present; see Node 1 in Figure 2). Within the mtDNA
network (Figure 3a) there exists a broad geographic orientation of haplotypes. The
first lineage (Lineage A) was predominantly restricted to north-eastern Australia
(NEA), while the second, more widespread lineage (Lineage B) was detected across
the squirrel glider’s sampled distribution except the Einasleigh Uplands (EU). A
narrow zone of admixture of the two mtDNA lineages was observed, encapsulating
the distributional limits of the mahogany glider in the Cardwell Lowlands (CL) and the
neighbouring squirrel glider region in the Hervey Ranges (HR). The Queensland
subset (Figure 3b) reiterated this pattern, while also presenting variable levels of
mtDNA admixture across the five geographically intermediate regions (Figure 4).
Regional measures of the percentage of haplotypes per region by lineage (%H)
present a broad geographic trend, with the proportion of Lineage B haplotypes
increasing with latitude. A trend in the percentage of individuals per lineage (%N)
across the region was less clear, with the proportion of Lineage A haplotypes roughly
equivalent at either end of the admixture zone. Phylogeographic substructure was
also observed in the southern lineage, with sequences from the central coast of New
South Wales (CCN) clustering with a selection from north-eastern NSW (NEN) and
Victoria (VIC), as highlighted in Figure 2 and Figure 3a.

Figure 3: Median joining haplotype networks (mtDNA ND2) for the squirrel - mahogany glider complex; a) full eastern distribution of both gliders, and b) limited to the admixture zone between the two gliders in north-eastern Australia. Haplotypes are coloured according to sample origin, scaled according to frequency and connected by solid lines representing a single base pair substitution. Black solid circles represent unsampled haplotypes and double dashed lines and their
accompanying numbers represent the number of unsampled haplotypes.

Figure 4: Location and composition of mtDNA admixture in north-eastern Australia. Coloured rings surrounding pie charts correspond to sample origin. Pie chart fill colour indicates presence of either Lineage A (black) or Lineage B (white). %H, proportion of haplotypes by lineage; %N, proportion of individuals by
lineage. Admixture zone identified with an asterisk (*).

25
RESULTS
The primary characteristics of the mtDNA dataset were also apparent in the nDNA –
haplotypes assorted independent of taxonomy yet with a broad geographic
orientation of phylogenetic diversity (Figure 5). Specifically, the four most common
nDNA haplotypes (N01 – N04, comprising over 80% of all ApoB1 sequences) had
strong geographic associations, with N01 and N04 common north of the Burdekin
Gap but less so to the south, while haplotypes N02 and N03 showed the reverse
pattern.
Measures of both haplotypic and nucleotide diversity were higher in the squirrel
glider than the mahogany glider for ND2 and ApoB1 (Table 1a). Notably, mtDNA
nucleotide diversity (Table 1a) was markedly higher in CL and HR, the previously
described zone of admixture, than the remaining regions. Haplotypic diversity was
broadly consistent across all regions, marginally lower in CL and Victoria (VIC). No
clear patterns, however, were observed in either nucleotide or haplotypic diversities
of the nDNA dataset (Table 1b).
Based on pairwise distances (Figure 6a) both EU and CCN were the most divergent
regions, with each significantly differentiated from the remaining regions (except HR
and VIC, respectively). Conversely, HR was the least distinct, exhibiting significant
differentiation from only the two most geographically removed regions (CCN and
VIC). Although appreciably lower than their mtDNA counterparts, results of nDNA
pairwise comparisons (Figure 6b) support the geographically oriented phylogenetic
diversity presented in the nDNA haplotype network. Specifically, statistical
significance was limited to comparisons made across the Burdekin Gap.

26
RESULTS
Figure 5: Median joining haplotype network (nDNA ApoB1) for the eastern Australian distribution of the squirrel - mahogany glider complex. Haplotypes are coloured according to sample origin, scaled
according to frequency and connected by solid lines representing a single base pair substitution.

27
RESULTS
Table 1: Genetic diversity data for the squirrel - mahogany glider complex for: a) eastern Australian
mtDNA dataset, b) north-eastern Australian mtDNA dataset and c) eastern Australian nDNA dataset. n, number of sequences; H, number of haplotypes; P, number of private haplotypes; Hd, haplotype
diversity; πx, nucleotide diversity; K, population grouping; ns, non-significant (p > 0.05); * p < 0.05; ** p < 0.01; *** p < 0.001;
1, most parsimonious SAMOVA scenario. Underlined text indicates mahogany
glider regions.
Diversity Measures
a) ND2 n H (P) Hd πx
squirrel glider 46 36 (34) 0.987 0.011
mahogany glider 16 10 (8) 0.867 0.010
Regions
Einasleigh Uplands 8 6 (5) 0.929 0.004
Coastal Lowlands 16 10 (8) 0.867 0.010
Hervey Range 8 8 (5) 1.000 0.010
Mid-eastern QLD 8 8 (7) 1.000 0.005
North-eastern NSW 8 7 (5) 0.964 0.006
Central coast NSW 8 7 (6) 0.964 0.003
Victoria 6 4 (3) 0.867 0.007
b) ApoB1 n H (P) Hd πx
squirrel glider 43 11 (8) 0.822 0.0023
mahogany glider 16 7 (0) 0.629 0.0014
Regions
Einasleigh Uplands 7 3 (0) 0.582 0.0011
Coastal Lowlands 16 7 (0) 0.629 0.0014
Hervey Range 8 6 (4) 0.683 0.0017
Mid-eastern QLD 8 7 (1) 0.883 0.0023
North-eastern NSW 8 4 (0) 0.650 0.0011
Central coast NSW 8 2 (0) 0.525 0.0007
Victoria 4 3 (1) 0.714 0.0038

28
RESULTS
Figure 6: Pairwise comparisons of nDNA and mtDNA variation in the squirrel - mahogany glider complex a) ND2 and b) ApoB1. ΦST below diagonal, DA above diagonal and πx on diagonal. Dashes
represent statistically non-significant (p > 0.05) pairwise comparisons.
Two consistent patterns were noted across the six mtDNA scenarios generated by
SAMOVA (i.e. K=2 through to K=7): 1) the Einasleigh Uplands (EU) remained
isolated from all other regions, and 2) Hervey Range (HR) and Cardwell Lowlands
(CL) were always partitioned within the same group (Table 2).For the mtDNA data, a
series of four groupings (i.e. K=4) was identified by SAMOVA as the most
appropriate biogeographic scenario. When compared to the a priori scenarios, the
SAMOVA scenario provides the most parsimonious partitioning of genetic variation
(Table 3a). Within this scenario, Hudson’s nearest neighbour statistic (Snn) identified
moderate differentiation between the central coast of NSW (CCN) and Victoria (VIC)
(Snn = 0.69, p = 0.05), plus between HR and CL (Snn = 0.73, p = 0.02). Minimal
differentiation, however, was detected between regions comprising eastern Australia
(EA), MEQ and NEN (Snn = 0.45, p = 0.54).

29
RESULTS
Table 2: SAMOVA derived biogeographic scenarios, based upon a) mtDNA and b) nDNA datasets.
Shaded blocks indicate regional groupings by scenario.
Biogeographic scenario (SAMOVA)
a) ND2
2 Groups 3 Groups 4 Groups 5 Groups 6 Groups 7 Groups
Reg
ion
s
EU
CL
HR
MEQ
NEN
CCN
VIC
b) ApoB1
2 Groups 3 Groups 4 Groups 5 Groups 6 Groups 7 Groups
Reg
ion
s
EU
CL
HR
MEQ
NEN
CCN
VIC
For ApoB1, K=2 was the preferred biogeographic scenario, with each group
comprised exclusively of regions from either side of the Burdekin Gap. As with the
mtDNA dataset, the SAMOVA scenario provided a better explanation of
phylogeographic structure than the a priori scenarios (Table 3b) while assorting the
sampling regions into taxonomic groupings again provided the least parsimonious
scenario.

30
RESULTS
Table 3a: mtDNA structure data across the squirrel - mahogany glider complex according to a number of biogeographic scenarios. Regions are either connected by a ‘-’ (dash) or separated by a ‘/’
(backspace). NEA = EU, HR and CL; EA = MEQ and NEN; SEA = CCN and VIC. See text for a description of biogeographic scenarios and explanation of abbreviations.
a) ND2
No. of
groups
% variation P-value
Biogeographic Scenario Variance component
SAMOVA 4 Among groups 44% **
EU / CL-HR / EA-SEA Among regions 3% ns
Within regions 53% ***
Unstructured 1 Among regions 43% ***
EU-CL-HR-MEQ-NEN-CCN-VIC Within regions 57% -
Biogeography B 3 Among groups 37% **
NEA-EA-SEA Among regions 12% **
Within regions 51% ***
Biogeography D 4 Among groups 34% *
EU-HR / CL-EA-SEA Among regions 11% **
Within regions 55% ***
Biogeography A 2 Among groups 30% *
NEA / EA-SEA Among regions 20% ***
Within regions 50% ***
Biogeography C 3 Among groups 22% ns
EU-HR / CL / EA-SEA Among regions 24% ***
Within regions 54% ***
Taxa 2 Among groups -22% ns
CL / EU-HR-MEQ-NEN-CCN-VIC Among regions 59% ***
Within regions 64% ***

31
RESULTS
Table 3b: nDNA structure data across the squirrel - mahogany glider complex according to a number of biogeographic scenarios. Regions are either connected by a ‘-’ (dash) or separated by a ‘/’
(backspace). NEA = EU, HR and CL; EA = MEQ and NEN; SEA = CCN and VIC. See text for a description of biogeographic scenarios and explanation of abbreviations.
b) ApoB1
No. of
groups
% variation P-value
Biogeographic Scenario Variance component
SAMOVA (Biogeography D) 2 Among groups 47% *
NEA / EA-SEA Among regions 3% ns
Within regions 50% ***
Biogeography B 3 Among groups 42% *
NEA-EA-SEA Among regions 3% *
Within regions 55% ***
Biogeography C 3 Among groups 40% *
EU-HR / CL / EA-SEA Among regions 4% *
Within regions 56% ***
Biogeography A 4 Among groups 34% ns
EU-HR / CL-EA-SEA Among regions 6% *
Within regions 60% ***
Unstructured 1 Among regions 38% ***
EU-CL-HR-MEQ-NEN-CCN-VIC Within regions 62% -
Taxa 2 Among groups 11% ns
CL / EU-HR-MEQ-NEN-CCN-VIC Among regions 31% ***
Within regions 58% ***

32
RESULTS
3.2 Comparative phylogeography
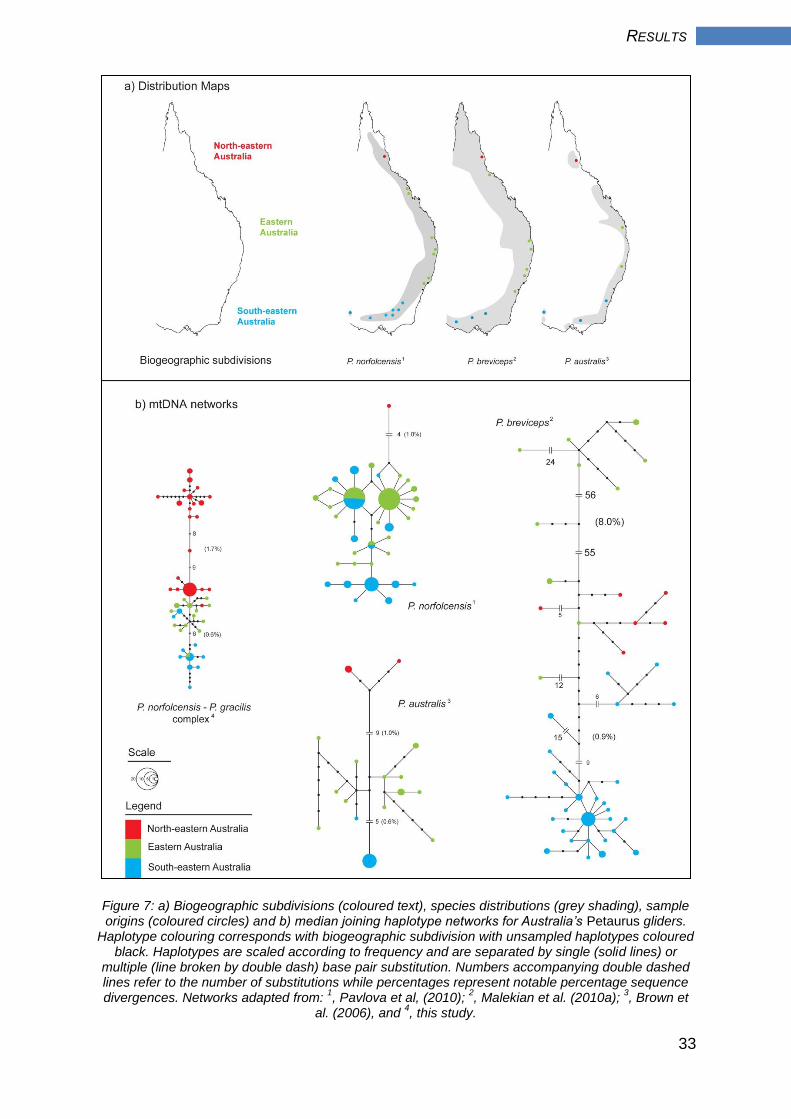
Phylogeographic structure was broadly consistent across the four eastern Australian
petaurid datasets examined here (Figure 7). Each network was composed of two
divergent lineages that, with the exception of the sugar glider, were of comparable
depth. The biogeographic subdivisions recognised in the squirrel glider - mahogany
glider complex (NEA, EA and SEA; Figure 7a) provided an appropriate explanation
of phylogeographic structure in each glider, accounting for between one-third
(squirrel glider and mahogany glider) to two-thirds (sugar glider and yellow-bellied
glider) of the observed mtDNA variation (Table 4). The single NEA squirrel glider
from Pavlova et al. (2010) was clearly distinct from the remaining EA and SEA
samples (Figure 7b). This differentiation mirrors that of the single NEA squirrel glider
region used in this study (EU, n = 8), which was composed exclusively of NEA
haplotypes. In fact, phylogeographic structure was broadly comparable for the
squirrel glider – mahogany glider complex and yellow-bellied glider, with NEA gliders
clearly distinct from those in EA and SEA. In contrast, the most distinct subdivision in
the sugar glider network was EA, with populations exhibiting approximately 8% net
sequence divergence from NEA and SEA populations (Figure 7b).
33
RESULTS
Figure 7: a) Biogeographic subdivisions (coloured text), species distributions (grey shading), sample origins (coloured circles) and b) median joining haplotype networks for Australia’s Petaurus gliders.
Haplotype colouring corresponds with biogeographic subdivision with unsampled haplotypes coloured black. Haplotypes are scaled according to frequency and are separated by single (solid lines) or
multiple (line broken by double dash) base pair substitution. Numbers accompanying double dashed lines refer to the number of substitutions while percentages represent notable percentage sequence divergences. Networks adapted from:
1, Pavlova et al, (2010);
2, Malekian et al. (2010a);
3, Brown et
al. (2006), and 4, this study.

Table 4: Comparative a) source and b) phylogeographic data for four petaurid gliders. n, number of sequences; r, number of sampled regions. Biogeographic subdivisions: NEA, north-eastern Australia; EA, eastern Australia; SEA, south-eastern Australia. Underlined text represents mtDNA diversity and structure
measures for the Einasleigh Uplands (EU) region. Superscript text corresponds with source of mtDNA data.
a) Comparative dataset information
Source Gene Fragment size Model of sequence evolution
a This study ND2 1,040bp Tamura & Nei
b Pavlova et al., 2010 CytB 397bp Tamura & Nei
c Malekian et al., 2010a ND2/4 1,392bp Tamura & Nei
d Brown et al., 2006 ND4 873bp Tamura & Nei
b) Petaurus diversity and structure
% nucleotide diversity (πx) % sequence divergence (DA) % variance
within subdivision (n / p) between subdivisions among subdivisions
Taxon NEA EA SEA NEA-EA NEA-SEA EA-SEA Variation P-value
P. n - P. g complex a 1.0 (32/3) 0.5 (16/2) 0.6 (14/2) 1.2 1.6 1.0 44% ***
0.4 (8/1) 1.7 1.9
P. norfolcensis b 0.0 (1/1) 0.6 (66/7) 1.0 (53/7) 1.8 2.4 1.1 32% ***
P. breviceps c 0.6 (6/1) 4.9 (12/6) 0.6 (44/3) 5.8 1.7 6.3 66% ***
P. australis d 0.3 (4/1) 0.7 (15/2) 0.1 (13/3) 1.8 1.9 1.0 67% ***

35
RESULTS
Genetic diversity was generally comparable within biogeographic subdivisions
across the four Petaurus datasets, with a few exceptions (Table 4). Firstly,
comparable levels of diversity were recorded in the NEA subdivisions across all taxa
except for the squirrel glider – mahogany glider complex. This distinction is explained
by the presence of both highly divergent lineages within two of the three regions that
comprise the NEA subdivision of the squirrel glider – mahogany glider complex. An
additional estimate of πx was generated for the single region from the squirrel glider
– mahogany glider complex comprised exclusively of Lineage A sequences, EU.
Results highlighted the relatively depauperate nature of EU (πx = 0.4%) and brought
the level of NEA divergence in line with those of the other three datasets. Secondly,
genetic diversity in the SEA subdivision of the yellow-glider was markedly lower than
all other gliders, due primarily to the ubiquity of a single haplotype across the
subdivision. Thirdly, nucleotide diversity in the EA subdivision of the sugar glider was
five-fold higher than the remaining gliders. This large differentiation explains the
notably higher value for DA between EA and the other subdivisions in the sugar
glider. All other measures of DA are broadly consistent across the subdivisions and
species.
3.3 Morphometrics
Body measurements of the six external characters (Table 5) are consistent with
those published elsewhere for both the squirrel glider (Quin, 1995; Quin et al.,
1996b; Traill, 1998; Millis and Bradley, 2001) and mahogany glider (Van Dyck, 1993;
Jackson, 2000a). Despite the large geographic range, no clear clinal variation in
morphology was detected for the squirrel glider - mahogany glider complex. This

36
RESULTS
contrasts with previous examinations of eco-geographic variation in squirrel and
sugar gliders (Quin et al., 1996b) and yellow-bellied glider (Brown et al., 2006).
Preliminary two-factor ANOVA of the four mahogany glider subregions (i.e. Tu, Tc,
Ra and Ba) generated no significant geographic or sex differences in any of the six
morphological characters analysed (results not shown). Morphological data from the
four subregions was therefore grouped in line with molecular analyses (i.e. Cardwell
Lowlands, CL). Due to low sample sizes, morphological data from CCN and VIC
were merged into a broader south-eastern Australian (SEA) region that conformed to
the biogeographic zones of James and Moritz (2000) and Moussalli et al. (2005).
Although available data for EU and HR were also limited, both were maintained as
separate regions due to their geographic proximity to, and phylogeographic
relationship with, the mahogany glider. As such, caution was taken in interpreting
these data with results from these regions considered preliminary in nature.

Table 5: Raw measurements for six external morphological characters of the squirrel - mahogany glider complex. N, number of samples; min, minimum value; Mean, mean value; max, maximum value; SE, one standard error of Mean. Bracketed text accompanying morphological variables represent the unit of measurement for that variable (cm, centimetres; gm, grams). Regional abbreviations described in-text.
Snout-tail length (cm) Snout-vent length (cm) Vent-tail length (cm)
N min Mean max SE N min Mean max SE N min Mean max SE
Mahogany glider 104 480 615.4 715 4.2 99 200 260.5 320 2.1 106 240 356.1 430 3.1
Sex
male 53 548 621.9 715 4.9 53 215 261.6 320 2.5 55 280 360.6 430 4.0
female 51 480 608.6 700 6.9 46 200 259.2 320 3.5 51 240 351.2 405 4.7
Region
Tu 25 510 596.2 700 9.9 23 200 250.9 310 4.7 26 270 346.9 430 7.3
Tc 35 480 627.3 715 6.9 33 215 259.5 320 3.7 35 305 367.7 405 3.5
Ra 10 595 627.5 695 8.7 10 240 270.0 320 7.1 10 325 357.5 375 4.8
Ba 34 530 613.7 677 6.8 33 230 265.1 300 2.7 35 240 350.9 414 6.3
Squirrel glider 188 212 447.4 660 4.0 184 170 203.7 260 1.5 188 150 247.7 330 1.8
Sex
male 77 212 456.0 660 6.6 73 170 208.3 260 2.7 77 199 248.6 330 2.7
female 111 220 441.5 540 5.0 111 170 200.7 255 1.7 111 150 247.0 320 2.5
Region
EU 4 450 503.8 560 23.0 4 170 210.0 260 18.7 4 240 293.8 320 18.4
HR 2 425 542.5 660 117.5 2 195 212.5 230 17.5 2 230 280.0 330 50.0
MEQ 74 399 437.0 495 3.6 70 170 206.2 260 3.0 74 210 252.0 295 2.1
SEQ 23 380 437.0 495 5.9 23 175 201.0 227 2.9 23 195 236.1 285 4.5
NEN 64 212 417.0 502 8.4 65 173 197.7 244 1.9 64 150 237.4 290 2.7
SEA 21 419 482.1 540 7.7 20 179 215.3 245 3.3 21 220 264.3 320 6.2

Table 5 [cont]: Base measurements for six external morphological characters of the squirrel - mahogany glider complex. N, number of samples; min, minimum value; Mean, mean value; max, maximum value; SE, one standard error of Mean. Bracketed text accompanying morphological variables represent the unit of
measurement for that variable (cm, centimetres; gm, grams). Regional abbreviations described in-text.
Weight (gm) Body-tail ratio Head length (cm)
N min Mean max SE N min Mean max SE N min Mean max SE
Mahogany glider 102 195 333.5 450 5.8 98 0.57 0.73 1.00 0.01 85 41.0 55.4 68.3 0.6
Sex
male 52 200 341.0 450 8.8 52 0.61 0.73 0.98 0.01 47 47.7 55.6 68.3 0.8
female 50 195 325.7 410 7.3 46 0.57 0.74 1.00 0.01 38 41.0 55.2 67.0 0.8
Region
Tu 22 195 318.6 410 12.0 23 0.57 0.74 1.00 0.02 6 48.8 56.6 63.5 2.3
Tc 34 200 358.6 450 10.4 33 0.61 0.71 0.86 0.01 34 41.0 55.7 68.0 0.9
Ra 10 215 335.2 380 17.5 10 0.65 0.76 0.85 0.02 9 48.9 57.1 68.3 2.0
Ba 36 220 318.5 420 8.6 32 0.64 0.75 0.98 0.02 36 46.0 54.5 67.0 0.8
Squirrel glider 157 111 205.5 325 3.2 179 0.53 0.83 1.11 0.01 76 41.4 47.9 57.5 0.4
Sex
male 66 128 214.6 320 4.8 71 0.61 0.84 1.04 0.01 40 42.0 48.7 57.5 0.5
female 91 111 198.9 325 4.2 108 0.53 0.82 1.11 0.01 36 41.4 47.0 52.2 0.4
Region
EU 4 320 322.5 325 1.4 4 0.53 0.73 0.88 0.09 4 45.3 46.2 48.5 0.8
HR 2 200 204.0 208 4.0 2 0.70 0.78 0.85 0.08 1 51.6 51.6 51.6 .
MEQ 72 128 217.7 279 3.5 70 0.61 0.82 1.11 0.01 71 41.4 47.9 57.5 0.4
SEQ 19 111 178.5 301 9.9 23 0.73 0.86 1.10 0.02 0 . . . .
NEN 55 121 190.4 294 4.2 60 0.66 0.83 1.03 0.01 0 . . . .
SEA 5 130 205.2 270 25.3 20 0.63 0.83 1.02 0.02 0 . . . .

39
RESULTS
No interaction between region and sex was observed across any character (Table
6). Significant regional differences were found for all characters assessed, while only
one, namely SVL, significantly differed between the sexes. Post hoc pairwise
comparison of regional variation identified significant geographic differences in only
two characters, SVL and BTR, with the primary pattern being the differentiation of
the Cardwell Lowlands (CL) from the remaining regions. Specifically, mahogany
gliders were clearly and significantly longer than the squirrel glider (Figure 8a).
Among the squirrel glider regions, little morphological differentiation was noted, with
minor variation restricted to the southern portion of its distribution (NEN and SEA).
Regional patterns of BTR – a proxy for body mass - exhibited a similar trend, with
gliders from CL significantly heavier (i.e. lower BTR) than those from the remaining
regions (Figure 8b). Although EU and HR exhibited non-significant variation from
both the mahogany glider and four squirrel glider regions south of the Burdekin Gap
in both SVL and BTR, this was considered an artefact of under-representation of the
squirrel glider north of the Burdekin Gap in this dataset.
Table 6: Two-factor ANOVA of six external morphological characters of the squirrel - mahogany glider complex, depicting variation of a) sampling regions, b) sexual dimorphism and c) their interaction. Red
bold p-values indicate statistical significance (at p < 0.05). n/a, insufficient samples. Morphological character abbreviations: weight (WT), snout-tail length (STL), snout-vent length (SVL), vent-tail length
(VTL), body-tail ratio (BTR), head length (HL).
region sex interaction
Morphological Variable F p F p F p
SVL 59.05 0.000 8.68 0.003 0.94 0.469
BTR 9.67 0.000 0.55 0.471 0.92 0.483
WT 8.93 0.000 0.82 0.366 1.06 0390
STL 13.54 0.000 0.19 0.665 1.55 0.163
VTL 19.06 0.000 0.38 0.539 1.10 0.362
HL 4.20 0.000 2.39 0.124 na na

40
RESULTS
Figure 8: Mean values plus standard error of morphological variation in the squirrel - mahogany glider complex for the two characters to exhibit significant post-hoc pairwise differences: a) snout-vent
length (SVL), and b) body-tail ratio (BTR). Subscript letters represent region groupings, as defined by Tukey’s post-hoc HSD pairwise comparisons. N, sample size; open square, mahogany glider; closed circles, squirrel glider. Regions are ranked by increasing latitude while the gap width between regions
provides a rough measure of geographic distance. Regional abbreviations explained in-text.

Plate 4: Skins of the squirrel glider (left and centre) and the mahogany glider (right) (Museum Victoria)
Photo: P. Ferraro

42
DISCUSSION
4. Discussion
The mahogany glider (Petaurus gracilis) and squirrel glider (P. norfolcensis) share a
more complex evolutionary history than currently understood. Results from mtDNA
analyses identified two well differentiated, reciprocally monophyletic lineages that
exhibit a strong geographic orientation, but are not congruent with current taxonomy.
One lineage is restricted to north-eastern Australia (NEA) while the second is
distributed across all sampling regions except Einasleigh Uplands (EU), the northern
limit of the dataset. Thus, a narrow zone of admixture exists, restricted to the
mahogany glider in the Cardwell Lowlands (CL) and the squirrel glider population in
the adjacent Hervey Range (HR). Although exhibiting a much slower mutation rate
with perhaps minimal lineage sorting, the nuclear data also suggests a north-eastern
Australia – eastern, south-eastern Australia split. Divergence estimates date the split
between lineages to approximately the early Pleistocene. Converse to the molecular
data, however, morphology does support current taxonomy, with the mahogany
glider significantly larger (i.e. SVL and BTR) than the squirrel glider. In the following
sections I first provide a detailed discussion of the molecular findings, followed by the
implications of these results for the taxonomic status of the mahogany glider.
4.1 Phylogeography of the squirrel glider – mahogany glider complex
The primary phylogeographic split within the squirrel – mahogany glider complex
coincides with north-eastern Queensland’s Burdekin Gap; an expanse of dry, sparse
woodland and savannah separating the Wet Tropics from higher latitude subtropical
rainforests and open Eucalyptus forests (Keast, 1961; Ford, 1986; Cracraft, 1991).
Consistent with previous studies that have focussed on eastern Australia’s forest

43
DISCUSSION
communities, it is clear that the Burdekin Gap represents a persistent, long-term
dispersal barrier. These results join a growing list of studies that attribute
coincidental phylogeographic structure in open forest communities to the Burdekin
Gap. Among petaurids for instance, the dry and open woodlands of the Burdekin
Gap are recognised as the primary barrier to dispersal in the patchily distributed
yellow-bellied glider (Brown et al., 2006). More broadly, the Burdekin Gap is invoked
as the geographic feature responsible for notable phylogeographic structure in a
wide range of vertebrate taxa, including amphibians (James and Moritz, 2000),
reptiles (Edwards and Melville, 2010), birds (Joseph and Moritz, 1994) and mammals
(Taylor and Foulkes, 2004).
The Pleistocene origin of mtDNA divergence detailed in this study also compares
with those of both mammalian and non-mammalian open forest taxa, the majority of
which fall within the Pliocene – Pleistocene epochs. This correlates with the
established scenario of historical biogeography of eastern Australia, where genetic
divergence in closed forest taxa is earlier (typically Miocene – Pliocene c.f. Pliocene
– Pleistocene) and more highly geographically structured than amongst their open
forest counterparts (e.g. Schneider et al., 1998; Moritz et al., 2000; Moussalli et al.,
2005; Bell et al., 2007, 2010). As petaurid gliders have a strong association with
mature Eucalyptus stands for a range of ecological requirements, including diet,
breeding, shelter and movement (Dettmann et al., 1995; Quin et al., 1996b; Jackson,
2000c, 2001; Goldingay and Jackson, 2004; Eyre, 2007) and despite the major
climatic fluctuation associated with the Quaternary, results indicate that even open
tall forest communities rarely establish across the Burdekin Gap. Nevertheless,
admixture of the two major lineages of the squirrel – mahogany glider complex north

44
DISCUSSION
of the Burdekin Gap clearly suggest periods of intermittent connectivity of such
communities. Considering the estimated divergence between mtDNA clades within
only the southern lineage that span the Burdekin Gap (see Node 3 in Figure 2), such
connectivity may have been as recent as the current glacial or the penultimate
interglacial (Kershaw, 1976; Kershaw, 1983; Moss and Kershaw, 2000).
In contrast, the relatively deeper divergence observed among major lineages within
the sugar glider is hypothesised to have an alternative origin, namely the geographic
uplift of the Great Dividing Range (Malekian et al., 2010a). Although eastern
Australia’s petaurid gliders are largely analogous in ecological preferences the sugar
glider is considered relatively more vagile and more of a generalist in terms of habitat
and dietary preferences (Lindenmayer, 2002). Malekian et al. (2010b) proposed that
these characteristics may be responsible for the lack of phylogenetic divergence
across the Burdekin Gap in the sugar glider. The narrower habitat preferences of the
less widespread yellow-bellied glider, conversely, correspond with a greater degree
of phylogenetic partitioning across the Burdekin Gap (Brown et al., 2006). These
interspecific phylogeographic patterns mirror those among Sericornis scrubwrens
(Joseph and Moritz, 1994), which were determined to be a consequence of
interspecific ecological differentiation. Joseph and Moritz (1994) observed that the
most ecologically diverse and widely distributed species, S. frontalis, exhibited less
phylogeographic structure than its congeners, especially across the Burdekin Gap.
Contrary to previous published work on open forest taxa, no phylogenetic break was
associated with either the open woodlands of St. Lawrence Gap or the montane wet
forests of the McPherson Range. The St. Lawrence Gap, a lowland dry corridor

45
DISCUSSION
considered analogous to that of the Burdekin Gap (Chapple et al., 2011a), has
previously been cited as a long-term dispersal barrier to open forest taxa (McGuigan
et al., 1998; James and Moritz, 2000; Keogh et al., 2003), although to a lesser
extent. One possible explanation for the lack of divergence across the St. Lawrence
Gap in the squirrel – mahogany glider complex is the relatively higher dispersal
capacity of the petaurids among open forest vertebrate taxa (van der Ree et al.,
2003) paired with their ability to traverse habitat breaks (van der Ree and Bennett,
2003). In regards to the McPherson Range, a bioregion noted for its high phylogentic
endemicity among wet forest taxa (e.g. James and Moritz, 2000; Nicholls and Austin,
2005; although see Edwards and Melville, 2010), few cases of associated
phylogeographic structure exist among open forest taxa, as highlighted by Chapple
et al. (2011a).
North of the Burdekin Gap, mtDNA substructure suggests isolation of the Einasleigh
Uplands from its neighbouring populations, Hervey Range and Cardwell Lowlands.
The cause of such isolation is likely multi-faceted, with the region’s complex mosaic
of vegetation types (i.e. Figure 1, Edwards and Melville, 2010) providing numerous
potential barriers to dispersal. For instance, the strong phylogenetic differentiation
between the Einasleigh Uplands and Cardwell Lowlands populations is likely strongly
influenced by the Wet Tropics; the largely continuous high altitude rainforest that lies
to the northern and western extremes of the Cardwell Lowlands. Petaurid gliding
techniques are unsuited to movement through the closed canopy and dense
understorey characteristic of the Wet Tropics (Jackson, 1999), rendering this habitat
impassable (see Brown et al., 2006).

46
DISCUSSION
Resembling an ecological cul-de-sac, the comparatively wetter and more floristically
diverse Cardwell Lowlands appear to meld with the wider open forests of north-
eastern Australia only toward its southern reaches – as illustrated by the
phylogenetically homogeneous nature of the neighbouring Cardwell Lowlands and
Hervey Range populations. The cause of reduced gene flow between the Einasleigh
Uplands and the Hervey Range populations is less apparent, however, as each
inhabit the open sclerophyll forests that replace the closed rainforests on the western
slopes of the of the Wet Tropics. The forests are themselves replaced by woodland
savannahs at lower altitudes, producing patches of unfavourable petaurid habitat.
One such dry open woodland habitat is the Star River Valley (Williams et al., 1993),
a minor subcatchment of the Upper Burdekin River Basin located to the north-east of
the predominant biogeographic barrier of north-eastern Australia, the Burdekin Gap.
This potential vicariant barrier lies directly between the Hervey Range and Einasleigh
Uplands populations and is comprised largely of grazing natural pastureland, habitat
highly unsuited to petaurid gliders.
Relative to the deep divergence associated with the Burdekin Gap, phylogeographic
structure and phylogenetic depth among southern squirrel glider populations is less
clearly defined and due to much more recent biogeographic events. Phylogeographic
structure broadly follows that of Pavlova et al., (2010), who described the central
coast NSW as an Evolutionary Significant Unit (ESU) from an appreciably larger
dataset, albeit derived primarily from populations south of the Burdekin Gap. This
south-eastern Australian substructure appears concordant also with that observed in
the sugar glider (Malekian et al., 2010a) and, to a lesser degree, the yellow-bellied
glider (Brown et al., 2006). Both Pavlova et al. (2010) and Malekian et al. (2010b)

47
DISCUSSION
proposed that the observed substructure was a consequence of recent glaciations
along the Great Dividing Range, specifically confined to the Snowy Mountains
(Barrows et al., 2001). Such an evolutionary scenario has previously been posited
for open forest endemics, including frogs (Donnellan et al., 1999), skinks (Chapple et
al., 2011b) and lizards (Dubey and Shine, 2010).
Further to the Great Dividing Range, an additional southern New South Wales
biogeographic barrier, the Hunter River Valley, may also be involved in the isolation
of central coast NSW populations of the squirrel glider. This dry and open lowland
river valley (Keast, 1961; Ford 1987a; Cracraft, 1991) bisects traditional open forest
habitat between the north-eastern and central coast of New South Wales. Although
not previously considered a significant dispersal barrier to petaurids (Malekian et al.,
2010a; Pavlova et al., 2010), it has previously been cited in other vertebrate taxa
(e.g. Schäuble and Moritz, 2001; Chapple et al., 2005).
4.2 Taxonomic implications for the squirrel glider – mahogany glider complex
Synthesis of the molecular, ecological and morphological data suggests a complex
relationship between the mahogany glider and squirrel glider. While there exists no
molecular support for reciprocal monophyly of the mahogany and squirrel glider,
morphological differentiation appears well established. Results presented here,
specifically in terms of body length and mass, clearly show a degree of divergence in
body size between the mahogany and squirrel glider that is considerably greater
than interpopulation variation across the squirrel glider’s distribution. Hence, the
molecular data must be considered alongside Van Dyck’s (1993) taxonomic revision.

48
DISCUSSION
Such discordance between the partitioning of genetic variation and taxonomy based
on animal morphometrics is not uncommon (e.g. Omland et al., 2006; Spellman et
al., 2007; Joseph and Omland, 2009; Edwards et al., 2011; Roberts et al., 2011;
Rogers et al., 2011; Silva-Segundo et al., 2011). To this end, three primary factors,
which act either independently or in tandem, have been described to explain such
conflict (hereafter referred to as species-level paraphyly; Funk and Omland, 2003).
Imperfect taxonomy, the failure of taxonomic nomenclature to pair with gene flow
patterns, is considered to comprise the plurality of observed cases of species-level
paraphyly (e.g. Omland et al., 1999; Appleton et al., 2004; Fouquet et al., 2007). Two
further factors, incomplete lineage sorting and the associated retention of ancestral
polymorphisms (e.g. Omland et al., 2006; Fujita et al., 2010; Lack et al., 2010;
Nakamura et al., 2012) plus mitochondrial introgression following hybridisation (e.g.
Degnan, 1993; Pidancier et al., 2006; Spinks et al., 2012), account for most other
cases. Both can be notoriously difficult to differentiate via traditional phylogeographic
methods (Holder et al., 2001; Nielsen and Wakeley, 2001; Funk and Omland, 2003).
Two scenarios are thereby offered which go to explain the species-level paraphyly
discovered by the current study. The first is that ecological and morphological
differentiation reflects adaptation to local environmental conditions, and that the
mahogany glider is simply a geographic variant of the squirrel glider (i.e. imperfect
taxonomy). This scenario assumes that the diagnostic characters traditionally cited
to differentiate the two gliders do not share concomitant evolutionary divergence. It
may also explain in part the asymmetrical dispersal suggested by the molecular

49
DISCUSSION
data, namely the unidirectional gene flow from the southern lineage across the
Burdekin Gap.
To this end, size differences between the two gliders may be an effect of the
correlation of the mahogany glider’s restricted distribution with distinct temperature,
moisture, precipitation and floristic diversity profiles (Jackson and Claridge, 1999).
On account of this habitat differentiation, Van Dyck (1993) argued that the larger size
of the mahogany glider reflects higher habitat resource availability when compared to
the typically drier and more open forests of the squirrel glider. In support of this
hypothesis, Jackson and Johnson (2002) later found that, contrary to a positive
correlation between foraging and body mass in exudivorous possums, the larger
mahogany glider maintained its size advantage for relatively less foraging effort than
the squirrel glider.
It is also possible that the distinct buff coloured ventral surface from which the
mahogany glider derives its common name reflects habitat associated
polymorphisms. This hypothesis was recently put forward to explain morphological
variation between rainforest and sclerophyll forest populations of the north-eastern
Australian brushtail possum (Trichosurus vulpecula johnstonii) (S. Kerr, pers.
comm.). While exhibiting clear size and colour association with habitat (broadly
analogous to that documented between the mahogany glider and squirrel glider),
brushtail possums from each habitat were nevertheless genetically indistinguishable
at both mtDNA and microsatellite loci. It was suggested that strong habitat fidelity
and maternal diet played a role in the maintaining habitat-specific morphological
characters in the face of high levels of gene flow.

50
DISCUSSION
A comparable case of imperfect taxonomy example exists among petaurids. Brown
et al. (2006) found no concordance between molecular data and the recognised
subspecific delineation of the yellow-bellied glider, one based primarily on pelage
colouration (Thomas, 1923). These findings supported earlier doubts surrounding the
veracity of yellow-bellied glider taxonomy (Goldingay and Kavanah, 1990; Goldingay
et al., 2001), which hypothesised that pelage polymorphisms were an artefact of age
rather than biogeography. Rather, Brown et al., (2006) argued that the disjunct Wet
Tropics population – restricted to a narrow band of atypical transitional wet forest
between dry open forest and rainforest – was sufficiently genetically differentiated
(1.4% net sequence divergence) to warrant separate consideration and
management. A national recovery plan for the yellow-bellied glider (Wet Tropics) has
since been produced, with the objectives of protecting and recovering this population
throughout its limited range (Department of Environment and Resource
Management, 2011).
The underlying rationale for imperfect taxonomy, particularly species oversplitting, is
that phenotypic divergence occurs despite gene flow and is subsequently either
environmentally induced or maintained by the counter-balancing effect of strong
selection (Funk and Omland, 2003). This may arguably explain the high degree of
genetic similarity between the mahogany glider and the nearest sampled squirrel
glider population, Hervey Range. Available ecological evidence, namely a lack of
sympatry, suggests that the squirrel – mahogany glider complex does not comply
with this pre-requisite of imperfect taxonomy. As both gliders inhabit similar
ecological niches (Jackson, 2000a) and replace one another outside their distribution

51
DISCUSSION
(Quin, 1995), existing taxonomy is underpinned by an understanding of allopatry
(e.g. Van Dyck, 1993; Jackson, 2011). This is highlighted by bioclimatic models of
Jackson and Claridge (1999), which clearly indicate a significant and restrictive
association for the mahogany glider with environmental characteristics traditionally
associated with rainforest communities.
While the data generally support the mahogany glider as a geographic variant of a
larger polytypic squirrel glider complex, results do not explicitly exclude a more
nuanced interpretation. Namely, variations in size and pelage are indicative of two
genetically and morphologically divergent species, with the lack of reciprocal
monophyly a signature of intermittent northward migration of squirrel gliders across
the Burdekin Gap. This hypothesis is underpinned by the assumption that the
association of the mahogany glider with the zone of molecular admixture is non-
coincidental. Although insufficient evidence is available in this study, it is feasible that
character displacement between the mahogany glider and neighbouring populations
of the squirrel glider has arisen via strong divergent selection across a steep
moisture gradient within the region. With rainforest barriers to the west and north,
such character displacement would ensure minimal gene flow between the
mahogany glider and the squirrel glider populations in and around the Hervey
Range, approximately 50km to the south. If so, then while there does exist a high
degree of apparent morphological conservatism within this species complex (even
when incorporating the sugar glider, see Quin et al., 1996b), the significant
divergence in size alone between the mahogany glider and squirrel glider suggests
taxonomic relevance and, when considering the recent timeframe in which this
divergence arose, may be indicative of incipient speciation.

52
DISCUSSION
Although the effects of mtDNA introgression can be difficult to discern from those of
incomplete lineage sorting (Funk and Omland, 2003), the presence of the southern
lineage (i.e. Lineage B) in north-eastern Australian populations of the squirrel –
mahogany glider complex can be interpreted as a genetic signature of dispersal of
southern squirrel glider across the Burdekin Gap throughout the Quaternary. Such
instances of introgression may have been facilitated by periodic shifts in habitat
composition across the Burdekin Gap, namely the replacement of dry and open
woodland with open forests throughout the Quaternary. This scenario is supported
by BEAST analyses, which date the most recent instance of this purported
introgression to approximately 0.12 – 0.39 million YBP, a time when Eucalyptus
forests replaced open woodland along the Burdekin Gap (Keast, 1961). This would
therefore have had the effect of re-establishing contact both between northern and
southern populations of squirrel glider and between the mahogany glider and
southern populations of the squirrel glider.
Signatures of both introgression and incipient speciation may arguably be observed
in the expanded Queensland dataset. While the introgressed southern lineage is
similarly distributed across the majority of the admixture zone (excluding Tully), the
abundance of individuals carrying the southern haplotypes is markedly different
between populations of the two taxa. The greater abundance of southern haplotypes
in Hervey Range may be evidence of low levels of gene flow from the Einasleigh
Uplands squirrel glider population. That this contact appears not to extend into the
southern reaches of the mahogany glider’s distribution may potentially reflect the
aforementioned character displacement. Further, equal representation of both the

53
DISCUSSION
northern lineage and introgressed southern lineage across the majority of the
admixture zone may be indicative of hybridisation, suggesting that character
displacement may only be in effect between individuals of the squirrel – mahogany
glider complex from populations north of the Burdekin Gap.
4.3 Conclusions and future actions
In the current study the taxonomic validity of the mahogany glider within Petaurus
remains unresolved, necessitating further investigation. Whether this concludes with
the retention of P. gracilis, recognition of subspecific status for the mahogany glider
(P. norfolcensis gracilis), creation of a broader north-eastern Australian subspecies
comprising both taxa (P. n. norfolcensis) or the subsumption of the mahogany glider
within P. norfolcensis relies upon additional well-constructed research. It is
recommended that future research address two important issues, namely clarifying
the dimensions of the admixture zone between the mahogany and squirrel glider and
defining the extent, composition and direction of gene flow among squirrel glider
populations across the Burdekin Gap.
Most critical is the generation of a definitive description of the dimensions,
composition and location of the zone of admixture between the mahogany glider and
neighbouring squirrel glider populations. Considering gene flow between the two
gliders appears restricted by the Wet Tropics to the north and west, sampling should
focus upon the 50km transect of open forest between the Cardwell Lowlands and
Hervey Range populations (see Figure 4). Intense sampling along such an
ecologically defined transect would allow for the identification of genotypic and

54
DISCUSSION
phenotypic intermediates via supplementary analysis of highly polymorphic
microsatellite markers and morphometric characters.
Secondly, the identification of uni-directional gene flow between two divergent
mtDNA lineages across the Burdekin Gap requires further investigation, namely
mapping the extent of northward introgression from populations south of the
Burdekin Gap and investigating the apparent absence of concomitant north-south
introgression. This is especially important given that the under-representation of
squirrel gliders from north of the Wet Tropics may mask further evidence of genetic
admixture. Unlike the two other eastern Australian petaurid gliders with a widespread
distribution, the sugar and yellow-bellied gliders, no intraspecific subdivisions are
currently recognised within the squirrel glider. As Pavlova et al. (2010) argued for the
evolutionary distinctness of southern populations of the squirrel glider using mtDNA
and microsatellite data, this study suggests a similar status for the species’ poorly
understood – yet genetically distinct – northern range. Any future research should
therefore prioritise the increased of both the molecular and morphological
representation across north-eastern Australia to allow for a more accurate
interpretation of taxonomy within the polytypic squirrel glider. This is especially
critical when considering the incomplete distributional information of the squirrel
glider in northern Australia, particularly the Cape York Peninsula and inland of the
Great Dividing Range (Winter et al., 2004) and the purported smaller size of squirrel
gliders within this region (Menkhorst and Knight, 2001).
Such strategies are known to have succeeded in the past. Barrowclough et al.
(2005) detected a pattern of limited mtDNA introgression across a narrow hybrid

55
DISCUSSION
zone between two phenotypically defined subspecies of the spotted owl (Strix
occidentalis), one of which was ESA-listed (S. o. caurina). Not only was this
demographic pattern later confirmed by complementary microsatellite analyses
(Funk et al., 2008), but previously undetected congeneric introgression into the
endangered subspecies was detected. In another instance, Joseph et al. (2009)
employed complementary microsatellite data to confirm incomplete lineage sorting
as the cause of mtDNA paraphyly between two Australian species of Anas teals, as
identified by Kennedy and Spencer (2000). The synthesis of mtDNA and
microsatellite data (King et al., 2006) also revealed the evolutionary distinctiveness
of an endangered jumping mouse (Zapus hudsonius preblei) from its conspecifics,
thereby contradicting an existing recommendation for its synonymisation within Z.
hudsonius (Ramey et al., 2005); an action that would have resulted in its delisting
from the US Endangered Species Act. As these studies indicate, finescale molecular
and morphological analyses can be critical tools in defining taxonomic boundaries for
the management of taxa with high conservation values, such as those within the
squirrel – mahogany glider complex.

56
BIBLIOGRAPHY
Bibliography
Amrine-Masden, H., Koepfli, K.P., Wayen, R.K. and Springer, M.S. (2003) A new
phylogenetic marker, apolipoprotein B provides compelling evidence for eutherian
relationships. Molecular Phylogenetics and Evolution, 28, 225-240.
Appleton, B.R., McKenzie, J.A. and Christidis, L. (2004) Molecular systematic and
biogeography of the bent-wing bat complex Miniopteus schreibersii (Kuhl, 1817)
(Chiroptera: Vespertilionidae). Molecular Phylogenetics and Evolution, 31, 431-439.
Arbogast, B.S. and Kenagy, G.J. (2001) Comparative phylogeography as an integrative
approach to historical biogeography. Journal of Biogeography, 28, 819-825.
Avise, J.C. (2000) Phylogeography: the history and formation of species. Harvard
University Press, Cambridge, Massachusetts.
Ball, T., Adams, E. and Goldingay, R. L. (2009) Diet of the squirrel glider in a fragmented
landscape near Mackay, central Queensland. Australian Journal of Zoology, 57, 295-
304.
Ball, T., Goldingay, R.L. and Wake, J. (2011) Den trees, hollow-bearing trees and nest
boxes: management of squirrel glider (Petaurus norfolcensis) nest sites in tropical
Australian woodland. Australian Mammalogy, 33, 106-116.
Bandelt, H.J., Forster, P., Sykes, B.C. and Richards, M.B. (1995) Mitochondrial portraits of
human populations. Genetics, 141, 743-753.
Bandelt, H.J., Forster, P. and Röhl, A. (1999) Median-joining networks for inferring
intraspecific phylogenies. Molecular Biology and Evolution, 16, 37-48.
Barrowclough, G.F., Groth, J.G. and Mertz, L.A. and Gutierrez, R.J. (2005) Genetic
structure, introgression, and a narrow hybrid zone between northern and California
spotted owls (Strix occidentalis). Molecular Ecology, 14, 1109-1120.

57
BIBLIOGRAPHY
Barrows, T.T., Stone, J.O., Fifield, L.K. and Cresswell, R.G. (2001) Late Pleistocene
glaciations of the Kosciuszko Massif, Snowy Mountains, Australia. Quaternary
Research, 55, 179-189.
Bell, K.L.. Yeates, D.K., Moritz, C. and Monteith, G.B. (2004) Molecular phylogeny and
biogeography of the dung beetle genus Temnoplectron Westwood (Scarabaeidae:
Scarabaeinae) from Australia’s wet tropics. Molecular Phylogeny and Evolution, 31,
741-753.
Bell, K.L., Moritz, C., Moussalli, A. and Yeates, D.K. (2007) Comparative phylogeography
and speciation from the Australian Wet Tropics rainforests. Molecular Ecology, 16,
4984-4998.
Bell, R.C., Parra, J.L. Tonione, M. and Hoskin, C.J. (2010) Patterns of persistence and
isolation indicates resilience to climate change in montane rainforest lizards.
Molecular Ecology, 19, 2531-2544.
Bermingham, E and Moritz, C. (1998) Comparative phylogeography: concepts and
applications. Molecular Ecology, 7, 367-369.
Bernatchez, L. and Wilson, C.C. (1998) Comparative phylogeography of Nearctic and
Palearctic fishes. Molecular Ecology, 7, 431-452.
Bininda-Emonds, O.P.R. (2007) Fast genes and slow clades: comparative rates of
molecular evolution in mammals. Evolutionary Bioinformatics, 3, 59-85.
Blackwell, G.L., Bassett, S. M. and Dickman, C.R. (2006) Measurement error associated
with external measurements commonly used in small-mammal studies. Journal of
Mammalogy, 87, 216-223.
Blakers, M., Davies, S.J.J.F. and Reilly, P.N. (1984) The atlas of Australian birds.
Melbourne University Press, Melbourne.

58
BIBLIOGRAPHY
Bowman, D.M.J.S., Brown, G.K., Braby, M.F., Brown, J.R., Cook, L.G., Crisp, M.D., Ford,
F., Haberle, S., Hughes, J., Isagi, Y., Joseph, L., McBride, J., Nelson, G. and
Ladiges, P.Y. (2010) Biogeography of the Australian monsoon tropics. Journal of
Biogeography, 37, 201-216.
Bowler, J.M. (1982) Aridity in the late Tertiary and Quaternary of Australia. Evolution of the
flora and fauna of arid Australia (eds. W.R. Barker and P.J.M. Greenslade), pp. 35-
45. Peacock Publications, Adelaide.
Brown, W.M., George Jr., M. and Wilson, A.C. (1979) Rapid evolution of animal
mitochondrial DNA. Proceedings of the National Academy of Sciences of the United
States of America, 76, 1967-1971.
Brown, M., Cooksley, H., S.M. and Cooper, S.J.B. (2006) Conservation units and
phylogeographic structure of an arboreal marsupial, the yellow-bellied glider
(Petaurus australis). Australian Journal of Zoology, 54, 305-317.
Burnett, S., Winter, J. and Martin, R. (2008) Petaurus gracilis. In: IUCN Red List of
Threatened Species. Version 2011.2. <www.iucnredlist.org>. Accessed on
6 December 2011.
Byrne, M., Yeates, D.K., Joseph, L., Kearney, M., Bowler, J., Williams, M.A.J., Cooper, S.,
Donnellan, S.C., Keogh, J.S., Leys, R., Melville, J., Murphy, D.J., Porch, N. and
Wyrwoll, K.H. (2008) Birth of a biome: insights into the assembly and maintenance of
the Australian arid zone biota. Molecular Ecology, 17, 4398-4417.
Byrne, M., Steane, D.A., Joseph, L., Yeates, D.K., Jordan G.J., Crayn, D., Aplin, K.,
Cantrill, D.J., Cook, L.G., Crisp, M.D, Keogh, J.S., Melville, J., Moritz, C., Porch, N.,
Kale Sniderman, J.M., Sunnucks, P. and Weston, P.H. (2011) Decline of a biome:
evolution, contraction, fragmentation, extinction and invasion of the Australian mesic
zone biota. Journal of Biogeography, 38:1635-1656.

59
BIBLIOGRAPHY
Chapple, D.G., Keogh, J.S., and Hutchinson, M.N. (2005) Substantial genetic
substructuring in south-eastern and alpine Australia revealed by molecular
phylogeography of the Egernia whitii (Lacertilla: Scincidae) species group. Molecular
Ecology, 14, 1279-1292.
Chapple, D.G., Hoskin, C.J., Chapple, S.N.J. and Thompson, M.B. (2011a)
Phylogeographic divergence in the widespread delicate skink (Lampropholis
delicata) corresponds to dry habitat barriers in eastern Australia. BMC Evolutionary
Biology, 11:191.
Chapple, D.G., Chapple, S.N.J. and Thompson, M.B. (2011b) Biogeographic barriers in
south-eastern Australia drive phylogeographic divergence in the garden skink,
Lampropholis guichenoti. Journal of Biogeography, 38:1761-1775.
Claridge, A.W. and van der Ree, R. (2004) Recovering endangered populations in
fragmented landscapes: the squirrel glider ‘Petaurus norfolcensis’ on the south-west
slopes of New South Wales. Conservation of Australia’s forest fauna (ed. D.
Lunney), pp. 678-687. Royal Zoological Society of New South Wales, Sydney.
Cogger, H.G. (2000) Reptiles and amphibians of Australia. 5th edn. Reed New Holland,
Sydney.
Colgan, D.J. and Flannery, T.F. (1992) Biochemical studies in the genus Petaurus
(Marsupialia: Petauridae). Australian Journal of Zoology, 30, 245-256.
Cracraft, J. (1991) Patterns of diversification within continental biotas: hierarchical
congruence among the areas of endemism of Australian vertebrates. Australian
Systematic Botany, 4, 211-227.
Crandall, K.A. and Templeton, A.R. (1993) Empirical tests of some predictions from
coalescent theory with applications to intraspecific phylogeny reconstruction.
Genetics, 134, 959-969.

60
BIBLIOGRAPHY
Crisp, M.D., Linder, H.P., and Weston, P.H. (1995) Cladistic biogeography of plants in
Australia and New Guinea: congruent pattern reveals two endemic tropical tracks.
Systematic Biology, 44, 457-473.
Davey, S.M. (1984) Habitat preference of arboreal marsupials within a coastal forest in
southern New South Wales. Possums and Gliders (eds. A.P. Smith and I.D. Hulme),
pp. 509-516. Australian Mammal Society, Sydney.
Degnan, S.M. (1993) The perils of single gene trees – mitochondrial versus single-copy
nuclear DNA variation in white-eyes (Aves: Zosteropidae). Molecular Ecology, 2,
219-225.
Department of Environment and Resource Management (2011) National recovery plan for
the yellow-bellied glider (Wet Tropics) Petaurus australis unnamed subspecies.
Report to Department of Sustainability, Environment, Water, Population and
Communities, Canberra. Department of Environment and Resource Management,
Brisbane.
Dettmann, M.E., Jarzen, D.M. and Jarzen, S.A. (1995) Feeding habits of the mahogany
glider: palynological evidence. Palynology, 19, 137-142.
De Vis, C.W. (1883) Description of a new Belidius from northern Queensland. Abstracts
and Proceedings of the Linnean Society of New South Wales, 1, 619-620.
Dickinson, J.A., Wallace, M.W., Holdgate, G.R., Gallagher, S.J. and Thomas, L. (2002)
Origin and timing of the Miocene-Pliocene unconformity in southeast Australia.
Journal of Sedimentary Research, 72, 288-303.
Dolman, G. and Moritz, C. (2006) A multilocus perspective on refugial isolation and
divergence in rainforest skinks (Carlia). Evolution, 60, 573-582.

61
BIBLIOGRAPHY
Donnellan, S.C., McGuigan, K., Knowles, R., Mahony, M. and Moritz, C. (1999) Genetic
evidence for species boundaries in frogs of the Litoria citropa species-group (Anura:
Hylidae). Australian Journal of Zoology, 47, 275-293.
Drummond, A.J. and Rambaut, A. (2007) BEAST: Bayesian evolutionary analysis by
sampling trees. BMC Evolutionary Biology, 7, 214-21.
Dubey, S. and Shine, R. (2010) Evolutionary diversification of the lizard genus Bassiana
(Scincidae) across southern Australia. PLoS One, 5, e12982.
Dupanloup, I., Schneider, S. and Excoffier, L. (2002) A simulated approach to define the
genetic structure of populations. Molecular Ecology, 11, 2571-2581.
Edwards, D.L. and Melville, J. (2010) Phylogeographic analysis detects congruent
biogeographic patterns between a woodland agamid and Australian wet tropics taxa
despite disparate evolutionary trajectories. Journal of Biogeography, 37, 1543-1556.
Edwards, S., Claude, J., Van Vuuren, B.J. and Matthee, C.A. (2011) Evolutionary history
of the Karoo bush rat, Myotomys unisulcatus (Rodentia: Muridae): discordance
between morphology and genetics. Biological Journal of the Linnean Society, 102,
510-526.
Eldridge, M.D.B., Heckenberg, K., Neaves, L.E., Metcalfe, C.J., Hamilton, S., Johnson,
P.M. and Close, R.L. (2011) Genetic differentiation and introgression amongst
Thylogale (pademelon) taxa in eastern Australia. Australian Journal of Zoology, 59,
103-117.
Engels, W. (2005) Amplify3, version 3.1.4,
http://engels.genetics.wisc.edu/amplify/#Anchor-Amplify-47857.
Excoffier, L. and Lischer, H.E.L. (2010) Arlequin suite ver3.5: a new series of programs to
perform population genetics analyses under Linux and Windows. Molecular Ecology
Resources, 10, 564-567.

62
BIBLIOGRAPHY
Eyre, T.J. (2004) Distribution and conservation status of the possums and gliders of
southern Queensland. The Biology of Australian Gliders and Possums (eds. R.L.
Goldingay and S.M. Jackson), pp. 1-25. Surrey Beatty and Sons, Sydney.
Eyre, T.J (2007) Regional habitat selection of large gliding possums at forest stand and
landscape scales in southern Queensland, Australia II. Yellow-bellied glider
(Petaurus australis). Forest Ecology and Management, 239, 136-149.
Fleay, D. (1947) Gliders of the gum trees. Bread and Cheese Club, Melbourne.
Ford, J. (1986) Avian hybridisation and allopatry in the region of the Einasleigh Uplands
and Burdekin-Lynde Divide, north-east Queensland. Emu, 86, 87-110.
Ford, J. (1987a) Hybrid zones in Australian birds. Emu, 87, 158-178.
Ford, J. (1987b) Minor isolates and minor geographical barriers in avian speciation in
continental Australia. Emu, 87, 90-102.
Fouquet, A., Gilles, A., Vences, M., Marty, C., Blanc, M. and Gemmell, N.J. (2007)
Underestimation of species richness in Neotropical frogs revealed by mtDNA
analyses. PLoS ONE, 2, e1109. doi:10.1371/journal.pone.0001109.
Fowler, E.V., Houlden, B.A., Hoeben, P. and Timms, P. (2000) Genetic diversity and gene
flow among southeastern Queensland koalas (Phascolarctos cinereus). Molecular
Ecology, 9, 155-164.
Frakes, L.A., McGowran, B., Bowler, J.M. (1987) Evolution of Australian environments. In,
Fauna of Australia, Volume 1A (eds. G.R. Dyne and D.W. Walton), pp. 1-16.
Australian Government Publishing Service, General Articles, Canberra.
Fujita, M.K., McGuire, J.A., Donnellan, S.C. and Moritz, C. (2010) Diversification and
persistence at the arid-monsoonal interface: Australia-wide biogeography of the
Bynoe’s gecko (Heteronotia binoei; Gekkonidae). Evolution, 64, 2293-2314.

63
BIBLIOGRAPHY
Funk, D.J. and Omland, K.E. (2003) Species-level paraphyly and polyphyly: frequency,
causes, and consequences, with insights from animal mitochondrial DNA. Annual
Review of Ecology Evolution and Systematics, 34, 397-423.
Funk, W.C., Forsman, E.D., Mullins, T.D. and Haig, S.M. (2008) Introgression and
dispersal among spotted owl (Strix occidentalis) subspecies. Evolutionary
Applications, 1, 161-171.
Garrick, R.C., Sunnucks, P. and Dyer, R.J. (2010) Nuclear gene phylogeography using
PHASE: dealing with unresolved genotypes, lost alleles, and systematic bias in
parameter estimation. BMC Evolutionary Biology, 10:118.
Gemmell, N.J. and Akiyama, S. (1996) An efficient method for the extraction of DNA from
vertebrate tissues. Trends in Genetics, 12, 338-339.
Gibbons, P. and Lindenmayer, D.B. (2002) Tree hollows and wildlife conservation in
Australia. CSIRO Publishing, Melbourne.
Goldingay, R.L. and Kavanah, R.P. (1990) Socioecology of the yellow-bellied glider,
Petaurus australis, at Waratah Creek, NSW. Australian Journal of Zoology, 38, 327-
341.
Goldingay, R.L. and Jackson, S.M. (2004) A review of the ecology of the Australian
Petauridae. The Biology of Australian Gliders and Possums (eds. R.L. Goldingay
and S.M. Jackson), pp. 376-400. Surrey Beatty and Sons, Sydney.
Goldingay, R.L. and Quin, D. (2004) Components of the habitat of the yellow-bellied glider
in northern Queensland. The Biology of Australian Possums and Gliders (eds. R.L.
Goldingay and S.M. Jackson), pp. 369-375. Surrey Beatty and Sons, Sydney.
Goldingay, R.L., Quin, D.G. and Churchill, S. (2001) Spatial variability in the social
organisation of the yellow-bellied glider (Petaurus australis) near Ravenshoe, north
Queensland. Australian Journal of Zoology, 49, 397-409.

64
BIBLIOGRAPHY
Guindon, S. and Gascuel, O. (2003) A simple, fast and accurate algorithm to estimate
large phylogenies by maximum likelihood. Systematic Biology, 52, 696-704.
Hasegawa, M., Kishino, H., and Yano, T. (1985) Dating of the human-ape splitting by a
molecular clock of mitochondrial DNA. Journal of Molecular Evolution, 22, 160–74.
Holder, M.T., Anderson, J.A. and Holloway, A.K. (2001) Difficulties in detecting
hybridisation. Systematic Biology, 50, 978-982.
Hoskin, C.J., Higgie, M., McDonald, K.R. and Moritz, C. (2005) Reinforcement drives rapid
allopatric speciation. Nature, 437, 1353-1356.
Houlden, B.A., Costello, B.H., Sharkey, D., Fowler, E.V., Melzer, A., Ellis, W., Carrick, F.,
Baverstock, P.R. and Elphinstone, M.S. (1999) Phylogeographic differentiation in the
mitochondrial control region of the koala, Phascolarctos cinereus (Goldfuss 1817).
Molecular Ecology, 8, 999-1011.
Hudson, R.H. (2000) A new statistic for detecting genetic differentiation. Genetics, 155,
2011-2014.
Hugall, A., Moritz, C., Moussalli, A. and Stanisic, J. (2002) Reconciling paleodistribution
models and comparative phylogeography in the Wet Tropics rainforest land snail
Gnarosophia bellendenkerensis (Brazier 1875). Proceedings of the National
Academy of Sciences of the United States of America, 99, 6116-6117.
Iredale, T. and Troughton, E. (1934) A check-list of the mammals recorded from Australia.
Memoirs of the Australian Museum, 6, 1-122.
Jackson, S.M. (1999) Glide angle in the genus Petaurus and a review of gliding in
mammals. Mammal Review, 30, 9-30.
Jackson, S.M. (2000a) Habitat relationship of the mahogany glider, Petaurus gracilis, and
the sugar glider, Petaurus breviceps. Wildlife Research: 27, 39-48.

65
BIBLIOGRAPHY
Jackson, S. M. (2000b) Home range and den use of the mahogany glider. Wildlife
Research: 27, 49-60.
Jackson, S. M. (2000c) Population dynamics and life history of the mahogany glider,
Petaurus gracilis, and the sugar glider, Petaurus breviceps, in north Queensland.
Wildlife Research: 27, 21-37.
Jackson, S.M. (2001) Foraging behaviour and food availability of the mahogany glider
Petaurus gracilis (Petauridae: Marsupialia). Journal of Zoology (London), 253, 1-13.
Jackson, S.M. (2011) Petaurus gracilis (Diprotodontia: Petauridae). Mammalian Species,
43, 141-148.
Jackson, S. M., and Claridge, A.C. (1999) Climatic modelling of the distribution of the
mahogany glider (Petaurus gracilis), and the squirrel glider (P. norfolcensis).
Australian Journal of Zoology: 47, 47-57.
Jackson, S.M., and Johnson, C.N. (2002) Time allocation to foraging in the mahogany
glider Petaurus gracilis (Marsupialia, Petauridae) and a comparison of activity times
in exudivorous and folivorous possums and gliders. Journal of Zoology (London),
256, 271-277.
Jackson, S.M., Morgan, G., Kemp, J.E., Maughan, M. and Stafford, C.M. (2011) An
accurate assessment of habitat loss and current threats to the mahogany glider
(Petaurus gracilis). Australian Mammalogy, 33, 82-89.
James, C. H. and Moritz, C. (2000) Interspecific phylogeography in the sedge frog Littoria
fallax (Hylidae) indicates pre-Pleistocene vicariance of an open forest species from
eastern Australia. Molecular Ecology, 9, 349-358.
Joseph, L. and Moritz, C. (1993) Phylogeny and historical aspects of the ecology of
eastern Australian scrubwrens Sericornis spp. – evidence from mitochondrial DNA.
Molecular Ecology, 2, 161-170.

66
BIBLIOGRAPHY
Joseph, L. and Moritz, C. (1994) Mitochondrial DNA phylogeography of birds in eastern
Australian rainforests: first fragments. Australian Journal of Zoology, 42, 385-403.
Joseph, L. and Omland, K.E. (2009) Phylogeography: its development and impact in
Australo-Papuan ornithology with special reference to paraphyly in Australian birds.
Emu, 109, 1-23.
Joseph, L., Adcock, G.A., Linde, C., Omland, K.E., Heinsohn, R., Chesser, R.T., and
Roshier, D. (2009) A tangled tale of two teals: population history off the grey Anas
gracilis and chestnut teal A. castanea of Australia. Journal of Avian Biology, 40, 430-
439.
Keast, A. (1961) Bird speciation on the Australian continent. Bulletin of the Museum of
Comparative Zoology, Harvard University, 123, 303-495.
Keast, A. (1981) Distributional patterns, regional biotas, and adaptations in the Australian
biota: a synthesis. Ecological biogeography of Australia (ed. A. Keast), pp. 1891-
1997. W. Junk, Hague, Boston.
Kennedy, M. and Spencer, H.G. (2000) Phylogeny, biogeography, and taxonomy of
Australasian teals. The Auk, 117, 154-163.
Keogh, J.S. Scott, I.A.W., Fitzgerald, M. and Shine, R. (2003) Molecular phylogeny of the
Australian venomous snake genus Hoplocephalus (Serpentes, Elapidae) and
conservation genetics of the threatened H. stephensii. Conservation Genetics, 4, 57-
65.
Keogh, J.S., Scott, I.A.W., and Hayes, C. (2005) Rapid and repeated origin of insular
gigantism and dwarfism in Australian tiger snakes. Evolution, 59, 226-233.
Kershaw, A.P. (1976) A late Pleistocene and Holocene pollen diagram from Lynch’s
Crater, north-eastern Queensland, Australia. New Phytologist, 77, 469-498.

67
BIBLIOGRAPHY
Kershaw, A.P. (1981) Quaternary vegetation and environments. Ecological biogeography
of Australia (ed. A. Keast), pp. 83-101. W. Junk, Hague Boston, Boston.
Kershaw, A.P. (1983) A Holocene pollen diagram from Lynch's Crater, north-eastern
Queensland, Australia. New Phytologist, 94, 669-682.
Kershaw, A. P., Martin, H.A. and McEwan Mason, J.R.C. (1994) The Neogene: a period of
transition. History of the Australian vegetation: Cretaceous to recent (ed. R.S. Hill),
pp. 299-327. Cambridge University Press, Cambridge.
King, T. L., Switzer, J.F., Morrison, C.L., Eackles, M.S., Young, C.Y, Lubinski, B.A, and
Cryan, P. (2006) Comprehensive genetic analyses reveal evolutionary distinction of
a mouse (Zapus hudsonius preblei) proposed for delisting from the US Endangered
Species Act. Molecular Ecology, 15, 4331-4359.
Krajewski, C., Wroe, S. and Westerman, M. (2000) Molecular evidence for the pattern and
timing of cladogenesis in dasyurid marsupials. Zoological Journal of the Linnean
Society, 130, 375-404.
Krosch, M.N. (2011) Phylogeography of Echinocladius martini Cranston (Diptera:
Chironomidae) in closed forest streams of eastern Australia. Australian Journal of
Entomology, 50, 258-268.
Krosch, M.N., Baker, A.M., McKie, B.G., Mather, P.B. and Cranston, P.S. (2009) Deeply
divergent mitochondrial lineages reveal patterns of local endemism in chironomids of
the Australian Wet Tropics. Austral Ecology, 34, 317-328.
Lack, J.B., Pfau, R.S. and Wilson, G.M. (2010) Demographic history and incomplete
lineage sorting obscure population genetic structure of the Texas mouse
(Peromyscus attwateri). Journal of Mammalogy, 91, 314-325.
Lambeck, K. and Chappell, J. (2001) Sea level changes through the last glacial cycle.
Science, 292, 679-686.

68
BIBLIOGRAPHY
Librado, P. and Rozas, J. (2009) DnaSP v5: a software for comprehensive analysis of
DNA polymorphism data. Bioinformatics, 25, 1451-1452.
Nielsen, R. and Wakeley, J. (2001) Distinguishing migration from isolation: a Markow
Chain Monte Carlo approach. Genetics, 158, 885-896.
Lindenmayer, D.B. (2002) Gliders of Australia: a natural history. University of New South
Wales, Sydney.
Lindenmayer, D.B., Claridge, A., Hazell, D., Michael, D., Crane, M., MacGregor, C., and
Cunningham, R. (2003) Wildlife on Farms. CSIRO Publishing, Melbourne.
Mackay, B.G., Berry, S.L. and Brown, T. (2008) Reconciling approaches to
biogeographical regionalisation: a systematic and generic framework examined with
a case study of the Australian continent. Journal of Biogeography, 35, 213-229.
Malekian, M., Cooper, S.J.B. and Carthew, S.M. (2010a) Phylogeography of the
Australian sugar glider (Petaurus breviceps): evidence for a new divergent lineage in
eastern Australia. Australian Journal of Zoology, 58, 165-181.
Malekian, M., Cooper, S.J.B., Norman, J.A., Christidis, L. and Carthew, S.M. (2010b)
Molecular systematic and evolutionary origins of the genus Petaurus (Marsupialia:
Petauridae) in Australia and New Zealand. Molecular Phylogenetics and Evolution,
54, 122-135.
McGuigan, K., McDonald, K., Parris, K. and Moritz, C. (1998) Mitochondrial DNA diversity
and historical biogeography of a wet forest-restricted frog (Litoria pearsoniana) from
mid-east Australia. Molecular Ecology, 7, 175-196.
Menkhorst, P.W. and Knight, F. (2001) A Field Guide to the Mammals of Australia. Oxford
University Press, Melbourne.

69
BIBLIOGRAPHY
Millis, A.L. and Bradley, A.J. (2001) Reproduction in the squirrel glider, Petaurus
norfolcensis (Petauridae) in south-east Queensland. Australian Journal of Zoology,
49, 139-154.
Moritz, C. and Faith, D.P. (1998) Comparative phylogeography and the identification of
genetically divergent areas for conservation. Molecular Ecology, 7, 419-429.
Moritz, C., Patton, J.L., Schneider, C.J. and Smith, T.B. (2000) Diversification of rainforest
faunas: An integrated approach. Annual Review of Ecology and Systematics, 31,
533-563.
Moritz, C., Hoskin, C.J., Graham, C.H., Hugall, A. and Moussalli, A. (2005) Historical
biogeography, diversity and conservation of Australia's tropical rainforest
herpetofauna. Phylogeny and conservation. (eds. A. Purvis, J.L. Gittleman and T.
Brooks), pp. 243-264. Cambridge University Press, Cambridge.
Moss, P.T., Kershaw, A.P. (2000) The last glacial cycle from the humid tropics of
northeastern Australia: comparison of a terrestrial and marine record.
Palaeogeography, Palaeoclimatology, Palaeoecology, 155, 155-176.
Moussalli, A., Hugall, A.F. and Moritz, C. (2005) A mitochondrial phylogeny of the
rainforest skink genus Saproscincus, Wells and Wellington (1984). Molecular
Ecology, 14, 1485-1496.
Nakamura, K., Chung, K.F., Huang, C.J., Kono, Y., Kokubugata, G. and Peng, C.I. (2012)
Extreme habitats that emerged in the Pleistocene triggered divergence of weedy
Youngia (Asteraceae) in Taiwan. Molecular Phylogenetics and Evolution, 63, 486-
499.
Nei, M. (1987) Molecular Evolutionary Genetics. Columbia University Press, New York,
NY.

70
BIBLIOGRAPHY
Nicholls, J.A. and Austin, J.J. (2005) Phylogeography of an east Australian wet-forest bird,
the satin bowerbird (Ptilonorhynchus violaceus), derived from mtDNA, and its
relationship to morphology. Molecular Ecology, 14, 1485-1496.
Nix, H.A. (1982) Environmental determinants of biogeography and evolution in Terra
Australis. Evolution of the flora and fauna of arid Australia (eds. W.R. Barker and
P.J.M. Greenslade), pp. 47-66. Peacock Publications, Adelaide.
Omland, K.E., Lanyon, S.M. and Fritz, S.J. (1999) A molecular phylogeny of the New
World orieles (Icterus): the importance of dense taxon sampling. Molecular
Phylogenetics and Evolution, 12, 224-239.
Omland, K.E., Baker, J.M. and Peters, J.L. (2006) Genetic signatures of intermediate
divergence: population history of Old and New World Holarctic ravens (Corvus
corax). Molecular Ecology, 15, 795-808.
Osborne, M.J. and Christidis, L. (2001) Molecular phylogenetics of Australo-Papuan
possums and gliders (Family Petauridae). Molecular Phylogenetics and Evolution,
20, 211-224.
Osborne, M.J., Christidis, L. and Norman, J.A. (2002) Molecular phylogenetics of the
Diprotodontia (kangaroos, wombats, koala, possums and allies). Molecular
Phylogeny and Evolution, 25, 219-228.
Palmeirim, J.M. (1998) Analysis of skull measurements and measurers: can we use data
obtained by various observers? Journal of Mammalogy, 79, 1021-1028.
Parsons, M. and Latch, P. (2006) National recovery plan for the mahogany glider
‘Petaurus gracilis’. Queensland Parks and Wildlife Services, Brisbane.
Pavlova, A., Walker, F.M., van der Ree, R., Cesari, S. and Taylor, A.C. (2010) Threatened
populations of the Australian squirrel glider (Petaurus norfolcensis) show evidence of

71
BIBLIOGRAPHY
evolutionary distinctiveness on a Late Pleistocene timescale. Conservation Genetics,
11, 2393-2407.
Pidancier, N., Jordan, S., Luikart, G. and Taberlet, P. (2006) Evolutionary history of the
genus Capra (Mammalia, Artiodactyla): discordance between mitochondrial DNA
and Y-chromosome phylogenies. Molecular Phylogenetics and Evolution, 40, 739-
749.
Polzin, T. and Daneschmand, S. V. (2003) On Steiner trees and minimum spanning trees
in hypergraphs. Operations Research Letters, 31, 12-20.
Posada, D. (2008) jModelTest: Phylogenetic model averaging. Molecular Biology and
Evolution, 25, 1253-1256.
Potter, S., Cooper, S.J.B, Metcalfe, C.J., Taggart, D.A. and Eldridge, M.D.B. (2012)
Phylogenetic relationships of rock-wallabies, Petrogale (Marsupalia: Macropodidae)
and their biogeographic history within Australia. Molecular Phylogenetics and
Evolution, 62, 640-652.
Quin, D. (1995) Population ecology of the squirrel glider (Petaurus norfolcensis) and the
sugar glider (P. breviceps) (Marsupialia: Petauridae) at Limeburners Creek, on the
Central North Coast of New South Wales. Wildlife Research, 22, 471-505.
Quin, D., Goldingay, R.L., Churchill, S. and Engel, D. (1996a) Feeding behaviour and food
availability of the yellow-bellied glider. Wildlife Research, 23, 637-646.
Quin, D., Smith, A.P. and Norton, T.W. (1996b) Eco-geographic variation in size and
sexual dimorphism in sugar gliders and squirrel gliders (Marsupialia: Petauridae).
Australian Journal of Zoology, 44, 19-45.
Rambaut, A. (2006) FigTree, version 1.0. http://beast.bio.ed.ac.uk/FigTree.
Ramey, R.R., Liu, H.P., Epps, C.W., Carpenter, L.M., and Weshausen, J.D. (2005)
Genetic relatedness of the Preble’s meadow jumping mouse (Zapus hudsonius

72
BIBLIOGRAPHY
preblei) to nearby subspecies of Z. hudsonius as inferred from variation in cranial
morphology, mitochondrial DNA and microsatellite DNA: implications for taxonomy
and conservation. Animal Conservation, 8, 329-346.
Rice, W.R. (1989) Analyzing tables of statistical tests. Evolution, 43, 223-225.
Riddle, B.R., Hafner, D.J., Alexander, L.F. and Jaeger, J.R. (2000) Cryptic vicariance in
the historical assembly of a Baja California Peninsula Desert biota. Proceedings of
the National Academy of Sciences of the United States of America, 97, 14438-
14443.
Roberts, D.G., Baker, J. and Perrin, C. (2011) Population genetic structure of the
endangered Eastern Bristlebird, Dasyornis brachypterus; implications for
conservation. Conservation Genetics, 12, 1075-1085.
Rogers, D.S., Leite, R.N. and Reed, R.J. (2011) Molecular phylogenetics of an
endangered species: the Tamaulipan woodrat (Neotama angustapalata).
Conservation Genetics, 12, 1035-1048.
Rowston, C., Catterall, C.P. and Hurst, C. (2002) Habitat preferences of squirrel gliders,
Petaurus norfolcensis, in the fragmented landscape of southeast Queensland. Forest
Ecology and Management, 164, 197-209.
Rowston, C. and Catterall, C.P. (2004) Habitat segregation, competition and selective
deforestation: effects on the conservation status of two similar Petaurus gliders.
Conservation of Australia’s Forest Fauna (ed. D. Lunney), pp. 741-747. Royal
Zoological Society of New South Wales, Sydney, NSW.
Rozen, S. and Skaletsky, H.J. (2000) Primer3 on the WWW for general users and for
biologist programmers. Bioinformatics Methods and Protocols: Methods in Molecular
Biology (eds. S. Krawetz and S. Misener), pp. 365-386. Humana Press, Totowa.
73
BIBLIOGRAPHY
Schäuble, C.S. and Moritz, C. (2001) Comparative phylogeography of two open forest
frogs from eastern Australia. Biological Journal of the Linnean Society, 74, 157-170.
Schneider, C.J. Cunningham, M. and Moritz, C. (1998) Comparative phylogeography and
the history of endemic vertebrates in the Wet Tropics rainforests of Australia.
Molecular Ecology, 7, 487-498.
Schodde, R. (2006) Australia’s bird fauna today – origins and development. Evolution and
biogeography of Australasian vertebrates (eds. J.R. Merrick, M. Archer, G. Hickey
and M. Lee), pp.413-458. AsciPub, Sydney.
Shapiro, S.S. and Wilk, M.B. (1965) An analysis of variance test for normality (complete
samples). Biometrika, 52, 591-611.
Silva-Segundo, C.A., Brito-Chavarria, M., Balart, E.F., de los A. Barriga-Sosa, I., Rojas-
Esquivel, R., Roldan, M.I., Murugan, G and Garcia-de Leon, F.J. (2011) Clarifying
the taxonomic status of Merluccius spp. In the north-eastern Pacific: a combined
morphological and molecular approach. Review in Fish Biology and Fisheries, 21,
259-282.
Slayter, C., Rosauer, D. and Lemckert, F. (2007) An assessment of endemisim and
species richness patterns in the Australian anura. Journal of Biogeography, 34, 583-
596.
Spellman, G.M., Riddle, B. and Klicka, J. (2007) Phylogeography of the mountain
chickadee (Poecile gambeli): diversification, introgression, and expansion in
response to Quaternary climate change. Molecular Ecology, 16, 1055-1068.
Spencer, P.B.S., Rhind, S.G. and Eldridge, M.D.B. (2001) Phylogeographic stricture within
Phascogale (Marsupialia: Dasyuridae) based on partial cytochrome b sequence.
Australian Journal of Zoology, 49, 369-377.

74
BIBLIOGRAPHY
Spinks, P.Q., Thomson, R.C., Zhang, Y., Che, J., Wu, Y. and Shaffer, H.B. (2012) Species
boundaries and phylogenetic relationships in the critically endangered Asian box
turtle genus Cuora. Molecular Phylogenetics and Evolution, 63, 656-667.
Stephens, M., Smith, N. and Donnelly, P. (2001) A new statistical method for haplotype
reconstruction from population data. American Journal of Human Genetics, 68, 978-
989.
Suckling, G.C. (1983a) Squirrel glider. The Complete Book of Australian Mammals (ed. R.
Strahan), pp. 140-141. Angus and Robertson Publishers, Sydney.
Suckling, G.C. (1983b) Sugar glider. The Complete Book of Australian Mammals (ed. R.
Strahan), pp. 138-139. Angus and Robertson Publishers, Sydney.
Sullivan, J., Arellano, E. and Rogers, D.S. (2000) Comparative phylogeography of
Mesoamerican highland rodents: concerted versus independent responses to past
climate fluctuations. American Naturalist, 155, 755-768.
Sumner, J., Webb, J.K., Shine, R. and Keogh, J.S. (2010) Molecular and morphological
assessment of Australia’s most endangered snake, Hoplocephalus bungaroides,
reveals two evolutionary significant units for conservation. Conservation Genetics,
11, 747-758.
Symula, R., Keogh, J.S. and Cannatella, D.C. (2008) Ancient phylogeographic divergence
in southeastern Australia among populations of the widespread common froglet,
Crinia signifera. Molecular Phylogenetics and Evolution, 47, 569-580.
Tajima, F. (1983) Evolutionary relationship of DNA sequences in finite populations.
Genetics, 105, 437-460.
Tamura, K. and Nei, M. (1993) Estimation of the number of nucleotide substitutions in the
control region of mitochondrial DNA in humans and chimpanzees. Molecular Biology
and Evolution, 10, 512-526.

75
BIBLIOGRAPHY
Taylor, G. (1994) Landscapes of Australia: their nature and evolution. History of the
Australia vegetation: Cretaceous to recent (ed. R.S. Hill), pp. 60-79. Cambridge
University Press, Cambridge.
Taylor, A.C. and Foulkes, J. (2004) Molecules and morphology: a taxonomic analysis of
the common brushtail possum Trichosurus vulpecula with an emphasis on the
central Australian form. The Biology of Australian Possums and Gliders (eds. R.L.
Goldingay and S.M. Jackson), pp. 455-470. Surrey Beatty and Sons, Sydney.
Thomas, O. (1888) Catalogue of the Marsupialia and Monotremata in the collection of the
British Museum (Natural History). British Museum (Natural History), London.
Thomas, O. (1923) On some Queensland Phalangeridae. Annals and Magazine of Natural
History Series, 9, 246-249.
Traill, B.J. (1998) Identification of squirrel gliders and sugar gliders in Victoria. The
Victorian Naturalist, 115, 135-141.
van der Ree, R. (2002) The population ecology of the squirrel glider (Petaurus
norfolcensis) within a network of remnant linear habitats. Wildlife Research, 29, 329-
340.
van der Ree, R. and Bennett, A., F. (2003) Home range of the squirrel glider (Petaurus
norfolcensis) in a network of remnant linear habitats. Journal of Zoology (London),
259, 327-336.
van der Ree, R., Bennett, A.F. and Gilmore, D.C. (2003) Gap crossing by gliding
marsupials: thresholds for use of isolated woodland patches in an agricultural
landscape. Biological Conservation, 115, 421-249.
van der Ree, R. and Suckling, G.C. (2008) The squirrel glider. The Mammals of Australia
(eds. S. Van Dyck and R. Strahan), pp. 235-236. New Holland Publishers, Sydney.

76
BIBLIOGRAPHY
Van Dyck, S. (1990) Belidius gracilis – soaring problems for an old de Vis glider. Memoirs
of the Queensland Museum, 28, 329-336.
Van Dyck, S. (1993) The taxonomy and distribution of Petaurus gracilis (Marsupialia:
Petauridae), with notes on its ecology and conservation status. Memoirs of the
Queensland Museum, 33, 77-122.
Van Dyck, S. and Strahan, R. (2008) The Mammals of Australia. New Holland Publishers,
Sydney.
Williams, M., Cook, E., van der Kaars, S., Barrows, T., Shulmeister, J. and Kershaw, P.
(2009) Glacial and deglacial climatic patterns in Australia and surrounding regions
from 35,000 to 10,000 years ago reconstructed from terrestrial and near-shore proxy
data. Quaternary Science Reviews, 28, 2398-2419.
Wilson-Wilde, L. (2010) Species identification in wildlife crime investigations using
Diprotodontia, PhD Thesis, University of Canberra, Canberra.
Winter, J.W., Dillewaard, H.A., Williams, S.E. and Bolitho, E.E. (2004) Possums and
gliders of north Queensland: distribution and conservation status. The Biology of
Australian Possums and Gliders (eds. R.L. Goldingay and S.M. Jackson), pp. 26-50.
Surrey Beatty and Sons, Sydney.
Zink, R.M. (1996) Comparative phylogeography of North American birds. Evolution, 50,
308-317.

77
APPENDICES
Appendices
Appendix I: Raw genetic data. Samples marked with * comprised the broadscale dataset, while those marked with ^ comprised the finescale dataset. B
S refers to samples associated with the Lineage B
mtDNA substructure. Source abbreviations as follows: QPWS(WT), Queensland Parks and Wildlife Services (Wet Tropics); Department of Environment and Resource Management; SJ, Steve Jackson (unpublished data); ANWC, Australian National Wildlife Collection; QM, Queensland Museum; JCU,
James Cook University; AM, Australia Museum; MV, Museum Victoria.
Sample Locality ND2 ApoB1
ID Source Lat Long Haplotype Lineage State Genotype
Mahogany Glider (92)
Tully (14); -18.22, 146.01
TU01^ QDERM -18.18 145.98 MT08 B -- -- --
TU02^ QDERM -18.18 145.99 MT08 B -- -- --
TU03^ QDERM -18.07 145.59 MT44 A -- -- --
TU04^ QDERM -18.23 146.00 MT44 A -- -- --
TU05^ QDERM -18.24 146.00 MT08 B -- -- --
TU06^ QDERM -18.23 146.00 MT44 A -- -- --
TU07^ QDERM -18.24 145.94 MT08 B -- -- --
TU08/CL02*^ QDERM -18.24 145.98 MT38 A Het 1 13
TU09^ QDERM -18.25 145.98 MT08 B -- -- --
TU10/CL03*^ QDERM -18.24 145.98 MT08 B Hom 1 1
TU11^ QDERM -18.12 145.90 MT44 A -- -- --
TU12/CL01*^ QDERM -18.12 145.90 MT37 A Hom 5 5
TU13/CL04*^ QDERM -18.09 145.85 MT08 B Hom 1 1
TU14^ QDERM -18.05 145.91 MT08 B -- -- --
Two Creeks (33); -18.44, 146.12
TC01^ QDERM -18.44 146.12 MT46 B -- -- --
TC02^ QDERM -18.44 146.12 MT44 A -- -- --
TC03^ QDERM -18.44 146.12 MT08 B -- -- --
TC04^ QDERM -18.44 146.12 MT37 A -- -- --
TC05^ QDERM -18.44 146.12 MT37 A -- -- --
TC06^ QDERM -18.44 146.12 MT08 B -- -- --
TC07^ QDERM -18.44 146.12 MT08 B -- -- --
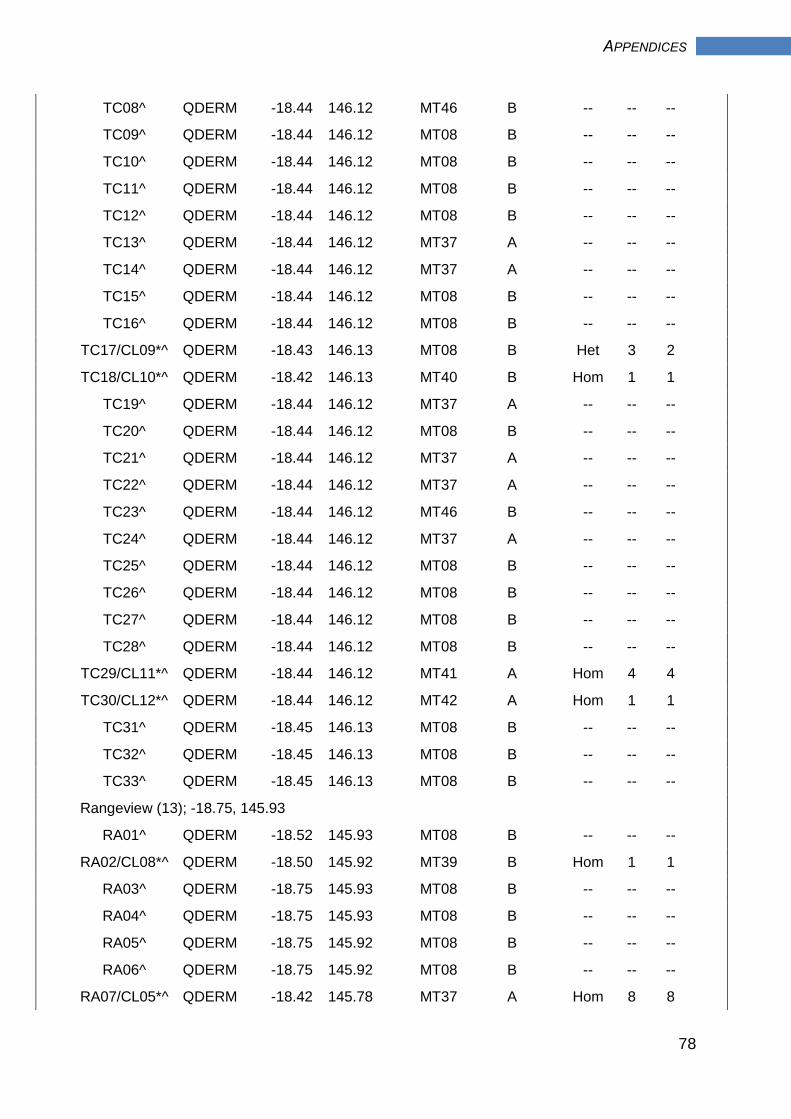
78
APPENDICES
TC08^ QDERM -18.44 146.12 MT46 B -- -- --
TC09^ QDERM -18.44 146.12 MT08 B -- -- --
TC10^ QDERM -18.44 146.12 MT08 B -- -- --
TC11^ QDERM -18.44 146.12 MT08 B -- -- --
TC12^ QDERM -18.44 146.12 MT08 B -- -- --
TC13^ QDERM -18.44 146.12 MT37 A -- -- --
TC14^ QDERM -18.44 146.12 MT37 A -- -- --
TC15^ QDERM -18.44 146.12 MT08 B -- -- --
TC16^ QDERM -18.44 146.12 MT08 B -- -- --
TC17/CL09*^ QDERM -18.43 146.13 MT08 B Het 3 2
TC18/CL10*^ QDERM -18.42 146.13 MT40 B Hom 1 1
TC19^ QDERM -18.44 146.12 MT37 A -- -- --
TC20^ QDERM -18.44 146.12 MT08 B -- -- --
TC21^ QDERM -18.44 146.12 MT37 A -- -- --
TC22^ QDERM -18.44 146.12 MT37 A -- -- --
TC23^ QDERM -18.44 146.12 MT46 B -- -- --
TC24^ QDERM -18.44 146.12 MT37 A -- -- --
TC25^ QDERM -18.44 146.12 MT08 B -- -- --
TC26^ QDERM -18.44 146.12 MT08 B -- -- --
TC27^ QDERM -18.44 146.12 MT08 B -- -- --
TC28^ QDERM -18.44 146.12 MT08 B -- -- --
TC29/CL11*^ QDERM -18.44 146.12 MT41 A Hom 4 4
TC30/CL12*^ QDERM -18.44 146.12 MT42 A Hom 1 1
TC31^ QDERM -18.45 146.13 MT08 B -- -- --
TC32^ QDERM -18.45 146.13 MT08 B -- -- --
TC33^ QDERM -18.45 146.13 MT08 B -- -- --
Rangeview (13); -18.75, 145.93
RA01^ QDERM -18.52 145.93 MT08 B -- -- --
RA02/CL08*^ QDERM -18.50 145.92 MT39 B Hom 1 1
RA03^ QDERM -18.75 145.93 MT08 B -- -- --
RA04^ QDERM -18.75 145.93 MT08 B -- -- --
RA05^ QDERM -18.75 145.92 MT08 B -- -- --
RA06^ QDERM -18.75 145.92 MT08 B -- -- --
RA07/CL05*^ QDERM -18.42 145.78 MT37 A Hom 8 8

79
APPENDICES
RA08^ QDERM -18.65 146.03 MT08 B -- -- --
RA09/CL06*^ QDERM -18.65 146.02 MT08 B Hom 1 1
RA10^ QDERM -18.65 146.01 MT37 A -- -- --
RA11^ QDERM -18.65 146.01 MT37 A -- -- --
RA12CL07*^ QDERM -18.65 146.02 MT13 A Hom 4 4
RA13^ QDERM -18.65 146.02 MT08 B -- -- --
Bambaroo (32); -18.89, 146.23
BA01^ QDERM -18.88 146.22 MT08 B -- -- --
BA02^ QDERM -18.88 146.22 MT08 B -- -- --
BA03^ QDERM -18.88 146.22 MT08 B -- -- --
BA04/CL14*^ QDERM -18.88 146.22 MT43 B Hom 5 5
BA05^ QDERM -18.88 146.22 MT13 A -- -- --
BA06^ QDERM -18.87 146.19 MT37 A -- -- --
BA07^ QDERM -18.87 146.19 MT08 B -- -- --
BA08^ QDERM -18.86 146.17 MT08 B -- -- --
BA09^ QDERM -18.87 146.19 MT08 B -- -- --
BA10^ QDERM -18.87 146.19 MT08 B -- -- --
BA11^ QDERM -18.87 146.19 MT08 B -- -- --
BA12/CL16*^ QDERM -18.87 146.19 MT44 B Hom 1 1
BA13^ QDERM -18.87 146.19 MT37 A -- -- --
BA14^ QDERM -18.92 146.27 MT08 B -- -- --
BA15^ QDERM -18.93 146.27 MT08 B -- -- --
BA16^ QDERM -18.93 146.27 MT08 B -- -- --
BA17^ QDERM -18.99 146.33 MT08 B -- -- --
BA18^ QDERM -18.88 146.22 MT08 B -- -- --
BA19^ QDERM -18.88 146.22 MT08 B -- -- --
BA20^ QDERM -18.88 146.22 MT08 B -- -- --
BA21^ QDERM -18.88 146.22 MT08 B -- -- --
BA22/CL13*^ QDERM -18.88 146.22 MT08 B Hom 1 1
BA23^ QDERM -18.88 146.22 MT08 B -- -- --
BA24^ QDERM -18.88 146.22 MT08 B -- -- --
BA25^ QDERM -18.88 146.22 MT08 B -- -- --
BA26^ QDERM -18.89 146.23 MT39 B -- -- --
BA27^ QDERM -18.85 146.12 MT08 B -- -- --

80
APPENDICES
BA28^ QDERM -18.86 146.12 MT08 B -- -- --
BA29^ QDERM -18.86 146.12 MT08 B -- -- --
BA30^ QDERM -18.86 146.13 MT44 A -- -- --
BA31^ QDERM -18.85 146.13 MT08 B -- -- --
BA32/CL15*^ QDERM -18.86 146.13 MT08 A Hom 1 1
Squirrel Glider (67)
Einasleigh Uplands (8); -17.26, 144.56
EU01*^ QM -16.53 143.68 MT01 A Hom 1 1
EU02*^ ANWC -17.56 145.45 MT02 A Hom 1 1
EU03*^ QDERM -17.62 145.51 MT03 A -- -- --
EU04*^ QDERM -18.19 145.26 MT04 A Hom 1 1
EU05*^ QDERM -18.19 145.26 MT02 A Hom 1 1
EU06*^ QDERM -18.19 145.26 MT05 A Hom 4 4
EU07*^ QDERM -18.19 145.26 MT06 A Het 4 2
EU08*^ QDERM -18.19 145.26 MT04 A Hom 4 4
Hervey Range (17); -19.21, 146.20
HR01*^ JCU -19.36 146.33 MT07 B Hom 1 1
HR02*^ JCU -19.36 146.33 MT08 B Hom 1 1
HR03*^ JCU -19.36 146.33 MT09 A Het 4 6
HR04*^ JCU -19.36 146.33 MT05 A Hom 1 1
HR05*^ JCU -19.36 146.33 MT10 A Het 1 9
HR06*^ JCU -19.36 146.33 MT11 B Het 1 9
HR07*^ JCU -19.36 146.33 MT12 B Het 4 7
HR08*^ JCU -19.36 146.33 MT13 A Het 1 12
HR09^ JCU -19.36 146.33 MT45 A -- -- --
HR10^ JCU -19.36 146.33 MT07 B -- -- --
HR11^ JCU -19.36 146.33 MT07 B -- -- --
HR12^ JCU -19.36 146.33 MT07 B -- -- --
HR13^ JCU -19.36 146.33 MT07 B -- -- --
HR14^ JCU -19.36 146.33 MT13 A -- -- --
HR15^ JCU -19.36 146.33 MT47 B -- -- --
HR16^ JCU -19.36 146.33 MT08 B -- -- --

81
APPENDICES
HR17^ QDERM -19.26 146.67 MT45 A -- -- --
Mid-eastern Queensland (20); -21.46, 149.10
MEQ01*^ QDERM -21.08 149.04 MT14 B Hom 1 1
MEQ02*^ QDERM -21.03 149.01 MT15 B Het 4 3
MEQ03*^ QDERM -21.13 148.54 MT16 B Het 4 6
MEQ04*^ QDERM -21.34 149.18 MT17 B Hom 2 2
MEQ05*^ QDERM -21.08 149.11 MT18 B Het 3 6
MEQ06*^ QDERM -21.03 149.13 MT19 B Het 11 7
MEQ07*^ QDERM -21.13 148.54 MT20 B Het 3 2
MEQ08*^ QDERM -21.34 149.18 MT21 B Het 6 2
MEQ09^ QDERM -21.34 149.18 MT20 B -- -- --
MEQ10^ QDERM -22.15 148.57 MT48 B -- -- --
MEQ11^ QDERM -22.15 148.57 MT48 B -- -- --
MEQ12^ QM -23.22 150.30 MT49 B -- -- --
MEQ13^ ANWC -23.38 150.51 MT50 B -- -- --
MEQ14^ ANWC -23.38 150.51 MT18 B -- -- --
MEQ15^ QDERM -21.08 149.11 MT19 B -- -- --
MEQ16^ QDERM -22.15 148.57 MT18 B -- -- --
MEQ17^ QDERM -21.08 149.11 MT18 B -- -- --
MEQ18^ QDERM -21.43 149.19 MT51 B -- -- --
MEQ19^ QDERM -20.57 148.44 MT52 B -- -- --
MEQ20^ QDERM -23.22 150.30 MT53 B -- -- --
North-eastern New South Wales (8)
NEN01 AM -29.35 152.46 MT22 B1 Hom 2 2
NEN02 AM -29.35 152.46 MT23 B Het 3 2
NEN03 AM -29.00 153.27 MT24 B Hom 3 3
NEN04 AM -29.02 153.14 MT24 B Het 3 2
NEN05 AM -29.53 152.53 MT18 B Hom 3 3
NEN06 AM -28.50 153.03 MT25 B Het 3 2
NEN07 AM -29.21 153.17 MT26 B Het 4 7
NEN08 AM -28.56 153.28 MT27 B Hom 2 2
Central Coast New South Wales (8)
CCN01 AM -32.11 152.31 MT28 B1 Hom 2 2
CCN02 AM -32.56 151.46 MT29 B1 Het 3 2

82
APPENDICES
CCN03 AM -33.16 151.27 MT30 B1 Het 3 2
CCN04 AM -33.17 151.25 MT22 B1 Het 3 2
CCN05 AM -32.12 152.31 MT31 B1 Het 3 2
CCN06 AM -33.10 151.35 MT32 B1 Hom 3 3
CCN07 AM -32.23 151.45 MT31 B1 Het 3 2
CCN08 AM -32.57 151.41 MT33 B1 Hom 3 3
Victoria (6)
VIC01 MV -36.22 145.24 MT22 B1 Hom 2 2
VIC02 MV -37.06 142.78 MT34 B Hom 5 5
VIC03 MV -36.31 146.29 MT34 B Hom 10 10
VIC04 MV -36.45 145.34 MT22 B1 Hom 2 2
VIC05 MV -36.45 145.34 MT35 B1 -- -- --
VIC06 MV -36.45 145.34 MT36 B -- -- --

83
APPENDICES
Appendix II: Raw morphological data. Source abbreviations as follows: QPWS(WT), Queensland Parks and Wildlife Services (Wet Tropics); SJ, Steve Jackson (unpublished data); ANWC, Australian National Wildlife Collection; QM, Queensland Museum; JCU, James Cook University; AM, Australia
Museum; MV, Museum Victoria.
Sample External character
ID Source Sex WT STL SVL VTL BTR HL
(298) (312) (314) (316) (312) (189)
Mahogany Glider (107)
Tully (26)
TU01 QPWS(WT) F 335 700 340 360 0.94 54.5
TU02 QPWS(WT) F 317 650 270 380 0.71 48.8
TU04 QPWS(WT) M 300 640 260 380 0.68 .
TU07 QPWS(WT) F 333 650 245 405 0.60 .
TU09 QPWS(WT) F 350 620 310 310 1.00 63.5
TU11 QPWS(WT) F 319 610 250 360 0.69 .
TU12 QPWS(WT) F 350 630 280 350 0.80 57.0
TU14 QPWS(WT) M . . . 430 . .
TU15 QPWS(WT) F 385 575 260 315 0.83 62.7
TU16 QPWS(WT) F 210 596 235 334 0.70 53.3
TU17 QM M 350 603 249 354 0.70 .
TU18 QM F 350 510 240 270 0.89 .
TU19 QM M . 625 260 365 0.71 .
TU20 QM M . 595 255 340 0.75 .
TU21 QM F . 607 252 355 0.71 .
TU22 QM F 352 591 261 330 0.79 .
TU23 QM M 410 600 265 335 0.79 .
TU24 QM F 345 520 220 300 0.73 .
TU25 QM F 195 520 200 320 0.63 .
TU26 QM F 215 510 180 330 0.55 .
TU27 QM F 255 640 250 390 0.64 .
TU28 QM M 330 627 247 380 0.65 .
TU29 QM F 325 595 215 380 0.57 .
TU30 QPWS(WT) 340 580 260 320 0.81 .

84
APPENDICES
TU31 QM F 370 602 256 346 0.74 .
TU32 QPWS(WT) 274 510 230 280 0.82 .
Two Creeks (35)
TC01 SJ M 335 655 250 405 0.62 62.0
TC02 SJ M 355 605 245 360 0.68 58.0
TC03 SJ M 440 635 250 385 0.65 62.0
TC04 SJ M 435 635 265 370 0.72 61.0
TC05 SJ F 297 480 175 305 0.57 52.0
TC09 SJ M 368 595 245 350 0.70 56.0
TC10 SJ M 400 630 270 360 0.75 55.0
TC11 SJ M 415 650 260 390 0.67 53.0
TC12 SJ M 268 610 240 370 0.65 68.0
TC13 SJ F 335 630 240 390 0.62 57.0
TC14 SJ F 410 635 250 385 0.65 62.0
TC15 SJ F 340 620 240 380 0.63 54.0
TC16 SJ F 390 652 280 372 0.75 57.6
TC17 SJ M 395 656 275 381 0.72 55.1
TC18 SJ F 395 661 305 356 0.86 58.2
TC19 SJ M 353 635 285 350 0.81 61.1
TC20 SJ M 380 610 280 330 0.85 58.9
TC21 SJ M 391 610 250 360 0.69 56.0
TC22 SJ M 350 650 260 390 0.67 57.5
TC23 SJ F 306 580 240 340 0.71 51.6
TC24 SJ F 385 620 250 370 0.68 53.6
TC25 SJ M . 666 280 386 0.73 53.6
TC26 SJ M 200 570 215 355 0.61 48.0
TC27 SJ M 213 560 220 340 0.65 49.0
TC28 SJ M 365 610 245 365 0.67 52.0
TC29 SJ M 450 640 275 365 0.75 57.0
TC30 SJ M 372 630 265 365 0.73 55.0
TC31 SJ M 353 640 265 375 0.71 59.0
TC32 SJ F 400 660 270 390 0.69 55.0
TC33 SJ M 402 660 265 395 0.67 54.0
TC34 SJ M 265 640 255 385 0.66 51.1

85
APPENDICES
TC35 QM F 407 624 264 360 0.73 .
TC36 SJ M 389 715 340 375 0.91 59.3
TC37 SJ F 360 690 320 370 0.86 50.8
TC38 SJ F 272 595 250 345 0.72 41.0
Rangeview (10)
RA01 QPWS(WT) M 370 695 320 375 0.85 48.9
RA02 QPWS(WT) M 272 610 240 370 0.65 64.4
RA03 QPWS(WT) M 375 630 260 370 0.70 58.0
RA04 QPWS(WT) F 380 615 275 340 0.81 54.2
RA05 QPWS(WT) F 355 625 275 350 0.79 55.3
RA06 QPWS(WT) M 370 640 280 360 0.78 68.3
RA08 QPWS(WT) M 215 640 280 360 0.78 80.0
RA12 QPWS(WT) M 378 610 245 365 0.67 53.2
RA13 QPWS(WT) F 328 595 270 325 0.83 53.1
RA14 QPWS(WT) F 309 615 255 360 0.71 58.5
Bambaroo (36)
BA01 QPWS(WT) M 330 630 255 375 0.68 53.0
BA02 QPWS(WT) F 330 656 256 400 0.64 52.6
BA06 QPWS(WT) F 300 600 250 350 0.71 54.3
BA07 QPWS(WT) M 285 614 280 334 0.84 54.1
BA09 QPWS(WT) M 220 570 260 310 0.84 50.8
BA10 QPWS(WT) F 315 530 290 240 1.21 52.7
BA11 QPWS(WT) M 415 550 230 320 0.72 50.8
BA12 QPWS(WT) M 350 595 270 325 0.83 53.0
BA13 QPWS(WT) F 230 540 190 350 0.54 46.0
BA14 QPWS(WT) F 348 635 300 335 0.90 55.4
BA15 QPWS(WT) M 305 550 275 280 0.98 54.4
BA16 QPWS(WT) F 302 640 255 385 0.66 53.7
BA17 QPWS(WT) M 277 675 265 410 0.65 58.2
BA18 QPWS(WT) F 242 635 255 380 0.67 53.3
BA20 QPWS(WT) F 350 615 260 355 0.73 52.2
BA21 QPWS(WT) F 350 635 270 365 0.74 55.6
BA22 QPWS(WT) M 390 650 265 385 0.69 53.1
BA23 QPWS(WT) M 345 605 255 350 0.73 50.1

86
APPENDICES
BA24 QPWS(WT) F 350 605 245 360 0.68 53.3
BA25 QPWS(WT) M 340 620 265 355 0.75 55.3
BA27 QPWS(WT) F 333 625 280 345 0.81 67.0
BA28 QPWS(WT) M 300 625 250 375 0.67 54.2
BA29 QPWS(WT) M 220 595 260 335 0.78 47.7
BA30 QPWS(WT) F 335 565 235 330 0.71 51.3
BA31 QPWS(WT) M 360 . . 340 . 53.6
BA32 QPWS(WT) M 225 580 270 310 0.87 52.0
BA33 QPWS(WT) M 330 . 300 . . 51.0
BA34 QPWS(WT) M 305 548 265 283 0.94 48.6
BA35 QPWS(WT) M 378 643 290 353 0.82 50.9
BA36 QPWS(WT) F 332 645 265 380 0.70 54.6
BA37 QPWS(WT) F 356 652 262 390 0.67 56.9
BA38 QPWS(WT) F 310 613 268 345 0.78 60.4
BA39 QPWS(WT) M 335 634 265 369 0.72 62.5
BA40 QPWS(WT) M 420 677 263 414 0.64 66.9
BA41 QPWS(WT) F 320 655 280 375 0.75 65.3
BA42 QPWS(WT) F 233 660 285 375 0.76 58.6
Squirrel Glider (252)
Einasleigh Uplands (4)
EU04 QPWS(WT) F 325 450 210 240 0.88 45.3
EU05 QPWS(WT) M 320 560 260 300 0.87 45.6
EU06 QPWS(WT) F 325 490 170 320 0.53 48.5
EU08 QPWS(WT) F 320 515 200 315 0.63 45.3
Hervey Range (17)
HR01 JCU F 200 425 195 230 0.85 .
HR02 JCU M 270 . . . . 51.0
HR03 JCU M 300 . . . . 46.0
HR04 JCU M 275 . . . . 50.0
HR05 JCU M 255 . . . . 44.0
HR06 JCU M 205 . . . . 50.0
HR07 JCU M 235 . . . . 46.0
HR08 JCU M 215 . . . . 48.0

87
APPENDICES
HR09 JCU M 275 . . . . 46.0
HR10 JCU F 210 . . . . 44.0
HR11 JCU F 250 . . . . 44.0
HR12 JCU F 240 . . . . 45.0
HR13 JCU F 280 . . . . 49.0
HR14 JCU M 225 . . . . 46.0
HR15 JCU F 205 . . . . 50.0
HR17 QPWS(WT) 208 660 230 330 0.70 51.6
HR18 JCU F 275 . . . . 46.0
Mid-eastern Queensland (84)
MEQ02 QPWS(WT) F 200 399 184 215 0.86 49.0
MEQ03 QPWS(WT) F 232 450 190 260 0.73 46.9
MEQ04 QPWS(WT) F 192 410 165 245 0.67 50.4
MEQ05 QPWS(WT) F 234 391 161 230 0.70 49.0
MEQ06 QPWS(WT) M 224 435 175 260 0.67 53.8
MEQ07 QPWS(WT) M 250 445 180 265 0.68 48.1
MEQ08 QPWS(WT) M 250 450 170 280 0.61 43.7
MEQ09 QPWS(WT) F 240 300 150 150 1.00 48.3
MEQ10 QPWS(WT) F 235 460 180 280 0.64 41.7
MEQ11 QPWS(WT) F 242 455 220 235 0.94 46.9
MEQ15 QPWS(WT) M 196 450 185 265 0.70 47.7
MEQ16 QPWS(WT) M 228 445 205 240 0.85 47.5
MEQ17 QPWS(WT) M 230 465 205 260 0.79 48.5
MEQ19 QPWS(WT) M 218 500 235 265 0.89 55.0
MEQ21 QPWS(WT) F 221 455 175 280 0.63 45.0
MEQ22 QPWS(WT) F 169 450 185 265 0.70 47.4
MEQ23 QPWS(WT) F 216 450 200 250 0.80 49.1
MEQ24 QPWS(WT) F 199 445 185 260 0.71 52.2
MEQ25 QPWS(WT) F 201 475 195 280 0.70 49.6
MEQ26 QPWS(WT) F 240 440 175 265 0.66 49.6
MEQ27 QPWS(WT) F 252 411 170 241 0.71 50.7
MEQ28 QPWS(WT) F 218 445 225 220 1.02 44.3
MEQ29 QPWS(WT) F 193 425 165 260 0.63 54.0
MEQ30 QPWS(WT) F 210 410 190 220 0.86 46.0

88
APPENDICES
MEQ31 QPWS(WT) F 210 415 165 250 0.66 53.0
MEQ32 QPWS(WT) F 176 415 160 255 0.63 44.2
MEQ33 QPWS(WT) F 228 454 180 274 0.66 47.8
MEQ34 QPWS(WT) F 180 450 195 255 0.76 45.0
MEQ35 QPWS(WT) F 230 525 255 270 0.94 47.0
MEQ36 QPWS(WT) F 172 480 210 270 0.78 46.6
MEQ37 QPWS(WT) F 279 540 270 270 1.00 50.8
MEQ38 QPWS(WT) F 241 500 235 265 0.89 49.6
MEQ39 QPWS(WT) F 230 460 200 260 0.77 23.1
MEQ40 QPWS(WT) F 181 445 170 275 0.62 47.3
MEQ41 QPWS(WT) F 239 470 220 250 0.88 44.0
MEQ42 QPWS(WT) F 199 445 200 245 0.82 49.1
MEQ43 QPWS(WT) F 171 440 190 250 0.76 43.7
MEQ44 QPWS(WT) F 209 492 222 270 0.82 51.5
MEQ45 QPWS(WT) F 200 450 200 250 0.80 47.7
MEQ46 QPWS(WT) F 240 475 235 240 0.98 47.2
MEQ47 QPWS(WT) F 232 450 205 245 0.84 41.4
MEQ48 QPWS(WT) F 170 435 225 210 1.07 46.1
MEQ49 QPWS(WT) F 169 470 215 255 0.84 48.0
MEQ50 QPWS(WT) F 122 390 165 225 0.73 45.8
MEQ51 QPWS(WT) F 236 485 225 260 0.87 47.3
MEQ52 QPWS(WT) F 224 465 245 220 1.11 42.1
MEQ53 QPWS(WT) F 221 485 225 260 0.87 48.7
MEQ54 QPWS(WT) F 99 385 145 240 0.60 41.0
MEQ55 AM F . 460 195 265 0.74 .
MEQ56 AM F . 422 172 250 0.69 .
MEQ57 QPWS(WT) M 199 490 230 260 0.88 49.0
MEQ58 QPWS(WT) M 233 430 180 250 0.72 45.4
MEQ59 QPWS(WT) M 203 430 200 230 0.87 50.9
MEQ60 QPWS(WT) M 202 460 190 270 0.70 52.9
MEQ61 QPWS(WT) M 241 460 180 280 0.64 55.0
MEQ62 QPWS(WT) M 230 410 185 225 0.82 52.1
MEQ63 QPWS(WT) M 224 445 165 280 0.59 51.4
MEQ64 QPWS(WT) M 228 410 170 240 0.71 46.4

89
APPENDICES
MEQ65 QPWS(WT) M 166 500 240 260 0.92 45.9
MEQ66 QPWS(WT) M 243 470 260 210 1.24 49.1
MEQ67 QPWS(WT) M 230 442 192 250 0.77 51.7
MEQ68 QPWS(WT) M 178 495 230 265 0.87 48.4
MEQ69 QPWS(WT) M 273 550 255 295 0.86 47.5
MEQ70 QPWS(WT) M 249 460 220 240 0.92 48.7
MEQ71 QPWS(WT) M 259 530 280 250 1.12 57.5
MEQ72 QPWS(WT) M 221 485 230 255 0.90 50.4
MEQ73 QPWS(WT) M 211 445 215 230 0.93 47.6
MEQ74 QPWS(WT) M 202 461 250 211 1.19 46.9
MEQ75 QPWS(WT) M 169 465 220 245 0.90 48.1
MEQ76 QPWS(WT) M 262 465 195 270 0.72 46.6
MEQ77 QPWS(WT) M 232 455 215 240 0.90 44.0
MEQ78 QPWS(WT) M 244 480 245 235 1.04 51.0
MEQ79 QPWS(WT) M 244 490 235 255 0.92 47.4
MEQ80 QPWS(WT) M 146 430 185 245 0.76 47.6
MEQ81 QPWS(WT) M 230 520 260 260 1.00 44.2
MEQ82 QPWS(WT) M 242 470 220 250 0.88 46.7
MEQ83 QPWS(WT) M 204 470 225 245 0.92 51.6
MEQ84 QPWS(WT) M 230 475 230 245 0.94 45.5
MEQ85 QPWS(WT) M 128 405 180 225 0.80 42.0
MEQ86 QPWS(WT) F 202 480 240 240 1.00 44.0
MEQ87 QPWS(WT) M 228 460 200 260 0.77 52.0
MEQ88 QPWS(WT) M 241 495 250 245 1.02 45.8
MEQ89 QPWS(WT) M 221 427 172 255 0.67 48.2
MEQ90 QPWS(WT) M 90 268 135 133 1.02 41.7
South-eastern Queensland (30)
SEQ01 QM F 132 424 183 241 0.76 .
SEQ02 QM F 111 390 165 225 0.73 .
SEQ03 QM M 174 457 227 230 0.99 .
SEQ04 QM F 148 420 190 230 0.83 .
SEQ05 QM F 111 . . . . .
SEQ06 QM M . 480 210 270 0.78 .
SEQ07 QM F 160 390 190 200 0.95 .

90
APPENDICES
SEQ08 QM F 111 380 185 195 0.95 .
SEQ09 QM F . 415 175 240 0.73 .
SEQ10 QM F . 495 210 285 0.74 .
SEQ11 QM F 211 430 225 205 1.10 .
SEQ12 QM F 177 422 199 223 0.89 .
SEQ13 QM M 150 415 185 230 0.80 .
SEQ14 QM M . 420 200 220 0.91 .
SEQ15 QM F 160 . . . . .
SEQ16 QM M 160 430 190 240 0.79 .
SEQ17 QM F 220 450 220 230 0.96 .
SEQ18 QM F 147 . . . . .
SEQ19 QM F 180 440 200 240 0.83 .
SEQ20 QM M 301 455 212 243 0.87 .
SEQ21 QM M 242 452 212 240 0.88 .
SEQ22 QM F 138 430 195 235 0.83 .
SEQ23 QM F 160 410 190 220 0.86 .
SEQ24 QM F 168 450 200 250 0.80 .
SEQ25 QM M 180 . . . . .
SEQ26 QM F 162 . . . . .
SEQ27 QM F 144 . . . . .
SEQ28 QM M 203 489 217 272 0.80 .
SEQ29 QM F 175 451 202 249 0.81 .
SEQ30 QM F 182 447 205 242 0.85 .
North-eastern New South Wales (73)
NEN01 QM F 140 416 182 234 0.78 .
NEN02 AM F 173 422 214 208 1.03 .
NEN03 AM F 228 447 200 247 0.81 .
NEN04 AM M 294 499 244 255 0.96 .
NEN05 AM F 220 455 207 248 0.83 .
NEN06 AM F 188 420 193 227 0.85 .
NEN07 AM F 230 460 205 255 0.80 .
NEN08 AM F 200 440 195 245 0.80 .
NEN09 AM F 246 450 200 250 0.80 .
NEN10 AM F . 440 185 255 0.73 .

91
APPENDICES
NEN11 AM F 131 351 160 191 0.84 .
NEN12 AM M 215 450 205 245 0.84 .
NEN13 AM M 215 436 205 231 0.89 .
NEN14 AM F 200 424 186 238 0.78 .
NEN15 AM F 174 425 195 230 0.85 .
NEN16 AM M 172 432 177 255 0.69 .
NEN17 AM F 173 434 190 244 0.78 .
NEN18 AM F 228 495 220 275 0.80 .
NEN19 AM M . 480 190 290 0.66 .
NEN20 AM F . 455 200 255 0.78 .
NEN21 AM F 116 407 168 239 0.70 .
NEN22 AM F 209 420 190 230 0.83 .
NEN23 AM F 184 357 177 181 0.98 .
NEN24 AM F 179 399 173 226 0.76 .
NEN25 AM F 194 418 185 233 0.79 .
NEN26 AM F . 442 205 238 0.86 .
NEN27 AM F 200 417 187 230 0.82 .
NEN28 AM M 155 364 166 197 0.84 .
NEN29 AM F 191 . . 228 . .
NEN30 AM M 225 373 174 199 0.87 .
NEN31 AM F 175 428 185 243 0.76 .
NEN32 AM F 188 444 205 239 0.86 .
NEN33 AM F 126 357 145 212 0.68 .
NEN34 AM F 164 230 180 230 0.78 .
NEN35 AM M 183 215 200 215 0.93 .
NEN36 AM F . 438 208 230 0.90 .
NEN37 AM M 202 455 215 240 0.90 .
NEN38 AM M 193 440 200 240 0.83 .
NEN39 AM M 206 435 207 228 0.91 .
NEN40 AM F 167 . . . . .
NEN41 AM F 185 266 215 266 0.81 .
NEN42 AM M 189 435 210 225 0.93 .
NEN43 AM M 142 212 201 212 0.95 .
NEN44 AM F 159 . 188 . . .

92
APPENDICES
NEN45 AM F 121 400 180 220 0.82 .
NEN46 AM F . 443 200 243 0.82 .
NEN47 AM F 177 450 210 240 0.88 .
NEN48 AM F 149 220 175 220 0.80 .
NEN49 AM F 172 240 194 240 0.81 .
NEN50 AM M 140 417 177 240 0.74 .
NEN51 AM F 161 425 190 235 0.81 .
NEN52 AM M 199 431 212 219 0.97 .
NEN53 AM F 197 480 220 260 0.85 .
NEN54 AM F 182 436 204 232 0.88 .
NEN55 AM M 191 473 208 265 0.78 .
NEN56 AM F 148 405 185 220 0.84 .
NEN57 AM M 222 439 198 241 0.82 .
NEN58 AM F 206 460 195 265 0.74 .
NEN59 AM F 229 502 220 282 0.78 .
NEN60 AM M 226 455 220 235 0.94 .
NEN61 AM M 168 367 162 205 0.79 .
NEN62 AM F 163 403 180 223 0.81 .
NEN63 AM M 228 425 205 220 0.93 .
NEN64 AM M 177 405 175 230 0.76 .
NEN65 AM F 139 395 175 220 0.80 .
NEN66 AM F 185 420 190 230 0.83 .
NEN67 AM F . 448 180 268 0.67 .
NEN68 AM F . 456 199 257 0.77 .
NEN69 AM M . 450 210 240 0.88 .
NEN70 AM F . 462 212 250 0.85 .
NEN71 AM F 181 487 230 257 0.89 .
NEN72 AM F . 325 136 189 0.72 .
NEN73 AM F 204 360 210 150 1.40 .
South-eastern Australia (26)
SEA01 AM M 130 419 179 240 0.75 .
SEA02 AM F . 500 220 280 0.79 .
SEA03 MV F . 420 200 220 0.91 .
SEA04 MV F . 350 147 203 0.72 .

93
APPENDICES
SEA05 MV F . 350 147 203 0.72 .
SEA06 MV F . 350 148 202 0.73 .
SEA07 MV F . 460 210 250 0.84 .
SEA08 MV F . 485 228 257 0.89 .
SEA09 MV F . . . 275 . .
SEA10 MV F . 467 202 265 0.76 .
SEA11 MV F 177 522 232 290 0.80 .
SEA12 MV M . 448 226 222 1.02 .
SEA13 MV M . 460 218 242 0.90 .
SEA14 MV M 270 460 213 247 0.86 .
SEA15 MV M . 540 270 270 1.00 .
SEA16 MV M . 522 245 277 0.88 .
SEA17 MV F . 504 206 298 0.69 .
SEA18 MV M . 520 200 320 0.63 .
SEA19 MV F . 500 220 280 0.79 .
SEA20 MV M . . . . . .
SEA21 MV F . 490 220 270 0.81 .
SEA22 MV M . 470 215 255 0.84 .
SEA23 MV F . 435 212 223 0.95 .
SEA24 MV F 251 525 225 300 0.75 .
SEA25 MV M . 470 230 240 0.96 48.0
SEA26 MV F 198 508 204 304 0.67 .