a pooled testing strategy for identifying sars-cov-2 at
TRANSCRIPT

A pooled testing strategy for identifying SARS-CoV-2 at low prevalence
Leon Mutesa, Pacifique Ndishimye, Yvan Butera, Jacob Souopgui, Annette Uwineza, Robert Rutayisire, Ella Larissa Ndoricimpaye, Emile Musoni, Nadine Rujeni, Thierry Nyatanyi, Edouard Ntagwabira, Muhammed Semakula, Clarisse Musanabaganwa, Daniel Nyamwasa, Maurice Ndashimye, Eva Ujeneza, Ivan Emile Mwikarago, Claude Mambo Muvunyi, Jean Baptiste Mazarati, Sabin Nsanzimana, Neil Turok & Wilfred Ndifon
This is a PDF file of a peer-reviewed paper that has been accepted for publication. Although unedited, the content has been subjected to preliminary formatting. Nature is providing this early version of the typeset paper as a service to our authors and readers. The text and figures will undergo copyediting and a proof review before the paper is published in its final form. Please note that during the production process errors may be discovered which could affect the content, and all legal disclaimers apply.
Received: 13 May 2020
Accepted: 12 October 2020
Accelerated Article Preview Published online 21 October 2020
Cite this article as: Mutesa, L. et al. A pooled testing strategy for identifying SARS-CoV-2 at low prevalence. Nature https://doi.org/10.1038/s41586-020-2885-5 (2020).
https://doi.org/10.1038/s41586-020-2885-5
Nature | www.nature.com
Accelerated Article Preview
ACCELERATED
ARTICLE
PREVIEW
Nature | www.nature.com | 1
Article
A pooled testing strategy for identifying SARS-CoV-2 at low prevalence
Leon Mutesa1,2, Pacifique Ndishimye2,3, Yvan Butera2, Jacob Souopgui1,2,4, Annette Uwineza2, Robert Rutayisire2, Ella Larissa Ndoricimpaye2, Emile Musoni2, Nadine Rujeni2, Thierry Nyatanyi2, Edouard Ntagwabira2, Muhammed Semakula2, Clarisse Musanabaganwa2, Daniel Nyamwasa2, Maurice Ndashimye2,3, Eva Ujeneza3, Ivan Emile Mwikarago2, Claude Mambo Muvunyi2, Jean Baptiste Mazarati2, Sabin Nsanzimana2, Neil Turok3,5,6 ✉ & Wilfred Ndifon3 ✉
Suppressing SARS-CoV-2 will likely require the rapid identification and isolation of infected individuals on an ongoing basis. Reverse transcription polymerase chain reaction (RT-PCR) tests are accurate but costly, making regular testing of every individual expensive. The costs are a challenge for all countries and particularly for developing countries. Cost reductions can be achieved by pooling (or combining) subsamples and testing them in groups1–7. A balance must be struck between increasing the group size and retaining test sensitivity, since sample dilution increases the likelihood of false negatives for individuals with low viral load in the sampled region at the time of the test8. Likewise, minimising the number of tests to reduce costs must be balanced against minimising the time testing takes to reduce the spread of infection. Here we propose an algorithm for pooling subsamples based on the geometry of a hypercube that, at low prevalence, accurately identifies infected individuals in a small number of tests and rounds of testing. We discuss the optimal group size and explain why, given the highly infectious nature of the disease, largely parallel searches are preferred. We report proof of concept experiments in which a positive subsample was detected even when diluted 100-fold with negative subsamples (cf. 30-fold to 48-fold dilution in Refs. 9–11). We quantify the loss of sensitivity due to dilution and discuss how it may be mitigated by frequent re-testing of groups, for example. With the use of these methods, the cost of mass testing could be reduced by a large factor which, furthermore, increases as the prevalence falls. Field trials of our approach are under way in Rwanda and South Africa. The use of group testing on a massive scale to closely and continually monitor infection in a population, along with rapid and effective isolation of infected people, provides a promising pathway to the longterm control of COVID-19.
I. IntroductionCOVID-19 represents a major threat to global health. Rapidly identifying and isolating infected individuals is one of the most important avail-able strategies for containing the virus. However, each diagnostic test for the SARS-CoV-2 virus costs 30–50 US dollars12. Therefore, testing every individual regularly, as may be required to eliminate the virus, is expensive. The costs are unaffordable for most low-income countries, which have limited available resources for massive SARS-CoV-2 testing. It is therefore important to ask: are there more efficient ways to find infected people?
The first step in testing, swab collection, is labour intensive but does not require expensive chemicals or equipment. It may therefore
be feasible to collect swabs regularly from everyone. The next step involves RT-PCR machines13. These require expensive chemical rea-gents, currently in short supply, as well as skilled personnel. Reducing the cost requires that we minimise the total number of tests. The speed of testing is also a key concern because SARS-CoV-2 is so infectious. Each RT-PCR test takes several hours in the lab, time during which the virus can spread14.
To find infected individuals, the naive approach is to test everyone, i.e., to perform one test per person. However, at low prevalence it is far more efficient to pool (or combine) samples and test them together. This idea of group testing was proposed by Dorfman in 19431. At low viral prevalence p, Dorfman’s algorithm reduces the number of tests per person, required to find all infected individuals, to p≈2
https://doi.org/10.1038/s41586-020-2885-5
Received: 13 May 2020
Accepted: 12 October 2020
Published online: 21 October 2020
1Centre for Human Genetics, College of Medicine and Health Sciences, University of Rwanda, Kigali, Rwanda. 2Rwanda Joint Task Force COVID-19, Rwanda Biomedical Centre, Ministry of Health, Kigali, Rwanda. 3African Institute for Mathematical Sciences, Kigali, Rwanda. 4Department of Molecular Biology, Institute of Biology and Molecular Medicine, IBMM, Université Libre de Bruxelles, Gosselies, Belgium. 5James Clerk Maxwell Building, University of Edinburgh, Edinburgh, EH9 3FD, Scotland, UK. 6Perimeter Institute for Theoretical Physics, Waterloo, Ontario, N2L 2Y5, Canada. ✉e-mail: [email protected]; [email protected]
ACCELERATED
ARTICLE
PREVIEW

2 | Nature | www.nature.com
Article(see Appendix A). The algorithm we present is more efficient, requiring only ≈ep ln(1/p) tests per person at low p, where e = 2.718… is Euler’s number. As an example, a survey of private residential households in England and Wales, released on 4 September, 2020 by the Office of National Statistics, estimated a prevalence of p = 0.05%(−.01% +.02% at 95%Cl)15–17. For p = 0.05%, Dorfman’s algorithm offers a 22-fold cost reduction while ours offers a 100-fold cost reduction. The main obsta-cle to achieving these large cost savings is the number of samples which can be pooled without compromising detection. In this paper, we pre-sent proof of concept experiments demonstrating that one positive sample in a pool of a hundred can still be reliably detected. We also discuss routes to increasing the pool size, as will be needed to gain the full benefits of group testing at low prevalence. If larger pool sizes and the associated cost reductions can be achieved, group testing may pro-vide an affordable pathway to the longterm control of SARS-CoV-2.
In this paper, our focus is on population screening and not on proto-cols for use with at risk groups or in clinical settings. The prevalence is typically much higher among at risk groups or among individuals who present themselves for testing. For example, in the week ending 2nd September, 2020, 0.6% of the tests performed in hospitals in England were positive18, suggesting a prevalence an order of magnitude greater than that in the wider population, quoted above. Second, in clinical settings the overriding concern should be to test the individual patient as quickly and accurately as possible. In most situations, that means performing an individual test. We are not suggesting group testing as a strategy for testing patients in clinics, specially those presenting with symptoms.
With this caveat, there are many potential applications. Sports teams where players and staff must be tested regularly are an example. A prominent rugby team in South Africa is trialling our method. Early results indicate cost savings of over an order of magnitude, with the successful detection of positives in groups of 81. Care homes provide a similar application. Pre-flight group tests can be used to clear pas-sengers for commercial flights. Rwanda has adopted group testing as a national strategy. All air passengers are now required to undergo a test locally which has helped to revive tourism in the country. Group tests in University halls of residence, labs or departments could likewise enable safer in-person interaction. There is exciting potential for combining group testing with cheaper multiplex RT-PCR tests (see, e.g.,19) for the purposes of population screening. The combination may yield cost reductions of over two orders of magnitude.
Group testing algorithms generally require more than one round of testing. In Dorfman’s algorithm, a first round of group tests is fol-lowed by a second round in which each member of every positive group is tested. Our algorithm involves a similar first round of group tests, though with a larger group size. Positive groups proceed to a second round of “slice tests,” which usually suffices to identify all infected individuals without any need for individual tests. Occasionally one and, very rarely, more than one additional round of slice tests may be required. We compare our approach with other approaches in some detail (see Supplementary Information). There are adaptive algorithms requiring fewer tests but more rounds of testing, during which the viral prevalence can grow. We argue below that such searches are dis-favoured at low prevalence. There are also non-adaptive algorithms requiring only one round of testing4–7,11. While superficially attractive, they have some disadvantages compared to ours, for example a higher failure rate (see Supplementary Information, sections III and IX). In our approach, the first round of tests, performed on the groups, provides a valuable “sanity check” on the viral prevalence in the population being tested before the second round of more numerous “slice tests.” More generally, group tests will provide a highly efficient means of tracking the viral prevalence in a number of different populations in real time (see Supplementary Information, section VIII).
Group testing is most obviously effective when there are no infected individuals in the group: just one test suffices to show that no-one is
infected. Our algorithm takes full advantage of this powerful result. In the first round of tests, subsamples from all group members are pooled and tested together. For our algorithm, the optimal group size is N ≈ 0.35/p. The expected number of infected individuals in a group is 0.35 and a group will test negative over 70% of the time. Groups that test positive are passed on to the first round of slice tests, which we now describe.
II. When one member of a group is infectedConsider the case where only one member of the group is infected. The idea behind our algorithm is geometrical: the group of individuals to be tested is represented by a set of N points on a cubic lattice in D dimensions, organised in the form of a hypercube with L points on a side (see Figure 1), so that
L N= . (1)D
Instead of directly testing the samples taken from every individual, we first divide each of them into D equal subsamples. These DN sub-samples are recombined as follows. Slice the hypercube into L planar slices, perpendicular to one of the principal directions on the lattice. Form such a set of slices in each of the D principal directions and pool the LD−1 subsamples corresponding to each slice. Altogether, DL slices, each slice combining N/L = LD−1 subsamples, are tested in parallel, in each round of slice tests. If there is one infected individual, then one slice out of the L slices, in each of the D directions, will yield a positive result. That slice indicates the coordinate of the infected individual, in the corresponding principal direction.
Therefore the number of tests required to uniquely identify the infected individual is
DL DN= , (2)D1/
where we used (1). Treating D as a continuous variable, the right hand side of (2) diverges at both small and large D, possessing a minimum at
D N= ln , (3)
corresponding to L = e and a total of elnN trials. In reality, D and L must be integers, but using L = 3 achieves almost the same efficiency (in the total number of trials, e is replaced with 3/ln3 ≈ 2.73, less than half a per cent larger, whereas using L = 2 or 4 gives 2/ln2 = 4/ln4 ≈ 2.89, more than 5 per cent larger). With no further constraint, finding one infected person in a population of a million, using L = 3, requires only 39 tests, performed in one round of testing. (To see this, note that 313 > 106, so a hypercube of side L = 3 in dimension D = 13 contains over a million points. A round of slice tests on this hypercube consists of DL = 13 × 3 = 39 slice tests.)
III. Proof of conceptIn real time PCR tests, the target RNA molecules are reverse transcribed into DNA which is replicated exponentially until it can be detected through flourescence. In a perfectly efficient test, the number of DNA molecules doubles in every PCR cycle. The test is extremely sensitive: fewer than 10 molecules of viral RNA are sufficient13. A nasopharyngeal swab taken in the first 5 days of symptoms yields, on average, ~2 × 10⁵ viral RNA molecules per mL20. Asymptomatic patients appear to exhibit similar viral loads21. In the normal testing protocol, just 5 μL of the solu-tion, containing around 1000 RNA molecules, is included in the mix fed into the PCR machine. Samples taken earlier or later, or in younger patients whose antibodies have suppressed the virus, have less virus present. In practice, this is expected to be the most significant cause of testing error, taking the form of false negatives17,22,23. In pooled testing,
ACCELERATED
ARTICLE
PREVIEW
ACCELERATED
ARTICLE
PREVIEW

Nature | www.nature.com | 3
positive subsamples are diluted with negative subsamples. Dilution by 100-fold, for example, means that only around 10 RNA molecules are likely to be present in the RT-PCR test. In principle, this should still be sufficient to yield a positive result.
As a proof of concept, using oropharyngeal swab specimens col-lected during COVID-19 surveillance in Rwanda, we investigated whether known positive specimens still test positive after they are diluted 20-, 50-, or 100-fold through pooling with negative speci-mens (see Methods). We used a RT-PCR test targetting the N and Orf1ab genes of SARS-CoV-2, a combination used routinely for diagnostic screening for COVID-19 in Rwanda. The standard proto-col is to consider a test positive if PCR amplification produces an above-background fluorescence signal for both target genes at a PCR cycle number, i.e., a Ct value, ≤ 40. Our key finding is that typical positive specimens can still be detected even after dilution by up to a 100-fold (see Figure 2). (For experiments demonstrating detec-tion after 30-, 32-fold and 48-dilution, see Refs. 9–11). As a consistency check, we determined the change in the Ct value (ΔCt) in going from a 50- to a 100-fold dilution. As noted above, a positive sample diluted 100-fold in principle requires one more cycle of PCR amplification than when diluted 50-fold, to achieve the same flourescence signal, implying ΔCt ≈ 1.0. Consistent with this expectation, we find ΔCt ≈ 1.0 ± 0.15 (1σ error) for the N gene and ΔCt ≈ 1.1 ± 0.14 for the Orf1ab gene. The changes in Ct values for other dilutions are also consistent with this interpretation.
We estimated post-dilution sensitivities by combining (technically, convolving) the probability distribution for pre-dilution Ct values for positive samples (see Extended Data Table 3) with the probability dis-tribution for the increase ΔCt as inferred above. Treating both distri-butions as Gaussian, the distribution of post-dilution Ct values is also Gaussian, with mean given by the sum of the means and variance given by the sum of the variances. In this way, we estimated that a 40-cycle PCR test targeting the N-gene (resp. Orf1ab gene) has post 20-, 50-, and 100-fold dilution sensitivities of 91% (resp. 85%), 88% (resp. 81%), and 85% (resp. 77%), respectively. We have confirmed these estimates using two additional data sets: (i) an independent sample of Ct values for 107 positive specimens collected in Rwanda, in tests targetting the same two genes, and (ii) the published data set of 26 positive specimens identified in a recent study of pooled testing for SARS-CoV-2 in Israel10, targetting a single gene (the E gene). All three data sets gave broadly consistent results.
The positive samples most likely to be missed due to dilution are those with the highest Ct values before dilution, i.e., those with the lowest viral load. The individuals concerned are likely to be the least infectious24,25. Conversely the individuals producing samples with the lowest Ct values, least affected by sample dilution, whether symp-tomatic or asymptomatic, are the most important to detect since they are likely to be the most infectious. Nevertheless, it is impor-tant to consider ways in which the loss in sensitivity due to dilution might be mitigated. The most obvious is to re-test sufficiently often (say, every 3 days) to ensure a test occurs in the period of highest viral abundance, for any infected individual. Group tests involve the greatest degree of dilution in our method, but they are also the cheapest testing stage to repeat frequently and thereby to mitigate sensitivity loss. Second, the number of PCR cycles could be raised to 44, the maximum used in Ref. 10. According to our analysis, this would raise the sensitivity after 100-fold dilution to 95% (resp. 90%) for the N (resp. Orf1ab) genes. Third, the volume of the sample used in the RT-PCR test can be increased from 5 μL to 10 μL, reducing the Ct value by one (this is done in the lab we are working with in South Africa). Fourth, the viral concentration in the pooled sample might be raised by physical or chemical means such as ultra-centrifugation or precipitation. Finally, PCR machines might be re-engineered to allow larger sample volumes to be tested. All of these possibilities are worth exploring.
IV. When more than one member of a group is infectedSo far, we have assumed only one member of the group is infected. But what if 2, 3 or more members are infected? In normal circumstances, all we will have is an estimate of the prevalence p of the virus in the population from which the group has been drawn, i.e., the probability that a person chosen at random is infected. A feature of group testing is that the first round of group tests, relatively few in number, allows us to conveniently update our knowledge of p, before any infected individu-als have been identified (see Supplementary Information, section VIII).
Given p, the probability that k members of a group of size N are infected is described by a Poisson distribution with mean λ = pN. For λ well below unity, the probability falls rapidly with increasing k. At very low p, the optimal N is very large, so D = logL N ≫ 1. The advantages of the hypercube algorithm are particularly clear in this limit. Therefore, we describe this limit first before discussing realistic values of D.
The first round of slice tests, as described in Section 2, yield, for L = 3, a set of triples of zeros and ones, i.e., {1, 0, 0}, {1, 1, 0} or {1, 1, 1} and permutations thereof, for every principal direction of the lattice. Let σ be the sum of the three values (so σ = 1, 2 or 3) and dσ the number of directions in which the value σ occurs, so d1 + d2 + d3 = D. For D ≫ 1, the number of infected individuals k may be accurately inferred from the observed values of dσ, even before any infected individuals are identi-fied. Knowing k, we then find all infected individuals as follows: (i) if k = 1, then d1 = D. Each positive slice indicates the coordinate of the infected individual in that direction. Hence, the infected individual is identified in one round of slice tests; (ii) if k = 2, d2 > 0 but d3 = 0. If d2 = 1, the two infected individuals are immediately identified. If d2 > 1, choose one of the directions with σ = 2, and treat the two positive slices as smaller hypercubes, each containing one infected individual. A further round of slice tests identifies one and the other is found by elimination; (iii) if k = 3 then, at large D, at least one direction has σ = 3. Choose one such direction and treat two of the positive slices as smaller hypercubes, each containing one infected individual. A slice test on each identifies two infected individuals and the third is found by elimination; if k > 3, the number of rounds of slice tests required to identify all infected individuals is slightly larger than k. However, for the optimal value of group size, the probability to have k > 3 infected members is negligibly small.
Hence, in the large D limit, to a good approximation k rounds of slice tests are required to identify k infected individuals. In the Supplemen-tary Information, we show that, at low prevalence p, assuming Poisson statistics, the expected number of tests per person ⟨T⟩/N required to identify all infected individuals is minimised for N ≈ 0.350/p. At this optimal group size, ⟨T⟩/N ≈ ep ln(0.734/p), shown as the dashed grey line in Figure 3. The reciprocal of this number is the efficiency gain relative to naive testing.
For practical applications, we are interested in the efficiency of the algorithm at modest values of D such as 3, 4 or 5. This requires a more intricate analysis, the details of which we relegate to the Supplemen-tary Information. However, some simple and general statements may be made. First, when all directions yield σ = 1, only one individual is infected and they are immediately and uniquely identified. This is the most probable outcome of the first round of slice tests. Second, when σ > 1 in only one direction then two (or three) infected individuals are uniquely identified without further tests. If σ > 1 in more than one direc-tion, a second round of slice tests is needed. We can eliminate any slice which tested negative in the first round and thus work with a smaller hypercube. We make only one approximation, namely we assume the infected samples are rare in the hypercube. They may then be treated as independent, randomly chosen points. Within this approximation, we compute the probabilities through to the second round of slice tests. Strikingly, we find that the hypercube algorithm remains highly efficient at modest values of D. For example, for λ = 0.35 and D = 4, in 93.3% of cases one round of slice tests suffices to identify all infected
ACCELERATED
ARTICLE
PREVIEW
ACCELERATED
ARTICLE
PREVIEW
individuals. For the remaining 6.7% of cases, one more round suffices in all but 0.01% of cases, a very low theoretical failure rate (which does not include experimental errors). The expected total number of tests per person, for D = 3, 4 and 5, are plotted in Figure 3. Where 0.35/p is an exact power of 3, as at the left end of each coloured curve, optimal performance is attained. As p is increased, an increasing fraction of sites in the 3D hypercube are left empty until the next exact power is reached. Nevertheless, pooling still results in a high efficiency gain. As Figure 3 shows, the large D approximation provides a surprisingly good (and very convenient) fit to the low D results. (See Supplementary Information, sections IV–VII for further details).
V. Largely parallel searches are preferredSome search methods require fewer tests but more rounds of testing. A binary search2,3, for example, finds one infected individual among N in ~log2 N tests, a factor of e ln 2 ≈ 1.88 less tests than needed by our hypercube algorithm at large D. However, the tests must be performed serially, requiring ~log2(1/p) rounds of testing. For p = 0.4% (or 0.15%) a binary search takes 8 (or over 9) rounds of testing whereas a hypercube search takes typically 2 and occasionally 3 (in both cases). For a highly infectious disease like COVID-19, saving time is crucial because infected individuals who are still at large can infect others. The doubling time for SARS-CoV-2 has been estimated at τ2 ≈ 2 days14,26. If each testing round takes τ days, the prevalence grows by p~(1/ )τ τ/ 2 during a binary search. If this growth factor exceeds e ln 2, a binary search will do worse than a hypercube search. Assuming τ ≈ 1/3 day, we find that for p < 1%, the hypercube search is preferred. Another advantage of the hypercube search is that it includes many consistency checks. For example, finding σ = 1 in one direction and σ = 0 in the others indicates a testing error. In contrast, a binary search relies on repeated testing of the positive sam-ple, so that a single false negative can prematurely terminate the search.
VI. ConclusionsThe hypercube algorithm offers an attractive compromise between minimising the total number of tests to reduce costs and maximising the speed of testing to reduce the spread of the virus. We have demon-strated its viability for group sizes up to 100, showing that cost savings of a factor of nearly 20 can, in principle, already be achieved. We have quantified the loss of sensitivity due to dilution and discussed how it may be mitigated, for example through repeated group testing. These strategies could open the way to the use of larger pool sizes, bringing even greater cost savings at low prevalence. The most striking aspect of our approach is how rapidly the cost of testing a population can fall, pooled test sensitivity permitting, with decreasing prevalence. This should incentivise decision-makers to act firmly to drive the prevalence down through mass testing, contact tracing and isolation. Although mass testing is initially costly, it provides a clear route to reducing the prevalence. As the viral prevalence is reduced, keeping it low will, with the use of pooled testing, become progressively more affordable.
Online contentAny methods, additional references, Nature Research reporting sum-maries, source data, extended data, supplementary information, acknowledgements, peer review information; details of author con-tributions and competing interests; and statements of data and code availability are available at https://doi.org/10.1038/s41586-020-2885-5.
1. R. Dorfman, “The Detection of Defective Members of Large Populations,” Ann. Math. Stat. 14 (1943) 436.
2. F.K. Hwang, “A method for detecting all defective members in a population by group testing,” J. Amer. Stat. Assoc. 67 (1972) 605.
3. A. Allemann, “An efficient algorithm for combinatorial group testing,” in Aydinian H., Cicalese F., Deppe C. (eds), Information Theory, Combinatorics, and Search Theory, Lecture Notes in Computer Science, 7777, Springer, 2013.
4. M. Aldridge, O. Johnson, and J. Scarlett, “Group testing: an information theory perspective,” Foundations and Trends in Communications and Information Theory, to appear, arXiv:1902.06002.
5. S. Ghosh, R. Agarwal, M. A. Rehan, S. Pathak, P. Agrawal, Y. Gupta, S. Consul, N. Gupta, R. Goyal, A. Rajwade, and M. Gopalkrishnan, “A compressed sensing approach to group-testing for covid-19 detection,” arXiv:2005.07895 [q-bio.QM].
6. B. W. Heng and J. Scarlett, “Non-Adaptive Group Testing in the Linear Regime: Strong Converse and Approximate Recovery,” arXiv:2006.01325 [cs.IT].
7. A. Z. Broder and R. Kumar, “A note on double pooling tests (preliminary version),” arXiv:2004.01684 [cd.DM].
8. Ingrid Arevalo-Rodriguez et al., “False negative results of initial RT-PCR assays for COVID-19: a systematic review,” medRxiv preprint (August 13, 2020). https://doi.org/ 10.1101/2020.04.16.20066787.
9. S. Lohse et. al., “Pooling of Samples for testing for SARS-CoV-2 in asymptomatic people,” Lancet Infectious Diseases (April 28, 2020). https://doi.org/10.1016/S1473-3099(20)30362-5.
10. I. Yelin et. al., “Evaluation of COVID-19 RT-qPCR test in multi-sample pools,” Clinical Infectious Diseases (May 02, 2020). https://doi.org/10.1093/cid/ciaa531.
11. Noam Shental et al., “Efficient high throughput SARS-CoV-2 testing to detect asymptomatic carriers,” Science Advances 6 (2020) eabc5961.
12. Medicare, “Medicare administrative contractor (MAC) COVID-19 test pricing,”. https://www.cms.gov/files/document/mac-covid-19-test-pricing.pdf.
13. V.M. Corman, O. Landt, M. Kaiser et al., “Detection of 2019 novel coronavirus (2019-nCoV) by real-time RT-PCR,” Euro. Surveill. 25 (2020) 2000045.
14. S. Sanche, Y.T. Lin, C. Xu, E. Romero-Severson, M. Hengartner, R. Ke, “High contagiousness and rapid spread of severe acute respiratory syndrome coronavirus,” Emerg. Infect. Dis. 26 (July, 2020). https://doi.org/10.3201/eid2607.200282.
15. Office of National Statistics, “COVID-19 Infection Survey (Pilot): England and Wales, 4 September (2020),”. https://www.ons.gov.uk/peoplepopulationandcommunity/healthandsocialcare/conditionsanddiseases/bulletins/coronaviruscovid19infectionsurveypilot/englandandwales4september2020.
16. K. B. Pouwels, T. House, et al., “Community prevalence of SARS-CoV-2 in England: Results from the ONS Coronavirus Infection Survey Pilot,”. https://www.medrxiv.org/content/early/2020/07/07/2020.07.06.20147348.full.pdf.
17. Office of National Statistics, “COVID-19 Infection Survey (Pilot): methods and further information,”. https://www.ons.gov.uk/peoplepopulationandcommunity/healthandsocialcare/ conditionsanddiseases/methodologies/covid19infectionsurveypilotmethodsandfurtherinformation#test-sensitivity-and-specificity.
18. Office of National Statistics, “Weekly Statistics for NHS Test and Trace (England) and coronavirus testing (UK): 27 August to 2 September,”. https://www.gov.uk/government/publications/nhs-test-and-trace-england-and-coronavirus-testing-uk-statistics-27-august- to-2-september-2020/weekly-statistics-for-nhs-test-and-trace-england-and-coronavirus- testing-uk-27-august-to-2-september#annex-table-1.
19. Martin A.M. Reijns et al., “A sensitive and affordable multiplex RT-qPCR assay for SARS- CoV-2 detection,” medRxiv preprint (July 16, 2020). https://doi.org/10.1101/2020.07.14.20154005.
20. R. Wölfel, V.M. Corman, W. Guggemos et al., “Virological assessment of hospitalized patients with COVID-2019,” Nature. https://doi.org/10.1038/s41586-020-2196-x.
21. Q.X. Long et al., “Clinical and immunological assessment of asymptomatic SARS-CoV-2 infections,” Nature Medicine 26 (2020) 1200.
22. J. Watson, P. F. Whiting, and J. E. Brush, “Interpreting a covid-19 test result,” BMJ 369:m (2020) 1808. https://www.bmj.com/content/bmj/369/bmj.m1808.full.pdf.
23. L. M. Kucirka, S. A. Lauer, O. Laeyendecker, and J. Lessler, “Variation in False-Negative Rate of Reverse Transcriptase Polymerase Chain Reaction-Based SARS-CoV-2 by Time Since Exposure,” Ann. Intern. Med. 173 (4) (2020) 262 (2020). https://pubmed.ncbi.nlm.nih.gov/32422057.
24. Rita Jaafar et al., “Correlation between 3790 qPCR positives samples and positive cell cultures including 1941 SARS-CoV-2 isolates,” Clinical Infectious Diseases (September 28, 2020). https://doi.org/10.1093/cid/ciaa1491.
25. R. F. Service, “One number could help reveal how infectious a COVID-19 patient is. Should test results include it?,”. https://www.sciencemag.org/news/2020/09/one-number- could-help-reveal-how-infectious-covid-19-patient-should-test-results.
26. N. Afshordi, B. Holder, M. Bahrami, and D. Lichtblau, “Diverse local epidemics reveal the distinct effects of population density, demographics, climate, depletion of susceptibles, and intervention in the first wave of covid-19 in the united states,” arXiv:2007.00159 [q-bio.PE].
Publisher’s note Springer Nature remains neutral with regard to jurisdictional claims in published maps and institutional affiliations.
© The Author(s), under exclusive licence to Springer Nature Limited 2020
4 | Nature | www.nature.com
Article
ACCELERATED
ARTICLE
PREVIEW
ACCELERATED
ARTICLE
PREVIEW

Fig. 1 | Subsample pooling in the hypercube algorithm. shown here for D = L = 3 and N = 27 = 33. Each vertex represents an individual. The hypercube is sliced into L slices, in each of the D principal directions. Samples from N/L individuals are pooled into a sample for each slice. For this example, the 3 sets of slices are
shown in blue, red and green. If one infected individual is present, tests on each set of slices identify their coordinate in that direction. Hence only 9 tests uniquely identify them. As the viral prevalence p falls, the optimal group size N, the dimension D and the efficiency gain increase.
Nature | www.nature.com | 5
ACCELERATED
ARTICLE
PREVIEW
ACCELERATED
ARTICLE
PREVIEW

Fig. 2 | Positive specimens are detected after a 100-fold dilution. Each of six typical SARS-CoV-2-positive specimens was diluted through pooling with 19, 49, or 99 negative specimens. A Ct value (i.e., the PCR cycle at which the fluorescence signal generated by a specimen exceeds the baseline signal) was determined for each pool through RT-PCR amplification of the N and Orflab
genes of SARS-CoV-2. For each gene, the Ct values are plotted against the dilution factor. The red horizontal lines indicate the Ct value (40) at or below which a specimen is considered positive. All Ct curves stay below the red lines even as the positive specimens are diluted 100-fold. (See Extended Data Figure 1 and Extended Data Table 2).
6 | Nature | www.nature.com
Article
ACCELERATED
ARTICLE
PREVIEW
ACCELERATED
ARTICLE
PREVIEW

Fig. 3 | Expected number of tests per person to find all infected individuals using the hypercube algorithm (log-log plot). The dashed grey curve shows ep ln(0.734/p), the result obtained in the large D approximation, where the optimal group size N ≈ 0.35/p. The coloured curves show the results obtained from a detailed analysis when the group size N = 3D with D an integer. Where
0.35/p is an exact power of 3, as at the left end of each coloured curve, optimal performance is attained. As p is increased, a growing fraction of sites in the 3D hypercube are left empty, until the next exact power of 3 (see Supplementary Information).
Nature | www.nature.com | 7
ACCELERATED
ARTICLE
PREVIEW
ACCELERATED
ARTICLE
PREVIEW
Methods
Observational study designWe conducted an experiment to evaluate the hypothesis that known SARS-CoV-2 positive oropharyngeal swab specimens collected dur-ing COVID-19 surveillance in Rwanda will test positive after they are combined with as many as 99 known SARS-CoV-2 negative specimens. This was followed by an observational study that aimed to apply our hypercube algorithm to increase the efficiency of community testing for COVID-19 in Rwanda. In the experiment, two different sets of sample pools were tested for SARS-CoV-2 using RT-PCR. Each set consisted of three sample pools containing one known SARS-CoV-2 positive sample diluted in ratios of 1:20, 1:50, and 1:100 by combining it with equivalent amounts of 19, 49, and 99 known SARS-CoV-2 negative samples, respec-tively (see Figure 2 and Extended Data Table 2). In the observational study, 1280 individuals selected from the community were tested for SARS-CoV-2 using RT-PCR. One third of the individuals were participants in a screening for Severe Acute Respiratory Infections (SARI) and Influ-enza Like Illness (ILI) conducted in 30 per cent of the health facilities found across the 30 districts of Rwanda. The remaining two thirds were from COVID-19 screening of at-risk groups in the capital city of Kigali. The latter group is comprised mainly of people (market vendors, bank agents, and supermarket agents) who remained active during the lockdown imposed by the Government of Rwanda to contain COVID-19. Extended Data Table 1 summarises the characteristics of the study participants.
The positive fraction of RT-PCR tests for SARS-CoV-2 conducted in Rwanda in March 2020 suggests an upper-bound of 2 per cent for the virus prevalence in the country. Using p =2 per cent in the hypercube algorithm indicated an optimal sample group size of 17.5. For conven-ience, the 1280 individual samples were combined in 64 groups of 20 samples before testing for SARS-CoV-2 (see Extended Data Figure 1).
We used two established experimental protocols for SARS-CoV-2 testing, namely 1) a protocol by DAAN Gene Co., Ltd., Sun Yat-sen University, which is available online27, and is also under review by the WHO28, and 2) another by Corman et al.,13 which is widely used by the scientific community. The first protocol is used for routine screening for SARS-CoV-2, while the second protocol is used only if the first one produces a positive result and confirmation is thus required.
Sample collection and pool designOropharyngeal swabs were collected by wiping the tonsils and posterior pharynx wall with two swabs, and the swab heads were immersed in 3 mL Viral Transport Medium (VTM). Samples were transported in VTM to the Rwanda National Reference Laboratory (NRL) immediately after collection. Samples that had to be transported over a long distance were stored in dry ice. Each sample had a volume of 3 mL, of which 200 μL were used for pool testing, and the remainder was temporarily stored at −20 °C until the result of the pool testing was known. 200 μL of each sample were mixed with the same volume of other samples of the same pool in a FalconTM 15 mL conical tube and, after vortexing for 5 seconds, 200 μL of the mixture were pipetted for downstream RNA extraction. 5 μL of the extracted RNA were added to 20 μL of mas-ter mix to make 25 μL of total solution to be amplified by RT-PCR. If a pool tested positive, stored samples from that pool were processed to identify the positive ones. Individual samples were bar coded, making it easy to trace individuals that tested positive and minimising the risk of confusion of samples. Pool design and subsequent experimental analysis (see RT-PCR for SARS-CoV-2 below) were implemented with the aid of a robot to reduce human error.
RT-PCR for SARS-CoV-2Total viral RNA was extracted from swab specimens using the QIAamp Viral RNA 91 Mini Kit (Qiagen, Hilden, Germany), according to the manu-facturer’s instructions. RNA samples were screened for SARS-CoV-2 using a 2019-nCoV RNA RT-PCR test targeting two genes respectively
encoding an open reading frame (denoted Orf1ab) and nucleocapsid protein (denoted N) (DAAN Gene Co., Ltd. Of Sun Yat-sen University, 19, Xiangshan Road, Guangzhou Hi-Tech Industrial Development Zone, China). For Orf1ab, CCCTGTGGGTTTTACACTTAA and ACGATTGT GCATCAGCTGA were used as forward and reverse primers, respectively, together with a 5′-VIC CCGTCTGCGGTATGTGGAAAGGTTATGG-BHQ1-3′ probe. For N, GGGGAACTTCTCCTGCTAGAAT and CAGACATTT TGCTCTCAAGCTG were used as forward and reverse primers, respec-tively, together with a 5′-FAM- TTGCTGCTGCTTGACAGATT-TAMRA-3′ probe. The RT-PCR reaction was set up according to the manufacturer’s protocol, with a total volume of 25 μL. The reaction was run on the ABI Prism 7500 SDS Instrument (Applied Biosystems) at 50 °C for 15 min for reverse transcription, denatured at 95 °C for 15 min, followed by 45 PCR cycles of 94 °C for 15 sec and 55 °C for 45 sec. A threshold cycle (Ct value) <40 indicated a positive test, while Ct value >40 indicated a negative test. Positive controls for the reaction showed amplification as determined by curves for FAM and VIC detection channels, and a Ct value ≤ 32. Positive tests were confirmed using LightMix SarbecoV E-gene and LightMix Modular SARS-CoV-2 RdRp RT-PCRs targeting the envelope (E) and RNA directed RNA Polymerase (RdRp) genes, respec-tively, as described by the manufacturer (TIB MOLBIOL Syntheselabor GmbH, Eresburgstr. 22-23, D-12103 Berlin, Germany). Both the primers used and the RT-PCR reaction conditions were previously described13.
Statistical analysisCt values were tested for normality by using the Shapiro-Wilk test. A confidence bound for a sample of n Ct values was calculated as C t s± ×t df
⁎ , where Ct is the sample mean, s is the sample standard error, and tdf
⁎ is an appropriate quantile of the Student’s t distribution with n − 1 degrees of freedom, df. A confidence bound for the sum of the means of two samples of Ct values of sizes n1 and n2, respectively, was calculated using the same formula, with Ct set to the sum of the indi-vidual sample means, s set to the sum of the individual sample stand-ard errors, and df set to the smaller of n1 − 1 and n2 − 1. Statistical analysis was done using the R statistical computing environment (https://www.r-project.org/).
Loss of sensitivity due to dilutionTo estimate the post-dilution sensitivities of PCR tests with different maximum numbers of PCR cycles, we combined two data sets. First, we used the mean and standard deviations of the number of additional PCR cycles required for a positive detection, after a k-fold dilution of a positive specimen (Figure 2 in the paper, showing the data in Figure 6). Second, we used the mean and standard deviation of Ct values for positive specimens sampled from a target population. We combined (or, more accurately, convolved) the two probability distributions, represented as Gaussians to calculate the sensitivity of a ≤ x cycle PCR test as the prob-ability that the Ct value of a k-fold diluted positive specimen sampled from the same population will be ≤ x. Using a representative sample of 33 positive specimens identified during clinical screening for SARS-CoV-2 in Rwanda (see Extended Data Table 3), we estimate that a ≤ 40-cycle PCR test targeting the SARS-CoV-2 Ngene (resp. Orf1ab) has post 20-, 50-, and 100-fold dilution sensitivities of 95% (resp. 86%), 92% (resp. 82%), and 89% (resp. 77%), respectively. For a ≤ 44-cycle PCR test targeting the N gene (resp. Orf1ab), we obtain post 20-, 50-, and 100-fold dilution sensitivities of 99% (resp. 96%), 98% (resp. 94%), and 98% (resp. 92%), respectively. (As mentioned in the article, a maximum of 44 PCR cycles was used in the recent study of pooled testing for SARS-CoV-2 in Israel10.)
As further checks, we applied the same analysis to (1) an independ-ent sample of 107 positive specimens collected in Rwanda, and (2) the previously published data set consisting of the 26 positive specimens identified in Ref. 10. From the Rwandan data set, we estimated that a 40-cycle PCR test targeting the N-gene (resp. Orf1ab) has post 20-, 50-, and 100-fold dilution sensitivities of 91% (resp. 85%), 88% (resp. 81%), and 85% (resp. 77%), respectively. For a 44-cycle PCR test targeting the
Article
ACCELERATED
ARTICLE
PREVIEW
ACCELERATED
ARTICLE
PREVIEW
N-gene (resp. Orf1ab), the predicted sensitivities are 97% (resp. 94%), 96% (resp. 92%), and 95% (resp. 90%). The data set of Ref. 10 contains Ct values for only one gene - the E gene of SARS-CoV-2. Based on the argu-ments above, we assume for simplicity that diluting a positive specimen by 20-, 50- and 100-fold adds approximately 5, 6, and 7, respectively, to the original Ct value. Applying these assumptions to the data in Ref. 10, we infer post 20-, 50-, and 100-fold dilution sensitivities of 94%, 92% and 89% respectively for a ≤ 40-cycle PCR test, and 99%, 98% and 97%, for a ≤ 44-cycle PCR test. These results are comparable to those reported from our experiments. Together, they confirm that diluting positive samples does result in a loss of sensitivity, but that much of the loss can be offset by increasing the number of PCR cycles. In particular, sensitivities above 90% can be achieved for 100-fold dilution by using 44 PCR cycles, only 10% more than the number routinely employed.
Ethics approvalEthics approval was obtained from the Rwanda National Ethics Committee (Ref: FWA Assurance No. 00001973 IRB 00001497 of IORG0001100/20March2020) and written informed consents were obtained from the patients.
Reporting summaryFurther information on research design is available in the Nature Research Reporting Summary linked to this paper.
Data availabilityAll data and codes (both in R and in Mathematica) mentioned in the paper are available from the corresponding authors upon reasonable request.
Code availabilityAll data and codes (both in R and in Mathematica) mentioned in the paper are available from the corresponding authors upon reasonable request. 27. DAAN Gene Company Ltd., “DAAN - RT - PCR Reagent Set for COVID-19,”. https://
prolabcorp.com/daan-rt-pcr-reagent-set-for-covid-19-real-time-detection-for-48-samples-research-use-only.
28. World Health Organisation, “SARS-CoV-2 Nucleic Acid Tests,”. https://www.who.int/diagnostics_laboratory/200414_eul_covid19_ivd_update.pdf?ua=1.
Acknowledgements We thank the Rwanda Ministry of Health through RBC for stimulating discussions and correspondence. Kendrick Smith and Corinne Squire provided valuable encouragement and helpful references. We thank Andrew Jackson for discussions. Research at AIMS is supported in part by the Carnegie Corporation of New York and by the Government of Canada through the International Development Research Centre and Global Affairs Canada. Research at Perimeter Institute is supported in part by the Government of Canada through the Department of Innovation, Science and Economic Development Canada and by the Province of Ontario through the Ministry of Colleges and Universities.
Author contributions L.M., S.N. coordinated the experiments; P.N., T.N., E.N., M.S., C.M., D.N., M.N. contributed to patient recruitment and data collection from the community; P.N., Y.B., J.S., A.U., R.R., E.L.N., E.M., E.M., N.R., I.E.M., J.B.M., C.M.M. and E.U. contributed to laboratory RT-PCR test validation, data analysis and interpretation. W.N. and N.T. contributed to the theory.
Competing interests The authors declare no competing interests.
Additional informationSupplementary information is available for this paper at https://doi.org/10.1038/s41586-020-2885-5.Correspondence and requests for materials should be addressed to N.T. or W.N.Peer review information Nature thanks Maimuna Majumder, Sigrun Smola and the other, anonymous, reviewer(s) for their contribution to the peer review of this work. Peer reviewer reports are available.Reprints and permissions information is available at http://www.nature.com/reprints.
ACCELERATED
ARTICLE
PREVIEW
ACCELERATED
ARTICLE
PREVIEW
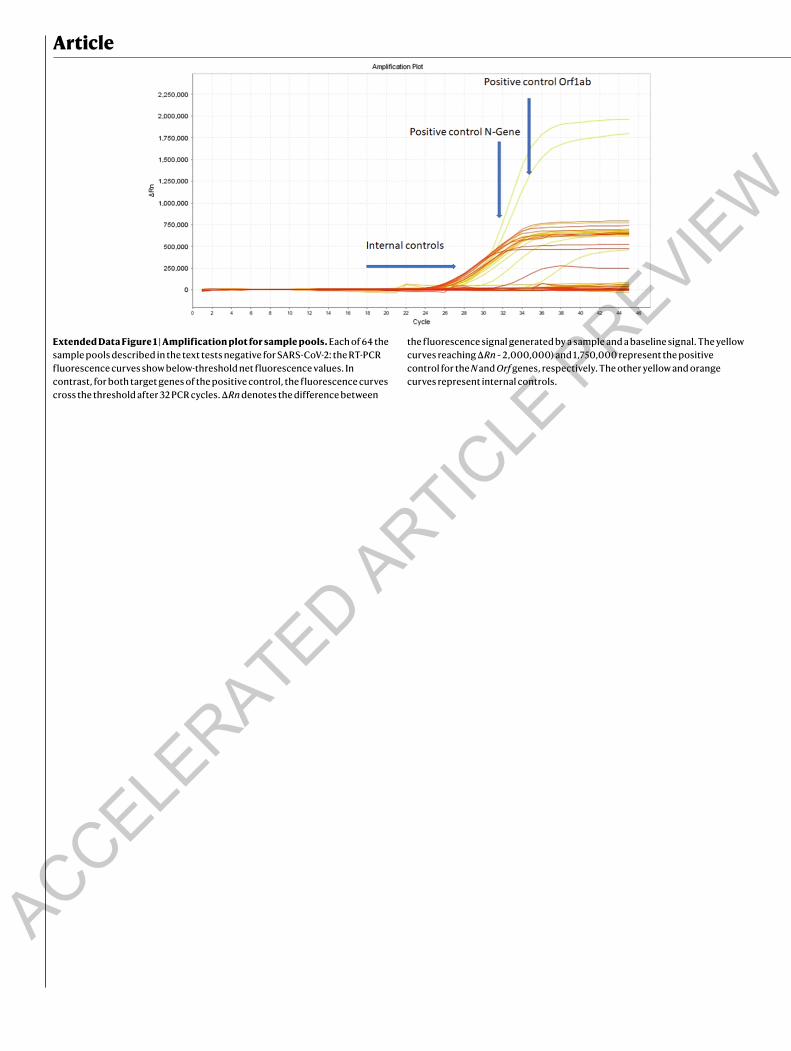
Extended Data Figure 1 | Amplification plot for sample pools. Each of 64 the sample pools described in the text tests negative for SARS-CoV-2: the RT-PCR fluorescence curves show below-threshold net fluorescence values. In contrast, for both target genes of the positive control, the fluorescence curves cross the threshold after 32 PCR cycles. ΔRn denotes the difference between
the fluorescence signal generated by a sample and a baseline signal. The yellow curves reaching ΔRn ~ 2,000,000) and 1,750,000 represent the positive control for the N and Orf genes, respectively. The other yellow and orange curves represent internal controls.
Article
ACCELERATED
ARTICLE
PREVIEW
ACCELERATED
ARTICLE
PREVIEW

Extended Data Table 1 | Characteristics of participants in field trial of hypercube algorithm in Rwanda
For more information, see Observational study design. *SARI=Severe acute respiratory infections, ILI = Influenza-like illness.
ACCELERATED
ARTICLE
PREVIEW
ACCELERATED
ARTICLE
PREVIEW

Extended Data Table 2 | Positive specimens are detected after massive dilution
Six SARS-CoV-2 positive specimens detected during COVID-19 screening in Rwanda were analysed. The positive specimens were detected by using a screening RT-PCR test targeting the N and Orf1ab genes of SARS-CoV-2 (Ct values from this test are reported in columns 3 and 4), and confirmed by using another RT-PCR test targeting the E and RdRp genes (Ct values reported in columns 5 and 6). We determined whether the screening test would have detected the positive specimens if they had been combined with 19, 49 or 99 known SARS-CoV-2 negative specimens. Three pools were thus formed per sample, with dilution factors given in column 2. For all 18 pools, fluorescence exceeded background levels at Ct values ≤ 40 (columns 3 and 4), implying the positive samples would have been detected even if diluted 100-fold.
Article
ACCELERATED
ARTICLE
PREVIEW
ACCELERATED
ARTICLE
PREVIEW

Extended Data Table 3 | Representative sample of confirmed positive specimens detected during COVID-19 screening in Rwanda
The specimens were detected by using a screening RT-PCR test targeting the N and Orf1ab genes of SARS-CoV-2 (Ct values from this test are reported in columns 3 and 5). They were subsequently confirmed as positive by using another RT-PCR test targeting the E and RdRp genes (Ct values are reported in columns 7 and 9).ACCELE
RATED ARTIC
LE PREVIE
W
ACCELERATED
ARTICLE
PREVIEW

1
nature research | reporting summ
aryApril 2020
Corresponding author(s): Neil Turok
Last updated by author(s): Oct 7, 2020
Reporting SummaryNature Research wishes to improve the reproducibility of the work that we publish. This form provides structure for consistency and transparency in reporting. For further information on Nature Research policies, see our Editorial Policies and the Editorial Policy Checklist.
StatisticsFor all statistical analyses, confirm that the following items are present in the figure legend, table legend, main text, or Methods section.
n/a Confirmed
The exact sample size (n) for each experimental group/condition, given as a discrete number and unit of measurement
A statement on whether measurements were taken from distinct samples or whether the same sample was measured repeatedly
The statistical test(s) used AND whether they are one- or two-sided Only common tests should be described solely by name; describe more complex techniques in the Methods section.
A description of all covariates tested
A description of any assumptions or corrections, such as tests of normality and adjustment for multiple comparisons
A full description of the statistical parameters including central tendency (e.g. means) or other basic estimates (e.g. regression coefficient) AND variation (e.g. standard deviation) or associated estimates of uncertainty (e.g. confidence intervals)
For null hypothesis testing, the test statistic (e.g. F, t, r) with confidence intervals, effect sizes, degrees of freedom and P value noted Give P values as exact values whenever suitable.
For Bayesian analysis, information on the choice of priors and Markov chain Monte Carlo settings
For hierarchical and complex designs, identification of the appropriate level for tests and full reporting of outcomes
Estimates of effect sizes (e.g. Cohen's d, Pearson's r), indicating how they were calculated
Our web collection on statistics for biologists contains articles on many of the points above.
Software and codePolicy information about availability of computer code
Data collection Raw data (Ct values) obtained from PCR-RT machines and built-in software available on request
Data analysis Open source code in R (V 4.02) (used to produce Figure 3) available on request; Mathematica (V 12.1) code used to obtain results in given in Supplementary Information available on request
For manuscripts utilizing custom algorithms or software that are central to the research but not yet described in published literature, software must be made available to editors and reviewers. We strongly encourage code deposition in a community repository (e.g. GitHub). See the Nature Research guidelines for submitting code & software for further information.
DataPolicy information about availability of data
All manuscripts must include a data availability statement. This statement should provide the following information, where applicable: - Accession codes, unique identifiers, or web links for publicly available datasets - A list of figures that have associated raw data - A description of any restrictions on data availability
All data and codes (both in R and in Mathematica) mentioned in the paper are available from the corresponding authors upon reasonable request

2
nature research | reporting summ
aryApril 2020
Field-specific reportingPlease select the one below that is the best fit for your research. If you are not sure, read the appropriate sections before making your selection.
Life sciences Behavioural & social sciences Ecological, evolutionary & environmental sciences
For a reference copy of the document with all sections, see nature.com/documents/nr-reporting-summary-flat.pdf
Life sciences study designAll studies must disclose on these points even when the disclosure is negative.
Sample size 1200 samples for proof of concept experiment on pooled testing, chosen as maximum feasible size for trial of population screening in discussion with Rwandan Ministry of Health; 140 samples for sensitivity analysis for positive samples, this was the largest sample available.
Data exclusions None
Replication Test sensitivity analysis (Section III of the paper) on 33 positive samples, on the basis of data presented in Methods Table 7, confirmed by analysis of 107 further samples as well as data taken from an independent study (Ref. 14)
Randomization Random
Blinding Experimenters had no indication in advance as to whether samples were positive or negative
Reporting for specific materials, systems and methodsWe require information from authors about some types of materials, experimental systems and methods used in many studies. Here, indicate whether each material, system or method listed is relevant to your study. If you are not sure if a list item applies to your research, read the appropriate section before selecting a response.
Materials & experimental systemsn/a Involved in the study
Antibodies
Eukaryotic cell lines
Palaeontology and archaeology
Animals and other organisms
Human research participants
Clinical data
Dual use research of concern
Methodsn/a Involved in the study
ChIP-seq
Flow cytometry
MRI-based neuroimaging
Human research participantsPolicy information about studies involving human research participants
Population characteristics In Rwanda, 1280 individuals selected from the community were tested for SARS-CoV-2 using RT-PCR. One third of the individuals were participants in a screening for Severe Acute Respiratory Infections (SARI) and Influenza Like Illness (ILI) conducted in 30 per cent of the health facilities found across the 30 districts of Rwanda. The remaining two thirds were from COVID-19 screening of at-risk groups in the capital city of Kigali. The latter group is comprised mainly of people (market vendors, bank agents, and supermarket agents) who remained active during the lockdown imposed by the Government of Rwanda to contain COVID-19. Table 5 summarises the characteristics of the study participants.
Recruitment Recruited by the Rwandan Ministry of Health COVID-19 team
Ethics oversight Rwanda National Ethics Committee (Ref: FWA Assurance No. 00001973 IRB 00001497 of IORG0001100/20March2020).
Note that full information on the approval of the study protocol must also be provided in the manuscript.

3
nature research | reporting summ
aryApril 2020
ChIP-seq
Data depositionConfirm that both raw and final processed data have been deposited in a public database such as GEO.
Confirm that you have deposited or provided access to graph files (e.g. BED files) for the called peaks.
Data access links May remain private before publication.
For "Initial submission" or "Revised version" documents, provide reviewer access links. For your "Final submission" document, provide a link to the deposited data.
Files in database submission Provide a list of all files available in the database submission.
Genome browser session (e.g. UCSC)
Provide a link to an anonymized genome browser session for "Initial submission" and "Revised version" documents only, to enable peer review. Write "no longer applicable" for "Final submission" documents.
Methodology
Replicates Describe the experimental replicates, specifying number, type and replicate agreement.
Sequencing depth Describe the sequencing depth for each experiment, providing the total number of reads, uniquely mapped reads, length of reads and whether they were paired- or single-end.
Antibodies Describe the antibodies used for the ChIP-seq experiments; as applicable, provide supplier name, catalog number, clone name, and lot number.
Peak calling parameters Specify the command line program and parameters used for read mapping and peak calling, including the ChIP, control and index files used.
Data quality Describe the methods used to ensure data quality in full detail, including how many peaks are at FDR 5% and above 5-fold enrichment.
Software Describe the software used to collect and analyze the ChIP-seq data. For custom code that has been deposited into a community repository, provide accession details.
Flow Cytometry
PlotsConfirm that:
The axis labels state the marker and fluorochrome used (e.g. CD4-FITC).
The axis scales are clearly visible. Include numbers along axes only for bottom left plot of group (a 'group' is an analysis of identical markers).
All plots are contour plots with outliers or pseudocolor plots.
A numerical value for number of cells or percentage (with statistics) is provided.
Methodology
Sample preparation Describe the sample preparation, detailing the biological source of the cells and any tissue processing steps used.
Instrument Identify the instrument used for data collection, specifying make and model number.
Software Describe the software used to collect and analyze the flow cytometry data. For custom code that has been deposited into a community repository, provide accession details.
Cell population abundance Describe the abundance of the relevant cell populations within post-sort fractions, providing details on the purity of the samples and how it was determined.
Gating strategy Describe the gating strategy used for all relevant experiments, specifying the preliminary FSC/SSC gates of the starting cell population, indicating where boundaries between "positive" and "negative" staining cell populations are defined.
Tick this box to confirm that a figure exemplifying the gating strategy is provided in the Supplementary Information.
Magnetic resonance imaging
Experimental design
Design type Indicate task or resting state; event-related or block design.

4
nature research | reporting summ
aryApril 2020
Design specifications Specify the number of blocks, trials or experimental units per session and/or subject, and specify the length of each trial or block (if trials are blocked) and interval between trials.
Behavioral performance measures State number and/or type of variables recorded (e.g. correct button press, response time) and what statistics were used to establish that the subjects were performing the task as expected (e.g. mean, range, and/or standard deviation across subjects).
Acquisition
Imaging type(s) Specify: functional, structural, diffusion, perfusion.
Field strength Specify in Tesla
Sequence & imaging parameters Specify the pulse sequence type (gradient echo, spin echo, etc.), imaging type (EPI, spiral, etc.), field of view, matrix size, slice thickness, orientation and TE/TR/flip angle.
Area of acquisition State whether a whole brain scan was used OR define the area of acquisition, describing how the region was determined.
Diffusion MRI Used Not used
Preprocessing
Preprocessing software Provide detail on software version and revision number and on specific parameters (model/functions, brain extraction, segmentation, smoothing kernel size, etc.).
Normalization If data were normalized/standardized, describe the approach(es): specify linear or non-linear and define image types used for transformation OR indicate that data were not normalized and explain rationale for lack of normalization.
Normalization template Describe the template used for normalization/transformation, specifying subject space or group standardized space (e.g. original Talairach, MNI305, ICBM152) OR indicate that the data were not normalized.
Noise and artifact removal Describe your procedure(s) for artifact and structured noise removal, specifying motion parameters, tissue signals and physiological signals (heart rate, respiration).
Volume censoring Define your software and/or method and criteria for volume censoring, and state the extent of such censoring.
Statistical modeling & inference
Model type and settings Specify type (mass univariate, multivariate, RSA, predictive, etc.) and describe essential details of the model at the first and second levels (e.g. fixed, random or mixed effects; drift or auto-correlation).
Effect(s) tested Define precise effect in terms of the task or stimulus conditions instead of psychological concepts and indicate whether ANOVA or factorial designs were used.
Specify type of analysis: Whole brain ROI-based Both
Statistic type for inference(See Eklund et al. 2016)
Specify voxel-wise or cluster-wise and report all relevant parameters for cluster-wise methods.
Correction Describe the type of correction and how it is obtained for multiple comparisons (e.g. FWE, FDR, permutation or Monte Carlo).
Models & analysis
n/a Involved in the studyFunctional and/or effective connectivity
Graph analysis
Multivariate modeling or predictive analysis