a portrait of the relationship between mechanization and ...padler/research/dot.final-1.pdf · a...
TRANSCRIPT

A Portrait of the Relationship betweenMechanization and Work in the U.S. Economy in 1980
Paul S. AdlerGraduate School of BusinessUniversity of Southern California
Bryan BorysInstitute of Safety and Systems ManagementUniversity of Southern California
June 1994
Debates over the effects of technological change on work continue to generate a wideand confusing array of findings. One reason for the lack of consensus is that empiricalresearch based on large samples has yet to adequately address the core issue: therelationship, if any, between the level of mechanization and the characteristics of work.This relationship is explored using data from the 1980 Census of Population to linkmeasures of the level of mechanization with measures of work characteristics formanufacturing industries. The results are mixed; work characteristics in moremechanized industries compared to less mechanized industries are higher in somedimensions and lower in others. A path model approach allows aggregation of thesemixed results. Using wages as a yardstick, and controlling for other determinants ofwages, we find that the work characteristics of more mechanized industries areupgraded in the aggregate, compared to those in less mechanized industries.
A Portrait of the Relationship betweenMechanization and Work in the U.S. Economy in 1980
Debates over the effects of technological change on work continue to generate a wideand confusing array of findings. One reason for the lack of consensus is that empiricalresearch based on large samples has yet to adequately address the core issue: therelationship, if any, between the level of mechanization and the characteristics of work.This relationship is explored using data from the 1980 Census of Population to linkmeasures of the level of mechanization with measures of work characteristics formanufacturing industries. The results are mixed; work characteristics in moremechanized industries compared to less mechanized industries are higher in somedimensions and lower in others. A path model approach allows aggregation of thesemixed results. Using wages as a yardstick, and controlling for other determinants ofwages, we find that the work characteristics of more mechanized industries areupgraded in the aggregate, compared to those in less mechanized industries.

Studies of the evolution of work in the face of technological change have generated
a wide and confusing array of findings. Debates continue over how the historical trend
toward mechanization has affected work -- or indeed whether any discernible
relationship exists at all. Our approach is to examine what are the effects of
mechanization on work; the question of whether there are such (strong) effects is
treated as the null hypothesis.
Of those who hypothesize strong influences of mechanization, some argue that
political forces have led managers to use new technologies to “deskill” workers
(Braverman, 1974; Noble, 1984). Their argument is that political demands for increased
control over workers comes at the expense of workers' autonomy and skill. A corollary
is the polarization thesis, which argues that deskilling of some (groups of) workers is
accompanied by upgrading of others (e.g., technicians), leading to an increasingly
dichotomous skill distribution.
Others argue an upgrading hypothesis. One variant, developed by Bell (1960) and
others and reworked in the 1980s by Hirschhorn (1984), Adler (1986), and Zuboff
(1988), is that although new technologies reduce traditional craft skills, they make even
greater conceptual demands on workers. Another variant is that jobs may be deskilled
in the initial stages of technological development, but with further advances in
technology, the trend reverses and an overall pattern of upgrading emerges (Blauner,
1964; Sorge and Streeck, 1988).
The null hypothesis about the relationship between mechanization and work is that
managers have a wide latitude of choice in technological implementation, and a wide
variety of local conditions affect both technology implementation and skill labeling. This
"contextualist" hypothesis argues that the relationship between mechanization and
work is idiosyncratic to particular firms (Kelley, 1986; Form, et al., 1988) or countries
(Maurice et al., 1986), and thus there is no general historical trend to be found.

For all three schools, what is at stake is the effect of technological change on jobs,
and through the changing nature of jobs, on the workers who inhabit those jobs. To
measure such an effect, one must be able to assess the technological and skill-related
characteristics of jobs in a broad sample. Existing empirical research falls short of
resolving these debates due to three difficulties (Vallas, 1990; Spenner, 1990).
First, researchers have lacked a robust notion of skill or, more broadly, of the
appropriate dimensions of work. Industrial engineers focus on the range of con-
ventional skills -- manual, cognitive, perceptual, etc. -- demanded for the technically
efficient use of new technologies (Crossman, et al., 1966; Hazlehurst, et al., 1969). Those
who focus attention on the politics of the workplace highlight substantive complexity
and autonomy/control as the central characteristics of skilled work, emphasizing their
role as a source of power in labor-management conflict (Braverman, 1974; Edwards,
1979; Shaiken, 1984). Another line of research criticizes both approaches for failing to
recognize that labels such as “skilled” and “unskilled” reflect idiosyncratic constellations
of institutional and cultural forces more than they do broad technological or political-
economic realities (Elbaum, 1984).
Each of these approaches is based on contestable theory (Hirschhorn, 1984; Adler,
1986); moreover, none is supported by systematic data. Following Cain and Treiman
(1981) and Parcel and Mueller (1983), we shall use the measures of a rich set of work
characteristics supplied by the Dictionary of Occupational Titles (U.S. Department of
Labor, 1977) (DOT) to identify empirically some underlying dimensions of work. It is
this empirical characterization that we shall use in measuring the relationship between
mechanization and the dimensions of work.
Second are methodological difficulties. Richer, more fine-grained case studies are
hampered by inadequate samples; while studies employing broader samples gloss the
issue of causality. Case-study research is insufficient to address the question at the heart
of this paper. The forces that link mechanization and work clearly allow considerable

variation from case to case (Spenner, 1988). If competitive pressures tend to drive firms
to employ human and technical capital efficiently and if efficient use has determinate
form, it will still be the case that not all firms will be at equilibrium at any given point in
time and there may therefore be a wide range of technology utilization patterns.
When we look to broader statistical studies, however, we find that the question of
mechanization has been supplanted by a focus on temporal change in work
characteristics. Attributing temporal changes in work to mechanization assumes a
relatively strong causal role for technology in which temporal trends in mechanization
are widespread, consistent, and outweigh other forces shaping work (such as shopfloor
politics and rising education levels). While some find such a model plausible, many
others do not (Kelley, 1986; Noble, 1984; MacKenzie and Wajcman, 1985).
Of the studies reviewed by Spenner (1988) on the “effects of technology on skill
requirements,” only that by Mueller et al. (1969) incorporates any measure of
technology. Mueller and her colleagues analyzed 2662 jobs representative of the U.S.
labor force. In the 228 cases in which the worker had been in the same job for the 5-
year span of the survey and in which the job had experienced a “machine change”
during that time, they found evidence of upgrading of both “skill” and “influence.”
Apart from the very small final sample, the Mueller et al. study suffers from two other
difficulties. First, it is difficult to extrapolate to the broader universe of jobs, since for
those workers who changed jobs during the five years, skill changes may be
attributable either to changes in mechanization or changes in job (Spenner, 1988).
Second, it could be plausibly argued that if technological change does affect job
requirements, the incumbent is more likely to be replaced if the change reduces
requirements than if it increases requirements.
In order to avoid conflating the effects of mechanization and the effects of other
forces (e.g., rising education levels, work mobility) the present study focuses on the
cross-section relationship between mechanization and skill, examining the entire U.S.

manufacturing workforce in 1980. Limitations of data and space prevent us from
exploring mining, agricultural, transportation and service industries. We shall not,
however, restrict the range of occupations studied since occupations typically associated
with the service sector are often found in manufacturing industries and are affected by
mechanization. A quantitative measure of mechanization (equipment stock per worker)
will be supplemented by qualitative measures -- proportion of output produced in small
batches, in large batch or assembly-line production, or through continuous process
technology -- similar to those used in previous studies of mechanization and work (e.g.,
Woodward, 1965; Blauner, 1964; Hull, et al., 1982).
We thus draw our data from the 1980 U.S. Census, thus covering all reported job
holders in that year; we measure not only the skill level, but also the mechanization
level, of each job. We then test whether there is a discernible statistical relationship
between mechanization and work; and if so, whether the relationship is consistent with
the deskilling or upgrading hypotheses.
A third problem is that existing research lacks a scheme for weighting the relative
contributions of different work characteristics in order to assess the aggregate changes
in work (Vallas, 1990). In most research on mechanization and work, more than one
dimension of work is at issue, creating the need for some form of aggregation scheme.
The industrial engineering approach decomposed work into constituent skills, but
lacked a method for evaluating the relative contribution of each dimension to an overall
measure of skill (Crossman et al., 1966; Hazlehurst et al., 1969; Bright, 1958). As a result
these researchers were unable to draw any overall conclusions. Similarly, those who
emphasize substantive complexity and autonomy/control have difficulty aggregating
the two. Their theoretical model presumes that the two dimensions are highly
correlated and that management pressure to reduce the latter also tends to reduce the
former (Braverman, 1974). But this correlation is asserted, not tested and has been con-
tested by Friedman (1977). The problems associated with aggregating disparate

dimensions of work has led some to abandon the search. These agnostics posit a
“mixed effects” model in which the final aggregate outcome is either uncertain or
contingent upon organizational variables (Form, et al., 1988).
We approach the aggregation problem with a socio-economic method that takes
wages as the final arbiter of skill. Our strategy is decidedly “positivist,” in Attewell’s
(1990) framework, taking productive ability — and its quantification in wages — as the
grounding of our concept of skill. Nonetheless, we are not blindly positivist; we
recognize the other influences on wages besides productive ability, controlling for such
factors.
First, we measure the effect of mechanization on each of several dimensions of
work. We find mixed results: there is some evidence of upgrading, some of deskilling.
Second, we estimate the wage return to each of several underlying dimensions of work,
controlling for social and institutional influences. This captures the labor market
valuation of each of these dimensions of work and thus provides an implicit weighting
scheme: the higher the wage return, the greater the productive contribution and thus
the greater the overall skill content.
Thus, by measuring the association between mechanization and skill for all reported
job holders in the U.S. in 1980, and by weighting the differentially distributed
components of skill, we can assess the degree of upgrading or deskilling due to
mechanization in the overall U.S. economy. We find that the deskilled dimensions of
work tend to be devalued, relative to the upgraded dimensions. On net, we find that
the mixed effects of mechanization generate a slight overall upgrading effect. While we
do not assume that wages are an unambiguous indicator of skill, we find that this
approach generates some important lessons for the skill debates.
DATA AND METHODS
Our unit of analysis is the job, and our sample is all jobholders reporting their
employment on the 1980 U.S. Census. For each job we shall need a measure of skill and
a measure of mechanization. The former is obtained from the DOT; the latter from the
Bureau of Economic Analysis. We can associate each of these data sources with our
Census data because each jobholder reported his/her occupation and the industry in
which s/he worked. The major hurdle in doing so is that the taxonomies employed by
the Census, the DOT and the BEA are not isomorphic. Fortunately, bridges between
them exist which provide a suitably accurate mapping.
The fulcrum of our dataset is the Census Bureau’s industry-occupation matrix (U.S.
Bureau of Census, 1984), in which rows represent industrial categories and columns
represent occupations. Each cell of the matrix contains the number of employees in that
particular industry-occupation mix. The cell frequencies come from the 1980 U.S.
Census and represent the self-reported occupation and industry of employment for
over 94 million employees. These employees are allocated into 447 Census occupations
and 225 Census industries; this creates a matrix with 100575 unique industry-occupation
combinations. After selecting the manufacturing subset (20 industries) we are left with
20.3 million employees categorized into 8940 unique industry-occupation combinations.
Measuring work characteristics
We use the Dictionary of Occupational Titles (DOT) as our source of measures of work
characteristics. The DOT is not without problems; however, its breadth of coverage,
standardization and detail make it invaluable for the type of large-scale analysis
presented here. The DOT variables measure physical capacities such as manual
dexterity; managerial and social aspects of work (e.g., "People"; "Direct, Control, Plan";
“Deal with People”); and socio-cultural aspects (e.g., "Preference for Prestige") (Table 1).
These measures are gathered through field studies conducted by the United States
Employment Service, which periodically updates both the measures and the
occupational classification scheme.
Put Table 1 here.
The most exhaustive examinations of the limitations of the DOT dataset is found in
Miller et al. (1980) and Spenner (1990). Miller et al. argue that since the DOT classification
is based on incremental, decennial updates of previously existing schemes, it
underrepresents occupations in emerging industries. Since our data represent jobs,
rather than occupational categories, and this is a cross-sectional study, this problem is
not a threat here.
Miller et al. also suggest that there is not as much differentiation among the DOT
measures as is apparent, due to halo effects caused by the use of a single rater for each
occupation. We follow their advice and use factor analysis to reduce these measures to a
set of more distinct measures. Miller et al. also report low inter-coder reliability of the
DOT measures, finding that the major source of unreliability is inter-rater differences.
This would be a threat to the validity of our results only if certain raters focused on
certain occupations or certain industries; Miller et al., find no significant bias due to such
a source. Thus for us, the lack of reliability results in noise, rather than bias (see also
Spenner, 1990).
A more serious threat is posed by the influence of occupational prestige or de-
sirability on evaluations of skill (Parcel and Mueller, 1983; Attewell, 1990; Spenner,
1990). As we discuss below in our discussion of estimation procedures, this potential
model specification error has been ruled out empirically. Similarly, the validity
problems cataloged by Spenner (1990) are either controlled for in this analysis (e.g.,

gender bias), or merely generate noise in our factor-analytic scheme (e.g., the
questionable measurement of “strength” requirements).
The thorniest problem is that the occupational classification scheme employed by
the Bureau of the Census in constructing the industry-occupation matrix differs from
that used by the Bureau of Labor Statistics in constructing the DOT. The finer grain of
the DOT classification results largely from distinguishing between similar occupations in
different industries, which the Census classification does not. In order to use the DOT
measures with the Census data, we employ a crosswalk between the two occupational
classification schemes created by Paula England. The crosswalk translates the DOT
variables into the Census occupational scheme by prorating the DOT measures for
appropriate DOT occupations to each Census occupation. Each variable for each Census
occupation is an average of that variable for the several corresponding DOT
occupational categories weighted by the number of workers in each of the DOT
categories. Thus, thanks to the efforts of Prof. England and colleagues, the problem of
incommensurability is surmounted.
The factor structure for employees in the manufacturing sector is shown in Table 4
(all factor analyses are PROMAX oblique rotations, following Cain and Treiman, 1981).
We find five statistically warranted and theoretically interpretable factors:
• Substantive Complexity encompasses the cognitive demands captured by in-
telligence, verbal, clerical, spatial, and numerical aptitudes, as well as training and
education requirements (SVP and GED) and Data and People (thus our factor scheme is
consistent with the cautions of Spenner, 1990).
• Motor Skills includes measures of dexterity and facility with things; it also
includes negative loadings of Influence and Prestige, suggesting that (other work
characteristics being equal) more manually-skilled occupations tend to have less
authority and status. (The dexterity measures originally loaded negatively on the Motor
Skills factor and Influence loaded positively. We have changed the sign on this factor to
make the results more intuitive.)
• Social Skills captures not only management skills (People, Influence, Preference
for Business, and Use Judgment), but also communication skills (Talk, Verbal, Deal with
People) and analytic skills (Data versus Things). Demanding Working Conditions
captures both hazardous and physically demanding conditions.
• The fifth factor is more difficult to interpret. We call it Craftwork, because the
combination of productive, creative and interpretive aspects, along with the negative
loading of People, approximates the traditional concept of autonomous craftsmen.
Occupations that scored particularly high on this factor included many of the traditional
craft and creative occupations.
These factors are similar to those derived by Cain and Treiman, 1981. Minor differences
reflect our narrower focus on manufacturing industries and our use of the jobholder,
rather than the occupation, as the unit of analysis.
Put Table 2 here.
Sociological studies of work have tended to focus on the impacts of mechanization
on non-managerial workers (Spenner, 1979; 1988). At the heart of the deskilling
hypothesis is the assumption of increasing “separation of execution and control”
(Edwards, 1979) and the different effects of mechanization on each element. In order to
explore such differences we analyze two, successively narrower occupational subsets:
all non-managerial occupations and non-managerial, non-professional occupations.
The factor structure for non-managerial employees is presented in Table 5. A
comparison with the factor structure for all manufacturing employees in Table 5
illustrates the effects of status differences among non-managerial employees. While
some form of Substantive Complexity accounts for most of the variance in both

datasets, in the non-managerial subset, it does not include social skills or status. Status
differences in the non-managerial subset turn up instead in the Motor Skill factor. This
suggests that in the status hierarchy among non-management employees, those at the
top are the less manually-skilled.
Put Table 3 here.
The factor structure for jobs in non-managerial, non-professional occupations is
presented in Table 6. The major difference between this structure and that for the set of
all occupations (Table 4) is that Substantive Complexity in the non-managerial, non-
professional subset is decomposed into two factors that seem to reflect the white-
collar/blue-collar distinction. The first factor, Cognitive Complexity, captures qualities
such as clerical aptitude, use of judgment, and preferences for business and data (rather
than for machines and things). This factor contrasts with the skills reflected in Technical
Complexity, such as using measures, spatial and numerical aptitudes, and preference
for science. Cognitive and Technical Complexity also differ on the social skills involved:
the former includes people-processing skills (“Deal with People” and “Talk”), while the
latter includes more properly supervisory responsibilities (i.e., “Direct, Control, Plan”
and “Preference for Prestige”). Since the distinction between Cognitive and Technical
Complexity appears only by excluding professionals, it appears that professional
occupations combine these dimensions.
Put Table 4 here.
Measuring mechanization

We used the capital-labor ratio as a quantitative measure of the level of mechanization
of each industry. We used this ratio since we are interested in the amount of
mechanization available to average worker in the average job in an industry. For the
numerator of this ratio, we use a five-year weighted average of the stock of
"Equipment" for the years 1978 to 1982 (U.S. Dept. of Commerce, 1987). We thus
exclude forms of capital less relevant to the mechanization and work debate, such as
real estate and structures. Finer-grained candidates, such as the level of “office and
computing equipment,” each excluded important types of mechanized capital.
The measures we use are not depreciated. Since much mechanized equipment has a
longer useful lifetime than the book life of accounting conventions (typically 5 years),
measures of depreciated capital stock may underrepresent the actual level of equipment
in use.
The denominator of the mechanization measure is the number of employees in each
industry, calculated from the Census Bureau’s industry-occupation matrix. The range of
this measure is quite large; we use the logarithm of the capital-labor ratio in order to
reduce scale effects.
A second measure of mechanization captures qualitative, rather than quantitative,
industry distinctions. This is a measure of process type derived from the PIMS data
service. Based on a survey of 3788 business units, the data indicate the proportion of
output produced by each business unit using each of three process types: “small batch,”
“large batch/assembly” and “continuous process” (Strategic Planning Institute, 1978).
We calculate the mean percentage of output produced through each category over the
sample of business units in each of 49 industries.
Theories of organization assume that technological development results in a
movement from small batch to large batch/assembly and then from the latter to
continuous process (Woodward, 1970; Blauner, 1964). Confirming these assumptions,
factor analysis of these three measures (using a PROMAX oblique rotation) generates

two factors: the first factor (“Volume”) distinguishes small batch from large
batch/assembly-intensive industries; the second factor (“Process”) distinguishes
assembly from continuous process-intensive industries (see Table 2). These factors
allow us to distinguish the relationships between work characteristics and the shift from
batch to assembly, and between work and the shift from batch/assembly to continuous
process.
Put Table 5 here.
The profile of industries on the qualitative and quantitative measures is given in Tables
3a , 3b, and 3c.
Put Tables 6a, 6b and 6c here.
We link the mechanization measures to the DOT measures using the industry-
occupation matrix. This raises a problem similar to that raised by the DOT data: the
Commerce Department's Standard Industrial Classification (SIC) scheme differs from
the industrial classification scheme used by the Census Bureau in constructing the
industry-occupation matrix. In this instance, however, bridging the two is much
simpler. We used a published crosswalk (U.S. Bureau of Census, 1980). Since the 2-digit
SIC categories are inclusive of the Census categories, we can convert from the Census
to the 2-digit SIC scheme without having to prorate industries across categories.
Methods: Calculating correlations across the matrix

The resulting dataset represents each jobholder as reported in the 1980 U.S. Census, for
whom we have a measure of skill (inferred from the jobholder’s occupation) and of
mechanization (inferred from his/her industry). (See Figure 1.)
Put Figure 1 here
We thus seek to measure how the distribution of skill throughout the U.S. economy
reflects the distribution of mechanization (among other factors). The relative number of
jobholders in each cell of our industry-occupation yield both distributions. By
measuring the association between these distributions we can test the skill debates. The
deskilling hypothesis, for example, claims that high-skill occupations will be more
frequent in low-mechanization industries than in high-mechanization industries.
In our analyses the nominal unit of analysis is the Census respondent. The matrix
represents over 20.3 million individuals; thus the dataset has over 20.3 million
observations. Some of the variance in mechanization and work characteristics is lost,
however, due to the structure of the dataset: the measures of work characteristics vary
only between occupations and the mechanization measures vary only between
industries. We thus adjust the degrees of freedom as appropriate, always assuming the
most conservative test.
The first part of the analysis measures the association between mechanization and
work. We first factor-analyze the DOT measures, isolating five factors. We then
measure the correlations between mechanization (both quantitative and qualitative
measures) and these five work factors. Our hypothesis, based on considerable empirical
findings, was that this analysis would show mixed results, with some dimensions of
work positively associated with mechanization and some negatively.
The final step in our analysis is thus to develop an aggregation scheme to account
for the overall impact of mechanization on work. We do so by regressing the wage for

each occupation on each of the work characteristic factor scores, controlling for
occupational gender composition, and for industrial profitability and level of
unionization (for a description of the control variables, see Hodson and England, 1986).
Once we measure the marginal returns to each work characteristic, we can compare
aggregate profiles of work characteristics and estimate overall upgrading or deskilling
effects of mechanization through its effects on the composition of work.
RESULTS
The correlations between Mechanization and the dimensions of work for each of the
three occupational subsets are presented in Tables 7a - c.
Put Tables 7a - c here.
We interpret each correlation as a measure of the increase in each particular skill
required by a unit increase in Mechanization. Since our population is the same as our
sample, except for Census department sampling error, we shall not draw much
attention to tests of statistical significance. We report all correlations in the paper; the
reader can see from the tables that the correlations are small, but given the large
sample are nonetheless significant but for a few.
We find first that, contrary to the deskilling thesis, there is a small but positive
correlation between complexity (whether Substantive, Cognitive or Technical) and
Mechanization for all of the occupational subsets. (We examined the polarization
corollary by measuring the association between the variation in each dimension of
work and Mechanization. To be able to calculate a variance for each observation, we
used the industry as the unit of analysis, for this analysis only; this severely reduces the

number of independent observations. This analysis yielded no correlations that were
either large or statistically significant.)
Second, we find a negative correlation between Mechanization and both Motor
Skills and Craftwork in each occupational subset. This result is consistent with most
prior research. Even the upgrading models allow for losses in manual skills and craft
forms of work, hypothesizing that such losses are offset by gains in other types of skill.
The positive correlation between Mechanization and Demanding Working
Conditions for each subset contradicts conventional wisdom. This may be due to the
prevalence of machines that do indeed create poor working conditions. Alternatively,
this correlation might reflect disequilibrium in implementation. If the most physically
demanding tasks are the first candidates for mechanization, then higher-than-average
levels of mechanization may be found in the most physically demanding areas in the
short run, even if those areas become progressively more mechanized and less
physically demanding over time. This disequilibrium hypothesis is consistent with the
research on robotics that finds robots used most in particularly demanding
environments of auto painting and welding (Hunt and Hunt, 1983).
Social Skills captures collegiality and people-processing skills. The positive
correlation, weak as it is, between Mechanization and Social Skills is consistent with the
hypothesis that mechanization increases interdependence among employees
(Hirschhorn, 1984; Adler, 1986; Ray, 1989). While not directly capturing interdepen-
dence per se, this modest finding suggests that more mechanized work settings
demand occupations with greater interpersonal (but not supervisory) skills.
The relationship between the qualitative measures of mechanization and work are
presented in Tables 8a-c. These results summarize the effects of qualitative shifts in
technology from small batch to large batch/assembly technology (measured by
Volume) and from assembly to continuous process technology (Process).

Put Tables 8a-c here.
Not surprisingly, we find that Volume is negatively associated with Substantive
Complexity in the all-occupations and the non-management datasets (Table 8a).
However, we also find a positive correlation between Volume and both Cognitive and
Technical Complexity among non-professional, non-managerial occupations (Table 8c).
The latter finding challenges the widespread assumption that large batch/assembly line
production allows for a finer division of labor which in turn reduces the substantive
complexity of workers’ jobs (Edwards, 1979).
The association between Process and each of the Complexity factors in each subset
were statistically insignificant, except for a positive association between Process and
Technical Complexity in the non-management, non-professional dataset.
Higher levels of both Volume and Process are associated with decreases in Motor
Skills for all the occupational subsets. This is consistent with nearly all previous research
and with the results of the quantitative measures examined above.
The relationship between Demanding Working Conditions and type of mecha-
nization is weak in most cases. Poor Working Conditions are, however, negatively
associated with Volume in the non-management non-professional subset (Table 8c),
suggesting that assembly-line work is less hazardous and physically demanding than
small batch production.
Craftwork is negatively associated with Process in the non-management non-
professional subset (Table 8c). The craft aspects of work are in less demand in process-
intensive than in assembly-intensive environments, challenging the “return-to-
craftwork” upgrading arguments of Blauner (1964) and his followers. They are not
significantly lower, however, in large batch/assembly than in small batch
environments, challenging the deskilling arguments of Braverman (1974) and his
followers.

Overall, all the significant regression coefficients on Volume and Process have the
same sign; thus the two dimensions appear to have similar effects on work. We thus
find no support for the curvilinear model proposed by Blauner (1964), in which the
transition from small batch to assembly-line has a qualitatively different effect on work
than the transition from assembly-line, large batch to continuous process. This suggests
that the monotonic, uni-dimensional model suggested by Woodward (1965) model is a
better conceptualization of mechanization for the purposes of analyzing its effects on
work.
Aggregating the effects of Mechanization on Work
We thus find strong confirmation of a mixed-effects model: mechanization is associated
with higher cognitive demands and lower physical demands. It remains to assess the
aggregate result. The logic of our model is that mechanization affects wages through its
effects on the underlying dimensions of work and their relative valuation (controlling
for unionization, gender composition and industry profitability) (Figure 2).
Put Figure 2 here.
The central findings of this model proved robust procedures to correct data
problems, as well as against alternative specifications (such as allowing for the effects of
control variables on Mechanization). In addition, we tested for the effects of
occupational status on both the raters of the DOT measures and on wages (Parcel and
Mueller, 1983), anticipating that the influence of this unmeasured factor would lead to
correlated errors in the Wage and the Work Characteristic equations. We could not
reject the null hypothesis of no correlation between the residuals and thus rely on
ordinary least square estimation.

Results of the equations in Figure 1 are presented in Tables 9a-c. The results are
summarized in Table 10, which decomposes the covariance between Mechanization and
Wage into its component paths, measured by their standardized regression coefficients.
Since the work characteristics are factor scores they are dimensionless variables by
construction and their variances are quite similar. The use of standardized coefficients
allows us to compare the effects of work characteristics alongside those of the control
variables (unstandardized coefficients suggest similar results).
Put Tables 9a-c and 10 here.
The central result is that in each of the three subsets we find a small but positive net
relationship between Mechanization and Wage. Our contribution is not the
identification of this relationship, however, but the ability of our model to decompose it
into its component relationships. Closer examination of these suggests some new
insights into mechanization’s influence on work.
Substantive Complexity, Technical Complexity and Cognitive Complexity are all
positively associated with both Mechanization and Wage. Consistent with the findings
above, higher levels of Mechanization are associated with higher levels of Complexity.
Since Complexity receives a positive wage return at the margin, the net effect of
increases in Mechanization through this dimension of work on wages is positive. We
will see that this robust effect, although small, outweighs the negative effects of other
dimensions of work.
The path through Motor Skills is positive in the total sample and the non-managerial
subsample — but not because of simple upgrading. Higher levels of Mechanization are
associated with lower motor skills, but work with lower Motor Skill content in turn has
higher wages than work with higher Motor Skill. Thus in the overall sample,
mechanization is associated with increases in productive capacity accompanied by lower

levels of Motor Skill. By contrast, for the non-management, non-professional
subsample, we find a more traditional result: a net loss in Wages due to loss of Motor
Skills. This supports the hypothesis of manual deskilling on which the deskilling
approach focuses. Manual deskilling in the overall economy is not borne out due to the
negative wage returns to manual skill in the managerial and professional occupations.
The Social Skills paths in the all-occupation and non-management subsets are
positive (the third occupational subset lacks a comparable dimension). More
mechanized environments place higher demands on Social Skills and these skills have
positive marginal returns. Unfortunately the DOT focuses primarily on cognitive
capabilities and physical competence. The measures loading on the Social Skills factor
(e.g., “Deal with People,” “People,” “Influence,” “Talk,” “Verbal”) do not tell much
about the nature of these social demands.
In each subset Mechanization is associated with Demanding Working Conditions
which in turn suffer a wage penalty in the labor market. The positive association of
Mechanization and Demanding Working Conditions is somewhat surprising; earlier we
suggested that this may be due to temporary disequilibria in the mechanization of jobs
with poor working conditions. The negative correlation with wages, net of other
components of skill, is also surprising; since we have controlled for manual and
cognitive skills, it does not reflect the association of poor working conditions with low-
skill jobs. It may instead be evidence of disequilibrium in the labor market for such
work: jobs with poorer working conditions are more likely to suffer frequent turnover
and to be filled by the unemployed and thus are more likely to have lower wages than
jobs with better conditions.
The Craftwork component in the all-occupation dataset has a net negative effect, as
mechanization reduces this positively-valued dimension of work. In the other two
subsets more “negative upgrading” is found. Although mechanization reduces the craft
content of work, there are negative marginal wage returns from Craftwork. The

negative return to Craftwork is surprising; both upgrading and deskilling theorists hold
up craft work as a exemplar of skilled work. One explanation is that since the
Craftwork factor holds constant the substantive complexity normally associated with
craft work, the creative and interpretive elements of craftwork are not themselves
rewarded in the labor market.
Having assessed the results of the narrow model of Figure 2, we expand our model
to include the controls as pathways between mechanization and wage (allowing a path
from Mechanization to Control in Figure 2). These findings reinforce the upgrading
hypothesis.
The first result is that the percentage of female workers is negatively associated with
both mechanization and wages. The former is not surprising, given cultural gender
norms on both the supply and demand side of the labor market. The latter is consistent
with research on gender bias in the labor market.
Second, industry profitability is negatively associated with mechanization. This
contradicts the conventional interpretation that the capital-labor ratio is associated with
higher productivity (and, thus, profits). This may signal the failure of Fordist (Sabel,
1982) strategies of mechanization. Alternatively, it may be that high levels of
mechanization are found in large “sunset” industries suffering from decline relative to
large sunrise industries. Third, it may also reflect short-run adjustments (e.g., that
profits are eroded by the high cost of new forms of mechanization).
Equally surprising is the wage penalty found in jobs in more profitable industries.
To the extent that this is an artifact of the fact that declining, older industries have both
lower profits and high-wage union contracts, it would be controlled for by
Unionization. A simpler explanation is that profitable industries are those which are
better able to control labor costs.
Third, Unionization is positively associated with both mechanization and wages, the
former due to industry effects and the latter to the influence of collective bargaining.

On net, the small but positive relationship between Mechanization and Wage is
robust against controls for unionization, gender composition and industry profitability.
DISCUSSION
Our market-based definition of skill as reflected in monetary returns distances our
analysis from some studies of skill. But it speaks to the heart of the skill debates: the
effect of mechanization on productive ability. Despite data difficulties that increased the
noise of our models, we found small, but consistent results that support the upgrading
thesis.
We do not wish to over-interpret the small positive correlation between
Mechanization and Wage. It is, instead, merely the jumping-off point of our analysis.
From there we adopted the mixed-effects assumption that manual skills decline, and
cognitive skills increase, with mechanization. And we extended this analysis by
assessing whether, and how, the upgrading and mixed-effects models were consistent.
We found that, in general, the gains brought by increases in positively valued
cognitive and social skills outweighed the losses from decreases — brought both by
losses of positively valued skills (e.g., manual skills) and by increases in negatively
valued skills (e.g., Craftwork).
Some of the detailed results caused us to reconsider some of the less debated
assumptions of existing theories. For one, we found that, controlling for the complexity
of work, craft work per se is negatively valued in the labor market. This challenges the
assumption that autonomy and control are themselves associated with productive
ability (cf. Spenner, 1979). For another, we found a unexpected form of deskilling
through working conditions: not only is Mechanization surprisingly associated with
Demanding Working Conditions, but the latter suffers a wage penalty. We suggested
some disequilibrium industry effects might be at the root of this finding.

Overall, however, we found a small but consistent upgrading effect. The more
detailed examinations of our results indicate that the deskilling argument is borne out in
the limited realm of blue-collar workers and manual skills; its extension to other areas
of work seems unwarranted. The mixed effects argument, while supported by our
initial explorations, appears incomplete. We have extended it through our path model
to accommodate the upgrading thesis: while some aspects of skill are reduced and some
are increased with increased mechanization, those that increase outweigh the others.
CONCLUSIONS
This study suffers from several limitations. It is cross-sectional, and so cannot measure
the change in particular occupations brought about by mechanization. The path model
may lack needed control variables. The DOT variables contain considerable noise and
do not adequately capture some of the constructs at issue in the mechanization and
work debate, such as “responsibility,” considered by many to be an important
characteristic of work that is upgraded by mechanization (Belitsky, 1978; Shaiken, 1984;
Hirschhorn, 1984; Adler, 1986).
Nonetheless, we have uncovered some surprising and suggestive results. Using
wages as a yardstick, jobs are upgraded in settings that are higher in both quantitative
and qualitative levels of mechanization. This finding holds for jobs within occupations in
all three major occupational subsets, including the non-management, non-professional
employees who are at the center of the mechanization and work debate. In addition, in
contrast to both the Braverman deskilling hypothesis and Blauner curvilinear
hypotheses, we find that upgrading accompanies increases in both assembly- and
process-intensity.
We have discussed limitations in data and methods that generated noise and
inefficiency in our analyses. We have attributed the weaknesses of our results to these
problems. An alternative attribution is the contextualist hypothesis, which argues that
the effects of mechanization on work are simply weak. Despite this, we discovered that
a cross-sectional view of the 1980 Census is consistent with several key corollaries of a
naive upgrading interpretation of the “mixed results” model: deskilling in the manual
and craft components of work is compensated for by upgrading in the cognitive, tech-
nical, substantive and social components.
While our methods do not allow us to decisively prove the upgraded mixed effects
model, our results suggest that more attention be paid to the gains, as well as the losses,
of skill to mechanization and to better methods for measuring and weighing the two. It
thus suggests to managers that they ignore the potential upgrading effects of
mechanization at their peril. Our analysis suggests to researchers that craft-based
yardsticks for studying work are inappropriate and offers a method for rescuing the
mixed effects model from its present agnosticism.

REFERENCES
Adler, Paul S.1986 “New Technologies, New Skills.” California Management Review. Fall: 9-28.
Attewell, Paul.1990 “What Is Skill?” Work and Occupations. 17:422-48
Belitsky, A. H.1978 New Technologies and Training in Metalworking. Wash., D.C.: National
Center for Productivity and Quality of Working Life.
Bell, Daniel1960 The End of Ideology. Glencoe, Ill.
Blauner, Robert1964 Alienation and Freedom: The Factory Worker and His Industry. Chicago, IL:
Univ. of Chicago Press
Braverman, Harry1974 Labor and Monopoly Capital. New York, NY: Monthly Review Press.
Bright, John R.1958 Automation and Management. Boston: Harvard University.
Cain, Pamela S. and Donald J. Treiman1981 “The “Dictionary of Occupational Titles” as a Source of Occupational Data.”
American Sociological Review. 46:253-278.
Crossman, E. R. W. F., et al.1966 “Evaluation of Change in Skill-Profile and Job Content Due to Technological
Change.” Working Paper. University of California, Dept. of IndustrialEngineering and Operations Research.

Edwards, Richard1979 Contested Terrain. New York, NY: Basic Books.
Elbaum, Bernard1984 “The Making and Shaping of Job and Pay Structures in the Iron and Steel
Industry.” in Paul Osterman, ed., Internal Labor Markets. Cambridge, Mass:MIT Press.
Form, William, Robert L. Kaufman, Toby L. Parcel, and Michael Wallace.1988 “The Impact of Technology and Work Organization and Work Outcomes.” In
George Farkas and Paula England, eds., Industries, Firms, and Jobs. NewYork, NY: Plenum Press.
Friedman, Andrew L.1977 Industry and Labor. London: Macmillan.
Hazlehurst, R.J., R. J. Bradbury and E. N. Corlett1969 “A Comparison of the Skills of Machinists on Numerically-Controlled and
Conventional Machines.” Occupational Psychology. 43:169-182.
Hirschhorn, Larry1984 Beyond Mechanization. Cambridge, Mass.: MIT Press.
Hodson, Randy and Paula England1986 “Industrial Structure and Sex Differences in Earnings,” Industrial Relations.
25:16-32.
Hull, F.M., N.S. Friedman, and T.F. Rodgers1982 “The Effect of Technology on Alienation from Work.” Sociology of Work and
Occupations. 9:31-57.
Hunt, H.A. and T.L Hunt1983 Human Resource Implications of Robotics. Kalamazoo.: W.E. Upjohn
Institute for Employment Research.
Kelley, Maryellen R.

1986 “Programmable Automation and the Skill Question.” Human SystemsManagement. 6:223-241.
MacKenzie, D. and J. Wajcman, eds.1985 The Social Shaping of Technology. Stratford, U.K.: Open University Press.
Maurice, M. F. Sellier, and J.-J. Silvestre1986 The Social Foundations of Industrial Power. Cambridge, Mass.: MIT Press.
Miller, Ann R., Donald J. Treiman, Pamela S. Cain, and Patricia A. Roos, eds.1980 Work, Jobs, and Occupations: A Critical Review of the Dictionary of
Occupational Titles. Washington, D.C.: National Academy Press.
Mueller, Eva, et al.1969 Technological Advance in an Expanding Economy. Ann Arbor, Mich.:
Institute for Social Research.
Noble, David F.1984 Forces of Production: A Social History of Industrial Automation. New York,
NY: Knopf.
Parcel, Toby L. and Charles W. Mueller1983 “Occupational Differentiation, Prestige, and Socioeconomic Status.” Work and
Occupations. 10:49-80.
Ray, Carol Axtell1989 “Skill Reconsidered: The Deskilling and Reskilling of Managers.” Work and
Occupations. 16:65-79.
Roos, Patricia A. and June Price1981 “Codebook: Fourth Edition Dictionary of Occupational Titles.” Committee on
Occupational Classification and Analysis. National Academy of Science.
Sabel, Charles F.1982 Work and Politics: The Division of Labor in Industry. New York, NY:
Cambridge University Press.

Shaiken, Harley1984 Work Transformed. New York, NY: Holt, Rinehart and Winston.
Sorge, Arndt and Wolfgang Streeck1988 “Industrial Relations and Technical Change: The Case for an Extended
Perspective,” in Richard Hyman and Wolfgang Streeck, eds., NewTechnology and Industrial Relations. Oxford: Basil Blackwell.
Spenner, Kenneth I.1979 “Temporal Changes in Work Content,” American Sociological Review.
44:968-975.
Spenner, Kenneth I.1988 “Technological Change, Skill Requirements and Education: The Case for
Uncertainty.” in Richard M. Cyert and David C. Mowery, eds., The Impact ofTechnological Change on Employment and Economic Growth. Cambridge,Mass.: Ballinger.
Spenner, Kenneth I.1990 “Skill: Meanings, Methods, and Measures.” Work and Occupations. 17:399-
421.
Strategic Planning Institute1978 PIMS Data Manual. Cambridge, Mass.: Strategic Planning Institute.
U.S. Bureau of Census1980 1980 Census of Population: Classified Index of Industries and Occupations.
Washington, DC: Government Printing Office.
U.S. Bureau of Census1984 Census of Population 1980: Occupation by Industry. Washington, DC. Bureau
of Census data tape and codebook.
U.S. Department of Commerce, Bureau of Economic Analysis

1987 Fixed Reproducible Tangible Wealth in the United States, 1925--85.Washington, DC: U.S. Government Printing Office.
U.S. Department of Labor1977 Dictionary of Occupational Titles. Washington, D.C.: U.S. Government
Printing Office.
Vallas, Steven Peter1990 “The Concept of Skill: A Critical Review.” Work and Occupations. 17:379-398.
Woodward, Joan1965 Industry Organization: Theory and Practice. London: Oxford University
Press.
Zuboff, Shoshana1988 In the Age of the Smart Machine. Oxford: Heinemann Professional.

Table 1:
DOT Variables
Description and scaleName (counter-intuitive coding schemes are reversed) Mean S.D.
Data Complexity of functioning with data. 3.2 1.5Scale: 0 (comparing) to 6 (synthesizing)
People Complexity of functioning with people. 6.3 1.50 (taking instructions, helping) to 8 (mentoring)
Things Complexity of functioning with things. 4.1 1.90 (handling) to 7 (setting-up)
GED General Educational Development.1 to 6: composite scale of reasoning, math, and 3.7 0.9language development.
SVP Specific Vocational Preparation. 5.4 1.51 to 9: scale of time required to learn the job
Aptitudes: Capacities or abilities required to learn some task or job duty.Occupation ranked by quintile (1 to 5)
Intell Intelligence 2.8 0.7Verbal Verbal 3.0 0.7Numeric Numerical 3.2 0.7Spatial Spatial 3.3 0.6Form Form perception 3.2 0.6Clerical Clerical perception 3.5 0.6Motor Motor coordination 3.4 0.4Fingdex Finger dexterity 3.4 0.5Mandex Manual dexterity 3.2 0.5Eye/Hand Eye, hand, foot coordination 4.5 0.6Color Color discrimination 4.3 0.5

Interests: Percent of workers whose job requires preference for activities...Idata concerning the communication of data 19.9 29.2Iscience of a scientific and technical nature 15.0 28.2Icreate of an abstract and creative nature 4.7 15.3Iprod resulting in tangible productive satisfaction 15.8 24.9Ithing dealing with things and objects 51.6 36.3Ibusiness involving business contact with people 26.0 32.0Iroutine of a routine, concrete, organized nature 38.0 34.2Ipeople involving working for the presumed good 7.2 21.0
of peopleIprestige resulting in prestige or the esteem of others 15.7 24.1
Polar interests: Interests that are entailed in job performance.Scored on scale from -1 to 1: 1=first interest is relevant; -1=second interest is relevant; 0=dimension is irrelevant.
Data/Thing Preference for working with data or things. -0.3 0.6Create/Rout Preference for abstract, creative work vs. -0.3 0.4
routine, concrete, organized work.Mach/People Preference for working with machines vs. 0.5 0.5
working for the presumed good of people.Product/Prest Preference for activities resulting in tangible 0.0 0.4
production vs those resulting in prestige.
Temperaments: Percent of workers whose job requires the adaptability...Direct for the direction, control, or planning of 18.8 25.9
an activity.Interpret to situations involving the interpretation of 2.8 12.3
feelings, ideas or facts.Influence to influencing people. 9.4 20.1Judge to making decisions based on sensory or 30.5 31.0
judgmental criteria.Measure to making decisions based on measurable or 46.0 34.0
verifiable criteria.Dealw/people to dealing with people beyond giving or 35.8 36.5
receiving instructions.Repeat to performing repetitive work or to 25.9 29.2
continuously performing the same work.Stress to performing under stress. 5.7 17.0Standard to situations requiring the attainment of 52.6 35.0
set limits, tolerances or standards.Variety to performing a variety of duties, often 34.5 28.8
changing from one task to another.
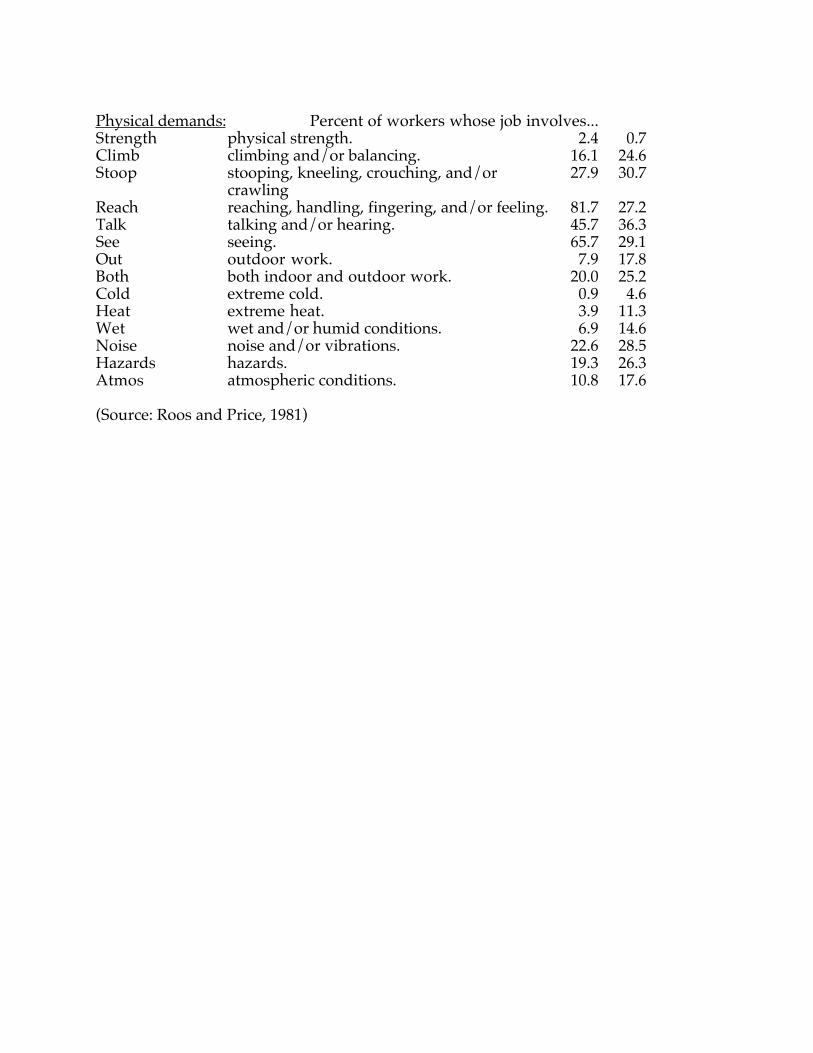
Physical demands: Percent of workers whose job involves...Strength physical strength. 2.4 0.7Climb climbing and/or balancing. 16.1 24.6Stoop stooping, kneeling, crouching, and/or 27.9 30.7
crawlingReach reaching, handling, fingering, and/or feeling. 81.7 27.2Talk talking and/or hearing. 45.7 36.3See seeing. 65.7 29.1Out outdoor work. 7.9 17.8Both both indoor and outdoor work. 20.0 25.2Cold extreme cold. 0.9 4.6Heat extreme heat. 3.9 11.3Wet wet and/or humid conditions. 6.9 14.6Noise noise and/or vibrations. 22.6 28.5Hazards hazards. 19.3 26.3Atmos atmospheric conditions. 10.8 17.6
(Source: Roos and Price, 1981)

Table 2:
Measures of Process Type Intensity
Load on Two Factors
Factor 1 Factor 2PIMS variable Volume Process
Large batch/assembly .92 -.31
Small batch -.86 -.53
Continuous process -.02 .98
Proportion of commonvariance explained .54 .46

Table 3:
Quantitative and Qualitative Indices of Mechanization by Industry
Quantitative index is capital-labor ratio (K/L) calculated for 2-digit SIC industries. Unitsare thousands of dollars per worker.
Qualitative indices are factor scores for 3-digit SIC industries in the PIMS sample.“Volume” contrasts assembly- and small batch-intensive processes; “Process” contrastsprocess- and small batch-intensive processes.
Industry K/L Volume Process
Petroleum 133.4
Chemicals 77.9Drugs 1.60 -0.69Soaps -0.16 0.38Paints 0.56 -0.28Agricultural chemicals 0.61 2.27Industrial chemicals -0.43 3.47
Paper products 77.6Paper pulp -0.55 5.21Misc. paper products 1.30 -0.19Paper containers 1.45 -0.56
Primary metals 70.6Steel mills 0.11 0.14Foundries -1.29 -0.94Primary aluminum 0.66 -0.66Other primary metals -0.87 0.52Forgings 1.13 -0.73
Glass, cement and stone 50.0Glass 0.11 3.53Cement -0.37 4.47Misc. stone products -0.67 0.40
Tobacco 47.4

Food Processing 40.7Canned vegetables 0.73 0.67Milled grains 0.65 1.06Bakeries 1.47 -0.23Beverages 1.23 0.44Misc. food 0.61 2.27
Rubber and plastics 39.6Plastics materials and synthetics 0.25 1.33Misc. plastics 0.73 0.24Rubber products 0.81 1.29
Fabricated metals 38.5Hardware 0.47 -0.57Fabricated structural metals -0.88 0.48Screw machinery products 1.23 0.12Misc. fabricated metals -0.02 1.60
Transportation equipment33.2Aircraft -1.86 -0.86
Lumber and wood products27.1Misc. wood products 0.38 2.86
Textiles 24.7Floor coverings 0.10 0.23Fabrics 0.97 .47Misc. textiles 0.40 2.25
Machinery, except electrical22.8Engines 0.42 -0.74Farm machinery 1.49 -0.70Construction machinery-2.12 -0.72Metalworking machinery -1.11 -0.89Office and computing equipment -1.17 0.15Non-electrical machinery, nec -2.20 -0.78
Electrical machinery 21.0Household appliances 1.43 -.70Radio/TV equipment -0.77 -0.29Electrical industrial machinery 0.06 -0.69
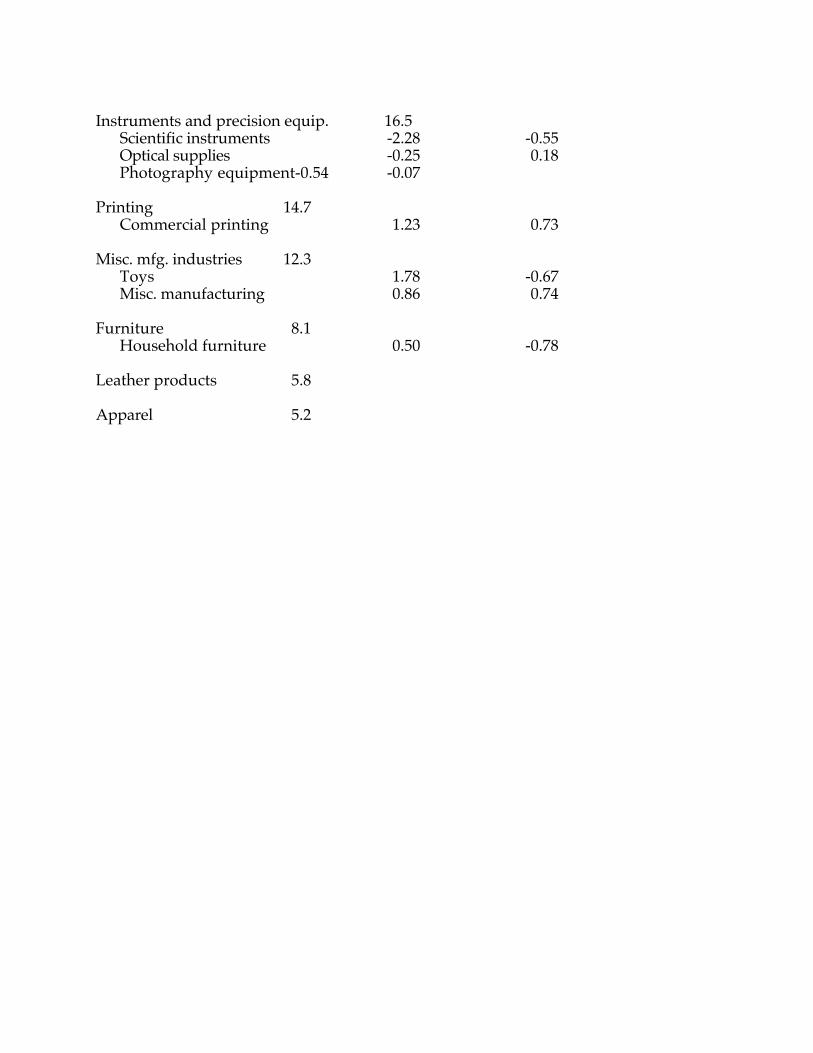
Instruments and precision equip. 16.5Scientific instruments -2.28 -0.55Optical supplies -0.25 0.18Photography equipment-0.54 -0.07
Printing 14.7Commercial printing 1.23 0.73
Misc. mfg. industries 12.3Toys 1.78 -0.67Misc. manufacturing 0.86 0.74
Furniture 8.1Household furniture 0.50 -0.78
Leather products 5.8
Apparel 5.2

Table 3bDescriptions of mechanization indices
Variable Mean Standard Dev.K/L 41.5 22.7Volume .16 1.0Process .49 1.5
Table 3cCorrelations among the mechanization indices
K/L Volume Process
K/L 1.00
Volume .124 1.00
Process .246 -.005 1.00

Table 4:
Factor Structure
(all occupations)Percent of common variance accounted for by each factor is shown in parentheses.Only loadings of .40 or higher are shown. Method: oblique rotation (ROTATE =PROMAX in SAS).
Factor 1: Substantive complexity (32%)Data .97 SVP .96 GED .95 Intell .90Create/Rout .89 Verbal .88 Iroutine -.88 Repeat -.87Numerical .87 Direct .80 People .75 Talk .69Ithing -.68 Variety .67 Measure .65 Clerical .61Iscience .61 Spatial .58 Iprestige .57 Strength -.49
Factor 2: Motor skills (16%)Things .89 Motor .84 Fingdex .83 See .82Standards .81 Mandex .75 Form .67 Prod/Prestige .62Reach .61 Influence -.49 Mach/People .49 Iproduct .49
Factor 3: Social skills (25%)Data/Thing .93 Ibusiness .92 Idata .90 Dealw/peo .89Ithing -.82 Talk .79 Imachine -.78 Judge .75People .67 Verbal .61 Influence .57
Factor 4: Demanding Working conditions (19%)Climb .86 Stoop .86 Strength .84 Physical .77Hazard .76 Atmos .61 Noise .66 Clerical -.63
Factor 5: Craftwork (8%)Prod/Prestige .66 Icreate .60 Iprestige -.57 Color .52Interpret .45 People -.42
Inter-factor correlationsFactor 1 Factor 2 Factor 3 Factor 4 Factor 5
Factor 1 1.00
Factor 2 .00 1.00
Factor 3 -.36 -.27 1.00
Factor 4 -.26 -.16 .38 1.00
Factor 5 -.09 -.27 .19 .04 1.00

Table 5:
Factor Structure
(non-managerial occupations)
Percent of common variance accounted for by each factor is shown in parentheses.Only loadings of .40 or higher are shown. Method: oblique rotationFactor 1: Substantive complexity (30%)GED .96 Data .94 SVP .93 Numerical .92Intell .91 Verbal .86 Create/Rout .82 Iroutine -.80Repeat -.80 Iscience .80 Direct .80 Spatial .69Measure .67 Form .64 People .61 Variety .60Clerical .58
Factor 2: Social skills (28%)Data/Thing .96 Dealw/people .94 Idata .93 Ibusiness .92Talk .87 Ithing -.87 People .81 Judge .79Mach/People -.72 Verbal .71 Clerical .68 Intell .63
Factor 3: Motor skills (16%)Things .87 Standards .81 Fingdex .80 Motor .80See .76 Form .72 Mandex .72 Prod/Prestige .61Influence -.52
Factor 4: Demanding Working conditions (18%)Climb .88 Stoop .88 Strength .80 Physical .80Hazard .78 Noise .62 Atmos .60 Clerical -.54Both .54 Wet .52 Iproduct .50
Factor 5: Craftwork (8%)Iproduct .72 Interpret .62 Create/Rout .60 Prod/Prestige .55
Inter-factor correlationsFactor 1 Factor 2 Factor 3 Factor 4 Factor 5
Factor 1 1.00
Factor 2 .38 1.00
Factor 3 .22 -.13 1.00
Factor 4 -.19 -.38 .17 1.00
Factor 5 .16 .02 .18 .27 1.00

Table 6:
Factor Structure
(non-managerial, non-professional occupations)Percent of common variance accounted for by each factor is shown in parentheses.Only loadings of .40 or higher are shown. Method: oblique rotation(ROTATE=PROMAX in SAS).
Factor 1: Cognitive complexity (30%)Data/Thing .95 Dealw/peo .91 Idata .91 Talk .91Ibusiness .90 Ithing -.89 Verbal .86 People .85Judge .82 Intell .77 Clerical .72 Repeat -.70Iroutine -.61 Mach/People -.62 Create/Rout .60 Strength -.56Variety .50 SVP .51
Factor 2: Technical complexity (23%)GED .87 SVP .86 Data .86 Numerical .81Repeat -.76 Intell .76 Iroutine -.70 Iscience .69Measure .69 Direct .66 Icreate .55 Spatial .55
Factor 3: Motor skills (18%)Standards .85 See .84 Things .84 Fingdex .81Motor .80 Form .80 Mandex .60 Influence -.56
Factor 4: Demanding Working conditions (15%)Climb .88 Stoop .85 Hazard .81 Physical .81Strength .75 Both .62 Atmos .58 Noise .54Heat .52
Factor 5: Craftwork (14%)Prod/Prestige .86 Iproduct .86 Mandex .65 Spatial .65Noise .57 Clerical -.54 Physical .52 Things .50
Inter-factor correlationsFactor 1 Factor 2 Factor 3 Factor 4 Factor 5
Factor 1 1.00
Factor 2 .39 1.00
Factor 3 .07 .38 1.00
Factor 4 -.29 -.01 .07 1.00
Factor 5 -.18 .13 .27 .45 1.00

Table 7a:
Correlations between Mechanization and Work
(all occupations)
Mechanization: Ln (K/L).N=8940Correlations in boldface are significant at the .05 level.
DemandingSubst comp .10 Motor skill - .10 Social skills .04 Wkg conds .13 Craftwork -.05 Data .11 Things -.09 Data/Thing .06 Climb .17 Prod/Prestige -.06SVP .09 Motor -.08 Ibusiness .04 Stoop .16 Icreate -.00GED .11 Fingdex -.20 Idata .01 Strength .13 Iprestige .05Intell .13 See -.10 Dealw/peo .05 Physical .05 Color -.09Creat/Rou .12 Standards -.10 Ithing -.08 Hazard .16 Interpret -.07Verbal .08 Mandex -.01 Talk .09 Atmos .17 People .09Iroutine -.13 Form -.08 Imachine -.08 Noise -.07Repeat -.13 Prod/Prestige-.06 Judge .05 Clerical .13Numerical .12 Reach -.04 People .09Direct .08 Influence -.00 Verbal .08People .09 Mach/People -.08 Influence -.00Talk .09Ithing -.08Variety .10Measure .11Clerical .13Iscience .09Spatial .02Iprestige .05Strength .13

Table 7b:
Correlations between Mechanization and Work(non-management occupations)
Mechanization: Ln(K/L).
N=8060Correlations in boldface are significant at the .05 level.
DemandingSubst comp .10 Social skills .06 Motor skills - .08 Wkg conds .17 Craftwork -.10 GED .11 Data/Thing .05 Things -.09 Climb .18 Iproduct -.04Data .10 Dealw/peo .03 Standards -.10 Stoop .18 Interpret -.08SVP .08 Idata .02 Fingdex -.21 Strength .16 Create/RoutT .11Numerical .12 Ibusiness .02 Motor -.07 Physical .09 Prod/Prestige -.05Intell .13 Talk .08 See -.10 Hazard .17Verbal .08 Ithing -.08 Form -.09 Noise -.07Creat/Rou .11 People .09 Mandex .01 Atmos .18Iroutine -.13 Judge .04 Prod/Prest -.05 Clerical .13Repeat -.13 Mach/People -.10 Influence .00 Both .18Iscience .09 Verbal .08 Wet .09Direct .06 Clerical .13 Iproduct -.04Spatial .02 Intell .13Measure .10Form -.09People .09Variety .09Clerical .13

Table 7c:
Correlations between Mechanization and Work(non-management, non-professional occupations)
Mechanization: Ln(K/L).N=5940Correlations in boldface are significant at the .05 level.
DemandingCog comp .08 Tech comp .11 Motor skills - .08 Wkg conds .23 Craftwork -.07 Data/Thg .08 GED .11 Standards -.13 Climb .19 Prod/Prest -.05Deal peo .05 SVP .08 See -.11 Stoop .20 Iproduct -.02Idata .05 Data .12 Things -.12 Hazard .18 Mandex .00Talk .10 Numerical .11 Fingdex -.23 Physical .10 Spatial .00Ibusiness .04 Repeat -.14 Motor -.08 Strength .17 Noise -.07Ithing -.09 Intell .15 Form -.11 Both .19 Clerical .13Verbal .08 Iroutine -.14 Mandex .00 Atmos .18 Physical .10People .11 Iscience .07 Influence .02 Noise -.07 Things -.12Judge .06 Measure .08 Heat .10Intell .15 Direct .07Clerical .13 Icreate .03Repeat -.14 Spatial .00Iroutine -.14Mach/Peo -.12Creat/Rou .13Strength .17Variety .08SVP .08
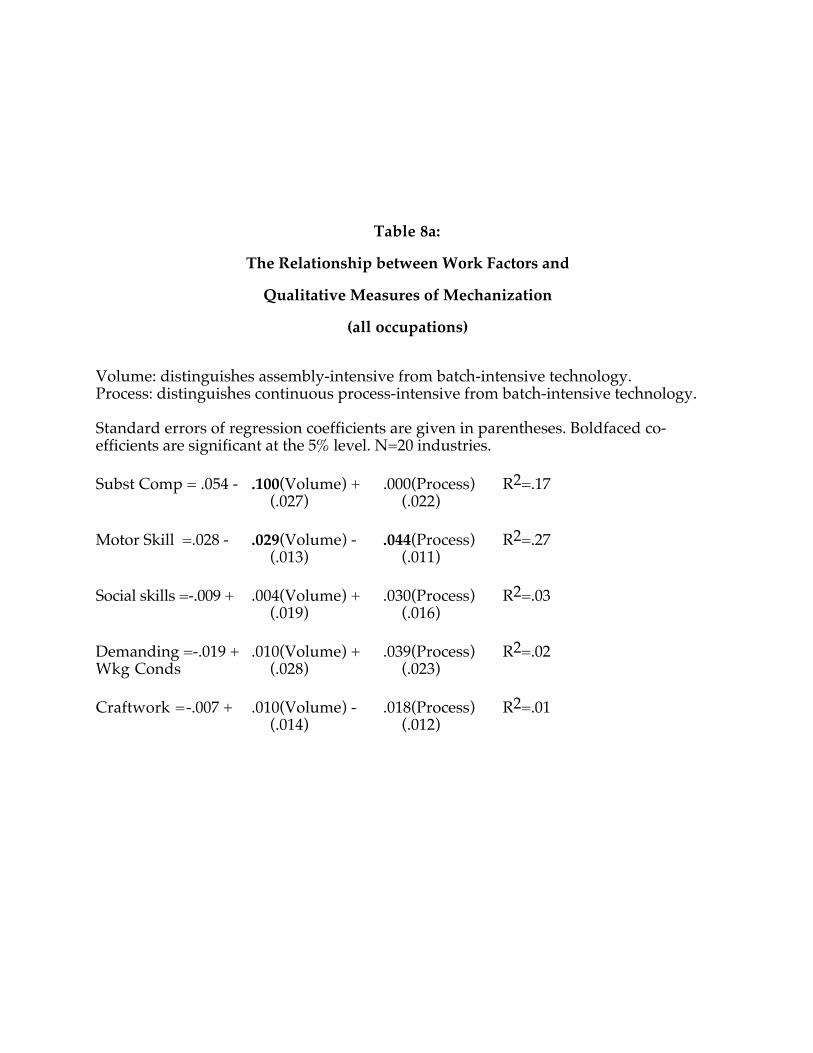
Table 8a:
The Relationship between Work Factors and
Qualitative Measures of Mechanization
(all occupations)
Volume: distinguishes assembly-intensive from batch-intensive technology.Process: distinguishes continuous process-intensive from batch-intensive technology.
Standard errors of regression coefficients are given in parentheses. Boldfaced co-efficients are significant at the 5% level. N=20 industries.
Subst Comp = .054 - .100(Volume) + .000(Process) R2=.17(.027) (.022)
Motor Skill =.028 - .029(Volume) - .044(Process) R2=.27(.013) (.011)
Social skills =-.009 + .004(Volume) + .030(Process) R2=.03(.019) (.016)
Demanding =-.019 + .010(Volume) + .039(Process) R2=.02Wkg Conds (.028) (.023)
Craftwork =-.007 + .010(Volume) - .018(Process) R2=.01(.014) (.012)
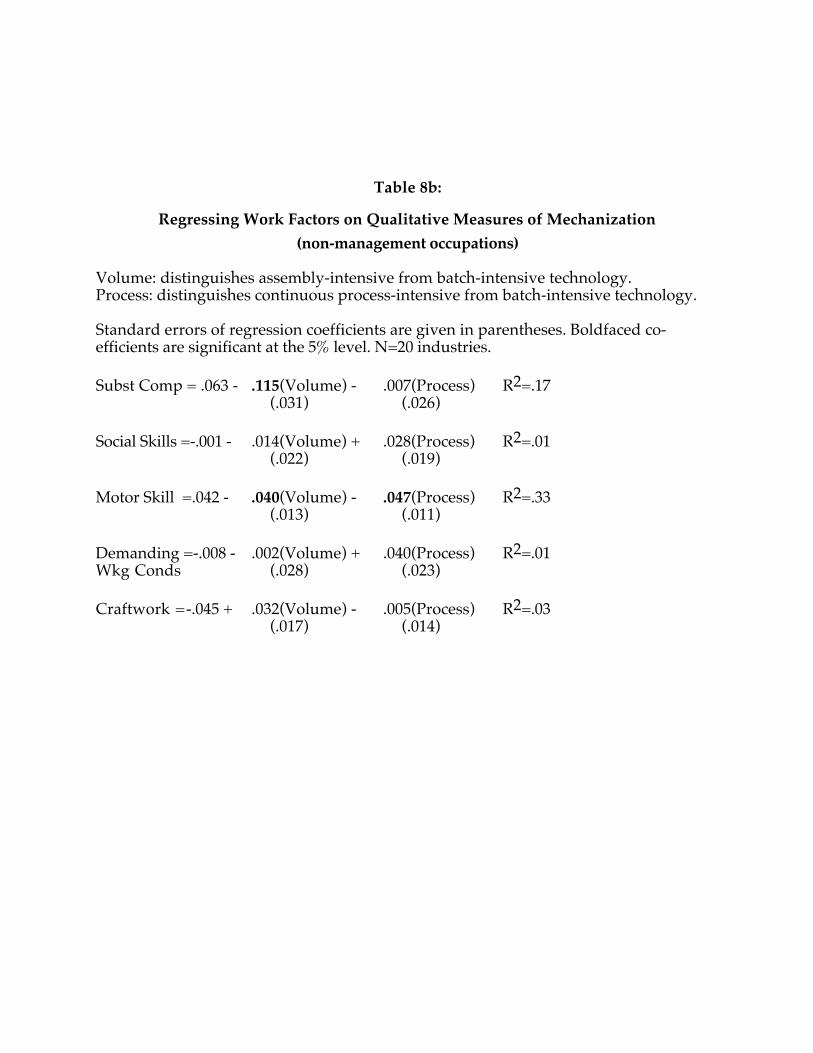
Table 8b:
Regressing Work Factors on Qualitative Measures of Mechanization(non-management occupations)
Volume: distinguishes assembly-intensive from batch-intensive technology.Process: distinguishes continuous process-intensive from batch-intensive technology.
Standard errors of regression coefficients are given in parentheses. Boldfaced co-efficients are significant at the 5% level. N=20 industries.
Subst Comp = .063 - .115(Volume) - .007(Process) R2=.17(.031) (.026)
Social Skills =-.001 - .014(Volume) + .028(Process) R2=.01(.022) (.019)
Motor Skill =.042 - .040(Volume) - .047(Process) R2=.33(.013) (.011)
Demanding =-.008 - .002(Volume) + .040(Process) R2=.01Wkg Conds (.028) (.023)
Craftwork =-.045 + .032(Volume) - .005(Process) R2=.03(.017) (.014)

Table 8c:
Regressing Work Factors on Qualitative Measures of Mechanization
(non-management, non-professional occupations)
Volume: distinguishes assembly-intensive from batch-intensive technology.Process: distinguishes continuous process-intensive from batch-intensive technology.
Standard errors of regression coefficients are given in parentheses. Boldfaced co-efficients are significant at the 5% level. N=20 industries.
Cog Comp = -.058 + .065(Volume) - .018(Process) R2=.09(.023) (.019)
Tech Comp =-.021 + .034(Volume) + .054(Process) R2=.31(.014) (.012)
Motor Skill =.015 + .012(Volume) - .035(Process) R2=.02(.024) (.020)
Demanding =.007 - .034(Volume) - .017(Process) R2=.10Wkg Conds (.014) (.012)
Craftwork = .063 - .024(Volume) - .049(Process) R2=.18(.017) (.014)
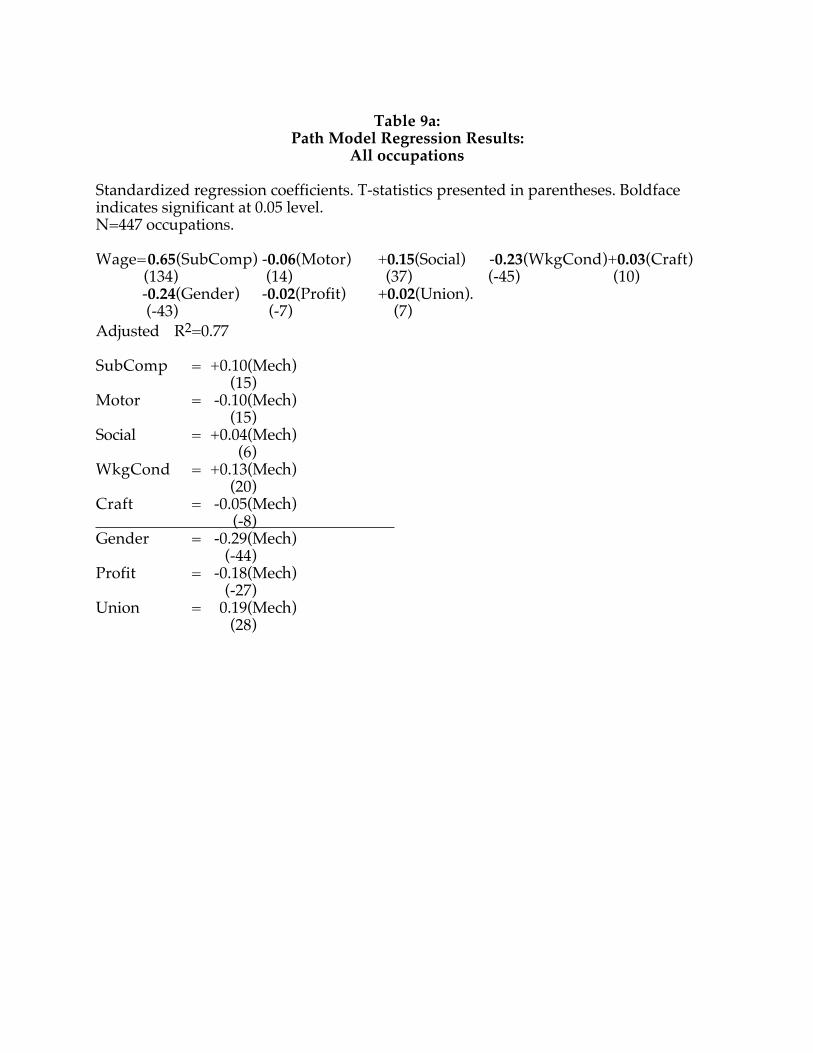
Table 9a:Path Model Regression Results:
All occupations
Standardized regression coefficients. T-statistics presented in parentheses. Boldfaceindicates significant at 0.05 level.N=447 occupations.
Wage=0.65(SubComp) -0.06(Motor) +0.15(Social) -0.23(WkgCond)+0.03(Craft)(134) (14) (37) (-45) (10)-0.24(Gender) -0.02(Profit) +0.02(Union).(-43) (-7) (7)
Adjusted R2=0.77
SubComp = +0.10(Mech)(15)
Motor = -0.10(Mech)(15)
Social = +0.04(Mech)(6)
WkgCond = +0.13(Mech)(20)
Craft = -0.05(Mech) (-8) Gender = -0.29(Mech)
(-44)Profit = -0.18(Mech)
(-27)Union = 0.19(Mech)
(28)

Table 9b:Path Model Regression Results:Non-management occupations
Standardized regression coefficients. T-statistics presented in parentheses. Boldfaceindicates significant at 0.05 level.N=403 occupations.
Wage = 0.65(SubComp) +0.23(Social) -0.02(Motor) -0.17(WkgCond) -0.05(Craft)(115) (51) (4) (-29) (-13)
-0.27(Gender) -0.02(Profit) +0.03(Union).(-42) (-6) (7)
AdjustedR2=0.74
SubComp = +0.11(Mech)(15)
Social = +0.05(Mech)(8)
Motor = -0.08(Mech)(12)
WkgCond = +0.17(Mech)(25)
Craft = -0.10(Mech) (-14) Gender = -0.30(Mech)
(-44)Profit = -0.18(Mech)
(-25)Union = 0.19(Mech)
(27)

Table 9c:Path Model Regression Results:
Non-management, non-professional occupations
Standardized regression coefficients. T-statistics presented in parentheses. Boldfaceindicates significant at 0.05 level.N=297 occupations.
Wage=0.60(CogComp)+0.16(TecCom) +0.18(Motor) -0.23(WkgCond)(108) (23) (26) (-33)0.02(Craft) -0.46(Gender) -0.02(Profit) -0.04(Union).(-3) (-55) (-4) (8)
Adjusted R2=0.62
CogComp = +0.09(Mech)(12)
TechComp = +0.11(Mech)(13)
Motor = -0.08(Mech)(11)
WkgCond = +0.20(Mech)(27)
Craft = -0.07(Mech)(-9)
Gender = -0.30(Mech)(-41)
Profit = -0.17(Mech)(-22)
Union = 0.19(Mech)(26)

Table 10:
Decomposition of Variance between Mechanization and Wages
(standardized regression coefficients)
All occupations
(1) From (2) To TotalWork Characteristic Mech Wage (1)x(2)Substantive Complexity 0.10 0.65 0.065Motor Skill -0.10 -0.06 0.006Social Skills 0.04 0.15 0.006Working Conditions 0.13 -0.23 -0.030Craftwork -0.05 0.03 -0.002
Total covariance 0.045Control Gender -0.29 -0.24 0.070Profitability -0.18 -0.02 0.004Unionization 0.19 0.02 0.004
Total covariancewith controls: 0.123
Non-management occupations
(1) From (2) To TotalWork Characteristic Mech Wage (1)x(2)Substantive Complexity 0.11 0.065 0.072Social Skills 0.05 0.23 0.012Motor Skill -0.08 -0.02 0.001Working Conditions 0.17 -0.17 -0.029Craftwork -0.10 -0.05 0.005
Total covariance 0.061Control Gender -0.30 -0.27 0.081Profitability -0.18 -0.02 0.004Unionization 0.19 0.03 0.006
Total covariancewith controls: 0.152

Table 10:
Decomposition of Variance between Mechanization and Wages
(standardized regression coefficients)
Non-management non-professional occupations
(1) From (2) To TotalWork Characteristic Mech Wage (1)x(2)Cognitive Complexity! 0.09 0.60 0.054Technical Complexity 0.11 0.16 0.018Motor Skill -0.08 0.18 -0.014Working Conditions 0.20 -0.23 -0.046Craftwork -0.07 -0.02 0.001
Total covariance 0.013Control Gender -0.30 -0.46 0.138Profitability -0.17 -0.02 0.003Unionization 0.19 0.04 0.008
Total covariancewith controls: 0.162

Figure 1Data Matrix
Occ
upat
ions
(em
ploy
ees)
Occ
upat
ion
j
Mec
hani
zatio
nPr
ofita
bilit
yU
nion
izat
ion
Indu
strie
s
i
Occ
upat
iona
l wag
e
sex
com
posi
tion
Pro
cess
type
Indu
stry
DO
T ch
arac
teris
tics
for
occu
patio
n i (
%)
char
acte
ristic
k
ni,j
i k
DOT
k
Occ
upat
ion'
s
Occ
upat
ion'
sDO
Tch
arac
teris
tics
(%)
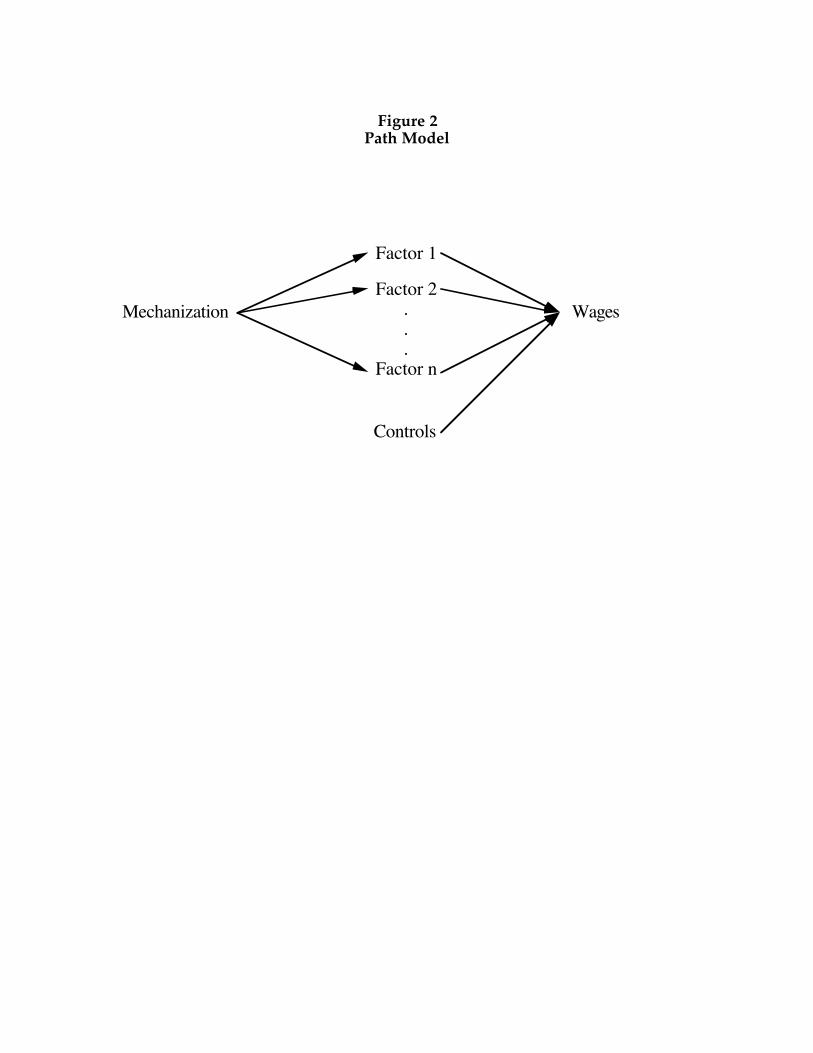
Figure 2Path Model
Mechanization
Factor 1
Factor 2...
Factor n
Wages
Controls