a postmortem study of otters (lutra lutra) in england and
TRANSCRIPT

A Postmortem Study of Otters (Lutra lutra) in England and
Wales
R&D Technical Report W1-019/TR
A Postmortem Study of Otters (Lutra lutra) in England and Wales R & D Technical Report W1-019/TR Dr A V Bradshaw & Dr F M Slater Research Contractor: Cardiff School of Biosciences, Cardiff Universiy

R&D TECHNICAL REPORT W1-019/TR
Publishing Organisation Environment Agency, Rio House, Waterside Drive, Aztec West, Almondsbury, BRISTOL, BS32 4UD. Tel: 01454 624400 Fax: 01454 624409 Website: www.environment-agency.gov.uk © Environment Agency 2002 ISBN: 1 85705 874 71 All rights reserved. No part of this document may be reproduced, stored in a retrieval system, or transmitted, in any form or by any means, electronic, mechanical, photocopying, recording or otherwise without the prior permission of the Environment Agency. The views expressed in this document are not necessarily those of the Environment Agency. Its officers, servants or agents accept no liability whatsoever for any loss or damage arising from the interpretation or use of the information, or reliance upon views contained herein. Dissemination Status Internal: Released to Regions External: Released to Public Domain Statement of Use This report has been produced for use by the Environment Agency Conservation and Environmental Protection staff and external interested parties. The report is intended as a baseline statement of the health status and chemical burden of otters in England and Wales as part of the Agency’s contribution to the UK otter BAP. Keywords Otter, postmortem, road traffic accidents, pesticides, organochlorines, PCB’s (polychlorinated biphenyls), DDT, pathology. Research Contractor This document was produced under R&D Project W1-019 by: Cardiff School of Biosciences, Cardiff University, Llysdinam Field Centre, Newbridge-on-Wye, Llandrindod Wells, LD1 6NB Tel: 01597 860308 Fax: 01597 860381 Environment Agency’s Project Manager The Environment Agency’s Project Manager for R&D Project W1-019 was: Andrew Crawford – Environment Agency, Midlands Region
Further copies of this report are available from: Environment Agency R&D Dissemination Centre, c/o WRc, Frankland Road, Swindon, Wilts SN5 8YF tel: 01793-865000 fax: 01793-514562 e-mail: [email protected]

R&D TECHNICAL REPORT W1-019/TR
ii
CONTENTS EXECUTIVE SUMMARY iii SUMMARY OF MAIN FINDINGS iv ACKNOWLEDGEMENTS v 1. INTRODUCTION 1 1.1 Description of the sample analysed in this report 3 2. MATERIALS AND METHODS 5 2.1 Necropsy Procedure 5 2.2 Laboratory Analysis 6 2.3 Statistical Analysis 6 3. RESULTS OF NECROPSY 7 3.1 Frequency and Distribution of Road Death 7 3.2 Summary of gross examination 11 3.3 Health Indicators and Classification of Disease 14 4. RESULTS OF CHEMICAL ANALYSIS 19 4.1 Geographical distribution, age structure and condition of the sample 19 4.2 The burden of pollutants in the liver and intercorrelation between 20
individual toxicants 4.3 Toxicant burdens in age / sex groups. 22 4.4 Contamination in relation to health indicating factors 22 4.5 Toxicant burdens in different geographical areas 24 4.6 Changes in toxicant burden over the study period 26 5 ANALYSES AND DISCUSSION 28 5.1 General 28 5.2 Sample biases and constraints 28 5.3 Trends in mortality 29 5.4 Condition, adrenal weight and adrenal factor 30 5.5 Other gross observations 31 5.6 Analytical considerations 32 5.7 Comparative studies and critical levels 33 5.8 Chemical burdens, sex and age 34 5.9 Chemical burdens and health-indicating factors 36 5.10 Geographical variation in chemical burdens 36 5.11 Changes in chemical burdens over the study period 36 6 RECOMMENDATIONS 37 7 REFERENCES 38 GLOSSARY 42 APPENDIX I – POSTRMORTEM RECORD SHEET 43 APPENDIX II – EXPLANANTION OF THE BOXPLOT 45 APPENDIX III – REGIONAL BREAKDOWN 46 Table 1.1 A summary of events significant in the decline and recovery of the otter 2 in Britain Table 1.2 Details of the data sets included in this study 4 Table 3.1 Summary of basic records obtained (Studies I & II) 7 Table 3.2 Time scale over which otters were collected in each region 7 Table 3.3 Summary of information retrieved for each animal prior to dissection 11 (N = 401)

(N = 401) Table 3.4 Summary of necropsy findings 11 Table 3.5 A summary of values calculated for condition factor, adrenal weight 14 and adrenal factor Table 3.6 Correlation data (Spearman Rank) for health factors. 14 Table 4.1 Numbers of otters included in the chemical analysis sub-sample 20 compared to the whole sample Table 4.2 Health factors determined for the chemical analysis sub-sample 20 compared to the whole sample. Table 4.3 Summary of substances identified above the limit of detection (ppm) 21 Table 4.4 Spearman rank correlation coefficients (rs) for TPCBww and individual 21 congeners Table 4.5 Summary of the median chemical burdens in each area (red indicates a 25 significant meanR difference was observed between regions) Table 5.1 Examples of chemical data from similar studies 35
Figure 3.1The distribution of otters used in studies I & II (showing 10 Km grid 8 square from which at least one otter was retrieved). Figure 3.2 Annual numbers of otters retrieved in this study 9 Figure 3.3 Month by month record of otters retrieved in this study 9 Figure 3.4 Month by month record of adult, sub-adult and juvenile otters. 9 Figure 3.5 Month by month changes in rainfall and the number of RTA’s 10 (1992-2000). Figure 3.6 Foetal otters removed from a female otter killed in Wales 12 Figure 3.7 A staghorn renal calculus removed from an adult male otter 13 Figure 3.8 An adult male otter with a severe genital injury 13 Figure 3.9 An adult female otter with a shot wound 14 Figure 3.10 Boxplot showing condition factor for different sex/age groups 15 Figure 3.11 Boxplot showing condition factor for RTA and non-RTA otters 16 Figure 3.12 Boxplot to show combined adrenal weight for different sizes of 17 renal calculi. Figure 3.13 Boxplot showing adrenal factor for otters with evidence of infection 17 compared to those with no evidence of infection Figure 3.14 Boxplot showing changes in condition factor by month. 18 Figure 4.1 The distribution of otters used in studies I & II for which chemical 19 analysis was carried out (showing 10 Km grid square from which at least one otter was retrieved). Figure 4.2 Boxplot showing Total PCB (ppm in liver, wet weight) for different sex 22 and age groups Figure 4.3 Boxplot showing Dieldrin (ppm in liver, wet weight) for quiescent, 23 pregnant and lactating females Figure 4.4 Boxplot showing Total PCB (ppm in liver, wet weight) for quiescent, 23 pregnant and lactating females Figure 4.5 Boxplot showing Total PCB (ppm in lipid in liver) for RTA and non- 24 RTA otters Figure 4.6 Boxplot showing DDE levels (ppm in lipid in liver) for six Environment 25 Agency regions Figure 4.7 Boxplot showing DDT levels (ppm in lipid in liver) for six Environment 26 Agency regions Figure 4.8 Boxplot showing annual changes in Total PCB (ppm in lipid in liver) 27
R&D TECHNICAL REPORT W1-019/TR
iii

EXECUTIVE SUMMARY Postmortem examinations were carried out on 341 otters retrieved between 1992 and 2000. These data were combined with those from otters collected from South West England (Simpson, V., R&D Technical Report W148). Together, these data allowed a detailed analysis of the health status and chemical burden of the otter in England and Wales, establishing a comprehensive baseline. Road traffic accounted for the majority of the otters submitted. Other causes of death included bite wounds and starvation. The population was considered to be in good health, road kill being a sampling method which tends to sample relatively healthy individuals. Non-lethal disease included the presence of renal calculi (kidney stones), which occurred in 10% of otters. Liver samples were removed and analysed for a range of organochlorine pesticides, PCBs and heavy metals. Mean levels were considered to be generally low, although large ranges were observed. There was a strong intercorrelation between toxicants, particularly individual PCB congeners, but also between total PCB and the OC pesticides. The level of toxicant observed in an individual otter may be affected by its geographical origin, health and reproductive status.
R&D TECHNICAL REPORT W1-019/TR
iv
SUMMARY OF MAIN FINDINGS 1. Postmortem examinations were carried out on 341 otters retrieved between 1992 and 2000. These data were combined with those from otters collected from South West England (Simpson, 1998). 2. Numbers of otters submitted increased, levelling out between 1994 and 1999 (between 40 and 50 per year) and a dramatic increase was observed in 2000. The non-random nature of the sampling method necessitated the use of non-parametric or distribution-free statistical analysis and geometric rather than arithmetic means. 3. Road traffic death occurred more frequently in winter and spring with peaks in November and February, falling low over the summer months. There was no statistically significant difference between the patterns of male and female mortality. Non-road kills were equally likely to die in any month. 4. Significantly more male otters (65%) were submitted than females (35%). Among the age groups, adult males dominated the sample (47%), with fewer adult females (20%). The ratio of males to females among sub adults and juveniles was 1:1. 5. Road traffic accounted for 94% of the otters submitted. Other causes of death (N=21) included bite wounds (N=7), starvation (abandoned cubs)(N=7), drowning (N=2), shooting (N=2) and infections or abscesses of unknown origin (N=3). 6. Indicators of health or physiological stress (health indicators) included adrenal factor (relative adrenal weight, rapid response to stress) and condition factor (relative weight, evidence of longer term stress). 7. Female otters had a higher average condition than males in adult, sub adult and juvenile age-classes. Otters which died on the roads had a higher condition and lower adrenal factor than those which died of other causes. Health indicators also varied with reproductive status, presence of disease and time of year. 8. 48% of females had reproduced at least once, with 6% pregnant at the time of death and 17 % lactating. 9. Non-lethal disease included the presence of renal calculi (kidney stones). 10 % of otters had some evidence of renal concretion, and 2 % had stag-horn calculi, those which filled a large proportion of the kidney. 10. Liver samples were removed and analysed for a range of organochlorine pesticides, PCBs and heavy metals. The principal toxicants which occurred above the limit of detection were total PCB, Dieldrin, DDE, DDT and TDE. Although the mean levels were low, large ranges were observed. 11. There was a strong intercorrelation between toxicants, particularly individual PCB congeners, but also between total PCB and the OC pesticides.
R&D TECHNICAL REPORT W1-019/TR
v

12. Male otters tended to have higher burdens than females, though this was only statistically significant for total PCB and DDE 13. Lactating females had lower PCB, dieldrin and DDE burdens than quiescent females. Otters which died on the roads had less total PCB and DDT than non-RTA’s. There was a positive correlation between total PCB and combined adrenal weight. However, this is not necessarily indicative of a direct cause-and-effect relationship. 14. Statistically significant differences occurred between the regions with respect to the mean levels of the main toxicants identified. South West region had the highest mean HCH-gamma, DDT and TDE levels, Midlands had the highest mean dieldrin and North West had the highest mean levels of DDE and hexachlorobenzene (HCB). However, with the exception of HCH-gamma, the individual otters with the highest burden of these substances originated from Welsh region. 15. Although there is little doubt that the environmental contamination with PCBs and OC pesticides has decreased over the study period, it is considered that otters sampled in this way do not reflect this due to the many biases in the method. These data have, however, provided a comprehensive baseline study demonstrating the range of burdens which may be observed in a largely healthy population. 16. This study began with the aim of assessing the impact of pollutants on the otter in England and Wales. It has become apparent that road-death is of greater potential significance at this time and therefore the results are assisting in mitigation schemes. As a result of these findings, it is recommended that the routine collection and examination of otters be continued in order to add to this detailed baseline. ACKNOWLEDGEMENTS The authors would like to convey their thanks to the many individuals who have provided otters for this study and who have assisted us in the task of road-side collection and transportation. In particular, we are grateful for the assistance of Geoff Liles, Andrew Crawford, Teg Jones, Diane Russell, Dyfrig Jones, and Bob Hemmings. This study has benefited from generous financial support from the Esmée Fairbairn Foundation.
R&D TECHNICAL REPORT W1-019/TR
vi

1. INTRODUCTION Otters are members of the family Mustelidae, one of the largest families in the order carnivora. There are 5 mustelid sub-families: Mustelinae (weasels, martens and polecats), Melinae (badgers), Mellivorinae (honey badger), Mephitinae (skunks) and Lutrinae (otters). (Chanin, 1985). Although described as the European otter, Lutra lutra has an expansive range, occurring everywhere apart from Australasia, Madagascar and the arctic and Antarctic regions (Kruuk, 1995) and the Americas. Ten sub species of Lutra lutra have been approximately defined by their geographical location. The sub-species lutra has a mainly Palearctic distribution (Harris, 1968) and is the only sub-species indigenous to Britain. Otter populations have been decreasing steadily since the nineteenth century over much of Europe. The dramatic decline, however, which resulted in their regional extinction, began in the 1950’s. (Kruuk, 1995). The body of evidence for the decline and subsequent recovery is great but did not begin to emerge until approx. 1978, with the publication of a comprehensive analysis of hunting records, together with information regarding pollutants. The report (Chanin & Jefferies, 1978) concluded that a number of factors had contributed to the decline, but that the timing coincided with the introduction of organochlorine pesticides. A cascade of research, reporting and hypotheses concerning the exact causes of the otters decline began at this point and some of the debates continue. The chronology of events surrounding the triggers of the otter’s decline and the subsequent actions taken to protect and restore populations are extremely complex and Table 1.1 provides a brief summary. While there is little doubt that pollution predominates as the cause of the decline (Kruuk, 1995), there is clearly a complex combination of factors affecting otter mortality and survival. The otter was officially described as a pest in Britain in 1566 (Chanin, 1985). However, in the 20th century its’ image has been transformed. It is now an indicator of a healthy aquatic environment over much of the world. In its position at the top of the food chain, the otter is among the first to disappear if the environment becomes polluted (Foster-Turley et al., 1990). Although several key features appear to have been responsible for a crash in the population observed in the 1950’s, the lack of an overall pattern of recovery suggests that complex environmental factors are involved (Andrews, et al., 1993). Populations are stronger in mid and south west Wales and south west England. This reflects the geographical factors which influenced the otters’ decline in the 1960’s including the past agricultural use of pesticides. An eastward "rolling front" of expansion is evident, though the rate of expansion has been surprisingly slow. The speed of expansion is limited by many factors, including the quality and quantity of resources in the area being colonised, the levels of local accidental mortality and the slow breeding rate. (Strachen & Jefferies, 1996).
R&D TECHNICAL REPORT W1-019/TR
1

Table 1.1 A summary of events significant in the decline and recovery of the otter in Britain
1955 Dieldrin and related products such as aldrin, endrin and heptachlor were introduced for sheep
dipping, seed dressing and moth proofing
1956 The populations of peregrine falcons & sparrowhawks declined. Huge numbers of seed-eating
birds were found dead in areas recently sown with organochlorine-dressed grain.
The bodies of foxes and badger (found dead) contained high concentrations of pesticides. The
mortality was attributed to dieldrin
1957 The success of otter hunts began to fall. In the late 50’s and early 60’s and early 60’s,
huntsmen began to report the apparent cessation of otter breeding
1962 The use of dieldrin on spring-grown cereals stopped under a voluntary agreement.
1965-1966 Most other uses for dieldrin ceased
1976 Friends of the Earth launched the “Save the otter” campaign.
1976 The Joint Otter Group was set up by the Nature Conservancy Council to consider evidence on
the status of the otter in Britain and to recommend conservation measures
1977 The Joint Otter Group proposed a list of pressures which may have been the cause of their
decline. These included hunting, riparian clearance, pollution, disease, severe winter,
increasing mink population, reduced fish stocks and killing for pelts.
1977-1981 The first 4 National otter surveys were carried out using full-time researchers
1978 Chanin & Jefferies published the first comprehensive report, analysing hunting records, etc. and
forming a hypothesis as to the cause of the decline.
1978 An addition to Schedule 1 of the Conservation of Wild Creatures & Wild Plants Act, 1975
protected otters in England and Wales - making it illegal to catch or kill an otter.
1981 The Wildlife and Countryside Act, 1981, protects otters in England and Wales - extending the
protection to include habitat, making it an offence to disturb or destroy holts
Road traffic is the largest and most rapidly expanding cause of unnatural otter mortality (Green, 1991). It has been suggested that although many hundreds of otters are killed on the roads each year, road death is unlikely to have any serious effect on populations on a national or international scale (Conroy, 1993). It may be assumed, therefore, that the healthy and expanding otter populations of England and Wales can withstand accidental mortality such as road death. Expansion of otter ranges in the UK, however, is no cause for complacency (Conroy, 1993). The expansion of populations from strongholds has been slow (Andrews et al., 1993) and the rate of colonisation may be severely reduced by local accidental mortality on the roads (Strachen & Jefferies, 1996). Moreover, recent evidence from the Somerset levels indicates a potential loss of most if not all recruitment as a result of road traffic accidents (RTA’s) (Williams, 2000). From a monitoring perspective, therefore, the nature and frequency of road mortality can be an important aspect of otter conservation. It can also allow the identification of vulnerable groups of individuals and facilitate the study of several aspects of otter health. Seasonal patterns in behaviour may also be identified.
R&D TECHNICAL REPORT W1-019/TR
2

There is little published literature on the pathology of the otter, and although many tissues from individuals have been submitted for chemical analysis, detailed pathological examinations have rarely been carried out or reported. The identification of pathological changes associated with organochlorine and PCB burdens has been the objective of a few UK studies (Kruuk & Conroy, 1991; Kruuk et al., 1987; Kruuk & Conroy, 1996). The otters’ decline over much of Europe is thought to be largely due to bioaccumulating pollutants (Macdonald & Mason, 1994). Studies that involved monitoring toxic pollutant levels have found “critical” or “potentially harmful” levels in tissues and faeces (Mason, 1989) but few studies in England and Wales have incorporated pathological data. For monitoring of this kind to be of any use in terms of otter welfare, pollution monitoring in otter tissues must be combined with pathological evidence of the lesions associated with toxicity and chemical stress. The “health indicators” described (condition factor, combined adrenal weight and adrenal factor) provide quantitative estimates of nutritional status and physiological stresses. Two large studies carried out in Scotland (Kruuk & Conroy, 1991; Kruuk & Conroy, 1996) provide both pollution and pathological data with which meaningful comparison could be made. The pathological and chemical data provided by such studies are extremely complex (Kruuk, 1995) and the assessment of the significance of pollution burdens a subjective one. (Mason & Macdonald, 1986). The relative significance of the compounds, which may have initially caused the decline of the otters, and subsequently inhibited its recovery, has been open to some debate (Mason, 1998; Kruuk, 1997), and will be discussed later in this report. Although recognised as a non-random sampling method, road death is the only readily available source of tissue. The otter population clearly suffered from a serious decline, largely due to pollution, but now appears to be recovering. The extent to which that recovery was and is inhibited by pollution burdens and accidental mortality remains unanswered. The potential role of PCBs is particularly contentious. 1.1 Description of the sample analysed in this report In their proposed recovery plan for the otter, Jefferies and Mitchell-Jones (1993) listed structured autopsies and monitoring of pollutant burdens as important features for the assessment of the current situation and the implementation of practical conservation. The aim of this study is therefore to gather the maximum amount of relevant data in order to: (1) Describe the trends in road mortality and the main biases of the sample (2) Comprehensively examine the health status of the road kill population and use this information in conjunction with chemical data to assess the significance of various polluting chemicals, particularly PCBs. This study is based on 341 otter carcasses retrieved between 1992 and 2000 (Study I). A detailed postmortem examination was carried out on each individual and collection of tissue samples made. Liver samples from 158 otters were submitted to the Environment Agency Laboratory for chemical analysis. A similar project also funded by the Environment Agency was carried out on otters from South West England. This provided a second data set for inclusion and comparison. (Study II) (Simpson 1998). A draft version of the present report used data provided by Lyn Jenkins (Environment Agency, South west region), which included 83 records of sex, weight and length, plus raw
R&D TECHNICAL REPORT W1-019/TR
3
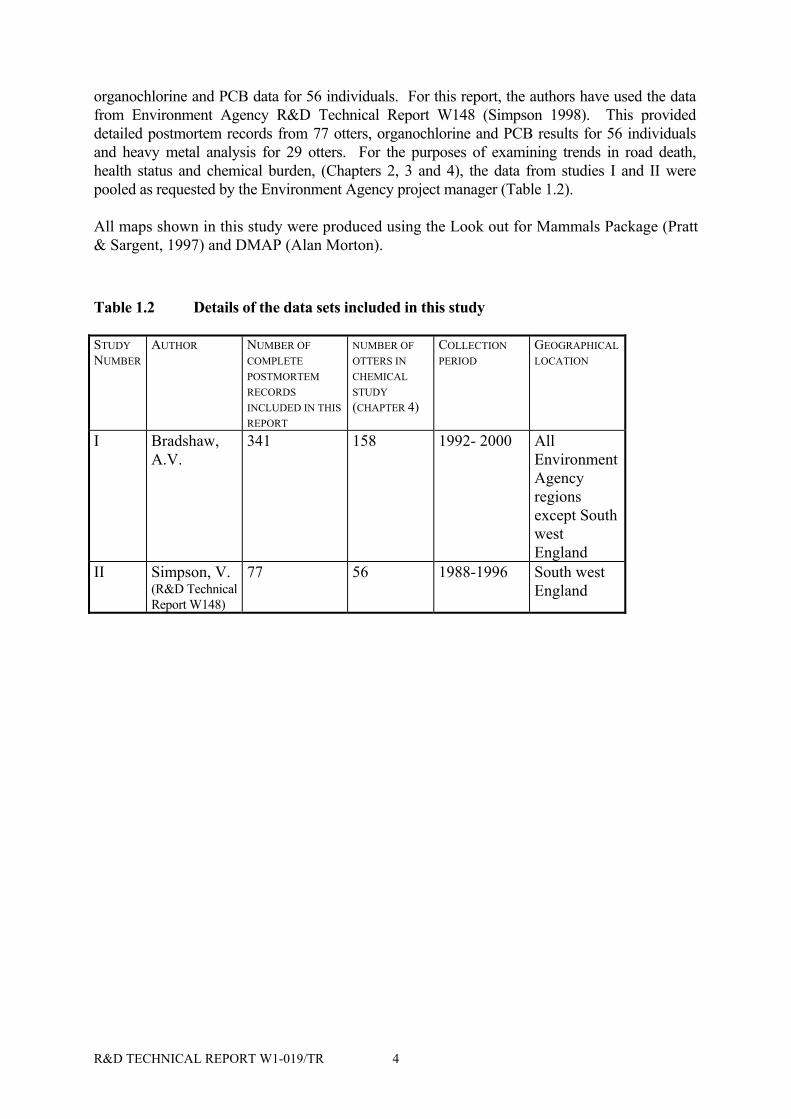
organochlorine and PCB data for 56 individuals. For this report, the authors have used the data from Environment Agency R&D Technical Report W148 (Simpson 1998). This provided detailed postmortem records from 77 otters, organochlorine and PCB results for 56 individuals and heavy metal analysis for 29 otters. For the purposes of examining trends in road death, health status and chemical burden, (Chapters 2, 3 and 4), the data from studies I and II were pooled as requested by the Environment Agency project manager (Table 1.2). All maps shown in this study were produced using the Look out for Mammals Package (Pratt & Sargent, 1997) and DMAP (Alan Morton). Table 1.2 Details of the data sets included in this study STUDY NUMBER
AUTHOR NUMBER OF COMPLETE POSTMORTEM RECORDS INCLUDED IN THIS REPORT
NUMBER OF OTTERS IN CHEMICAL STUDY (CHAPTER 4)
COLLECTION PERIOD
GEOGRAPHICAL LOCATION
I Bradshaw, A.V.
341 158 1992- 2000 All Environment Agency regions except South west England
II Simpson, V. (R&D Technical Report W148)
77 56 1988-1996 South west England
R&D TECHNICAL REPORT W1-019/TR
4

2. MATERIALS AND METHODS 2.1 Necropsy Procedure The majority of carcasses were submitted frozen and stored at -20oC until an examination could be carried out. 2.1.1 Basic information retrieval A postmortem examination was carried out on each individual from Study I following the record sheet outlined in Appendix I, including recording sex, weight and overall length. Age was estimated using the following criteria: Males and females weighing less than 3.0 and 2.1 kg respectively were considered to be juvenile (< 5 months) according to the growth curve data provided by Stephens (1957). Females above this weight were described as sub-adult (6-18 months) if they showed no signs of reproductive activity (absence of nipples and immature uterus) and adult if they showed signs of having reproduced at least once. Males above 3.0 kg with a baculum length less than 59 mm were described as sub-adult and with a baculum length greater than 60 mm were described as adult. (van Bree et al., 1966). These criteria were confirmed by other features such as total length, tooth wear and baculum weight. Otters from Study II were examined as described in the report (Environment Agency R&D Technical Report W148: Simpson, 1998) and the results transcribed from the report into the authors’ spreadsheet. Any details that were absent or ambiguous were omitted. However, the data were highly compatible. 2.1.2 Gross examination A visual assessment was made of nutritional state, reproductive status, lesion, growths and concretions. Gross observations were recorded on the record sheet (see Appendix I). 2.1.3 Health indicating factors – calculations and classification Body condition index was calculated as follows: K=W/aLn Where W=Total body weight (kg) L=Total length (nose to tip of tail) (m) For females, a=5.02, n=2.33 For Males, a=5.87, n=2.39 (Kruuk et al., 1987). Adrenal glands were removed, weighed and examined for signs of nodular hyperplasia. The weight of combined adrenal weight was recorded in g (left + right). Adrenal factor (relative adrenal weight) was calculated as follows: Adrenal factor = adrenal weight (g)/Total body weight (Kg)
R&D TECHNICAL REPORT W1-019/TR
5

2.2 Laboratory Analysis Liver samples from 56 otters retrieved from the study carried out in South west England, and 158 livers from otters collected from the rest of England and Wales were used in the analysis. All livers were placed in aluminium foil and stored at -20oC until analysed. Analysis took place in 7 batches (4 batches forwarded from study I, 3 batches from study II) at the Environment Agency Laboratory, Exeter. Methods for analysis of organochlorines and PCBs are described elsewhere (Simpson, 1998 & Simpson et al., 2000). The presence of heavy metals was determined and the level examined using atomic absorption spectrophotometry. 2.3 Statistical Analysis Non-parametric statistical methods were used, as the data did not meet the assumptions for Analysis of Variance. These “distribution-free” methods use a null hypothesis not concerned with specific parameters but with distribution variates. Kruskal-Wallis, a non-parametric equivalent of analysis of variance was applied. The samples are therefore compared on the basis of their mean ranks (meanR). Spearman’s rank correlation (rs) was applied to examine the relationship between health-indicating factors and the relationship between toxicant burdens, health factors and time. An explanation of the boxplot symbol is provided in Appendix II. Results of chemical analysis are expressed as both geometric and arithmetic means, (meanG and meanA respectively), following the arguments by Newton (1988) and Newton et al. (1993). A skewed distribution, such as that frequently observed with chemical data, includes outlying values, which have a great influence on an arithmetic mean. This influence is reduced with use of geometric means and provides a more realistic assessment of population trends. Both arithmetic and geometric based statistical analyses are quoted here for comparison with results from other authors. Organochlorine and PCB results are expressed in both ppm wet weight (e.g. Dieldrinww) and ppm in lipid (e.g. DieldrinL). Total PCB is termed TPCBww and TPCBL, and heavy metals as ppm dry weight (e.g. Hg dw).
R&D TECHNICAL REPORT W1-019/TR
6

3. RESULTS OF NECROPSY 3.1 Frequency and Distribution of Road Death A total of 418 carcasses were included in this analysis. Due to the nature of the collection method, the records obtained for each otter varied considerably. Table 3.1 shows a summary of the number of otters for which various basic data were available.
Table 3.1 Summary of basic records obtained (Studies I & II)
Number of individual otters
Environment Agency Region
418
10 km grid 357 Sex 415 Age 408 Month of death 385 Year of death 390
3.1.1 Geographical distribution Table 3.2 shows the number of otters provided by each Environment Agency Region and the time scale over which they were collected. (Time-scale refers to first and last otter received).
Table 3.2 Time scale over which otters were collected in each region
Environment Agency Region
N Time scale over which they were retrieved
Wales 210 January 1992 – December 2000 Midlands 44 September 1994 - December 2000 Anglian 33 November 1995 – December 2000 North East 27 December 1994 – November 2000 North West 19 November 1992 – November 2000 Thames 6 October 1999 – December 2000 Southern 2 November 1995 – March 1998 South West 77 December 1988 – November 1996 TOTAL 418
By December 2000, all Environment Agency regions were represented in the sample, although Southern Region sent only two specimens and therefore was not considered in isolation for statistical purposes. North West and North East Regions sent no specimens until 1995 but had several deep frozen specimens with good records and these were therefore included. Regions did not appear to vary greatly from one another in their collection effort, the numbers seen being consistent with an estimate of relative otter numbers in each Region. However, the appointment of additional “Otters and Rivers Project” staff in 1999 is likely to have contributed to the dramatic increase in the number of otters received in 2000.
R&D TECHNICAL REPORT W1-019/TR
7

Figure 3.1 The distribution of otters used in studies I (blue circles) & II (blue squares) (showing 10 Km grid square from which at least one otter was retrieved).
R&D TECHNICAL REPORT W1-019/TR
8

0
10
20
30
40
50
60
70
80
1988 1990 1991 1992 1993 1994 1995 1996 1997 1998 1999 2000
Num
ber
of o
tter
s
FemaleMale
Figure 3.2 Annual numbers of otters retrieved in this study
0
10
20
30
40
50
60
Jan Feb Mar Apr May Jun Jul Aug Sep Oct Nov Dec
Num
ber
of o
tter
s
FemalesMales
Figure 3.3 Month by month record of otters retrieved in this study
0102030405060
Jan Feb Mar Apr May Jun Jul Aug Sep Oct Nov Dec
Num
ber
of O
tter
s
JuvenilesSub-adultsAdults
Figure 3.4 Month by month record of adult, sub-adult and juvenile otters.
R&D TECHNICAL REPORT W1-019/TR
9

Figure 3.5 Month by month changes in rainfall and the number of RTA’s (1992-2000). Rainfall is measured in monthly average rainfall for England and Wales (cm).
R&D TECHNICAL REPORT W1-019/TR
10

3.2 Summary of gross examination Table 3.3 and 3.4 summarise the basic information retrieved prior to dissection of each animal.
Table 3.3 Summary of information retrieved for each animal prior to dissection (N= 401) N Median weight
(Kg) Median total length (mm)
Median tail length (mm)
Adult males 194 8.5 1120 420 Adult females 83 6.0 1025 390 Sub-adult males 54 5.0 980 380 Sub-adult females 51 4.9 960 370 Juvenile males 10 1.7 692 255 Juvenile females 9 2.1 765 280 The state of the tissue presented varied considerably from fresh (postmortem within 24 hours of death) to severe autolysis including hair loss and severe organ deterioration. The degree of trauma also varied. These factors affected the level of information available from each individual. In order to effectively and comprehensively describe the health status of individuals within this population, otters were classified according to the presence or absence of various factors. The principal factors selected were those which can be seen in otters irrespective of decomposition or injury. There is some level of overlap between these factors but a summary is provided in Table 3.4. Table 3.4 Summary of necropsy findings Factor Details No. Otters from
RTA group No. Otters from Non-RTA group
Quiescent 39 1 Pregnant 8 0
Reproductive status (Females)
Lactating 24 1 Miniscule 5 0 Moderate 11 2
Calculi
Staghorn 9 0 Bites 33 8 Wounding Shot 2 1 Malignancies 3 0 Enlarged adrenal 36 12
Lesions, tumours and adrenal hyperplasia
Nodular hyperplasia 3 1 Peritonitis/ Septicaemia
4 7
Suspected drowning Not applicable 2 Miscellaneous Suspected abandoned cub
1 7
R&D TECHNICAL REPORT W1-019/TR
11

3.2.1 Reproductive status Of the females for which reproductive status could be estimated (decomposition and injury permitting, n=145), 70 had immature uteri and were described as sub-adult. Females that had reproduced at least once (n=75) were further divided into quiescent (no sign of recent reproductive activity, n=40), pregnant (n=8), or lactating (n=25). Of the pregnant females, 5 uteri contained 1 foetus, 2 uteri contained 2 foetuses and 1 contained 3 foetuses. Figure 3.6 shows foetal otters.
Figure 3.6: Foetal otters removed from a female otter killed in Wales 3.2.2 Concretions Renal calculi were restricted to older adults, i.e. were accompanied by features such as advanced tooth wear. Calculi occurred equally in males and females, and were classified into 3 size groups: miniscule (visible but not encroaching on the parenchyma, n=15); moderate (occupying entire lobules, n=13) and staghorn (occupying several lobules and joining up between them, n=9). Although minuscule and moderate calculi were observed in pregnant and lactating females, staghorn calculi were restricted to males and quiescent females. The presence of calculi was associated with adrenal enlargement and staghorn calculi were associated with visible nodular hyperplasia. An example of a staghorn calculus is shown in Figure 3.7. The presence of peritoneal adhesions was accompanied by adrenal enlargement, but not with nodular hyperplasia.
R&D TECHNICAL REPORT W1-019/TR
12

Total length: 27 mm Figure 3.7: A staghorn renal calculus removed from an adult male otter 3.2.3 Wounding Evidence of fighting occurred mostly as puncture wounds around the genitals, anus and hind legs, usually well healed. In the extreme, though not fatal, this included one example of complete castration as shown in Figure 3.8. Lethal fighting injuries, i.e. those considered to have been the principal cause of death, were also recorded. One animal was presented having received a mortal shot wound, (Figure 3.9), 2 other animals had a small number of subcutaneous lead pellets, although no deleterious effects were identified.
Figure 3.8: An adult male otter with a severe genital injury
R&D TECHNICAL REPORT W1-019/TR
13

Figure 3.9: An adult female otter with a shot wound 3.2.4 Lesions, tumours and nodular adrenal hyperplasia Lesions and tumours were rare, though malignancies were identified on 3 occasions. An experienced oncologist who confirmed the identification observed two of these (Dr S. Hinsull, pers. comm.). Adrenal enlargement was observed in 48 individuals and in 4 cases a severe nodular hyperplasia was observed macroscopically. Although observed in both RTA’s and non-RTA’s, adrenal enlargement was commonly associated with some other stressor such as non-lethal fighting injuries, peritonitis, staghorn calculi or lactation. Severe nodular hyperplasia was found in individuals with staghorn calculi, liver fluke, and in suspected abandoned cubs (i.e. in the presence of anaemia, starvation and dehydration). 3.3 Health Indicators and Classification of Disease Table 3.5 A summary of values calculated for condition factor, adrenal weight and adrenal factor N Median Mean±SD Range Condition (K) 377 1.07 1.05±0.18 0.47-1.63 Combined adrenal weight (g)
191 0.91 0.97±0.4 0.2-2.9
Adrenal factor (g/Kg) 187 0.14 0.15±0.06 0.06-0.36 Table 3.6 Correlation data (Spearman Rank) for health factors. Combined adrenal weight Adrenal factor Condition factor rs=0.28, P<0.001, n=185 rs=-0.21, P<0.05, n=185 Combined adrenal weight rs=0.58, P<0.001, n=130
R&D TECHNICAL REPORT W1-019/TR
14

3.3.1 Health indicators, age and sex There was a significant difference between meanR condition for sex and age classes, with females having a higher meanR condition than males in adult, sub-adult and juvenile classes (Kruskal-Wallis: H=75, d.f.=5, p<0.0001). Combined adrenal weight differed between age classes (as would be expected). For adults, males had larger meanR combined adrenal weight than females. For sub-adults and juveniles, however, there was no difference between the sexes. (H=72, d.f.=5, p<0.0001). There was no statistically significant difference between meanRs adrenal factor for any age & sex classes. Figure 3.10 shows a boxplot of condition factor for sex and age classes.
3.3.2 Health indicators and gross findings Otters which died on the roads had a significantly higher meanR condition factor than those which died of unknown causes (H=28.5, d.f.=1, p<0.0001). MeanR adrenal weight did not vary according to cause of death. However, RTA’s had a significantly lower meanR adrenal factor than non-RTA’s (H=25.6, d.f.=1, p<0.0001) (see Figure 3.11). MeanR condition varied significantly according to reproductive status, with pregnant females and lactating females having a higher meanR condition than quiescent females (H=28.3, d.f.=4, p<0.0001). MeanR combined adrenal weight also rose during pregnancy, then fell slightly during lactation and was lowest in quiescent females (H=28.3, d.f.=4, p<0.0001).This was also observed in adrenal factor, although to a lesser extent (H=11.8, d.f.=4, p<0.02).
R&D TECHNICAL REPORT W1-019/TR
15

MeanR condition did not vary significantly according to the presence of renal calculi. However, meanR adrenal weight and adrenal factor both increased with the presence of minuscule calculi, increasing more dramatically when a staghorn calculi were present (H=23.6, d.f.=3, p<0.0001 for combined adrenal weight; H=13.6, d.f.=3, p<0.005 for adrenal factor) (Figure 3.12). No statistically significant observations could be made for the presence of malignancies due to low numbers involved. There was no significant change in meanR condition observed in the presence of adrenal enlargement. MeanR condition decreased significantly in the presence of peritoneal adhesions or some sign of septicaemia (H=8.8, d.f.=1, p<0.005). There was also a significant increase in meanR combined adrenal weight (H=12.9, d.f.=1, p<0.0001) and adrenal factor (H=13.7, d.f.=1, p<0.0001) (see Figure 3.13). The presence of fighting injuries (non-lethal) had no statistically significant impact on condition, adrenal weight or adrenal factor. However, for otters which had apparently been killed by bite wounds, meanR condition was significantly lower (H=9.2, d.f.=1, p<0.005) and adrenal factor higher (H=5.3, d.f.=1, p<0.05).
R&D TECHNICAL REPORT W1-019/TR
16

R&D TECHNICAL REPORT W1-019/TR
17
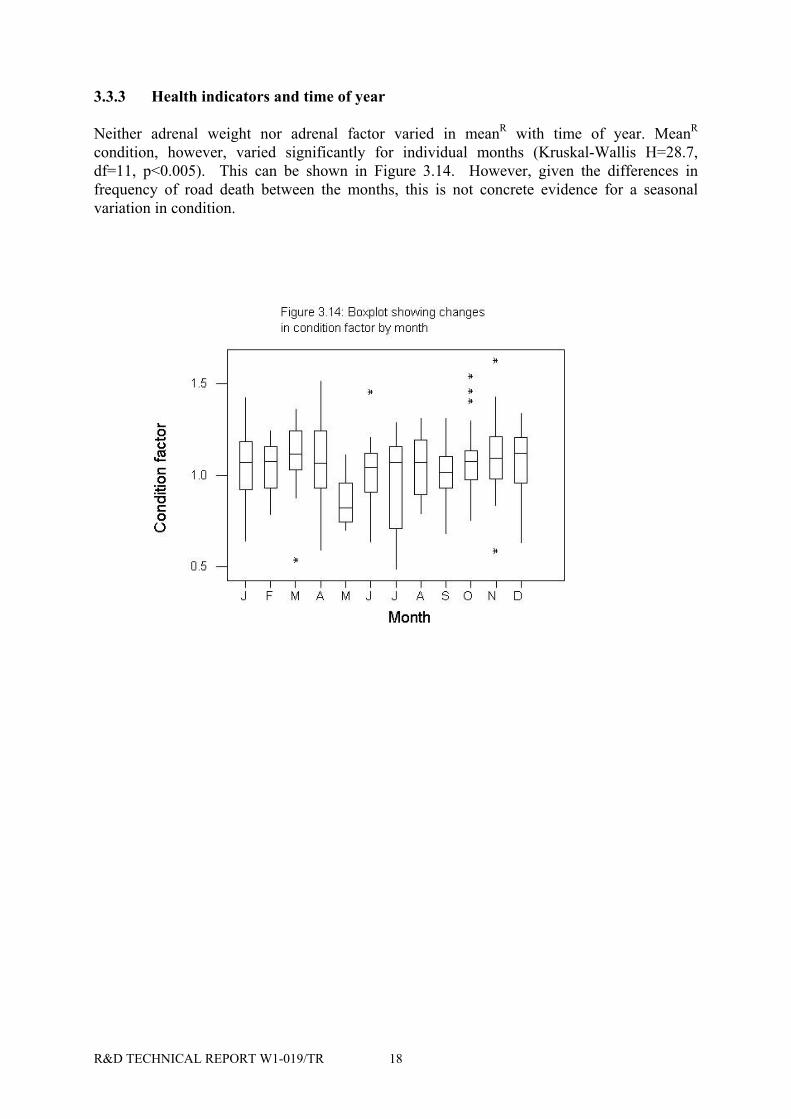
3.3.3 Health indicators and time of year Neither adrenal weight nor adrenal factor varied in meanR with time of year. MeanR condition, however, varied significantly for individual months (Kruskal-Wallis H=28.7, df=11, p<0.005). This can be shown in Figure 3.14. However, given the differences in frequency of road death between the months, this is not concrete evidence for a seasonal variation in condition.
R&D TECHNICAL REPORT W1-019/TR
18

4. RESULTS OF CHEMICAL ANALYSIS 4.1 Geographical distribution, age structure and condition of the sample Table 4.1 provides a summary of the sex and age structure and condition of the sample. Table 4.2 summarises health factors for the chemical sub-sample versus the whole sample. There was no significant difference between the meanR of any health indicators of the total sample (referred to in Part 3) and those of the chemical sub-sample. It was therefore considered overall that the chemical analysis sub sample was adequately representative of the total sample in terms of age distribution and the ranges of “health indicators”. Figure 4.1 The distribution of otters used in studies I (blue circles) & II (blue squares) for which chemical analysis was carried out (showing 10 Km grid square from which at least one otter was retrieved).
R&D TECHNICAL REPORT W1-019/TR
19

Table 4.1 Numbers of otters included in the chemical analysis sub-sample compared to the whole sample Whole samples Chemical analysis sub-sample Adult males 194 104 Adult females 83 42 Sub-adult males 54 24 Sub-adult females 50 30 Juveniles males 10 7 Juvenile females 10 4 Totals 401 211 Table 4.2 Health factors determined for the chemical analysis sub-sample compared to the whole sample. Whole sample Chemical analysis sub-sample Mean Range Mean Range Condition factor (K) 1.07 0.48-1.63 1.08 0.54-1.52 Combined adrenal weight (g) 0.91 0.2-2.9 0.9 0.2-2.2 Adrenal factor (g/Kg) 0.13 0.06-3.6 0.13 0.06-0.35 4.2 The burden of pollutants in the liver and intercorrelation between
individual toxicants Table 4.3 summarises the levels of the main toxicants analysed for in otter livers, which came above the limit of detection for most of the otter livers, analysed. For TPCBL, 25 individuals had TPCBL levels above 30 ppm (21 males and 4 females). 24 individuals had TPCBL levels above 50 ppm (20 males and 4 females). The wet weight values for individual toxicants compared to in lipid values were strongly and significantly correlated as follows: TPCBww & TPCBL: rs=0.86, p<0.0001, n=197 Dieldrinww & DieldrinL: rs=0.89, p<0.0001, n=197 DDEww and DDEL: rs=0.91, p<0.0001, n=197 DDTww and DDTL: rs=0.9, p<0.0001, n=197 TDEww & TDEL: rs=0.97, p<0.0001, n=197 Individual PCB congeners were strongly correlated with the total PCB burden, numbers 180 in particular. The occurrences of the most common PCB congeners were also strongly intercorrelated. Table 4.4 shows the correlation coefficients calculated for total PCB and individual congeners.
R&D TECHNICAL REPORT W1-019/TR
20

Table 4.3 Summary of substances identified above the limit of detection (ppm) Arithmetic calculation Geometric
calculation
N Median Mean ± S.E. Mean ×÷ S.E. Range
Extractable lipid (%)
200 2.93 3.6 0.154 3.07 1.04 0.99-15
HGH ww 211 <0.00001 0.00003 0.0001 0.002 1.23 ND-0.017 Dieldrin ww 212 0.107 0.303 0.097 0.119 1.08 ND-20.2 DDE ww 213 0.172 0.428 0.089 0.174 1.09 ND-16.4 DDT ww 211 <0.00001 0.005 0.002 0.005 1.19 ND-0.27 TDE ww 213 0.0197 0.09 0.04 0.033 1.11 ND-8.5 TPCB ww 200 0.45 0.694 0.051 0.489 1.07 ND-3.83 HCB ww 213 0.0103 0.018 0.002 0.016 1.07 ND-0.342 HGH LL 199 0.00001 0.017 0.008 0.072 1.39 ND-1.32 Dieldrin LL 199 3.21 8.87 1.81 3.68 1.1 ND-308 DDE LL 200 4.9 14.4 2.28 5.54 1.1 ND-250 DDT LL 198 0.0001 0.314 0.148 0.199 1.23 ND-26 TDE LL 200 0.55 2.72 0.706 1.07 1.13 ND-130 TPCB LL 200 14.5 23.27 1.75 16.02 1.07 ND-128 HCB LL 200 0.32 0.62 0.08 0.53 1.09 ND-11.9 Zinc dw 186 102 112.6 4.15 105.78 1.02 17.6-711 Nickel dw 156 <0.00001 0.123 0.053 0.86 1.32 ND-5.9 Arsenic dw 185 <0.00001 0.369 0.103 2.98 1.15 ND-14 Mercury dw 186 8.0 10.6 0.713 7.51 1.07 0.1-61.8 Lead dw 185 <0.001 0.53 0.12 1.56 1.18 ND-15.8 Chromium dw 184 <0.0001 0.642 0.146 1.94 1.14 ND-15.5 Copper dw 185 40.3 42.34 1.26 38.97 1.03 10.1-102 Cadmium dw 185 0.43 0.854 0.161 0.53 1.08 ND-28.6 Table 4.4 Spearman rank correlation coefficients (rs) for TPCBww and individual congeners (for all values, p<0.0001). PCBtotal
ww 105 118 138 153
105 0.76 - 118 0.72 0.80 - 138 0.72 0.83 0.74 - 153 0.68 0.59 0.78 0.84 - 180 0.80 0.75 0.82 0.16 0.81 A significant correlation was observed between concentrations of DDE and TDE (DDEww and TDEww:, rs=0.65, p<0.0001, n=188; DDE L and TDE L: rs=0.61, p<0.0001, n=197). All correlation coefficients between organic compounds which came above the limit of detection were significant with the exception of TPCBww and DDTww. Correlation was poor between organic compounds and metals.
R&D TECHNICAL REPORT W1-019/TR
21

4.3 Toxicant burdens in age / sex groups. The only toxicants showing a significant change in meanR between age and sex groups were TPCBww (Kruskal-Wallis: H=25.7, d.f.=5, p<0.0001), DDEww (H=17.7, d.f.=4, p<0.0001) and TPCBL (H=19.1, d.f.=4, p<0.0001). For TPCBww (see Figure 4.2) and TPCBL, males had larger meanR burdens than females for adult, sub-adult and juvenile classes, adults and juveniles having similar meanR burdens and sub-adult burdens being slightly lower. For DDEww, adult males and sub-adult males had larger burdens than females. However, juvenile females had significantly higher meanR burdens than all other age or sex groups.
4.4 Contamination in relation to health indicating factors No significant changes were observed in meanR heavy metals with any of the health indicators measured in this study. In terms of reproductive status, there were insufficient pregnant females in the sample to be considered statistically (n=4). However, lactating females were present in sufficient numbers to be compared to quiescent females. Lactating females had a lower meanR burden of Dieldrinww (H=10.4, d.f.=4, p<0.05)(see Figure 4.3), DDE (H=11.5, d.f.=4, p<0.05) and TPCBww (H=10, d.f.=4, p<0.05)(see Figure 4.4). This was not observed for these toxicants when expressed in ppm in lipid in liver.
R&D TECHNICAL REPORT W1-019/TR
22

No significant differences were observed in meanR for any chemical between the presence and absence of renal calculi. A significant increase in meanR of TPCBww and TPCBL was observed in otters with adrenal enlargement compared to those with normal adrenals (H=13.3, d.f.=2, p<0.001). Otters suffering from peritoneal adhesions of septicaemia also had a significantly higher meanR TPCBww level (H=4, d.f=1, p<0.05) and TPCBL (H=4.1, d.f.=1, p<0.05).
R&D TECHNICAL REPORT W1-019/TR
23

Otters which died on the roads had significantly less DDTww than non-RTA’s (H=5.9, d.f.=1, p<0.02) and DDTL (H=7.2, d.f.=1, p<0.01). They also had significantly lower meanR TPCBL (H=4.3, d.f.=1, p<0.05) (see Figure 4.5).
Otters suffering from non-lethal fighting injuries showed no difference in meanR burden but those which died from bite wounds had significantly higher meanR levels of DDTww (H=14.3, d.f.=1, p<0.0001), DDTL (H=14.9, d.f.=1, p<0.0001), DieldrinL (H=6.7, d.f.=1, p<0.05) and DDEL (H=5.7, d.f.=1, p<0.02). They also had higher levels of extractable lipid (H=7.6, d.f.=1, p<0.01). 4.5 Toxicant burdens in different geographical areas For the purposes of qualitative comparison, toxicant burdens for individual otters in each region are provided in graphical form in Appendix III. A statistical comparison of means is provided here. South West region had the highest meanR levels of lindane (HCH-g), with similar levels observed in the Midlands and East Anglia (H=31.1, d.f.=5, p<0.0001). South west also had the highest meanR levels of DDT (H=105, d.f.=5, p<0.0001), with all other regions having similar meanR levels to one another. North west had a higher meanR level of hexachlorobenzene than other regions (H=19.8, d.f.=5, p<0.005). Wales and the Midlands had similarly high meanR levels of cadmium (H=20.1, d.f.=5, p<0.005). It must be noted that although regional differences have emerged in this sample, the levels overall were low. The only toxicant occurring in a range which may be considered “of concern” was TPCB and this did not vary significantly between regions.
R&D TECHNICAL REPORT W1-019/TR
24

Table 4.5 Summary of the median chemical burdens in each area (red indicates a significant meanR difference was observed between regions) Wales Midlands Anglian NE NW SW Ext Lip% 3.00 3.03 2.97 2.97 2.21 2.4 HCH-gL (ppm)
0.00006 0.00756 0.00173 0.000001 0.000001 0.0648
DieldrinL (ppm)
3.0 5.2 4.6 1.9 2.3 4.7
DDEL (ppm)
3.8 7.7 5.9 2.7 13.9 6.2
DDTL (ppm)
0.254 0.007 0.022 0.078 0.031 0.668
TDEL (ppm)
0.36 0.76 0.53 0.001 1.19 1.49
TPCBL (ppm)
14.1 13.9 20.8 10.4 31.0 13.6
HCBenzL (ppm)
0.186 0.343 0.482 0.0001 1.23 0.616
R&D TECHNICAL REPORT W1-019/TR
25

4.6 Changes in toxicant burden over the study period Given the nature of this sampling method, this is not an appropriate sample for the construction of predictive models for changes in toxicant burden over time. The only comparisons between years appropriate for these data were non-parametric. The change in burden over the study period was therefore examined using 2 non-parametric tests: Kruskal-Wallis for comparison of meanRs between years and Spearman rank correlation to examine the relationship between year and burden. The toxicants showing a significant change in meanR over time were those which occurred in very minute quantities, e.g. HCH-g (H=30.5, d.f.=9, p<0.0001) and DDTww (H=54, d.f.=10, p<0.0001). There was no indication that TPCBww or TPCBL varied significantly in meanR between years (see Figure 4.8). Spearman rank correlation revealed similar results, with no correlation coefficient above 0.2 and those of TPCBww and TPCBL not statistically significant. These non-parametric statistical test were repeated on the Welsh data alone and no statistically significant decline over time was observed for any chemical. It is considered that although an environmental decrease may have occurred over the study period, it is not reflected in non-parametric analysis of this sample.
R&D TECHNICAL REPORT W1-019/TR
26

R&D TECHNICAL REPORT W1-019/TR
27
5. ANALYSES AND DISCUSSION 5.1 General There is little doubt that the otter population in Britain declined sharply several decades ago (Chanin & Jefferies, 1978; Mason & Macdonald, 1986; Jefferies, 1989). Many other parts of Europe suffered similar declines and in some countries the species is extinct (Foster-Turley et al., 1990). Many of the compounds which are believed to have caused the otter’s decline such as Dieldrin, DDT (1,1,1-trichloro-2,2-bis(p-chlorophenyl)ethane) and PCBs are officially out of use (Newton et al., 1993). There is evidence to suggest a surviving and expanding otter population from surveys carried out in England (e.g. Strachen & Jefferies, 1996), Scotland (Green & Green, 1987), and Wales (e.g. Andrews et al., 1991). Several large studies report chemical findings (e.g. Kruuk & Conroy, 1991; Kruuk & Conroy, 1996; Mason, 1989), few report these in conjunction with detailed necropsy findings (e.g. Simpson, 1998; Bradshaw, 1999). The aims of this study were to describe the health-status of road-killed otters from England and Wales, adding to existing data (Simpson 1998) to identify some of the biases in the sampling method and to make comparisons with otters found dead from non-violent causes. Gross observations were then compared to liver burdens of some chemicals, particularly those implicated in the otter’s decline. 5.2 Sample biases and constraints One factor hampering the achievement of these aims was the sampling method itself. Road kills are generally considered to be non-random and therefore severe constraints were placed on statistical analysis. However, the collection of such a large data set has allowed the identification of the major biases - those of selection for good health, young adult animals predominating, and more males killed than females. These findings agree strongly with those of other road-kill based studies (e.g. Kruuk & Conroy 1996; Simpson, 1998; Madsen et al., 1999). It is difficult to determine to what extent the trends in age, sex, health and toxicant burden are reflected in the free-living population. These data do, however, provide a detailed and extensive baseline. Nevertheless, ongoing sampling from this same “population”, i.e. road kills provides good comparative data in time. The variation in both autolysis and trauma observed in a road-kill sample may affect gross appearance. In an attempt to overcome this it was considered necessary to use those health-indicating factors which are less vulnerable to change with trauma and decomposition. The number of otter deaths recorded is clearly influenced by a number of factors. These include publicity, which increases the number of otters recognised and collected, and the appointment of otter-specific conservation staff such as the Otters and Rivers Project officer recruitment. As well as collection effort, road density and road usage by collectors also varied. One of the most significant contributors is presumably otter population increase and expansion, though it is not possible to measure the relative influence of this. An increase in the number of otters submitted over the study period has been observed elsewhere (e.g. Madsen, et al., 1999). It is likely to be a combination of otter expansion and collection effort that resulted in the increase observed during the timeframe of this study.
R&D TECHNICAL REPORT W1-019/TR
28
5.3 Trends in mortality Conroy (1993) has suggested that healthy otter populations may withstand road mortality without a severe impact on the total British population. Others, however, have suggested that road mortality threatens the continued expansion of the species (Madsen et al., 1999). A recent study from South West England supports the latter view, suggesting that recruitment and mortality numbers are roughly equal. (Williams, 2000). The alarming increase in the number of otters received over the study period, particularly in 2000 must therefore be a cause for concern, even though there are other possible explanations for the increase in submissions. The badger (Meles meles), another mustelid, has been the subject of several road-kill studies. Large discrepancies were observed in road kill trends between 3 studies carried out (Killingly, 1973; Jefferies, 1975; Neal, 1977). All agreed that road deaths were more frequent early in the year (between February and April), a factor attributed largely to breeding patterns. The relative contribution of males and females, however, differed greatly between the studies. It was proposed that the discrepancies were due to differences in sample size (Davis et al., 1987). However, other factors include collection effort, geographical location of regular collectors and regional differences in road density and badger population density. All these factors must also be considered when interpreting otter road-kill data, with the exception of seasonal breeding, for which there is currently little evidence in otters in England and Wales. In a study of otter mortality on Shetland, violent deaths such as those caused by road traffic were equally likely to occur at any time of year, whereas over half of natural deaths occurred between March and June (Kruuk & Conroy, 1991). In a similar study of otters from Orkney, northern Scotland and Denmark (Mason & Madsen, 1990), the timing of neither violent nor natural mortality varied significantly over the year. Simpson (1997 & 1998) reported a winter increase and summer decline of otter road mortality for otters from South west England (which forms a sub sample for this study). The discrepancy in seasonality is substantial. It is possible that seasonality is disguised on Shetland due to the low road density and low vehicular usage. In this study, the number of deaths was significantly identified as a function of time of year, with winter increases and summer declines mirroring those observed in Simpson’s report (1997 and 1998). The trends observed here may therefore reflect the seasonality of road usage and rainfall. Males predominated in the sample but when Wales was considered in isolation, there was no significant frequency difference between the sexes. This demonstrates the necessity for a sample of sufficient size and highlights the potential discrepancies, which may occur between studies of vastly different sample sizes. This sample demonstrated a significant male bias overall, although this was not always statistically significant in individual regions. In the Shetland study, Kruuk and Conroy (1991) observed almost equal numbers of mortalities in males and females, while Mason & Madsen (1990) unfortunately made no mention of sex ratios in their study of otter mortality. The greater mobility and home ranges of male otters compared to those of females have been the proposed explanation for this male bias (Simpson 1997 and 1998). Similarly in a large study of macropod road kills in southern Australia, male biased road kills in kangaroos were considered to be due to behavioural traits, which exposed males to more vehicles than females. In a species for which behavioural data fail to explain a difference, possible explanation included a skewed sex ratio in the population. Behavioural observations of otter suggest that the greater home range and
R&D TECHNICAL REPORT W1-019/TR
29
mobility of males would expose them to more traffic (Kruuk, 1995). A skew in the sex ratio of the free-living population has not been identified. Simpson (1997 & 1998) tentatively postulated seasonal differences in road death between the sexes, and its possible relationship with different behaviour patterns, since he observed a peak in female mortality in February, whereas male mortality peaked in March and December. Seasonal differences were not statistically examined for the South west otters from Simpson’s study but when this was incorporated into the present study, no statistically significant differences between mortality patterns in males and females were evident. It is therefore considered most likely that the factors affecting seasonal variation in otter road mortality for this sample affect both males and females. A clear breeding season has not been defined for otters in England and Wales, therefore reproductive events are not thought to be seasonally reflected in road mortality. Seasonal fluctuations in weather conditions were examined broadly in this study by the correlation between average monthly rainfall in England and Wales and the number of otter road deaths. Heavy rainfall causes increased flow speeds through culverts and results in a greater likelihood of otters venturing over roads. The statistical relationship between mortality and rainfall, albeit a broad comparison, indicates that rainfall contributes significantly to otter mortality. The low "r" value indicates that it forms only part of the explanation. High river flows may also make feeding more difficult. This factor may encourage otters to move to pools and forage for alternative prey such as amphibians, especially between February and April (Slater, pers. comm.). Another factor is the use of roads and the coincidence between dawn/dusk and rush hour. Otters tend to be most active at dawn and dusk (Mason & Macdonald, 1986). Therefore, when these coincide with heavy traffic on the roads - i.e. November to March, mortality is more likely to occur, particularly when this is accompanied by river spate. 5.4 Condition, adrenal weight and adrenal factor Condition factor provides a quantitative indicator of weight, taking into account the differences in length between otters. Kruuk and Conroy, using 25 “healthy” otters that had been killed on the roads, developed the specific equation used for otters. These were assumed to have an average K=1.0, and the constants for males and females were calculated accordingly (Kruuk, 1995). These data demonstrate a lower meanR condition in sub-adult males compared to that of adult males. This indicates that either sub-adult males are less healthy overall (which is not supported by pathological evidence) or that growth is non-linear, and therefore an increase according to K=1 cannot be maintained. However, across the majority of the sample, condition index identifies good, moderate and poor health and is a useful tool for comparison of condition in adult otters, although probably too simplistic to be an accurate description of health in young animals. Although several earlier studies have utilised the condition index, its use is limited by its relatively slow response to disease. It was therefore considered important to include another feature of the response to physiological stress (not necessarily disease). The natural environment is composed of a series of hostile stress factors, therefore maintenance of homeostasis requires physiological adaptation. This is achieved via complex endocrine interactions, with the adrenal gland having a major role. Chronic exposure to
R&D TECHNICAL REPORT W1-019/TR
30

stress may result in proliferation of adrenal tissue in order for increased hormone release to occur. This gland responds extremely rapidly, causing adrenal enlargement to become evident within as little as 6 hours. (Harvey et al., 1984). In terms of the postmortem examination of otter road kills, the adrenal gland has the advantage that it may be examined macroscopically, without the need for histological techniques. This compact gland has a limited blood supply and appears relatively resistant to trauma and autolysis. The diagnosis requires excision, weighing and comparison with known values. In the extreme, nodules may appear in the cortex (nodular hyperplasia), which are also visible macroscopically. Adrenal enlargement was observed in this study when the individual was suffering from an infection, renal calculi or was in late pregnancy or lactation. Nodular hyperplasia was associated with aggressive infection, severe bite wounds and staghorn calculi. In a study of 2 otters with suspected organochlorine toxicity, the presence of adrenal hyperplasia was thought to be associated with the organochlorine burden, although the relationship with age was also postulated (Keymer et al., 1998). A more recent study provided evidence to indicate that adrenal enlargement observed in otters was due to hyperplasia rather than hypertrophy (Simpson, 1998). Nodular hyperplasia is especially common in dogs of middle age and over and it is thought to affect up to 69% of dogs over 10 years of age. It has been suggested that the prevalence in older animals is due to the cumulative impact of various stresses over a number of years. A specific cause is often obscure. (Appleby & Sohrabi-Haghdoost, 1980). Adrenal factor was used as a relative adrenal weight to take increases in the animal’s size into account. Both proved useful tools in conjunction with other gross observations. 5.5 Other gross observations 5.5.1 Concretions In this study, renal calculi were observed in 27 individuals, all mature adults apart from one juvenile (which showed signs of a renal infection). The significance of this is unclear, as neither their cause nor their potential impact is understood. Although other pathological observations indicating poor health sometimes accompanied calculi, this was not always the case. Several animals showed signs of excellent nutrition and general good health (adequate adipose and plentiful digestible contents). Calculus formation relies on an organic matrix and its chemical constituents depends on the pH of the urine, both extremes resulting in precipitation. Dietary constituents may affect this, and therefore the components of omnivore, herbivore and carnivore calculi may differ. Infections of the urinary tract may induce calculus formation, not only by increasing the alkalinity, and therefore promoting precipitation, but also by causing inflammatory detritus, which may act as a nidus for stone formation. Metabolic disorders may well contribute, as they increase the output of insoluble constituents into the urine. There is also a genetic predisposition, as observed in dogs where breed-susceptibility is observed. (Hess et al., 1998). Renal calculi were not observed in animals from South west England (Simpson, 1997 & 1998). The mortality study carried out in Shetland and that of mainland Scotland also failed
R&D TECHNICAL REPORT W1-019/TR
31
to reveal any calculi in the free-living population. This is possibly due to the low life expectancy, as the majority of animals died before 3 years of age (Kruuk, 1995). In this study, animals encountered with staghorn calculi showed other signs of advanced age such as extreme tooth wear. In mink (Mustela vison), renal calculi have been associated with the disruption of reproductive activity in terms of both endocrine response and behaviour (Jefferies & Hanson, 1987). Although some of the individuals in this study appeared in good nutritive health despite staghorn calculi, there may have been unseen reproductive consequences. Keymer reported renal calculi in 50% of otters examined during the necropsy of 32 otters (several species). Although the majority of calculi were small and showed little evidence of causing kidney damage, the large accumulations resulted in pressure atrophy of the surrounding tissue. Although the causes were not clearly understood, the presence of calculi was thought to be associated with excessive dietary calcium and vitamin D. (Keymer et al., 1981). The potential consequence of these stones in free-living animals is therefore unclear, although it appears to be a feature of the ageing process and the consequential gradual deterioration in renal function or severe renal infection. 5.5.2 Wounding Incidents of wounding have featured in other studies (e.g. Kruuk & Conroy, 1991) but had been largely attributed to dogs until the reports from Simpson (1998). The findings of this study would concur with observations by Simpson that these wounds were generally caused by other otters. These were sometimes the cause of non-RTA mortality but on close examination of the baculum, most healthy adult males had some healed genital injury. 5.6 Analytical considerations The toxicological impact of organochlorines, PCBs and heavy metals on otter populations has been the subject of several major studies since the population decline was first identified. The scientific ideal would be to conduct laboratory experiments involving the administration of pesticides and the study of biochemical, physiological and behavioural effects on otters. There are clearly many ethical and practical issues preventing this particular type of study. Studies so far have therefore relied upon data collected from animals killed accidentally. The selection of a liver sample for chemical analysis was carried out during the postmortem examination and was based on the practical criteria of the degree of degradation and injury and therefore potential for further storage. Severely damaged livers were excluded and although alternative tissues were removed for possible chemical analysis, this has not been carried out to date. Individual rates of excretion of persistent chemicals are affected in experimentation by a number of factors, including sex, age, species, method of administration, and duration of exposure. In addition, in the free-living situation this is modified further by season, nutritional status, dietary components and physiological status. (Wren, 1986). It is not, therefore, entirely surprising that the frequency distribution of chemicals in this sample were skewed. Any such anomalies in
R&D TECHNICAL REPORT W1-019/TR
32

distribution are more likely to occur in a non-random sample such as that used in this study. For such samples, Newton (1988) argues that geometric means rather than arithmetic means are more appropriate, as they reduce the disproportionate effects of outlying values and provide a more accurate statistical evaluation. Kruuk & Conroy (1996) agree with this finding, as does the present study, therefore geometric values have been produced alongside arithmetic values. The values obtained are lower than arithmetic values and the range is still included so that the burdens present in individual otters are represented as they have a role in animal welfare. The analysis of OCs and PCBs relies on comparisons between the chemicals extracted from tissues and technical formulations. During their passage through the food chain, these organic chemicals undergo structural changes, therefore their identification is somewhat subjective. Considerable differences may be observed in the identification of substances between analytical laboratories. (McFarland & Clarke, 1989). It is therefore inappropriate to make detailed comparisons between data from different laboratories, and for the purposes of this discussion only broad comparisons will be made with other studies. Due to the often non-random sampling method itself (road death), it was considered important to assess the level to which the chemical analysis sub sample represented the total. It was considered that, although individuals with very high adrenal weights or low condition indices were absent from the chemical sub-sample, there were no significant differences between the general trends within the total RTA sample and those of the sub-sample. The hypothesis that the sub-sample is representative of the total RTA sample is therefore accepted. The values below the detection limit do not necessarily mean that they are no longer present in the environment, but may be largely explained by the rapid excretion of these chemicals. DDT is rapidly metabolised to DDE (1,1-dichloro-2,2-bis(chlorophenyl)ethylene), the most abundant metabolite, and conversion from DDT to TDE occurs postmortem. In dosing trials with DDT (carried out on Pigeons), TDE formation increased in proportion to the storage time of tissues after death. It is possible, therefore, that the TDE present in this study was originally accumulated as the more toxic parent compound, DDT. A tendency for accumulation in an organ other than the liver may also explain low values in this sample. Although studies have indicated species-specific excretion patterns, endosulphan isomers are also rapidly converted to less toxic metabolites in mammals. Residues also tend to accumulate in the kidneys rather than in fat. Although lindane has been found in milk, fat and kidneys of rats, following oral administration, rapid elimination has also been observed. (Tomlin, 1994). 5.7 Comparative studies and critical levels Table 5.1 includes a summary of data produced during similar studies. For total PCB, critical values, i.e. those causing lethal or sub-lethal effects, have been produced based on studies using the American mink. The following environmental standards are most frequently quoted for otter tissues (based on a dosing study carried out in mink (Jensen, et al., 1977): a concentration of 50 ppm total PCB (lipid basis) in liver (1.24 ppm wet weight) is related to a 50% decrease in reproduction. However, the significance of PCB burdens remains an undetermined factor in otters. There are several arguments against the use of mink standards for otter populations. Other than problems associated with the comparison between free-living and captive animals, it is unclear
R&D TECHNICAL REPORT W1-019/TR
33
whether the effect in mink may be extrapolated to levels for the otter, as large differences in sensitivity between mustelid species have already been identified (Leonards, et al., 1997). Mason clearly concurs with the “environmental standard” mentioned above, frequently reporting critical levels in otter tissues from England and Wales (Mason, 1989) but in the absence of pathological data, an accurate description of the sample or any data which relates to the physiological status of the population. The mean value for total PCB in lipid is similar in this study to that quoted for other British studies (Mason, 1989), though the range observed is considerably smaller. The arithmetic mean is well below that considered to be harmful to otters. The range, however, clearly indicates that individuals with high PCB levels are still present in the population, though the pathological evidence for reproductive failure is absent. Furthermore, the study from mainland Scotland, Orkney and Shetland found a mean level in excess of that considered critical, yet no deterioration in reproductive capacity was observed. It would appear that otters are less sensitive than the studies based on mink would suggest. Environmental standards or critical levels for dieldrin, DDT and DDE have not been developed for otters. However, the mean and range of dieldrin are similar to those observed in other British studies on otters (Mason, 1989). The levels observed are clearly below the only published lethal observation of 13.95 ppm wet weight in liver (Strachen & Jefferies, 1996) apart from one individual. DDT levels are considerably lower than those published for earlier British studies, tending to occur close to the limit of detection. Their presence is, however, of concern. The rapidity of breakdown in a biological system of DDT to DDE and TDE is such that the mere presence of DDT indicates recent exposure to the ecosystem. (Jefferies & Hanson, 1987). Generally the mean levels of toxicants observed in this study are low and with the absence of pathological indications of harmful effects it may be postulated that the levels have fallen below those that are critical to otter survival. However, it must be noted that more vulnerable groups in the population such as pregnant females and young animals are under represented in a road kill sample. Furthermore, little is known about the potential additive effects of toxicants or their possible impact under unfavourable circumstances such as food shortage. The presence of significantly higher levels in males than females supports the theory of an excretory mechanism such as pregnancy and lactation. Organochlorine pesticides can be transferred across the placental barrier to accumulate in the foetus, and can be transferred to young via milk (Jefferies & Hanson, 1987). 5.8 Chemical burdens, sex and age Mean toxicant burdens tended to be higher in males than females, particularly dieldrin. The mechanism for this is unclear, though it is not unreasonable to assume that pregnancy and lactation in females is acting as an excretory mechanism.
R&D TECHNICAL REPORT W1-019/TR
34

Table 5.1: Examples of chemical data from similar studies Locality N Arithmetic
mean (ppm in lipid in
liver
Range Arithmetic mean (ppm wet weight
in liver)
Range Reference
Dieldrin British Isles
38 5.3 ND-66.4 Mason, 1989
British Isles
32 0.5 ND-13.9 Jefferies et al., 1974
Mainland Scotland, Orkney & Shetland
116 3.6 0.7-14 0.08 0.01-0.28 Kruuk, 1995
England and Wales
212 8.9 ND-308 0.3 ND-20.2 This study
DDE Mainland Scotland, Orkney & Shetland
116 9.7 ND-116 0.24 ND-2.81 Kruuk, 1995
England and Wales
213 14.1 ND-250 0.4 ND-16.4 This study
DDT British Isles
38 23.0 ND-199 Mason, 1989
England and Wales
211 0.31 ND-26 0.005 ND-0.27 This study
Total PCB British Isles
38 24.5 ND-232 Mason, 1989
British Isles
26 * 0.07-4.49 Jefferies & Hanson,
1987 Mainland Scotland, Orkney & Shetland
116 57.4 ND-596 1.49 ND-14.4 Kruuk, 1995
England and Wales
200 23.3 ND-128 0.69 ND-3.8 This study
Organochlorine insecticides can pass through the placental barrier and accumulate in the foetus during development. They can also be transferred to offspring via milk. (Jefferies & Hanson, 1987). However, this would not explain the greater mean values in sub-adult males compared to sub-adult females. This would tend to suggest a more general metabolic explanation. It is a potential bias in a study of this kind.
R&D TECHNICAL REPORT W1-019/TR
35

5.9 Chemical burdens and health-indicating factors 5.9.1 Chemical burdens, condition, adrenal weight and adrenal factor The relationship between condition, K, and total PCB burden was identified by Kruuk & Conroy (1996) (r = 0.45, p<0.001). This relationship was not observed in this study. There was, however, a correlation between total PCB and combined adrenal weight. Adrenal glands enlarge in response to physiological stresses such as diseases, pregnancy and a shortage of resources. It is unclear whether this is a cause-and-effect relationship or whether the mobilisation of organochlorines into liver lipid is a side effect of circulating stress hormones. 5.10 Geographical variation in chemical burdens There was some indication that geographical differences occur in the mean toxicant levels observed. A higher mean PCB level was observed in Wales and the Midlands, for example, whereas South west England had higher mean levels of DDT and the North-West had a higher mean DDE. These differences may reflect geographical trends in industrial input and pesticide usage. It may be possible to divide geographical areas further to allow more detailed comparison, and compare areas from which few otters originated. However, given the large number of other factors affecting toxicant burden here, the extremely low levels observed, and the nature of the sampling method, it was considered unwise to use these data for the identification of “chemical hot spots” at this time. 5.11 Changes in chemical burdens over the study period Mason (1998) identified a decline in PCB levels in otter tissues from England and Wales averaging 8% per year between 1983 and 1992. However, the sample consisted of only 32 otters taken from a wide geographical area. The data presented here do not support the suggestion that total PCB, or any of the organochlorine pesticides studied, have declined over the study period. A convincing case for the environmental decline of organochlorines was provided by Newton (1993) with the burdens of over 1000 birds collected over a 20 year period. However, the data used here, namely largely road-killed samples collected over a 10 year period cannot confidently be used for parametric linear regression and therefore are not appropriate for use in predictive decline. There is little doubt that environmental recovery is continuing. The role of otter tissue analysis, in conjunction with postmortem examination, is to ensure that environmental conditions remain favourable for otter welfare. As this study has outlined, the most accessible part of the otter population in terms of tissue sampling is also the healthiest. It is therefore important that positive results from this sample do not lead to complacency. The presence of DDT after such a long period of legislative exclusion is a case in point.
R&D TECHNICAL REPORT W1-019/TR
36

6 RECOMMENDATIONS 6.1 In the light of the findings of this extensive study it is recommended that this study continue under the present arrangements. The lines of communication to ensure efficient collection and transportation are now firmly in place. In order to maintain continuity of data collection and analysis, it is proposed that the Environment Agency continues to fund the retrieval and postmortem of otters under the current contract specifications. 6.2 The chemical analysis should continue to include those substances which consistently occur above the limit of detection. Although the levels appear low in this study sample as a whole, their relationship to disease and other health factors deserves further investigation. The presence of total PCB over the level previously described as potentially hazardous to otter reproductive status, a single animal with dieldrin above a previously described lethal limit and a number of otters with DDT burdens above the detection limit all serve to illustrate the inadequacy of out understanding of these substances. This was a comprehensive baseline study which deserves futher investigation. 6.3 We would suggest that chemicals which tend to fall well below detection limits such as some herbicides and organophosphates be excluded. It maybe more appropriate to do a small-scale study on the target-organs of these substances. 6.4 Dispite the lack of convincing evidence that PCB contamination is leading to widespread reproductive failure in otters in England and Wales, the combined impact of toxicant burdens is unclear. The use of TEQ’s would be a useful tool in this case (toxic equivalent concentration, see Leonards, et al., 1997). 6.5 With the increasing concern about synthetic pyrethroids and other oestrogenic compounds, we would also recommend their inclusion in the chemical suite. 6.6 Because of concern with other British mustelids the monitoring of “second generation” rodenticides would be appropriate for otters. They are considerably more toxic than Warferin and otehr first generation compounds, and this together with the long biological half-life in the liver has lead to concern in other potential predators such as polecats (Shore, et al., 1999). It is therefore recommended that a number of otter specimens be submitted for analysis for secondary rodenticides.
R&D TECHNICAL REPORT W1-019/TR
37

7 REFERENCES Andrews, E., Howell, P., Johnson, K. (Eds. )(1993). Otter survey of Wales. Vincent Wildlife
Trust, London. Appleby, E. C., Sohrabi-Haghdoost, I. (1980). Cortical hyperplasia of the adrenal gland in the dog. Research in Veterinary Science 29, 190-197. Bartle, H. (1991): Quiet sufferers of the silent spring. New Scientist 18 May 1991, 30-35. Carpenter, K. E. (1924): A study of the fauna of rivers polluted by lead mining in the
Aberystwyth district of Cardiganshire. Annals of Applied Biology 11(1), 1-23. Carpenter, K. E. (1925): On the biological factors involved in the destruction of river fisheries by pollution due to lead mining. Annals of Applied Biology 12, 1-13. Carpenter, K. E. (1926): The lead mine as an active agent in river pollution. Annals of Applied
Biology 13, 395-401. Chanin, P. (1985): The natural history of otters. Croom Helm, Beckenham, Kent, UK. 179 pages. Chanin, P. R. F., Jefferies, D. J. (1978): The decline of the otter Lutra lutra L. in Britain. an analysis of hunting records and discussion of causes. Biological Journal of the
Linnean Society 10, 305-328. Conroy, J. W. H. (1993): Otter mortality and survival. In: Proceedings of the National Otter Conference, Cambridge, September 1992. (Ed: Morris, PA) The Mammal
Society, Bristol, 21-24. Cooke, A. S., Bell, A. A., Haas, M. B. (Eds. ) (1982): Predatory birds, pesticides and
pollution.Institute of Terrestrial Ecology, Cambridge. 73 pages. Davies, J. M., Roper, T. J., Shepherdson, D. J. (1987): Seasonal distribution of road kills in the
European badger (Meles meles). Journal of Zoology, London 211, 525-529. Fry, J.C. (1993): Biological data analysis – a practical approach. IRL Press at Oxford
University, Oxford. Friends of the Earth (1991): Poisonous fish: a report on contamination of freshwater fish with persistent toxic chemicals. Friends of the Earth LTD, London, UK. Gorman, M. L., Kruuk, H., Jones, C., McLaren, G., Conroy, J. W. H. (1998): In: Behaviour and
Ecology of Riparian Mammals. Symposia of the Zoological Society of London 71 ed. (Eds: Dunstone, N, Gorman, ML) Cambridge University Press, Cambridge, UK, 107-118
Green, R. (1991): The impact of hunting, poaching and accidents in otter survival and measures to protect individual animals. Habitat 6, 171-190. Hagmar, L. (1997): High consumption of fatty fish from the Baltic sea contaminated with
persistent organohalogens and changes in human lymphocyte subset levels. In: Air pollution epidemiology reports series, No. 11 - Environment and immunity: proceedings of a workshop held in Brussels, 20-21 May 1996. (Eds: van Loveren,H,Sranm, R, Nolan, C) European Commission Directorate, General Science Research and Development, Luxembourg, 61-63.
Harris, C. J. (1968): Otters: a study of recent Lutrinae. Weinfield & Nicholson, London. Harvey, S., Phillips, J. G., Rees, A., Hall, TR (1985): Stress and adrenal function. The Journal
of Experimental Zoology 232, 633-645 Hess, R.S., Kass, P.H., Ward, C.R. (1998): Association between hyperadrenocortism and
development of calcium-containing uroliths in dogs with urolithiasis. Journal of the American Veterinary Medical Association 212(12), 1889-1891.
Humphreys, D. J. (1991): Effects of exposure to excessive quantities of lead on animals. British Veterinary Journal 147(1), 18-30.
R&D TECHNICAL REPORT W1-019/TR
38

Jefferies, D. J. (1975): Different activity patterns of male and female badgers (Meles meles) as shown by road mortality. Journal of Zoology, London 177, 504-506. Jefferies, D. J., Hanson, H. M. (1987): The Minsmere otter release and information gained from a detailed examination and analysis of the two casualties. Otters, Journal
of The Otter Trust 1(10), 19-29. Jefferies, D. J., Mitchell-Jones, A. J. (1993): Recovery plans for British mammals of conservation importance, their design and value. Mammal Review 23, 155-166. Jefferies, D. J., Walker, C. H. (1966): Uptake of pp’-DDT and its postmortem breakdown
breakdown in the avian liver. Nature 212, 533-534. Jefferies, DJ, French, MC, Stebbings, RE (1974): Pollution and Mammals. In: Monkswood
Experimental Station Report 1972-1983. NERC, Huntingdon. Jensen, S., Kihlstrom, J. E., Olsson, M., Lundberg, C., Orberg, J. (1977): Effect of PCB and DDT on Mink (Mustela vison) during the reproductive season. Ambio 6, 239. JNCC (1995) Framework for otters 1995-2000. JNCC, Peterborough. Keymer, I. F. (1991): Otters in east Anglia, past, present and future. Norfolk Naturalists
Trust, 72 Cathedral Close, Norwich. 18pp. Keymer, I. F. (1993): Diseases of the otter (Lutra lutra). In: Proceedings of the National Otter Conference, Cambridge, September 1992. (Ed: Morris, PA) The Mammal
Society, Bristol, 30-33. Keymer, I. F., Lewis, G., Don, P. L. (1981): Urolithiasis in otter (family Mustelidae, subfamily Lutrinae) and other species. Erkrankungen Der Zootiere - 23 Internationalen Symposiums Papers Akademie Der Wissenschaften Der DDR 23,
391-401. Keymer,IF; Wells,GAH; Mason,CF; Macdonald,SM (1988): Pathological changes and
organochlorine residues in tissues of wild otters (Lutra lutra). Veterinary Record 122, 153-155.
Killingley, A. (1973): The beleaguered badger. Countryside 22, 156-160. Kollmer, W. E. (1991): Cadmium in induced hair of the rat and its relation to the level in the diet and in the major organs during long-term exposure to cadmium in the subtoxic and toxic range. Journal of Trace Elements and Electrolytes in Health
and Disease 5(3), 165-171. Kruuk, H. (1995): Wild otters: predation and populations. Oxford University Press, Oxford. Kruuk, H. (1997): The significance of PCBs in otters: a reply. IUCN Otter Specialist Group Bulletin 14(2), 54-56. Kruuk, H., Conroy, J. W. H. (1991): Mortality of otters (Lutra lutra) in Shetland. Journal of Applied Ecology 28, 83-94. Kruuk, H., Conroy, J. W. H. (1996): Concentrations of some organochlorines in otters (Lutra lutra L. ) in Scotland: implications for populations. Environmental Pollution
92(2), 165-171. Kruuk, H., Conroy, J. W. H., Moorhouse, A. (1987): Seasonal reproduction, mortality and food
of otters (Lutra lutra L. ) in Shetland. Symposium of the Zoological Society of London 58, 263-278.
Leonards, P. E. G., Zierikzee, Y., Brinkman, U. A. T., Cofino, W. P. van Straalen, N. M. van Hattum, B. (1997): The selective dietary accumulation of planar polychlorinated
biphenyls in the otter. Environmental Toxicology and Chemistry 16(9), 1807-1815.
Macdonald, D. W. (1996): Dangerous liaisons and disease. Nature 379, 400-401.
R&D TECHNICAL REPORT W1-019/TR
39

Macdonald, S. M., Mason, C. F. (Eds)(1994): Status and conservation needs of the otter (Lutra lutra L. ) in the western Palearctic. Publication of the Council of Europe, Strasbourg. 54pp
Madsen, A. B. (1990) Oddere Lutra lutra og trafik. Flora og Fauna 96(2):39-46 Madsen, A. B., Dietz, H. H., Henriksen, P., Clausen, B. (1999): Survey of Danish Free living
otters Lutra lutra . A consecutive collection and necropsy of dead bodies. IUCN Specialist Group Bulletin. 16(2): 65-75.
Mason, C. F. (1989): Water pollution and otter distribution: a review. Lutra 32, 97-131. Mason, C.F. (1998): Decline in PCB levels in otters (Lutra lutra). Chemosphere 36(9), 1969-
1971. Mason, C. F., Last, N. I., Macdonald, S. M. (1986): Mercury, cadmium and lead in British otters. Bulletin of Environmental Contamination and Toxicology 37, 844-849. Mason, C. F., Macdonald, S. M. (1988): Metal contamination in mosses and otter distribution in a rural Welsh river receiving mine drainage. Chemosphere 17(6), 1159-1166. Mason, C. F., Macdonald, S. M. (1986): Otters: ecology and conservation. Cambridge
University Press, Cambridge. 236pp Mason, C. F., Madsen, A. B. (1990): Mortality and condition in otters Lutra lutra from
Denmark and Great Britain. Natura Jutlandica 22(14), 217-220. McFarland, V. A., Clarke, J. U. (1989): Environmental occurrence, abundance, and potential toxicity of polychlorinated biphenyl congeners: considerations for a congener-
specific analysis. Environmental Health Perspectives 81, 225-239. NRA (1995): Pesticides in the Aquatic Environment. Water Quality Series No. 26 ed. National
Rivers Authority, Bristol, UK. Neal, E. G. (1962): Otters. In: Animals of Britain No.8. (Ed: Harrison, L, Matthews) Sunday Times, London. Newton, I. (1988): Determination of critical pollutant levels in wild populations, with examples
from organochlorine insecticides in birds of prey. Environmental Pollution 55, 29-40.
Newton, I., Bogan, J. (1974): Organochlorine residues, egg shell thinning and hatching success in British sparrowhawks. Nature 249, 582-583.
Newton, I., Wyllie, I., Asher, A. (1993): Long-term trends in organochlorine and mercury residues in some predatory birds in Britain. Environmental Pollution 79, 143-
151. Nicholson, J. K., Kendall, M. D., Osborn, D. (1983): Cadmium and mercury nephrotoxicity. Nature 304, 633-635. Pratt, R, Sargent, G. (1997): Tutorial for first timers (Package including DMAP for Windows by
Alan Morton). The Mammal Society, Bristol. Safe, S. (1992): Toxicology, structure-function relationship and human environmental health impacts of polychlorinated biphenyls: progress and problems. Environmental
Health Perspectives 100, 259-268. Shore, R.F., Birks, J.D.S., & Freestone, P. (1999): Exposure of non-target vertebrates to second-
generation rodenticides in Britain, with particular reference to the polecat, Mustela putorius. New Zealand Journal of Ecology 23(2): 199-206
Siegal, S. (1956): Non parametric statistics for the behavioral sciences. McGraw-Hill, New York. Simpson, V.R. (1997): Health status of otters (Lutra lutra L. ) in south west England based on postmortem findings. The Veterinary Record 141 (8), 191-197. Simpson, V.R. (1998): A post mortem study of otters (Lutra lutra) found dead in South West
England. R & D Technical Report W148. Environment Agency, Bristol.
R&D TECHNICAL REPORT W1-019/TR
40

Simpson, V.R., Bain, M. S., Brown, R., Brown, B.F., Lacy, R.F. (2000): A long-term study of vitamin A and polychlorinated hydrocarbon levels in otters (Lutra lutra) in south west England. Environmental Pollution 110, 267-275.
Sokal, R.R. (1981) Biometry. WH Freeman & Co.USA. Stephens, MN (1957): The otter Report. UFAW, Potters Bar, Hertfordshire, UK. 88 pages. Strachen, R., Jefferies DJ(1996): Otter survey of England 1991-1994. The Vincent Wildlife Trust, London. Strafuss, A.C. (1988): Necropsy: Procedures and Basic Diagnostic Methods for Practicing Veterinarians. Charles C. Thomas, Springfield, Illinois, USA. 244 pages. Sugawara, N., Sugawara, C. (1991): Interactions of cadmium compounds with endogenous iron
in the intestinal tract. Bulletin of Environmental Contamination and Toxicology 46:263-270.
Tomlin, C. (Ed. ) (1994): The Pesticide Manual: incorporating the Agrochemical Handbook. 10th ed. Crop protection publications, Royal Society of Chemistry, Farnham & London. 1341 pages. van Bree, P.J.H., Jensen, B., Kleijn, L.J.K. (1966): Skull dimensions and the length/weight relation of the baculum as age indicators in the common otter. Danish Review of
Game Biology 4(3), 97-104. Wren, C.D. (1986): A review of metal accumulation and toxicity in wild mammals 1: Mercury. Environmental Research 40, 210-244. Zinkl,JG (1982): Noninfectious diseases of wildlife. Iowa State University Press, Ames,Iowa.
R&D TECHNICAL REPORT W1-019/TR
41
GLOSSARY The following terms are based on those found in Saunders Comprehensive Veterinary Dictionary, published by W.B.Saunders and Baillière’s Comprehensive Veterinary Dictionary by D.C. Blood & V.P.Studdert, published by Baillière Tindall. Adrenal gland – one of a pair of endocrine organs located near the cranial pole of the kidneys. Each is composed of two parts, an outer cortex and an inner medulla, that are anatomically, embryologically and functionally distinct. Atrophy – decrease in size of a normally developed organ or tissue wasting. Calculus – an abnormal concretion usually composed of mineral salts occurring within the animal body chiefly in the hollow organs or their passages. Also called stones. Effusion – the escape of fluid into a part. Hyperplasia – increase in size of a tissue or organ produced by an increased number of normal cells. Hypertrophy – increase in volume of a tissue or organ produced entirely by the enlargement of existing cells. Necropsy – the examination of a body after death. Necrosis – the morphological changes indicative of cell death caused by enzymatic degradation. Nodular – marked with or resembling nodules. Parenchyma – the essential or functional elements of an organ as distinguished from its stoma or framework. Peritonitis – Inflammation of the peritoneum. The cause may be infectious or chemical...in dogs and cats there is often effusion... Septicaemia – systemic disease associated with the presence and persistence of pathogenic micro-organisms and their toxins in the blood. The resulting syndrome is a combination of toxaemia and hypothermia, i.e. fever, mucosal and conjunctival petechiation and evidence of localisation in joints, eyes, meninges or heart valves. Proof is by positive blood culture or smear. Called also blood poisoning. Toxaemia – the condition resulting from the spread of bacterial products (toxins) by the blood stream.
R&D TECHNICAL REPORT W1-019/TR
42

APPENDIX I – POSTMORTEM RECORD SHEET
OTTER POSTMORTEM REPORT POSTMORTEM REF
NO. / / DETAILS OF OTTER:
CHEMICAL REF: DATE FOUND: EXAMINED BY:
AGE:
DATE: SEX: COLLECTED BY:
LOCATION:
CARCASS CONDITION:
FROZEN/FRESH NGR:
ENVIRONMENT AGENCYCONTAC
T:
CATCHMENT:
NOTES/MAILING LIST: BODY MEASUREMENTS BODY LENGTH mm TOTAL LENGTH
(NOSE-TO-TAIL) mm
TAIL mm WEIGHT Kg CONDITION INDEX (K) SUMMARY OF PATHOLOGICAL FINDINGS
REPRODUCTIVE STATUS
RENAL CALCULI
MALIGNANCY
ADRENAL ENLARGEMENT
PERITONITIS/SEPTICAEMIA
PARASITES
FIGHTING INJURIES
PROPOSED CAUSE OF DEATH
REFERENCE:
R&D TECHNICAL REPORT W1-019/TR
43

GROSS POSTMORTEM EXAMINATION: SKIN & SUBCUTIS
BODY CAVITIES
MUSCULO-SKELETAL SYSTEM
ALIMENTARY SYSTEM
RESPIRATORY SYSTEM
CARDIOVASCULAR SYSTEM
LYMPHORETICULAR SYSTEM
ENDOCRINE SYSTEM
URINARY SYSTEM
REPRODUCTIVE SYSTEM
NERVOUS SYSTEM
NOTES: SAMPLES REMOVED: BACULUM LIVER KIDNEYS SPLEEN OTHER
CALCULI HEART SKULL MUSCLE TESTES (TEETH) -20OC GI TRACT LUNGS 70%
ETHANOL CONTENTS HAIR
TIB/FIB UTERUS SCENT VIBRISSAE
R&D TECHNICAL REPORT W1-019/TR
44

APPENDIX II – Explanation of the boxplot. Data are ordered and the median or middle point is aligned the letter M. The two middle data points between the median and the lowest and highest values are called hinges and are assigned H. The principle continues through eighths (E) and letter values D, C, B, A and Z (which do not have names). When there is not a single central value, the central two data points are averaged. The midsummaries are then calculated from aver rages of the pairs of letter values. For a symmetrical distribution, these midsummaries will be equal.
A straightforward graphical way to examine residuals is by using a Box-and-Whiskers plot or boxplot. This is a graphical representation of the letter value display. Uneven residuals give non-symmetrical boxplots.
Reproduced from Fry (1993).
R&D TECHNICAL REPORT W1-019/TR
45

APPENDIX III – REGIONAL BREAKDOWN Total sample Chemical analysis sub-sample Welsh Midlands Anglian North
East North West
Welsh Midlands Anglian North East
North West
Total number of otters
210 44 33 27 19 113 16 14 6 8
Adult males 92 23 16 13 10 49 7 10 3 4 Adult females 40 10 5 5 3 22 6 1 0 2 Subadult males 31 5 7 4 3 17 0 2 1 0 Subadult females 30 3 4 2 3 16 2 1 1 2 Juvenile males 8 2 0 0 0 6 1 0 0 0 Juvenile females 5 1 0 2 0 3 0 0 1 0 Condition Index –
total sample Condition Index – chemical analysis sub-sample
Number of otters 184 112 Mean 1.04 1.06 Median 1.07 1.08
Welsh
Range 0.48-1.46 0.55-1.46 Number of otters 42 16 Mean 1.05 1.08 Median 1.07 1.09
Midlands
Range 0.59-1.42 0.78-1.33 Number of otters 23 13 Mean 1.11 1.20 Median 1.12 1.21
Anglian
Range 0.63-1.54 0.94-1.52 Number of otters 19 6 Mean 1.01 1.05 Median 1.00 1.09
North East
Range 0.72-1.42 0.78-1.34 Number of otters 15 7 Mean 1.08 1.09 Median 1.09 1.09
North West
Range 0.84-1.30 0.84-1.30 The results of analysis for gamma-HCH (hexachlorocycloheaxane), dieldrin, DDE, DDT and total PCB are shown on the graphs overleaf (ppm in lipid in liver). All showed a statistically significant difference in meanR between regions unless indicated by “*”.
R&D TECHNICAL REPORT W1-019/TR
46
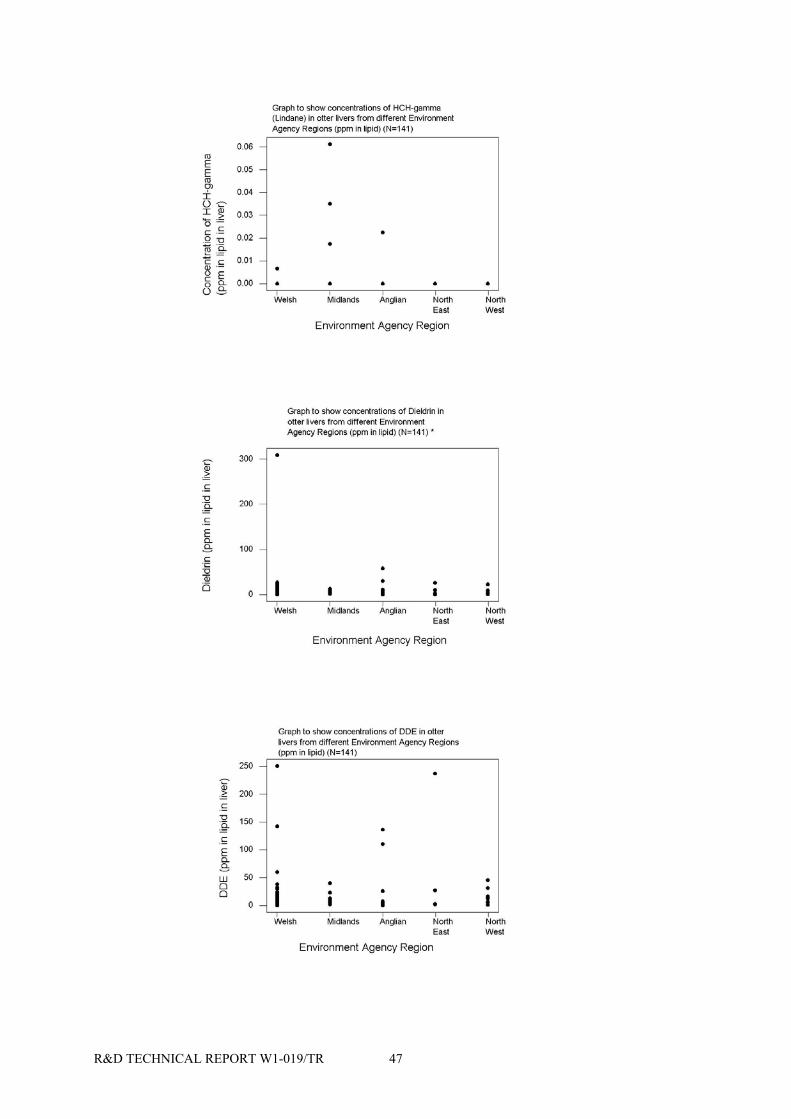
R&D TECHNICAL REPORT W1-019/TR
47

R&D TECHNICAL REPORT W1-019/TR
48