a powerful and vital report - oxford farming conference · a powerful and vital report ... session...
TRANSCRIPT


i

i
A powerful and vital report
This study was commissioned by the Oxford Farming Conference to provide information for the 2012 Conference whose theme is Agriculture: tomorrows' power. The Oxford Farming Conference Council wanted to produce a report that examines where the economic, political and natural resource power currently lies in world agriculture; how that might change in the future and what it means to British farmers.
I’m delighted to say that the team at SAC’s Rural Policy Centre have achieved that goal with this Power in Agriculture report. It contains vital findings and analysis for anyone who is farming today and will be farming into the future. The report’s content is based on literature reviews of recognised sources of statistics and research as well as SAC's extrapolation and interpretation of their findings. All sources are listed in the report's endnotes.
The report was made possible with support and funding from Lloyds TSB Agriculture, Massey Ferguson and Volac. On behalf of the Oxford Farming Conference and the wider farming community, I thank them for that support.
Much has been said about feeding a world population of over 9 billion by 2050 and a UK population of 70 million by 2030, against the background of a changing climate. What this report seeks to do is to show is where that food will come from and what resources will be needed to produce it.
A number of factors are highlighted that make this report timely:
Farm productivity must improve considerably over the next decade and beyond
The perception of a shift in global power eastwards
Increasing globalisation of agricultural trade, with increased levels of concentration in agricultural market places
The opening up of agricultural markets through a gradual process of trade liberalisation and de-regulation
The heavy reliance on use of natural resources, including non-renewables means factors, such as climate change and depletion of mineral reserves will be important.
Using a unique global power index, the report reveals that the UK is still a major agricultural player, but for the farming industry in this country to grow it needs to respond to the challenges of an increasingly globalised agricultural system and greater pressure on resources.
The Power in Agriculture report will be used throughout the conference and will form the basis of a key session on Where is the power in global agriculture? on the morning of the 5th January 2012, when farmers from across the UK and world will respond to the report. The session will be available online at the Oxford Farming Conference’s website www.ofc.org.uk by the end of January 2012. A copy of this report will also be on the site.
I urge all those involved in farming to read this report and share it with others so that they can build their own businesses and help British farming to continue to play a major role in helping to feed people in this country and elsewhere in a way that protects the planet.
Cedric Porter Chairman,2012 Oxford Farming Conference
ii
Executive Summary
Global power balance is shifting as a consequence of globalisation of markets and growth of transnational corporations.
While the UK may be perceived as a relatively small player in agricultural markets, it does punch above its weight in terms of global power, as a consequence of its position in terms of trade and the fact that it acts as a base for some significant transnational corporations (TNCs). This provides some opportunities as well as threats to UK farmers to work with the well-established commercial links the UK has e.g. to increase exports of commodities and value added products.
Consolidation of TNCs has seen some shifting of the focus of power, away from governments/ supranational bodies towards corporate businesses. This could be a source of concern for farmers exposed to upstream and downstream pressure. However the exercise of this power isn’t limitless and can be constrained by policy. Farmers and other stakeholders continue to wield influence over policy and can use this to shape the way TNCs operate.
Because of its size, the UK may not be well endowed with natural resources and therefore its position as an agricultural player depends on its ability to become significantly more productive. This requires a focus on policies that boost productivity such as investment in R&D.
Farmers in the UK face significant competitive pressures due to the growth of major players such as Brazil and India. However climate change may have a more benign effect and in tight global markets this could reinforce the position of UK farmers as part of the solution to some of the big global challenges.
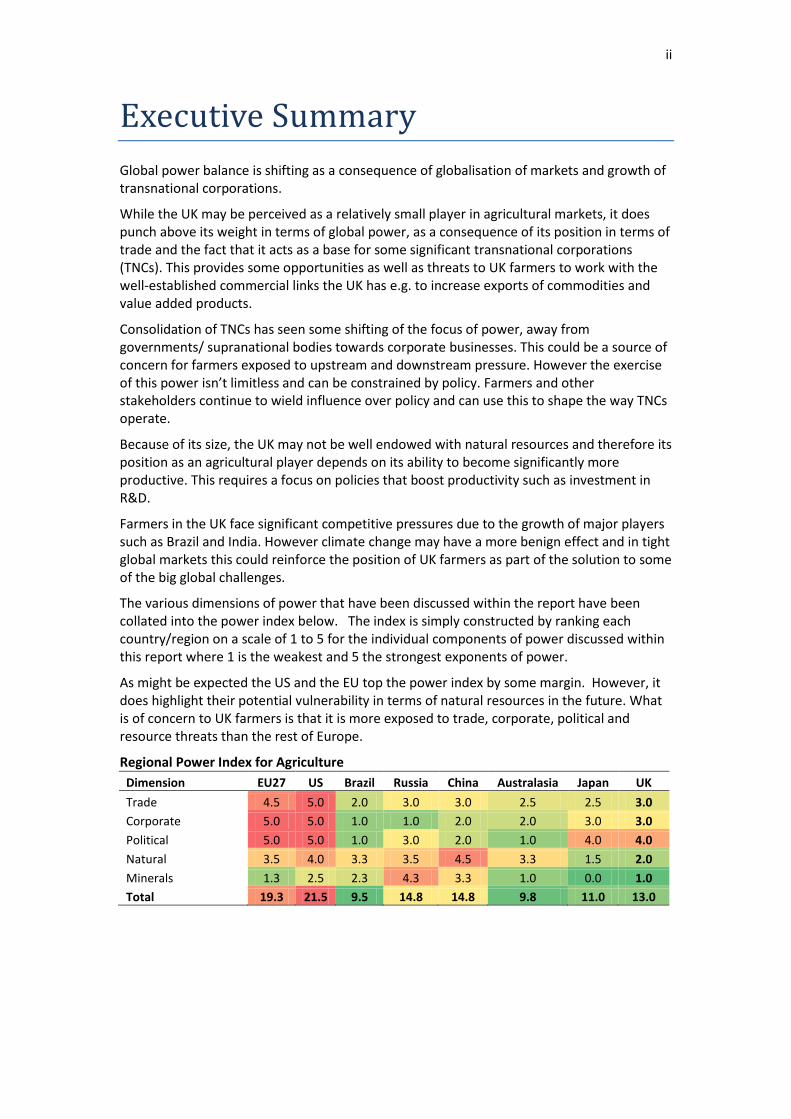
The various dimensions of power that have been discussed within the report have been collated into the power index below. The index is simply constructed by ranking each country/region on a scale of 1 to 5 for the individual components of power discussed within this report where 1 is the weakest and 5 the strongest exponents of power.
As might be expected the US and the EU top the power index by some margin. However, it does highlight their potential vulnerability in terms of natural resources in the future. What is of concern to UK farmers is that it is more exposed to trade, corporate, political and resource threats than the rest of Europe.
Regional Power Index for Agriculture
Dimension EU27 US Brazil Russia China Australasia Japan UK
Trade 4.5 5.0 2.0 3.0 3.0 2.5 2.5 3.0
Corporate 5.0 5.0 1.0 1.0 2.0 2.0 3.0 3.0
Political 5.0 5.0 1.0 3.0 2.0 1.0 4.0 4.0
Natural 3.5 4.0 3.3 3.5 4.5 3.3 1.5 2.0
Minerals 1.3 2.5 2.3 4.3 3.3 1.0 0.0 1.0
Total 19.3 21.5 9.5 14.8 14.8 9.8 11.0 13.0

iii
Contents A powerful and vital report .........................................................................................................i
Chapter One: Introduction ....................................................................................................... 1
Chapter Two: Economic Power ................................................................................................ 3
Summary................................................................................................................................ 3
Introduction ........................................................................................................................... 3
International Agricultural Trade ............................................................................................ 4
Aggregate import and export ............................................................................................ 4
Commodity-specific trade ................................................................................................. 6
Corporate concentration ..................................................................................................... 14
The overall picture ........................................................................................................... 14
Commodity-specific pictures ........................................................................................... 15
Future economic power ...................................................................................................... 19
Wheat trade .................................................................................................................... 19
Beef trade ........................................................................................................................ 21
Pork trade ........................................................................................................................ 22
Dairy products trade ........................................................................................................ 22
Conclusion ........................................................................................................................... 24
Chapter Three: Political Power ............................................................................................... 25
Summary.............................................................................................................................. 25
Introduction ......................................................................................................................... 25
Power within the WTO ........................................................................................................ 25
Power within the World Bank ............................................................................................. 29
Political power and Transnational Corporations (TNCs) ..................................................... 30
Conclusion ........................................................................................................................... 32
Chapter Four: Natural Resources and the Future of Power ................................................... 34
Summary.............................................................................................................................. 34
Introduction ......................................................................................................................... 34
Land ..................................................................................................................................... 35
Water ................................................................................................................................... 37
Minerals ............................................................................................................................... 37
Energy .................................................................................................................................. 41
Conclusion ........................................................................................................................... 42
Chapter Five: Summary and Conclusions ............................................................................... 44

1
Chapter One: Introduction
Developments in the agriculture and food sectors and the wider economy make the theme of 'power' particularly timely for a number of reasons.
First, the perception that global power is shifting eastwards has attracted considerable interest. For instance, the economies of the US and many European countries have continued to decline in recent years, whilst China’s economy has continued to grow, even during the recent economic turmoil. This has sparked speculation about whether the recent recession is a sign of the decline of US and European power in the world. This speculation raises the interesting question as to whether this decline in western economic power observed in other sectors is also evident in the agricultural sector.
Second, the agricultural system has become increasingly global and is highly commercialised and concentrated. For example, the fact that a few large transnational corporations (TNCs) handle the vast majority of the grain traded internationally is often cited as an example of both the globalisation and concentration of the agriculture sector. In addition, rapidly evolving global supermarkets are penetrating almost every corner of the globe. The emergence of these corporate actors in the food system has created a major reorientation in the locus of power, arguably, even further away from farmers.
It is contended by some that the agri-food system is entirely dominated and controlled by large agribusiness corporations. Within this system, the power of nation states can be blurred, for example, a commodity is grown in Africa, processed in USA and marketed in China. Some authors argue that this globalisation of the food system and the power of the TNCs have significant implications for food safety, social justice, fair competition and environmental sustainability, both in developed and developing countries. Therefore, it is important to explore how powerful these corporations are, and in which parts of the world they are concentrated.
Third, in a globally integrated food system there have been major changes in the way trade is conducted between nations. Closed-door policies to protect farmers from outside competition are disappearing as is the operation of state trading. Rather, due to the influence of globalisation - increased transnational migration, movement of assets and capital from one country or region to another – agricultural markets are prone to be more open than ever before. This evolution has given rise to dramatic changes in the global agri-food system, with once food-deficit countries appearing as powerful trade entities, giving rise to increased competition and power struggles in the international arena.
Fourth, a significant characteristic of the global agri-food system is the reliance on non-renewable natural resources like fossil fuels. Since these resources are scarce they often lead to conflicts and tensions between nation states; these tensions and struggles are likely to be exacerbated in the coming decades due to the impact of climate change. Therefore natural resource endowments will become an increasing source of power in global agriculture.
So, what is power? There is no single and unified definition of the term. However, among authors' many notions of power, the concept of “economic power” is very relevant to understanding the current global agricultural system. Economic power can be described as

2
the ability of an actor to compel, persuade, or control the behaviour of other actors through the deliberate and politically motivated use of economic assets (Frost, 20091; Whalley, 2009) such as the domestic market size of a nation state. At an international level, exercising economic power can take the form of the denial of market access, withdrawal of investments, the imposition of trade embargoes or the control of exports. Of two countries, the country with a larger domestic market often wins due to the other’s dependency on its market. For corporate businesses economic power may manifest itself in the ability to influence price and reduce the competition arising from very concentrated sectors.
The second important type of power considered is the “political” dimension of power, although it is difficult to differentiate between “politics” and “economics”, because one often feeds into the other. For this report, we define political power as the ability of actors to coerce, control or persuade others by using political means. For public actors, the most obvious source of such power is their political legitimacy acquired through electoral processes coupled with their positions in key decision making bodies. Reference to such powers held by nation states and their coalitions, e.g. the G8 group, The Economist2 writes:
“The powerful, like the victorious, do not just write history. They grab the seats at the top tables, from the United Nations Security Council to the boards of the big international economic and financial institutions. They collude behind closed doors. They decide who can join their cosy clubs and expect the rest of the world to obey the instructions they hand down.”
In agriculture a typical example may be the use by one country of the legal systems, authority or legitimacy of the World Trade Organisation (WTO) in gaining access into another country’s market. Such powers are sometimes also called the “institutional” dimension of power. At the corporate level, examples of political power may be the use of a corporate entity's political connections to influence public policy decisions, e.g. a ban of Genetically Modified (GM) foods.
In the literature reviewed for this report, economic and political dimensions of power are often discussed, but the power resulting from the possession of natural resources is less well documented. This is because the industrial scale and nature of agriculture relies heavily on the use of natural resources, such as water, minerals and energy. As many of these resources are scarce and non-renewable, actors having control over these resources are likely to be in a much stronger position to exert power. By the same token, those who have scarcity in these resources are likely to be vulnerable to outside control.
The purpose of this work is to enhance our understanding of the issues in global agriculture based on empirical evidence. In particular, the following issues are explored:
Who has the power in today’s globalised food system and where is it located?
Is the focus of power likely to shift in the future?
What might these power dynamics mean for European and, more specifically, British agriculture?
This report discusses the “economic”, political and natural resource dimensions of power. It then draws conclusions about the implications for British and European agriculture.
1 Frost, L. E. (2009) What is economic power? Joint Force Quarterly, April, 2009. Available at
http://findarticles.com/p/articles/mi_m0KNN/is_53/ai_n31506031/ (accessed 28/09/2011). 2 The Economist (undated). Who runs the world? Wrestling for influence. Available online at
http://www.economist.com/node/11664289 (accessed 28/09/2011).

3
Chapter Two: Economic Power
Summary
This chapter focuses on who are the major trading nations and the role of transnational corporations (TNCs) in the supply of agricultural products.
Agricultural trade is concentrated between relatively few countries, with the top 20 exporting and importing countries accounting for 78% of global exports and 70% of global imports. Similar levels of concentration can be found in the trade of individual commodities.
Trade patterns reflect factors including location and historic relationships. However, Regional Trade Agreements and other factors have led to new and evolving trade patterns emerging; particularly noticeable is the rising importance of a number of the BRICS countries (defined as Brazil, Russia, India, China and South Africa).
An ongoing process of consolidation through takeovers and mergers has meant that TNCs have become increasingly dominant in all aspects of the agricultural supply chain. It is estimated that:
Four companies account for between 75% and 90% of the global grain trade
10 companies are responsible for over 40% of the global retail market
Seven companies control virtually all fertiliser supply
Five companies share 68%of the world’s agrochemical market
Three companies control almost 50%of the proprietary seeds market Future trade estimates suggest that the focus of power is likely to remain with the EU and US into the near future, although the BRICS countries will continue to gain in importance. A key reason for power remaining in the EU and US is through the role of TNCs in the agriculture of emerging countries
Introduction In this Chapter an analysis of economic power in global agriculture is undertaken. As outlined in the previous chapter economic power is defined as the ability of actors to persuade, coerce or influence other actors (or thwart such attempts by others) by using economic assets – such as money and markets. Therefore, the economic power of countries is based on their financial positions and market sizes. This implies that actors possessing money and market strengths at their possession are likely to be in a position to influence others or prevent others from influencing them. For example, this has been reflected in the agricultural policies of both the EU and US.
The Common Agricultural Policy, one of the cornerstones of the EU, was based upon high levels of internal support for agriculture generated by protection from imports from outside of Europe. Particular attention is paid to the position of the UK or broadly the European Union vis-à-vis other powerful countries in the world, both in aggregate measures and specific commodity sectors. The analysis has tried to answer two key questions: who has the economic power in today’s global agriculture and what will this situation look like in 10-20 years time.

4
Whilst recognising that economic power may take many dimensions, two indicators provide the basis of our analysis – the size of international trade, and the magnitude of corporate concentration.
When examining trade patterns in agriculture it is pertinent to remember that historically agricultural trade has been heavily distorted by a range of factors including domestic agricultural policy, import protection and export subsidies. Trade patterns therefore reflect the influence of these factors. However, as ‘old style’ agricultural protection is declining it is useful to examine how trade patterns are evolving and what this means for the balance of power in agriculture.
International Agricultural Trade
Aggregate import and export According to the Food and Agriculture Organisation3 (FAO) of the United Nations, from 1999 to 2008, annual imports of agricultural products averaged over US$1.1 trillion per year. The statistics also highlight that over 70% of these imports are accounted for by only 20 countries. With average annual imports worth US$59 billion during this period, the USA ranks first as the largest importer, whilst the UK is fifth with average annual imports of US$40 billion (Figure 2.1). However, it should be noted that not all commodities that are imported into the UK are for use in the country as a proportion will be re-exported within the EU. In Asia and the Middle East only five countries have large import demands; China, Japan, South Korea, Saudi Arabia and Malaysia. None of the Latin American countries were in the top 20.
The top agricultural exporting countries in the world are shown in Figure 2.2. Between 1999 to 2008, only 20 countries accounted for 78% of annual agricultural exports (values) in the world. The USA consistently ranked first, with average annual exports of over US$70 billion
3 FAO (2010) FAO Statistical Yearbook 2010. Available at http://www.fao.org/economic/ess/ess-
publications/ess-yearbook/ess-yearbook2010/en/ (last accessed, 17/10/2011).
0 10 20 30 40 50 60 70
USA Germany
China Japan
UK France
Italy Netherlands
Belgium Spain
Canada Russia
Mexico Korea, South Saudi Arabia
Austria Denmark
Sweden Poland
Malaysia
billion US$ per year (1999-2008)
Figure 2.1 World's top 20 agricultural importers (Source: FAO Statistical Yearbook, 2010)

5
(11% of the world). Netherlands, France and Germany were in second, third and fourth positions and these four countries together accounted for more than a quarter of the world’s agricultural exports over the decade. Among the BRICS countries, Brazil and China occupy fifth and eighth place, with average annual exports of about US$28 and US$23 billions respectively. The other three countries within the BRICS coalition – India, Russia and South Africa – are not currently significant exporters.
Comparing the export figures with imports, we can see three broad country groupings. First, the USA, Netherlands, France, Germany, China, UK, Belgium, Italy and Spain are examples of countries that are both large exporters and importers. Second, Sweden, Russia and Saudi Arabia are examples of large importers, but not exporters. Finally, Brazil, Argentina, Indonesia, Australia, Thailand, India and New Zealand are major exporters, but not importers. In terms of power, does an importing country have power because it is wealthy enough to create the demand for goods? Or does power lies with the country that produces a surplus and exports? Whilst the graphs provide a snapshot of the trade situation, it is useful to consider how trade patterns have been evolving over time. Map 2.1 highlights how total agricultural trade has changed between an average of 1997-99 and 2007-2009, through presenting the change in net trade (exports minus imports). The darker blue the country/region the more the trade balance has increased the more red the country, the more trade has decreased.
A picture of a New/Old world split seems to emerge with North and South America and Australasia seeing improvement in their net agricultural trade balances whilst Europe’s have declined.4 There are a number of reasons for these changes, not least significant shifts in agricultural policy within the EU-27 that altered net-production balances. For example, reform of the sugar regime reduced EU production of sugar by around 6 million tonnes.
4 As the map is based on value of net trade, the scale of the change can be affected by changes in
prices between the two periods; however, it is still useful to highlight the direction of change.
0 10 20 30 40 50 60 70 80
USA Netherlands
France Germany
Brazil Belgium
Italy China Spain
Canada UK
Australia Argentina Denmark Thailand Malaysia
Indonesia Mexico
New Zealand India
Poland
billion US$ per year (1999-2008)
Figure 2.2 World's top agricultural exporters (Source: FAO Statistical Yearbook, 2010)

6
Map 2.1 Change in Net Trade (exports – imports) between average of 1997-99 and 2007-09
Commodity-specific trade Whilst the aggregate estimates of exports and imports give an idea of the major trading nations in the world, they do not address the strength of countries in commodities. This is important, because countries may have strengths in specific agricultural commodities and power struggles are likely to arise between two countries when they compete for the same commodity export market. Therefore, in this section we analyse commodity-specific trades in which the UK, or broadly the European Union, has interests. These include: wheat, beef and veal, pork, poultry and dairy products.
Wheat According to recent estimates available at the FAO trade database (TradeStat)5, the annual global import value of wheat is about US$40 billion. The top 20 importers of the world’s wheat are shown in Figure 2.3. These countries collectively account for over 58% of wheat imports.
As shown in Figure 2.3, Japan is the largest wheat importer in the world with annual imports valued at over US$2 billion. The major countries within the EU that import wheat are: Italy (2nd), Netherlands (7th), Spain (9th), Belgium (12th) and the UK (24th). The EU-27, as a single trading entity, ranks second in the world in terms of wheat imports, a figure that excludes intra-EU trade6. This shows that, although the EU is a major player in the world’s wheat import market, the UK in isolation is not very powerful.
5 TradeStat. Data available at http://faostat.fao.org/site/535/default.aspx#ancor (last accessed,
17/10/2011). 6 Estimates exclude intra-EU trade. If intra-EU trades are taken into account, EU-27 ranks first in the
world in the commodities analysed in this chapter.
7
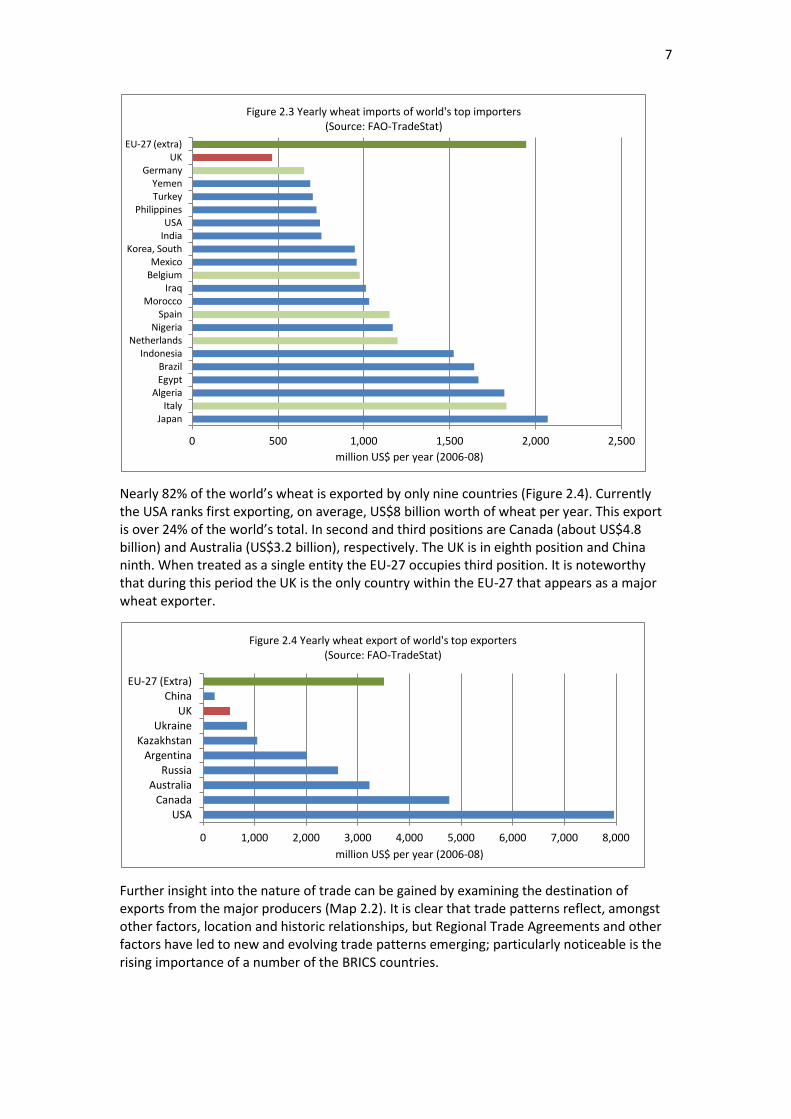
Nearly 82% of the world’s wheat is exported by only nine countries (Figure 2.4). Currently the USA ranks first exporting, on average, US$8 billion worth of wheat per year. This export is over 24% of the world’s total. In second and third positions are Canada (about US$4.8 billion) and Australia (US$3.2 billion), respectively. The UK is in eighth position and China ninth. When treated as a single entity the EU-27 occupies third position. It is noteworthy that during this period the UK is the only country within the EU-27 that appears as a major wheat exporter.
Further insight into the nature of trade can be gained by examining the destination of exports from the major producers (Map 2.2). It is clear that trade patterns reflect, amongst other factors, location and historic relationships, but Regional Trade Agreements and other factors have led to new and evolving trade patterns emerging; particularly noticeable is the rising importance of a number of the BRICS countries.
0 500 1,000 1,500 2,000 2,500
Japan Italy
Algeria Egypt Brazil
Indonesia Netherlands
Nigeria Spain
Morocco Iraq
Belgium Mexico
Korea, South India USA
Philippines Turkey Yemen
Germany UK
EU-27 (extra)
million US$ per year (2006-08)
Figure 2.3 Yearly wheat imports of world's top importers (Source: FAO-TradeStat)
0 1,000 2,000 3,000 4,000 5,000 6,000 7,000 8,000
USA Canada
Australia Russia
Argentina Kazakhstan
Ukraine UK
China EU-27 (Extra)
million US$ per year (2006-08)
Figure 2.4 Yearly wheat export of world's top exporters (Source: FAO-TradeStat)

8
Map 2.2 Value of wheat exports and destination of exports for major exporting countries, average 2007-2009
Beef and veal
Only 15 countries account for over 75% of beef and veal meat imports in the world (Figure 2.5). The USA is by far the largest, importing circa US$2.6 billion per year (>13% of the world). With an annual import of US$1 billion, the UK ranked eighth in the world during this time period. However, if we consider EU-27 as a single trading entity, it ranks third in the world, surpassing Russia. On average, the EU-27 import around US$2 billion worth of beef and veal per year which equates to about 10% of the world’s total.
0 500 1,000 1,500 2,000 2,500 3,000
USA Japan
Russia Germany
France Italy
Mexico UK
Netherlands Spain
Korea, South Canada
Egypt Chile
China EU-27 (Extra)
million US$ per year (2006-08)
Figure 2.5 Yearly import of beef & veal (boneless) by world's top importers (Source: FAO-TradeStat)

9
Whilst USA is the largest importer of beef and veal in the world, the country ranks fourth in terms of exports (Figure 2.6). Australia, Brazil and Netherlands rank ahead of the US in first, second and third positions, respectively. These four countries account for over 51% of the world’s total. With estimated annual exports of US$162 million the UK ranks 18th. The EU-27, as a single trading entity does not constitute a powerful exporter if we exclude intra-EU trade. The annual export of the EU-27 is around US$230 million, placing it in 16th position in the world.
Comparing both import and export figures, whilst some countries such as Netherlands and UK are both major importers and exporters, countries such as Australia, Brazil, Ireland, Argentina and New Zealand are only exporters (Map 2.3). In terms of market power, this means that, these export-only countries depend on the large importing countries for the viability of their beef and veal exports; again raising questions as to who ultimately has the power.
0 500 1,000 1,500 2,000 2,500 3,000 3,500 4,000
Australia Brazil
Netherlands USA
Ireland Argentina
New Zealand Germany
Canada Uruguay
Paraguay France
Italy Belgium
Denmark EU-27 (Extra)
UK
million US$ per year (2006-08)
Figure 2.6 Annual beef and veal (boneless) exports of world's top exporters (Source: FAO-TradeStat)

10
Map 2.3 Value of Beef and Veal Exports and export destination for main exporters, average of 2007-2009
The previous figures highlight a snapshot in time; however, it is useful to consider where the growth in trade is occurring. Map 2.4 therefore presents the change in net trade position (exports minus imports) for beef and veal between the periods 1997-1999 and 2007-2009. It clearly highlights the growth of exports from Brazil and Australia. This can be contrasted with the decline in the net position of the EU and the US over this period.
Map 2.4 Change in Net Beef and Veal Trade Balances between the average of 1997-99 and 2007-09

11
Pork Over US$24.8 billion worth of pork7 is imported annually in the world, with only 15 countries accounting for over 78% of these imports (Figure 2.7). Japan is the largest importer at circa US$3.67 billion, which represents over 14.8% of the world’s total. In the second and third positions are UK, Germany and Italy, each accounting for nearly 10% of the world’s imports respectively. Including Russia (7%), only five countries – Japan, UK, Germany, Italy and Russia – account for just over half of the world’s pork imports. The EU-27 does not occupy a major position in the world, if we exclude intra-EU trades.
Nearly 80% of the world’s pork7 is exported by only 15 countries (Figure 2.8). Denmark ranks first with a 15.8% share of the world market. The other notable exporting countries are Germany (13.3%), USA (11.8%), Netherlands (9.3%) and Spain (8.4%). These five countries collectively share nearly 60% of the world’s pork exports. The UK is not a major exporter (ranked 16th at $278 million) but the EU-27 external pork exports amount to $3.25 billion meaning it is the largest exporter of pork in the world. A comparison of the export and import figures indicates that some countries like Denmark, USA, Netherlands, Spain, Brazil, and Canada are major net exporters, whilst Japan, UK, Russia. Italy and South Korea are all significant net importers of pork.
7 The term pork is used in a generic sense to include the following FAO pig meat categories: (a) Pig
meat (meat, with the bone in, of domestic or wild pigs, whether fresh, chilled or frozen); (b) Pork (pig meat, excluding butcher fat and bones); and (c) Bacon and Ham (meat of pigs, whether salted, in brine, dried or smoked.)
0 500 1,000 1,500 2,000 2,500 3,000 3,500 4,000
Japan
UK
Germany Italy
Russia
France
USA
South Korea
Poland
Mexico
Netherlands
Greece
Romania
Hong Kong
Canada
EU(27)ex.int
million US$ per year (2006-08)
Figure 2.7 Yearly pig meat, pork, bacon and ham imports of world's top importers (Source: FAO-TradeStat)

12
Poultry meat The UK is the largest importer in the world with an estimated annual import of about US$2.35 billion (Figure 2.9), which is about 11.2% of the world’s total. Again, it should be noted that some of these imports will be re-exported within the EU. Japan (10.3%) and Germany (8.6%) are in second and third positions respectively. China and Hong Kong rank sixth and seventh in the world, but as one country, rank third. The EU-27 occupies fourth position as a single entity when intra-EU trade is excluded.
Only 15 countries currently export over 91% of the world’s poultry meat (Figure 2.10). As we can see, Brazil occupies first position with an annual export of nearly US$5.1 billion, which equates to about 23.6% of the world’s total. Whilst the UK is the largest importer of poultry meat, the country ranks 10th in the world in terms of export values (at over US$568 million
0 500 1,000 1,500 2,000 2,500 3,000 3,500 4,000 4,500
Denmark
Germany
USA
Netherlands
Spain
Canada
Belgium
France
Brazil
Italy
Poland
Austria
Chile
China
Hungary
EU(27)ex.int
million US$ per year (2006-08)
Figure 2.8 Yearly pig meat, pork, bacon and ham exports of world's top exporters (Source: FAO-TradeStat)
0 500 1,000 1,500 2,000 2,500
UK Japan
Germany Russian Federation
Netherlands China
China, Hong Kong SAR Saudi Arabia
France Mexico
Belgium Canada
United Arab Emirates Spain
Ireland EU-27 (Extra)
million US$ per year (2006-08)
Figure 2.9 Yearly poultry meat imports of world's top importers (Source: FAO-TradeStat)

13
per year). The EU-27 as a single entity occupies seventh position with annual exports of US$1.1 billion (about 5% of the world).
Again, a comparison of the import and export figures indicates that some countries like Brazil and Thailand are exporters only in the world’s poultry meat market.
Dairy products Fifteen countries account for over 63% of the world’s dairy product imports (Figure 2.11). Germany ranks first in the world with an annual import of over US$5.8 billion. Next is Italy (US$4 billion) and UK (US$3.3 billion). However, the EU-27, as a single entity, does not occupy a major position, ranking 16th in the world.
The top exporters of the world’s dairy products are shown in Figure 2.12. Germany ranks first with an annual export of US$8.1 billion (14.8% of the world). With annual exports of US$1.37 billion, the UK ranks 12th in the world, although it ranks third in terms of imports. The EU-27 ranks second having an annual export of US$7.8 billion (14.2% of the world). In
0 1,000 2,000 3,000 4,000 5,000 6,000
Brazil United States of America
Netherlands France
Thailand Germany
China Belgium
Poland United Kingdom
Hungary China, Hong Kong SAR
Denmark Italy
Ireland EU-27 (Extra)
million US$ per year (2006-08)
Figure 2.10 Yearly poultry meat export of world's top exporters (Source: FAO-TradeStat)
0 1,000 2,000 3,000 4,000 5,000 6,000
Germany
Italy
United Kingdom
Belgium
France
Netherlands
Spain
USA
Mexico
Saudi Arabia
Russian Federation
Japan
China
Algeria
Greece
EU-27 (Extra)
million US$ per year (2006-08)
Figure 2.11 Yearly imports of world's top dairy products importers (Source: FAO-TradeStat)

14
dairy we see that some countries like Australia and New Zealand are major exporters only and do not have substantial import demands.
Corporate concentration As discussed in Chapter One, transnational corporations (TNCs) have emerged as powerful players in the global agri-food system. According to UN Conference on Trade and Development (UNCTAD) estimates synthesised by Action Aid, in the year 2000, corporations were responsible for two-thirds of global trade with their worldwide sales quadrupling from US$3 trillion in 1980 to US$14 trillion in 20008.
Although TNCs, by definition, operate in multiple countries and hence do not belong to any specific country, their power is usually located in the headquarters of their home country. This is why TNCs are identified based on their country of origin – such as “US Corporation” or “Swiss Corporation”. In this section, TNCs are analysed in terms of their income, share of market and location.
The overall picture UNCTAD provides a list of the world’s top 150 agribusiness corporations which we have taken as the basis for our analysis (UNCTAD, 20099). According to this report, about 89% (133) of these corporations are located in just 20 countries (Figure 2.13). The largest number (43) are in the USA, which is over a quarter (28.67%) of the global total. In second position is the UK that is home to 11. In third and fourth positions are France and Germany with 10 and seven of the top corporations respectively (Figure 2.13).
8 Action Aid. Under the Influence: Exposing undue corporate influence over policy-making at the
World Trade Organisation. Available at http://www.actionaid.org.uk/index.asp?page_id=100300 (last accessed, 03/10/2011). 9 UNCTAD (2009) World Investment Report 2009: Transnational Corporations, Agricultural Production
and Development. New York and Geneva: United Nations.
0 1,000 2,000 3,000 4,000 5,000 6,000 7,000 8,000 9,000
Germany France
Netherlands New Zealand
Belgium Denmark
United States of America Australia
Italy Ireland Poland
United Kingdom Austria
Spain Belarus
EU-27 (Extra)
million US$ per year (2006-08)
Figure 2.12 Yearly export of dairy products by world's top exporters (Source: FAO-TradeStat)

15
Geographically, 44% of these corporations are located in just 17 countries of the European Union, 31% in just two countries of North America (USA and Canada) and 22% in the 14 countries of the Asia-Pacific region (Figure 2.14). This demonstrates the leadership of the EU global corporate power, although individually the major EU economies are small versus the corporate power of the USA.
Commodity-specific pictures The global food products industry, consisting of agricultural products and packaged foods, generated revenues of US$3.2 trillion in 200810. Only a few TNCs currently dominate this sector. In terms of annual turnover, the Swiss Corporation Nestlé ranks first in the world
10
IMAP (2010) Food and Beverage Industry Global Report – 2010. Available for download at http://www.imap.com/imap/media/resources/IMAP_Food__Beverage_Report_WEB_AD6498A02CAF4.pdf (last accessed, 17/10/2011).
43
11
10
10
7
7
5
5
4
4
4
3
3
3
3
3
3
2
2
1
0 5 10 15 20 25 30 35 40 45 50
USA
UK
France
Germany
Japan
Malaysia
Denmark
Italy
Canada
China
Netherlands
Australia
Belgium
Finland
Mexico
Singapore
Switzerland
Ireland
Norway
Austria
Figure 2.13 Home economies of world's top agribusiness TNCs (Source: UNCTAD, 2009)
EU-17 44%
N. America-2 31%
Asia-Pacific-14 22% Rest of the world-3
3%
Figure 2.14 Regional distribution of world's top 150 agribusiness TNCs (Source: UNCTAD, 2009)

16
with a turnover of over US$112 billion (Figure 2.15)11. Archer-Daniels-Midland (ADM) and Unilever ranks second and third with annual sales of US$62 billion and US$59billion respectively. The annual turnover of the top 11 companies combined is about US$393 billion. The total asset value of these TNCs is estimated to be US$439.5 billion. Using this indicator, Nestlé, Kraft Foods, and Unilever rank first, second and third respectively (Figure 2.15).
The ranking is similar for net annual income (Figure 2.16). With a profit of about US$37 billion, Nestlé ranks first, followed by Kraft Foods (US$5.7 billion) and Unilever (US$5.69 billion) which rank second and third respectively. The aggregate annual profit of the top 11 TNCs totals close to US$59 billion.
The global retail industry is currently dominated by 10-12 TNCs. In 2007, the top 10 retail TNCs shared 40% in worldwide retail sales (ETC Group, 2008 - Action Group on Erosion, Technology and Concentration). In 2010, the top 12 retail TNCs collectively had an annual turnover of US$1.32 trillion (Figure 2.17). With an annual turnover of about US$419 billion, the US Corporation Wal-Mart ranked first in the world. As shown in Figure 2.17, the other major TNCs are much smaller than Wal-Mart. The only UK retail TNC in this list is Tesco in seventh position. The asset values of these top 12 TNCs was over US$564 billion in 2010 and Wal-Mart alone represents 32% (US$180.3 billion) of this (Figure 2.17). The asset values of
11
FT Global 500. Data available at http://www.ft.com/cms/s/2/1516dd24-9d3a-11e0-997d-00144feabdc0.html#axzz1USBPfSjo (last accessed, 17/10/2011).
0 20 40 60 80 100 120
Nestle, Switzerland
Archer Daniels Midland, USA
Unilever, UK/Netherlands
Kraft Foods, USA
Wilmar International, Singapore
Danone, France
General Mills, USA
Kellogg, USA
Monsanto, USA
Heinz, USA
Cadbury, UK
Figure 2.15 Annual turnover and asset value of world's top food products TNCs (Source: FT Global 500)
Assets (billion US$)
Turnover (billion US$)
0 2 4 6 8 10 12 14 16 18 20 22 24 26 28 30 32 34 36 38
Nestle, Switzerland Kraft Foods, USA
Unilever, UK/Netherlands Danone, France
Archer Daniels Midland, USA General Mills, USA
Wilmar International, Singapore Kellogg, USA
Monsanto, USA Heinz, USA
Cadbury, UK
billion US$
Figure 2.16 Annual net income of world's top food products TNCs (Source: FT Global 500)

17
the next three TNCs – Carrefour, Tesco and CVS Caremark – were around one-third of Wal-Mart. This reiterates the economic prowess of Wal-Mart at the global level.
The net annual income (a measure of profit) from the 2010 sales of the TNCs was about US$36.5 billion. With income of over US$16 billion annually, Wal-Mart ranked first (Figure 2.18), Tesco ranked seventh in terms of annual turnover and second in net income (US$3.55 billion). In third position (US$3.4 billion) was another US Corporation – CVS Caremark.
The economic power of TNCs also manifests itself in agricultural inputs markets – such as agrochemicals, seeds and fertilisers. Like the other sectors, the global agri-input industry is highly concentrated where a few TNCs occupy substantial market shares (ETC Group, 2008). For example, in 2007, the top 10 agrochemical companies controlled 89% of the global market (Figure 2.19) with Bayer ranked first in the world, Syngenta second and BASF ranked third. Of the US$38.6 billion sales in the world, Bayer and Syngenta shared 19% each (around US$7.5 billion), and BASF 11% (US$4.3 billion). It is also apparent from Figure 2.19 that only five companies – Bayer, Syngenta, BASF, Dow and Monsanto – shared 68% of the world’s agrochemical market.
0 50 100 150 200 250 300 350 400 450
Wal-Mart Stores, USA
Carrefour, France
McKesson, USA
CVS Caremark, USA
Cardinal Health, USA
Metro, Germany
Tesco, UK
Kroger, USA
Walgreen, USA
Woolworths, Australia
Sysco, USA
Ahold, Netherlands
Figure 2.17 Annual turnover and asset values of world's top food retail TNCs (Source: FT Global 500)
Assets (billion US$)
Turnover (billion US$)
0 2 4 6 8 10 12 14 16 18
Wal-Mart Stores, USA Tesco, UK
CVS Caremark, USA Walgreen, USA
Woolworths, Australia Ahold, Netherlands
Seven & I Holdings, Japan Cardinal Health, USA
McKesson, USA Kroger, USA
Metro, Germany Sysco, USA
Carrefour, France
billion US$
Figure 2.18 Annual net incomes of world's top food retailing TNCs (Source: FT Global 500)

18
According to the ETC group, in 2007, the global sale of proprietary seeds was US$22 billion. By occupying about a quarter of this sale (about US$5 billion), Monsanto ranked first in the world, showing a clear dominance over the other companies (Figure 2.20). The next in order was DuPont (15%) and Syngenta (9%). These three companies controlled nearly 50% of the world’s seed market in 2007.
Only seven TNCs currently dominate the fertiliser market of the world (Figure 2.21). In terms of net income in 2007, Potash Corporation ranked first in the world (US$1104 million), while Yara (US$1027 million) and Mosaic (US$944 million) ranked second and third respectively (Figure 2.21).
0 1 2 3 4 5 6 7 8
Bayer, Germany Syngenta, Switzerland
BASF, Germany Dow Agrosciences, USA
Monsanto, USA DuPont, USA
Makhteshim Agan, Israel Nufarm, Australia
Sumitomo Chemical, Japan Arysta Lifescience, Japan
billion US$
Figure 2.19 Annual sales of world's top agrochemical TNCs (Source: Agrow World Protection News, 2008)
0 1 2 3 4 5 6
Monsanto (USA) DuPont (USA)
Syngenta (Switzerland) Groupe Limagrain (France)
Land O'Lakes (USA) KWS AG (Germany)
Bayer Crop Science (Germany) Sakata (Japan)
DLF-Trifolium (Denmark) Takii (Japan)
billion US$
Figure 2.20 Annual sales of world's top seed TNCs (Source: ETC Group, 2008)
0 200 400 600 800 1,000 1,200
Potash Corp, Canada
Yara, Norway
Mosaic, USA
Israel Chemicals Ltd, Israel
Agrium, Canada
K+S Group, Germany
Sociedad Quimicay Minera, Chile
million US$
Figure 2.21 Net annual income of world's top fertilizer TNCs in 2007 (Source: ETC Group, 2008)

19
Whilst these figures give an indication of the scale of the TNCs, they clearly do not tell the whole story in terms of power for a number of reasons. First, it should be noted that a number of very large companies are privately owned and therefore their figures are not publically available. Second, it does not tell us the number of countries that the companies operate in, nor the number of companies operating within a particular country. This is clearly important in terms of the degree of power faced by farmers. Third, as well as rapidly growing in size through the process of mergers and takeovers, other forms of business relationship have increased the economic power of TNCs. An example from the UK is the creation of Frontier as a joint enterprise between Cargill and ABF focusing on crop inputs and grain marketing. In effect this increases the economic power of both companies in the UK. In conclusion, UK farmers increasingly rely on transnational corporations to sell them their inputs and buy their goods. This might mean they have access to global technical developments and markets, but it does mean they are more exposed to international competition from other farmers.
Future economic power Agricultural policy changes effect changes in production patterns and these changes might influence future power in global agriculture. One aspect is changing trade patterns and, based on trade projections provided by the US Department of Agriculture (USDA)12 and the OECD-FAO Agricultural Outlook13, consideration is given to the situation for major commodities over the next 10 to 20 years.
Wheat trade Currently the major wheat importers in the world are Japan, Algeria, Brazil, Egypt, Indonesia and some of the major EU-27 countries such as Italy, Spain, Netherlands and Belgium. The USDA projections demonstrate that the imports of Egypt and Algeria are likely to increase, Brazil and the EU’s imports are likely to remain almost the same, and Japan’s import is likely to decline (Figure 2.22). The biggest rise in imports is predicted for Sub-Saharan African (SSA) countries. Since these are food deficit countries, the projections imply that the countries in this region remain vulnerable to the supplies of wheat from the key exporters.
12
United Stated Department of Agriculture (USDA). USDA Long-Term Agricultural Projection Tables. Available at http://usda.mannlib.cornell.edu/MannUsda/viewStaticPage.do?url=http://usda.mannlib.cornell.edu/usda/ers/94005/./2011/index.html (last accessed, 17/10/2011). 13
Organisation for Economic Cooperation and Development (OECD). OECD-FAO Agricultural Outlook 2011-2020. Data available at http://www.agri-outlook.org/pages/0,2987,en_36774715_36775671_1_1_1_1_1,00.html (last accessed, 17/10/2011).

20
The USDA projections of world wheat exports indicate that the exports from the USA –currently the biggest world exporter – is likely to decline from 2011/12 to 2013/14 and maintain an equilibrium state afterwards up to 2020/21 (Figure 2.23). A similar state of equilibrium is likely to be observed for EU-2714, Canada, and Australia. In contrast, the exports of Ukraine and Argentina are likely to rise slightly from 2011/12 onwards. The highest rise in export is predicted for Russia from 2010/11 onwards. Around 2020, Russia is likely to catch up or surpass USA’s wheat exports – emerging as a global leader. No major changes in the global status of China and India will likely take place. In terms of power shift this situation indicates that the former Soviet countries (i.e. Russia and Ukraine) would enjoy greater opportunities to extend their power in the African and Middle Eastern countries dependent on external supplies of wheat.
14
All estimates for the EU-27 exclude intra-EU trades
4
6
8
10
12
14
16
18
20 m
illio
n t
on
ne
s
Figure 2.22 Global wheat import projections (Source: USDA)
SS Africa (+South Africa) Egypt Brazil EU-27 Algeria Japan
0
5
10
15
20
25
30
35
mill
ion
to
nn
es
Figure 2.23 Global wheat export projections (Source: USDA)
EU-27 Canada Australia
Argentina Russia Ukraine
United States

21
Beef trade The import projections for beef meat (see Figure 2.24) suggest that the USA will continue to be the top importer of beef and this trend is likely to increase from 2011 onwards. A similar increase is predicted for Mexico. The import volume of the other key importers is going to be similar to current levels with the exception of the EU-27 where imports are predicted to decline from 2011 onwards.
The export projections show that the current dominant exporters are likely to maintain their positions in the future (Figure 2.25). The export volumes of Brazil and the USA are likely to increase even further. Although Australia is currently the second largest exporter of beef, USA is likely to catch up with Australia by 2017. Similarly, Argentina’s exports are likely to increase from 2014 onwards and it is likely to catch up with Canada and New Zealand by 2020. In terms of market power this situation indicates that some of the current dominant players, in particular, Australia, Canada and New Zealand are likely to face intense competitions from USA and Argentina. The projection for EU-27 indicates a decline in exports from 2014 onwards.
0
200
400
600
800
1,000
1,200
1,400
1,600
'00
0 t
on
ne
s
Figure 2.24 Global beef import projections (Source: USDA)
Japan
South Korea
EU-27
Russia
Mexico
Canada
United States
0
200
400
600
800
1,000
1,200
1,400
1,600
1,800
2,000
2,200
'00
0 t
on
ne
s
Figure 2.25 Global beef export projections (Source: USDA)
Australia
New Zealand
EU-27
Argentina
Brazil
Canada
United States

22
Pork trade Japan is predicted to continue to maintain its position as the top importer of world’s pork up to 2020 (Figure 2.26).Projections suggest that the quantity of pork imports by Mexico is likely to increase substantially from 2011 onwards, while Russia’s imports are expected to decline markedly.
Export projections indicate that USA’s share of the global market is likely to increase further while the share of the EU-27 is likely to decline from 2011 onwards (Figure 2.27). The export volumes of the other major exporters are predicted to increase only slightly.
Dairy products trade The OECD-FAO projections of dairy products15 trade in the world suggest that there is unlikely to be any change in the quantity of dairy products imported by the EU-27 up to 2020 (Figure 2.28). Russia and China – the two largest importers in the world at the moment – are likely to observe an uneven growth in their imports. Russia’s imports are likely to decline up to 2012 and then rise again up to 2020. China’s imports, on the other hand, are going to decline 100,000 tonnes per year up to 2015 and then rise again in the following five years, reaching over 800,000 tonnes per year in the year 2020. After an import decline in 2010-
15
Includes butter, cheese, skim milk powder, casein, and whey powder
0
200
400
600
800
1,000
1,200
1,400
'00
0 t
on
ne
s
Figure 2.26 Global pork import projections (Source: USDA)
Japan
China
South Korea
Russia
Mexico
Canada
0
500
1,000
1,500
2,000
2,500
3,000
'00
0 t
on
ne
s
Figure 2.27 Global pork export projections (Source: USDA)
Brazil
Canada
Mexico
EU-27
China
USA

23
2011, Algeria and USA are likely to rise again, reaching around 300,000 tonnes per year by 2020. Imports of South Korea and Sub-Saharan African countries are predicted to rise considerably (by some 100,000 to 150,000 tonnes per year).
The export projections for dairy products indicate no major changes in the current positions of some of the world’s top exporters, including Australia and the EU-27 (Figure 2.29). The USA and Argentina’s exports are likely to increase 1.5 times from their current status by 2020. The export of EU-27is predicted to decline up to 2013, then rise to a sustained level between 2014 and 2020. The highest rise in exports is likely to be observed for New Zealand – some 800,000 tonnes increase per year in 2020. The country is currently the world’s largest quantity exporter of dairy products; this trend is likely to continue up to 2020.
Future projections for agricultural trade and production are readily available, but this is not the case for changes in the corporate businesses that are responsible for trade. However, recent trends point towards the future development of the role of TNCs in global agriculture. It is likely therefore that we will see:
0
100
200
300
400
500
600
700
800
900
killo
to
ns
Figure 2.28 Projection of dairy products imports by major global importers (Source: OECD-FAO Agricultural Outlook, 2011-2020)
China
Saudi Arabia
Algeria
Sub-Saharan Africa
EU-27
Japan
Korea, South
USA
Russia
0
500
1000
1500
2000
2500
3000
killo
to
ns
Figure 2.29 Projection of dairy products exports by world's major exporters (Source: OECD-FAO Agricultural Outlook, 2011-2020)
Australia
EU-27
New Zealand
USA
Argentina
24
A continuing process of agglomeration through mergers and takeovers
Increasing ‘joint’ activity where TNCs identify benefits from co-operation together
Through this process of joint working, farmers will increasingly buy their inputs and their outputs to the same TNCs and the choice of suppliers and buyers will continue to decline
As the emerging markets become more important the degree of activity of TNCs in these countries is going to increase raising further questions of national versus corporate power
Conclusion The analysis of the economic power of nation states in the world indicates that, at present, the power is currently concentrated in North America and Europe. Despite certain countries such as Brazil and New Zealand being the world's largest exporters of key commodities (e.g. beef and dairy products). Also, while some of the major EU economies – such as Germany and the Netherlands – top world trade in certain commodities, the EU-27, as a single entity, does not. This means that the EU-27 has relatively less engagement with the outside world and acts as a crucial market for trades between its member states .In terms of global power, this provides a degree of self-sufficiency and may help to reduce the vulnerabilities of individual member countries.
The trade projections indicate, albeit crudely, that the current power situation is unlikely to be changed up to 2020. However, it is also apparent that the major EU economies and the US are unlikely to amass any further significant strength. Rather, the export capabilities of the EU-27 in some key commodity sectors are predicted to decline in the next 10 years, unless policy measures markedly change. This may include creating appropriate incentives to increase the productivity growth of European agriculture, through, for example, the adoption of productivity enhancing technologies or a return to more production related support mechanisms.
Our analysis also indicates that, although the emerging economies, in particular China and Brazil, have clear advantages in certain commodity markets, their corporate power in agriculture is still behind that of North American (US and Canada) and European countries, particularly the UK, France and Germany. These major EU economies therefore are in a strong position to consolidate their economic power through their transnational agribusiness corporations. In particular we have seen the process of TNCs controlling trade from countries such as Brazil. For example, the second largest sugar cane refiner in Brazil is largely owned by a French company. This picture is repeated in many different commodity sectors and is likely to be an ongoing process.
Whilst this process may be seen to be advantageous for the countries that the TNCs are based, it does give rise to a dilemma for policy makers considering the negative effects of TNCs monopolistic and monopsonic positions in the marketplace. Currently around 40-90% of the agricultural products, retail and input markets are controlled by only a few very large corporations. Given that reduced farm incomes in the UK and the EU have often been linked with the market power of the TNCs; the challenge for European and American countries is to balance corporate and farmer power whilst maintaining global power.

25
Chapter Three: Political Power
Summary
Political power is closely aligned to Economic Power. Political power is exercised through international agencies such as UN, IMF, World Bank and particularly important for agriculture, the World Trade Organisation (WTO).
The WTO is used as a case study to highlight the political dominance of the US and the EU in many international institutions. A strong correlation between contributions to the WTO budget and use of the dispute settlement mechanisms is shown, highlighting how economic power is linked to political power.
Shifts in the political basis of power can be seen with new groupings emerging to challenge the dominance of the US and EU. Potential shifts in political power reflect global changes in economic power with an increased role for the BRICS countries
The stalling of WTO talks has led to a proliferation of bi-lateral and regional trade deals which will have a major impact on agriculture
Using the World Bank as a further case study, the potential use of political power to support the economic interests of nations is highlighted.
TNCs expend considerable resources in lobbying activities to try to ensure that political power is used to support business interests. However, increasingly, individual states and civil society organisations are challenging the power of these corporations.
Introduction From the results provided in Chapter Two, it is apparent that the economic power in world agriculture is currently concentrated in the hands of a few countries – including USA, major EU countries, Canada, Australia, New Zealand, Japan, Argentina, Brazil, South Korea, and China – and some giant agribusiness corporations – including Nestle, Wal-Mart, Monsanto, Syngenta etc. In the following sections we will discuss the political power of these actors. As outlined in Chapter One, political power is defined for the purposes of this report as the ability of actors to persuade, compel or influence other actors by using political means – e.g. position, authority and governance rules. Since these concepts underpinning political power are not easily quantifiable, examples and narratives are used as evidence of political power within this report. The cases chosen are illustrative of the political power of actors in the global agri-food system.
Power within the WTO Given that the current global agri-food system is highly commercialised (or trade-oriented), an analysis of the WTO is vital for understanding the political power of actors and countries in today’s agri-food system.
Put simply, the WTO’s purpose is to facilitate the liberalisation of global trade (including agri-food trade) by acting as a ‘platform’ for countries to negotiate trade problems, settle disputes (e.g. market access, tariff concessions, and quotas), and formulate and sanction

26
trade rules16. The organisation currently has 153 members (countries) that cover almost 90% of global trade. In assessing the power of nation states within the WTO we have relied on three indicators – financial contribution to WTO (proxy indicator), capacity to use WTO’s dispute settlement mechanisms and influence in WTO’s decision making.
An analysis of the financial contribution of various member states to WTO’s budgets reveals that the WTO relies heavily on the donations of a few countries – most of which are the large trading nations that we have shown in Chapter Two. It is also noteworthy that the smaller economies make very little financial contribution. For instance, in 2011, only 12 countries, mostly large economies, collectively contributed over 79% of WTO’s budgets (Figure 3.1)17. The biggest five contributors in order are: EU-1518 (38.75%), USA (12.4%), China (11.18%), Japan (5%) and Canada (3%). Disregarding the EU as a single entity, the highest contributors in order are USA, China, Japan, Germany (8.86%), France (4.49%) and UK (4.84%).
Whilst financial contribution may not necessarily be an indicator of a country’s influence within the WTO, there does appear a strong relationship between the level of contribution and the use of the WTO’s platform. Our analysis reveals almost a perfect correlation between the proportion of budgetary contribution made by countries and their use of the WTO’s dispute settlement mechanisms. For instance, about 84% (351) of the 419 trade disputes brought into the WTO from 1995 through to 2010 were made by only 12 countries. The highest number of disputes was raised by USA (97), followed by EU (82), Canada (33), Brazil (25), India (19), Argentina (15), Japan (14), South Korea (14), Thailand (13), Chile (10) and China (8). Figure 3.2 shows that the rest of the 141 WTO member countries combined launched just slightly over 15% of the total number of complaints.
16
WTO. What is the World Trade Organisation? See the WTO statements at http://www.wto.org/english/thewto_e/whatis_e/tif_e/fact1_e.htm (last accessed, 17/10/2011). 17
Based on data provided in “WTO Annual Report 2011”. Available for download at http://www.wto.org/english/res_e/booksp_e/anrep_e/anrep11_e.pdf (last accessed, 17/10/2011). 18
These 15 countries are UK, Sweden, Switzerland, Spain, Poland, Norway, Netherlands, Italy, Ireland, Germany, France, Denmark, Belgium, Austria, and Portugal. Among these 15 nations Germany’s contribution is the highest (8.86%), followed by France (4.49%), and UK (4.84%). The contribution of other countries range from 3.7% (Italy) to 0.51% (Portugal).
0 5 10 15 20 25 30 35 40
EU-15 USA
China Japan
Canada South Korea
Mexico India
Thailand Brazil Chile
Argentina Rest of the world
% of global total
Figure 3.1 Share of financial contribution to WTO's budgets (Source: WTO, 2011)

27
Smaller economies are often unable to take advantage of the WTO’s dispute settlement system because of the high cost of the legal process. It is estimated that, for a market access case raised by an exporter, a ‘litigation only’ fee of US$500,000 is fairly common (Bown & Hoekman, 200519). The legal fees can be even higher. Instances were found that fees for parties in panel proceedings exceeded US$10 million (Nordstrom & Shaffer, 200720). Another reason is that relatively small domestic market size creates negligible impacts on the exports of larger economies and the retaliation of smaller economies by withdrawing tariff concessions under WTO’s sanctioning mechanisms. The other reasons include the fear of counter-retaliation and the dependence on imports from larger economies., as was evidenced in the reluctance of Antigua and Barbuda and Ecuador to retaliate against USA and the EC (former), respectively (see Nottage, 200921). These examples indicate that economic power and political power are inexorably linked.
In terms of influencing the WTO’s decision making, examples provided in the empirical literature indicate that the system has so far been dominated by a handful of countries, in particular, USA. Historically, this dominance is reflected in the way decisions regarding trade negotiations have been made in the WTO. According to its policy, the WTO operates on a “one country one vote” basis and its decisions are made based on “consensus”22. Some researchers (e.g. Jamara & Kwa, 200323; Monbiot, 200424; Steinberg, 200225) however found that, in reality, WTO decisions are often made through a process of informal negotiations between a few large and high-income member states. In these decisions the power
19
Bown, C. & Hoekman, B. (2005) WTO Dispute Settlement and the Missing Developing Country Cases: Engaging the Private Sector. JIEL, 8(4), pp. 861-870. 20
Nordstrom, H., & Shaffer, G. (2007) Access to justice in the World Trade Organisation: A Case for a Small Claims Procedure. ICTSD Dispute Settlement and Legal Aspects of International Trade Issue Paper No. 2, June 2007, pp. 9-10. 21
Nottage, H. (2009) Developing Countries in the WTO Dispute Settlement System. Global Economic Governance Working Paper 2009/47, Department of Politics and International Relations, University of Oxford. 22
See WTO. Op. cit. p. 26 23
Jamara, F. & Kwa, A. (2003). Behind the Scenes at the WTO: The Real World of International Trade Negotiations. New York: Zed Books. 24
Monbiot, G. (2004) The Age of Consent: A Manifesto for a New World Order. London: Flamingo. 25
Steinberg, R. H. (2002) In the Shadow of Law or Power? Consensus-Based Bargaining and Outcomes in the GATT/WTO. International Organisation, 56(2), pp. 339-374.
0 3 6 9 12 15 18 21 24
USA
EU
Canada
Brazil
Mexico
India
Argentina
Japan
South Korea
Thailand
Chile
China
Rest of the world
% of total complaints
Figure 3.2 Use of WTO's dispute settlement mechanism - share of total complaints launched since 1995-2010 (Source: WTO, 2011)

28
asymmetry between developed and developing countries become clearly visible. Monbiot (2004: 205-207), for instance, reports that before a round of trade talks begins in WTO, the agenda is first established by a group of powerful countries called the ‘Quad’, comprising USA, EU, Canada and Japan. These countries then make the decisions, with the token participation of small, low income countries, through a process called the ‘Green Room’ meetings before the formal constitutional talks even begin.
Historically, the developed Western nations, in particular USA, have dominated the WTO, but recent incidents indicate a power shift, with the emerging developing countries also appearing as powerful players. This power shift has manifested in the collapse of the Geneva talks under the Doha Development Agenda (which began in 2001) due to disputes between USA, EU, China and India regarding the liberalisation of agricultural trade.
The dispute arose when devising the Special Safeguards Mechanism in the ‘Agreement on Agriculture’ that allows a country to temporarily increase customs tariffs in response to a surge in import volumes or a sharp decline in price. Whilst, India and China wanted a 10% surge to be a cut-off point, USA wanted it to be 40%. According to India and China, a 10% cut-off point was quite reasonable and necessary to protect the livelihoods of millions of subsistence farmers from, what was in their view, an uneven (unfair) competition from the ‘heavily subsidised’ and corporatized Western agriculture. They also demanded a withdrawal of US and EU’s farm subsidies. Although the US proposed to reduce its farm subsidies, the amount was not acceptable to India and China. The USA accused India and China of protectionism, the position of the EU appeared to be leaned towards India and China. In a BBC interview, the EU Commissioner Mandelson said he was ‘profoundly disappointed’ that the talks had collapsed as a result of what he termed as the inflexibility of the USA26. He stated,
"What they're [USA] saying is that for every dollar that they strip out of their trade-distorting farm subsidies they want to be given a dollar's worth of market access in developing country markets…..That is not acceptable to developing countries and it's a principle that I on Europe's behalf certainly couldn't sign up to either."
This incident has been labelled in the international media as a significant shift in global power. A German business daily Handelsblatt, for instance, writes27:
“Above all the failure of the WTO talks reflects the changing power relations in the world. Gone are the days when the US and Europe could set the tone and largely draw up the world trade agreements amongst themselves. China and India took a tough stance. They fight hard for their interests and only support free trade when it suits them. The old industrial powers will slowly realize the bitter truth of this. Geneva was just a foretaste.”
The failure to reach agreement within the WTO has led to the proliferation of bi-lateral or regional trade agreements through the world.
26
BBC News (25 July, 2006). Europe blames US for WTO failure. http://news.bbc.co.uk/1/hi/5209010.stm (last accessed, 03/2010/2011). 27
Quoted in Spiegel Online International (30 July 2008). WTO Failure Reflects Changing Global Power Relations. http://www.spiegel.de/international/world/0,1518,569027,00.html (last accessed, 03/10/2011).

29
Power within the World Bank Apart from the WTO, another classic case for examining the political power of nation states in world agriculture is the World Bank. Like the WTO, the World Bank is also a global institution represented by 170 member states (World Bank, 201028). The organisation has historically played crucial roles in shaping global agriculture through its lending operations and technical assistance programmes (see Pincus, 2001)29. This trend still continues. For instance, in the Fiscal Year 2010, the Bank invested about US$2.6 billion in agricultural development programmes.
Some of the notable programmes that the World Bank has supported in the world include: irrigation development and farm mechanisation (in particular, during the so called “Green Revolution” of the 1960s and 1970s), agricultural credit, Integrated Rural Development Projects (IRDPs) and agricultural trade liberalisation and privatisation through Structural Adjustment lending programmes (Pincus, 2001). More recently, following a summit in Pittsburgh in September 2009, the World Bank has approved a Global Agriculture and Food Security Programme (GAFSP) in order to respond to the financial needs in developing country agricultural sectors (World Bank, 2010).
Whilst, the World Bank is represented by 170 member countries, the voting power of individual countries within the Bank is not equal and linked to the financial contribution made by each member country. Thus, the country that contributes the most has the highest voting power; this is the USA with 16%of the voting power (See Figure 3.3). The UK ranks fifth position. If we analyse this voting power in terms of economic coalitions, we see that
28
World Bank (2010). The World Bank Annual Report 2010: Year in Review. Washington DC: The World Bank. 29
Pincus, J. (2001) The Post-Washington Consensus and Lending Operations in Agriculture: New Rhetoric and Old Operational Realities. In: C. Lapavitsas & J. Pincus (eds.) Development Policy in the 21
st Century. London: Routledge.
0 2 4 6 8 10 12 14 16 18
United States
Japan
Germany
France
United Kingdom
Canada
China
India
Italy
Russia
Saudi Arabia
Netherlands
Brazil
Belgium
Spain
Switzerland
Australia
Iran
Mexico
Argentina
Figure 3.3 Subscription and voting power of top 20 countries in the World Bank (Source: World Bank, 2011)
Voting Power (% of total)
Subscription (% of total)

30
the G-7 block30 has the highest voting power (44%), while the BRIC coalition, comprising of the emerging economies, has only 11% of the votes.
In terms of global power in agriculture, this distinction is important since greater voting power enables countries or coalitions to push forward their own World Bank agenda by influencing decisions like which country receives loans and under what conditions.
World Bank policies and programmes have significant implications for both developed and developing countries. For instance, through its Structural Adjustment lending programmes the World Bank persuaded many developing country governments to slash their budgetary support to agriculture, privatise state-owned corporations and adopt liberalised policies in agricultural trade. The Bank used these reforms as “pre-conditions” for sanctioning loans to debt-ridden developing countries and this condition-based loan-sanctioning mechanism is still in practice (see Oxfam, 200631). However, these changes were crucial for powerful countries like USA and its agribusiness corporations to gain access to developing country markets. Similarly it has been argued that, since the 1970s, the USA has systematically used its influence in convincing the Bank not to grant loans that could facilitate the production of goods that would compete with US products, i.e. palm oil, citrus fruits and sugar (Toussaint, 200632).
Whilst, the World Bank has historically been dominated by powerful economic coalitions such as the USA and the G-7 group, recently, there has been a shift in this power game. Although it is still the USA and the EU countries that have most of the power, the Bank has recently provided more power to emerging economies like China and India (World Bank, 2010). This clearly shows a changing geopolitical landscape with clear signs of power shift from the West to the East. As the Chairman of the World Bank Group, Robert Zoellick himself stated in the 2010 annual report of the Bank:
Our shareholders..... fulfilled the commitment....to increase voting power at the International Bank for Reconstruction and Development (IBRD)33 for developing and transition countries by at least 3 percentage points, bringing them to 47.19 percent—a total shift of 4.59 percent since 2008. Developing-country voting power in the International Development Association (IDA) will rise to more than 45 percent. Developing and transition countries’ shares at the International Finance Corporation (IFC) will increase by 6.07 percent to 39.48 percent. These changes in voting power help us better reflect the realities of the new multipolar global economy, where developing and transition countries are now key players.
Political power and Transnational Corporations (TNCs) From the above analyses one might get an impression that it is the nation states that are in a position to influence the ‘rules of the games’ in world agricultural policies and trades. This is however only a part of the picture. The reality is that the decisions taken by the public
30
The G7 member countries are France, Germany, Italy, Japan, UK, USA, and Canada. The G7 (which is an informal grouping) is considered to be the most powerful economic and political coalition in the world. Although it should be noted that with the addition of Russia it has become known as the G8, and there are reports that France is keen to expand it further to include other countries such as Brazil, India and China. This again can be seen to reflect the changing balance of political power in the world. 31
Oxfam (2006) Kicking the Habit: How the World Bank and the IMF are still addicted to attaching economic policy conditions to aid. Oxfam Briefing Paper 96, November 2006, Oxfam, UK. 32
Toussaint, E. (2006) The influence of the United States on the World Bank. Available at http://www.cadtm.org/The-influence-of-the-United-States (last accessed 14/10/2011). 33
IBRD, IDA, and IFC are collectively called the “The World Bank Group”.

31
authorities concerned – whether national governments or the bureaucrats in global institutions like the WTO – are often influenced by large TNCs (Action Aid34; Fuchs & Clapp, 200935). There are two major ways through which such influences occur – corporate lobbying (and political campaign financing) and corporate connections with public office holders.
According to Action Aid, around 15,000 corporate lobbyists are based in Brussels and around 17,000 in Washington DC alone. The annual expenditure of these lobbying activities is estimated to be €0.75 to €1 billion in Brussels and US$13 billion in USA. Agribusiness TNCs account for a large proportion of this expenditure (Figure 3.4). Between 2008-2010, for instance, it is estimated that Monsanto alone, one of the world’s largest seed and agrochemical firms, spent over US$8.5 million per year in lobbying36 and only three companies – Monsanto, Syngenta and Dow – donated over a quarter million US$ to democrat and republican parties during the 2009-2010 election cycle (Agri-Pulse, 2010)37. Using such influences, it is argued that big agribusiness corporations have often attempted to block US policy reforms that were against their interests (Jowit, 201038; Madsen & Davis, 2011)39.
Although lobbying obviously plays a part in influencing trade decisions, expenditure is not the only indication of lobby power. Organisations that represent large numbers of people – such as business or consumer organisations – can also wield power and influence.
34
Op. cit. p. 14 35
Fuchs, D. & Clapp, J. (eds.) (2009) Corporate Power in Global Agrifood Governance. Cambridge: The MIT Press 36
Lobbying Database, Centre for Responsive Politics, http://www.opensecrets.org/lobby/index.php (last accessed, 28/09/2011) 37
Agri-Pulse Communications Inc. (2010) Agri-Pulse Newsletter, Volume 6, Number 7, February 17, 2010, http://www.northamericandevon.com/pdfs/02172010.pdf (last accessed, 28/09/2011). 38
Jowit, J. (2010) Corporate lobbying is blocking food reforms, senior UN official warns, Guardian online http://www.guardian.co.uk/environment/2010/sep/22/food-firms-lobbying-samuel-jutzi 39
Madsen, T. & Davis, B. (2011) Growing Influence: The Political Power of Agribusiness and the Fouling of America’s Waterways. Available for download at http://www.pennenvironment.org/reports/clean-water/clean-water-program-reports/growing-influence-the-political-power-of-agribusiness-and-the-fouling-of-americas-waterways
0 1 2 3 4 5 6 7 8 9
Monsanto Co
Kraft Foods
Tyson Foods
Nestle SA
Safeway Inc
Archer Daniels Midland
Smithfield Foods
Bunge Limited
Syngenta Corp
General Mills
Dow Chemical
Kellogg Co
Kroger Co
million US$ per year (2008-2010)
Figure 3.4 Annual lobbying expenditure of some of the world's top agribusiness TNCs (Source: Centre for Responsive Politics)

32
In addition to lobbying, corporations often influence public policy decisions by using their connections and influences within key policy making bodies. For instance, because of Monsanto’s long history of collaboration with the US administration, the company has amassed substantial political capital in the US (African Centre for Biosafety, 2011: 7)40. Many former executives of Monsanto worked for, and have recently been deployed in, the US Department of Agriculture (USDA), the US Food and Drug Administration (FDA), and the US Agency for International Development (USAID) (African Centre for Biosafety, 2011: 7). It is argued by authors cited in this report that such connections may enable the company to influence policy development to their advantage.
Although the political influence of the TNCs is well-documented, examples are found that their power is being challenged, not only by states, but also by civil society groups (e.g. activists) and farmer organisations. A classic example of a clash between state power and corporate power is reflected in the actions taken by various governments against GM technologies.
Some examples include the decision by the French government in February 2008, to ban the cultivation of Monsanto’s MON810 on safety grounds (AFP News, 2008)41. The EU authorities also forcefully returned unapproved GM foods that had arrived in the EU on two occasions (Davison, 2009)42. Similarly, an Indian Environment Minister imposed a moratorium on the cultivation of GM Brinjal (egg plant) in February, 2010 (Mohiuddin, 2010)43. In 2002, farmer organisations lobbied for Monsanto to withdraw its applications for regulatory approval of GM wheat submitted to the Canadian and US authorities. Soon afterwards the company publicly declared its intention to stop Research and Development (R&D) of GM wheat in 2004 (Falkner, 2009)44. Following eight years campaign by Greenpeace in Brazil, German company Bayer finally halted trying to introduce GM rice to Brazilian farmers45.
Conclusion In this chapter we have analysed global power in agriculture by taking selected case examples. Our analysis shows that the political power relevant to global agriculture is still concentrated in the hands of the USA, major EU countries, and some other economically powerful countries within the G-7 coalition. However, recently there have been indications that this situation is changing and some emerging economies in the developing world are increasingly appearing to be powerful players at the world stage. This has important implications for European and UK agriculture, in particular, in terms of transnational agricultural trades. In the coming decades, EU countries may have to confront difficulties and competition for market access. This competition is likely to come from emerging economies – like China, India and Brazil.
40
African Centre for Biosafety (2011) Heavy Hands: Monsanto’s control in South Africa. Available at http://www.biosafetyafrica.org.za/index.php/20110513357/HEAVY-HANDS-Monsanto-s-control-in-SA/menu-id-100026.html (last accessed, 28/09/2011). 41
http://afp.google.com/article/ALeqM5hyDkekOSZZGL5lcgjIfbHcjp8GLw (last accessed, 29/09/2011). 42
Davison, J. (2010) GM Plants: Science, politics and EC regulations. Plant Science, 178 (2), 94-98. 43
Mohiuddin, Y. (2010) India says no to first GM food crop. http://www.google.com/hostednews/afp/article/ALeqM5hx8gKVOxrM8-7Pkj6nWSsPwbXBIw (last accessed, 29/09/2011). 44
Falkner, R. (2009) The Troubled Birth of the “Biotech Century”: Global Corporate Power and Its Limits. In J. Clapp & D. Fuchs (eds.) Corporate Power in Global Agrifood Governance (pp. 225-251). Cambridge, MA: The MIT Press. 45
Greenpeace International 2010 Annual Report. Available for download at http://www.greenpeace.org/international/en/about/reports/#a0 (last accessed, 29/09/2011).

33
Our analysis also confirms the political influence of transnational corporations (TNCs) in global agriculture. However, we also find evidence that their power is not limitless in achieving all their goals. This finding does not corroborate the suggestions made by some that, in this age of corporate globalisation, the state is powerless to resist corporate activities. The findings however do indicate the significance of civil society organisations and farmer groups in countervailing or balancing corporate influences.

34
Chapter Four: Natural Resources and the Future of Power
Summary Agriculture depends heavily on the exploitation of increasingly scarce natural resources and their endowments differ considerably between nation-states.
Around 75% of agricultural land is located in only 25 countries with the top five countries (China, US, Brazil, Australia and Russia) having over one third of the world's agricultural area.
Of the estimated renewable water reserves 67% are located in just 15 countries.
China and the US are currently the largest Phosphate producers, the bulk of known reserves are located in Africa (Morocco and Western Sahara account for 77%of known reserves). For Potassium, five countries control 80% of production, with Russia and Canada being the major producers and also having the largest reserves.
The European Union is shown to be resource poor when it comes to key minerals associated with agriculture. But parts of the EU might escape the worst effects of climate change.
With current rates of extraction (and known levels of reserves) many key producing countries will run out of reserves in the relatively near future.
Population growth, depleting mineral reserves and the impact of climate change will all put increased pressures on natural resource availability and it is clear, as evidenced through the process of ‘land grab’, that control of natural resources will become increasingly important as they become more scarce.
Introduction In the earlier Chapters the economic and political powers of actors in global agriculture in terms of relative market size, financial wealth and political clout have been examined. In this Chapter the focus is on a different notion of power – the possession of natural resources – that may provide nation states important bargaining chips in the agri-food system. This is because the agricultural industry depends heavily on the exploitation of increasingly scarce natural resources, whose endowments differ considerably between nation-states. In order to understand the power of players in global agriculture it is therefore necessary to take these differences into consideration.
While natural resource endowments as a source of power are emphasised, it is not proposed that countries that lack natural resources within their borders are less powerful than others. Japan, for example, became the second largest economy in the world in the twentieth century without significant natural resource endowments. In contrast, some well-endowed countries have failed to turn their natural resources into wealth or power. For example, many African countries have remained weak despite their possession of precious minerals like diamond, iron ore and bauxite. Rather, mineral wealth became a curse46 for many of these countries due to their lack of other types of power, such as economic and political.
46
See the “resource curse” theory at http://en.wikipedia.org/wiki/Resource_curse (last accessed, 18/10/2011).

35
Whilst recognising this historical fact, the role of natural resources are emphasised for three key reasons. First, the lack of natural resources can make countries dependent on external supplies and therefore potentially vulnerable to interruptions in these supplies. Although countries can overcome this vulnerability by finding substitutes, either naturally or through technological innovations, many of the natural resources used in agriculture currently have little or no substitutes.
Second, since natural resources are scarce and unevenly endowed, they often lead to power struggles and conflicts, which may impact the economic and political vulnerabilities for resource-scarce countries. Third, since there are shifts in global economic and political powers (see previous Chapters) it may be the case that currently powerful countries may lose their ability to control the markets for natural resources, leading to an increased vulnerability. This Chapter provides a brief assessment of the natural resource endowments in the world and explores whether the dominant players in today’s global agriculture are likely to become vulnerable in future. As in the previous chapters, we have focused our analysis and consider four critical natural resource endowments, namely, land, water, minerals and energy.
Land Agriculture is primarily a land-based industry, meaning land can be considered the most important of all agricultural resources. About 74% of the world’s 4.8 billion ha of agricultural land is located within the borders of only 25 countries. China (10.7%), Australia (8.5%), USA (8.4%), Brazil (5.4%) and Russia (4.4%) are the top five countries in the world in terms of total agricultural land (FAO, 2010).47 Collectively, they occupy over one-third (37%) of the world’s agricultural area.
The UK’s position is 51st. Simply ranking by area may be misleading as it does not take into account the population that the land has to sustain (for example the situation in China). In addition it does not take account of the quality of the land. Correcting for population, Mongolia has the highest per capita agricultural area (44 ha/person), followed by Australia (20 ha/person) and Namibia (18 ha/person). By using this indicator, some large countries i.e. Russia, Brazil, USA and China become much less land rich. For instance, Russia’s position is 32nd, Brazil’s 35th, USA’s 36th and China’s 109th. Of course, this figure is still only a crude indicator as it is not adjusted for the quality (productivity) of the land.
In terms of only arable land (which may be argued to better reflect productive capacity) the USA ranks first in the world with an endowment of 170.5 million ha – over 12% of the world’s total (1.4 billion ha). India ranks second (11.5%), Russia (8.8%), China (7.9%) and Brazil (4.4%). When per capita arable land holding is examined, the picture becomes different (Figure 4.1). Using this indicator, Australia ranks first in the world. In the second and third positions are Kazakhstan and Canada. Brazil ranks 37th in the world with per capita arable land of 0.32 ha, India ranks 106th with 0.13 ha and China ranks 138th with only 0.08 ha.
It is interesting to note that some of the EU countries (shown in yellow bars) are within the top 25 in the world in terms of per capita arable land holding. However, none of these are the agriculturally powerful countries. For instance, France’s position in the world is 41st (0.29 ha) and the UK’s 126th (0.09 ha).
47
Op. cit. p. 4. Total agricultural land includes Arable Land + Land under Permanent Crop + Pasture Lands.

36
As a final point, our analysis of the world’s arable land holdings also shows that the per capita land holding has declined in some of the major world economies over the last five decades (Figure 4.2)48. Whilst the reasons have been country specific and have included such factors as land use change to pasture and afforestation, population growth and urbanisation, it does indicate the level of pressure on the land resource and why some countries, particularly China are looking elsewhere for land to secure supplies. Among the major EU economies, the per capita arable land holding has declined in France and UK since the 1960s; whilst in Germany and the Netherlands, it has remained at a relatively stable level.
48
Based on World Bank data at http://data.worldbank.org/indicator/AG.LND.ARBL.HA.PC (last accessed, 03/11/2011).
0 0.5 1 1.5 2 2.5
Australia Kazakhstan
Canada Niger
Russia Argentina
Ukraine Paraguay
Belarus Lithuania
Guyana USA
Latvia Moldova
Sudan Uruguay Hungary
Estonia Cent Afric Repub
Denmark Finland
Burkina Faso Romania Bulgaria
Chad UK
Figure 4.1 World's top 25 countries according to per capita arable land holding in hectares vis-a-vis UK (Source: FAO, 2010)
0
1
2
3
4
Figure 4.2 Trends of per capita arable land holding in hectares in agriculturally powerful non-EU countries (Source: World Bank)
Australia New Zealand Brazil
China USA Canada

37
Water After land, water is perhaps the most important of the natural resources used in agriculture. It is argued that a major part of the increased productivity of the agricultural sector has been due to the use of irrigation. Water is also required in the manufacturing and processing of many food products. It is therefore not surprising that, among all modern industrial sectors, agriculture is the major user of water in the world, accounting for around 70 %of water abstraction (FAO).
Whilst all countries rely on water for their agricultural activities, the endowment of the world's natural water resources is highly skewed. The total renewable water resource (by volume) in the world is estimated as just over 54 billion m3 per year49. However, about 67% of this is located in just 15 countries and many of these water-rich countries are developing economies (Figure 4.3). The major EU economies actually appear to be water poor in comparison to these developing countries, with the EU-27 despite its land mass only having the eighth highest water resources globally. The advanced EU economies are in a more vulnerable situation in terms of natural renewable water levels in comparison to some of the food giants – such as USA, Canada and the BRIC countries. In terms of per capita actual water availability (trillion m3 /inhabitant/year), however, only one major agricultural country (Canada) appears in the top 10.
Minerals Modern agricultural production relies heavily on the use of fertilisers, especially, urea, phosphate and potash. While urea comes from inorganic sources, the other two minerals are extracted from mines. Phosphorus, for example, comes from phosphate rock. As these mineral resources are non-renewable and have no alternatives at the moment, their possession and control can be a source of power for actors in the global food system.
49
The estimates are based on FAO-AquaStat data that are available at http://www.fao.org/nr/water/aquastat/data/query/index.html?lang=en (last accessed, 18/10/2011).
0 1,000 2,000 3,000 4,000 5,000 6,000 7,000 8,000 9,000
Brazil
Russia
USA
Canada
China
Colombia
Indonesia
Peru
India
Congo (DRC)
Venezuela (BRV)
Bangladesh
Myanmar
Chile
Viet Nam
United Kingdom
EU-27
billion m3/year
Figure 4.3 Top 15 water rich countries vis-a-vis EU-27 (Source: FAO AquaStat)

38
Almost the entire reserve of world’s phosphate rock, which is estimated to be 65 billion tonnes, is located in 15 countries only (USGS, 201150). Nearly 77% of this reserve is in Morocco and Western Sahara (M&WS) alone and over 98% is in just nine countries (Figure 4.4). It is noteworthy that except M&WS, some of the countries with considerable phosphate rock reserves are the global agro-giants, such as USA, Canada and three of the BRICS countries. None of the EU countries has any phosphate rock reserve. This indicates that, in terms of competitiveness and sustainability of agriculture, the EU’s position may be vulnerable vis-à-vis some of the emerging economies like Brazil, China, Russia and South Africa.
50
USGS (2011) Mineral Commodity Summaries 2011. Virginia: US Geological Survey (USGS).
Morocco & West Sahara
78%
China 6%
Algeria 4%
Syria 3%
Jordan 2%
South Africa 2%
USA 2%
Russia 2%
Brazil 1%
Figure 4.4 World's phosphate rock reserves (Source: USGS, 2011)
0 10 20 30 40 50 60 70
China
USA
M&WS
Russia
Tunisia
Jordan
Brazil
Egypt
Israel
Syria
Australia
South Africa
Algeria
Togo
Canada
Senegal
million tonnes
Figure 4.5 Phosphate rock production per year (2009-2010) (Source: USGS, 2011)

39
In terms of production capacity of Phosphate rock, China currently ranks first in the world with an average annual production of about 63 million tonnes (Figure 4.5). In second and third positions are USA (26.3 million tonnes) and M&WS (24.5 million tonnes).
Looking forward, at the current rate of production, except M&WS, the phosphate rock reserves of a number of currently important producers are going to be depleted soon (Figure 4.6). This has potential implications for countries like Canada, Australia and China. For instance, Canada’s reserve is going to be exhausted in just seven years, while Australia’s in 29 years51 and China’s in about 60 years. Although the current reserves in M&WS region are more secure into the future, this region is likely to be a place of power struggle for the major world economies in future. Those who are successful in controlling this resource are likely to be in a position to exercise power over others.
The second key mineral considered in Potassium. Currently, potassium has no substitute as an essential plant nutrient and an essential nutritional requirement for animals and humans (USGS, 201152). Current the global Potassium reserve is estimated to be around 9.5 billion tonnes. Almost 100% of this reserve is located in just 13 countries, while over 81% in just two countries – Canada and Russia (Figure 4.7). Germany is the only country within the EU with any considerable Potassium reserves.
51
Although Australia is a phosphate rock producer, the country’s reserve is only 82 million tonnes, which is 0.13% of the world. This is why Australia is not shown in Figure 4.4 as having phosphate rock. 52
Op. cit. p. 38
0 200 400 600 800 1,000 1,200 1,400 1,600 1,800 2,000 2,200
M&WS Algeria
Syria South Africa
Senegal Jordan Russia
Togo Israel China Brazil
USA Australia
Egypt Tunisia Canada
Years
Figure 4.6 Depletion time of world's phosphate rock reserves (Source: Own estimation based on USGS, 2011 data)

40
In 2009-2010, the average mine production of Potassium in the world was about 27 million tonnes per year (rounded). At present, Canada is the largest producer and, in 2010, accounted for over 28% of the world’s production (Figure 4.8). The other major producers were Russia (20%), Belarus (15%), China (9%) and Germany (9%). These five countries currently produce over 80% of the world’s Potassium. The UK is the second highest potassium producer within the EU, Germany being the first. However, the amount shared by the UK is only about 1.2% and Germany and the UK together produce slightly over 10% of the world’s Potassium.
Looking forward, given the current reserves and the current rate of production, six of the above 13 countries are going to deplete their Potassium reserves in between just 19-70 years (Figure 4.9). These include Israel, followed by Jordan, Spain, UK, Germany and China. It is noteworthy that some of these countries – such as Spain, Germany, UK and China – are currently world leaders in terms of agricultural production. The immediate depletion of the Potassium reserves in these countries may therefore place them in a vulnerable position vis-à-vis the other top agricultural producers in the world – such as Brazil, Russia, Canada and the USA.
Canada 47%
Russia 36%
Belarus 8%
Brazil 3%
China 2%
Germany 2%
USA 1%
Chile 1%
Figure 4.7 Global potassium reserves (Source: USGS, 2011)
0 3 6 9 12 15 18 21 24 27 30
Canada
Russia
Belarus
China
Germany
Israel
Jordan
United States
Chile
Brazil
Spain
United Kingdom
Ukraine
% world
Figure 4.8 Potassium production per year (Source: USGS, 2011)
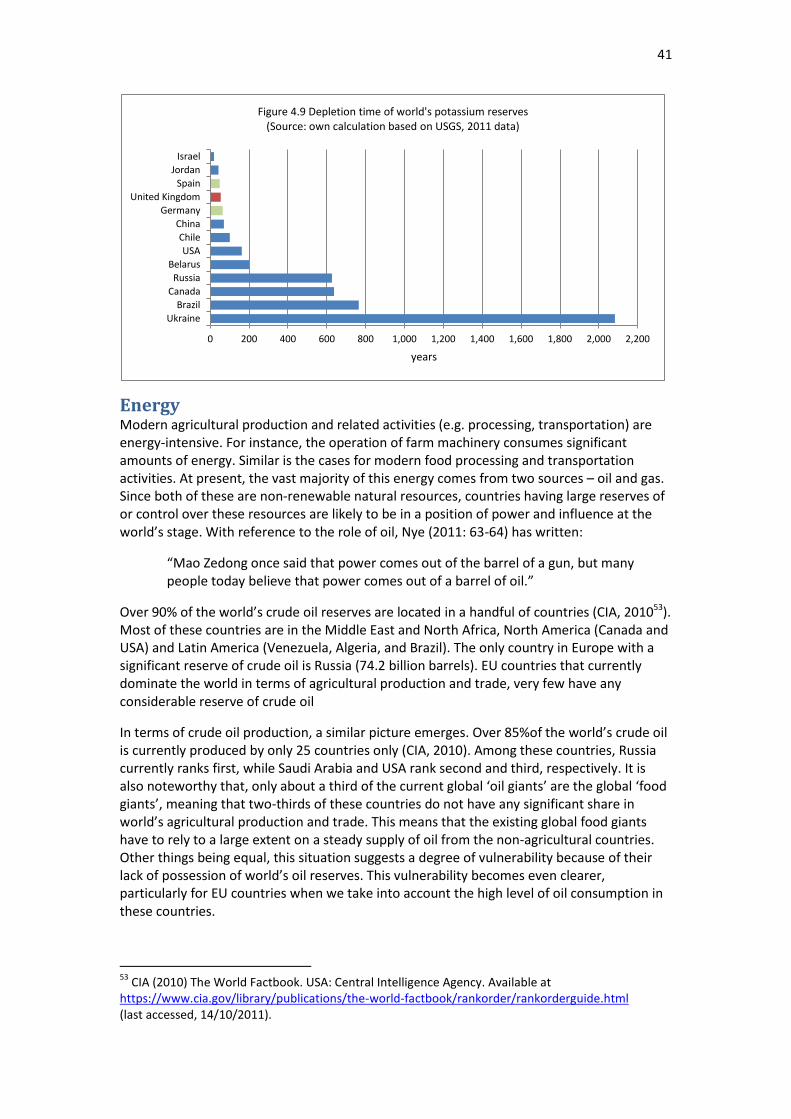
41
Energy Modern agricultural production and related activities (e.g. processing, transportation) are energy-intensive. For instance, the operation of farm machinery consumes significant amounts of energy. Similar is the cases for modern food processing and transportation activities. At present, the vast majority of this energy comes from two sources – oil and gas. Since both of these are non-renewable natural resources, countries having large reserves of or control over these resources are likely to be in a position of power and influence at the world’s stage. With reference to the role of oil, Nye (2011: 63-64) has written:
“Mao Zedong once said that power comes out of the barrel of a gun, but many people today believe that power comes out of a barrel of oil.”
Over 90% of the world’s crude oil reserves are located in a handful of countries (CIA, 201053). Most of these countries are in the Middle East and North Africa, North America (Canada and USA) and Latin America (Venezuela, Algeria, and Brazil). The only country in Europe with a significant reserve of crude oil is Russia (74.2 billion barrels). EU countries that currently dominate the world in terms of agricultural production and trade, very few have any considerable reserve of crude oil
In terms of crude oil production, a similar picture emerges. Over 85%of the world’s crude oil is currently produced by only 25 countries only (CIA, 2010). Among these countries, Russia currently ranks first, while Saudi Arabia and USA rank second and third, respectively. It is also noteworthy that, only about a third of the current global ‘oil giants’ are the global ‘food giants’, meaning that two-thirds of these countries do not have any significant share in world’s agricultural production and trade. This means that the existing global food giants have to rely to a large extent on a steady supply of oil from the non-agricultural countries. Other things being equal, this situation suggests a degree of vulnerability because of their lack of possession of world’s oil reserves. This vulnerability becomes even clearer, particularly for EU countries when we take into account the high level of oil consumption in these countries.
53
CIA (2010) The World Factbook. USA: Central Intelligence Agency. Available at https://www.cia.gov/library/publications/the-world-factbook/rankorder/rankorderguide.html (last accessed, 14/10/2011).
0 200 400 600 800 1,000 1,200 1,400 1,600 1,800 2,000 2,200
Ukraine
Brazil
Canada
Russia
Belarus
USA
Chile
China
Germany
United Kingdom
Spain
Jordan
Israel
years
Figure 4.9 Depletion time of world's potassium reserves (Source: own calculation based on USGS, 2011 data)

42
The crude oil reserves in the major EU countries are negligible in comparison to the world’s key oil giants. At the current rate of consumption, these reserves can sustain most EU countries for just 24-359 days, with the exception of UK, Norway and Denmark. If there is an oil crisis, the energy-intensive agricultural sectors of these countries wouldclearly be adversely affected.
Apart from crude oil, natural gas is another key source of energy in today’s world. Roughly, the current world reserve of natural gas is 188 trillion m3. Like oil, almost all (> 94%) of this reserve is located in just 25 countries. Russia ranks first with a reserve of 47.6 trillion (25.30% of the world), followed by Iran (15.75%) and Qatar (13.55%) that rank second and third, respectively. These three countries share more than one-half (55%) of the world’s natural gas reserves.
The reserve of natural gas in the EU is minimal. The only two countries with any considerable reserves are Norway and the Netherlands. These two countries together however share only about 2% of the world’s reserves. It is also noteworthy that very few of the world’s other agriculturally important countries have substantial natural gas reserves
Conclusion In this Chapter we have analysed the natural resource endowments in various countries of the world and explored which countries are better placed in terms of agricultural production and whether the countries which dominate world agriculture today are likely to be vulnerable in future.
Our analysis shows a potentially grim picture for many of today’s powerful agricultural economies in the world, including USA and Europe. In particular, European countries, including United Kingdom, appears to be relatively poorly endowed in global terms with critical natural resources used in agriculture – such as land, water, potassium, phosphate, oil and natural gas. This situation, especially the availability of water and energy, is likely to be exacerbated by the impacts of climate change. But contrary to that, certain parts of the EU might be less affected by climate change or even see benefits in terms of being able to grow a greater range of crops. The UK might fit into this category.
Although many of the emerging economies, like Brazil, China, and Russia are better-placed in terms of water and energy endowments, some of these countries appear to be vulnerable in their possession of agricultural lands (more specifically, arable lands) and critical minerals. This partly explains why some of these large economies, especially China, have already resorted to what is called ‘land-grabbing’ in Africa in which some major EU countries have also taken part (see Friis & Reenberg, 2010)54.
These findings have three major implications. First of all, EU countries are likely to face competition for land from countries like China. Second, the current water-intensive, fertiliser-intensive and energy-intensive agricultural practices of European countries are unlikely to be sustainable in the near future. This situation would deteriorate further if Europe loses its economic and political powers on the world stage, as has been discussed in Chapter Three.
Third, European countries need to enhance their level of efficiency in agricultural water use (and more generally). Most importantly, there does appear to be a need for European and UK agriculture to reduce their dependency on non-renewable sources of energy – such as oil
54
Friis, C. & Reenberg, A. (2010) Land grab in Africa: Emerging land system drivers in a teleconnected world. Global Land Project (GLP) Report No. 1, GLP-IPO, Copenhagen.

43
and gas – and promote the Research and Development (R&D) of renewable energy technologies and their wider diffusion at farm and industry levels. To make this happen, policy makers need to create appropriate incentives for scientists, industries, farmers and other key actors in the agricultural innovation systems.

44
Chapter Five: Summary and Conclusions
This report has considered the issue of Global Power in agriculture, this Chapter briefly summarises the key findings of the report and introduces the ‘Power Index’ as a way to draw together the results of the study.
The analysis of the economic power of nation states in the world indicates that, at present, the power is concentrated in North America and Europe. However, certain countries such as Brazil and New Zealand are currently the largest exporters of some commodities (e.g. beef and dairy products) in the world. There is little evidence to suggest that this current power situation is likely to be changed markedly in the next 10 years. However, it is also apparent that the EU as a whole has retreated from world markets as policies have changed and that the export capabilities of the EU-27 in some key commodity sectors are predicted to decline further in the next 10 years, unless policy measures change markedly.
Our analysis also indicates that, although the emerging economies, in particular, China and Brazil, have clear advantages in certain commodity markets, their corporate power in agriculture is still not on a par with that of North American (US and Canada) and European countries, especially, UK, France and Germany. These major North American and EU economies therefore are in a strong position to consolidate their economic power through their transnational agribusiness corporations. However, a major challenge for them is to balance corporate power with consumer and farmer power domestically, whilst maintaining global power.
The available evidence supports the view that the political power relevant to global agriculture is still concentrated in the hands of the USA, major EU countries and some other economically powerful countries within the G-8 coalition. However, recently there have been indications that this situation is changing and some emerging economies in the developing world are increasingly appearing to be powerful players at the world stage. This has important implications for European and UK agriculture, in particular, in terms of transnational agricultural trades. In the coming decades, EU countries may have to confront increased pressure to allow greater access to their markets. These competitions are likely to come from emerging economies – like China, India and Brazil and will have implications for domestic producers. .
Our analysis also confirms the political influence of transnational corporations (TNCs) in global agriculture. Although, evidence is found that their power is not limitless and, that ultimately it is nation states who can control agriculture – for example as shown in 2008 when a number of countries implemented export bans to try to ameliorate the impacts of a food crisis. This finding does not corroborate the suggestions made by some that, in this age of corporate globalisation, the state is powerless to resist corporate activities. Evidence is also found that in some cases civil society organisations and farmer groups have had a significant impact in countervailing or balancing corporate influences.
In terms of control over natural resources, our analysis shows a potentially grim picture for many of today’s powerful agricultural economies in the world, including USA and Europe. In particular, European countries, including the United Kingdom, appear to be relatively poorly endowed in global terms with the critical natural resources used in agriculture – such as land, water, potassium, phosphate, oil and natural gas. This situation, especially the

45
availability of water and energy, is likely to become worse because of the impacts of climate change. Although many of the emerging economies, like Brazil, China and Russia are better-placed in terms of water and energy endowments, some of these countries appear to be vulnerable in terms of their possession of agricultural lands (more specifically, arable lands) and critical minerals relative to their population size. This partly explains the much reported phenomenon of ‘land-grabbing’ in Africa, in which some major EU countries have also taken part.
Three key implications were drawn from these findings for the EU (and UK)
EU countries are likely to face competition for land from countries like China.
In the shorter term, further improvements in resource use efficiency (water, fertiliser and energy) are needed to sustain current levels of production.
As traditional resources become more scarce, alternative practices will need to be developed and adopted.
Finally, Table 5.1 attempts to pull together the various dimensions of power that have been discussed into a power index. The index is simply constructed by ranking each country/region on a scale of 1 to 5 for the individual components of power discussed within this report. For example, agricultural trade comprises an average of the ranking for the role in exports and imports (treated equally), whilst natural is an average of the score for land availability (both total and arable), population and water.55 It is of course an imprecise science but the findings support the general conclusions of the previous chapters.
As might be expected the US and the EU top the power index by some margin. However, it does highlight their potential vulnerability in terms of natural resources (key agricultural minerals and oil) moving forward. On the other hand the emerging countries at the moment have lower political and corporate power but seem better placed in terms of natural and mineral resources.
For, interest the UK has been separated from the rest of the EU. It is clear that the UK, ‘punches above its weight’ in terms of trade, corporate and political power. However, in a global sense it is a small country, and it is lowly rated in terms of natural resources on the power index and this puts it behind Russia and China on the overall index.
Table 5.1 Regional Power Index for Agriculture
Dimension EU27 US Brazil Russia China Australasia Japan UK
Trade 4.5 5.0 2.0 3.0 3.0 2.5 2.5 3.0
Corporate 5.0 5.0 1.0 1.0 2.0 2.0 3.0 3.0
Political 5.0 5.0 1.0 3.0 2.0 1.0 4.0 4.0
Natural 3.5 4.0 3.3 3.5 4.5 3.3 1.5 2.0
Minerals 1.3 2.5 2.3 4.3 3.3 1.0 0.0 1.0
Total 19.3 21.5 9.5 14.8 14.8 9.8 11.0 13.0
55
The power index was constructed by combining all the information in the report. For each power dimension the individual power components (e.g. imports and exports for "Trade" or water, total land, arable land and population for "Natural") were scored on a scale of 0 to 5 for each country / region. The scoring system was a simple 0-5 which was allocated by the research team after consideration of the evidence, where 5 meant considerable power and zero meant effectively zero power. These individual components of the power dimension were then averaged to populate the table.
Power in Agriculture: Resources, Economics and
Politics A Report Prepared for the Oxford
Farming Conference
Alan Renwick, Md. Mofakkarul Islam, and Steven Thomson
January 2012