a quality index for patent systems - ipts - jrc -...
TRANSCRIPT

A quality index for patent systemsIPTS, Spain, June 2011
1
Bruno VAN POTTELSBERGHE ,
Professor, ULB, SBS-EM; Senior fellow Bruegel

• Motivations
• Objective of the paper
• The quality index
Outline
• Cross-sectional analysis
• Concluding remarks
2
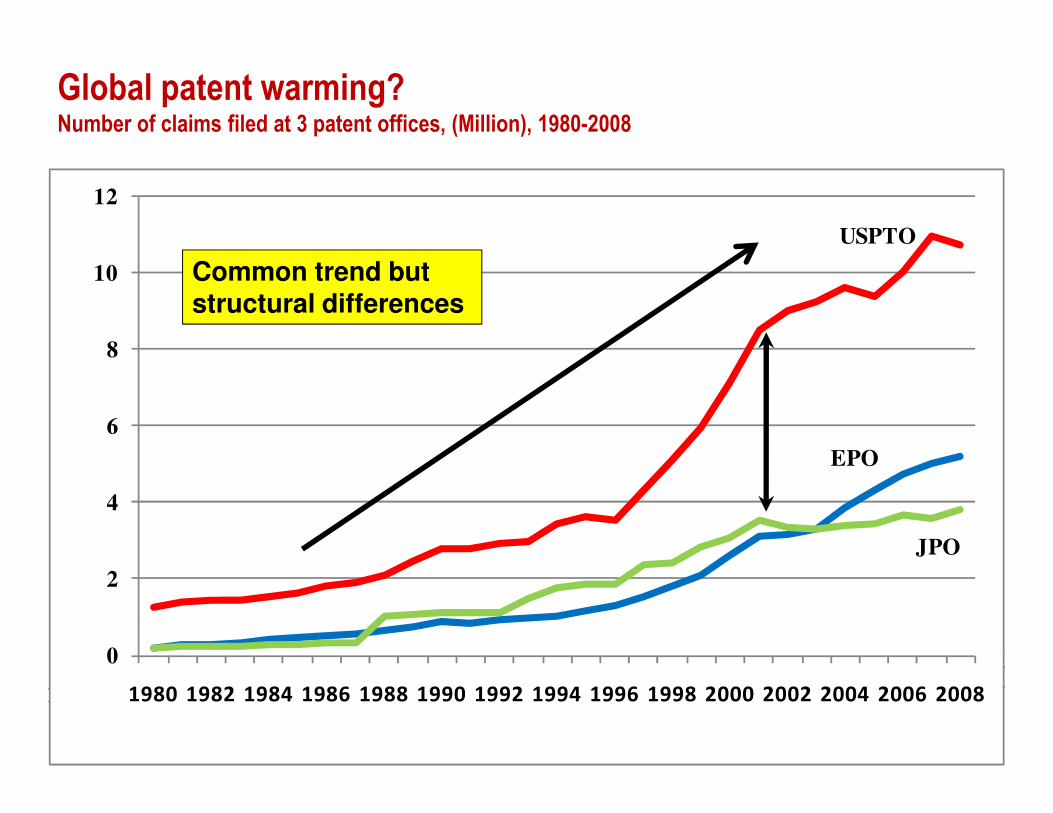
Global patent warming?Number of claims filed at 3 patent offices, (Million), 1980-2008
8
10
12
USPTO
Common trend but structural differences
0
2
4
6
1980 1982 1984 1986 1988 1990 1992 1994 1996 1998 2000 2002 2004 2006 2008
EPO
JPO
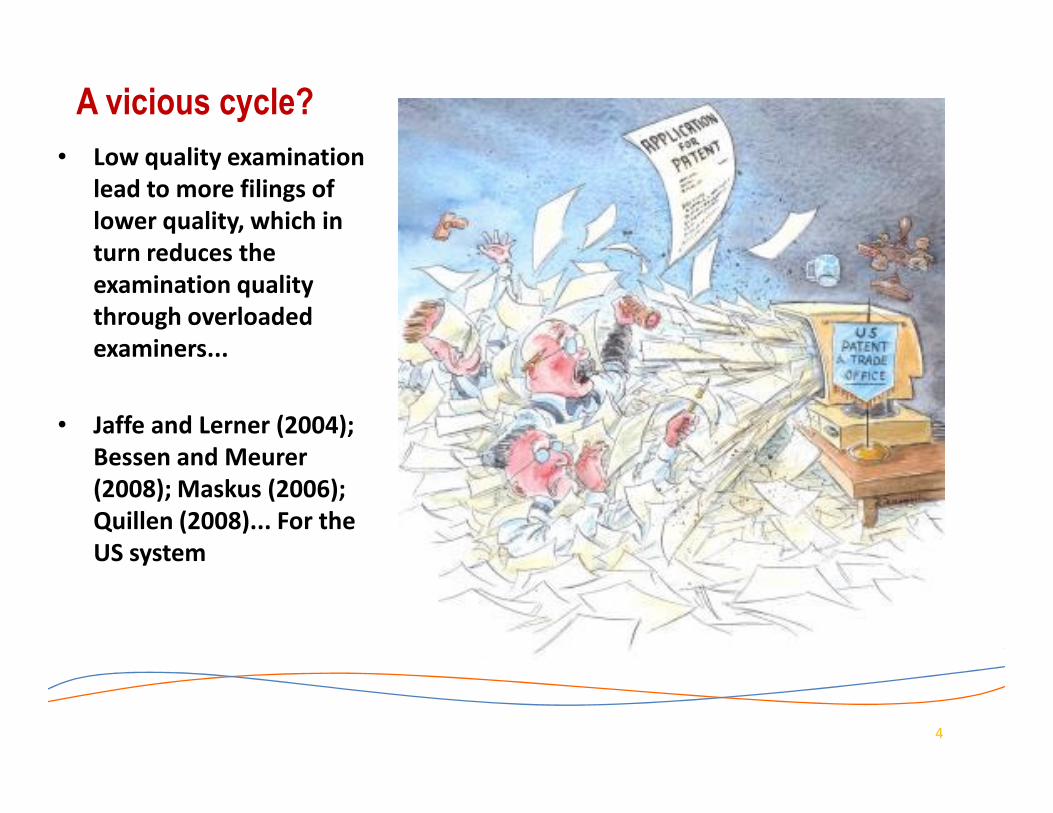
• Low quality examination
lead to more filings of
lower quality, which in
turn reduces the
examination quality
through overloaded
examiners...
A vicious cycle?
• Jaffe and Lerner (2004);
Bessen and Meurer
(2008); Maskus (2006);
Quillen (2008)... For the
US system
4

• Important patent reform currently under scrutiny in the US
• EPO: raising the bar project
• But has not been strongly analyzed so far
Quality seems to matter
5
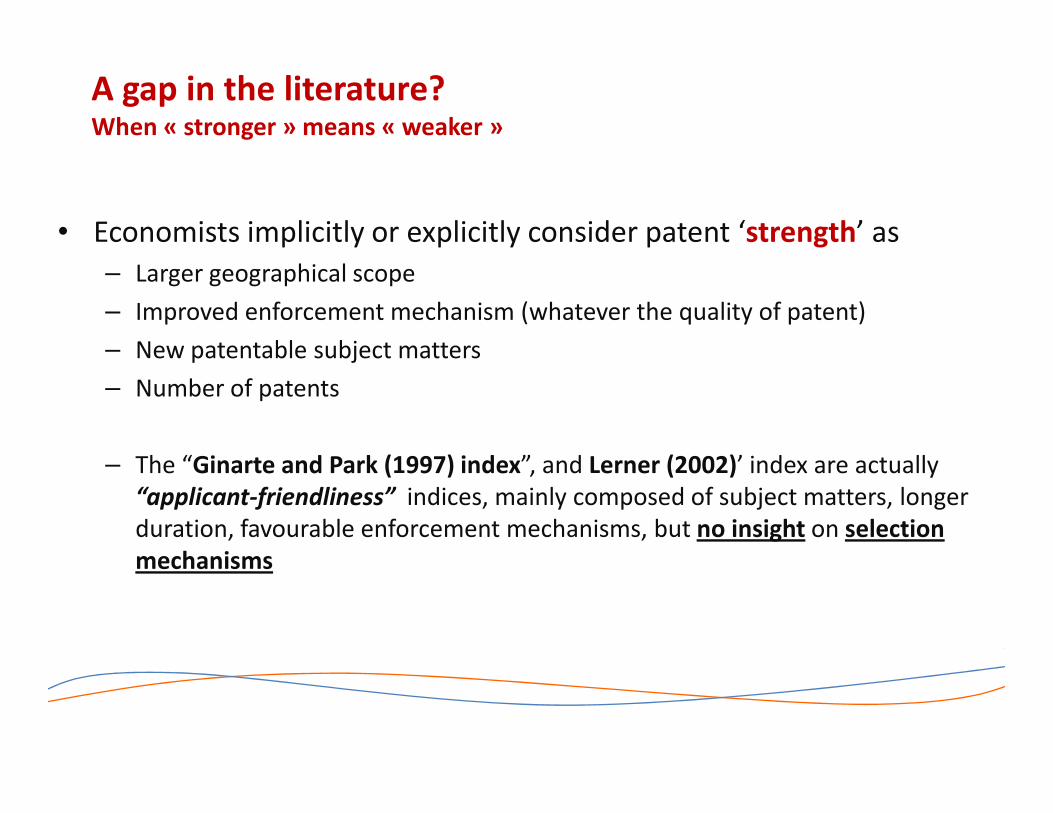
• Economists implicitly or explicitly consider patent ‘strength’ as
– Larger geographical scope
– Improved enforcement mechanism (whatever the quality of patent)
– New patentable subject matters
– Number of patents
A gap in the literature?When « stronger » means « weaker »
– The “Ginarte and Park (1997) index”, and Lerner (2002)’ index are actually
“applicant-friendliness” indices, mainly composed of subject matters, longer
duration, favourable enforcement mechanisms, but no insight on selection
mechanisms

• Scotchmer and Green (1990) : novelty requirement and ownership rules (“first-to-
file” vs “first-to-invent”)
• Yamauchi and Nagaoka (2009) : period allowed for requesting an examination at
the Japan Patent office (JPO).
• Franzoni and Scellato (2010) : consequence of the grace period
• de Rassenfosse and van Pottelsberghe (2008, 2009, 2010): fees
A gap in the literature?Authors tend to focus on a specific dimension of a multifaceted selection process
• Cockburn et al. (2002) : examiners’ characteristics ;
• Friebel et al. (2006), Langinier and Marcoul (2009) : organisational practices and
incentive mechanisms
• Lemley (2001): resources put in place to examine patents.
• Graham and Harhoff (2006) , Graham et al. (2002): post-grant opposition
process...

• Motivations
• Objective of the paper
• The quality index
Outline
• Cross-sectional analysis
• Concluding remarks
8

• Broad question : Can “quality” explain structural differences in patenting
behaviour ?
• Heterogeneous rigor (quality) could be due to different designs, hence to policy
makers at large (lawyers, PO, policy makers...)
Objective
• The objective of this paper is to develop a quality index for 32
patent systems, and test the ‘vicious cycle’ hypothesis across
countries
9

This paper is the fourth one on ‘quality’ in patent systems. Start with a
broad idea in a Bruegel Blueprint (available online), followed by 3 WPs:
Qualitative (USA, Japan, EPO):
• van Pottelsberghe B., 2011, The
quality factor in patent systems,
Industrial and Corporate Change,
forthcoming
Theoretical (governance, Q, fees, U)
10
Theoretical (governance, Q, fees, U)
• Picard P. and B. van Pottelsberghe,
2011, Patent Office Governance and
Patent System Quality, ECARES WP
Quantitative (32 countries):
• De Saint Georges M. And B. van
Pottelsberghe, 2011, A quality index
for patent systems, ECARES WP

Quality is defined as the extent to which
patent systems comply with
their patentability conditions
in a transparent way. in a transparent way.
11

Quality level and patent rights in force, 2008From: van Pottelsberghe, 2011, The quality factor in patent systems, Industrial and Corporate
Change, forthcoming.
80
100
120
140
160
25
30
35
40
45
50
USA
Japan
Claims in force per 1000 capita
(right-hand axis)
12
0
20
40
60
80
0
5
10
15
20
25
50 100 150 200 250 300
Quality metric (USA=100)
Millions of claims in force
(left-hand axis)
EPC
Japan

This paper: 9 components, 32 patent officesvan Pottelsberghe, 2011, many components, for three offices
Novelty W13 WB Inventiveness W13 WB
OD1 Subject matter 2 3 Novelty 3 4
OD2 Ownership 1 2 Request Exam 2 2
OD3 Identification 2 3 Definition 1 0
OD4 Search report 1 2 Incentives 2 3
13
OD4
OD5 Languages 2 5 Skills 3 6
OD6 Opposition 3 7 Workload 3 4
OD7 Grace period 1 0 Opposition 2 2
OD8 Control. Adapt 3 8
OD9 Hidden pat. 2 6
Correl. .91 .92
• Motivations
• Objective of the paper
• The quality index
Outline
• Cross-sectional analysis
• Concluding remarks
14

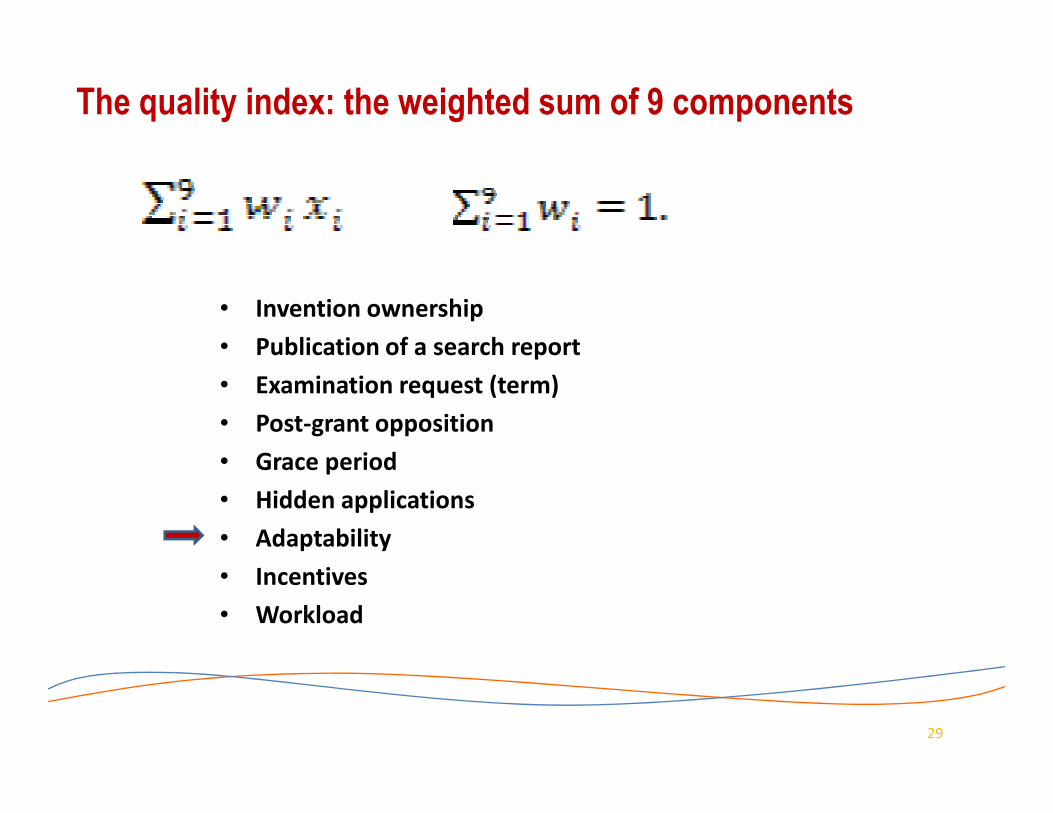
• Invention ownership
• Publication of a search report
• Examination request (term)
Post-grant opposition
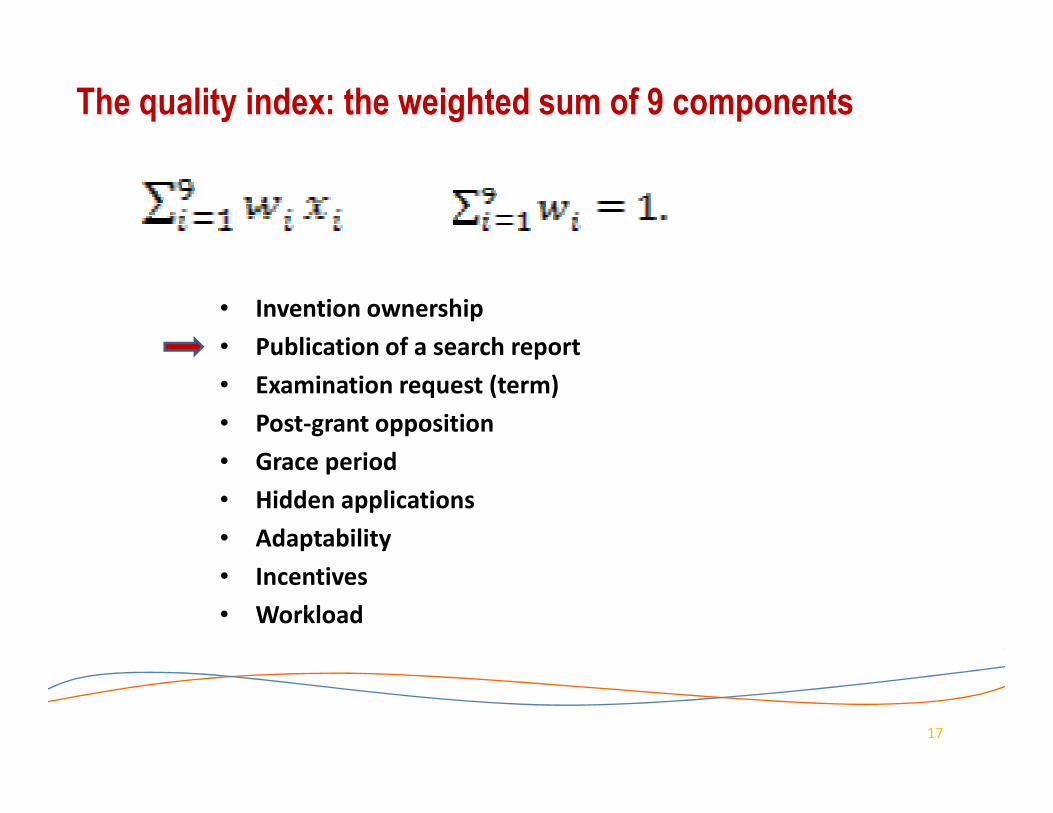
The quality index: the weighted sum of 9 components
• Post-grant opposition
• Grace period
• Hidden applications
• Adaptability
• Incentives
• Workload
15

• No need for a patent in
order to maintain a claim
on the market (Sankyo vs
Merck), favours secrecy;
• Litigation: first find the
First-to-Invent
(F2I = USA + 1)
First-to-File
(F2F = RoW)
• Favours early disclosure
and diffusion of
knowledge;
• Litigation: first challenge
validity of the patent, or • Litigation: first find the
true inventor, then validity
16
validity of the patent, or
infringement...
�1 =
1 if the prevailing system is "first-to-file".
0 if the prevailing system is “first-to-invent”.
• Invention ownership
• Publication of a search report
• Examination request (term)
Post-grant opposition
The quality index: the weighted sum of 9 components
• Post-grant opposition
• Grace period
• Hidden applications
• Adaptability
• Incentives
• Workload
17

Publication of search report?Transparency: provides more info to inventor and to third parties
YES
18 months:
EPO USPTO JPO
NO
Third parties
NO
Third parties
18
18 months:
third parties
can identify
and assess
Third parties
have less access;
for PCT after 32
months
Third parties
have less access;
for PCT after 32
months
�2 =
1 if the patent office provides and publishes a search report.
0 if it does not.

• Invention ownership
• Publication of a search report
• Examination request (term)
Post-grant opposition
The quality index: the weighted sum of 9 components
• Post-grant opposition
• Grace period
• Hidden applications
• Adaptability
• Incentives
• Workload
19
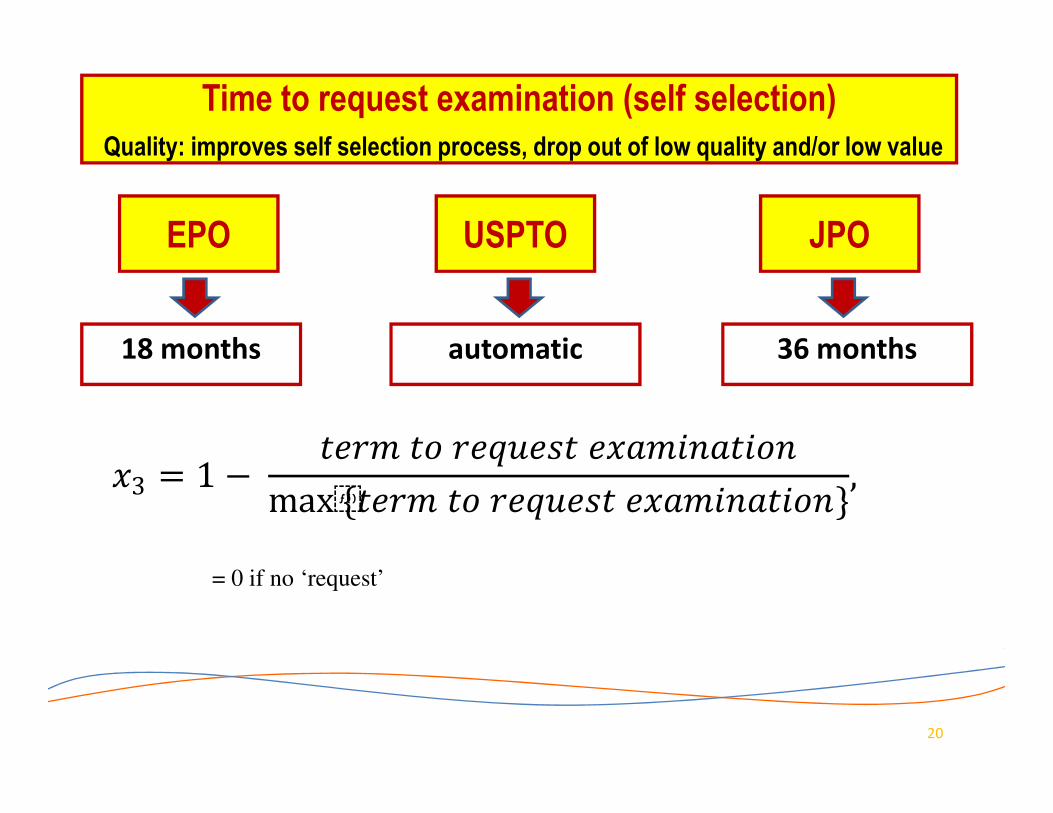
Time to request examination (self selection)
Quality: improves self selection process, drop out of low quality and/or low value
18 months
EPO USPTO JPO
36 monthsautomatic
20
�3 = 1 − �� �� ��� ����������max{�� �� ��� ����������},
= 0 if no ‘request’

• Invention ownership
• Publication of a search report
• Examination request (term)
Post-grant opposition
The quality index: the weighted sum of 9 components
• Post-grant opposition
• Grace period
• Hidden applications
• Adaptability
• Incentives
• Workload
21
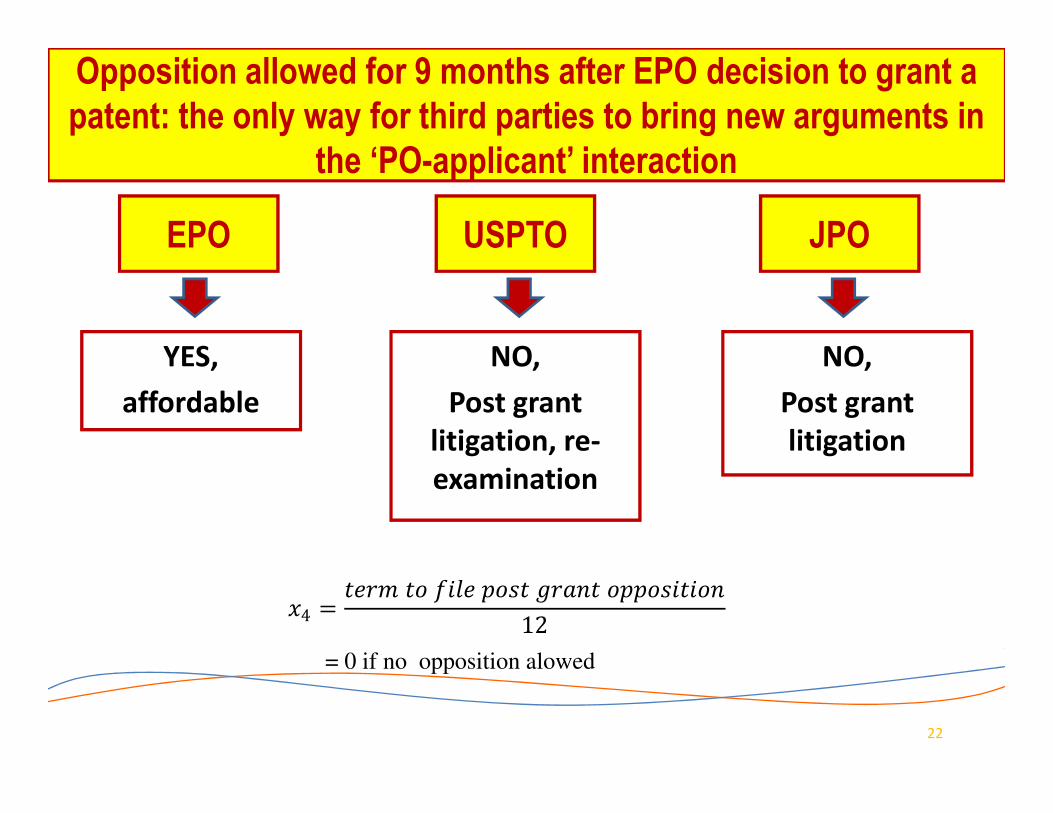
Opposition allowed for 9 months after EPO decision to grant a
patent: the only way for third parties to bring new arguments in
the ‘PO-applicant’ interaction
YES,
affordable
EPO USPTO JPO
NO,
Post grant
NO,
Post grant
22
affordable Post grant
litigation
Post grant
litigation, re-
examination
�4 = �� �� ��� ���� ���� ����������12
= 0 if no opposition alowed
• Invention ownership
• Publication of a search report
• Examination request (term)
Post-grant opposition
The quality index: the weighted sum of 9 components
• Post-grant opposition
• Grace period
• Hidden applications
• Adaptability
• Incentives
• Workload
23

Grace period allows the publication of an invention and still
being able to file a patent for x months
NO
EPO USPTO JPO
6 months12 months
24
Essentially aims at allowing scientists to
publish and still have access to patentability
�5 = 1 − �! ���"12 ,
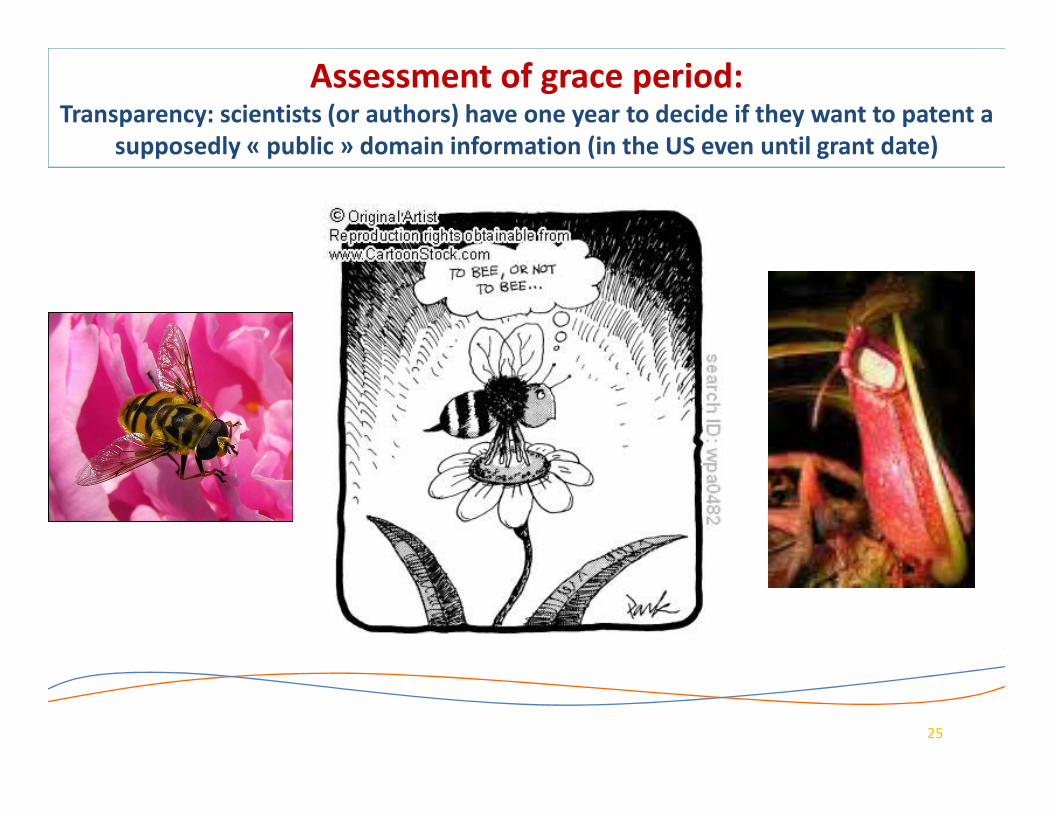
Assessment of grace period:Transparency: scientists (or authors) have one year to decide if they want to patent a
supposedly « public » domain information (in the US even until grant date)
25

• Invention ownership
• Publication of a search report
• Examination request (term)
Post-grant opposition
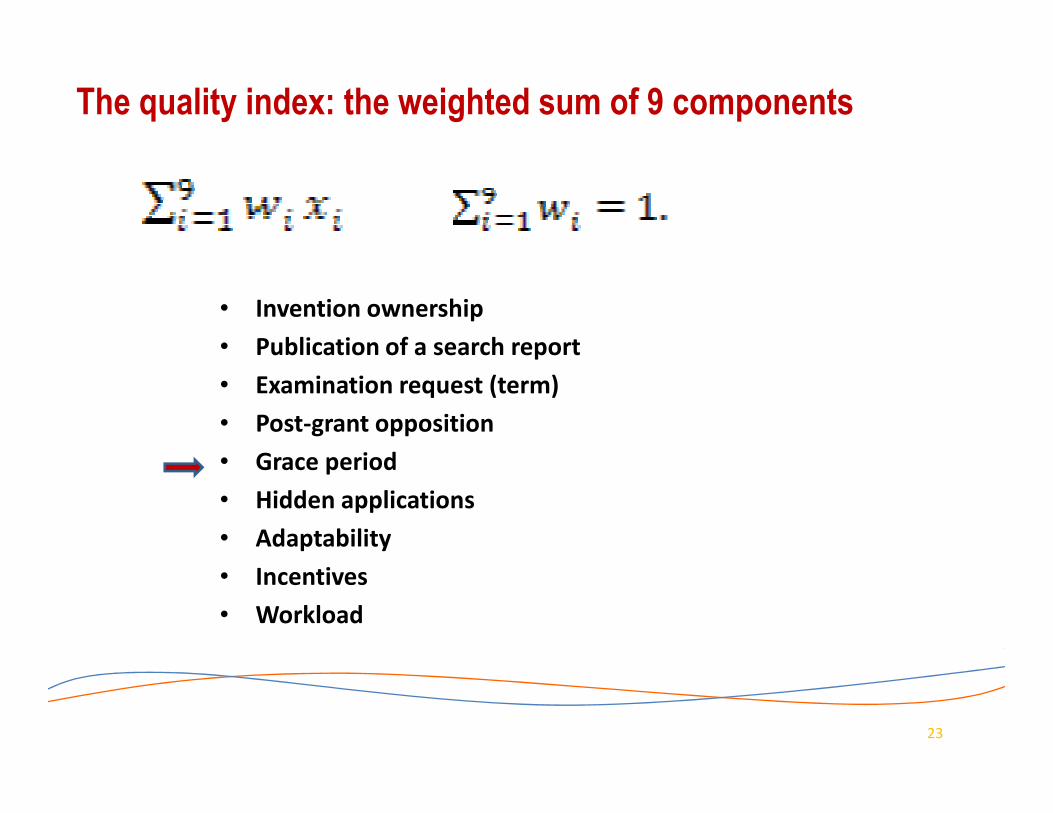
The quality index: the weighted sum of 9 components
• Post-grant opposition
• Grace period
• Hidden applications
• Adaptability
• Incentives
• Workload
26

Hidden applications:
USA vs Europe (different degrees of transparency)
27
�6 = 1 if the applications are published after a period of maximum 18 months from the
28
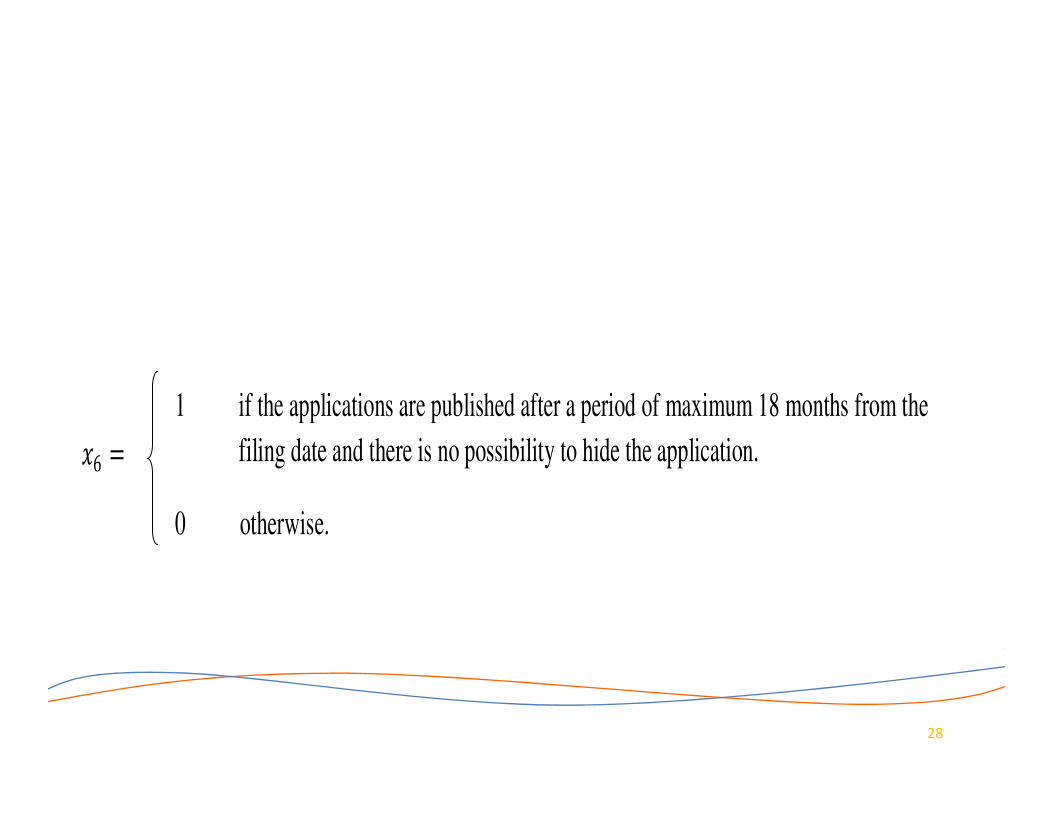
�6 =
1 if the applications are published after a period of maximum 18 months from the
filing date and there is no possibility to hide the application.
0 otherwise.
• Invention ownership
• Publication of a search report
• Examination request (term)
Post-grant opposition
The quality index: the weighted sum of 9 components
• Post-grant opposition
• Grace period
• Hidden applications
• Adaptability
• Incentives
• Workload
29
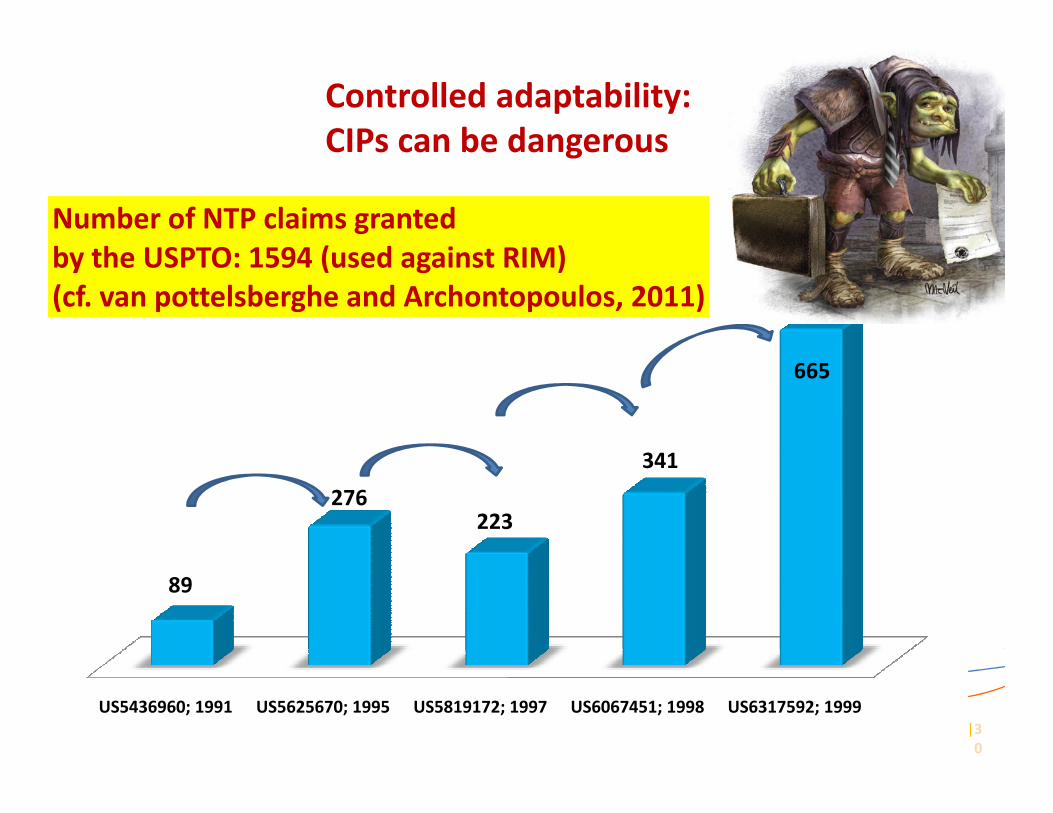
665
Number of NTP claims granted
by the USPTO: 1594 (used against RIM)
(cf. van pottelsberghe and Archontopoulos, 2011)
Controlled adaptability:
CIPs can be dangerous
|3
0
US5436960; 1991 US5625670; 1995 US5819172; 1997 US6067451; 1998 US6317592; 1999
89
276223
341

�7 =
1 if CIPs and patents of addition are not allowed.
0 if CIPs or patents of addition are allowed.
31

• Invention ownership
• Publication of a search report
• Examination request (term)
Post-grant opposition
The quality index: the weighted sum of 9 components
• Post-grant opposition
• Grace period
• Hidden applications
• Adaptability
• Incentives
• Workload
32
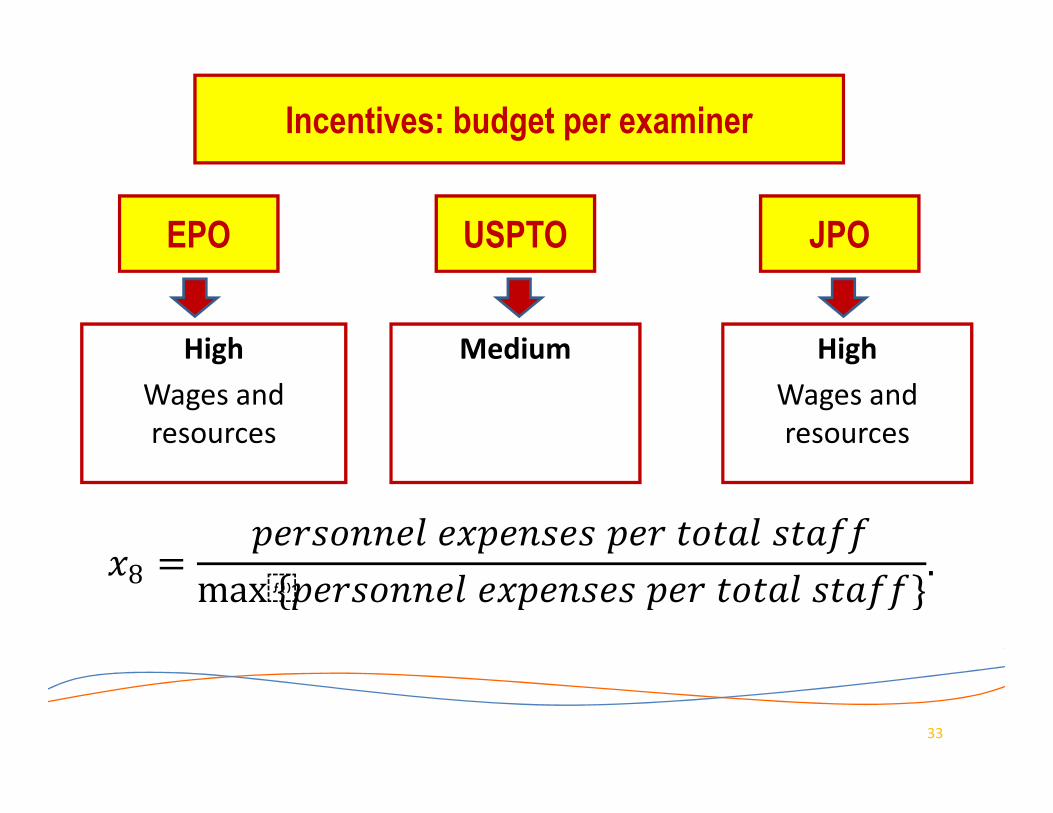
Incentives: budget per examiner
High
Wages and
EPO USPTO JPO
High
Wages and
Medium
33
Wages and
resources
Wages and
resources
�8 = ������ ����� � ����� �����max{������ ����� � ����� �����}.
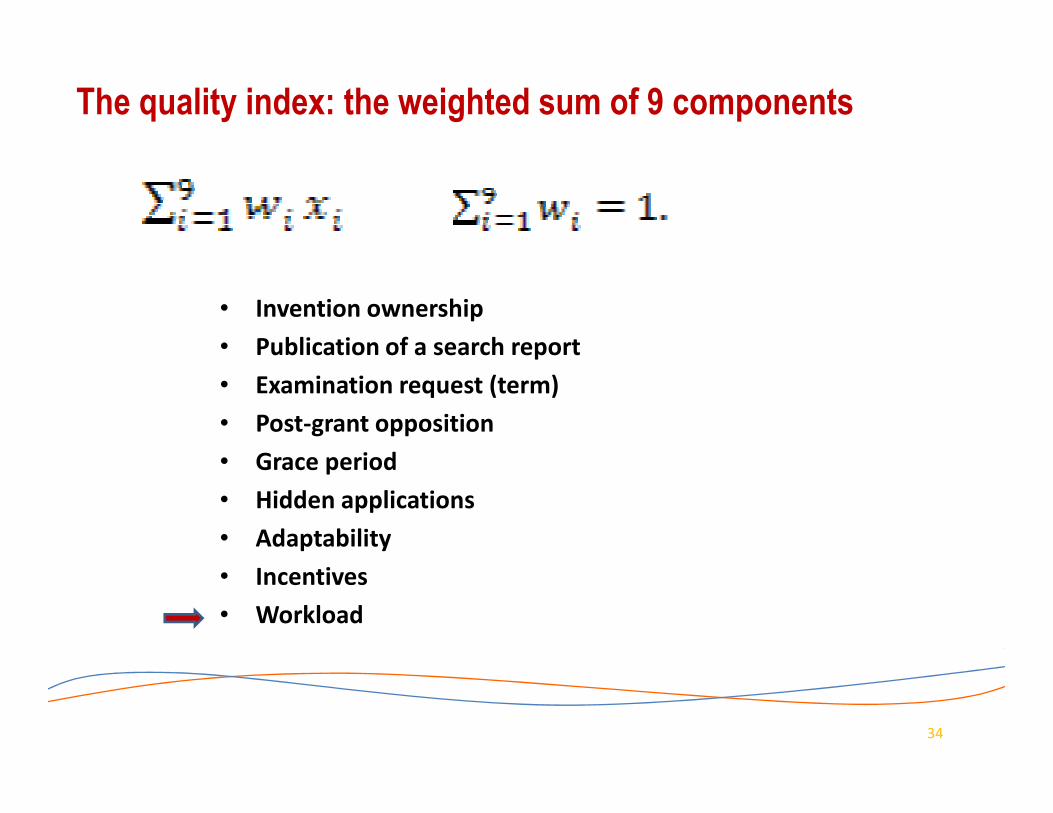
• Invention ownership
• Publication of a search report
• Examination request (term)
Post-grant opposition
The quality index: the weighted sum of 9 components
• Post-grant opposition
• Grace period
• Hidden applications
• Adaptability
• Incentives
• Workload
34

Evolution of the number of claims ‘in search’ or ‘in examination’ per
examiner
2000
2500
3000
USPTO (searches or examinations)
JPO (examinations)
0
500
1000
1500
1996 1997 1998 1999 2000 2001 2002 2003 2004 2005 2006 2007 2008
EPO (searches)
EPO (examinations)JPO searches are outsourced
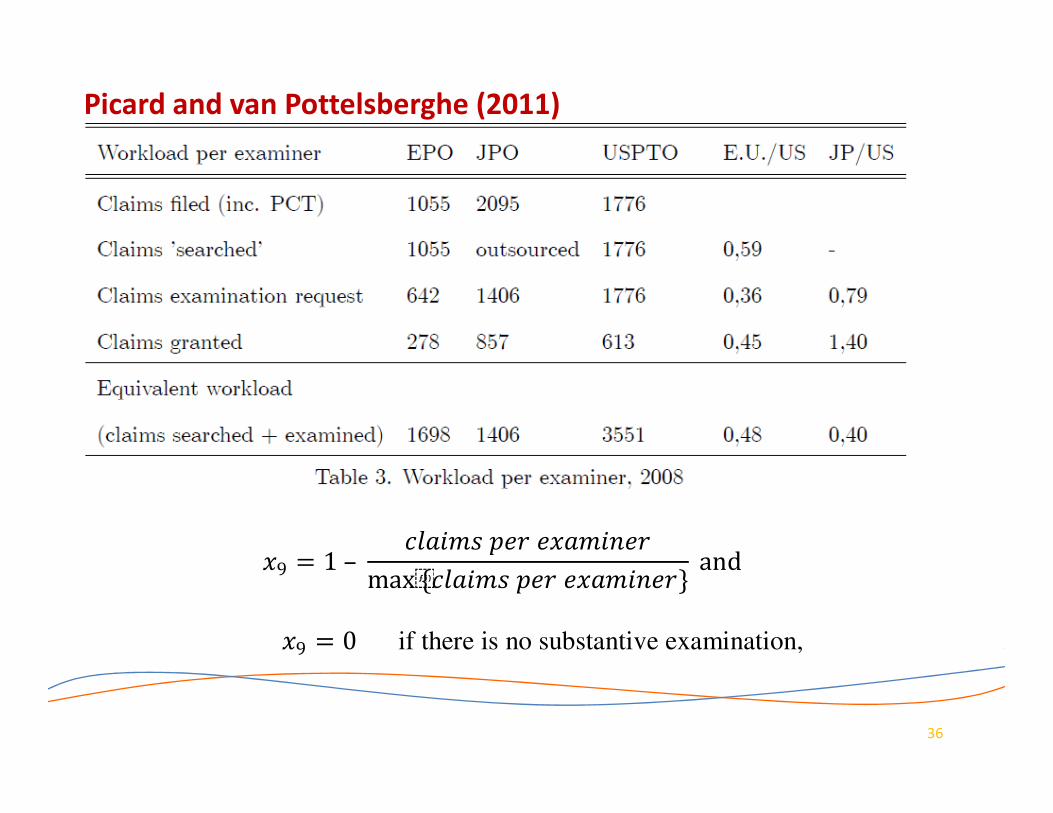
Picard and van Pottelsberghe (2011)
36
�9 = 1 – !����� � �����max{!����� � �����} and
�9 = 0 if there is no substantive examination,
, -�
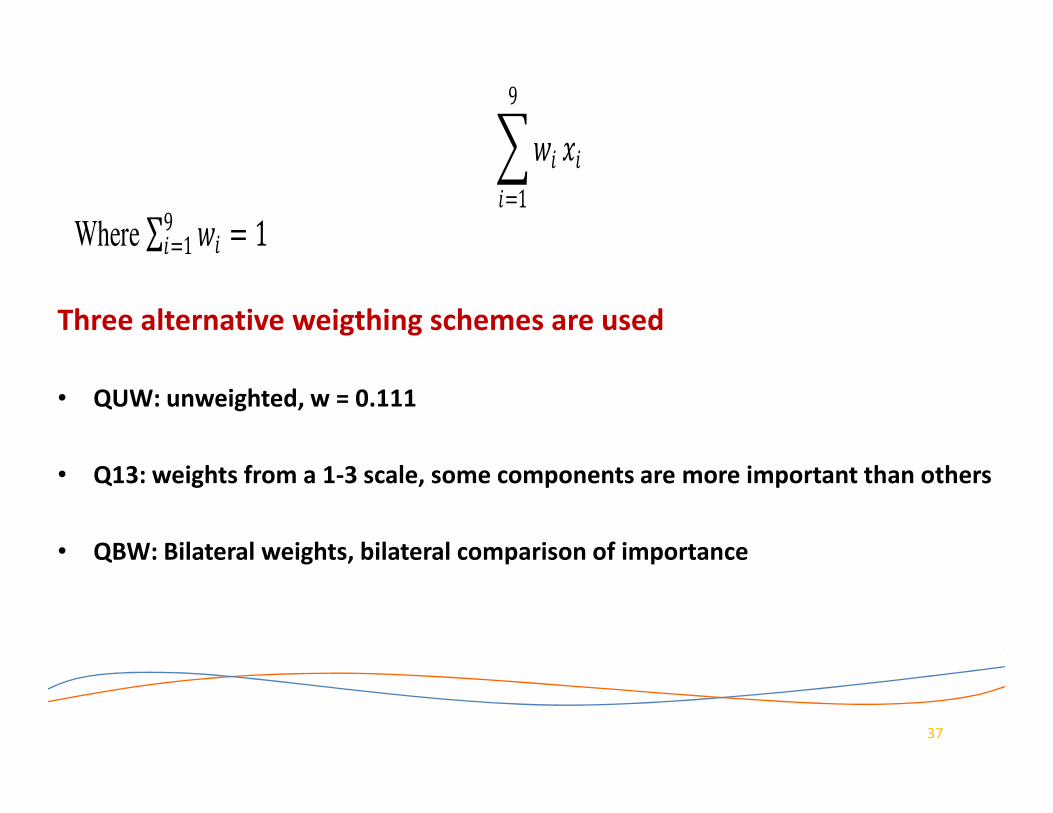
9
�=1��
Where ∑ -�9�=1 = 1
• QUW: unweighted, w = 0.111
Three alternative weigthing schemes are used
37
• QUW: unweighted, w = 0.111
• Q13: weights from a 1-3 scale, some components are more important than others
• QBW: Bilateral weights, bilateral comparison of importance

Table 1. Spearman’s rank correlation of the quality indices (QUW, QW13, QWB)
QUW QWB QW1-3
QUW 1.00
QWB 0.88 1.00
QW1-3 0.95 0.96 1.00
38

QUW QW1-3 QWB
High
EPO 100.00 100.00 100.00
UK 80.97 72.97 69.29
Sweden 72.28 74.36 72.19
Norway 72.08 74.08 71.90
Denmark 71.90 73.83 71.55
Finland 71.79 73.68 71.19
Medium high
Austria 67.84 62.40 58.11
Poland 67.37 61.74 55.65
China 67.16 60.63 58.90
39
China 67.16 60.63 58.90
The Netherlands 65.23 58.71 52.74
France 63.88 56.78 50.04
Japan 62.21 59.26 60.12
Switzerland 61.88 59.60 54.25
Chile 61.56 59.95 61.95
Russia 61.16 57.77 57.24
Colombia 59.77 59.83 61.96
South Korea 59.65 58.86 58.05
Turkey 56.32 48.88 46.05
Malaysia 56.06 54.56 55.05

QUW QW1-3 QWB
Medium low
Australia 53.55 46.16 44.84
Greece 53.05 41.40 34.37
Germany 52.42 46.16 43.41
Singapore 51.55 50.58 46.29
Spain 51.15 38.71 30.58
Brazil 47.89 44.58 47.15
Thailand 47.84 47.74 46.86
Mexico 47.16 50.00 50.39
Low
India 41.53 37.16 30.53
40
India 41.53 37.16 30.53
New Zealand 40.55 34.96 31.25
South Africa 39.53 27.85 22.27
Canada 39.45 35.83 36.09
US 17.60 24.99 32.99
The US reform (2011)
US11 a (medium low) 38.51 43.37 44.18
US11+25%a (medium low) 40.74 46.55 48.65
• Motivations
• Objective of the paper
• The quality index
Outline
• Cross-sectional analysis
• Concluding remarks
41
USA
JapAustral
Can
SK
Mex
Sing
Thail
SA
NZ
Mal
Chil4000
6000
8000
clfile
dperr
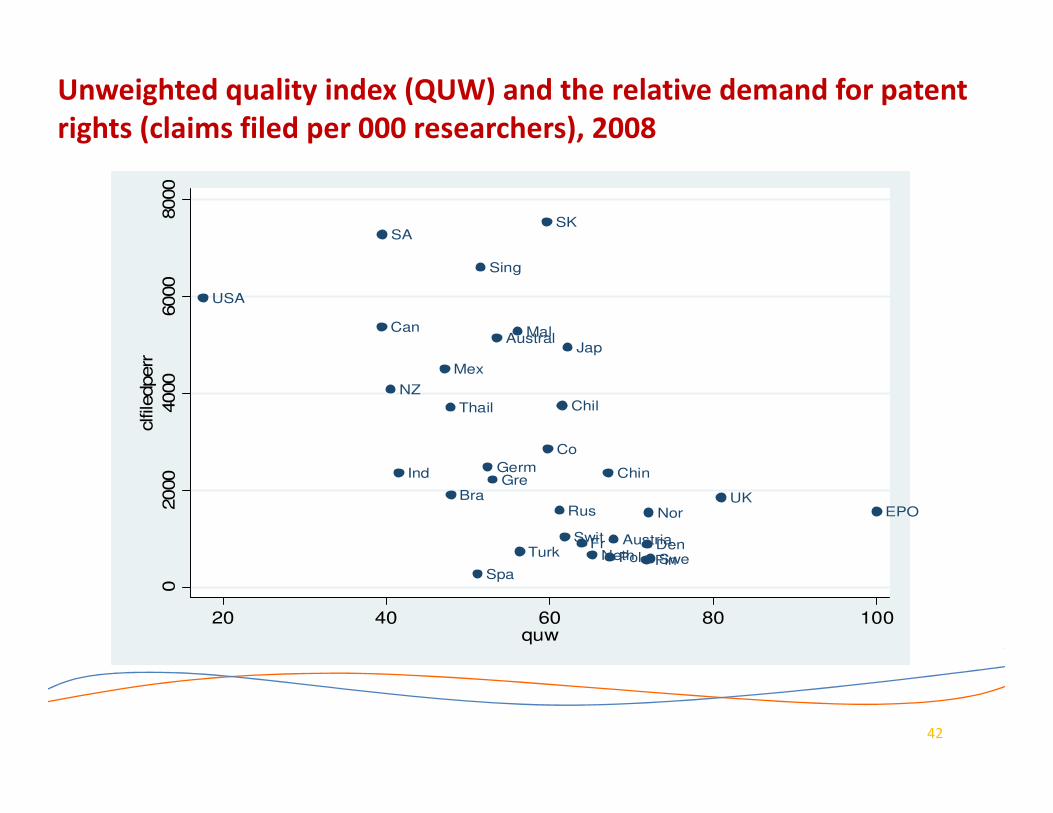
Unweighted quality index (QUW) and the relative demand for patent
rights (claims filed per 000 researchers), 2008
42
EPOUK
ChinGermInd
Bra
Fr
Rus
Thail
Nor
Gre
Spa
Chil
SwePolNethAustria
TurkSwit
Co
FinDen
02000
4000
clfile
dperr
20 40 60 80 100quw

/� = ! + λ Li + ∑ δn Xn i� + εi ,
where P is the observed demand for patent rights at the national patent office of
country i (i =1, ..., 32),
λ captures the impact of the number of researchers (L) on the demand for patent rights,
43
c is the intercept
ε is the error term.
Several factors (X) are used: fees, strenght index, quality
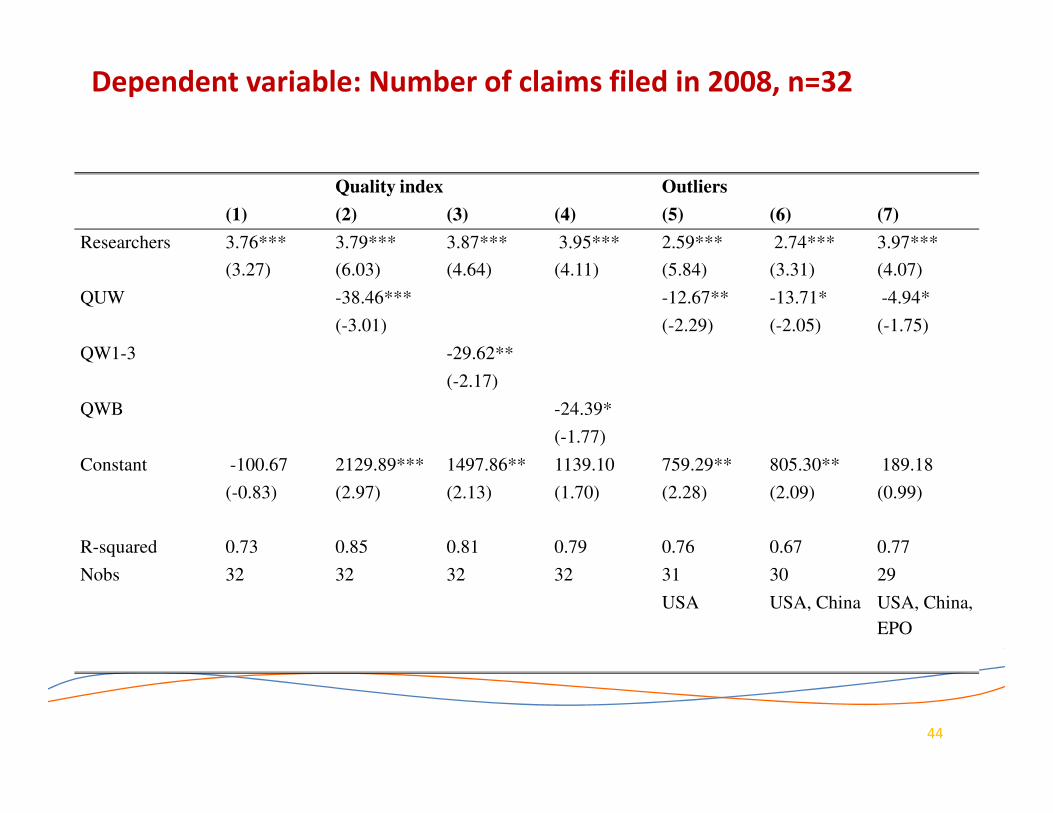
Quality index Outliers
(1) (2) (3) (4) (5) (6) (7)
Researchers 3.76*** 3.79*** 3.87*** 3.95*** 2.59*** 2.74*** 3.97***
(3.27) (6.03) (4.64) (4.11) (5.84) (3.31) (4.07)
QUW -38.46*** -12.67** -13.71* -4.94*
(-3.01) (-2.29) (-2.05) (-1.75)
QW1-3 -29.62**
(-2.17)
QWB -24.39*
Dependent variable: Number of claims filed in 2008, n=32
44
QWB -24.39*
(-1.77)
Constant -100.67 2129.89*** 1497.86** 1139.10 759.29** 805.30** 189.18
(-0.83) (2.97) (2.13) (1.70) (2.28) (2.09) (0.99)
R-squared 0.73 0.85 0.81 0.79 0.76 0.67 0.77
Nobs 32 32 32 32 31 30 29
USA USA, China USA, China,
EPO

(1) (2) (3) (4) (7)
Researchers 3.99*** 4.34*** 3.57*** 3.52*** 4.00***
(7.46) (8.21) (7.25) (8.83) (10.04)
QUW -40.32*** -36.68*** -43.12*** -42.35*** -40.15***
(-3.57) (-3.67) (-3.64) (-4.35) (-4.46)
FCGDPC -26.12** -100.30*** -72.94**
(-2.15) (-2.81) (-2.57)
Dependent variable: Number of patents filed in 2008/09, n=32
Explanatory variable: quality, relative fees, patent strength
45
(-2.15) (-2.81) (-2.57)
FCGDPC2 1.37** 0.98**
(2.42) (2.15)
IPI 646.88**
(2.28)
IPRES 1629.35*** 1197.78***
R-squared 0.88 0.90 0.88 0.87 0.92
Nobs 32 32 32 32 32
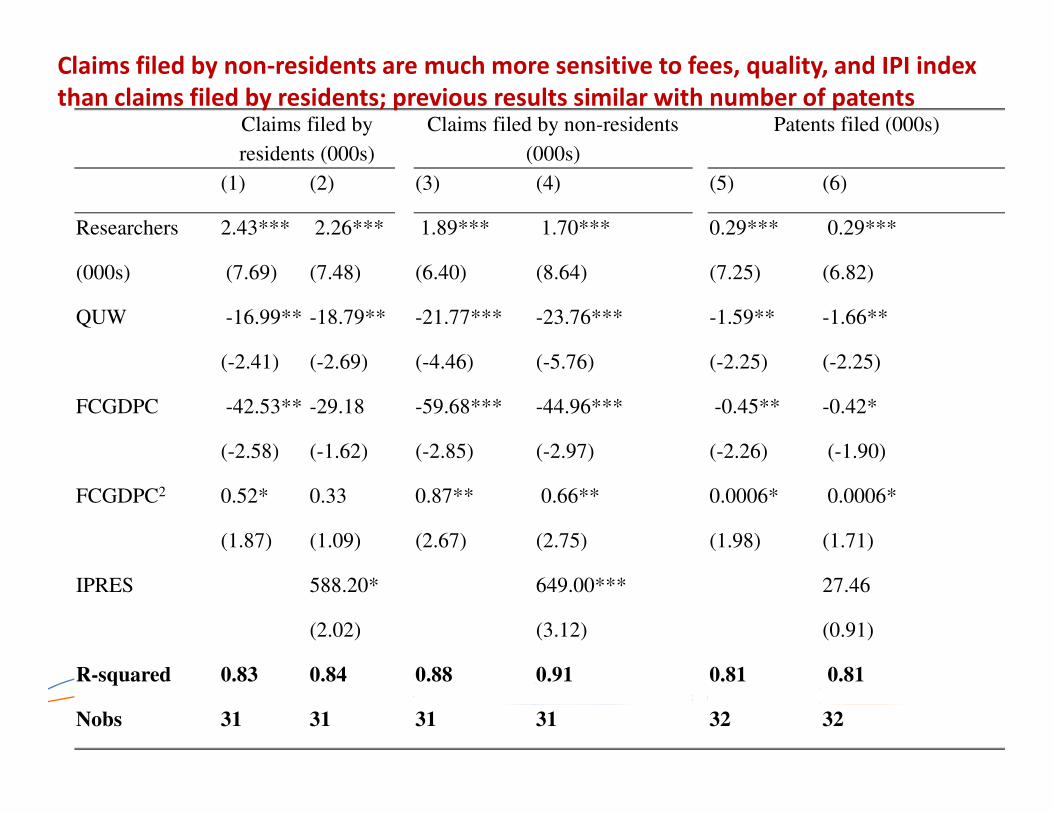
Claims filed by
residents (000s)
Claims filed by non-residents
(000s)
Patents filed (000s)
(1) (2) (3) (4) (5) (6)
Researchers 2.43*** 2.26*** 1.89*** 1.70*** 0.29*** 0.29***
(000s) (7.69) (7.48) (6.40) (8.64) (7.25) (6.82)
QUW -16.99** -18.79** -21.77*** -23.76*** -1.59** -1.66**
(-2.41) (-2.69) (-4.46) (-5.76) (-2.25) (-2.25)
FCGDPC -42.53** -29.18 -59.68*** -44.96*** -0.45** -0.42*
Claims filed by non-residents are much more sensitive to fees, quality, and IPI index
than claims filed by residents; previous results similar with number of patents
46
FCGDPC -42.53** -29.18 -59.68*** -44.96*** -0.45** -0.42*
(-2.58) (-1.62) (-2.85) (-2.97) (-2.26) (-1.90)
FCGDPC2 0.52* 0.33 0.87** 0.66** 0.0006* 0.0006*
(1.87) (1.09) (2.67) (2.75) (1.98) (1.71)
IPRES 588.20* 649.00*** 27.46
(2.02) (3.12) (0.91)
R-squared 0.83 0.84 0.88 0.91 0.81 0.81
Nobs 31 31 31 31 32 32

• Systemic approach must be adopted: many interdependent facets
form a coherent system; it is not “just” about F2F, Opposition,...
– Structural (rules) components
– Strategic/managerial (workload, budget) components
• EPS provides a higher quality selection service (stringency and
transparency) than the USPTO, JPO is in an intermediate position
Concluding remarks
transparency) than the USPTO, JPO is in an intermediate position
(implications for patent counts).
• The quality metric helps explaining structural differences (demand
for patent rights, or claims in force, both domestic and foreign)
• IPI index (patent friendliness) and fees also affect the patenting
behaviour
47

This paper ‘only’ provides evidence on relative positions; no insight
into optimal level:
RQ: Impact on rate of return to R&D; or on innovation?
48
Lemley (2001)
Rational ignorance?
Or Jefferson’s
hesitation?
Three main references
de Saint-Georges M. and B. van Pottelsberghe de la Potterie, 2011, A
quality index for patent systems, ECARES Working paper series.
Picard P. and B. van Pottelsberghe de la Potterie, 2011, Patent office
governance and patent system quality, ECARES Working paper series.
van Pottelsberghe de la Potterie B., 2011, The quality factor in patent
systems, Industrial and Corporate Change, forthcoming (in Press).
http://econpapers.repec.org/paper/brewpaper/440.htm
49