a quick introduction to approximate query processing part-iii cs286, spring’2007 minos garofalakis
Post on 19-Dec-2015
229 views
TRANSCRIPT
A Quick Introduction to A Quick Introduction to Approximate Query Processing Approximate Query Processing
Part-IIIPart-III
CS286, Spring’2007CS286, Spring’2007
Minos GarofalakisMinos Garofalakis
2CS286, Spring’07 – Minos Garofalakis #
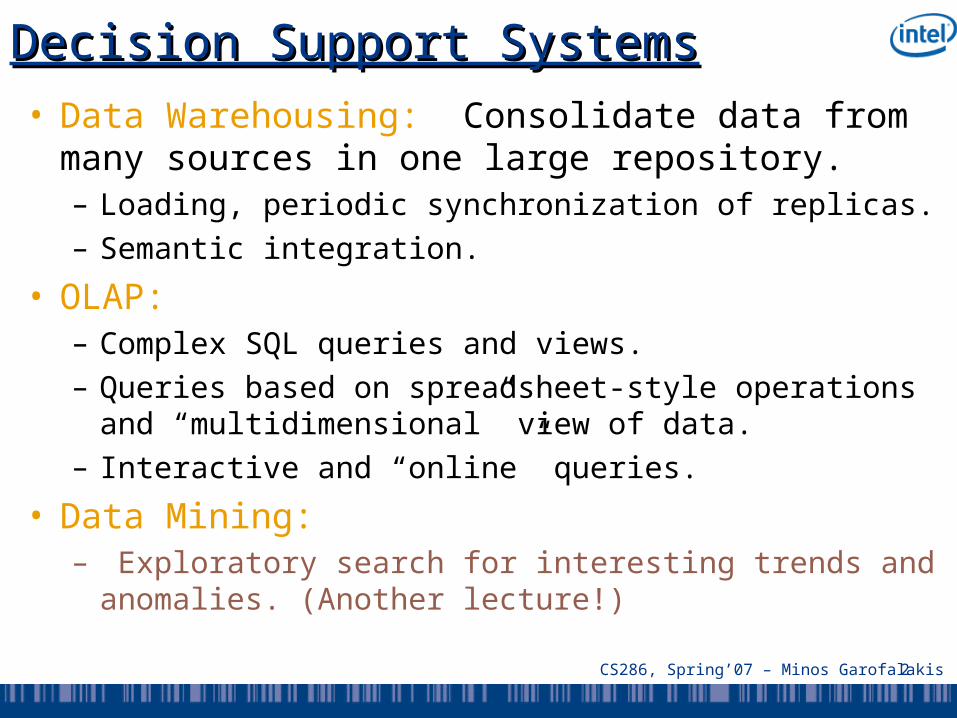
Decision Support SystemsDecision Support Systems• Data Warehousing: Consolidate data from
many sources in one large repository.– Loading, periodic synchronization of replicas.– Semantic integration.
• OLAP: – Complex SQL queries and views. – Queries based on spreadsheet-style operations and
“multidimensional” view of data.– Interactive and “online” queries.
• Data Mining: – Exploratory search for interesting trends and
anomalies. (Another lecture!)
3CS286, Spring’07 – Minos Garofalakis #
MotivationMotivation
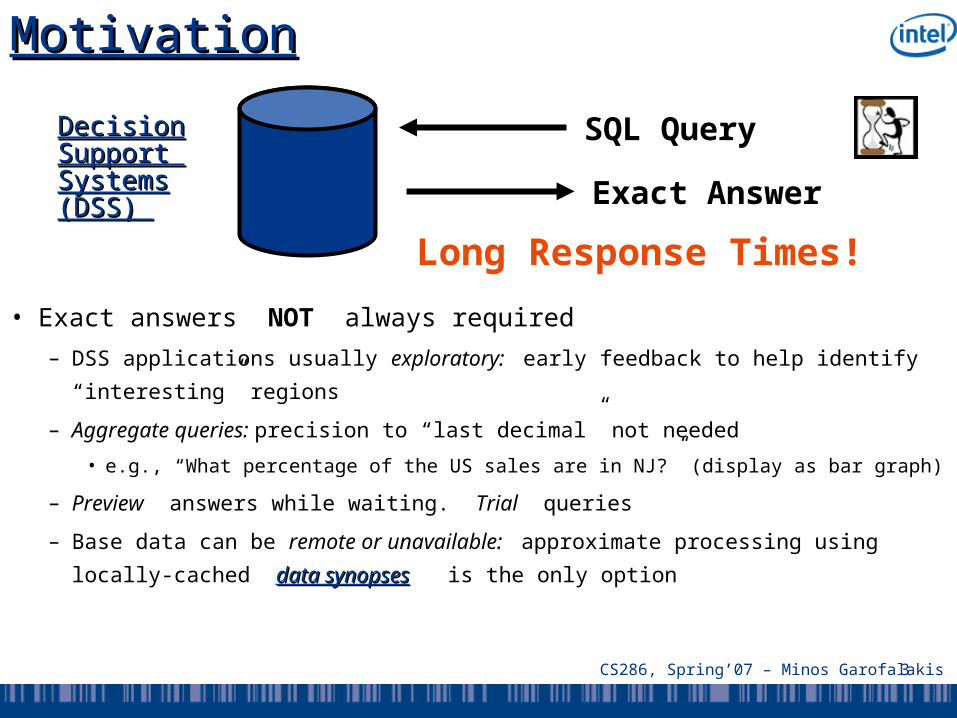
• Exact answers NOT always required
– DSS applications usually exploratory: early feedback to help identify
“interesting” regions
– Aggregate queries: precision to “last decimal” not needed
• e.g., “What percentage of the US sales are in NJ?” (display as bar graph)
– Preview answers while waiting. Trial queries
– Base data can be remote or unavailable: approximate processing using
locally-cached data synopsesdata synopses is the only option
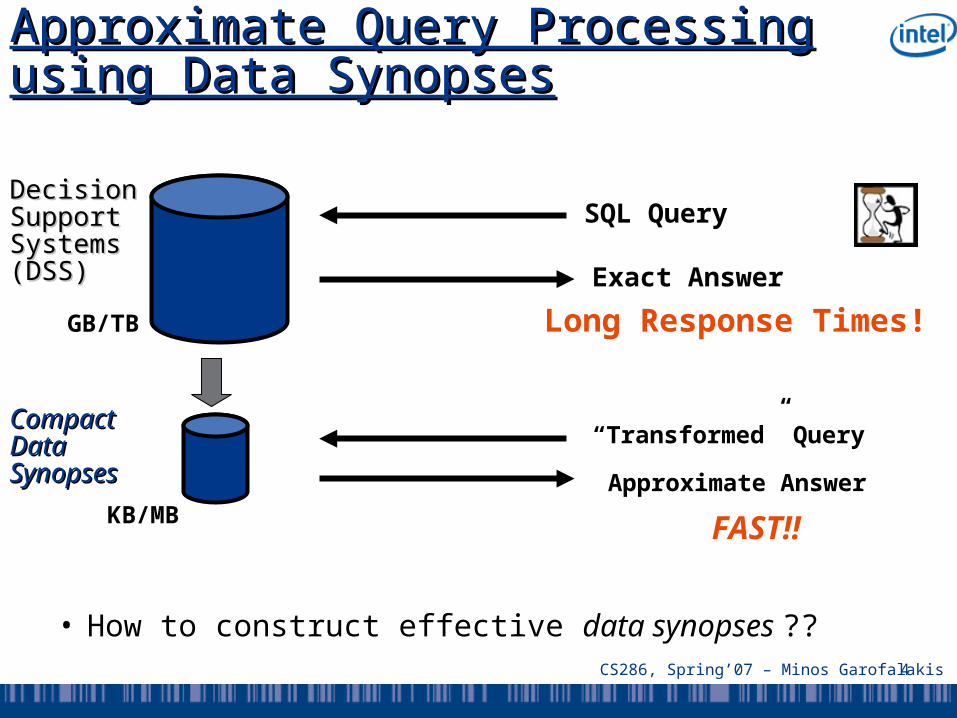
SQL Query
Exact Answer
DecisionDecisionSupport Support SystemsSystems(DSS) (DSS)
Long Response Times!
4CS286, Spring’07 – Minos Garofalakis #
Approximate Query Processing Approximate Query Processing using Data Synopsesusing Data Synopses
• How to construct effective data synopses ??
SQL Query
Exact Answer
DecisionDecisionSupport Support SystemsSystems(DSS) (DSS)
Long Response Times!
GB/TB
Compact Compact Data Data SynopsesSynopses
“Transformed” Query
KB/MBApproximate Answer
FAST!!
5CS286, Spring’07 – Minos Garofalakis #
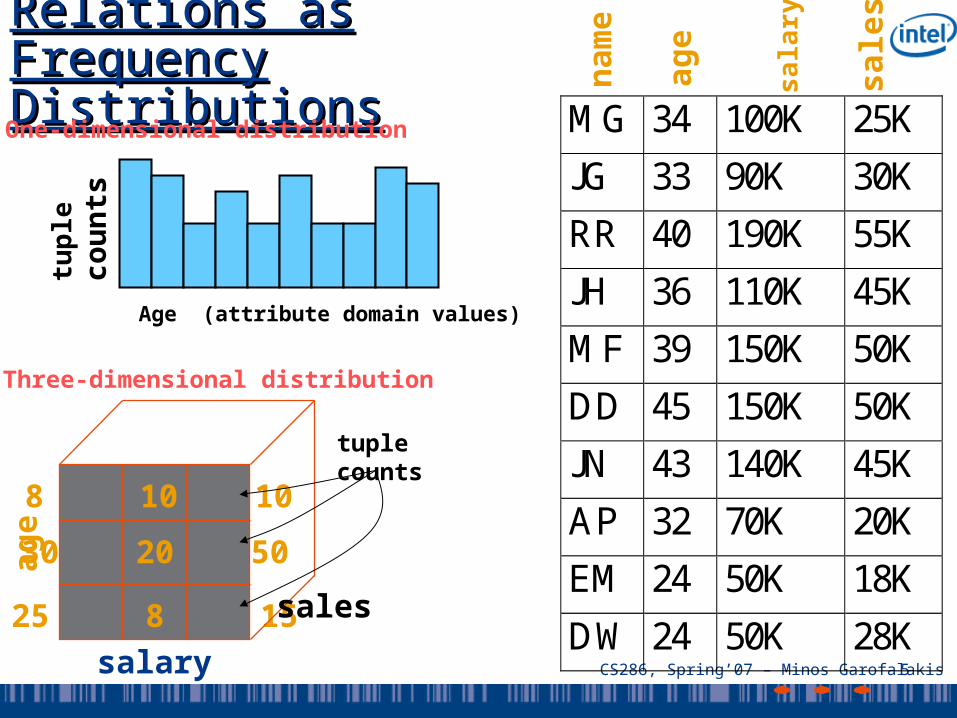
Relations as Relations as Frequency Frequency DistributionsDistributions
8 10 10
30 20 50
25 8 15 salary
ag
e
MG 34 100K 25K
JG 33 90K 30K
RR 40 190K 55K
JH 36 110K 45K
MF 39 150K 50K
DD 45 150K 50K
JN 43 140K 45K
AP 32 70K 20K
EM 24 50K 18K
DW 24 50K 28K
nam
e
ag
e
sala
ry
sale
s
sales
One-dimensional distribution
Age (attribute domain values)
tup
lecou
nts
Three-dimensional distribution
tuple counts
6CS286, Spring’07 – Minos Garofalakis #
OutlineOutline• Intro & Approximate Query Answering Overview
– Synopses, System architectures, Commercial offerings
• One-Dimensional Synopses– Histograms: Equi-depth, Compressed, V-optimal, Incremental
maintenance, Self-tuning
– Samples: Basics, Sampling from DBs, Reservoir Sampling
– Wavelets: 1-D Haar-wavelet histogram construction & maintenance
• Multi-Dimensional Synopses and Joins
• Set-Valued Queries
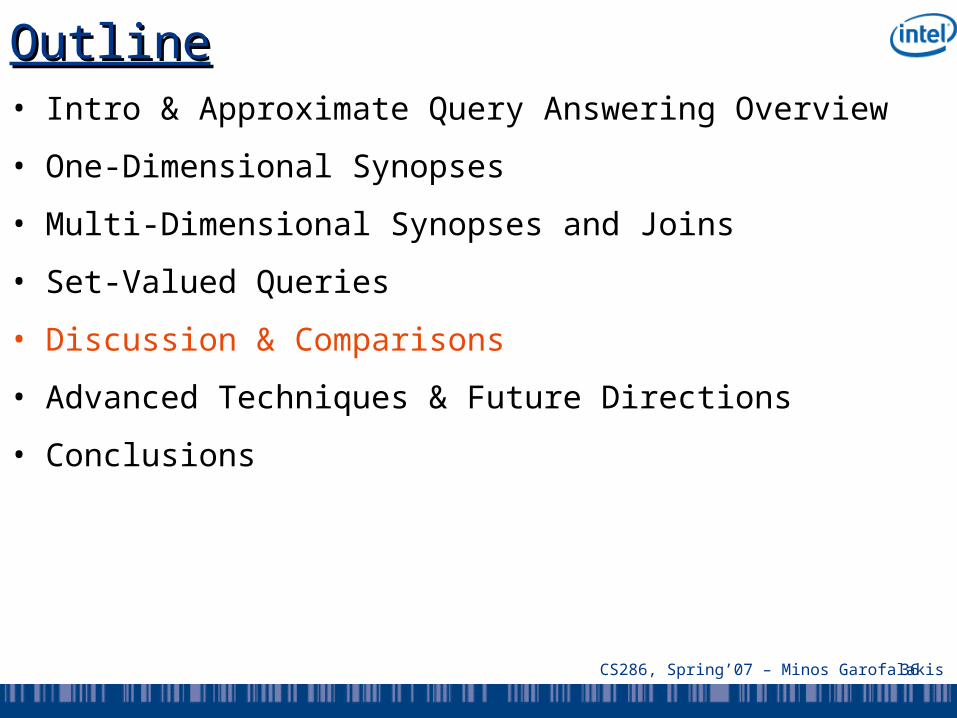
• Discussion & Comparisons
• Advanced Techniques & Future Directions
7CS286, Spring’07 – Minos Garofalakis #
OutlineOutline• Intro & Approximate Query Answering Overview
– Synopses, System architecture, Commercial offerings
• One-Dimensional Synopses
– Histograms, Samples, Wavelets
• Multi-Dimensional Synopses and Joins
– Multi-D Histograms, Join synopses, Wavelets
• Set-Valued Queries
– Using Histograms, Samples, Wavelets
• Discussion & Comparisons
• Advanced Techniques & Future Directions
– Dependency-based, Workload-tuned, Streaming data
8CS286, Spring’07 – Minos Garofalakis #
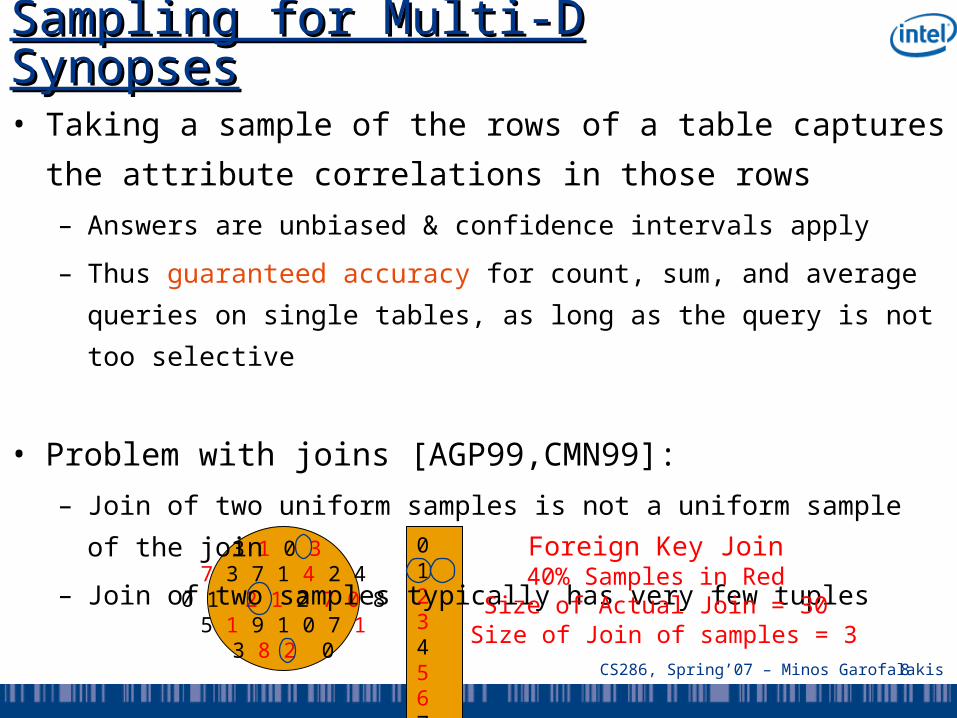
0 12 3 4 56 7 8 9
3 1 0 3 7 3 7 1 4 2 4
0 1 2 1 2 7 0 85 1 9 1 0 7 1
3 8 2 0
Sampling for Multi-D SynopsesSampling for Multi-D Synopses
• Taking a sample of the rows of a table captures the
attribute correlations in those rows
– Answers are unbiased & confidence intervals apply
– Thus guaranteed accuracy for count, sum, and average queries
on single tables, as long as the query is not too selective
• Problem with joins [AGP99,CMN99]:
– Join of two uniform samples is not a uniform sample of the join
– Join of two samples typically has very few tuples
Foreign Key Join40% Samples in Red
Size of Actual Join = 30Size of Join of samples = 3
9CS286, Spring’07 – Minos Garofalakis #
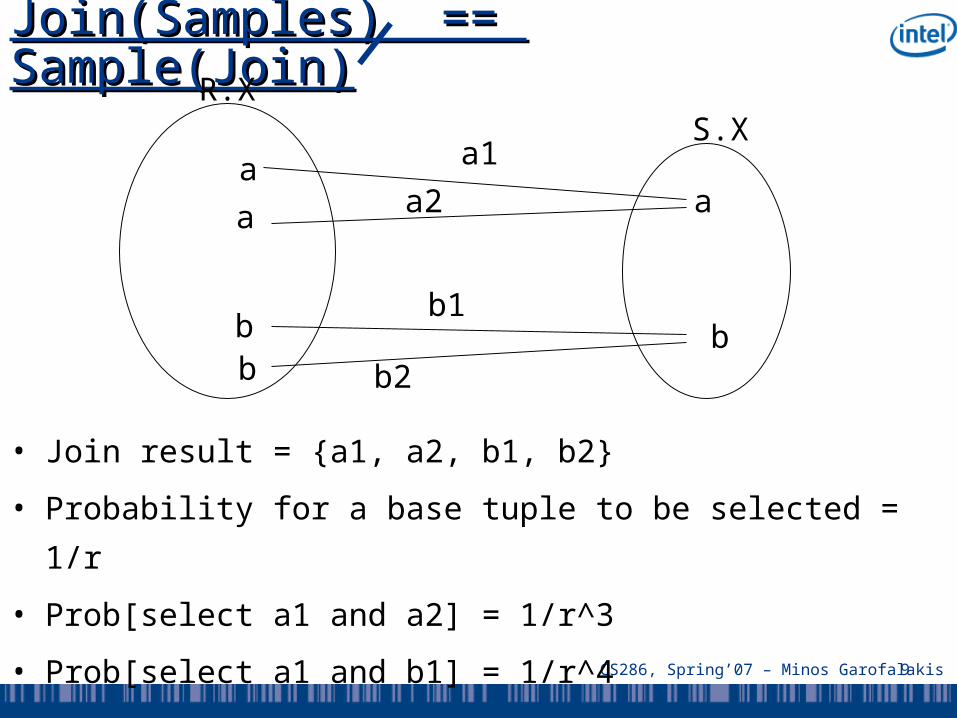
Join(Samples) == Join(Samples) == Sample(Join)Sample(Join)
R.X
a
a
bb
a
b
a1
a2
b1
S.X
b2
• Join result = {a1, a2, b1, b2}
• Probability for a base tuple to be selected = 1/r
• Prob[select a1 and a2] = 1/r^3
• Prob[select a1 and b1] = 1/r^4
10CS286, Spring’07 – Minos Garofalakis #
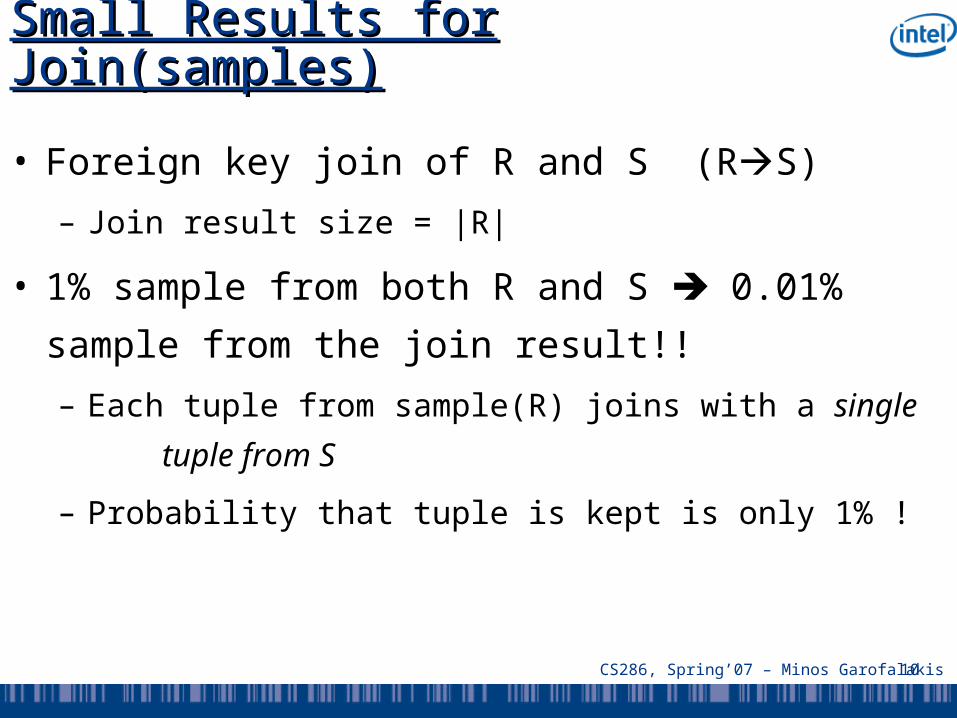
Small Results for Small Results for Join(samples)Join(samples)
• Foreign key join of R and S (RS)
– Join result size = |R|
• 1% sample from both R and S 0.01% sample
from the join result!!
– Each tuple from sample(R) joins with a single
tuple from S
– Probability that tuple is kept is only 1% !
11CS286, Spring’07 – Minos Garofalakis #
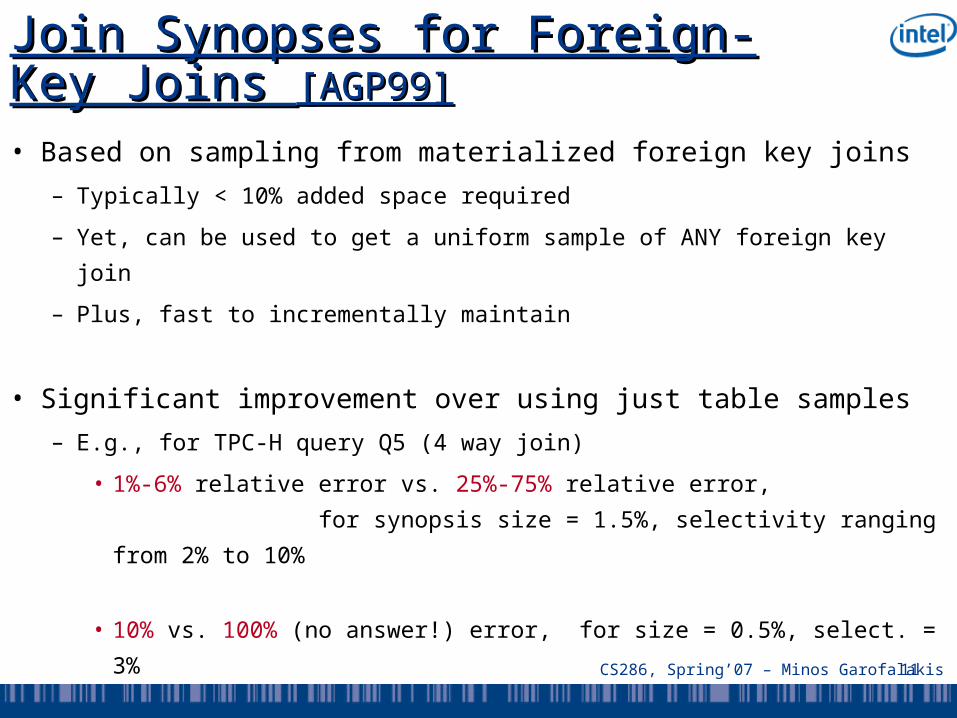
Join Synopses for Foreign-Key Join Synopses for Foreign-Key Joins Joins [AGP99][AGP99]
• Based on sampling from materialized foreign key joins
– Typically < 10% added space required
– Yet, can be used to get a uniform sample of ANY foreign key join
– Plus, fast to incrementally maintain
• Significant improvement over using just table samples
– E.g., for TPC-H query Q5 (4 way join)
• 1%-6% relative error vs. 25%-75% relative error,
for synopsis size = 1.5%, selectivity ranging from 2% to 10%
• 10% vs. 100% (no answer!) error, for size = 0.5%, select. = 3%
12CS286, Spring’07 – Minos Garofalakis #
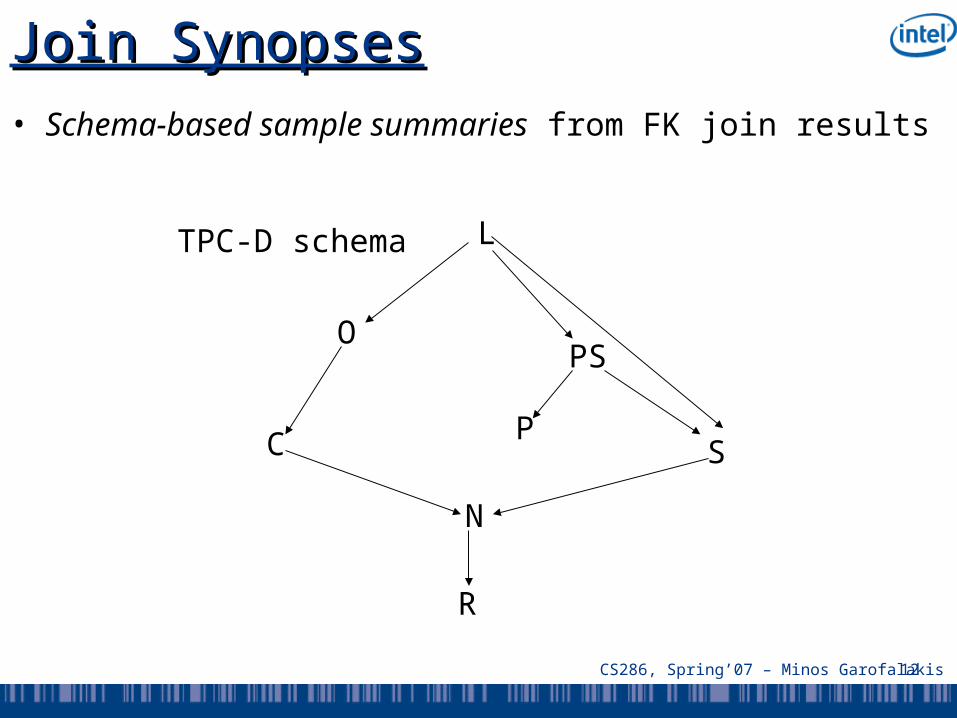
Join SynopsesJoin Synopses• Schema-based sample summaries from FK join results
L
PS
S
N
R
C
O
P
TPC-D schema
13CS286, Spring’07 – Minos Garofalakis #
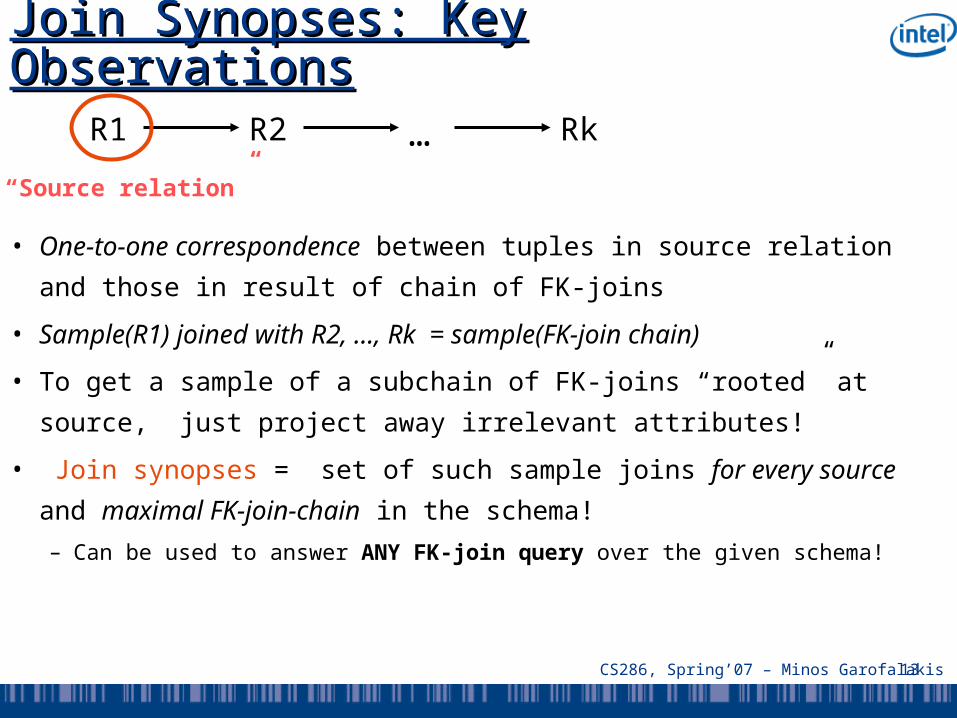
Join Synopses: Key Join Synopses: Key ObservationsObservations
• One-to-one correspondence between tuples in source relation and
those in result of chain of FK-joins
• Sample(R1) joined with R2, …, Rk = sample(FK-join chain)
• To get a sample of a subchain of FK-joins “rooted” at source, just
project away irrelevant attributes!
• Join synopses = set of such sample joins for every source and
maximal FK-join-chain in the schema!
– Can be used to answer ANY FK-join query over the given schema!
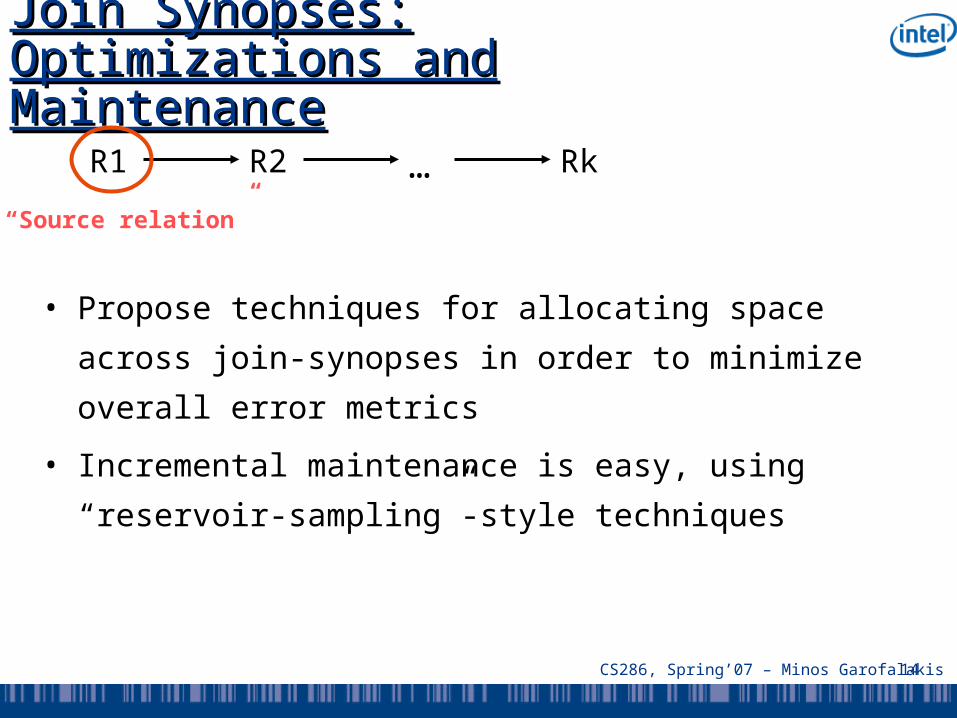
R1 R2 Rk…“Source relation”
14CS286, Spring’07 – Minos Garofalakis #
Join Synopses: Optimizations Join Synopses: Optimizations and Maintenanceand Maintenance
• Propose techniques for allocating space across join-
synopses in order to minimize overall error metrics
• Incremental maintenance is easy, using “reservoir-
sampling”-style techniques
R1 R2 Rk…“Source relation”
15CS286, Spring’07 – Minos Garofalakis #
Multi-dimensional Haar Multi-dimensional Haar WaveletsWavelets• Basic “pairwise averaging and differencing” ideas carry
over to multiple data dimensions
• Two basic methodologies -- no clear winner [SDS96]– Standard Haar decomposition
– Non-standard Haar decomposition
• Discussion here: focus on non-standard decomposition– See [SDS96, VW99] for more details on standard Haar
decomposition
– [MVW00] also discusses dynamic maintenance of standard multi-dimensional Haar wavelet synopses
17CS286, Spring’07 – Minos Garofalakis #
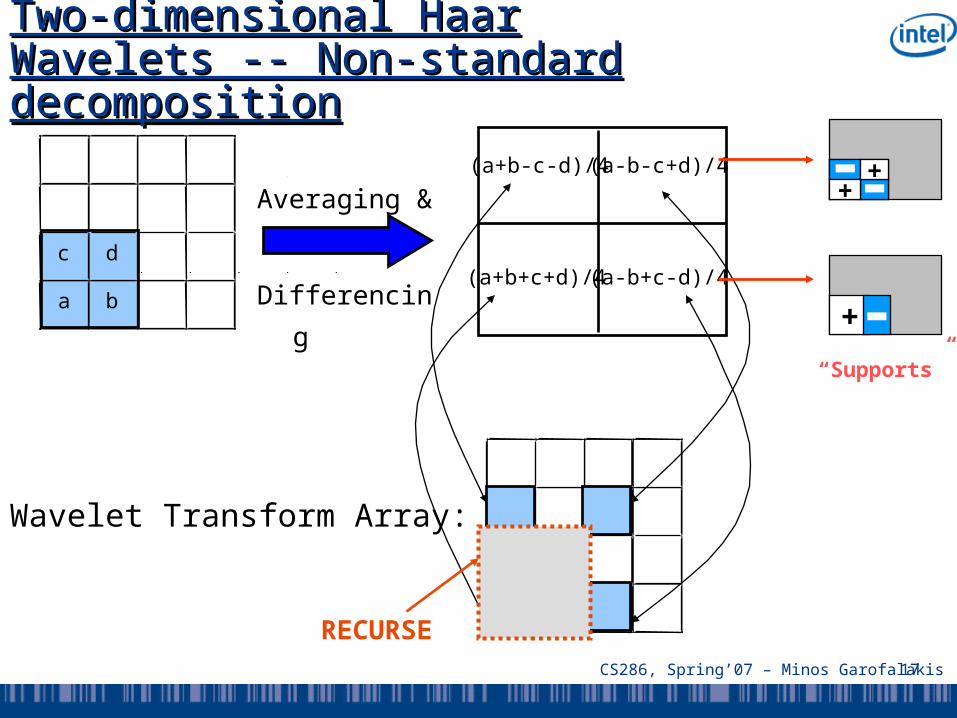
Two-dimensional Haar Wavelets -- Two-dimensional Haar Wavelets -- Non-standard decompositionNon-standard decomposition
c d
a b
Wavelet Transform Array:
Averaging &
Differencing
(a+b-c-d)/4
(a+b+c+d)/4
(a-b-c+d)/4
(a-b+c-d)/4
RECURSE
+ -
- -+ +
“Supports”
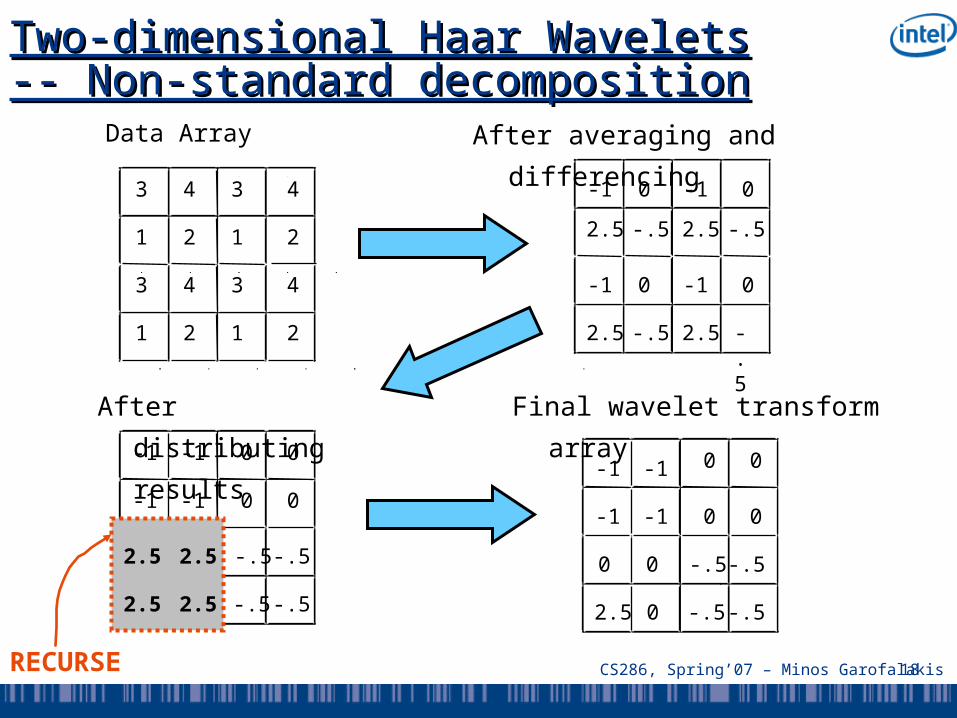
18CS286, Spring’07 – Minos Garofalakis #
Two-dimensional Haar Wavelets -- Two-dimensional Haar Wavelets -- Non-standard decompositionNon-standard decomposition
Data Array
3 4 3 4
1 2 1 2
3 4 3 4
1 2 1 2
After averaging and differencing
-1 0 -1 0
2.5 -.5 2.5 -.5
2.5 -.5 2.5 -.5
-1 0 -1 0
RECURSE
Final wavelet transform array
0 0
0 0
0 0
2.5 0
-1 -1
-1 -1
-.5 -.5
-.5 -.5
After distributing results
0 0
0 0
-.5 -.5
-.5 -.52.5
2.52.5
-1 -1
-1 -1
2.5
20CS286, Spring’07 – Minos Garofalakis #
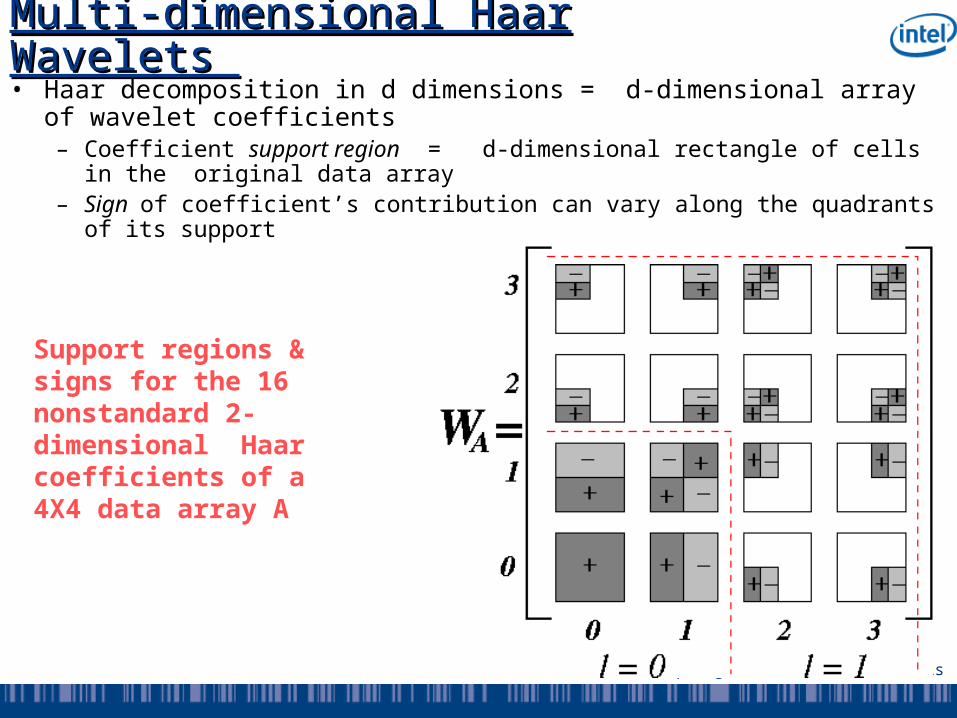
Multi-dimensional Haar Wavelets Multi-dimensional Haar Wavelets • Haar decomposition in d dimensions = d-dimensional array of
wavelet coefficients– Coefficient support region = d-dimensional rectangle of cells in the
original data array– Sign of coefficient’s contribution can vary along the quadrants of its
support
Support regions & signs for the 16 nonstandard 2-dimensional Haar coefficients of a 4X4 data array A
21CS286, Spring’07 – Minos Garofalakis #
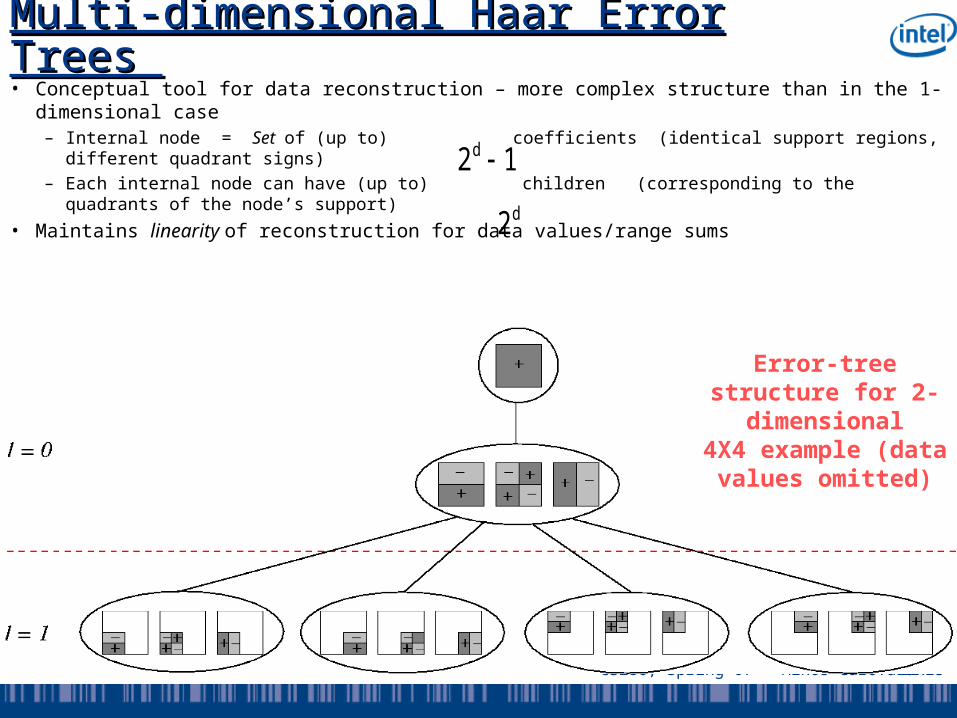
Multi-dimensional Haar Error Trees Multi-dimensional Haar Error Trees
Error-tree structure for 2-
dimensional4X4 example (data values
omitted)
12d d2
• Conceptual tool for data reconstruction – more complex structure than in the 1-dimensional case– Internal node = Set of (up to) coefficients (identical support regions, different quadrant
signs)– Each internal node can have (up to) children (corresponding to the quadrants of the
node’s support)
• Maintains linearity of reconstruction for data values/range sums
22CS286, Spring’07 – Minos Garofalakis #
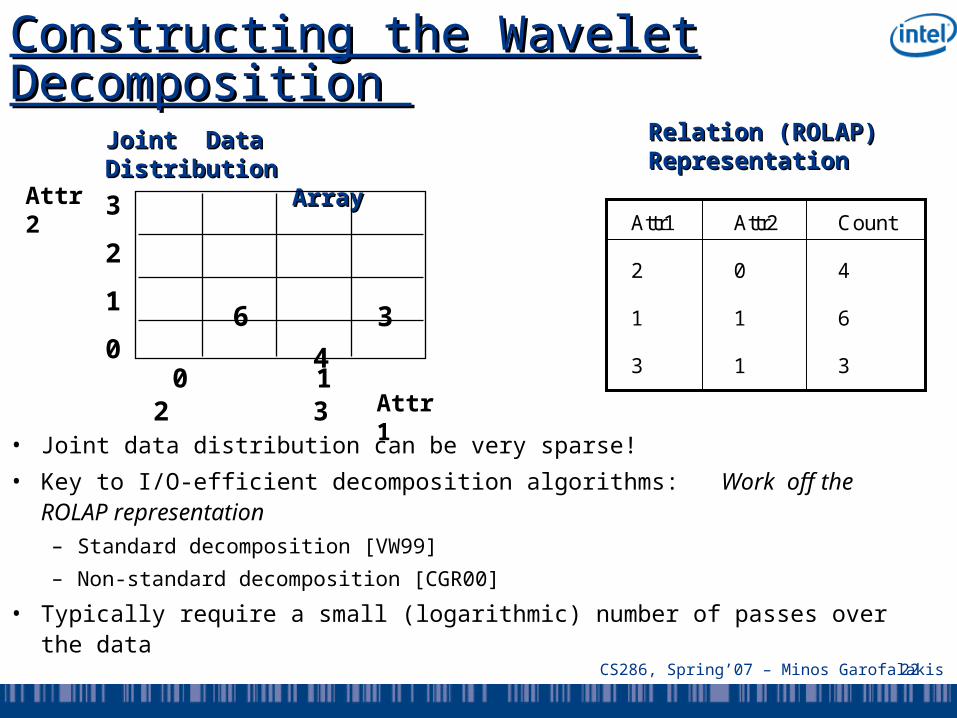
Constructing the Wavelet Constructing the Wavelet Decomposition Decomposition
Joint Data Distribution Joint Data Distribution ArrayArray
0 1 2 3Attr1
3
2
1
0
Attr2
36
4
Attr1 Attr2 Count
2 0 4
1 1 6
3 1 3
Relation (ROLAP) Relation (ROLAP) Representation Representation
• Joint data distribution can be very sparse!
• Key to I/O-efficient decomposition algorithms: Work off the ROLAP representation– Standard decomposition [VW99]
– Non-standard decomposition [CGR00]
• Typically require a small (logarithmic) number of passes over the data
23CS286, Spring’07 – Minos Garofalakis #
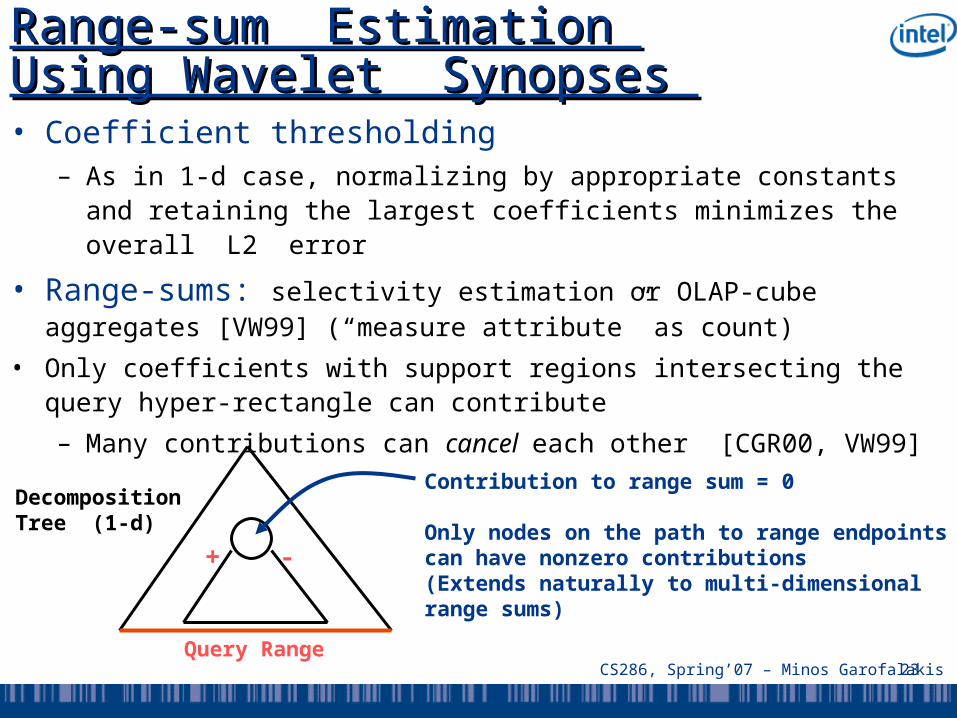
Range-sum Estimation Using Range-sum Estimation Using Wavelet Synopses Wavelet Synopses • Coefficient thresholding
– As in 1-d case, normalizing by appropriate constants and retaining the largest coefficients minimizes the overall L2 error
• Range-sums: selectivity estimation or OLAP-cube aggregates [VW99] (“measure attribute” as count)
• Only coefficients with support regions intersecting the query hyper-rectangle can contribute
– Many contributions can cancel each other [CGR00, VW99]
+ -
Query Range
Contribution to range sum = 0
Only nodes on the path to range endpoints can have nonzero contributions(Extends naturally to multi-dimensionalrange sums)
DecompositionTree (1-d)
24CS286, Spring’07 – Minos Garofalakis #
OutlineOutline• Intro & Approximate Query Answering Overview
• One-Dimensional Synopses
• Multi-Dimensional Synopses and Joins
• Set-Valued Queries
– Error Metrics
– Using Histograms
– Using Samples
– Using Wavelets
• Discussion & Comparisons
• Advanced Techniques & Future Directions
• Conclusions
25CS286, Spring’07 – Minos Garofalakis #
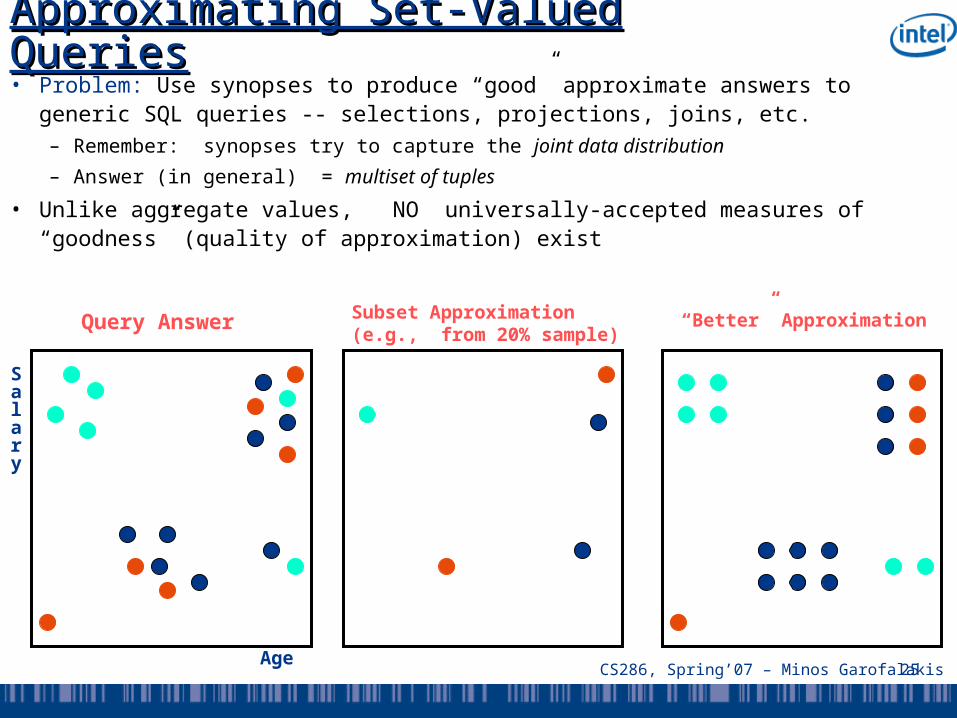
Approximating Set-Valued QueriesApproximating Set-Valued Queries• Problem: Use synopses to produce “good” approximate answers to generic SQL
queries -- selections, projections, joins, etc.– Remember: synopses try to capture the joint data distribution
– Answer (in general) = multiset of tuples
• Unlike aggregate values, NO universally-accepted measures of “goodness” (quality of approximation) exist
Age
Salary
Query Answer Subset Approximation(e.g., from 20% sample)
“Better” Approximation
26CS286, Spring’07 – Minos Garofalakis #
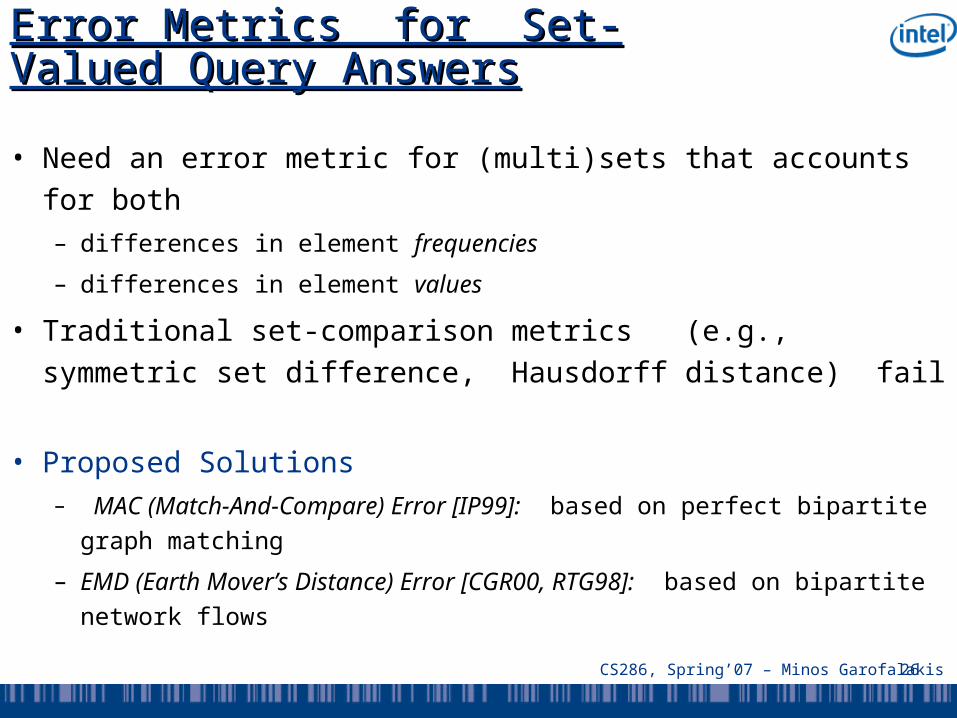
Error Metrics for Set-Valued Error Metrics for Set-Valued Query AnswersQuery Answers
• Need an error metric for (multi)sets that accounts for both– differences in element frequencies
– differences in element values
• Traditional set-comparison metrics (e.g., symmetric set difference, Hausdorff distance) fail
• Proposed Solutions– MAC (Match-And-Compare) Error [IP99]: based on perfect
bipartite graph matching
– EMD (Earth Mover’s Distance) Error [CGR00, RTG98]: based on bipartite network flows
27CS286, Spring’07 – Minos Garofalakis #
Using Histograms for Approximate Using Histograms for Approximate Set-Valued Queries Set-Valued Queries [IP99][IP99]• Store histograms as relations in a SQL database and define a
histogram algebra using simple SQL queries
• Implementation of the algebra operators (select, join, etc.) is fairly straightforward
– Each multidimensional histogram bucket directly corresponds to a set of approximate data tuples
• Experimental results demonstrate histograms to give much lower MAC errors than random sampling
• Potential problems
– For high-dimensional data, histogram effectiveness is unclear and construction costs are high [GKT00]
– Join algorithm requires expanding into approximate relations
• Can be as large (or larger!) than the original data set
28CS286, Spring’07 – Minos Garofalakis #
Set-Valued Queries via Set-Valued Queries via SamplesSamples• Applying the set-valued query to the sampled rows, we
very often obtain a subset of the rows in the full answer– E.g., Select all employees with 25+ years of service
– Exceptions include certain queries with nested subqueries (e.g., select all employees with above average salaries: but the average salary is known only approximately)
• Extrapolating from the sample:– Can treat each sample point as the center of a cluster of points
(generate approximate points, e.g., using kernels [BKS99, GKT00])
– Alternatively, Aqua [GMP97a, AGP99] returns an approximate count of the number of rows in the answer and a representative subset of the rows (i.e., the sampled points)
• Keeps result size manageable and fast to display
29CS286, Spring’07 – Minos Garofalakis #
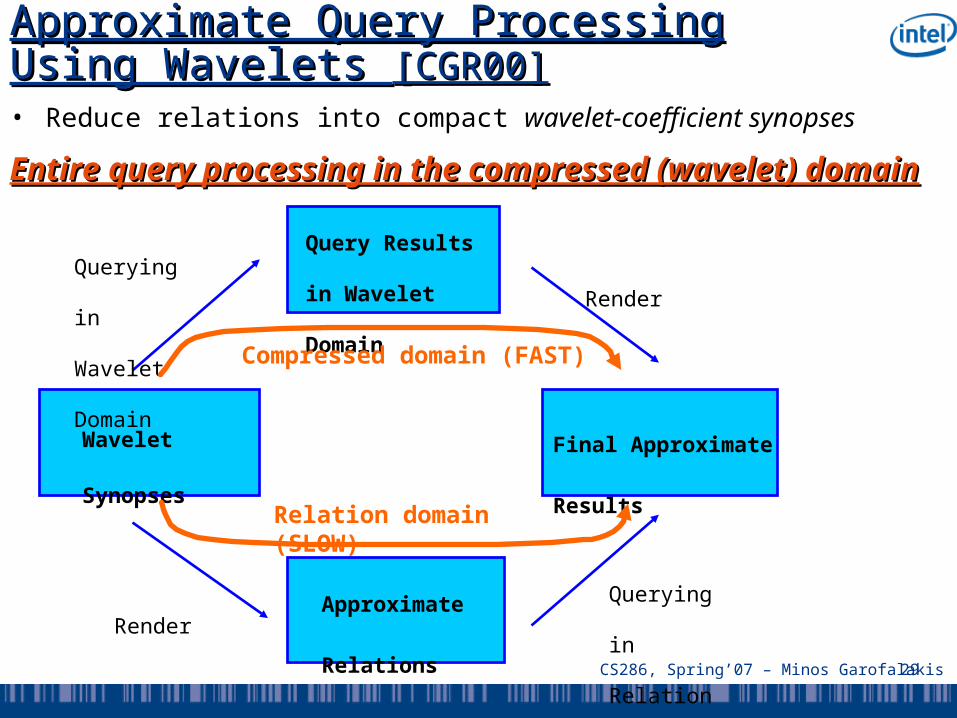
Approximate Query Processing Using Approximate Query Processing Using Wavelets Wavelets [CGR00][CGR00]
Wavelet
Synopses
Approximate
Relations
Query Results in
Wavelet Domain
Final Approximate
Results
Render
Render
Querying in
Wavelet
Domain
Querying in
Relation
Domain
Compressed domain (FAST)
Relation domain (SLOW)
• Reduce relations into compact wavelet-coefficient synopses
Entire query processing in the compressed (wavelet) domainEntire query processing in the compressed (wavelet) domain
30CS286, Spring’07 – Minos Garofalakis #
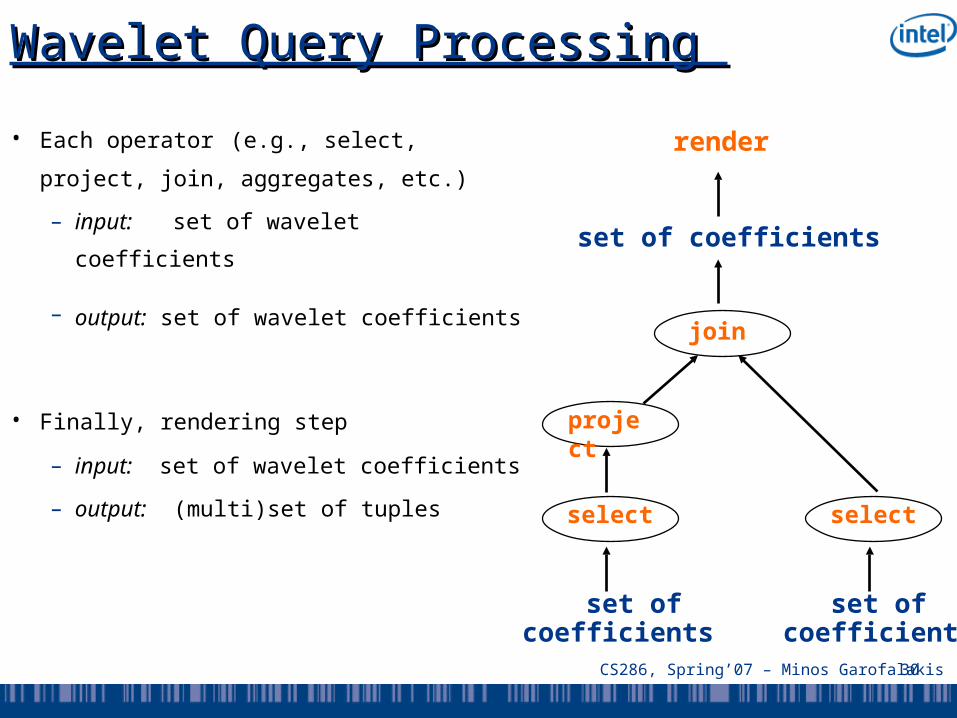
Wavelet Query Processing Wavelet Query Processing
join
project
select select
set of coefficients
set of coefficients
set of coefficients
• Each operator (e.g., select, project,
join, aggregates, etc.)
– input: set of wavelet coefficients
– output: set of wavelet coefficients
• Finally, rendering step
– input: set of wavelet coefficients
– output: (multi)set of tuples
render
31CS286, Spring’07 – Minos Garofalakis #
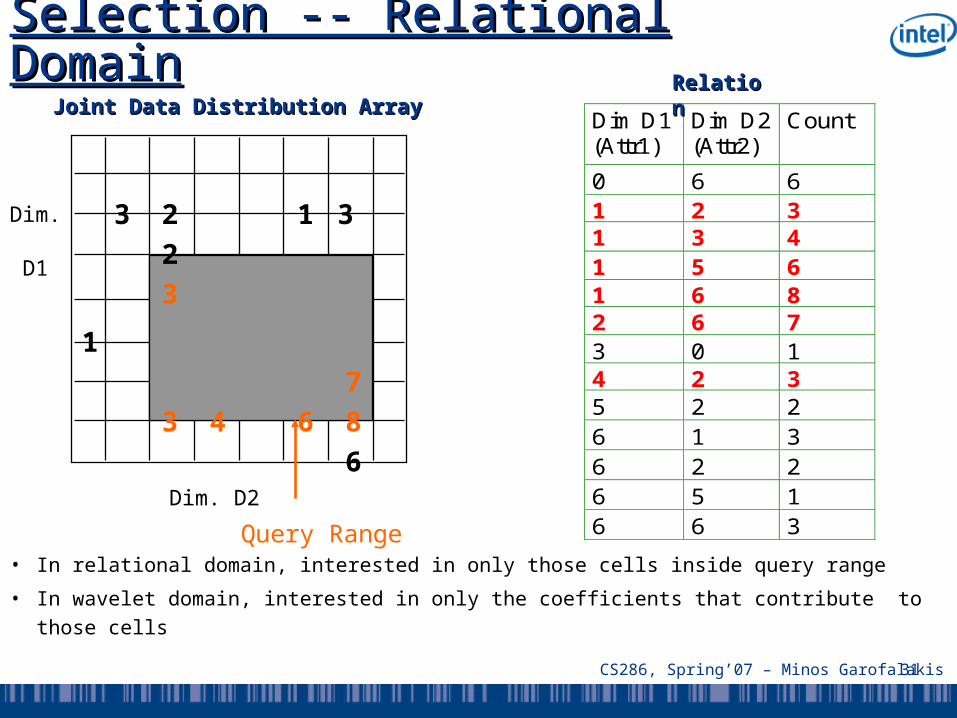
Selection -- Relational Selection -- Relational DomainDomain
• In relational domain, interested in only those cells inside query range
• In wavelet domain, interested in only the coefficients that contribute to those cells
Dim D1(Attr1)
Dim D2(Attr2)
Count
0 6 61 2 31 3 41 5 61 6 82 6 73 0 14 2 35 2 26 1 36 2 26 5 16 6 3
Dim. D2
6
3
7
3
32
2
4
1
1
8
6
3
Query Range
Dim.
D1
Joint Data Distribution ArrayJoint Data Distribution ArrayRelatioRelationn
32CS286, Spring’07 – Minos Garofalakis #
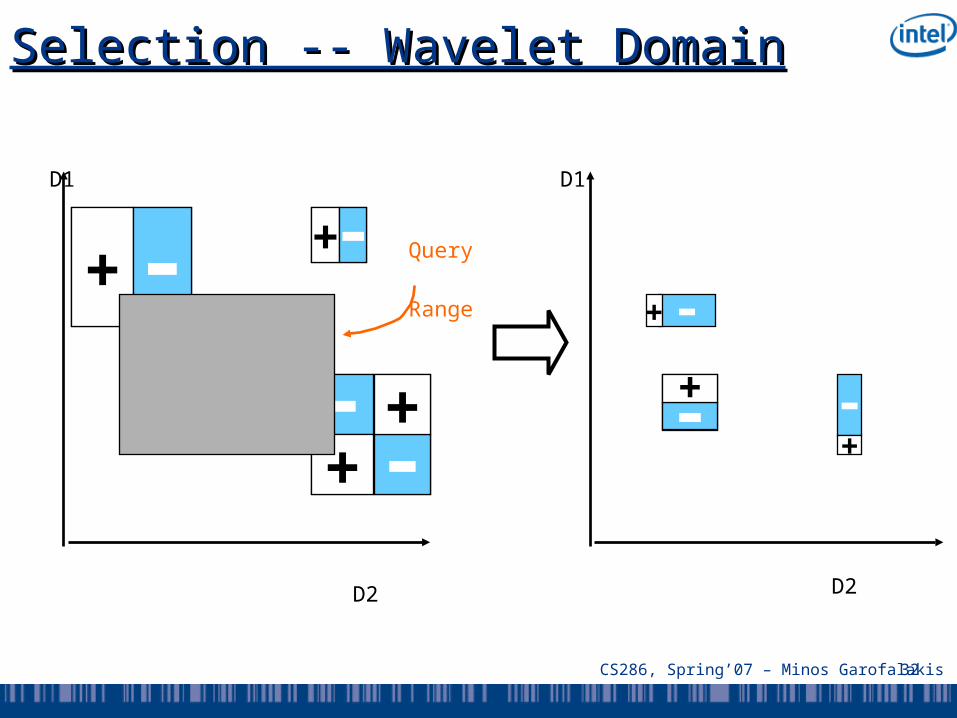
Selection -- Wavelet DomainSelection -- Wavelet Domain
--++
+ -
-+
+-
D2
D1
Query
Range -+
-+
-+
D2
D1
33CS286, Spring’07 – Minos Garofalakis #
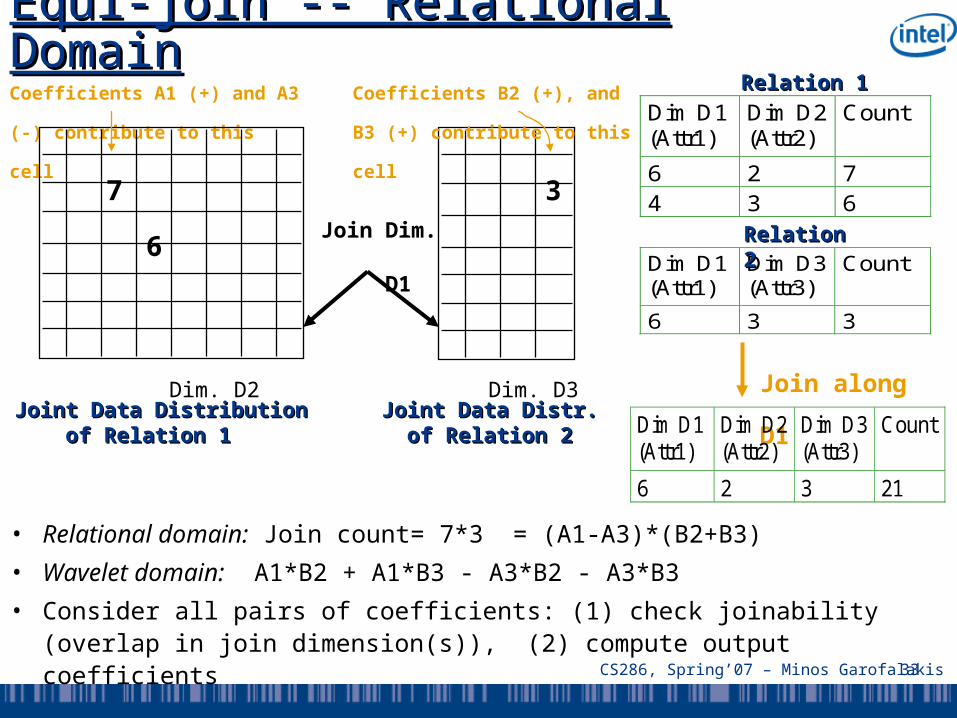
Equi-join -- Relational DomainEqui-join -- Relational Domain
• Relational domain: Join count= 7*3 = (A1-A3)*(B2+B3)
• Wavelet domain: A1*B2 + A1*B3 - A3*B2 - A3*B3
• Consider all pairs of coefficients: (1) check joinability (overlap in join dimension(s)), (2) compute output coefficients
3
Coefficients A1 (+) and A3 (-)
contribute to this cell
Coefficients B2 (+), and B3 (+)
contribute to this cellDim D1(Attr1)
Dim D2(Attr2)
Count
6 2 74 3 6
Dim D1(Attr1)
Dim D3(Attr3)
Count
6 3 3
Join along D1
Dim D1(Attr1)
Dim D2(Attr2)
Dim D3(Attr3)
Count
6 2 3 21
Joint Data DistributionJoint Data Distribution of Relation 1of Relation 1
Joint Data Distr.Joint Data Distr. of Relation 2of Relation 2
7
6
Dim. D2 Dim. D3
Join Dim.
D1
Relation 1Relation 1
Relation 2Relation 2
34CS286, Spring’07 – Minos Garofalakis #
Equi-join -- Wavelet DomainEqui-join -- Wavelet Domain
-+
D3
D1--++
D2
D1
D1
v1 v2
Join output coefficient:
D3
D1
+
D2
-v = v1 * v2

35CS286, Spring’07 – Minos Garofalakis #
Wavelet Query Processing Wavelet Query Processing
join
project
select select
set of coefficients
set of coefficients
set of coefficients
• Each operator (e.g., select, project,
join, aggregates, etc.)
– input: set of wavelet coefficients
– output: set of wavelet coefficients
• Finally, rendering step
– input: set of wavelet coefficients
– output: (multi)set of tuples
render
36CS286, Spring’07 – Minos Garofalakis #
OutlineOutline• Intro & Approximate Query Answering Overview
• One-Dimensional Synopses
• Multi-Dimensional Synopses and Joins
• Set-Valued Queries
• Discussion & Comparisons
• Advanced Techniques & Future Directions
• Conclusions
37CS286, Spring’07 – Minos Garofalakis #
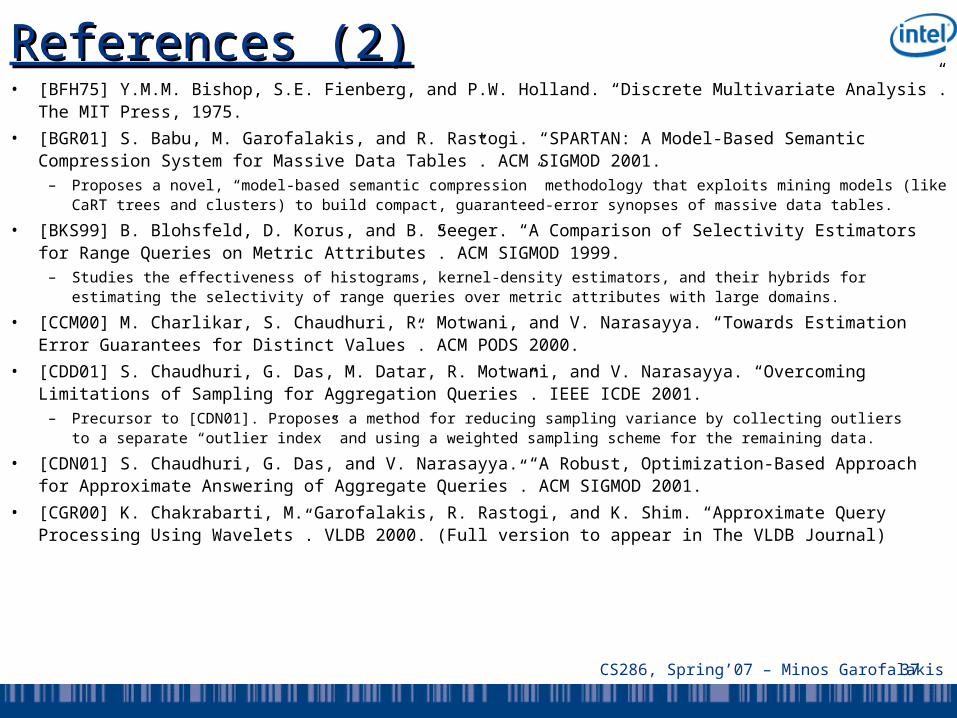
References (2)References (2)• [BFH75] Y.M.M. Bishop, S.E. Fienberg, and P.W. Holland. “Discrete Multivariate Analysis”. The MIT
Press, 1975.
• [BGR01] S. Babu, M. Garofalakis, and R. Rastogi. “SPARTAN: A Model-Based Semantic Compression System for Massive Data Tables”. ACM SIGMOD 2001.
– Proposes a novel, “model-based semantic compression” methodology that exploits mining models (like CaRT trees and clusters) to build compact, guaranteed-error synopses of massive data tables.
• [BKS99] B. Blohsfeld, D. Korus, and B. Seeger. “A Comparison of Selectivity Estimators for Range Queries on Metric Attributes”. ACM SIGMOD 1999.
– Studies the effectiveness of histograms, kernel-density estimators, and their hybrids for estimating the selectivity of range queries over metric attributes with large domains.
• [CCM00] M. Charlikar, S. Chaudhuri, R. Motwani, and V. Narasayya. “Towards Estimation Error Guarantees for Distinct Values”. ACM PODS 2000.
• [CDD01] S. Chaudhuri, G. Das, M. Datar, R. Motwani, and V. Narasayya. “Overcoming Limitations of Sampling for Aggregation Queries”. IEEE ICDE 2001.
– Precursor to [CDN01]. Proposes a method for reducing sampling variance by collecting outliers to a separate “outlier index” and using a weighted sampling scheme for the remaining data.
• [CDN01] S. Chaudhuri, G. Das, and V. Narasayya. “A Robust, Optimization-Based Approach for Approximate Answering of Aggregate Queries”. ACM SIGMOD 2001.
• [CGR00] K. Chakrabarti, M. Garofalakis, R. Rastogi, and K. Shim. “Approximate Query Processing Using Wavelets”. VLDB 2000. (Full version to appear in The VLDB Journal)
38CS286, Spring’07 – Minos Garofalakis #
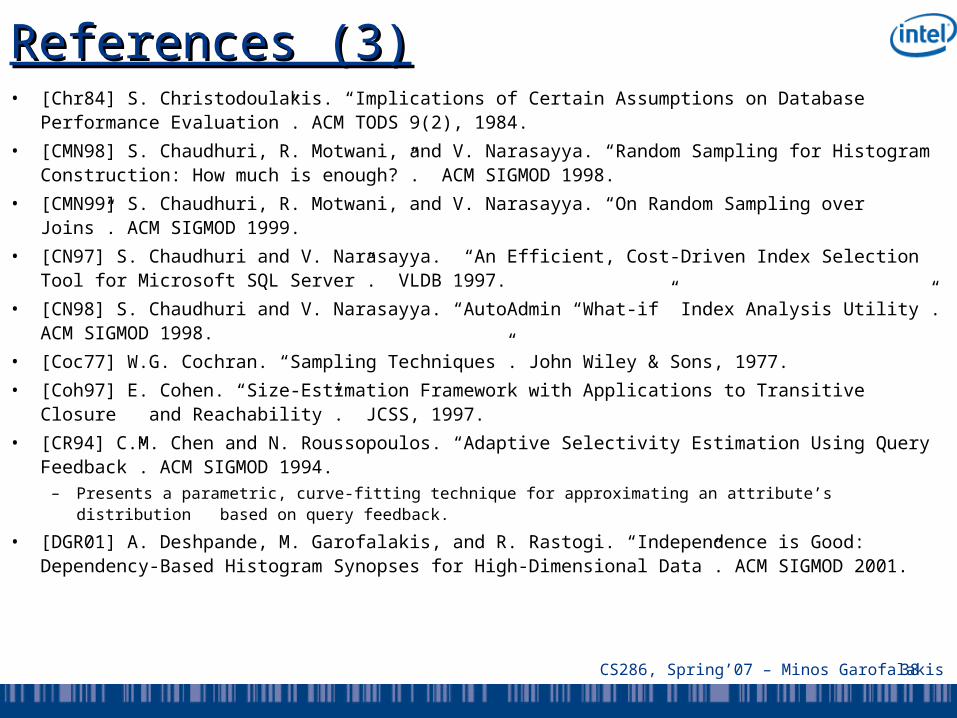
References (3)References (3)• [Chr84] S. Christodoulakis. “Implications of Certain Assumptions on Database Performance
Evaluation”. ACM TODS 9(2), 1984.
• [CMN98] S. Chaudhuri, R. Motwani, and V. Narasayya. “Random Sampling for Histogram Construction: How much is enough?”. ACM SIGMOD 1998.
• [CMN99] S. Chaudhuri, R. Motwani, and V. Narasayya. “On Random Sampling over Joins”. ACM SIGMOD 1999.
• [CN97] S. Chaudhuri and V. Narasayya. “An Efficient, Cost-Driven Index Selection Tool for Microsoft SQL Server”. VLDB 1997.
• [CN98] S. Chaudhuri and V. Narasayya. “AutoAdmin “What-if” Index Analysis Utility”. ACM SIGMOD 1998.
• [Coc77] W.G. Cochran. “Sampling Techniques”. John Wiley & Sons, 1977.
• [Coh97] E. Cohen. “Size-Estimation Framework with Applications to Transitive Closure and Reachability”. JCSS, 1997.
• [CR94] C.M. Chen and N. Roussopoulos. “Adaptive Selectivity Estimation Using Query Feedback”. ACM SIGMOD 1994.
– Presents a parametric, curve-fitting technique for approximating an attribute’s distribution based on query feedback.
• [DGR01] A. Deshpande, M. Garofalakis, and R. Rastogi. “Independence is Good: Dependency-Based Histogram Synopses for High-Dimensional Data”. ACM SIGMOD 2001.
39CS286, Spring’07 – Minos Garofalakis #
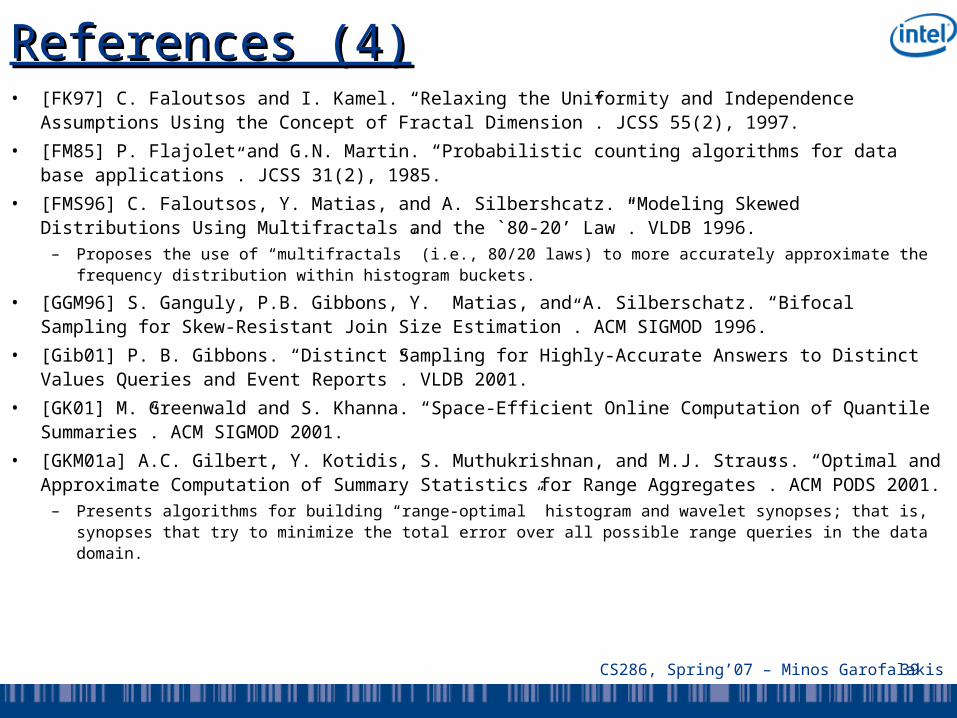
References (4)References (4)• [FK97] C. Faloutsos and I. Kamel. “Relaxing the Uniformity and Independence Assumptions
Using the Concept of Fractal Dimension”. JCSS 55(2), 1997.
• [FM85] P. Flajolet and G.N. Martin. “Probabilistic counting algorithms for data base applications”. JCSS 31(2), 1985.
• [FMS96] C. Faloutsos, Y. Matias, and A. Silbershcatz. “Modeling Skewed Distributions Using Multifractals and the `80-20’ Law”. VLDB 1996.
– Proposes the use of “multifractals” (i.e., 80/20 laws) to more accurately approximate the frequency distribution within histogram buckets.
• [GGM96] S. Ganguly, P.B. Gibbons, Y. Matias, and A. Silberschatz. “Bifocal Sampling for Skew-Resistant Join Size Estimation”. ACM SIGMOD 1996.
• [Gib01] P. B. Gibbons. “Distinct Sampling for Highly-Accurate Answers to Distinct Values Queries and Event Reports”. VLDB 2001.
• [GK01] M. Greenwald and S. Khanna. “Space-Efficient Online Computation of Quantile Summaries”. ACM SIGMOD 2001.
• [GKM01a] A.C. Gilbert, Y. Kotidis, S. Muthukrishnan, and M.J. Strauss. “Optimal and Approximate Computation of Summary Statistics for Range Aggregates”. ACM PODS 2001.
– Presents algorithms for building “range-optimal” histogram and wavelet synopses; that is, synopses that try to minimize the total error over all possible range queries in the data domain.
40CS286, Spring’07 – Minos Garofalakis #
References (5)References (5)• [GKM01b] A.C. Gilbert, Y. Kotidis, S. Muthukrishnan, and M.J. Strauss. “Surfing Wavelets on
Streams: One-Pass Summaries for Approximate Aggregate Queries”. VLDB 2001.
• [GKT00] D. Gunopulos, G. Kollios, V.J. Tsotras, and C. Domeniconi. “Approximating Multi-Dimensional Aggregate Range Queries over Real Attributes”. ACM SIGMOD 2000.
• [GKS01a] J. Gehrke, F. Korn, and D. Srivastava. “On Computing Correlated Aggregates over Continual Data Streams”. ACM SIGMOD 2001.
• [GKS01b] S. Guha, N. Koudas, and K. Shim. “Data Streams and Histograms”. ACM STOC 2001.
• [GLR00] V. Ganti, M.L. Lee, and R. Ramakrishnan. “ICICLES: Self-Tuning Samples for Approximate Query Answering“. VLDB 2000.
• [GM98] P. B. Gibbons and Y. Matias. “New Sampling-Based Summary Statistics for Improving Approximate Query Answers”. ACM SIGMOD 1998.
– Proposes the “concise sample” and “counting sample” techniques for improving the accuracy of sampling-based estimation for a given amount of space for the sample synopsis.
• [GMP97a] P. B. Gibbons, Y. Matias, and V. Poosala. “The Aqua Project White Paper”. Bell Labs tech report, 1997.
• [GMP97b] P. B. Gibbons, Y. Matias, and V. Poosala. “Fast Incremental Maintenance of Approximate Histograms”. VLDB 1997.
41CS286, Spring’07 – Minos Garofalakis #
References (6)References (6)• [GTK01] L. Getoor, B. Taskar, and D. Koller. “Selectivity Estimation using Probabilistic
Relational Models”. ACM SIGMOD 2001.– Proposes novel, Bayesian-network-based techniques for approximating joint data distributions in relational database
systems.
• [HAR00] J. M. Hellerstein, R. Avnur, and V. Raman. “Informix under CONTROL: Online Query Processing”. Data Mining and Knowledge Discovery Journal, 2000.
• [HH99] P. J. Haas and J. M. Hellerstein. “Ripple Joins for Online Aggregation”. ACM SIGMOD 1999.
• [HHW97] J. M. Hellerstein, P. J. Haas, and H. J. Wang. “Online Aggregation”. ACM SIGMOD 1997.
• [HNS95] P.J. Haas, J.F. Naughton, S. Seshadri, and L. Stokes. “Sampling-Based Estimation of the Number of Distinct Values of an Attribute”. VLDB 1995.
– Proposes and evaluates several sampling-based estimators for the number of distinct values in an attribute column.
• [HNS96] P.J. Haas, J.F. Naughton, S. Seshadri, and A. Swami. “Selectivity and Cost Estimation for Joins Based on Random Sampling”. JCSS 52(3), 1996.
• [HOT88] W.C. Hou, Ozsoyoglu, and B.K. Taneja. “Statistical Estimators for Relational Algebra Expressions”. ACM PODS 1988.
• [HOT89] W.C. Hou, Ozsoyoglu, and B.K. Taneja. “Processing Aggregate Relational Queries with Hard Time Constraints”. ACM SIGMOD 1989.
42CS286, Spring’07 – Minos Garofalakis #
References (7)References (7)• [IC91] Y. Ioannidis and S. Christodoulakis. “On the Propagation of Errors in the Size of Join Results”.
ACM SIGMOD 1991.
• [IC93] Y. Ioannidis and S. Christodoulakis. “Optimal Histograms for Limiting Worst-Case Error Propagation in the Size of join Results”. ACM TODS 18(4), 1993.
• [Ioa93] Y.E. Ioannidis. “Universality of Serial Histograms”. VLDB 1993.– The above three papers propose and study serial histograms (i.e., histograms that bucket “neighboring”
frequency values, and exploit results from majorization theory to establish their optimality wrt minimizing (extreme cases of) the error in multi-join queries.
• [IP95] Y. Ioannidis and V. Poosala. “Balancing Histogram Optimality and Practicality for Query Result Size Estimation”. ACM SIGMOD 1995.
• [IP99] Y.E. Ioannidis and V. Poosala. “Histogram-Based Approximation of Set-Valued Query Answers”. VLDB 1999.
• [JKM98] H. V. Jagadish, N. Koudas, S. Muthukrishnan, V. Poosala, K. Sevcik, and T. Suel. “Optimal Histograms with Quality Guarantees”. VLDB 1998.
• [JMN99] H. V. Jagadish, J. Madar, and R.T. Ng. “Semantic Compression and Pattern Extraction with Fascicles”. VLDB 1999.
– Discusses the use of “fascicles” (i.e., approximate data clusters) for the semantic compression of relational data.
• [KJF97] F. Korn, H.V. Jagadish, and C. Faloutsos. “Efficiently Supporting Ad-Hoc Queries in Large Datasets of Time Sequences”. ACM SIGMOD 1997.
43CS286, Spring’07 – Minos Garofalakis #
References (8)References (8)– Proposes the use of SVD techniques for obtaining fast approximate answers from large time-series
databases.
• [Koo80] R. P. Kooi. “The Optimization of Queries in Relational Databases”. PhD thesis, Case Western Reserve University, 1980.
• [KW99] A.C. Konig and G. Weikum. “Combining Histograms and Parametric Curve Fitting for Feedback-Driven Query Result-Size Estimation”. VLDB 1999.
– Proposes the use of linear splines to better approximate the data and frequency distribution within histogram buckets.
• [Lau96] S.L. Lauritzen. “Graphical Models”. Oxford Science, 1996.
• [LKC99] J.H. Lee, D.H. Kim, and C.W. Chung. “Multi-dimensional Selectivity Estimation Using Compressed Histogram Information”. ACM SIGMOD 1999.
– Proposes the use of the Discrete Cosine Transform (DCT) for compressing the information in multi-dimensional histogram buckets.
• [LM01] I. Lazaridis and S. Mehrotra. “Progressive Approximate Aggregate Queries with a Multi-Resolution Tree Structure”. ACM SIGMOD 2001.
– Proposes techniques for enhancing hierarchical multi-dimensional index structures to enable approximate answering of aggregate queries with progressively improving accuracy.
• [LNS90] R.J. Lipton, J.F. Naughton, and D.A. Schneider. “Practical Selectivity Estimation through Adaptive Sampling”. ACM SIGMOD 1990.
– Presents an adaptive, sequential sampling scheme for estimating the selectivity of relational equi-join operators.
44CS286, Spring’07 – Minos Garofalakis #
References (9)References (9)• [LNS93] R.J. Lipton, J.F. Naughton, D.A. Schneider, and S. Seshadri. “Efficient sampling
strategies for relational database operators”, Theoretical Comp. Science, 1993.
• [MD88] M. Muralikrishna and D.J. DeWitt. “Equi-Depth Histograms for Estimating Selectivity Factors for Multi-Dimensional Queries”. ACM SIGMOD 1988.
• [MPS99] S. Muthukrishnan, V. Poosala, and T. Suel. “On Rectangular Partitionings in Two Dimensions: Algorithms, Complexity, and Applications”. ICDT 1999.
• [MVW98] Y. Matias, J.S. Vitter, and M. Wang. “Wavelet-based Histograms for Selectivity Estimation”. ACM SIGMOD 1998.
• [MVW00] Y. Matias, J.S. Vitter, and M. Wang. “Dynamic Maintenance of Wavelet-based Histograms”. VLDB 2000.
• [NS90] J.F. Naughton and S. Seshadri. “On Estimating the Size of Projections”. ICDT 1990. – Presents adaptive-sampling-based techniques and estimators for approximating the result size of
a relational projection operation.
• [Olk93] F. Olken. “Random Sampling from Databases”. PhD thesis, U.C. Berkeley, 1993.
• [OR92] F. Olken and D. Rotem. “Maintenance of Materialized Views of Sampling Queries”. IEEE ICDE 1992.
• [PI97] V. Poosala and Y. Ioannidis. “Selectivity Estimation Without the Attribute Value Independence Assumption”. VLDB 1997.
45CS286, Spring’07 – Minos Garofalakis #
References (10)References (10)• [PIH96] V. Poosala, Y. Ioannidis, P. Haas, and E. Shekita. “Improved Histograms for
Selectivity Estimation of Range Predicates”. ACM SIGMOD 1996.
• [PSC84] G. Piatetsky-Shapiro and C. Connell. “Accurate Estimation of the Number of Tuples Satisfying a Condition”. ACM SIGMOD 1984.
• [Poo97] V. Poosala. “Histogram-Based Estimation Techniques in Database Systems”. PhD Thesis, Univ. of Wisconsin, 1997.
• [RTG98] Y. Rubner, C. Tomasi, and L. Guibas. “A Metric for Distributions with Applications to Image Databases”. IEEE Intl. Conf. On Computer Vision 1998.
• [SAC79] P. G. Selinger, M. M. Astrahan, D. D. Chamberlin, R. A. Lorie, and T. T. Price. “Access Path Selection in a Relational Database Management System”. ACM SIGMOD 1979.
• [SDS96] E.J. Stollnitz, T.D. DeRose, and D.H. Salesin. “Wavelets for Computer Graphics”. Morgan-Kauffman Publishers Inc., 1996.
• [SFB99] J. Shanmugasundaram, U. Fayyad, and P.S. Bradley. “Compressed Data Cubes for OLAP Aggregate Query Approximation on Continuous Dimensions”. KDD 1999.
– Discusses the use of mixture models composed of multi-variate Gaussians for building compact models of OLAP data cubes and approximating range-sum query answers.
• [V85] J. S. Vitter. “Random Sampling with a Reservoir”. ACM TOMS, 1985.
46CS286, Spring’07 – Minos Garofalakis #
References (11)References (11)• [VL93] S. V. Vrbsky and J. W. S. Liu. “Approximate—A Query Processor that Produces
Monotonically Improving Approximate Answers”. IEEE TKDE, 1993.– Uses class hierarchies on the data to iteratively fetch blocks relevant to the answer, producing tuples cer
tain to be in the answer while narrowing the possible classes containing the answer.
• [VW99] J.S. Vitter and M. Wang. “Approximate Computation of Multidimensional Aggregates of Sparse Data Using Wavelets”. ACM SIGMOD 1999.
• This is only a partial list of references on Approximate Query Processing. Further important references can be found, e.g., in the proceedings of SIGMOD, PODS, VLDB, ICDE, and other conferences or journals, and in the reference lists given in the above papers.
47CS286, Spring’07 – Minos Garofalakis #
Additional ResourcesAdditional Resources• Related TutorialsRelated Tutorials
– [FJ97] C. Faloutsos and H.V. Jagadish. “Data Reduction”. KDD 1998.
• http://www.research.att.com/~drknow/pubs.html
– [HH01] P.J. Haas and J.M. Hellerstein. “Online Query Processing”. SIGMOD 2001.
• http://control.cs.berkeley.edu/sigmod01/
– [KH01] D. Keim and M. Heczko. “Wavelets and their Applications in Databases”. IEEE ICDE 2001.
• http://atlas.eml.org/ICDE/index_html
• Research Project HomepagesResearch Project Homepages– The AQUA and NEMESIS projects (Bell Labs)
• http://www.bell-labs.com/project/{aqua, nemesis}/– The CONTROL project (UC Berkeley)
• http://control.cs.berkeley.edu/
– The Approximate Query Processing project (Microsoft Research)• http://www.research.microsoft.com/research/dmx/ApproximateQP/
– The Dr. Know project (AT&T Research)• http://www.research.att.com/~drknow/