a rainfall climatology of hil03 hawaii the quality of
TRANSCRIPT
Water Resources Research Center University of Hawaii
2610 Pope Road Hbnolulu, Hawaii 96822
March 23, 1973
ERRATA SHEET
Please note the following corrections to our Technical Report No. 61 entitled, A Rainfall Climatology of Hil03 Hawaii (by Charles M. Fullerton) and Technical Report No. 60 entitled, The Quality of Coastal Waters: First Annual FPogress Repopt (by L. Stephen Lau, Principal Investigator).
Technical Report No. 61
Page 1, Paragraph 3
Error: The Annual Summary of the "Hilo Local Climatological Data,11 published by the Environmental Data Service of the National Oceanic and Atmospheric Administration, contains a synopsis of the Hilo climate, as well as that of the published summary, together with additional data on the extremes of Hilo rainfall.
Correction: The Annual Summary of the "Hilo Local Climatological Data," published by the Environmental Data Service of the National Oceanic and Atmospheric Administration, contains a synopsis of the 11ilo climate, as well as that of the Island of Hawaii. The· following infOrmation is based largely on that pUblished summary, together with additional data on the extremes of Hilo rainfall.
Page 5, Lines 24 to 27
Error: amounts measures at the Hil0 airport. There appears to be no correlation between the frequency of frontal passages with the December~January monthly rainfall for Hilo during the 30-year period results in a curious inverse relationship (see Table 1).
Correction: amounts measures at the Hilo airport. There appears to be no correlation between the frequency of frontal passages and annual rainfall Comparing December-January frontal passages monthly rainfall for Hilo during the 30-year period results in a curious inverse relationship (see Table 1).
Page 16, Figure 6
Shaded portion refers only to rainfall received during 50% of the years of record. Arrow should point at the dot in the center of the shaded area.
Page 18, Figure 7
Shaded portion refers only to rainfall received during 50% of the years of record.

Page 21, Figure 9
Time intervals 3-4: upper block should be shaded to indicate rainfall intensity of 0.50 - 0.99 IN/HR. Time intervals 13-14: the upper block is correctly shaded; the next block down, now unshaded, should be shaded to indicate rainfall intensity of 0.25 - 0.49 IN/HR.
Page 23, Figure 11
Time interval 2-3; the upper block is correctly shaded; the next block down should be shaded to indicate rainfall intensity of 0.25 - 0.49 IN/HR. Time interval 12-13: the upper block is correctly shaded, the next block down should be shaded to indicate rainfall intensity of 0.25 - 0.49 IN/HR.
Page 34, 7th Reference
Error: U.S. Department of Commerce, National Oceanic and Atmospheric Administration, Environmental Data Service. 1970. Local climatological data, annual summary with comparative data, Hilo, Hawaii. 4 p. (In addition, weather parameters including hourly rainfall, as measured at the Hilo airport station.)
Correction: U.S. Department of Commerce, Na.tional Oceanic and Atmospheric Administration, Environmental Data Service. 1970. Local climatological data3 annual summary with conrparative data, Hilo, Hawaii. 4 p. (In addition, Local Climatological Data is published monthly, reporting a variety of weather parameters including hourly rainfall, as measured at the Hilo airport station.) - __ t_""'""=
Technical Report No. 60
Page 7, Line 1
Error: a) Undeveloped land areas, e.g., Waialua Bay, Oahu
Correction: a) Undeveloped land areas, e.g., Kahana Bay, Oahu

A RAINFALL CLIMATOLOGY OF HILO, HAWAII
by
Charles M. Fullerton
Technical Report No. 61
UHiVlET 72-03
December 1972
Partial Project Completion Report of
SPACE-TIME VARIATIONS IN HIGH INTENSITY RAINFALL ON THE WINDWARD COAST OF THE ISLAND OF HAWAII, PHASE I
OWRR PROJECT NO. B-024-HI, GRANT AGREEMENT NO. 14-31-0001-3575 Principal Investigator: Charles M. Fullerton
PROJECT PERIOD: July 1, 1971 to December 31, 1972
The programs and activities described herein were supported in part by funds provided by the United States Department of the Interior as authorized under the Water Resources Act of 1964, Public Law 88-379, and were performed with the cooperation of the Cloud Physics Observatory Department of Meteorology, University of Hawaii.

ABSTRACT
Annual~ monthly~ and houply rainfall data for Hilo~ Hawaii are plotted and analyzed as a preliminary phase of the study of spaae-time variations in high intensity rainfall in this loaality. A brief summary of the Hilo alimate is provided. Annual rainfall amounts are shown to be highly variable~ while the annual rainfall frequenay remains relatively aonstant at about 33 peraent. Monthly rainfall and maximum 24-houp rainfall amounts are displayed in the form of a monthly rainfall expectancy graph.
Houply rainfall amounts are divided into four intensity categories: O.Ol - 0.24~ 0.24 - 0.49~ 0.50 - 0.99 and ~ l.OO inches per clock hour. The percentage distribution of annual and monthly rainfall amounts and frequencies by rainfall intensity category are plotted and discussed. Hourly data are displayed in a series of monthly diurnal distributions by rainfall intensity category.
iii


CONTENTS
LIST OF FIGURES ............•..•.................•........•............... i v
LIST OF TABLES ....................................•...................... IV
I NTRODUCTI ON .............................................................. ,
CLIMATOLOGICAL SUMMARy ....•..........•.......•.•..•.....•..••....•...•.... 1
HILO ANNUAL RAINFALL ......•............•.•....•...........•..•....•..•.... 7
MONTHLY RAINFALL IN HILO ................................................. 14
HILO DIURNAL RAINFALL ..................•.....•.•...•......•.............. 17
OTHER SOURCES OF INFORMATION ...................•.............•........... 32
ACKNOWLEDGEMENTS ..•.......•..•...•............•................•....•.... 33
REFERENCES ............•...••..•......•........•.....••......•.........•.. 34
LIST OF FIGURES
1. Topographic r~ap of the Island of Hawaii .............................. 3
2. Annual Rainfall in Hil0 for 1931-1970 ..•..•......•................... 8
3. Percentage Variation in the Annual Rainfall in Hil0 in Four Intensity Categories (1953-1970) ..............•....•........... 10
4. Percentage Variation in Annual Rainfall Frequency in Hil0 in Four Intensity Categories and Trace Amounts .•.................•.. 13
5. Monthly Rainfall for Hil0 (1931-1970) ..•......•..•.................. 15
6. Quartile Distribution of Rainfall in Hil0 by Month (1931-"1970) ....•.....••......•.....................•.........•...... 16
7. Quartile Distribution of Maximum 24-hour Rainfall in Hi 10 by Month (1953-1970) ........................................... 18
8. Percentage Variation "In Monthly Rainfall Amounts in Hil0 by Four Intensity Categories (1953-1970) ....................... 19
9. Monthly Diurnal Rainfall Distr"ibution for Hil0 Showing Total Rainfall per Clock Hour by Intensity Category: January 1953-1971111 ..••.••••••••..•••.••.•.•..••.•........•••.••••... 20
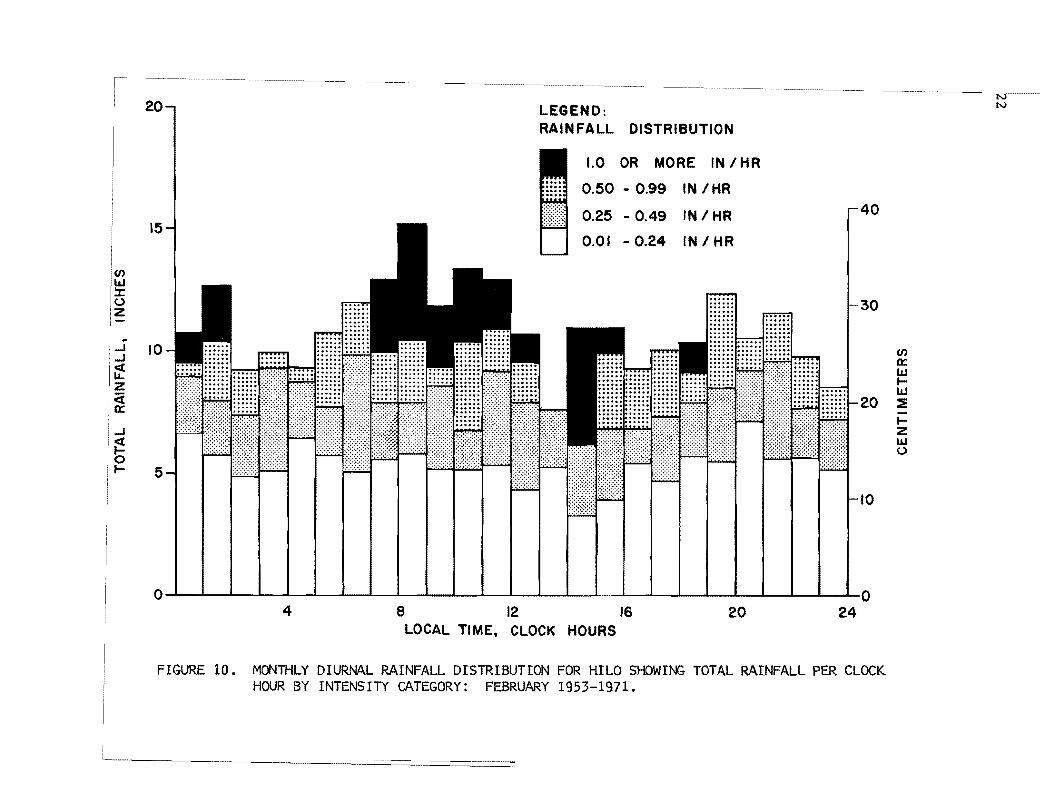
10. Monthly Diurnal Rainfall Distribution for Hil0 Showing Total Rainfall per Clock Hour by Intensity Category: February 1953-1971 ...•..............•.....•.....•...•..........•.•.. 21
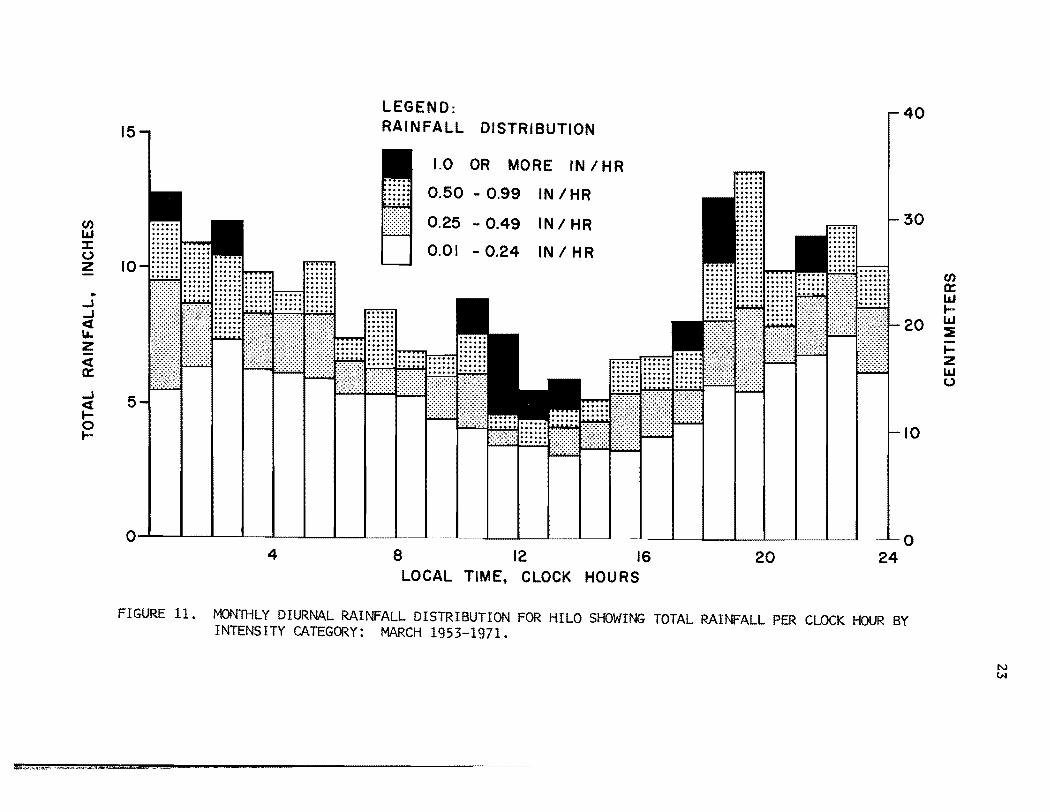
11. l\1onthly Diurnal Rainfall Distr"ibution for Hilo Showing Total Rainfall per Clock Hour by Intensity Category: \\1arch 1953-1971 ......•.••...•....................•...........••...•. 22
iv
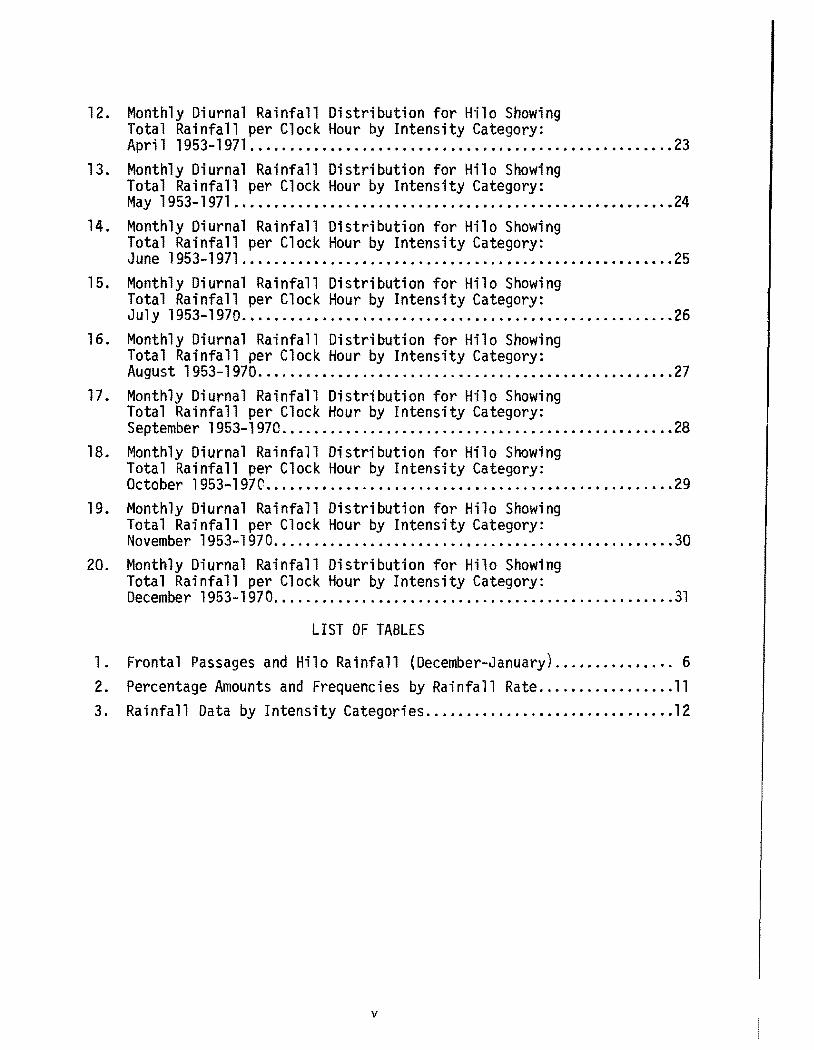
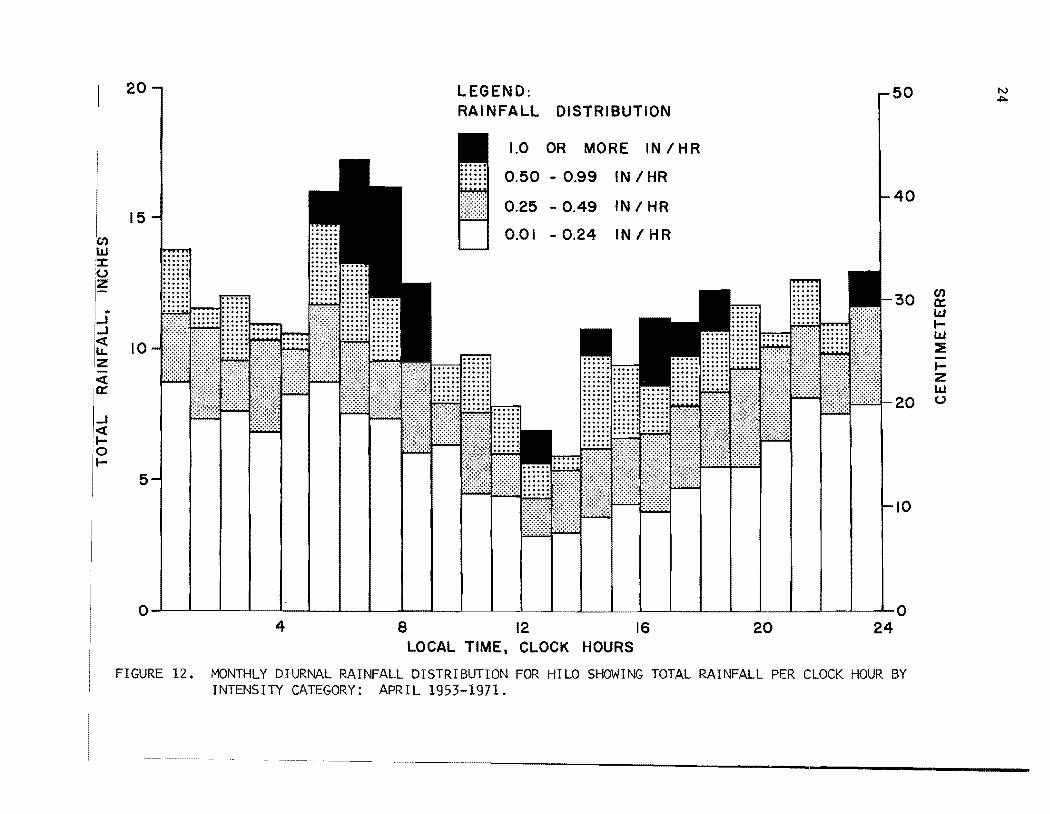
12. Monthly Diurnal Rainfall Distribution for H"ilo Showing Total Rainfall per Clock Hour by Intensity Category: April 1953-1971 .••.•...•••••••.•••..•.•••••••..•..•.•.•••.••.•...•.. 23
13. Monthly Diurnal Rainfall Distribution for Hi10 Showing Total Rainfall per Clock Hour by Intensity Category: May 1953-1971 ........................................................ 24
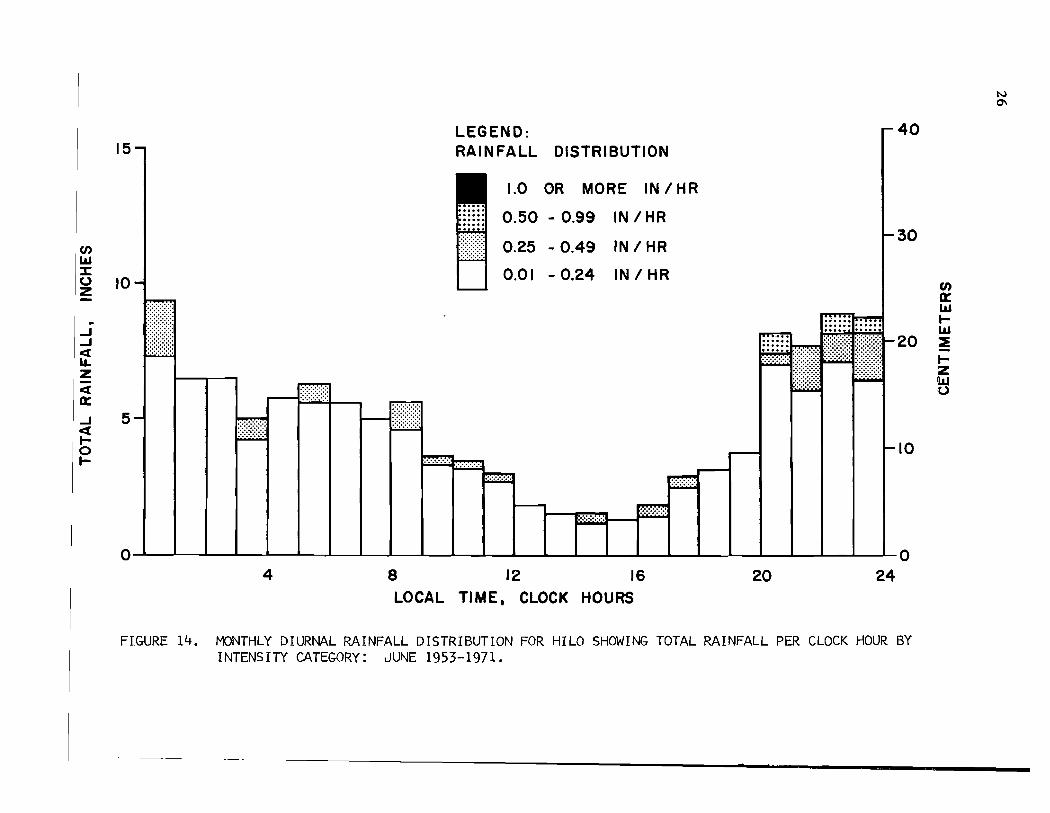
14. Monthly Diurnal Rainfall Distribution for Hilo Showing Total Rainfall per Clock Hour by Intensity Category: June 1953-1971 ........................................................ 25
15. Monthly Diurnal Rainfall Distribution for Hil0 Showing Total Rainfall per Clock Hour by Intensity Category: Jul y 1953-1970 .......................................................... 26
16. Monthly Diurnal Rainfall Distribution for Hilo Showing Total Rainfall per Clock Hour by Intensity Category: August 1953-1970 •.•.••.•..•.•..••.............•.............•.•••.•. 27
17. Monthly Di urnal Rainfall Di str-j buti on for Hilo Showi ng Total Rainfall per Clock Hour by Intensity Category: September 1953-1970 .•..•......•...............•.....•.•......••••..• 28
18. Monthly Diurnal Rainfall Distribution for Hil0 Showing Total Rainfall per Clock Hour by Intensity Category: October 1953-1970 .....•.•..•......•..••.•••..••....•••.•...•..•...•. 29
19. Monthly Diurnal Rainfall Distribution for Hilo Showing Total Rainfall per Clock Hour by Intensity Category: November 1953-1970 .•..••..•.......•.••..•.•...•.•......•..••........ 30
20. Monthly Diurnal Rainfall Distribution for Hilo Showing Total Rainfall per Clock Hour by Intensity Category: December 1953-197 O ................................ III •••••••••••••••••• 31
LIST OF TABLES
1. Frontal Passages and Hilo Rainfall (December-January) .•.•.••.•.••... 6 2. Percentage Amounts and Frequencies by Rainfall Rate ..•••..••.•.••.•• 11 3. Rainfall Data by Intensity Categories ............................... 12
v
INTRODUCTION
As a preliminary phase of the study of space and time variations in
high intensity rainfall on the windward coast of the island of Hawaii, it
seems advisable to examine the general characteristics of rainfall in
Hilo. In particular, it is of interest to know the diurnal variation in
rainfall; that is, the total quantity of rain recorded during each hour in
the various months of the year. From these monthly diurnal values, it is
possible to construct seasonal or annual diurnal curves to study yearly
rainfall trends or to compare conditions during limited experimental
periods with historical variations over longer intervals of time (see, for
example, Takahashi and Fullerton, 1972). Furthermore, it appears appro
priate to evaluate available rainfall records in the light of hourly varia
tions in rainfall. This analysis can be viewed as a first approximation to
the study of instantaneous rainfall rates in Hilo and its vicinity on the
island of Hawaii.
The basic data used in this report are hourly rainfall amounts, in
inches, measured at the National Weather Service first order station at
the Hilo airport from 1953 through 1971. The information is available
as a part of the one-page summary, "Local Climatological Data," published
monthly by the National Weather Service. Reported rainfall amounts are
those measured during the clock hour. There is no information in the cited
publication on instantaneous rainfall rates.
CLIMATOLOGICAL SUMMARY
The Annual Summary of the "Hilo Local Climatological Data," published by
the Environmental Data Service of the National Oceanic and Atmospheric Adminis
tration, contains a synopsis of the Hilo climate, as well as that of the pub
lished summary, together with additional data on the extremes of Hilo rainfall.
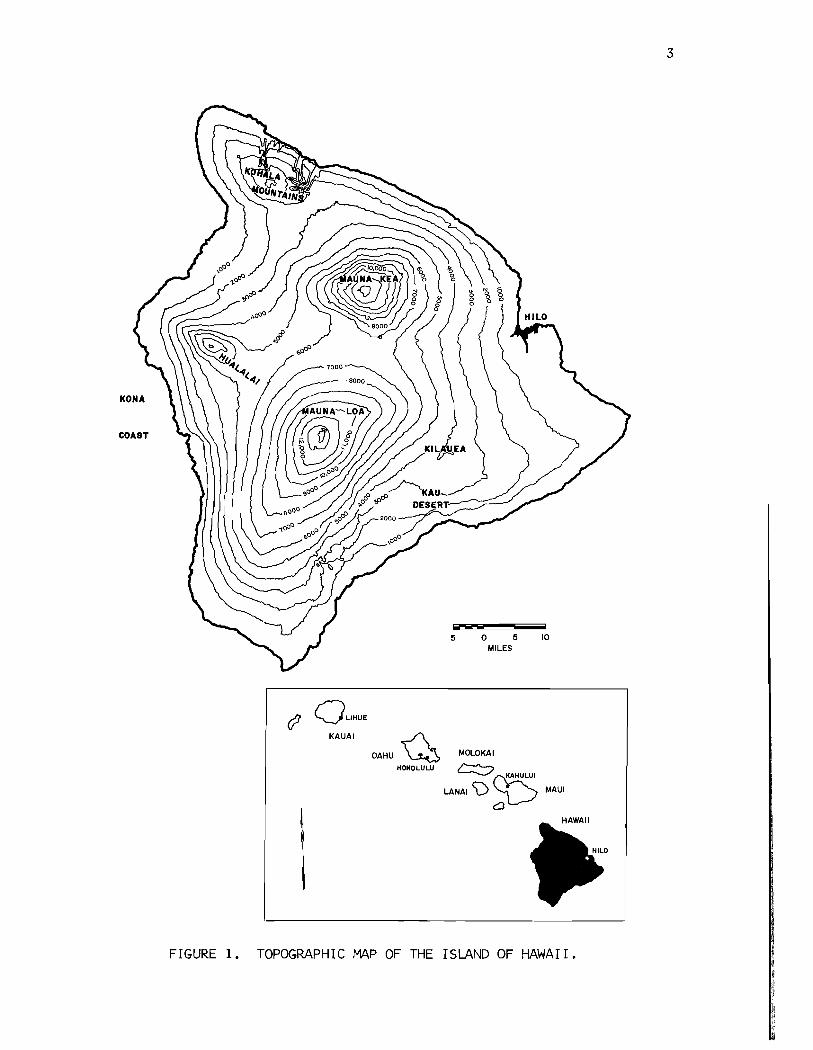
The state of Hawaii consists of eight major islands and 124 minor islands
with a total land area of 6,425 square miles and a coastline of 750 miles. The
island of Hawaii is by far the largest of the Hawaiian chain, with an area
of 4,038 square miles, more than twice the area of all the other islands
combined. It is diamond-shaped, about 93 miles long from north to south and
76 miles wide (Fig. 1).

2
Hawaii lies well within the belt of northeasterly trade winds generated
by the semi-permanent Pacific high pressure cell to the north and east.
The climate of the island is greatly influenced by its topography which is
dominated by the volcanic masses of Mauna Loa and Mauna Kea. The highest
point on the island, and in the north Pacific Ocean basin, is the 13,796-
foot summit of Mauna Kea closely followed by Mauna Loa which rises to
13,680 feet. Other major topographic features are Hualalai (8,271 feet),
the Kohala Mountains (5.480 feet) and Kilauea (4,090 feet). The island of
Hawaii is made up of these five volcanic mountains, their slopes, and the
broad saddles between them. Mauna Loa and Kilauea, which occupy the entire
southern half of the island, are still active volcanoes and, hence, smooth
sloped in contrast to the deeply eroded valleys found along the slopes of
Mauna Kea and the Kohala Mountains.
The principal features of the island's climate are the marked varia
tions in rainfall with location and elevation, the persistent northeasterly
trade winds in areas exposed to them, and the equable temperatures, both
daily and seasonally~ in localities near the coastline.
Over the island's windward slopes, precipitation occurs as a result
of one or a combination of climatic effects. Rainfall, in general, may
be related to (1) trade-wind showers, (2) frontal or cyclonic storms and
(3) intense convective storms referred to, for convenience, as thunder
storms. High intensity rainfall is generally associated with the latter
two cases. Most precipitation on the windward coast, in terms of frequency of occur-
rence, takes the form of showers within the ascending moist trade winds. Mean
annual rainfall increases from 100 inches or more along the coasts to over 300
inches at elevations of 2,000 to 3,000 feet, and then declines to about 15 inches
at the summits of Mauna Kea and Mauna Loa. Leeward areas, the southern and
western sections of the island. are, in general, topographically sheltered
from the trades, hence from trade-wind showers, and are therefore drier.
Even in lee areas, however, afternoon and evening cloudiness and showers re-
sult from the onshore and upslope movement of sea breezes caused by the day-
time heating of the land.
Where mountain slopes are steeper, mean annual rainfall may range
from 30 inches along the coast to 120 inches at elevations of 2,500 to
3,000 feet. The driest locality on the island, and in the state, is the
OLiHUE
KAUAI
OAHU ~ MOLOKAI
HONOLULU /'-"--.,
'-----/~ LANAI <V ~
Q
MAUl
FIGURE 1. TOPOGRAPHIC ML\P OF THE ISLAND OF HAWAII.
3
4
coastal strip just leeward of the southern portion of the Kohala Mountains
and the saddle between the Kohala Mountains and Mauna Kea, whi.ch has an
average annual rainfall of less than 10 inches.
These contrasts in rainfall are reflected in the soil and vegetation,
which are characterized by frequent and abrupt transitions from lush
tropical growth to near-desert conditions, such as occurs between the wet
windward slopes of Kilauea volcano and the Ka'u desert just to the south.
Hilo is a small city (population of about 28,000) located near the
midpoint of the windward (eastern) coast of the island. Within the city
the average rainfall varies from about 130 inches near the shore to as much
as 200 inches in the higher elevations. The wettest part of the island of
Hawaii, with a mean annual rainfall exceeding 300 inches, is at an eleva
tion of about 3,000 feet about 6 miles upslope from the city limits. It
rains on an average of about 280 days a year in the Hilo area.
Rainfall is measured in Hilo at several stations. Most of the data
used in the present report were obtained from records of the National
Weather Service's airport station for 1953 to the present. During this
period, the annual rainfall varied from a maximum of 173.23 inches (1969)
to a minimum of 71.40 inches (1962), the maximum monthly rainfall was 50.82
inches (December, 1954) and the minimum monthly rainfall was 0.36 inches
(January, 1953), and the maximum 24-hour rainfall was 15.70 inches (February,
1969).
Hawaii's equable temperatures are associated with its mid-ocean loca
tion and the small seasonal variation in incident solar radiation. At Hilo,
the range in average temperature from February and March, the coldest
months, to August, the warmest month, is only 5.2°F and the average daily
range is approximately 15°F. The highest temperature of record at the Hilo
airport is 94°F; the lowest 53°F. Greater variations occur in localities
with less rain and cloud cover, but temperatures in the mid-90's and low
50's are uncommon anywhere near the coastline of the island.
The trades prevail throughout the year, although, because of large
scale climatic reasons, they may be absent for days or even weeks at a time,
particularly in the winter. The trade winds which are predominantly north
easterly and their interaction with the topography have a profound influence
on the climate of the island. Places on the windward side of the island
exposed to the trades may be affected by local mountain circulations. For
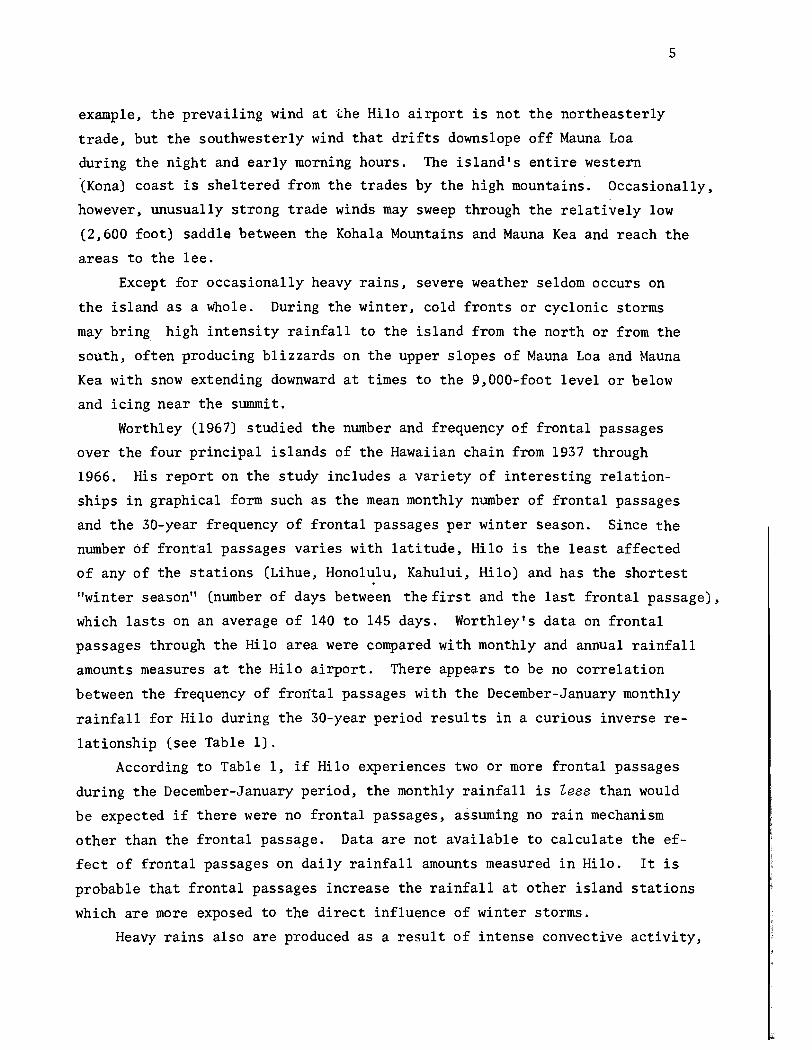
example, the prevailing wind at the Hilo airport is not the northeasterly
trade, but the southwesterly wind that drifts downslope off Mauna Loa
during the night and early morning hours. The island's entire western
5
'(Kona) coast is sheltered from the trades by the high mountains. Occasionally,
however, unusually strong trade winds may sweep through the relatively low
(2,600 foot) saddle between the Kohala Mountains and Mauna Kea and reach the
a.reas to the lee.
Except for occasionally heavy rains, severe weather seldom occurs on
the island as a whole. During the winter, cold fronts or cyclonic storms
may bring high intensity rainfall to the island from the north or from the
south, often producing blizzards on the upper slopes of Mauna Loa and Mauna
Kea with snow extending downward at times to the 9,DOD-foot level or below
and icing near the summit.
Worthley (1967) studied the number and frequency of frontal passages
over the four principal islands of the Hawaiian chain from 1937 through
1966. His report on the study includes a variety of interesting relation-
ships in graphical form such as the mean monthly number of frontal passages
and the 3D-year frequency of frontal passages per winter season. Since the
number 6f frontal passages varies with latitude, Hilo is the least affected
of any of the stations (Lihue, Honolulu, Kahului, Hilo) and has the shortest
"winter season" (number of days between the first and the last frontal passage),
which lasts on an average of 140 to 145 days. Worthley's data on frontal
passages through the Hilo area were compared with monthly and annual rainfall
amounts measures at the Hilo airport. There appears to be no correlation
between the frequency of frontal passages with the December-January monthly
rainfall for Hilo during the 30-year period results in a curious inverse re
lationship (see Table 1).
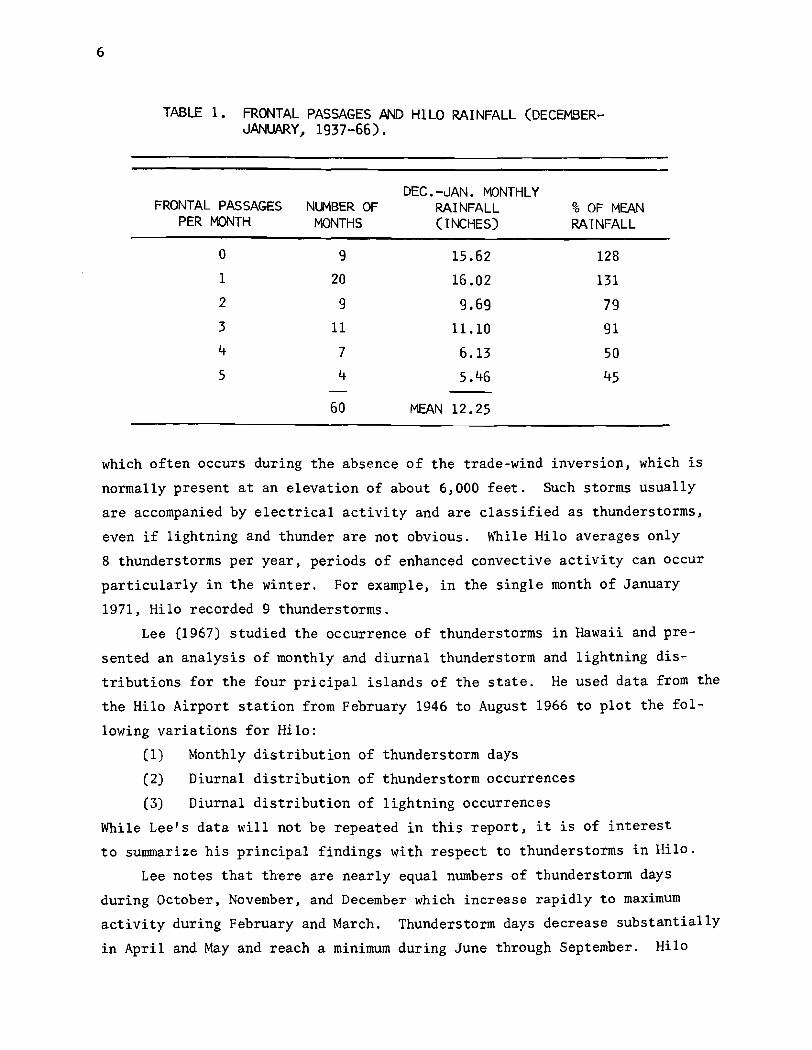
According to Table 1, if Hilo experiences two or more frontal passages
during the December-January period, the monthly rainfall is tess than would
be expected if there were no frontal passages, assuming no rain mechanism
other than the frontal passage. Data are not available to calculate the ef
fect of frontal passages on daily rainfall amounts measured in Hilo. It is
probable that frontal passages increase the rainfall at other island stations
which are more exposed to the direct influence of winter storms.
Heavy rains also are produced as a result of intense convective activity,
6
TABLE 1. FRONTAL PASSAGES AND HILO RAINFALL (DECEMBERJANUARY, 1937-66).
DEC.-JAN. MONTHLY FRONTAL PASSAGES NUMBER OF RAINFALL % OF MEAN
PER MONTH MONTHS (INCHES) RAINFALL
0 9 15.62 128
1 20 16.02 131 2 9 9.69 79 3 11 11.10 91 4 7 6.13 50 5 4 5.46 45
60 MEAN 12.25
which often occurs during the absence of the trade-wind inversion, which is
normally present at an elevation of about 6,000 feet. Such storms usually
are accompanied by electrical activity and are classified as thunderstorms,
even if lightning and thunder are not obvious. While Hilo averages only
8 thunderstorms per year, periods of enhanced convective activity can occur
particularly in the winter. For example, in the single month of January
1971, Hilo recorded 9 thunderstorms.
Lee (1967) studied the occurrence of thunderstorms in Hawaii and pre
sented an analysis of monthly and diurnal thunderstorm and lightning dis
tributions for the four pricipal islands of the state. He used data from the
the Hilo Airport station from February 1946 to August 1966 to plot the fol
lowing variations for Hilo:
(1) Monthly distribution of thunderstorm days
(2) Diurnal distribution of thunderstorm occurrences
(3) Diurnal distribution of lightning occurrences
While Lee's data will not be repeated in this report, it is of interest
to summarize his principal findings with respect to thunderstorms in Hilo.
Lee notes that there are nearly equal numbers of thunderstorm days
during October, November, and December which increase rapidly to maximum
activity during February and March. Thunderstorm days decrease substantially
in April and May and reach a minimum during June through September. Hilo
thunderstorms are clearly a "winter-time" phenomenon, as indicated by the
fact that thunderstorm days during October through March are nearly four
times as numerous as during April through September.
7
The diurnal distribution of Hilo thunderstorms is distinctly bimodal,
with the primary maximum near 1500 local time, and a secondary maximum at
0300. Minimum activity occurs between 0700 and 1100 with little variation
between 1800 and 0200.
ANNUAL RAINFALL IN HILO
As previously noted, the annual rainfall in Hilo is highly variable.
Figure 2 shows the annual rainfall over the 40-year period from 1931 to
1970. The values plotted on the graph are from the Annual Summary of the
"Local Climatological Data" for Hilo, Hawaii, 1970.
Rainfall measurements during this period were made at two different
locations. From 1931 through April 1942 and from January 1945 through
February 1946, rainfall data shown in Figure 2 were recorded at the
Federal Building in downtown Hilo at an elevation of 40 feet above sea
level. All other values were measured at the Hilo airport, approximately
2 miles east of the Federal Building site. While minor changes in the
location of the rain gauge occurred during the 1940's and early 1950's,
the instrument has been in a relatively fixed position since February
1954. The Hilo Airport station is located at 19°43'N, l55°04'W, at an
elevation of 27 feet above sea level.
The mean annual rainfall during the period 1931-1970 was 136.18 inches
(the currently used climatolo"gical mean annual rainfall is 136.62 inches).
Except for the three-year period of 1936 to 1938, when the annual rainfall
measurements exceeded 180 inches each year, records obtained from the
Hilo Federal Building appear comparable to more recent ones from the
airport station.
During 1953 to 1971, the average annual rainfall was 133.86 inches.
Values ranged from a high of 173.23 inches (129 percent of the average) to
a low of 71.40 inches (53 percent of the average). Twelve of the 19 years
of record fell within 20 percent of the average rainfall amount.
The insert in Figure 2 indicates the annual rainfall frequency at the
Hilo airport over the interval of 1953 to 1970. The frequency is defined

fI) LIJ
is ~
.. ..J ..J
~ z <t a: ..J <t :::;) Z Z <t
200
160
80
HI LO FEDERAL BLDG. If .--,.. AIRPORT •
I I AIRPORT
tZ LIJ () a:: LIJ a..
· · · · . . ANNUAL RAiNFALL FREQUENCY
500
400
(f)
ffi tLIJ
300::E t= z LIJ ()
200
o iii i 0 1930 1940 1950
YEARS 1960 1970
FIGURE 2. ANNUAL RAINFALL IN HILO FOR 1931 TO 1970. INSERT SHOWS RAINFALL FREQUENCY (RATIO OF RAIN PLUS TRACE HOURS TO TOTAL HOURS) FOR EACH YEAR FROM 1953 TO 1970.
00

9
by the ratio of the number or rain hours to the total number of hours
in the year. A rain hour is any clock hour in which rain was recorded at
the airport station and includes both measurable and trace rainfall amounts.
As the graph indicates, rain fell at the Hilo airport during approxi
mately one-third of all the hours in the 18-year period. On the average,
96 percent of all rain hours indicate light rains of lees than 0.25 inches
recorded in a clock hour. These light rains contributed approximately
62 percent of the total rainfall during the period. On the other hand
heavy rainfall, defined as more than one inch in a clock hour, accounted
for slightly more than 5 percent of the total precipitation, yet occurred
in less than 0.2 percent of the hours in the year.
The relative constancy of the annual rainfall frequency indicates the
necessity of investigating rainfall rate as the dominant factor contributing
to the total amount of rainfall in Hilo. If rainfall occurs at the Hilo
airport during approximately one-third of all the hours, year after year,
then the high variability in the annual rainfall can only be due to variations
in rainfall intensity. Furthermore, the relative constancy of the annual
frequency indicates that most rainfall in the Hilo area probably is produced
by a simple and regular physical process, possibly ralated to the local
wind circulation.
In his investigation of the association of synoptic and local wind
circulations with diurnal rainfall over Malaya, Ramage (1964) found that
the rainfall variation was substantially controlled by local wind changes
within the prevailing flow. It appears that similar relationships may
exist on the windward coast of the island of Hawaii.
To more fully investigate the variation in the annual rainfall in Hilo
with rainfall rate, the hourly precipitat~on data have been divided into
four intensity categories: 0.01 to 0.24 inches per clock hour, 0.25 to
0.49 inches per clock hour, 0.50 to 0.99 inches per clock hour, and rainfall
of 1.00 or more inches per clock hour and tabulated (Table 2).
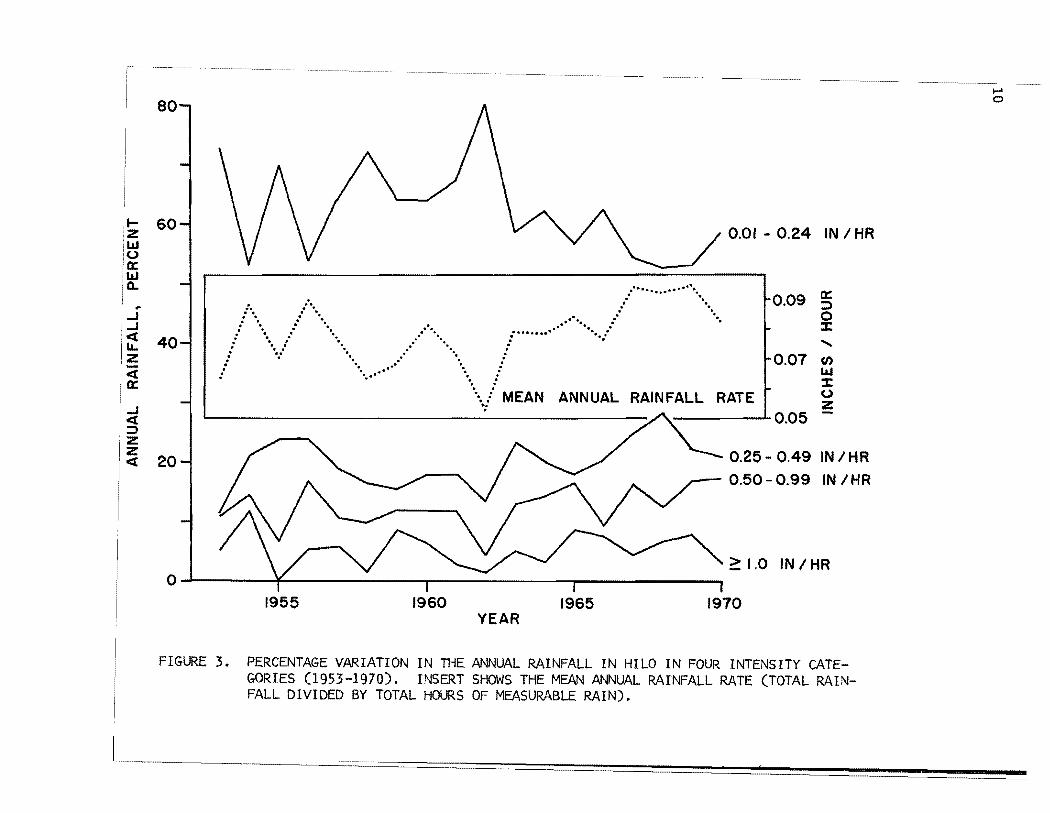
Figure 3 shows the percentage of the total annual rainfall in each of
the four intensity categories for each year in the period 1953-1970 (note
that 1971 is not plotted). Table 3 shows the average contribution of each
intensity category to the annual rainfall and the range of values about
the average. It is interesting to observe that heavy rains of one or more
inches per clock hour, while occuring on an average of only five hours per
L&J o 0::: L&J a..
.. ..J ..J
80
60
........ Of .. " ........... .
:. ..... ..- ... . :" If". .: •••• .. •••• :.. • ••
0.01 - 0.24 IN I HR
0.09 § o :t:
: 40 ...... .: •.. ..- a.. ........ .*.......... ...... . ...... _
." •••• *, .* *. .. .. .. •• : A, ._.. : z -<[ 0:::
i -: a.. ..a -". .: : a". .. •••• _ ••
.. .. .. .." .. ~ : .... .:" MEAN ANNUAL RAINFALL RATE
0.07 (/) L&J :t: o Z ':
----...... ' 0.05 ..J <[ :::J Z Z <[ 20 0.25 - 0.49 IN I HR
0.50-0.99 IN/HR
::: 1.0 IN I HR o , ¥
1955 1960 1965 1970 YEAR
FIGURE 3. PERCENTAGE VARIATION IN THE ANNUAL RAINFALL IN HILO IN FOUR INTENSITY CATEGORIES (1953-1970). INSERT SHOWS THE MEAN ANNUAL RAINFALL RATE (TOTAL RAINFALL DIVIDED BY TOTAL HOURS OF MEASURABLE RAIN).
..... o
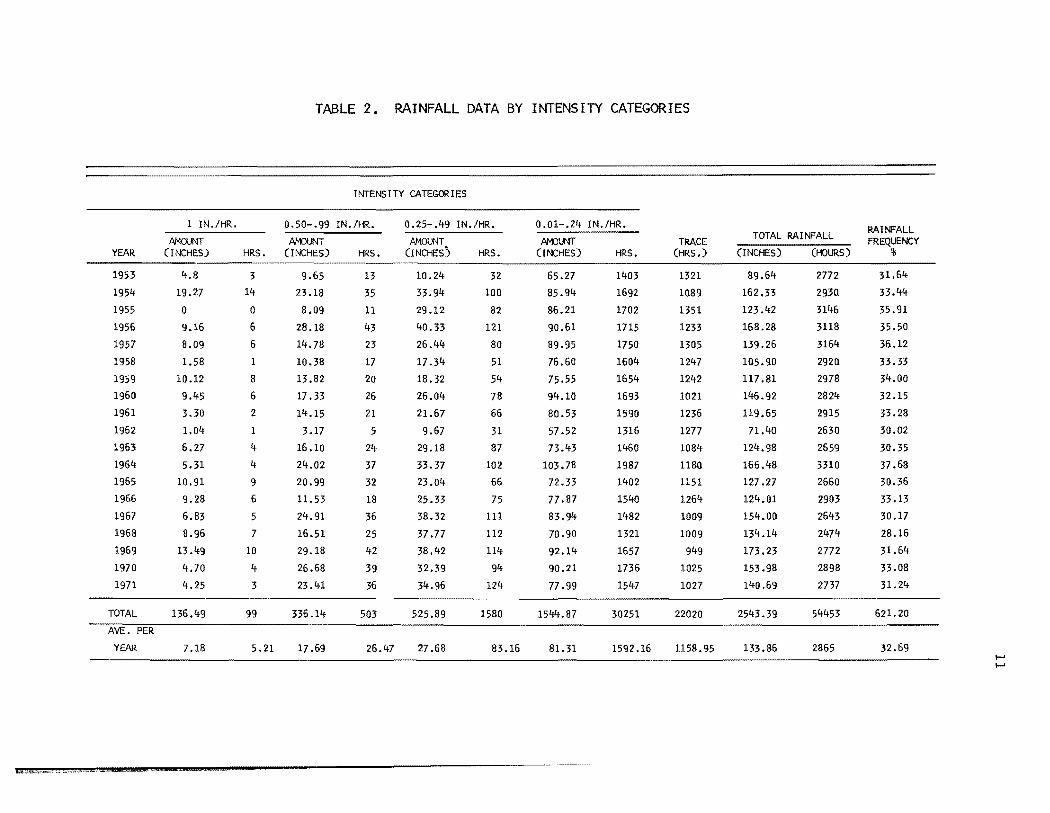
TABLE 2. RAINFALL DATA BY INTENSITY CATEGORIES
INTENSITY CATEGORIES
1 IN./HR. 0..50.-.99 IN./HR. 0.25-.49 IN./HR. 0.0.1-.24 IN./HR. RAINFALL AMOJNT AMOUNT AMOUNT AMOUNT TRACE TOTAL RA I NFALL FREQUENCY
YEAR (INCHES) HRS. (INCHES) HRS. (INCHES) HRS. (INCHES) HRS. (HRS.) (INCHES) (HOURS) %
1953 4.8 3 9.65 13 10..24 32 65.27 1403 1321 89.64 2772 31.64
1954 19.27 14 23.18 35 33.94 10.0. 85.94 1692 10.89 162.33 2930. 33.44
1955 0. 0. 8.0.9 11 29.12 82 86.21 170.2 1351 123.42 3146 35.91
1956 9.16 6 28.18 43 40..33 121 90..61 1715 1233 168.28 3118 35.50.
1957 8.0.9 6 14.78 23 26.44 80. 89.95 1750. 1305 139.26 3164 36.12
1958 1.58 1 10..38 17 17.34 51 76.60. 160.4 1247 105.90. 2920. 33.33
1959 10.12 8 13.82 20. 18.32 54 75.55 1654 1242 117.81 2978 34.0.0.
1960. 9.45 6 17 .33 26 26.0.4 78 94.10. 1693 10.21 146.92 2824 32.15
1961 3.30. 2 14.15 21 21.67 66 80..53 1590. 1236 119.65 2915 33.28
1962 1.0.4 1 3.17 5 9.67 31 57.52 1316 1277 71.40. 2630. 30.0.2
1963 6.27 4 16.10. 24 29.18 87 73.43 1460. 10.84 124.98 2659 30..35
1964 5.31 4 24.0.2 37 33.37 102 103.78 1987 118a 166.48 3310. 37.68
1965 10..91 9 20..99 32 23.0.4 66 72.33 140.2 1151 127.27 2660. 30..36
1966 9.28 6 11.53 18 25.33 75 n.87 1540. 1264 124.0.1 290.3 33.13
1967 6.83 5 24.91 36 38.32 111 83.94 1482 10.0.9 154.0.0. 2643 30..17
1968 8.96 7 16.51 25 37.n 112 70..90. 1321 10.0.9 134.14 2474 28.16
1969 13.49 10. 29.18 42 38.42 114 92.14 1657 949 173.23 2772 31.64
1970. 4.70. 4 26.68 39 32.39 94 90..21 1736 10.25 153.98 2898 33.0.8
1971 4.25 3 23.41 36 34.96 124 77 .99 1547 10.27 140..69 2737 31.24
TOTAL 136.49 99 336.14 50.3 525.89 1580. 1544.87 30.251 220.20. 2543.39 54453 621.20.
YEAR 7.18 5.21 17.69 26.47 27.68 83.16 81.31 1592.16 1158.95 133.86 2865 32.69 f-' f-'
til! ""411l<V,,,t.:::mH' •• ~ .".,,,·m",,,"~_z:;· """"'"'

12
TABLE 3. PERCENTAGE AMOUNTS Al\lD FREQUENCIES BY RAINFALL RATE.
RAINFALL RATE AMOUNT (PERCENT) FREQUENCY (PERCENT) (INCHES/CLOCK HR.) AVERAGE RANGE AVERAGE RAN:;E
TRACE AMOUNTS 41 34 - 48 0.01 - 0.24 62.3 53 - 80 55 50 - 60
0.24 - 0.49 19.9 12 - 28 2.8 1.2 - 4.5 0.50 - 0,99 12.5 4.5 - 16.8 1.0 0.2 - 1.5
> 1.00 5.3 0 - 12 0.2 0 - 0.4
100.0 100.0
year, contribute about 5 percent of the annual rainfall.
The insert diagram in Figure 3 shows the mean rainfall rate; that is,
the annual rainfall divided by the total hours of measurable rain. Since
light rains constitute the major contribution to the total rainfall in
Hilo, it is not surprising that the rainfall rate curve is approximately a
mirror image of the 0.01 to O.~4 inches per hour intensity curve. The
average rainfall rate is 0.078 inches per hour and the rate varies, as
would be expected, from 0.053 inches per hour in the year of minimum
rainfall (1962) to 0.095 inches per hour in the year of maximum rainfall
(1969). While rainfall rate is probably a meaningless expression when applied
to periods of one year, the variations in the rate indicate the relative
importance of the different rainfall categories. For example, during 1962
and 1967, while the rainfall frequency was approximately the same (30 per
cent), the recorded rainfall in 1967 (154.00 inches) was more than twice
that of 1962 (71.40 inches). In 1962, approximately 80 percent of the
total rainfall was from light rains, while the corresponding value in 1967
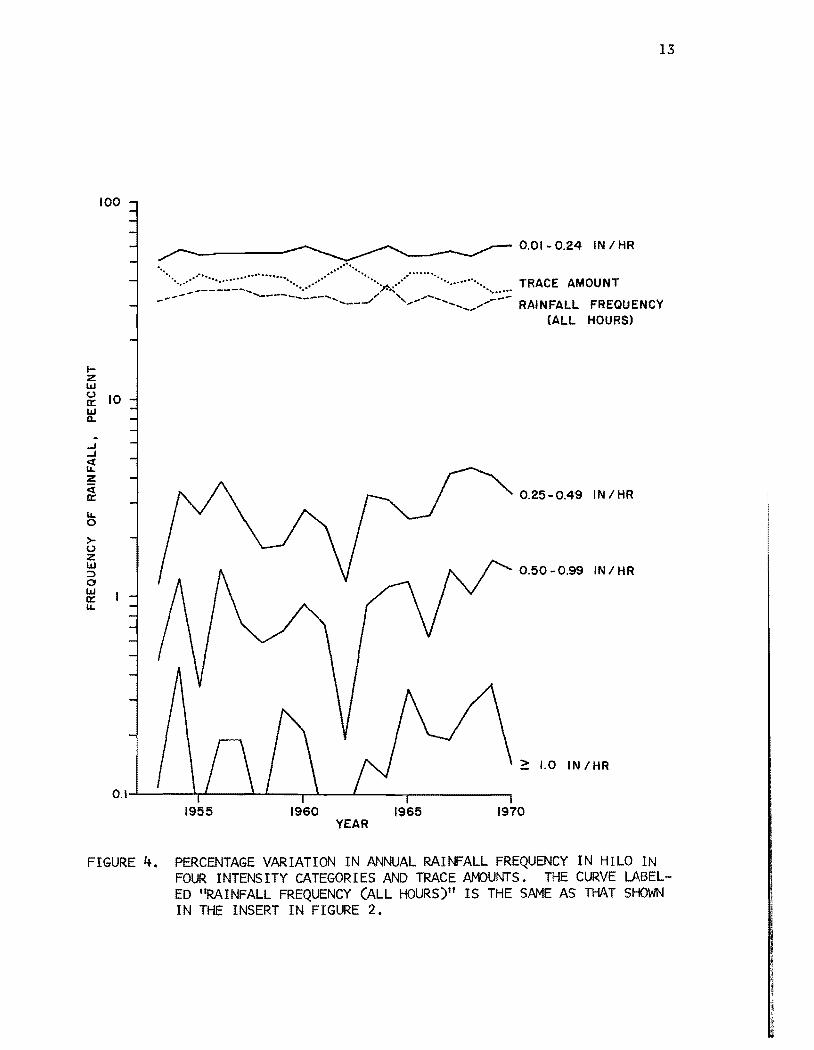
was 54 percent. Annual frequency relationships for the various rainfall intensity
categories are shown in Figure 4. The number of hours of trace rainfall
and measurable rainfall in each of the intensity categories is expressed
as a percentage of the total rain hours in each year and plotted on a
logarithmic scale. Averages and ranges of values are given in Table 3.
The curve labeled "rainfall frequency (all hours)" shown in Figure 4
is for comparison with the other curves, although it is derived
13
100
0.01- 0.24 IN I HR
••••••••••••• ~:: • .:.:.:.::~: ....................................... )1'0(. •••••••••••••••••••••••••••••••••••• TRACE AMOUNT
----- ---------............ ---/ " ................................................ --- RAINFAll FREQUENCY
(All HOURS)
... Z I.IJ U 10 a: I.IJ a..
-..J ..J
~ z <i a: 0.25-0.49 IN I HR
u. 0
)-u Z I.IJ ::> 0.50 -0.99 IN I HR 0 I.IJ a: u.
2: 1.0 IN/HR
1955 1960 1965 1970 YEAR
FIGURE 4. PERCENTAGE VARIATION IN ANNUAL RAINFALL FREQUENCY IN HILO IN FOUR INTENSITY CATEGORIES AND TRACE AMOUNTS. THE CURVE LABELED "RAINFALL FREQUENCY (ALL HOURS)" IS THE SAME AS THAT SHOWN IN THE INSERT IN FIGURE 2.

14
in a different way. It is the same curve shown in the insert box in
Figure 2, and it thus indicates the percentage of rain hours in the year.
MONTHLY RAINFALL IN HILO
Firgure 5 is a plot of the Hilo monthly rainfall during the 40-year
period 1931 through 1970. As previously mentioned, data were taken at the
Hilo Federal Building from 1931 through April 1942 and from January 1945
through February 1946. All other rainfall data were measured at Hilo air
port. Monthly amounts in excess of 40 inches were recorded during five
months: March 1939; March 1942; December 1946; December 1954; and February
1969. There were also four months in the 40-year period when the monthly
rainfall was less than one inch: January 1940; February 1941; January 1953;
and December 1963. It is interesting to note that all of the monthly ex
tremes occurred during the winter season in Hilo.
The 40 years of record for each calendar month were divided into three
groups: the 10 years with the highest monthly rainfall (upper quartile),
the 10 years with the lowest monthly rainfall (lower quartile), and the
intermediate 20 years of record. This information is plotted in Figure 6,
which may be considered a monthly rainfall expectancy graph for Hilo.
The maximum monthly rainfall, 50.82 inches, occurred in December 1954
and the minimum, 0.36 inches, occured in January 1953. The months of
highest rainfall, both in the maximum recorded amount and in the upper
limit of the 50 percent section, are February, March, and December. If
the February monthly rainfall is normalized to 31 days (for better compari
son with the March and December data), it exceeds the amount measured in
March. The two months which have the highest normalized rainfall are
December and February. The decrease in monthly rainfall in January, occur
ring in mid-winter and directly between the two months of highest rainfall,
is probably a result of the reduced rainfall frequency in January (see
Figure 8, p. 19).
The months of lowest mean rainfall amount in Hilo are June, July, and,
September. Since Figure 6 was drawn, three new monthly lows have been es
tablished and have been added to the figure.
Figure 7, showing the maximum 24-hour rainfall in each month, is plotted

LEGEND:
C VALUES > 40" 40-1 4 VALUES < I"
20
f3 oJ liiii","""';""""";""""'" ',j,,', j"""""""""';"""":;""""""""""'"Iliii~""'it"'~ii"i"'ii"'i""'t'i'[""i"'[i'i'1""""""-"""'1"";"""1"""""'1""""i"I"""""'I"'I"""" ::I: 1935 1940 1945 1950 U ~
40
20
o I';'; iiii 'ii,""""""'." Ii ii;I 'I'i" "iiii' ii"" "; "I' Ii Ii Ii "il'i" "t:';II" " "iil" II ": Ii "1,1 •• Ii' Ii iii. t """; 'I II' Ii" "i~ iiii. ".4." Ii"" Ii iii Ii' 'i' 'i,i Ii' 'i; "1"""""" Ii;: Ii' li'I',II:' II: iii., I';" 1955 1960 1965 1970
FIGURE 5. MONTHLY RAINFALL FOR HILa (1931 TO 1970). ~
U1

16
C/) I.LJ % 0 Z
. -J -J
~ Z <t p:
~ % t-Z 0 ::i
60
40
20
RANGE OF MONTHL( RAINFALL DURING 50"0 OF YEARS OF RECORD l
EAN MONTHLY VALUES USED BY NATIONAL WEATHER SERVICE
1971 • 1971
150
00
50
O~~--~~~~=T--r-~~~~~--~~--~--O J F MJ J AS 0 NO
MONTHS
FIGURE 6. QUARTILE DISTRIBUTION OF RAINFALL IN HILO BY MONTH (1931-1970) •
C/) 0::: I.LJ t-I.LJ ~
t-Z I.LJ 0
17
in the same fashion as Figure 6, except that the period of record considered
is 1953-1970. The months of highest 24-hour rainfall are February and
November, while the lowest 24-hour maximum rainfalls were recorded in
January and December. Excluding the high rainfall months of February and
November and the lower summer months of June, July, and September, all
maximum 24-hour rainfall amounts fall in the range of 9.5± O.S inches.
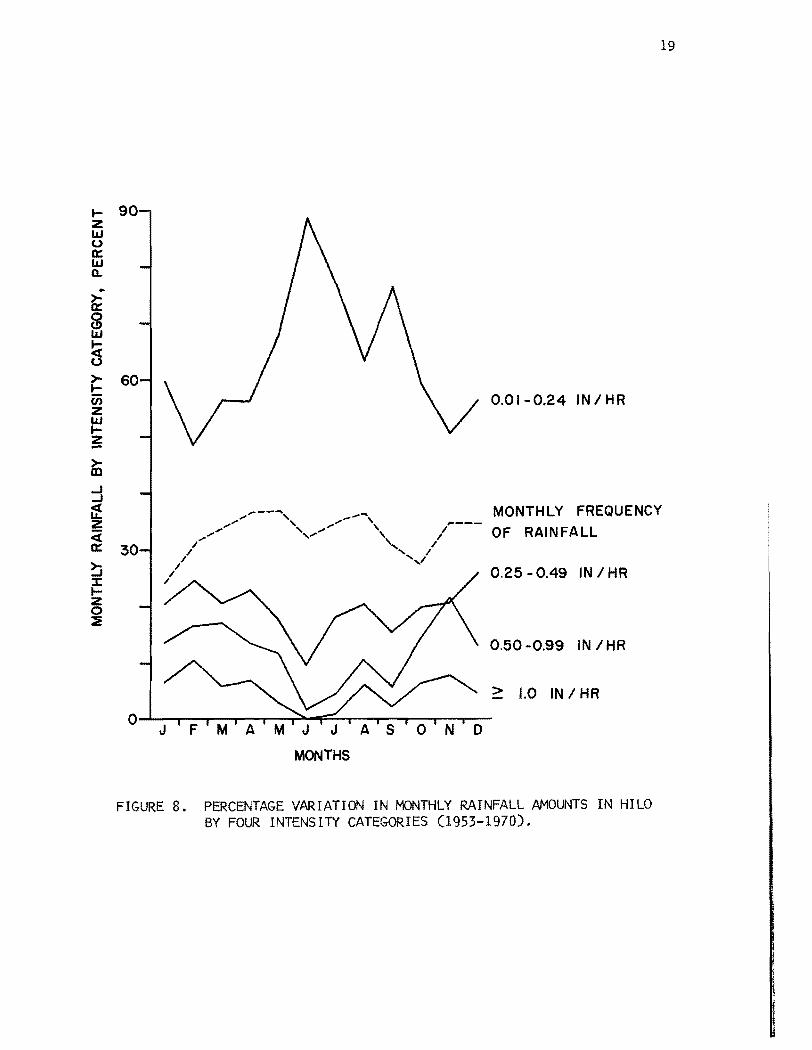
The concentration of heavy rainfall in the winter months is shown
clearly in Figure 8, where the total rainfall in the IS-year period,
1953 to 1970, is plotted by month and by intensity category. More than
75 percent of the total rainfall in June, July, and September is associated
with light rains, i.e.~those less than 0.25 inches per clock hour. On the
other hand, about 50 percent of the monthly rainfall in February and
November is associated with rainfall of more than 0.25 inches per hour.
Figure S also indicates the monthly frequency of rainfall in the Hilo
area. Whi 1 e 1 es s than 25 percent of t.he January hours are rain hours,
rain falls in more than 35 percent of the hours in April, May, and August.
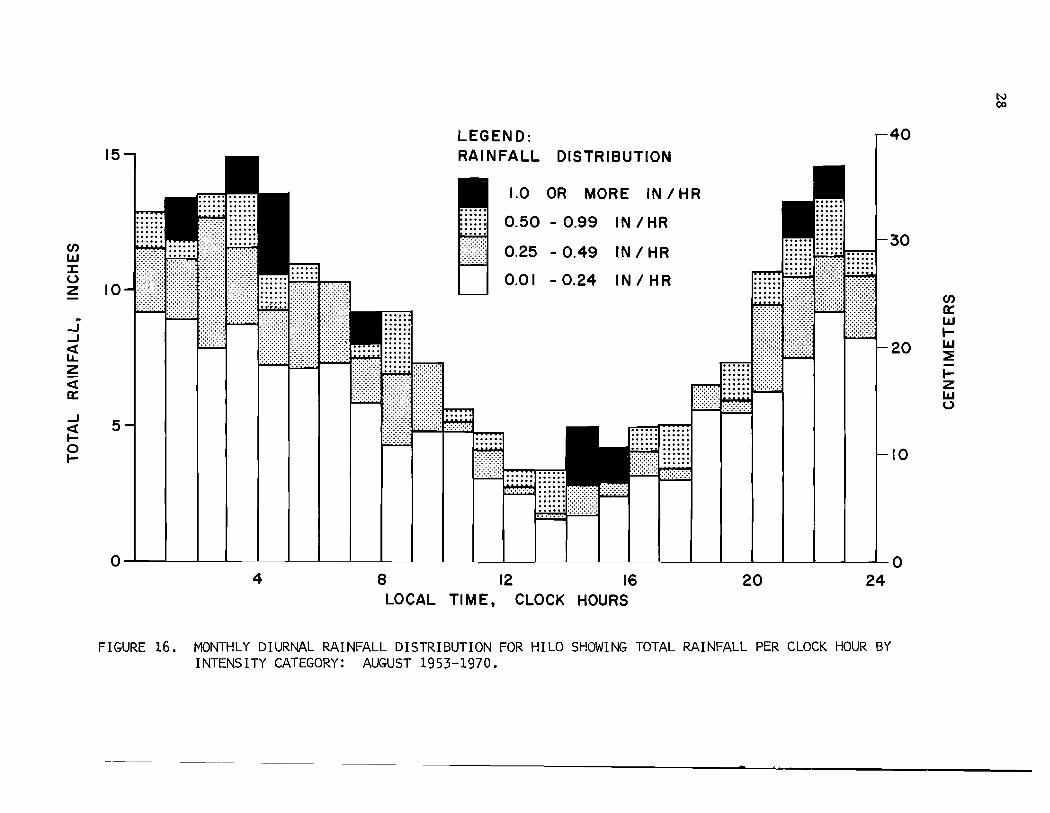
DIURNAL RAINFALL IN HILO
More than 160,000 hours of rainfall data recorded by the National
Weather Service at the Hilo airport have been used to construct diurnal
rainfall graphs. Hourly rainfall amounts have been divided into the four
intensity categories previously described and plotted by month. The
January through June graphs (Figures 9 through 14) show total rainfall for
each hour of the day over the 19-year period from 1953 through 1971. The
graphs for July through December (Figs. 15 through 20) are for the IS-year
period from 1953 to 1970.
On an annual basis, heavy rains may occur during any hour of the day,
particularly in the winter months. During the entire period of record
studied, there were no heavy rains recorded in June and only one such event
in July. Furthermore, in the daytime hours between OS 00 and 1400, there
was only one hour of heavy rainfall recorded during the six-month period
from May through October. Heavy rains occur most frequently in the hourly
periods ending at 0800, 1500, lSOO, and 2200 local time.
The data demonstrate convincingly that the annuaZ diurnal rainfall
curve for Hilo exhibits a minimum in the afternoon, between 1400 and 1500
hours. This effect, however, is masked during the winter months by the

18
en LaJ :::t: 0 z
.. ::t ~ Z « a: a: ::l 0 :::t: I
V
'" :E :l :E x « ~
15
10
5
JANGE OF MAXIMUM 24-HOUR RAINFALL RECEIVED DURING 50"0 OF THE YEARS OF RECORD. J
• 1911
J A SON 0
MONTHS
40
30
en 0: LaJ t-LaJ
20 :E t-z LaJ 0
10
FIGURE 7. QUARTILE DISTRIBUTION OF MAXIMUM 24-HOUR RAINFALL IN HILO BY MONTH (1953-1970).
t-Z W 0 0:: W Q. .. ~ g w ~ 0
>-t: (f) z W t-Z -~ ...J ...J
~ z <t 0::
b J: t-Z 0 ::IE
30
J
MONTHS
o N 0
19
0.01-0.24 IN/HR
MONTHLY FREQUENCY
OF RAINFALL
0.25 - 0.49 IN I HR
0.50-0.99 IN IHR
~ 1.0 IN I HR
FIGURE 8. PERCENTAGE VARIATION IN MONTHLY RAINFALL AMOUNTS IN HILO BY FOUR INTENSITY CATEGORIES (1953-1970).

20
relatively heavy rainfall associated with synoptic disturbances and con
vective activity. It is difficult to see any particular diurnal pattern
in the January and February rainfall (Figs. 9 and 10). The tendency toward
decreasing afternoon precipitation, particularly of the light rains, begins
to appear in the diurnal graph for March (Fig. 11). The months of May
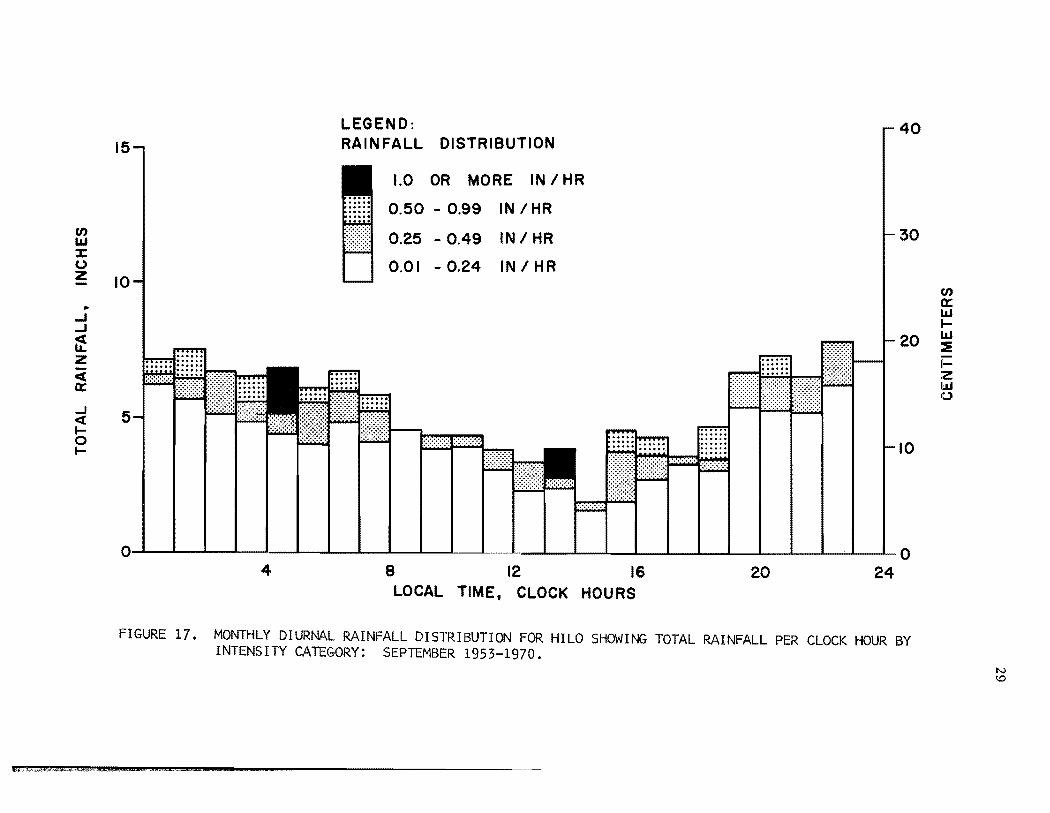
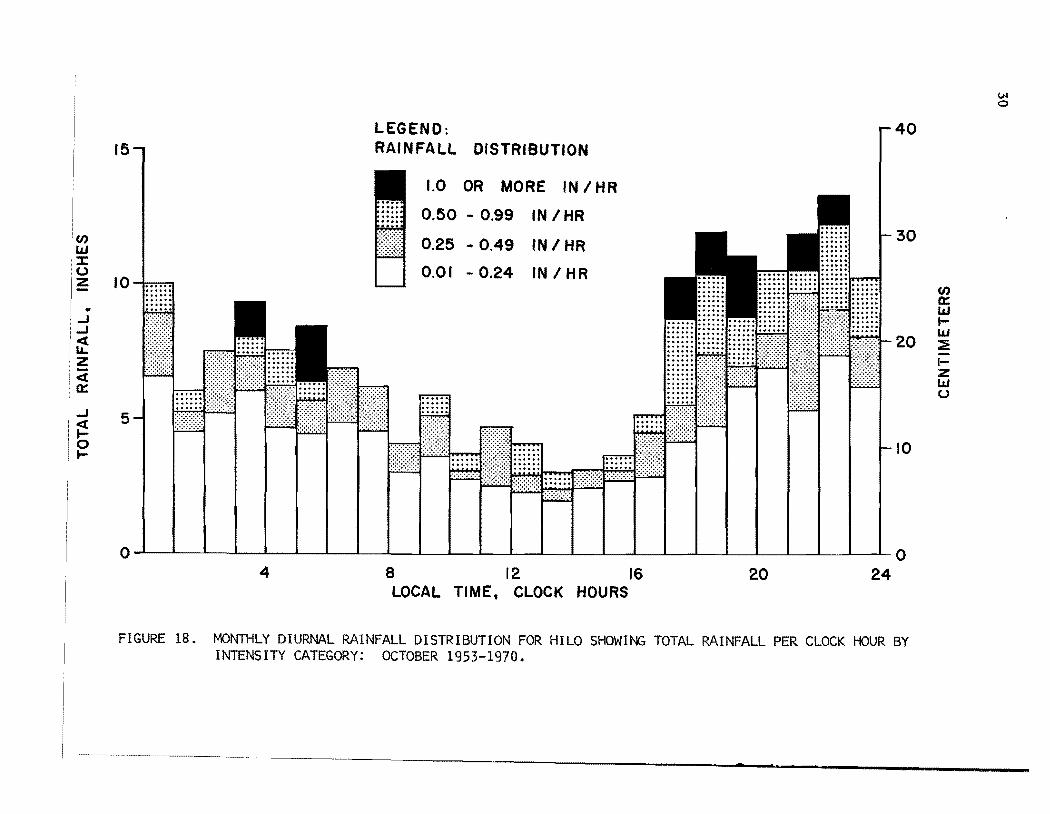
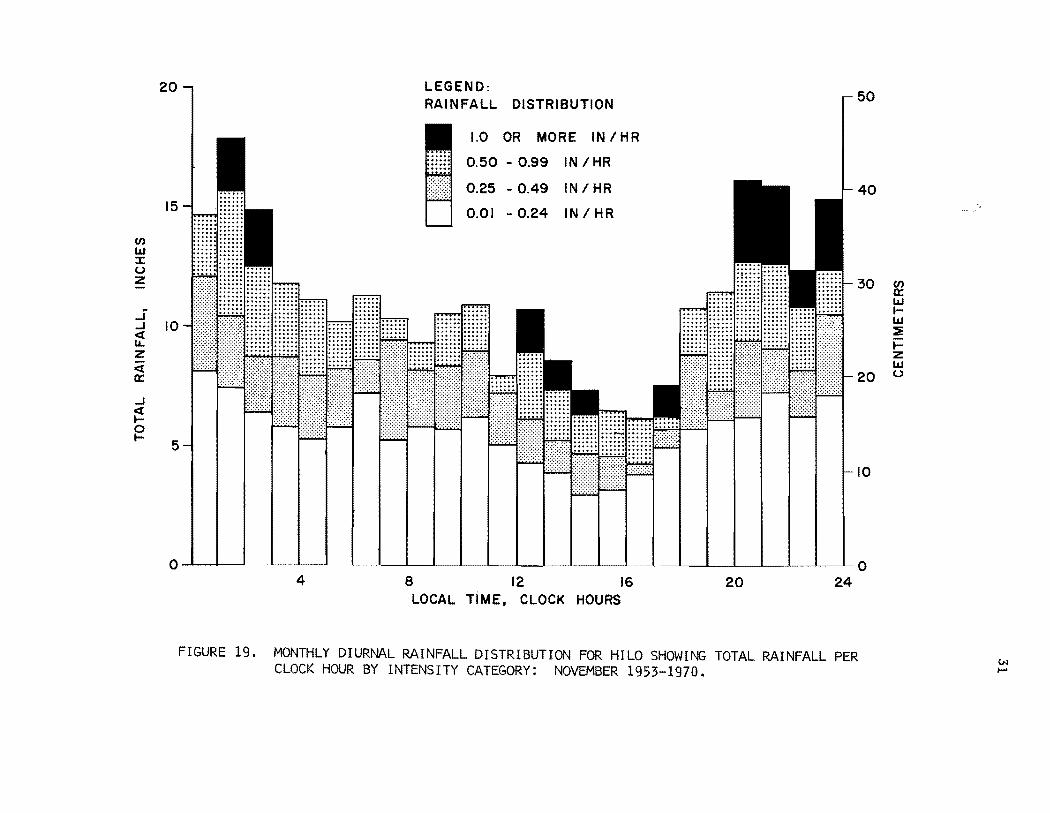
through October (Figs. 13 through 18) illustrate clearly the normal summer
time diurnal variation in Hilo rainfall. This pattern also can be seen in
the November graph (Fig. 19), although not as distinctly, and by December
(Fig. 20) the predominantly winter-type rainfall again complicates the
simple nighttime maximum-daytime minimum relationship.
The graph for August (Fig. 16) illustrates a diurnal pattern frequently
observed in Hilo. In addition to the afternoon minimum, the rainfall often
shows two maxima, one in the early evening between 2000 and 2300 and another
in the early morning between 0300 and 0500.
The diurnal variation in rainfall frequency also has been calculated for
each month. The frequency curves have not been reproduced in this report
since they are quite similar to the diurnal variation in light rainfall amounts.
The boundary between the shaded and unshaded portion of each diurnal curve
(Figs. 9 through 20) may be taken as a close approximation to the frequency
curve for that month. This result might be anticipated, since more than 93%
of the hours of measurable rain are hours of light rainfall, that is, less
than 0.25 inches per clock hour.
The monthly diurnal graphs may be combined to study seasonal variations
or to derive an annual curve. Such a curve has been plotted for each year
from 1953 to 1970. While the curves have not been reproduced in this report,
it is of interest to note that they are quite similar to one another, year
after year. The annual rainfall amounts vary widely, but the diurnal pattern
persists. This fact suggests, as does the relative constancy of the annual
rainfall frequency, that Hilo rainfall is produced by a simple and regular
process. The details of the physical mechanism underlying rainfall in Hawaii
are currently being investigated at the Cloud Physics Observatory.
OTHER SOURCES OF INFORMATION
ProbablY the best single source of data on rainfall in the State of
Hawaii is Taliaferro's (1959) RainfaZZ of the Hawaiian IsZands. Taliaferro

CJ) L&J ::t: (,)
z ..
..J
..J ct LL. z ct a::
..J
~ ~
LEGEN D: .40 15..., RAINFALL DISTRIBUTION
1.0 OR MORE IN IHR
0.50 - 0.99 IN IHR
nf{~:1 0.25 - 0.49 ~30
IN I HR
10~ I I 0.01 - 0.24 IN I HR
20
5
I ~r:-:-:-:;l"""1 ~ t:;::}::]:::::::}]}::~;::]::':::':·:·:·:1 I::::; ;[}}:F';':':':':~ I:::::::;::::l~~:::::it;,··········r·;,;,:·:·:·r··· ..... ;:~ ~IO
4 I 0
o 24 20 8 12 16 LOCAL TIME, CLOCK HOURS
FIGURE 9. MONTHLY DIURNAL RAINFALL DISTRIBUTION FOR HILO SHOWING TOTAL RAINFALL PER CLOCK HOUR BY INTENSITY CATEGORY: JANUARY 1953-1971.
~~~~~~~'~~~'llWmn"~=-E:==maED"" __ PB __ _
CJ)
a:: L&J t-L&J ::E t-z L&J (,)
N .....
(J)
w !r 0 z -
.. ...J ..J
~ Z <i 0::
...J <l I-0 I-
20, LEGEND: RAINFALL DISTRIBUTION
1.0 OR MORE IN/HR
0.50 - 0.99 IN IHR
0.25 - 0.49 IN/HR I 40 15~ - r:';';-;'1
0.01 - 0.24 IN/HR • '---I
- I .. ···· ........ 1m:: :1 1-30
10
20
5 p:::::::q I}~\:})\::::::] 11 10
20 I 0 o M 4 8 12 16
LOCAL TIME. CLOCK HOURS
FIGURE 10. MONTHLY DIURNAL RAINFALL DISTRIBUTION FOR HILO SHOWING TOTAL RAINFALL PER CLOCK HOUR BY INTENSITY CATEGORY: FEBRUARY 1953-1971.
"1',)-
IV
(J)
0:: W I-w :::E I-Z ll.I 0
C/) I.&J :::t: 0 z
.. ..J ..J e( La. z e( 0:::
..J e( I--0 I--
LEGEND: .40 151
RAINFALL DISTRIBUTION - 1.0 OR MORE IN IHR
0.50 - 0.99 IN IHR .······1 ~30 ...... ......
r"J 0.25 - 0 49 INI HR ......
~ ...... '.:-:.:.:.:.: .. ... , .. ...... 0.01 - 0.24 :::::: ;::::: IN I HR ...... -_ ... _,. ....
10 ----_._ .. - ----------------
;:::::;:;:::;: ...... ::: ~:::::::::: ::;: ::: :::: :~:
••••••••••••••
20
-5
.... ·1:~r?:::I::::: :f~:::~::::}I::::::::::::::[:::::::::J:::::::::::::J 1-10
o ~
4 16 ..... _~.1 ~LLL~~---.-l----'-----:2~4 0
8 12 20 LOCAL TIME, CLOCK HOURS
FIGURE 11. MONTHLY DIURNAL RAINFALL DISTRIBUTION FOR INTENSITY CATEGORY: MARCH 1953-1971.
SHOWING TOTAL RAINFALL PER CLOCK HOUR BY
C/) 0::: I.&J I--I.&J :::E l-Z I.&J 0
N VI
C/) W IX: (.) z
.. ...J ...J e( I.L. Z e( 0::
...J e( I-10 I-
20.., LEGEND: r 50 RAINFALL DISTRIBUTION
1.0 OR MORE IN IHR
0.50 - 0.99 IN IHR
r::::::::::1 ~:~~ ~ ~::: IN I HR ~40
15 1 ~ IN I HR ............ ...... '" .. "
30
10
20 [':'~':':':':'~'.';~~':'~'~';;J a..:...:...:...:·:·:·>:':·:·l·:-:·:·:~:·:·:t~·~·~·~·~·:·~~~ '" '" '" '" ~I I::';';;;; :1"''''' ··"'1 ..... '" •• :':':':':':':.(':':':':':';'~'~':'~.;';';'J'.'.'.'.'.'.'.1 •.... " ... -.-.-,
5 r:<:<:<:<:<r:::::::::::I::::: :1:::::::::::::[:~:~:~:~:~l::::~:~:::l~:)~{:rI
10
I 0 o ' 24 4 8 12 16 20
LOCAL TIME, CLOCK HOURS
FIGURE 12. MONTHLY DIURNAL RAINFALL DISTRIBUTION FOR HILO SHOWING TOTAL RAINFALL PER CLOCK HOUR BY INTENSITY CATEGORY: APRIL 1953-1971.
N ~
C/) 0:: W I-ILl :E -l-Z ILl (.)

LEGEND: .40 15., RAINFALL DISTRIBUTION
1.0 OR MORE IN I HR
0.50 - 0.99 IN I HR ........... . _······1 ...... bd-30
J I roo r:1........... .. ........ .. Ul ,',',','0',·, .... ooL """"'.'.' 0 25 0 9 f N H ................. .
~ ~}» :~m; >~<{ . -.4 I R o (~}) "" ........ ::::: 001 - 024 IN I HR z ::;:::::;:::: :::::: :::::: ::::: ...... . . 10 .:-;.;.:.:.; ...... .I ...... <........... . ................. , ............ ' ........ , ·L·.·.·.·.·.·.·. (f)
.. 0:: ~ ~ ~ ~
~ 20 ~ z -- ~ ~ Z 0:: ~
............. ~ 0 ~ 5 j:! ~ t F.;~F::;:::::;:;I;'~ .. :'~ __ F~:::~:~:~:I:;::;::::}:I 1-10
0----'-----" 4 8 12 16
LOCAL TIME, CLOCK HOURS 20
I 0 24
FIGURE 13. MONTHLY DIURNAL RAINFALL DISTRIBUTION. FOR HILO SHOWING TOTAL RAINFALL PER CLOCK HOUR BY INTENSITY CATEGORY: MAY 1953-1971.
_+~~~.!I':.~ :iiUilllitlii!ilOtililill!Giii""""
tv (,n
(J)
'" ~ 0 z
.. ....J ....J « I&. z « a: ....J « I-0 I-
15
10
:«f~
5 ~~~}~~~}~~i :::::::::::::.i
LEGEND: RAINFALL DISTRIBUTION
":':~:':':':-:':';';':':"
1.0 OR MORE IN / HR
0.50 - 0.99 IN / HR
0.25 - 0.49 IN / HR
0.01 - 0.24 IN / HR
::.:.:.:.~
40
30
en a: '" ~ I-:::::. :::::. '"
::x::::t:t:«ff 2 0 ~
10
IZ kI o
I 0 o 24 4 8 12 16 20
LOCAL TIME, CLOCK HOURS
FIGURE 14. MONTHLY DIURNAL RAINFALL DISTRIBUTION FOR HILO SHOWING TOTAL RAINFALL PER CLOCK HOUR BY INTENSITY CATEGORY: JUNE 1953-1971.
N 0\

I 0 o 24 4 8 12 16 20
LOCAL TIME, CLOCK HOURS
FIGURE 15. MONTHLY DIURNAL RAINFALL DISTRIBUTION FOR HILO SHOWING TOTAL RAINFALL PER CLOCK HOUR BY INTENSITY CATEGORY: JULY 1953-1970.
N "-I
en W :I: u z
.. ...J ...J
~ z ct a::
...J
~ 0 ....
LEGEND: ,40 15..., - RAINFALL DISTRIBUTION
1.0 OR MORE IN IHR
0.50 - 0.99 IN IHR
Mr:-?!::: :::L:»~ L:}}I 0.25 - 0.49 IN I HR ~······I ............. ~30
I 0 -r[:::~:[[::[:E[:[::::::::I[:[:::::~:~r:::::~~[:~\:rn:~:~:~::~:~:l:::::::::::::1 U 0.01 - 0.24 IN I HR - ................ •. -.--'_Y_'-'--.,
....... ; \ :;;;;: ::: • ••••••••••••
·\I:I:·~I~~~I~ ~m~~~~~~~~~~ ...... 20
.......
5
1:?W:1 · .... ·1· .. · .. 1 .:::-:.:::.:~ :::::: f-IO
0~-L~~~~L-~~~~~~--L-~~~~~--~~~~~~-;;24 0 4 8 12 16 20
LOCAL TIME, CLOCK HOURS
FIGURE 16. MONTHLY DIURNAL RAINFALL DISTRIBUTION FOR HILO SHOWING TOTAL RAINFALL PER CLOCK HOUR BY INTENSITY CATEGORY: AUGUST 1953-1970.
N 00
en a:: w .... w ~ -.... z w u
rn LLI ::z:: 0 z
.. ..J ..J
~ z « a: ..J « .... 0 ....
LEGEND: r40
15l RAINFALL DISTRIBUTION - 1.0 OR MORE IN IHR
0.50 - 0.99 IN IHR
tfI tf} 0.25 - 0.49 IN I HR 1-30
0.01 - 0.24 IN I HR 10
20
5
r-1 II r;·:·:·;.:·l··········l ........ .i - ~ ...... , ::::: ~
, ...... , 1-10
4 1 I 0
01
U 8 12 16 20 LOCAL TIME, CLOCK HOURS
FIGURE 17. MONTHLY DIURNAL RAINFALL DISTRIBUTION FOR HILO SHOWING TOTAL RAINFALL PER CLOCK HOUR BY INTENSITY CATEGORY: SEPTEMBER 1953-1970.
~.".~"'~).:i';;;$:h::w>,,:;;;:a;;;;;;;s:::.:::;;:;:;:::;;wz:m:tiiRQ£ swz:::;u::u:;;; _ZW !&£
(f)
a: w ~ w ::t ~ z w 0
N \0
en ILl ::r::: 0 Z
.. ...J ...J
~ z -<t a: ...J <t I-0 I-
LEGEND: r-40 15, RAINFALL DISTRIBUTION
1.0 OR MORE IN IHR
0.50 - 0.99 IN IHR
lol ......ITITITIl 1-30
~ - ........... ;:::;:;:::;: 0 25 - 0 49 IN I HR
............ .:-:.:.:-:-:" ..
0.01 - 0.24 IN I HR _ •••••• __ • ____ I_;.~~ __ •• ____ .. I:·~··-
20
1·· .... 1 ........ I' ..
5
h:;:;:=:;:;:[{::::=Lj{{:}j;:;; ~ :1 r}}~rI 1-10
01-~JL-L-L-L~~~~~~~L-L-L-~~~~~~~~~-2~40 4 8 12 16 20
LOCAL TIME, CLOCK HOURS
FIGURE 18. MONTHLY DIURNAL RAINFALL DISTRIBUTION FOR HILO SHOWING TOTAL RAINFALL PER CLOCK HOUR BY INTENSITY CATEGORY: OCTOBER 1953-1970.
CA 0
en a: ILl I-ILl :E ~ z LLI (J
C/) LLI J: U Z
.J'
...I
~ z <[ 0:
...I
~ 0 I-
20.., LEGEND: RAINFALL DISTRIBUTION .50
1.0 OR MORE IN IHR
0.50 - 0.99 IN IHR
15~:::. 0.25 - 0.49 IN/HR - ~40
':: : r····1 0.0 I - 0.24 :::::.:: : IN I HR ...... :: . ........ :
1::::::::::::3::::::1,""'1..-- j;;;;;;I::::::_::::::L 30
10
20
5 ~:;}::;:::F::>~:;l:::;:;::d~:;:::::J;;:;; :I
10
0 ......... --11-----'-----1---'---'
4 8 12 16 _LJ....---.lL--L--'-_~-------=-1 0 L_L...---.L_-'--~_ 24
20 LOCAL TIME, CLOCK HOURS
FIGURE 19. MONTHLY DIURNAL RAINFALL DISTRIBUTION FOR HILO SHOWING TOTAL RAINFALL PER CLOCK HOUR BY INTENSITY CATEGORY: NOVEMBER 1953-1970.
(J) 0: LLI I-LLI :!: j:: z LLI u
tN ......

(I) LIJ :J: (,) z
.. ..J ..J <t I.L Z
C2 ..J
~ 0 t-
LEGEND: RAINFALL DISTRIBUTION
1.0 OR MORE IN IHR
0.50 - 0.99 IN IHR r 40 15.., M:1N:~ 0.25 - 0.49 IN I HR
0.01 - 0.24 IN I HR
111_ '--'
IillTIL I!:::::~;~~~:I ::::::1- 30 -10 ,. ,. ~ ... ,. .......
20
5 ,..-".", ... , r·········1 """"1 1-10
o 0 4 8 12 16 20 24
LOCAL TIME, CLOCK HOURS
FIGURE 20. MONTHLY DIURNAL RAINFALL DISTRIBUTION FOR HILO SHOWING TOTAL RAINFALL PER CLOCK HOUR BY INTENSITY CATEGORY: DECEMBER 1953-1970.
--<A N
(I) cr I.LI t-LIJ ::Ii i= Z LIJ (,)

33
presents annual and monthly median isohyetal maps for the islands of Hawaii,
Maui, Molokai and Lanai, Oahu, and Kauai, based on data for the 25-year
period, 1933 to 1957. In addition, he provides tables of median and extreme
monthly rainfall amounts and median, upper and lower quartile, and extreme
annual rainfall amounts for approximately 1400 active and discontinued rain
gauges. The compilation includes an index of rain gauges, along with loca
tor maps, and a useful bibliography of 88 publications related to Hawaiian
rainfall.
The Department of Land and Natural Resources of the State of Hawaii
has published An Inventory of Basic Water Resources Data: IsZand of Hawaii
(1970). The report contains monthly and annual rainfall amounts for more
than 100 stations and an isohyetal map of the island showing mean annual
rainfall during 1931 to 1960, based on records from 97 gauges. Additional
selected data on temperatures, evaporation, wind, humidity, stream flow,
ground-water resources, and water quality are also provided.
A valuable source of literature on rainfall and other weather phenomena
in Hawaii has been compiled by Ekern and Worthley (1968). In most cases
the author's abstract or a brief description of the paper is given.
ACKNOWLEDGEMENTS
It may please (or perhaps shock) the reader to learn that the data
presented in this report were not processed by computer. The author is
indebted to Myra Enriques, Melody Meier, Florence Miyamoto, Margaret Okumoto,
and Sue Nakashima for their countless hours of dedicated data reduction.
Thanks also go to Bob Mitchel, who did most of the drafting, and to Darla
Serrao who typed the manuscript.
Raymond Busniewski of the Hilo airport station of the National Weather
Service furnished most of the data. The author has profited from helpful
discussions with Howard Ellis, of Mauna Loa Observatory, James Hunter, of
Beaumont Agricultural Research Center, and with David Raymond, Tsutomu
Takahashi, and Ronald Taylor of the Department of Meteorology, University of
Hawaii.
34
REFERENCES
Ekern, P.C. and L.E. Worthley. 1968. Annotated bibliography of publications and papers relevant to Hawaiian weather. Hawaii Institute of Geophysics Technical Report 68-11, University of Hawaii. p. 126.
Lee, C.B.H. 1967. "A preliminary study of thunderstorms in Hawaii," In Weather Phenomena in Hawaii. Hawaii Institute of Geophysics Technical Report 67-9, University of Hawaii. p. 41-53.
Ramage, C.S. 1964. "Diurnal variation of summer rainfall of Malaya." J. Trop. Geog., University of Singapore and University of Malaya. Vol. 19. p. 62-68.
State of Hawaii, Department of Land and Natural Resources, Division of Water and Land Development. 1970. An inventory of basic water resources data: island of Hawaii. Report R34. p. 188.
Takahashi, T. and C.M. Fullerton. 1972. "Raindrop charge-size measurements in warm rain." J. of Geophys. Research, Vol. 77, No.9. p. 1630-1636.
Taliaferro, W.J. 1959. RainfaU of the Hawaiian islands. Hawaii Water Authority, State of Hawaii, Honolulu. 394 p. (This book is out-of print. It is currently being revised, expanded, and updated by computerized methods.)
U.S. Department of Commerce, National Oceanic and Atmospheric Administration, Environmental Data Service. 1970. Local climatological data, annual summary with comparative data, Hilo, Hawaii. 4 p. (In addition, weather parameters including hourly rainfall, as measured at the Hilo aiport station.)
Worthley, L.E. 1967. "Synoptic climatology of Hawaii", in Weather phenomena in Hawaii. Hawaii Institute of Geophysics Technical Report 67-9, University of Hawaii. p. 1-40.