rainfall, discharge, and water-quality data during ... in cooperation with the state of hawaii...
TRANSCRIPT
Prepared in cooperation with the STATE OF HAWAII DEPARTMENT OF TRANSPORTATION
Rainfall, Discharge, and Water-Quality Data During Stormwater Monitoring, July 1, 2007, to June 30, 2008: Halawa Stream Drainage Basin and the H-1 Storm Drain, Oahu, Hawaii
By Todd K. Presley, Marcael T.J. Jamison, and Stacie T.M. Young
Open File Report 2008–1233
U.S. Department of the Interior U.S. Geological Survey
ii
U.S. Department of the Interior DIRK KEMPTHORNE, Secretary
U.S. Geological Survey Mark D. Myers, Director
U.S. Geological Survey, Reston, Virginia 2008
For product and ordering information: World Wide Web: http://www.usgs.gov/pubprod Telephone: 1-888-ASK-USGS
For more information on the USGS—the Federal source for science about the Earth, its natural and living resources, natural hazards, and the environment: World Wide Web: http://www.usgs.gov Telephone: 1-888-ASK-USGS
Any use of trade, product, or firm names is for descriptive purposes only and does not imply endorsement by the U.S. Government.
Although this report is in the public domain, permission must be secured from the individual copyright owners to reproduce any copyrighted material contained within this report.

iii
Contents Abstract .........................................................................................................................................1 INTRODUCTION...........................................................................................................................2 DATA-COLLECTION NETWORK .................................................................................................2 WATER-QUALITY SAMPLING TECHNIQUES.............................................................................4
Sampling requirements ..............................................................................................................4 Storm criteria..............................................................................................................................4 Sample collection .......................................................................................................................4 Determination of discharge for samples.....................................................................................6 Sample processing, analysis, and quality-assurance/quality-control..........................................7
HALAWA STREAM DRAINAGE BASIN........................................................................................9 Rainfall and Discharge Data..........................................................................................................9 Stormwater Sampling: Conditions and Results .............................................................................9
Third Quarter 2007—July 1 to September 30, 2007.................................................................10 Fourth Quarter 2007—October 1 to December 31, 2007 .........................................................10
Storm of November 4, 2007 ..................................................................................................10 First Quarter 2008—January 1 to March 31, 2008 ...................................................................11 Second Quarter 2008—April 1 to June 30, 2008......................................................................12
Storm of May 21-22, 2008.....................................................................................................12 Quality Assurance .......................................................................................................................13 H-1 STORM DRAIN ....................................................................................................................13 Rainfall and Discharge Data........................................................................................................13 Stormwater Sampling: Conditions and Results ...........................................................................14
Third Quarter 2007—July 1 to September 30, 2007.................................................................14 Storm of August 11, 2007 .....................................................................................................14
Fourth Quarter 200—October 1 to December 31, 2007 ...........................................................14 Storm of October 30, 2007....................................................................................................14 Storm of November 1, 2007 ..................................................................................................15
First Quarter 2008—January 1 to March 31, 2008 ...................................................................15 Storm of January 28 and 29, 2008 ........................................................................................15
Second Quarter 2008—April 1 to June 30, 2008......................................................................15 Storm of April 6, 2008 ...........................................................................................................16
Quality Assurance .......................................................................................................................16 References Cited ........................................................................................................................17 Appendix A: Discharge-Reporting and Load-Calculation Methods.............................................35 Appendix B: Physical Properties, Concentrations, and Loads for All Samples Collected from Halawa Stream Drainage Basin and H-1 Storm Drain During the Period from July 1, 2006, to June 30, 2007, Oahu, Hawaii ......................................................................................................37
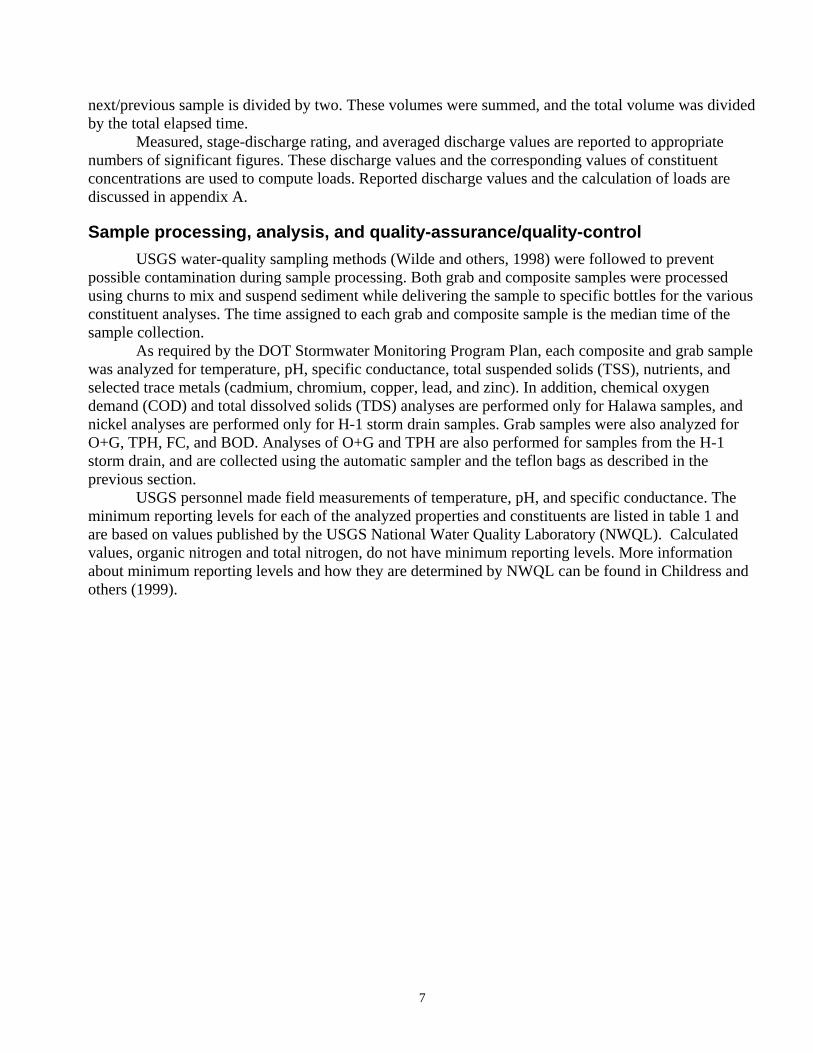
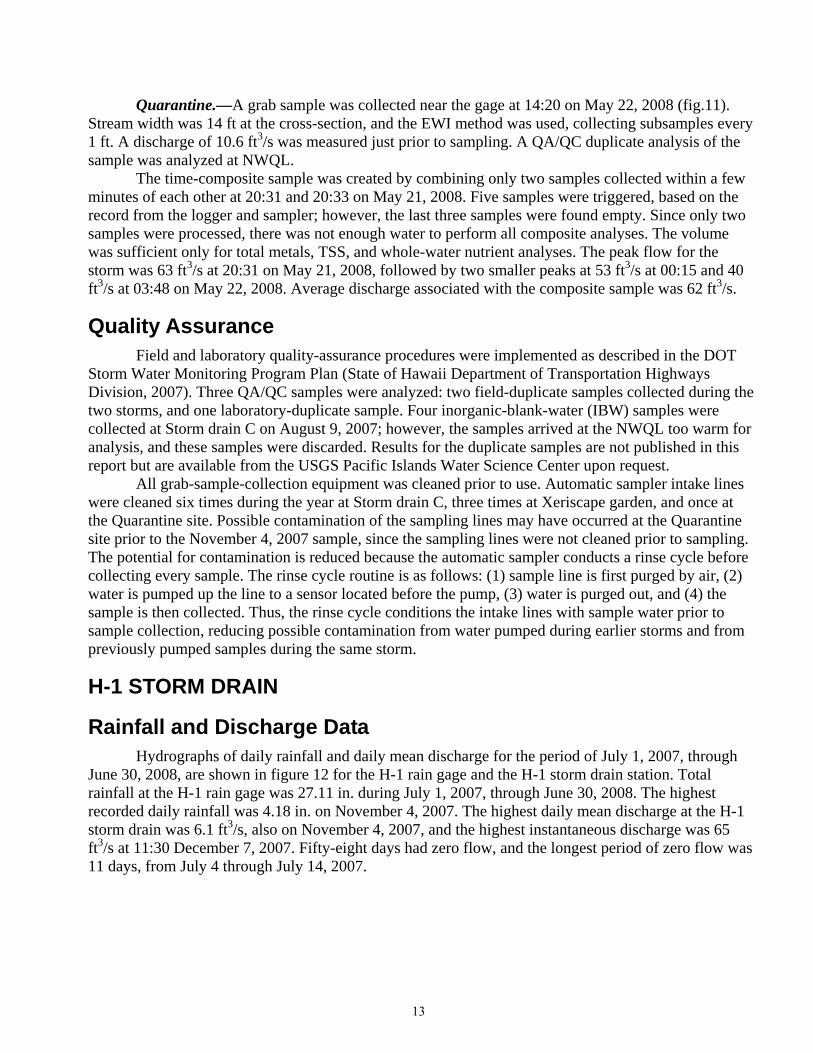
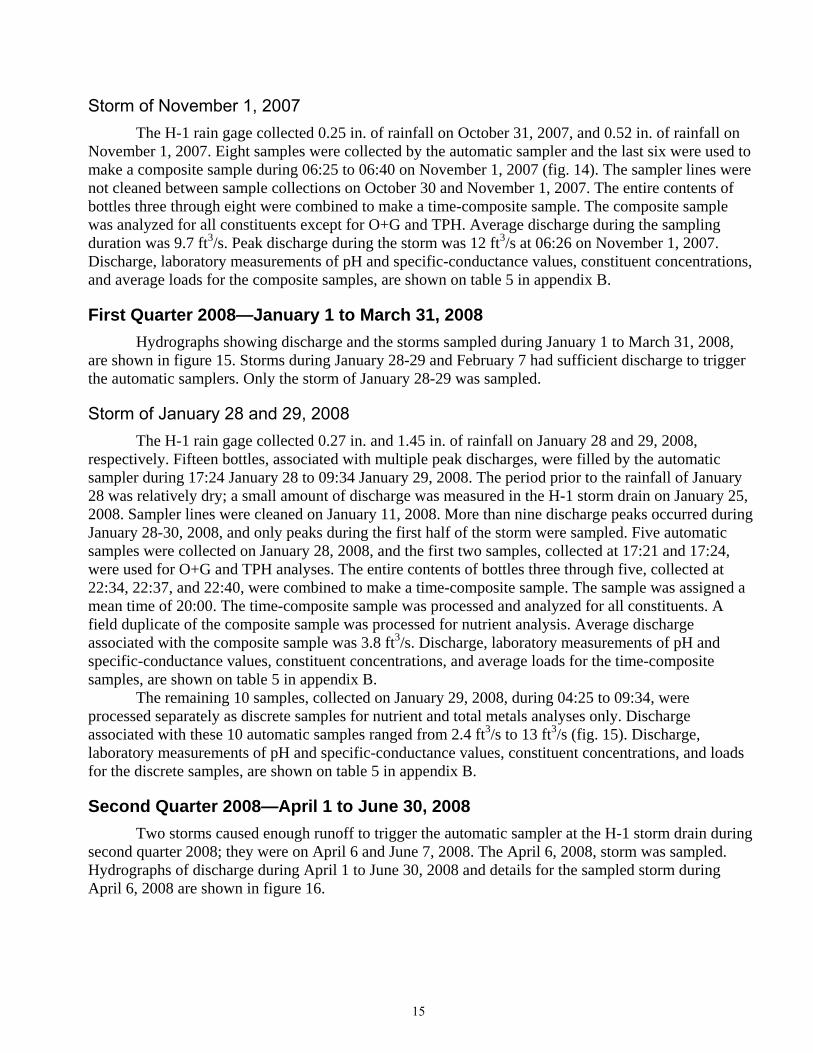
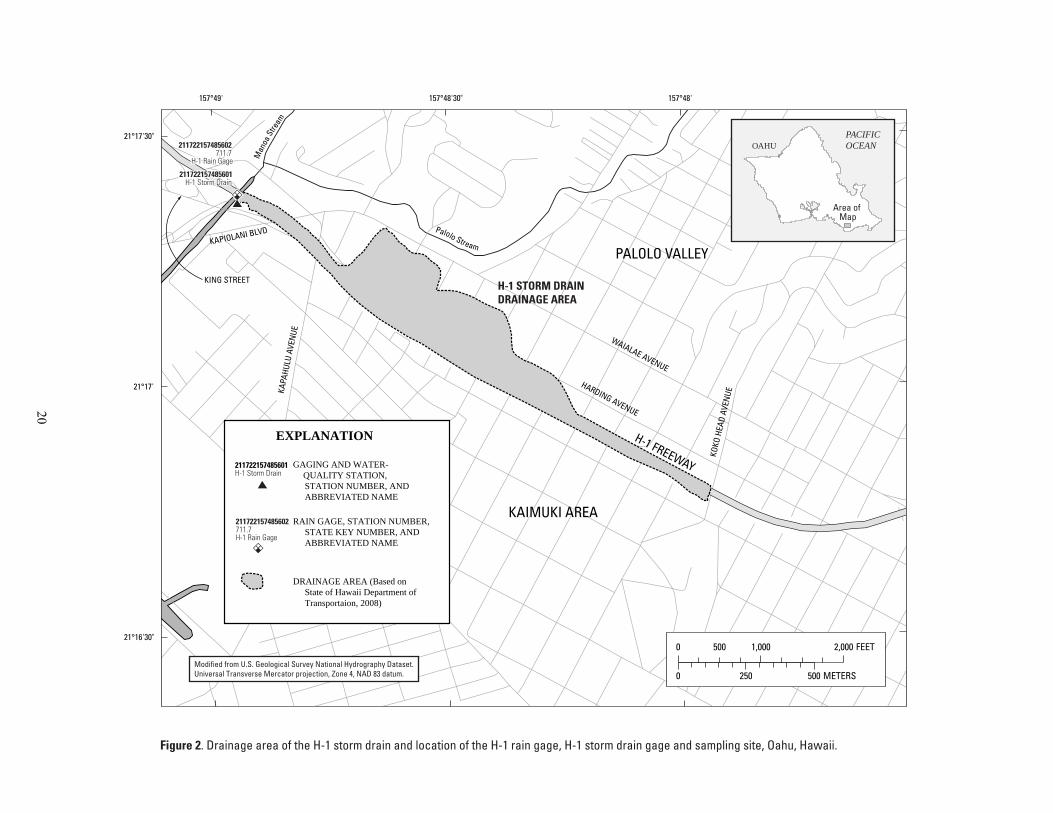
Figures Figure 1. Stream-gaging stations, rain gages, and water-quality sampling stations in the Halawa drainage basin, Oahu, Hawaii. ....................................................................................................19 Figure 2. Drainage area of the H-1 storm drain and location of the H-1 rain gage, H-1 storm drain gage and sampling site, Oahu, Hawaii. ..............................................................................20 Figure 3. Rainfall and discharge for stations within the Halawa Stream drainage basin, Oahu, Hawaii, for July 1, 2007, to June 30, 2008. .................................................................................21
iv
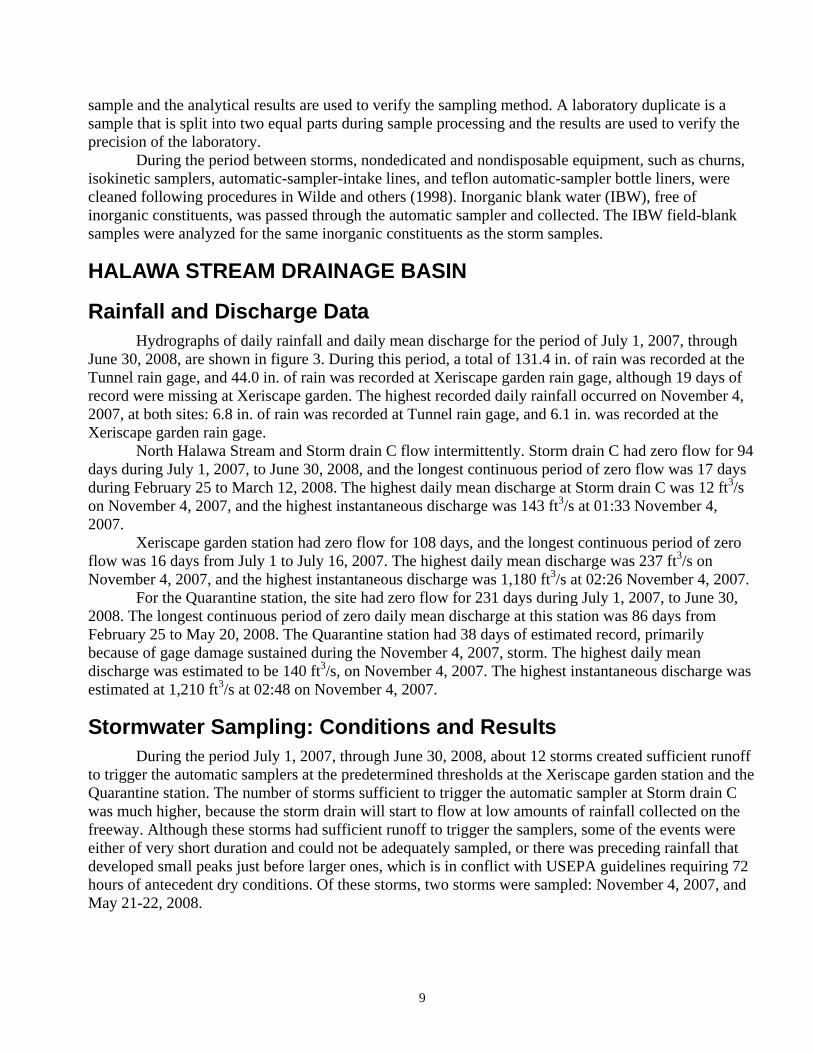
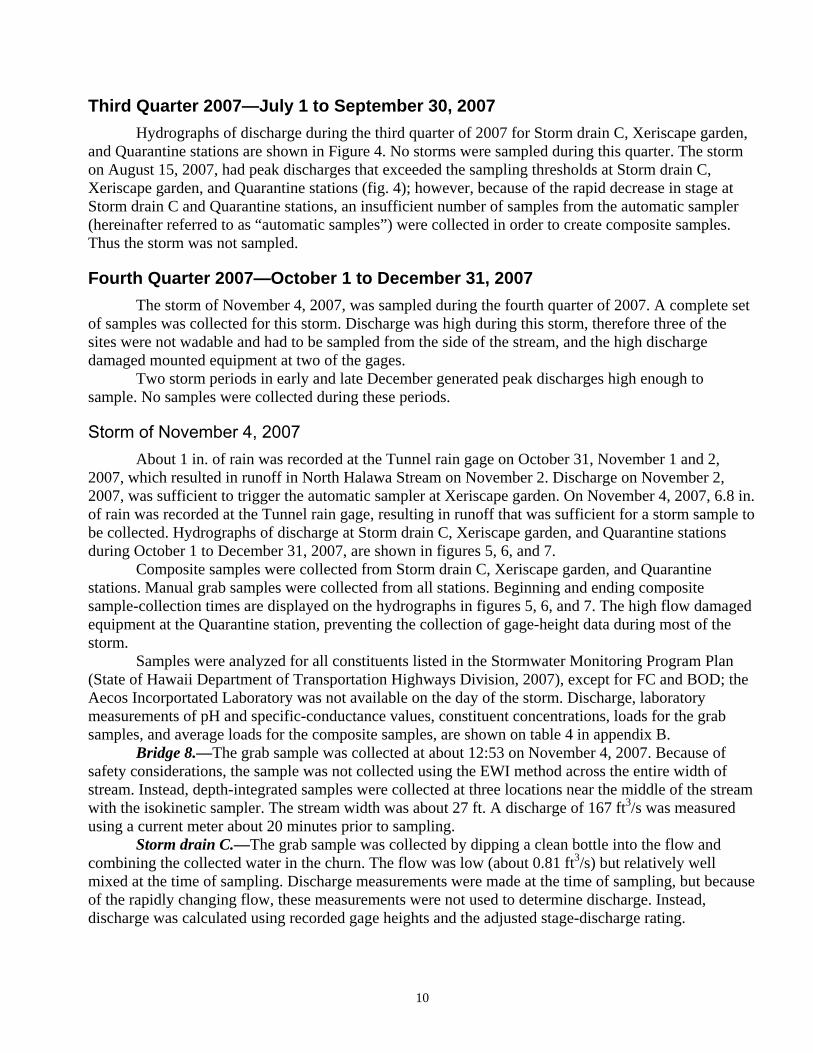
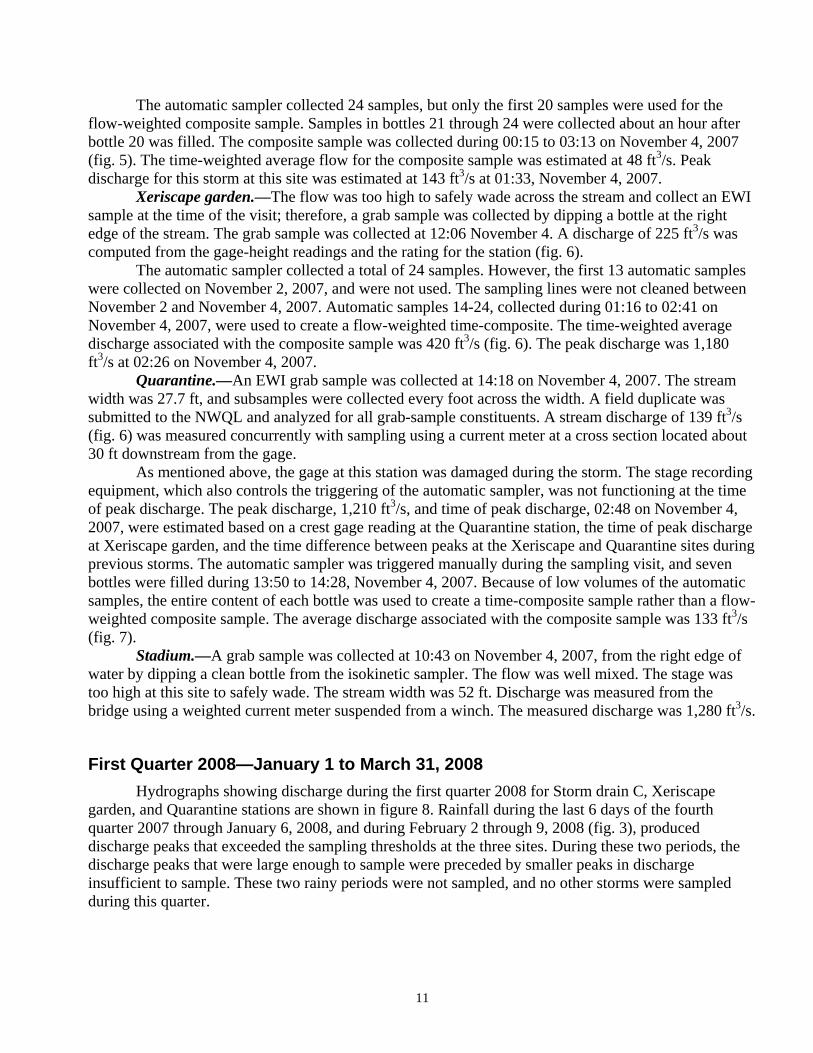
Figure 4. Discharge at Storm Drain C (212353157533001), and stream discharge at Xeriscape garden (16226200) and Quarantine station (16226400), for July 1 to September 30, 2007, Oahu, Hawaii. ........................................................................................................................................22 Figure 5. Discharge at Storm drain C (212353157533001) for October 1 to December 31, 2007; detail of 5-day period from November 1 to 5, 2007; and detail of 24-hour period from 20:00 November 3 to 20:00 November 4, 2007, Oahu, Hawaii. ............................................................23 Figure 6. Stream discharge at Xeriscape garden station (16226200) for October 1 to December 31, 2007; detail of 5-day period from November 1 to 5, 2007; and detail of 24-hour period from 20:00 November 3 to 20:00 November 4, 2007, Oahu, Hawaii. ..................................................24 Figure 7. Stream discharge at Quarantine station (16226400) for October 1 to December 31, 2007; and detail of 12-hour period from 12:00 November 4 to 00:00 November 5, 2007, Oahu, Hawaii. ........................................................................................................................................25 Figure 8. Discharge at Storm Drain C (212353157533001), and stream discharge at Xeriscape garden (16226200) and Quarantine station (16226400), for January 1 to March 31, 2008, Oahu, Hawaii. ........................................................................................................................................26 Figure 9. Discharge at Storm drain C (212353157533001) for April 1 to June 30, 2008; detail of 3-day period from May 21 to 23, 2008; and detail of 24-hour period from 16:00 May 21 to 16:00 May 22, 2008, Oahu, Hawaii. ......................................................................................................27 Figure 10. Stream discharge at Xeriscape garden station (16226200) for April 1 to June 30, 2008; detail of 7-day period from May 18 to 24, 2008; and detail of 30-hour period from 16:00 May 21 to 22:00 May 22, 2008, Oahu, Hawaii. ...........................................................................28 Figure 11. Stream discharge at Quarantine station (16226400) for April 1 to June 30, 2008; detail of 3-day period from May 21 to 23, 2008; and detail of 24-hour period from 16:00 May 21 to 16:00 May 22, 2008, Oahu, Hawaii. ........................................................................................29 Figure 12. Rainfall for H-1 rain gage and discharge for H-1 storm drain, Oahu, Hawaii, for July 1, 2007, to June 30, 2008. ..............................................................................................................30 Figure 13. Discharge at H-1 storm drain (211722157485601) for July 1 to September 30, 2007; and detail of 4-hour period from 20:00 August 11 to 00:00 August 12, 2007, Oahu, Hawaii. ......31 Figure 14. Discharge at H-1 storm drain (211722157485601) for October 1 to December 31, 2007; detail of 24-hour period from 12:00 October 30 to 12:00 October 31, 2007; and detail of 24-hour period from 00:00 November 1 to 00:00 November 2, 2007, Oahu, Hawaii...................32 Figure 15. Discharge at H-1 storm drain (211722157485601) for January 1 to March 31, 2008; detail of 3-day period from January 28 to 30, 2008; and detail of 20-hour period from 20:00 January 28 to 16:00 January 29, 2008, Oahu, Hawaii. ...............................................................33 Figure 16. Discharge at H-1 storm drain (211722157485601) for April 1 to June 30, 2008; and detail of 14-hour period from 02:00 to 16:00, April 6, 2008, Oahu, Hawaii. .................................34
Tables Table 1. Minimum reporting levels of properties and constituents for all samples collected from Halawa Stream drainage basin and H-1 storm drain from July 1, 2007, to June 30, 2008, Oahu, Hawaii ...........................................................................................................................................8 Table 2. Significant figures and rounding limits for measured, discharge-rating, and averaged discharges...................................................................................................................................35 Table 3. Conversion factors for computing daily loads from constituent concentration and discharge.....................................................................................................................................36
v
Table 4. Physical properties, concentrations, and loads for all samples collected from Halawa Stream drainage basin during the period from July 1, 2007, to June 30, 2008, Oahu, Hawaii. ...38 Table 5. Physical properties, concentrations, and loads for all samples collected from H-1 storm drain during the period from July 1, 2007, to June 30, 2008, Oahu, Hawaii. ...............................43
vi
Conversion Factors Inch/Pound to SI
Multiply By To obtain
Length
inch (in.) 2.54 centimeter (cm)
foot (ft) 0.3048 meter (m)
mile (mi) 1.609 kilometer (km)
Flow rate
cubic foot per second (ft3/s) 0.02832 cubic meter per second (m3/s) Temperature in degrees Celsius (°C) may be converted to degrees Fahrenheit (°F) as follows: °F=(1.8×°C)+32 Temperature in degrees Fahrenheit (°F) may be converted to degrees Celsius (°C) as follows: °C=(°F-32)/1.8 Vertical coordinate information is referenced relative to mean sea level. Horizontal coordinate information is referenced to Old Hawaiian Datum. Specific conductance is given in microsiemens per centimeter at 25 degrees Celsius (μS/cm at 25 °C). Concentrations of chemical constituents in water are given either in milligrams per liter (mg/L) or micrograms per liter (μg/L).

Rainfall, Discharge, and Water-Quality Data During Stormwater Monitoring, July 1, 2007, to June 30, 2008: Halawa Stream Drainage Basin and the H-1 Storm Drain, Oahu, Hawaii
By Todd K. Presley, Marcael T.J. Jamison, and Stacie T.M. Young
Abstract Storm runoff water-quality samples were collected as part of the State of Hawaii Department of
Transportation Stormwater Monitoring Program. The program is designed to assess the effects of highway runoff and urban runoff on Halawa Stream and to assess the effects from the H-1 storm drain on Manoa Stream. For this program, rainfall data were collected at three stations, continuous discharge data at four stations, and water-quality data at six stations, which include the four continuous discharge stations. This report summarizes rainfall, discharge, and water-quality data collected between July 1, 2007, and June 30, 2008.
A total of 16 environmental samples were collected over two storms during July 1, 2007, to June 30, 2008, within the Halawa Stream drainage area. Samples were analyzed for total suspended solids, total dissolved solids, nutrients, chemical oxygen demand, and selected trace metals (cadmium, chromium, copper, lead, and zinc). Additionally, grab samples were analyzed for oil and grease, total petroleum hydrocarbons, fecal coliform, and biological oxygen demand. Some samples were analyzed for only a partial list of these analytes because an insufficient volume of sample was collected by the automatic samplers. Three additional quality-assurance/quality-control samples were collected concurrently with the storm samples.
A total of 16 environmental samples were collected over four storms during July 1, 2007, to June 30, 2008 at the H-1 Storm Drain. All samples at this site were collected using an automatic sampler. Samples generally were analyzed for total suspended solids, nutrients, chemical oxygen demand, oil and grease, total petroleum hydrocarbons, and selected trace metals (cadmium, chromium, copper, lead, nickel, and zinc), although some samples were analyzed for only a partial list of these analytes. During the storm of January 29, 2008, 10 discrete samples were collected. Varying constituent concentrations were detected for the samples collected at different times during this storm event. Two quality-assurance/quality-control samples were collected concurrently with the storm samples. Three additional quality-assurance/quality-control samples were collected during routine sampler maintenance to check the effectiveness of equipment-cleaning procedures.
1

INTRODUCTION The State of Hawaii Department of Transportation (DOT) Stormwater Monitoring Program Plan
(State of Hawaii Department of Transportation Highways Division, 2007) was implemented on January 1, 2001, to monitor the Halawa Stream drainage basin, Oahu, Hawaii. The Stormwater Monitoring Program Plan was designed to fulfill part of the permit requirements for the National Pollutant Discharge Elimination System program and is revised yearly. The Stormwater Monitoring Program Plan includes the collection of rainfall, discharge, and water-quality data at selected stations in the Halawa Stream drainage basin.
In 2005, additional monitoring of a storm drain that collects runoff from the H-1 Freeway was implemented to fulfill requirements, outlined by the United States Environmental Protection Agency (USEPA), regarding Total Maximum Daily Loads (TMDL) for total nitrogen and total phosphoruous (United States Environmental Protection Agency, 2002) for discharges into Manoa Stream. Rainfall, discharge, and stormwater sampling began at this site in 2006.
This report summarizes water-quality data collected by the U.S. Geological Survey (USGS) as part of the Stormwater Monitoring Program Plan. This report also presents rainfall and discharge data collected from July 1, 2007, to June 30, 2008 for stations within the Halawa Stream drainage area and for a storm drain of the H-1 Freeway (hereinafter referred to as the H-1 storm drain) that discharges into Manoa Stream. Descriptions of the sampling techniques are included with the water-quality data. Quality-assurance/quality-control (QA/QC) samples were collected concurrently with storm samples and during routine cleaning of the sampling equipment between storms. Water-quality data for the QA/QC samples are not published in this report, but are available upon request from the USGS Pacific Islands Water Science Center in Honolulu, Hawaii.
Within the Halawa Stream drainage area, 16 samples were collected over two storms during July 1, 2007, to June 30, 2008. Three QA/QC samples were collected concurrently with the storm samples. An additional four artificial blank water samples were collected to check isolated parts of the sampling equipment for possible contamination on August 9, 2007, as part of quality assurance during routine cleaning of the sampling equipment. These samples were not analyzed, because the samples were not fully chilled upon arrival at the laboratory due to shipping delays.
At the H-1 storm drain, 16 samples were collected over four storms during July 1, 2007, to June 30, 2008. Two QA/QC samples were collected concurrently with the storm samples. In addition, three artificial blank water samples were collected to check isolated parts of the sampling equipment for possible contamination.
DATA-COLLECTION NETWORK Stream-stage, stream-discharge, rainfall, and water-quality data were collected at selected
stations in the Halawa Stream drainage basin (fig. 1). Rainfall data were collected at two stations, 212428157511201, North Halawa Valley rain gage at H-3 tunnel portal (abbreviated to Tunnel rain gage), and 212304157542201, North Halawa rain gage near Honolulu (abbreviated to Xeriscape garden rain gage). Rainfall data have been collected at the Tunnel and Xeriscape garden rain gages since July 1998 and May 1983, respectively.
Discharge data were collected at three stations in North Halawa Valley. Since 1998, discharge data have been collected at station 212353157533001, North Halawa Valley Highway Storm Drain C near Aiea (abbreviated Storm drain C). Stream discharge data have been collected at station 16226200, North Halawa Stream near Honolulu (abbreviated to Xeriscape garden), since 1983, and at 16226400,
2

North Halawa Stream at Quarantine Station (abbreviated to Quarantine), since 2001. The gaging stations Storm drain C, Xeriscape garden, and Quarantine are equipped with automatic samplers. The gage at the Quarantine site was destroyed on December 7, 2003 and rebuilt in June 2005.
Discharge data were collected at station 211722157485601 H-1 Storm Drain at Kapiolani Boulevard, Oahu, HI (abbreviated to H-1 storm drain). The H-1 storm drain station was constructed during 2005-2006 and began operation on April 6, 2006 (fig.2). Rainfall data were collected at station 211722157485602, State Key Number 711.7 H-1 Rain Gage at Kapiolani Boulevard, Oahu, HI, (abbreviated to H-1 rain gage). The H-1 rain gage is located on the top of the H-1 storm drain gage house.
Rainfall and discharge data were collected using variable sampling intervals, depending on rainfall or discharge rates. Discharge data from Quarantine and Storm drain C and discharge and rainfall data from the H-1 storm drain are transferred to the USGS National Water Information System (NWIS) database hourly by satellite telemetry. The Xeriscape garden rain gage and stream gage, and the Tunnel rain gage, currently do not have telemetry.
Recent data can be viewed at http://hi.water.usgs.gov/ under “Real-Time Data (from NWISWeb)” by selecting “Streamflow” or “Rainfall” and then selecting the appropriate USGS station numbers. Historical rainfall and streamflow data can be accessed through the website http://hi.water.usgs.gov/ under “Historical Data (from NWISWeb)” by selecting “Streamflow” or “Rainfall” and then selecting “Daily Data” and then entering the appropriate USGS station numbers.
Water-quality data were collected at five stations (fig. 1): 212356157531801, North Halawa Stream at Bridge 8 near Halawa (abbreviated to Bridge 8); Storm drain C; Xeriscape garden; Quarantine; and 16227100, Halawa Stream below H-1 (abbreviated to Stadium). The Bridge 8 station is about 0.75 miles (mi) upstream from the discharge point of Storm drain C on North Halawa Stream. Storm drain C collects runoff from an approximately 4-mi length of freeway starting at the leeward tunnel portal and extending to mid-valley and discharges directly to North Halawa Stream (fig. 1). The Xeriscape garden station is directly upstream from a light-industrial area near North Halawa Stream, and about 0.75 mi downstream of the discharge point of Storm drain C. The Quarantine station is about 1 mi downstream of Xeriscape garden and near the downstream end of the light-industrial area that borders the North Halawa Stream. The Stadium station is about 1.5 mi downstream of the Quarantine station, downstream from the confluence of North and South Halawa Streams, downstream from the crossing of H-1 freeway, and directly upstream from the mouth at Pearl Harbor.
The H-1 storm drain collects runoff from about 1.3 mi of freeway, flowing southeast to northwest (fig 2.). Part of the neighborhood adjacent to the freeway also drains into the drainage system connected to the storm drain. The H-1 storm drain discharges into Manoa Stream near the intersection of King Street and Kapiolani Boulevard, under the viaducts of the freeway and onramp. The discharge point of the storm drain is along a sloping wall about 10 ft higher than the bed of Manoa stream, about 0.1 mi downstream of the confluence of Palolo and Manoa Streams. The H-1 storm drain station, which includes the rain gage, is located directly above the discharge point of the drain.
Water-quality data that have been collected at stations Storm drain C (1998-present), Xeriscape garden (1983-present), and Stadium (1988-present) by the USGS as part of the H-3 freeway construction monitoring study, as well as water-quality data collected for this study and data collected at the H-1 storm drain (2006-present), can be viewed at the website http://hi.water.usgs.gov/ under “Historical Data (from NWISWeb)” by selecting “Water Quality” and then selecting either “Field/lab samples” or “Daily Data” and then entering the appropriate USGS station numbers.
3
WATER-QUALITY SAMPLING TECHNIQUES Water-quality samples include: grab samples collected manually, grab samples collected by an
automatic sampler, time-composite samples collected by an automatic sampler, and flow-weighted composite samples collected by an automatic sampler. Each grab and composite sample is assigned a median sampling time based on the start and finish time of the grab sampling process, or the times of collection of the samples used for the grab or composite sample from the automatic sampler.
Sampling requirements The DOT Stormwater Monitoring Program Plan states that water-quality samples will be
collected at least once per quarter during periods of storm runoff from each of the five water-quality monitoring stations in the Halawa area (fig. 1) and for the H-1 storm drain (fig. 2). Also, if a storm does not occur during a quarter, no samples will be collected.
Specifically for the H-3 part of the project, the DOT Stormwater Monitoring Program Plan states that efforts must be made to sample all five Halawa-area water-quality monitoring stations during the same storm. A complete set of samples for a storm consists of five grab samples (one from each of the five stations), three flow-weighted composite samples (one each from Storm drain C, Xeriscape garden, and Quarantine stations), and one QA/QC sample. However, some storms are brief and do not produce adequate runoff to sample all five stations and collect all samples. In practice, these storms have been sampled as thoroughly as possible and analyzed for as many constituents as practical.
At the H-1 storm drain, only composite samples are collected. In practice, opportunities to sample at the H-1 storm drain were frequent because of the multitude of discharge peaks associated with each burst of rainfall in the area. Because of time and manpower constraints, however, the H-1 storm drain was not sampled on the same days as the Halawa-area sites.
Storm criteria
The USEPA Storm Water Sampling Guidance Manual (U.S. Environmental Protection Agency, Office of Water, 1993) provides criteria for stormwater sampling. The first criterion requires at least 0.1 in. of accumulated rainfall within a storm. Rainfall accumulations exceeded 0.1 in. at the Tunnel rain gage and Xeriscape garden rain gage when stormwater sampling was conducted. The second criterion requires that samples be collected only for storms preceded by at least 72 hours of dry weather. The second criterion would prevent sampling of most storms on North Halawa Stream because the Halawa Stream drainage basin, as well as many other parts of Oahu, receives tradewind showers almost daily. Many of the samples collected in the past do not meet the second criterion.
In practice, criteria used to initiate sampling of the stream and storm drain were based on the rate of rainfall accumulation and the rise of stage in Storm drain C, Xeriscape garden, Quarantine, and H-1 storm drain stations. Each automatic sampler is triggered at a station-specific, stream-stage threshold determined after investigating the rainfall-to-runoff relation.
Sample collection In general, grab samples were collected manually using isokinetic, depth-integrating samplers
and equal-width increment (EWI) or single vertical sampling techniques (Wilde and others, 1998). The samplers collect water in an isokinetic manner; water enters the sampler at the same velocity as the stream at the sampling point. Samplers are made of high-density polyethylene (HDPE).
The EWI sampling technique utilizes evenly spaced sampling increments along the cross section of the stream, with equal vertical transit rates of the isokinetic sampler for all increments. Since the
4
transit rates are equal for each increment, the volume of each subsample collected at each increment is proportional to the discharge at that increment. Subsamples are combined in a HDPE churn. An EWI sample is practical when depths are greater than 0.5 ft and the stream is wadable, or where bridges or cable ways are available. If it is not practical or safe to collect an EWI sample, an alternative is to sample at the centroid of flow. At such times, a grab sample was collected with the isokinetic sampler at the estimated centroid of flow at a single vertical section. Subsamples from the single-vertical technique also were combined in a HDPE churn. During storms, flow in North Halawa Stream generally is thought to be well mixed, although sampling to determine the extent of mixing has not been done.
Automatic samplers collect water from a fixed point in the stream channel after predetermined stage thresholds are met. The automatic samplers have a capacity of 24 1-liter bottles. When the first threshold has been met, the automatic samplers are programmed to collect water samples about every 2 minutes for the first 5 samples, and then every 15 minutes for the remaining 19 samples. The first stage thresholds for the samplers correspond to discharges of about 5.2, 36, and 55 ft3/s for Storm drain C, Xeriscape garden, and Quarantine stations, respectively. In order to collect enough water in each sample during storms with quickly rising and falling stream stages, or high overall flow, a second set of stage thresholds, corresponding to higher discharges, is used to trigger the samplers to sample every seven minutes. These higher stage thresholds correspond to discharges of 43.9, 84, and 110 ft3/s for Storm drain C, Xeriscape garden, and Quarantine stations, respectively. At the H-1 storm drain, the stage thresholds correspond to discharges of 2.4 ft3/s for the first threshold and 56.2 ft3/s for the second threshold.
The automatic samplers are set up with “bottles” that are actually bags held in bottlelike frames. The bags are either reusable and made of teflon that can be cleaned, or disposable and made of low-density polyethylene (LDPE). The teflon bags are positioned in the first 3 slots of the sampler, and the LDPE bags are positioned in the remaining 21 slots. The teflon bags are used so that samples collected by the automatic sampler may be used to analyze for oil and grease (O+G) and total petroleum hydrocarbons (TPH). The main limitations of using water collected in the Teflon bags for O+G and TPH analyses are that: (1) analyses for these constituents requires that the samples be chilled prior to analysis and analyzed within a certain time after collection, known as the “holding time,” and (2) these constituents may adhere to tubing lines used to collect the sample. Fecal coliform (FC) and biological oxygen demand (BOD) samples are not collected by this method because the holding times for these constituents would likely be exceeded, and because the teflon bags are not sterilized for fecal coliform analysis and may become contaminated in the field because they are open to the air. Nutrient analyses may also be affected by holding times, but they are not affected by the type of bag.
Time-composite samples and flow-weighted composite samples are created by combining, in a HDPE churn, all or part of the samples collected by the automatic samplers. A time-composite sample is created by combining the entire contents of bottles with no weighting proportional to stream discharge. Time-composite samples are created when there are only a few bottles filled or partially filled, when there are multiple discharge peaks separated by time gaps of an hour or more, or when the combined volume of the sample collected in the bottles is low. A flow-weighted composite sample is created by combining select volumes of water from each sample, the amount being proportional to the volume of stream discharge between sample collection times. Flow-weighted composite samples are collected over time periods that sometimes last several hours, whereas time-composite samples are usually collected over shorter time periods.
Grab, time-composite, or flow-weighted composite samples were created from the samples collected by the automatic sampler depending on (1) the temporal distribution of discharge over the duration of the storm, (2) the discharge at the time the site was visited to collect a grab sample, (3) site
5
analytical requirements, (4) the number of sample bottles filled, and (5) the volume of sample collected in each bottle. Situations in which the storm samples deviate from the sampling requirements, outlined in the sampling plan, occurred when there were multiple peaks in discharge, when stream discharge had decreased too much after a storm to collect a grab sample, or when a small discharge peak was followed by a much larger discharge peak. When discharge was too low to sample at the time of visit, the first five samples from the automatic sampler, which are collected over about two minutes each, may be used to create a grab sample, and would represent a “first flush” type sample because it would be collected during the first peak of discharge for the storm. Because of the variability in discharge, one or a few hours may have separated groups of samples collected by the automatic sampler. In these cases, samples may have been grouped and analyzed separately as flow-weighted composite samples or time-composite samples.
The H-1 storm drain has unique requirements relative to the Halawa composite sample sites; only composite samples (no grab samples) are collected, although samples from the first two bottles are used for O+G and TPH analyses. In practice, because of the short duration and multitude of discharge peaks associated with each burst of rainfall at the H-1 storm drain, the composite samples are most often time-composite samples rather than flow-weighted samples.
In a few cases, individual samples collected by the automatic sampler at the H-1 storm drain were analyzed separately for metals and nutrients only. This type of sample is called a “discrete” sample since it is not combined with samples from other bottles, and it represents the runoff composition at the time at which the sample was taken. Discrete samples allow for the analysis of how constituent concentrations vary with changes in discharge during the storm.
Determination of discharge for samples At Bridge 8, Storm drain C, Xeriscape garden, and Quarantine stations, discharge associated
with each sample was determined using a stage-discharge rating created for the station or by direct measurement using a current meter. Stage-discharge ratings were developed using direct measurements of stage and discharge and the results from hydraulic models that were verified by measurements at each site. USGS practices for making discharge measurements and stage-discharge ratings can be found in Rantz and others (1982).
At the Quarantine site, the scouring and depositing bed of the stream and the damaged concrete control resulted in stage-discharge ratings that varied during every storm. The rating for this gage has many adjustments resulting in poor estimates of discharge at any given time.
At the Stadium station, the wide and curving concrete-lined channel and shallow and swift streamflow preclude development of an accurate discharge rating. When possible, discharge at this station was measured using a current meter. At higher flows, discharge was measured either by using float-measurement techniques, a radar gun, or a flow meter suspended by cable. The float-measurement technique involves timing floating objects over a known distance to determine water velocity. The radar gun measures surface velocity at multiple points in the cross section. In both techniques, the area of the cross section was estimated using measured water depths and surveyed dimensions of the channel.
An average-discharge value was calculated for each composite sample. The average-discharge value was equal to the total volume of water that flowed by the gaging station during sample collection, divided by the total elapsed time required to collect the automatic samples. To determine the volume of water that passed the station for each sample, the discharge at the time of sample collection was multiplied by the elapsed time. The elapsed time is computed by taking the difference between the times of the samples taken before and after the sample in question and dividing by two. To compute the elapsed time of the first and last samples, the difference between the time of the sample and
6
next/previous sample is divided by two. These volumes were summed, and the total volume was divided by the total elapsed time.
Measured, stage-discharge rating, and averaged discharge values are reported to appropriate numbers of significant figures. These discharge values and the corresponding values of constituent concentrations are used to compute loads. Reported discharge values and the calculation of loads are discussed in appendix A.
Sample processing, analysis, and quality-assurance/quality-control USGS water-quality sampling methods (Wilde and others, 1998) were followed to prevent
possible contamination during sample processing. Both grab and composite samples were processed using churns to mix and suspend sediment while delivering the sample to specific bottles for the various constituent analyses. The time assigned to each grab and composite sample is the median time of the sample collection.
As required by the DOT Stormwater Monitoring Program Plan, each composite and grab sample was analyzed for temperature, pH, specific conductance, total suspended solids (TSS), nutrients, and selected trace metals (cadmium, chromium, copper, lead, and zinc). In addition, chemical oxygen demand (COD) and total dissolved solids (TDS) analyses are performed only for Halawa samples, and nickel analyses are performed only for H-1 storm drain samples. Grab samples were also analyzed for O+G, TPH, FC, and BOD. Analyses of O+G and TPH are also performed for samples from the H-1 storm drain, and are collected using the automatic sampler and the teflon bags as described in the previous section.
USGS personnel made field measurements of temperature, pH, and specific conductance. The minimum reporting levels for each of the analyzed properties and constituents are listed in table 1 and are based on values published by the USGS National Water Quality Laboratory (NWQL). Calculated values, organic nitrogen and total nitrogen, do not have minimum reporting levels. More information about minimum reporting levels and how they are determined by NWQL can be found in Childress and others (1999).
7

Table 1. Minimum reporting levels of properties and constituents for all samples collected
Oahu, Hawaii o o
micrograms per lite100 milliliters]
from Halawa Stream drainage basin and H-1 storm drain from July 1, 2007, to June 30, 2008,
[std., standard; μS/cm, microsiemens per centimeter at 25 C; mg/L, milligrams per liter; C, degrees Celsius; μg/L, r; --, no minimum reporting level, computed value; MPN/100mL, most probable number (of colonies) per
Property or constituent Minimum reporting level pH 0.1 std. units Specific conductance 2.6 μS/cm Temperature 0.5oC Total suspendedTotal dissolved
solids 10 mg/L solids 10 mg/L
Total nitrogena -- nic nitrogen
c
+ ammonia (Kjeldahl) e dissolved /L
L
and 1 g/L
QL, 5.0 mg/L TALd ydrocarbons QL, 5.0 mg/L TALd demand
mL
b Orga -- 0.020 mg/L Ammonia dissolved
Nitrogen, total organic 0.1 mg/L 40.04 mNitrogen, nitrite + nitrat
Phosphorus dissolved g
0.04 mg/Total phospho us rChemical oxyge
0.04 mg/L n dem
Total cadmium 0 m0.01 μg/L
Total chromium 0.8 μg/L Total copper 1.2 μg/L Total lead 0.06 μg/L Total nickel 0.16 μg/L Total zinc 2 μg/L Oil and grease 8 mg/L NWTotal petroleum h
gen2 mg/L NW
Biological oxyrm
1 mg/L Fecal colifo 2 MPN/100aTotal nitrogen is calculated by adding nitrogen, total organic+ammonia to nitrogen, nitrite+nitrate, dissolved.
trogen is calculated by subtracting nitrogen ammonia, dissol nitrogen, total organic+ammonia
d as nitrogen roleum hydrocarbon analyses were perform laboratory to about January 1,
here. holiday, no FC or BOD samples were collected
because Aecos Incorporated was closed and holding times for these constituents would be exceeded. ither at the NWQL or, as of January of 2008, at the Test America
Laboratories facility in Denver, Colorado. All other analyses were performed at the USGS NWQL, in l
practices at NWQL are documented in Friedman and Erdmann (1982), Fishman and Friedman (1989), 996),
Garbarino and Struzeski (1998), and Garbarino and others (2006). n
(Kjeldahl)bOrganic ni ved, from(Kjeldahl). c orteAmmonia, dissolved is rep
d total petd Oil and grease an ed at the NWQL2008. All subsequent analyses were performed at Test America Laboratories (TAL) in Denver, Colorado
FC and BOD analyses were performed by Aecos Incorporated, a private laboratory on Oahu.
QA/QC practices for FC and BOD were performed by Aecos Incorporated, but are not publishedFor storm sampling that occurred on a weekend or
O+G and TPH were analyzed e
Denver, Colorado. The methods used for analyses of all water-quality constituents and quality-contro
Pritt and Raese (1992), Patton and Truitt (1992), Fishman (1993), Hoffman and others (1
A duplicate sample, field or laboratory, is required by the Stormwater Monitoring Program Plafor each storm sample. A field duplicate is a sample that is collected concurrently or split with a grab
8
sample and the analytical results are used to verify the sampling method. A laboratory duplicate is asample that is split into two equal parts during sample processing and the results are used to verify the
precisio
-blank orm samples.
e ays of
s recorded at the
Xeriscape garden rain gage. ittently. Storm drain C had zero flow for 94 ntinuous period of zero flow was 17 days
hest daily mean discharge at Storm drain C was 12 ft3/s neous discharge was 143 ft3/s at 01:33 November 4,
2007.
0, period of zero daily mean discharge at this station was 86 days from
Februa
Storm
ere
storms were sampled: November 4, 2007, and May 21-22, 2008.
n of the laboratory. During the period between storms, nondedicated and nondisposable equipment, such as churns,
isokinetic samplers, automatic-sampler-intake lines, and teflon automatic-sampler bottle liners, were cleaned following procedures in Wilde and others (1998). Inorganic blank water (IBW), free of inorganic constituents, was passed through the automatic sampler and collected. The IBW fieldsamples were analyzed for the same inorganic constituents as the st
HALAWA STREAM DRAINAGE BASIN
Rainfall and Discharge Data Hydrographs of daily rainfall and daily mean discharge for the period of July 1, 2007, through
June 30, 2008, are shown in figure 3. During this period, a total of 131.4 in. of rain was recorded at thTunnel rain gage, and 44.0 in. of rain was recorded at Xeriscape garden rain gage, although 19 drecord were missing at Xeriscape garden. The highest recorded daily rainfall occurred on November 4,2007, at both sites: 6.8 in. of rain was recorded at Tunnel rain gage, and 6.1 in. wa
North Halawa Stream and Storm drain C flow intermdays during July 1, 2007, to June 30, 2008, and the longest coduring February 25 to March 12, 2008. The higon November 4, 2007, and the highest instanta
Xeriscape garden station had zero flow for 108 days, and the longest continuous period of zero flow was 16 days from July 1 to July 16, 2007. The highest daily mean discharge was 237 ft3/s on November 4, 2007, and the highest instantaneous discharge was 1,180 ft3/s at 02:26 November 4, 2007.
For the Quarantine station, the site had zero flow for 231 days during July 1, 2007, to June 32008. The longest continuous
ry 25 to May 20, 2008. The Quarantine station had 38 days of estimated record, primarily because of gage damage sustained during the November 4, 2007, storm. The highest daily mean discharge was estimated to be 140 ft3/s, on November 4, 2007. The highest instantaneous discharge wasestimated at 1,210 ft3/s at 02:48 on November 4, 2007.
water Sampling: Conditions and Results During the period July 1, 2007, through June 30, 2008, about 12 storms created sufficient runoff
to trigg eer the automatic samplers at the predetermined thresholds at the Xeriscape garden station and thQuarantine station. The number of storms sufficient to trigger the automatic sampler at Storm drain C was much higher, because the storm drain will start to flow at low amounts of rainfall collected on the freeway. Although these storms had sufficient runoff to trigger the samplers, some of the events weither of very short duration and could not be adequately sampled, or there was preceding rainfall that developed small peaks just before larger ones, which is in conflict with USEPA guidelines requiring 72 hours of antecedent dry conditions. Of these storms, two
9
Third Quarter 2007—July 1 to September 30, 2007 Hydrographs of discharge during the third quarter of 2007 for Storm drain C, Xeriscape garden,
and Quarantine stations are shown in Figure 4. No storms were sampled during this quarter. The storm on August 15, 2007, had peak discharges that exceeded the sampling thresholds at Storm drain C, Xeriscape garden, and Quarantine stations (fig. 4); however, because of the rapid decrease in stage at Storm drain C and Quarantine stations, an insufficient number of samples from the automatic sampler (hereinafter referred to as “automatic samples”) were collected in order to create composite samples. Thus the storm was not sampled.
Fourth Quarter 2007—October 1 to December 31, 2007 The storm of November 4, 2007, was sampled during the fourth quarter of
of samples was collected for this storm. Discharge was high durin 2007. A complete set
g this storm, therefore three of the sites w
orded at the Tunnel rain gage on October 31, November 1 and 2, 2007, which resulted in runoff in North Halawa Stream on November 2. Discharge on November 2,
en. On November 4, 2007, 6.8 in. of rain
maged equipment at the Quarantine station, preventing the collection of gage-height data during most of the
the
ream
3
ere not wadable and had to be sampled from the side of the stream, and the high discharge damaged mounted equipment at two of the gages.
Two storm periods in early and late December generated peak discharges high enough to sample. No samples were collected during these periods.
Storm of November 4, 2007 About 1 in. of rain was rec
2007, was sufficient to trigger the automatic sampler at Xeriscape gardwas recorded at the Tunnel rain gage, resulting in runoff that was sufficient for a storm sample to
be collected. Hydrographs of discharge at Storm drain C, Xeriscape garden, and Quarantine stations during October 1 to December 31, 2007, are shown in figures 5, 6, and 7.
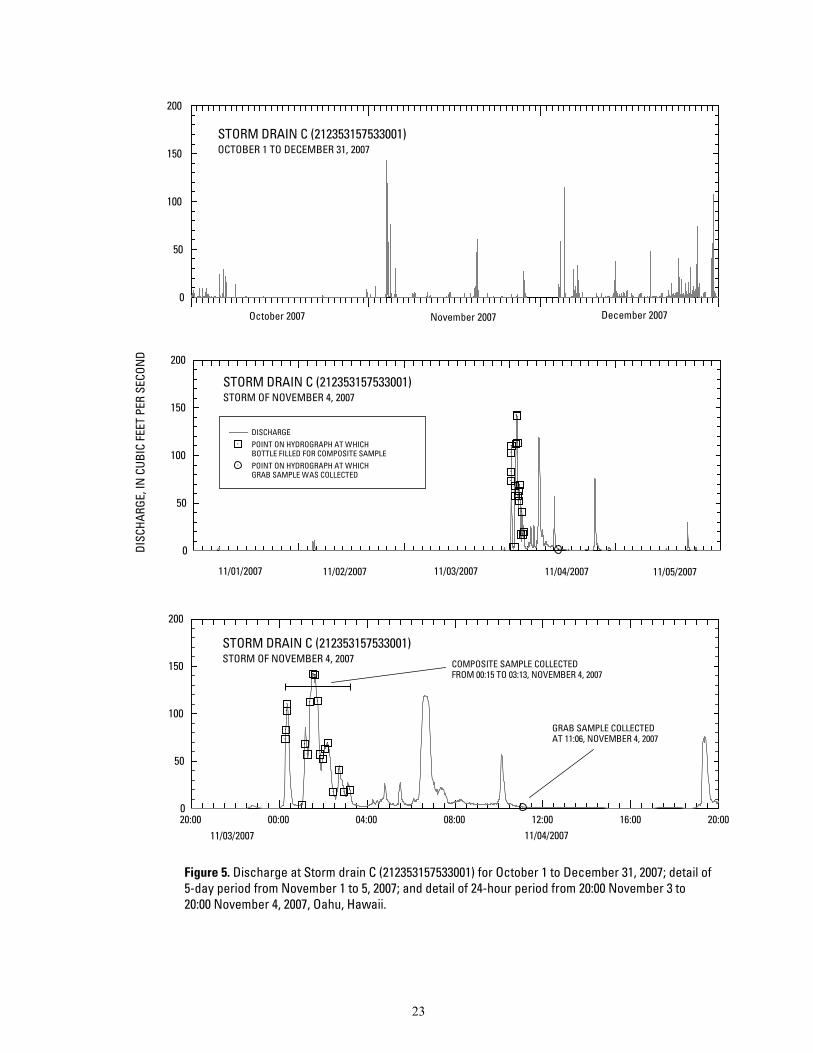
Composite samples were collected from Storm drain C, Xeriscape garden, and Quarantine stations. Manual grab samples were collected from all stations. Beginning and ending composite sample-collection times are displayed on the hydrographs in figures 5, 6, and 7. The high flow da
storm. Samples were analyzed for all constituents listed in the Stormwater Monitoring Program Plan
(State of Hawaii Department of Transportation Highways Division, 2007), except for FC and BOD; Aecos Incorportated Laboratory was not available on the day of the storm. Discharge, laboratory measurements of pH and specific-conductance values, constituent concentrations, loads for the grab samples, and average loads for the composite samples, are shown on table 4 in appendix B.
Bridge 8.—The grab sample was collected at about 12:53 on November 4, 2007. Because of safety considerations, the sample was not collected using the EWI method across the entire width of stream. Instead, depth-integrated samples were collected at three locations near the middle of the stwith the isokinetic sampler. The stream width was about 27 ft. A discharge of 167 ft3/s was measured using a current meter about 20 minutes prior to sampling.
Storm drain C.—The grab sample was collected by dipping a clean bottle into the flow and combining the collected water in the churn. The flow was low (about 0.81 ft /s) but relatively well mixed at the time of sampling. Discharge measurements were made at the time of sampling, but becauseof the rapidly changing flow, these measurements were not used to determine discharge. Instead, discharge was calculated using recorded gage heights and the adjusted stage-discharge rating.
10
The automatic sampler collected 24 samples, but only the first 20 samples were used for the flow-weighted composite sample. Samples in bottles 21 through 24 were collected about an hour aftebottle 20 was filled. The composite sample was collected during 00:15 to 03:13 on November 4, 2007 (fig. 5). The time-weighted average flow for the composite sample was estimated at 48 ft3/s. Peak discharge for this storm at this site was estimated at 143 ft3/s at 01:33, Novem
r
ber 4, 2007. WI
t
samples were co en
0
ss section located about 30 ft do
me
ge ference between peaks at the Xeriscape and Quarantine sites during
previouic
-
Xeriscape garden.—The flow was too high to safely wade across the stream and collect an Esample at the time of the visit; therefore, a grab sample was collected by dipping a bottle at the righedge of the stream. The grab sample was collected at 12:06 November 4. A discharge of 225 ft3/s was computed from the gage-height readings and the rating for the station (fig. 6).
The automatic sampler collected a total of 24 samples. However, the first 13 automatic llected on November 2, 2007, and were not used. The sampling lines were not cleaned betwe
November 2 and November 4, 2007. Automatic samples 14-24, collected during 01:16 to 02:41 on November 4, 2007, were used to create a flow-weighted time-composite. The time-weighted average discharge associated with the composite sample was 420 ft3/s (fig. 6). The peak discharge was 1,18ft3/s at 02:26 on November 4, 2007.
Quarantine.—An EWI grab sample was collected at 14:18 on November 4, 2007. The stream width was 27.7 ft, and subsamples were collected every foot across the width. A field duplicate was submitted to the NWQL and analyzed for all grab-sample constituents. A stream discharge of 139 ft3/s (fig. 6) was measured concurrently with sampling using a current meter at a cro
wnstream from the gage. As mentioned above, the gage at this station was damaged during the storm. The stage recording
equipment, which also controls the triggering of the automatic sampler, was not functioning at the tiof peak discharge. The peak discharge, 1,210 ft3/s, and time of peak discharge, 02:48 on November 4, 2007, were estimated based on a crest gage reading at the Quarantine station, the time of peak discharat Xeriscape garden, and the time dif
s storms. The automatic sampler was triggered manually during the sampling visit, and seven bottles were filled during 13:50 to 14:28, November 4, 2007. Because of low volumes of the automatsamples, the entire content of each bottle was used to create a time-composite sample rather than a flowweighted composite sample. The average discharge associated with the composite sample was 133 ft3/s (fig. 7).
Stadium.—A grab sample was collected at 10:43 on November 4, 2007, from the right edge of water by dipping a clean bottle from the isokinetic sampler. The flow was well mixed. The stage was too high at this site to safely wade. The stream width was 52 ft. Discharge was measured from the bridge using a weighted current meter suspended from a winch. The measured discharge was 1,280 ft3/s.
First Quarter 2008—January 1 to March 31, 2008 Hydrographs showing discharge during the first quarter 2008 for Storm drain C, Xeriscape
garden, and Quarantine stations are shown in figure 8. Rainfall during the last 6 days of the fourth quarter 2007 through January 6, 2008, and during February 2 through 9, 2008 (fig. 3), produced discharge peaks that exceeded the sampling thresholds at the three sites. During these two periods, the discharge peaks that were large enough to sample were preceded by smaller peaks in discharge insufficient to sample. These two rainy periods were not sampled, and no other storms were sampled during this quarter.
11

Second Quarter 2008—April 1 to June 30, 2008 Only two storms during second quarter 2008 had sufficient rainfall and discharge to trigger
automatic samplers, one on May 21-22, 2008, and a second on June 12, 2008. The storm of May 21had discharge only slightly above thresholds for the sampler. The June 12 storm had higher dischbut was short in duration; the flow lasted only about 3 hours at Xeriscape garden. Only the May 21-22, 2008, storm was sampled.
Storm of May 21-
the -22
arges
22, 2008 on May 21, and the Xeriscape rain gage gh runoff to trigger the automatic samplers
(figs. 9
er, only a few bottles at Quarantine and Storm drain C were filled. Beginning and ending composite sample-collection times are displayed on the hydrographs in figures 9, 10, and 11.
ents of pH and specific-conductance values, constituent concentrations, loads fo
r
5
3/s
s.
The tunnel rain gage collected about 3.2 in. of rainfall collected about 1.8 in. of rainfall. This rainfall produced enou
, 10, and 11). Only a partial set of samples was collected because of insufficient flow at the time of sampling at some sites. Grab samples were collected at Bridge 8, Xeriscape garden, and Quarantine sites. Flow was low and decreasing at the time of sampling; thus the sampling team decided not to sample at the Stadium site. Automatic samples were collected at Storm drain C, Xeriscape garden, and Quarantine stations; howev
Discharge, laboratory measuremr the grab samples, and average loads for the composite samples are shown on table 4 in
appendix B. Bridge 8.—The grab sample was collected using the EWI method at 13:23 on May 22, 2008.
The sampling cross section was about 13 ft wide, and was sampled at 1-ft intervals. About 45 minutes prior to sampling, a discharge of 11.8 ft3/s was measured using a current meter. This site was chosen foa field duplicate for selected analyses; thus, a second set of FC, BOD, O+G, and TPH bottles were filledat the site.
Storm drain C.—Discharge was nearly zero at the time the site was visited on May 22, 2008; thus a grab sample was not collected.
The automatic sampler at Storm drain C malfunctioned and only filled four bottles starting about 2 hours after the first peak. Samples were collected from 20:06 to 21:21 on May 21, 2008. Abouthours later, at 02:25 and 02:41, two more bottles were filled, and about 2 hours later, at 04:03 and 04:21(fig. 9), two additional bottles filled. The samples were taken during three distinct time periods; therefore the three groups of bottles were processed separately. The first four samples were used to create a flow-weighted composite sample, and the next two pairs of samples were each combined to create two time-composite samples. The volume of water collected was insufficient for filling all of the analyte bottles; thus only metals, TSS, and total nutrient bottles were filled and submitted for analysis from the flow-weighted sample, and only metal bottles from the two time-composite samples. Average discharge associated with the first group was 22 ft3/s, with the second group was 24 ft3/s, and with the third group was 7.8 ft3/s. The instantaneous peak discharges at the storm drain during the storm were: 44 ft3/s at 18:27, 34 ft3/s at 19:49, and 26 ft3/s at 20:51 on May 21, 2008; and 44 ft3/s at 02:31 and 15 ftat 04:22 on May 22, 2008.
Xeriscape garden.—An EWI grab sample was collected about 40 to 50 ft upstream of the gageat 12:20, May 22, 2008. The sampling cross section was 18.7 ft wide and was sampled at 1-ft intervalThe discharge measured was 16.6 ft3/s (fig. 10) using a current meter.
The composite sample was collected from 23:38 on May 21 to 00:44 on May 22, 2008. The flow-weighted composite sample was made from nine samples, with the first five samples collected over about 7 minutes. The average discharge associated with the composite sample was 51 ft3/s. Peak flow was 69 ft3/s at 23:41 on May 21, 2007. A smaller peak of 38 ft3/s preceded the larger peak at 20:11.
12
Quarantine.—A grab sample was collected near the gage at 14:20 on May 22, 2008 (fig.11). Stream width was 14 ft at the cross-section, and the EWI method was used, collecting subsamples every1 ft. A discharge of 10.6 ft3/s was m
easured just prior to sampling. A QA/QC duplicate analysis of the
sample
record o
ft /s at
the year at Storm drain C, three times at Xeriscape garden, and once at ontamination of the sampling lines may have occurred at the Quarantine
site pri . efore
and the highest instantaneous discharge was 65 ft /s at 11:30 December 7, 2007. Fifty-eight days had zero flow, and the longest period of zero flow was 11 days, from July 4 through July 14, 2007.
was analyzed at NWQL. The time-composite sample was created by combining only two samples collected within a few
minutes of each other at 20:31 and 20:33 on May 21, 2008. Five samples were triggered, based on the from the logger and sampler; however, the last three samples were found empty. Since only tw
samples were processed, there was not enough water to perform all composite analyses. The volume was sufficient only for total metals, TSS, and whole-water nutrient analyses. The peak flow for the storm was 63 ft3/s at 20:31 on May 21, 2008, followed by two smaller peaks at 53 ft3/s at 00:15 and 40
3 03:48 on May 22, 2008. Average discharge associated with the composite sample was 62 ft3/s.
Quality Assurance Field and laboratory quality-assurance procedures were implemented as described in the DOT
Storm Water Monitoring Program Plan (State of Hawaii Department of Transportation Highways Division, 2007). Three QA/QC samples were analyzed: two field-duplicate samples collected during thetwo storms, and one laboratory-duplicate sample. Four inorganic-blank-water (IBW) samples were collected at Storm drain C on August 9, 2007; however, the samples arrived at the NWQL too warm for analysis, and these samples were discarded. Results for the duplicate samples are not published in this report but are available from the USGS Pacific Islands Water Science Center upon request.
All grab-sample-collection equipment was cleaned prior to use. Automatic sampler intake lines were cleaned six times during the Quarantine site. Possible c
or to the November 4, 2007 sample, since the sampling lines were not cleaned prior to samplingThe potential for contamination is reduced because the automatic sampler conducts a rinse cycle bcollecting every sample. The rinse cycle routine is as follows: (1) sample line is first purged by air, (2) water is pumped up the line to a sensor located before the pump, (3) water is purged out, and (4) thesample is then collected. Thus, the rinse cycle conditions the intake lines with sample water prior to sample collection, reducing possible contamination from water pumped during earlier storms and from previously pumped samples during the same storm.
H-1 STORM DRAIN
Rainfall and Discharge Data Hydrographs of daily rainfall and daily mean discharge for the period of July 1, 2007, through
June 30, 2008, are shown in figure 12 for the H-1 rain gage and the H-1 storm drain station. Total rainfall at the H-1 rain gage was 27.11 in. during July 1, 2007, through June 30, 2008. The highest recorded daily rainfall was 4.18 in. on November 4, 2007. The highest daily mean discharge at the H-1 storm drain was 6.1 ft3/s, also on November 4, 2007,
3
13

Stormwater Sampling: Conditions and Results June 30, 2008, the flashy nature of the H-1 storm drain ample. Over the year, 18 samples were collected over 4
distinct
in bottles one and two were used for O+G and TPH analysis. The entire contents of bottles three through seven were combined in a HDPE churn for a time-composite sample. A
-sample volume was not large enough to mak
e loads for the composite samples, are shown on table 5 in
d by sampler on October 30, 2007 at 21:45 and 21:56 (fig.14). There was very little discharge
the drain from October 7 to 30. The sampler lines were cleaned on October 3, 2007. Because insufficient water was collected to make a composite sample, each automatic sample was processed
rom the automatic sampler bottles into the 3
During the period July 1, 2007, throughcreated many discharge peaks high enough to s
storms. Two of these 18 samples were QA/QC field duplicates processed concurrently with theenvironmental samples.
Third Quarter 2007—July 1 to September 30, 2007 The hydrographs of discharge (fig. 13) show at least three peak discharges that were high
enough to trigger the sampler: August 2, August 11, and September 1, 2007. Samples were collected during the storm of August 11, 2007.
Storm of August 11, 2007 The H-1 rain gage collected about 0.12 in. of rain on August 11, 2007. Seven samples were
collected by the automatic sampler on August 11, 2007, from 21:06 to 21:24. The H-1 storm drain had little or no flow for 8 days prior to the storm, and the sampler lines were cleaned on August 10, 2007. Water samples collected
field duplicate was split from the sample; however, the compositee a complete field duplicate for all analyses and only nutrient analyses were done. Average
discharge during the sampling was 3.4 ft3/s. Peak discharge during the storm was 4.1 ft3/s at 21:11 on August 11, 2007. Discharge, laboratory measurements of pH and specific-conductance values, constituent concentrations, and averagappendix B.
Fourth Quarter 200—October 1 to December 31, 2007 Hydrographs of discharge and sampled storms during October 1 to December 31, 2007, are
shown in figure 14. More than 10 storms during the fourth quarter 2007 produced sufficient flow to trigger the sampler. Of these storms, samples were collected during those of October 30 and November 1, 2007.
Storm of October 30, 2007 The H-1 rain gage collected 0.17 in. of rainfall on October 30, 2007. Two bottles were fille
the automaticin
separately to create “discrete” samples by pouring the water directly f analysis bottles. Only metals analyses were performed. Discharge was 2.7 ft /s for the 21:45
sample and 1.6 ft3/s for the 21:56 sample. The peak discharge was 9.2 ft3/s at 21:30 on October 30, 2007. Discharge, laboratory measurements of pH and specific-conductance values, constituent concentrations, and loads for the discrete samples, are shown on table 5 in appendix B.
14
Storm of November 1, 2007 The H-1 rain gage collected 0.25 in. of rainfall on October 31, 2007, and 0.52 in. of rainfall on
November 1, 2007. Eight samples were collected by the automatic sampler and the last six were used tomake a composite sample during 06:25 to 06:40 on November 1, 2007 (fig. 14). The sampler linenot cleaned between sample collections on October 30 and November 1, 2007. The entire contents ofbottles three through eight were combined to make a time-composite sample. The composite sample was analyzed for all constituents except for O+G and TPH. Average discharge during the sampling duration was 9.7 ft3/s. Peak discharge during the storm was 12 ft3/s at 06:26 on November 1, 2007. Discharge, laboratory measurements of pH and specific-conductance values, constituent concenand average loads for the composite samples, are shown on table 5 in appendix B.
s were
trations,
y 1 to March 31, 2008
an nine discharge peaks occurred during storm were sampled. Five automatic
sample
le. The sample was assigned a mean time of 20:00. The time-composite sample was processed and analyzed for all constituents. A
s processed for nutrient analysis. Average discharge associa nd
s
during
First Quarter 2008—JanuarHydrographs showing discharge and the storms sampled during January 1 to March 31, 2008,
are shown in figure 15. Storms during January 28-29 and February 7 had sufficient discharge to trigger the automatic samplers. Only the storm of January 28-29 was sampled.
Storm of January 28 and 29, 2008 The H-1 rain gage collected 0.27 in. and 1.45 in. of rainfall on January 28 and 29, 2008,
respectively. Fifteen bottles, associated with multiple peak discharges, were filled by the automatic sampler during 17:24 January 28 to 09:34 January 29, 2008. The period prior to the rainfall of January 28 was relatively dry; a small amount of discharge was measured in the H-1 storm drain on January 25, 2008. Sampler lines were cleaned on January 11, 2008. More thJanuary 28-30, 2008, and only peaks during the first half of the
s were collected on January 28, 2008, and the first two samples, collected at 17:21 and 17:24, were used for O+G and TPH analyses. The entire contents of bottles three through five, collected at 22:34, 22:37, and 22:40, were combined to make a time-composite samp
field duplicate of the composite sample wated with the composite sample was 3.8 ft3/s. Discharge, laboratory measurements of pH a
specific-conductance values, constituent concentrations, and average loads for the time-composite samples, are shown on table 5 in appendix B.
The remaining 10 samples, collected on January 29, 2008, during 04:25 to 09:34, were processed separately as discrete samples for nutrient and total metals analyses only. Discharge associated with these 10 automatic samples ranged from 2.4 ft3/s to 13 ft3/s (fig. 15). Discharge, laboratory measurements of pH and specific-conductance values, constituent concentrations, and loadfor the discrete samples, are shown on table 5 in appendix B.
Second Quarter 2008—April 1 to June 30, 2008 Two storms caused enough runoff to trigger the automatic sampler at the H-1 storm drain
second quarter 2008; they were on April 6 and June 7, 2008. The April 6, 2008, storm was sampled.Hydrographs of discharge during April 1 to June 30, 2008 and details for the sampled storm during April 6, 2008 are shown in figure 16.
15

Storm of April 6, 2008 Rainfall on April 2, 3, 5, and 6 caused discharge in the storm drain. The H-1 rain gage collected
tively. Discharge peaks were less than 1.1 matic sampler during 09:06 to 09:24 on
April 6
r discharge associated with the time-composite sample was 5.5
3 3/s at 09:08 on April 6, 2008. Discharge, laboratory measurements of pH alues, constituent concentrations, and average loads for the time-composite
sample
008, the relative percent difference between the duplicate sample ranged from 0 to 50 percent, with 3 constituents at 0 percent and ent difference. The total Kjeldahl (ammonia plus organic) nitrogen
values sults
automa
0.11 in. and 0.36 in. of rainfall on April 5 and 6, 2008, respecft3/s on April 2, 3 and 5. Seven bottles were filled by the auto
, 2008. Sampler lines were cleaned on April 4, 2008. Samples collected in bottles one and two were used for O+G and TPH analysis. The entire contents of bottles three through seven were used tomake a time-composite sample. The composite sample was processed for all constituents required fothe H-1 storm drain sampling. Averageft /s. Peak discharge was 7.7 ftand specific-conductance v
s, are shown on table 5 in appendix B.
Quality Assurance Field and laboratory quality-assurance procedures were implemented as described in the DOT
Storm Water Monitoring Program Plan (State of Hawaii Department of Transportation Highways Division, 2007). Two QA/QC samples were collected concurrently with the composite samples, one onAugust 11, 2007, and the other on January 28, 2008. Two field duplicate samples were collected and analyzed for nutrients. For the storm of August 11, 2007, the relative percent difference between the duplicate sample and the environmental sample ranged from 0 to 16 percent for the six nutrient determinations. For the storm of January 28, 2sample and the environmental one each at 11, 20, and 50 perc
differed by 50 percent (4.5 and 9.1 mg/L). The total phosphorus values differed by 20 percent (1.75 and 2.2 mg/L). Data were not reviewed in time to order a reanalysis of these constituents. Refor other analytes for the duplicate sample are not published in this report, but are available from the USGS Pacific Islands Water Science Center upon request.
Contamination of the sampling lines may have occurred at the H-1 storm drain prior to the collection of some of the samples. Maintaining a clean sampling line is challenging; discharge in the storm drain is flashy and triggers the sampler during most storms. The potential for contamination is reduced, however, because the automatic sampler conducts a rinse cycle before collecting every sample.
IBW field-blank samples from the automatic sampler were collected at the H-1 storm drain on August 10, 2007. Intake lines were cleaned prior to the collection of IBW field-blank samples. Three different types of field-blank samples were collected: (1) a source-solution trip sample (a blank-water sample is transported to the sampling site and back), (2) an equipment blank sample exposed to the sampling lines, and (3) an equipment blank sample exposed to the LDPE bags that line the bottles in the
tic sampler. The only element detected was lead at 0.1 μg/L in the equipment blank for the LDPE sample bag. Lead was not detected in the source solution trip sample or the equipment blank sample exposed to the sampling lines.
16

References Cited Childress, C.J.O., Foreman, W.T., Connor, B.F., and Maloney, T.J., 1999, New reporting procedures
based on long-term method detection levels and some considerations for interpretations of water-quality data provided by the U.S. Geological Survey National Water Quality Laboratory: U.S.
ile Report 99-193, 19 p.
S.
es
G nal n of elements in whole-water digests using inductively
G ination of elements in natural-water, biota,
8 p.
Pa ater
ated colorimetric finish that include dialysis: U.S. Geological Survey Open-File Report 94-455,
nt of
Geological Survey Open-F
Fishman, M.J., ed., 1993, Methods of analysis by the U.S. Geological Survey National Water Quality Laboratory—Determination of inorganic and organic constituents in water and fluvial sediments: U.Geological Survey Open-File Report 93-125, 217 p.
Fishman, M.J., and Friedman, L.C., eds., 1989, Methods for determination of inorganic substances in water and fluvial sediments (3d ed.): U.S. Geological Survey Techniques of Water-Resources Investigations, book 5, chap. A1, 545 p.
Friedman, L.C., and Erdmann, D.E., 1982, Quality assurance practices for the chemical and biologicalanalyses of water and fluvial sediments: U.S. Geological Survey Techniques of Water-ResourcInvestigations, book 5, chap. A6, 181 p.
arbarino, J.R., and Struzeski, T.M., 1998, Methods of analysis by the U.S. Geological Survey NatioWater Quality Laboratory—Determinatiocoupled plasma- optical emission spectrometry and inductively coupled plasma-mass spectrometry: U.S. Geological Survey Open-File Report 98-165, 101 p.
arbarino, J.R., Kanagy, L.K., and Cree, M.E., 2006, Determsediment and soil samples using collision/reaction cell inductively coupled plasma-mass spectrometry: U.S. Geological Survey Techniques and Methods, book 5, sec. B, chap.1, 8
Hoffman, G.L., Fishman, M.J., and Garbarino, J.R., 1996, Methods of analysis by the U.S. Geological Survey National Water Quality Laboratory—In-bottle acid digestion of whole-water samples: U.S. Geological Survey Open-File Report 96-225, 28 p.
tton, C.J., and Truitt, E.P., 1992, Methods of analysis by the U.S. Geological Survey National WQuality Laboratory—Determination of total phosphorus by a Kjeldahl digestion method and an autom42 p.
Pritt, J.W., and Raese, J.W., eds., 1992, Quality assurance/quality control manual National Water Quality Laboratory: U.S. Geological Survey Open-File Report 94-708, 26 p.
Rantz, S.E., and others, 1982, Measurement and computation of streamflow, Volume 1. Measuremestage and discharge, Volume 2. Computation of discharge: U.S. Geological Survey Water-Supply Paper 2175, 284 p. and 346 p.
Sauer, V.B., 2002, Standards for the analysis and processing of surface-water data and information using electronic methods: U.S. Geological Survey Water-Resources Investigations Report 01-4044, 92 p.
17

State of Hawaii Department of Transportation Highways Division, 2007, Annual storm water monitoring program plan 2007-2008, 20 p.
U.S. Environmental Protection Agency, Office of Water, 1993, NPDES storm water sampling gumanual, prepared by C.K. Smoley: CRC Press, Inc., 165 p.
idance
.S. Environmental Protection Agency, Region 9, and Hawaii Department of Health, 2002, Revisions to total maximum daily loads for the Ala Wai Canal, Island of Oahu, Hawaii: 37 p. [http://hawaii.gov/health/environmental/env-planning/wqm/awtmdlfinal.pdf, accessed 07/15/2008]
Wilde, F.D., Radtke, D.B., Gibs, Jacob, and Iwatsubo, R.T., 1998, National field manual for the collection of water-quality data: U.S. Geological Survey Techniques of Water-Resources Investigations, book 9, chap. A4, 114 p.
U
18
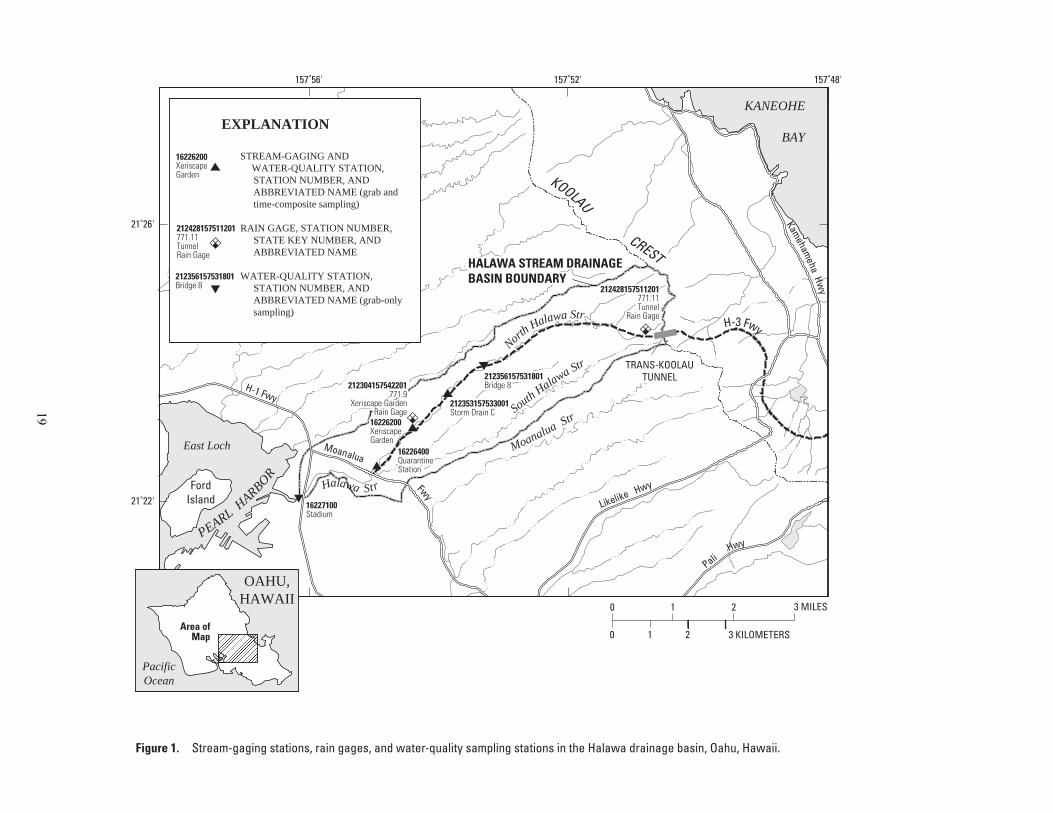
Figure 1. Stream-gaging stations, rain gages, and water-quality sampling stations in the Halawa drainage basin, Oahu, Hawaii.
South
Halawa Str
Halawa Str
North
Halawa Str
Moanalua Str
East Loch
PEARLHARBO
R
KANEOHE
BAY
212304157542201771.9
Xeriscape GardenRain Gage
16226400QuarantineStation
212353157533001Storm Drain C
212356157531801Bridge 8
16226200XeriscapeGarden
212428157511201771.11Tunnel
Rain Gage
HALAWA DRAINAGEBASIN BOUNDARY
212304157542201771.9
Xeriscape GardenRain Gage
16226400QuarantineStation
212353157533001Storm Drain C
212356157531801Bridge 8
21˚22'
21˚26'
157˚52'157˚56' 157˚48'
0
0
3 MILES2
2 3 KILOMETERS
1
1
H-3 Fwy
STREAM-GAGING ANDWATER-QUALITY STATION,STATION NUMBER, ANDABBREVIATED NAME (grab andtime-composite sampling)
RAIN GAGE, STATION NUMBER,STATE KEY NUMBER, ANDABBREVIATED NAME
WATER-QUALITY STATION,STATION NUMBER, ANDABBREVIATED NAME (grab-onlysampling)
TRANS-KOOLAUTUNNEL
KOOLAU
CREST
EXPLANATION
Kameham
ehaHw
y
H-1 Fwy
Moanalua
Fwy
Likelike Hwy
PaliHwy
FordIsland
16226200XeriscapeGarden
16227100Stadium
16226200XeriscapeGarden
212428157511201771.11Tunnel
Rain Gage
212428157511201771.11TunnelRain Gage
212356157531801Bridge 8
HALAWA STREAM DRAINAGEBASIN BOUNDARY
Area ofMap
OAHU,HAWAII
PacificOcean
19
PALOLO VALLEY
KAIMUKI AREA
H-1 FREEWAY
WAIALAE AVENUE
HARDING AVENUE
KOKO
HEA
D AV
ENUEKA
PAHU
LU A
VEN
UE
KAPIOLANI BLVD
Man
oa S
tream
Palolo Stream
GAGING AND WATER-QUALITY STATION,STATION NUMBER, ANDABBREVIATED NAME
RAIN GAGE, STATION NUMBER,
DRAINAGE AREA (Based on
STATE KEY NUMBER, AND
State of Hawaii Department ofTransportaion, 2008)
ABBREVIATED NAME
EXPLANATION
211722157485601H-1 Storm Drain
211722157485602711.7H-1 Rain Gage
211722157485602711.7
H-1 Rain Gage
211722157485601H-1 Storm Drain
H-1 STORM DRAIN DRAINAGE AREA
KING STREET
157°49' 157°48'30" 157°48'
21°16'30"
21°17'
21°17'30"
0
0 250 500 METERS
1,000 2,000500 FEET
Figure 2. Drainage area of the H-1 storm drain and location of the H-1 rain gage, H-1 storm drain gage and sampling site, Oahu, Hawaii.
Modified from U.S. Geological Survey National Hydrography Dataset. Universal Transverse Mercator projection, Zone 4, NAD 83 datum.
OAHUPACIFIC OCEAN
Area of Map
20

TUNNEL RAIN GAGE (212428157511201)DA
ILY
MEA
N D
ISCH
ARGE
, IN
CUB
IC F
EET
PER
SECO
ND
DAIL
Y RA
INFA
LL, I
N IN
CHES
XERISCAPE GARDEN (16226200)
QUARANTINE STATION (16226400)
No data
July Aug Sept2007
Oct Nov Dec Jan Feb Mar Apr May June2008
July Aug Sept2007
Oct Nov Dec Jan Feb Mar Apr May June2008
Figure 3. Rainfall and discharge for stations within the Halawa Stream drainage basin, Oahu, Hawaii,for July 1, 2007, to June 30, 2008.
XERISCAPE GARDEN RAIN GAGE (212304157542201)
STORM DRAIN C (212353157533001)
0
2
4
6
8
10
0
2
4
6
8
10
0
100
200
300
400
0
100
200
300
400
0
5
10
15
20
21

0
10
20
30
40
0
20
40
60
80
100
0
20
40
60
80
100
STORM DRAIN C (212353157533001) JULY 1 TO SEPTEMBER 30, 2007
DISC
HARG
E, IN
CUB
IC F
EET
PER
SECO
ND
Figure 4. Discharge at Storm Drain C (212353157533001), and stream discharge at Xeriscapegarden (16226200) and Quarantine station (16226400), for July 1 to September 30, 2007, Oahu, Hawaii.
XERISCAPE GARDEN (16226200)JULY 1 TO SEPTEMBER 30, 2007
QUARANTINE STATION (16226400)JULY 1 TO SEPTEMBER 30, 2007
July 2007 August 2007 September 2007
July 2007 August 2007 September 2007
July 2007 August 2007 September 2007July 2007 August 2007 September 2007
22
0
50
100
150
200
0
50
100
150
200
0
50
100
150
200
October 2007 November 2007 December 2007
STORM DRAIN C (212353157533001)OCTOBER 1 TO DECEMBER 31, 2007
11/01/2007
DISC
HARG
E, IN
CUB
IC F
EET
PER
SECO
ND
20:00 00:00 04:00 08:00 12:00 16:00 20:00
Figure 5. Discharge at Storm drain C (212353157533001) for October 1 to December 31, 2007; detail of 5-day period from November 1 to 5, 2007; and detail of 24-hour period from 20:00 November 3 to 20:00 November 4, 2007, Oahu, Hawaii.
STORM DRAIN C (212353157533001)STORM OF NOVEMBER 4, 2007
GRAB SAMPLE COLLECTEDAT 11:06, NOVEMBER 4, 2007
COMPOSITE SAMPLE COLLECTEDFROM 00:15 TO 03:13, NOVEMBER 4, 2007
STORM DRAIN C (212353157533001)STORM OF NOVEMBER 4, 2007
11/02/2007 11/03/2007 11/04/2007 11/05/2007
11/04/200711/03/2007
DISCHARGEPOINT ON HYDROGRAPH AT WHICHBOTTLE FILLED FOR COMPOSITE SAMPLEPOINT ON HYDROGRAPH AT WHICH GRAB SAMPLE WAS COLLECTED
23

0
200
400
600
800
1,000
1,200
1,400
1,600
1,800
October 2007 November 2007 December 2007
XERISCAPE GARDEN (16226200)OCTOBER 1 TO DECEMBER 31, 2007
DISCHARGEPOINT ON HYDROGRAPH AT WHICHBOTTLE FILLED FOR COMPOSITE SAMPLEPOINT ON HYDROGRAPH AT WHICH GRAB SAMPLE WAS COLLECTED
11/01/2007
DISC
HARG
E, IN
CUB
IC F
EET
PER
SECO
ND
20:00 00:00 04:00 08:00 12:00 16:00 20:00
Figure 6. Stream discharge at Xeriscape garden station (16226200) for October 1 to December 31, 2007; detail of 5-day period from November 1 to 5, 2007; and detail of 24-hour period from 20:00 November 3 to 20:00 November 4, 2007, Oahu, Hawaii.
XERISCAPE GARDEN (16226200)STORM OF NOVEMBER 4, 2007
GRAB SAMPLE COLLECTEDAT 12:06, NOVEMBER 4, 2007
COMPOSITE SAMPLE COLLECTEDFROM 01:16 TO 02:41, NOVEMBER 4, 2007
XERISCAPE GARDEN (16226200)STORM OF NOVEMBER 4, 2007
11/02/2007 11/03/2007 11/04/2007 11/05/2007
AUTOMATIC SAMPLER FILLED 13 BOTTLES ON NOVEMBER 2. 2008 SAMPLES NOT USED
11/04/200711/03/2007
0
200
400
600
800
1,000
1,200
1,400
1,600
1,800
0
200
400
600
800
1,000
1,200
1,400
1,600
1,800
24
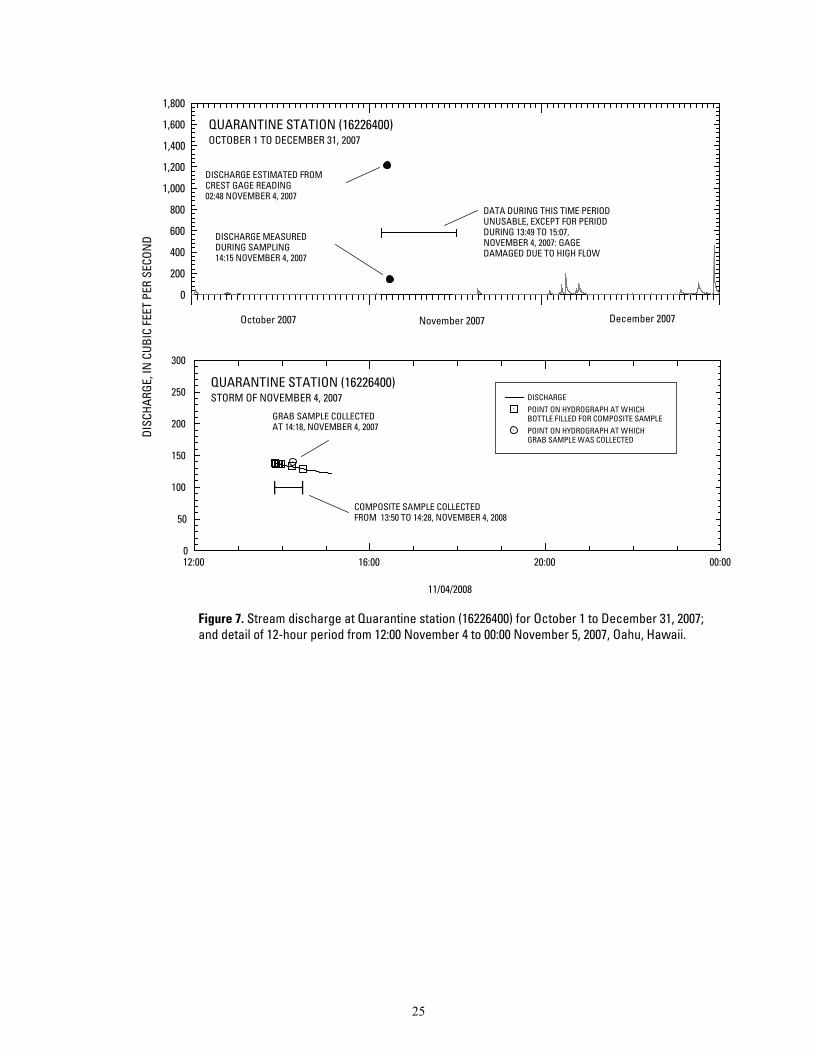
October 2007 November 2007 December 2007
QUARANTINE STATION (16226400)OCTOBER 1 TO DECEMBER 31, 2007
DISC
HARG
E, IN
CUB
IC F
EET
PER
SECO
ND
Figure 7. Stream discharge at Quarantine station (16226400) for October 1 to December 31, 2007; and detail of 12-hour period from 12:00 November 4 to 00:00 November 5, 2007, Oahu, Hawaii.
DISCHARGE ESTIMATED FROM CREST GAGE READING02:48 NOVEMBER 4, 2007
DISCHARGE MEASUREDDURING SAMPLING14:15 NOVEMBER 4, 2007
DATA DURING THIS TIME PERIODUNUSABLE, EXCEPT FOR PERIOD DURING 13:49 TO 15:07, NOVEMBER 4, 2007: GAGEDAMAGED DUE TO HIGH FLOW
12:00 16:00 20:00 00:000
50
100
150
200
250
300
DISCHARGEPOINT ON HYDROGRAPH AT WHICHBOTTLE FILLED FOR COMPOSITE SAMPLEPOINT ON HYDROGRAPH AT WHICHGRAB SAMPLE WAS COLLECTED
COMPOSITE SAMPLE COLLECTEDFROM 13:50 TO 14:28, NOVEMBER 4, 2008
11/04/2008
QUARANTINE STATION (16226400)STORM OF NOVEMBER 4, 2007
GRAB SAMPLE COLLECTEDAT 14:18, NOVEMBER 4, 2007
0
200
400
600
800
1,000
1,200
1,400
1,600
1,800
25
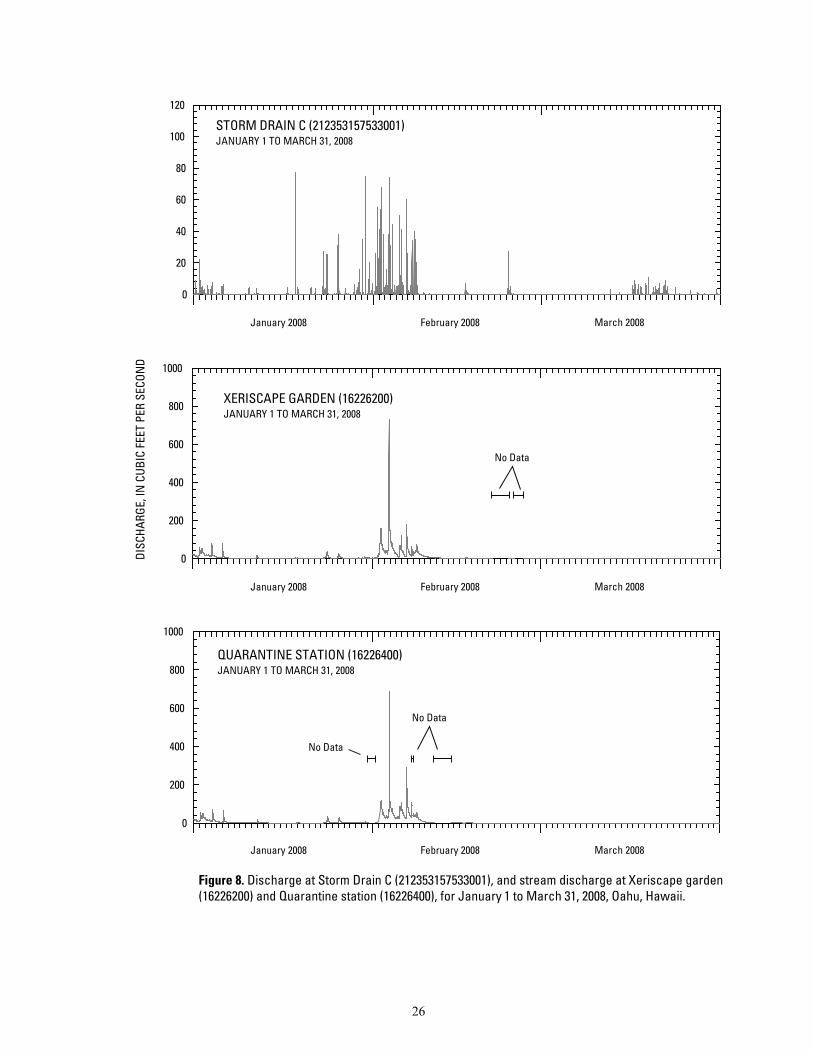
January 2008 February 2008 March 2008
January 2008 February 2008 March 2008
STORM DRAIN C (212353157533001)JANUARY 1 TO MARCH 31, 2008
DISC
HARG
E, IN
CUB
IC F
EET
PER
SECO
ND
Figure 8. Discharge at Storm Drain C (212353157533001), and stream discharge at Xeriscape garden(16226200) and Quarantine station (16226400), for January 1 to March 31, 2008, Oahu, Hawaii.
XERISCAPE GARDEN (16226200)JANUARY 1 TO MARCH 31, 2008
QUARANTINE STATION (16226400)JANUARY 1 TO MARCH 31, 2008
January 2008 February 2008 March 2008
0
20
40
60
80
100
120
No Data
No Data
No Data
0
200
400
600
800
1000
0
200
400
600
800
1000
26

0
20
40
60
80
100
April 2008 May 2008 June 2008
STORM DRAIN C (212353157533001)APRIL 1 TO JUNE 30, 2008
DISC
HARG
E, IN
CUB
IC F
EET
PER
SECO
ND
16:00 20:00 00:00 04:00 08:00 12:00 16:00
Figure 9. Discharge at Storm drain C (212353157533001) for April 1 to June 30, 2008; detail of 3-day period from May 21 to 23, 2008; and detail of 24-hour period from 16:00 May 21 to 16:00 May 22, 2008, Oahu, Hawaii.
05/21/2008 05/22/2008
0
10
20
30
40
50
60
70
DISCHARGEPOINT ON HYDROGRAPH AT WHICHBOTTLE FILLED FOR FIRST COMPOSITE SAMPLEPOINT ON HYDROGRAPH AT WHICHBOTTLE FILLED FOR SECOND COMPOSITE SAMPLEPOINT ON HYDROGRAPH AT WHCHBOTTLE FILLED FOR THIRDCOMPOSITE SAMPLE
0
10
20
30
40
50
60
70
05/21/2008 05/22/2008 05/23/2008
AUTOMATIC SAMPLER FILLED FOURBOTTLES; 20:06 TO 21:21 MAY 21, 2008, FOR COMPOSITE SAMPLE
STORM DRAIN C (212353157533001)STORM OF MAY 21-22, 2008
AUTOMATIC SAMPLER FILLED TWOBOTTLES; 02:25 AND 02:41 MAY 22, 2008, FOR COMPOSITE SAMPLE
AUTOMATIC SAMPLER FILLED TWOBOTTLES; 04:03 AND 04:21 MAY 22, 2008,FOR COMPOSITE SAMPLE
STORM DRAIN C (212353157533001)STORM OF MAY 21-22, 2008
27

0
100
200
300
400
0
20
40
60
80
100
0
20
40
60
80
100
April 2008 May 2008 June 2008
XERISCAPE GARDEN (16226200)APRIL 1 TO JUNE 30, 2008
05/18/2008
DISC
HARG
E, IN
CUB
IC F
EET
PER
SECO
ND
16:00 20:00 00:00 04:00 08:00 12:00 16:00 20:00
XERISCAPE GARDEN (16226200)STORM OF MAY 21-22, 2008
GRAB SAMPLE COLLECTEDAT 12:20, MAY 22, 2008
COMPOSITE SAMPLE COLLECTEDFROM 23:38 MAY 21TO 00:44, MAY 22, 2008
XERISCAPE GARDEN (16226200)STORM OF MAY 21-22, 2008
05/20/2008 05/22/2008 05/24/2008
05/22/200805/21/2008
DISCHARGEPOINT ON HYDROGRAPH AT WHICHBOTTLE FILLED FOR COMPOSITE SAMPLEPOINT ON HYDROGRAPH AT WHICH GRAB SAMPLE WAS COLLECTED
Figure 10. Stream discharge at Xeriscape garden station (16226200) for April 1 to June 30, 2008; detail of 7-day period from May 18 to 24, 2008; and detail of 30-hour period from 16:00 May 21 to 22:00 May 22, 2008, Oahu, Hawaii.
28

April 2008 May 2008 June 2008
0
20
40
60
80
100
DISCHARGEPOINT ON HYDROGRAPH AT WHICHBOTTLE FILLED FOR COMPOSITE SAMPLEPOINT ON HYDROGRAPH AT WHICHGRAB SAMPLE WAS COLLECTED
DISC
HARG
E, IN
CUB
IC F
EET
PER
SECO
ND
16:00 20:00 00:00 04:00 08:00 12:00 16:000
20
40
60
80
100
Figure 11. Stream discharge at Quarantine station (16226400) for April 1 to June 30, 2008; detailof 3-day period from May 21 to 23, 2008; and detail of 24-hour period from 16:00 May 21 to 16:00 May 22, 2008, Oahu, Hawaii.
AUTOMATIC SAMPLER FILLED TWOBOTTLES; 20:31 AND 20:33, MAY 21, 2008. WATER FROM BOTH BOTTLES COMBINEDFOR SAMPLE
QUARANTINE STATION (16226400)STORM OF MAY 21-22, 2008
QUARANTINE STATION (16226400)STORM OF MAY 21-22, 2008
GRAB SAMPLE COLLECTEDAT 14:20 MAY 22, 2008
05/21/2008 05/22/2008 05/23/2008
05/21/2008 05/22/2008
0
50
100
150
200
QUARANTINE STATION (16226400)APRIL 1 TO JUNE 30, 2008
29

0
2
4
6
8
10
0
1
2
3
4
5
6
H-1 RAIN GAGE (211722157485602)
DAIL
Y M
EAN
DIS
CHAR
GE,
IN C
UBIC
FEE
T PE
R SE
CON
DDA
ILY
RAIN
FALL
,IN
INCH
ES
H-1 STORM DRAIN (211722157485601)
Figure 12. Rainfall for H-1 rain gage and discharge for H-1 storm drain, Oahu, Hawaii, for July 1, 2007, to June 30, 2008.
July Aug Sept Oct Nov Dec Jan Feb Mar Apr May June
2007 2008
July Aug Sept Oct Nov Dec Jan Feb Mar Apr May June
2007 2008
30
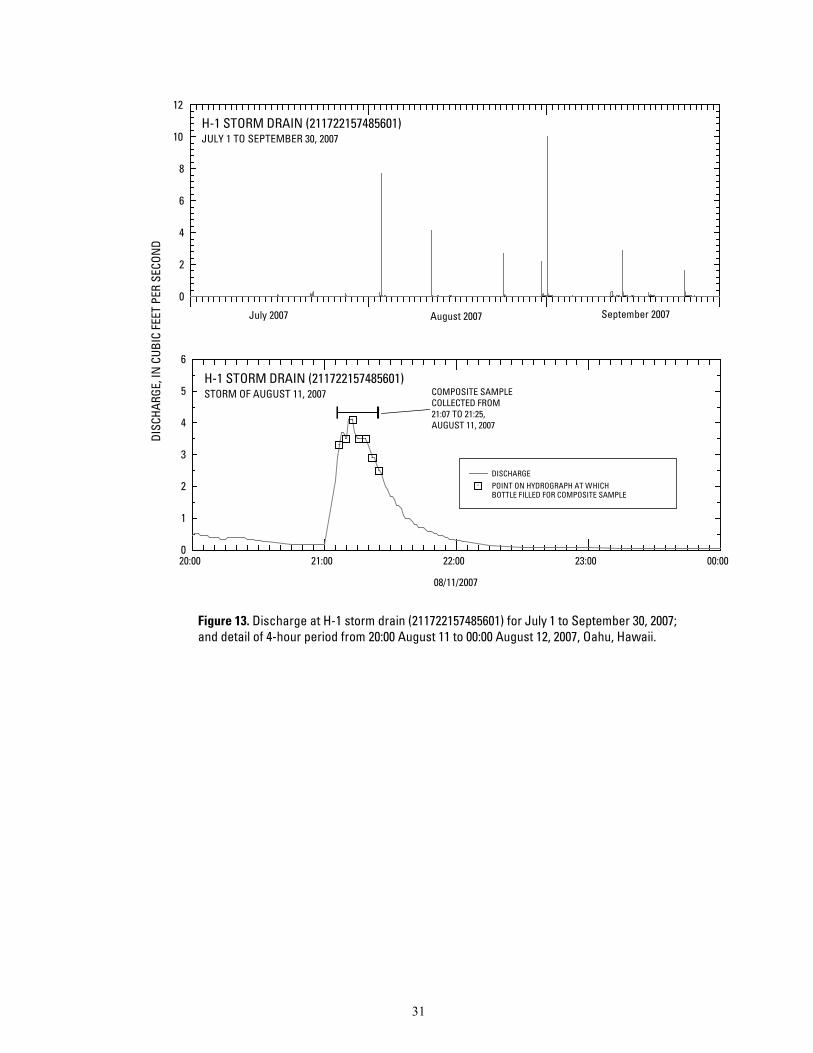
DISCHARGEPOINT ON HYDROGRAPH AT WHICH BOTTLE FILLED FOR COMPOSITE SAMPLE
COMPOSITE SAMPLECOLLECTED FROM 21:07 TO 21:25, AUGUST 11, 2007
H-1 STORM DRAIN (211722157485601)JULY 1 TO SEPTEMBER 30, 2007
H-1 STORM DRAIN (211722157485601)STORM OF AUGUST 11, 2007
July 2007 August 2007 September 2007
DISC
HARG
E, IN
CUB
IC F
EET
PER
SECO
ND
20:00 21:00 22:00 23:00 00:00
Figure 13. Discharge at H-1 storm drain (211722157485601) for July 1 to September 30, 2007; and detail of 4-hour period from 20:00 August 11 to 00:00 August 12, 2007, Oahu, Hawaii.
08/11/2007
0
2
4
6
8
10
12
0
1
2
3
4
5
6
31
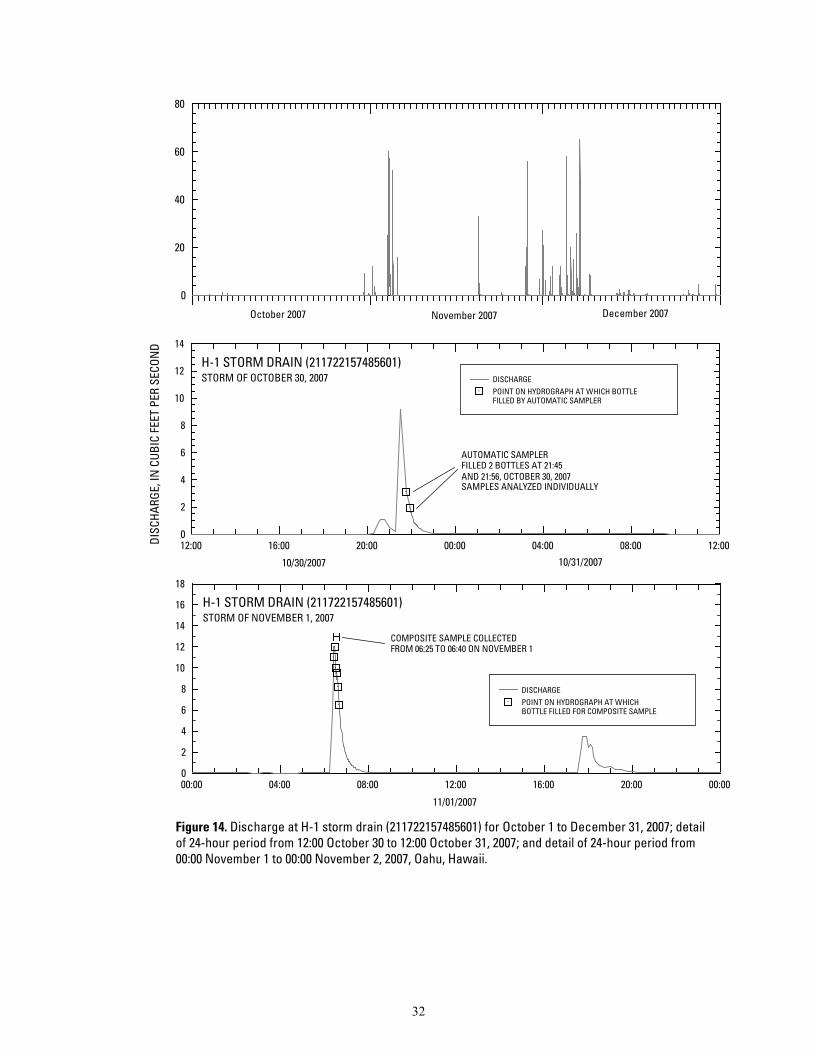
0
20
40
60
80
0
2
4
6
8
10
12
14
0
2
4
6
8
10
12
14
16
18
DISCHARGEPOINT ON HYDROGRAPH AT WHICHBOTTLE FILLED FOR COMPOSITE SAMPLE
DISCHARGEPOINT ON HYDROGRAPH AT WHICH BOTTLE FILLED BY AUTOMATIC SAMPLER
AUTOMATIC SAMPLER FILLED 2 BOTTLES AT 21:45 AND 21:56, OCTOBER 30, 2007SAMPLES ANALYZED INDIVIDUALLY
H-1 STORM DRAIN (211722157485601)STORM OF OCTOBER 30, 2007
COMPOSITE SAMPLE COLLECTEDFROM 06:25 TO 06:40 ON NOVEMBER 1
H-1 STORM DRAIN (211722157485601)STORM OF NOVEMBER 1, 2007
DISC
HARG
E, IN
CUB
IC F
EET
PER
SECO
ND
October 2007 November 2007 December 2007
12:00
00:00 04:00 08:00 12:00 16:00 20:00 00:00
Figure 14. Discharge at H-1 storm drain (211722157485601) for October 1 to December 31, 2007; detail of 24-hour period from 12:00 October 30 to 12:00 October 31, 2007; and detail of 24-hour period from 00:00 November 1 to 00:00 November 2, 2007, Oahu, Hawaii.
11/01/2007
16:00 20:00 00:00 04:00 08:00 12:00
10/30/2007 10/31/2007
32

0
10
20
30
40
January 2008 February 2008 March 2008
H-1 STORM DRAIN (211722157485601)JANUARY 1 TO MARCH 31, 2008
00:00 12:00 00:00 12:00 00:00 12:00 00:000
10
20
30
40
DISCHARGEPOINT ON HYDROGRAPH AT WHICH BOTTLE FILLED FOR COMPOSITE SAMPLE POINT ON HYDROGRAPH AT WHICH BOTTLE FILLED FOR DISCRETE SAMPLES
DISC
HARG
E, IN
CUB
IC F
EET
PER
SECO
ND
20:00 00:00 04:00 08:00 12:00 16:000
10
20
30
40
Figure 15. Discharge at H-1 storm drain (211722157485601) for January 1 to March 31, 2008; detail of 3-day period from January 28 to 30, 2008; and detail of 20-hour period from 20:00 January 28 to 16:00 January 29, 2008, Oahu, Hawaii.
01/28/2008
AUTOMATIC SAMPLER FILLED 3 BOTTLES AT 22:34, 22:37 AND 22:40 ON JANUARY 28, 2008: FOR TIME-COMPOSITE SAMPLE.
01/29/2008
H-1 STORM DRAIN (211722157485601)STORM OF JANUARY 28, 2008
H-1 STORM DRAIN (211722157485601)STORM OF JANUARY 29, 2008
AUTOMATIC SAMPLER FILLED 10 BOTTLES FROM04:25 TO 09:34 ON JANUARY 29, 2008. SAMPLES ANALYZED ASDISCRETE SAMPLES.
01/29/2008 01/30/2008
01/28/2008
FILLED TWO BOTTLES:
USED FOR OAG AND TPH ANALYSES17:21 AND 17:24 ON JANUARY 28, 2008
AUTOMATIC SAMPLER
33

0
5
10
15
20
0
2
4
6
8
10
April 2008 May 2008 June 2008
H-1 STORM DRAIN (211722157485601)APRIL 1 TO JUNE 30, 2008
02:00 04:00 06:00 08:00 10:00 12:00 14:00 16:00
DISC
HARG
E, IN
CUB
IC F
EET
PER
SECO
ND
Figure 16. Discharge at H-1 storm drain (211722157485601) for April 1 to June 30, 2008; and detail of 14-hour period from 02:00 to 16:00, April 6, 2008, Oahu, Hawaii.
04/06/2008
COMPOSITE SAMPLE COLLECTEDFROM 09:06 TO 09:24, APRIL 6, 2008
H-1 STORM DRAIN (211722157485601)STORM OF APRIL 6, 2008 DISCHARGE
POINT ON HYDROGRAPH AT WHICH BOTTLE FILLED FOR COMPOSITE SAMPLE
34
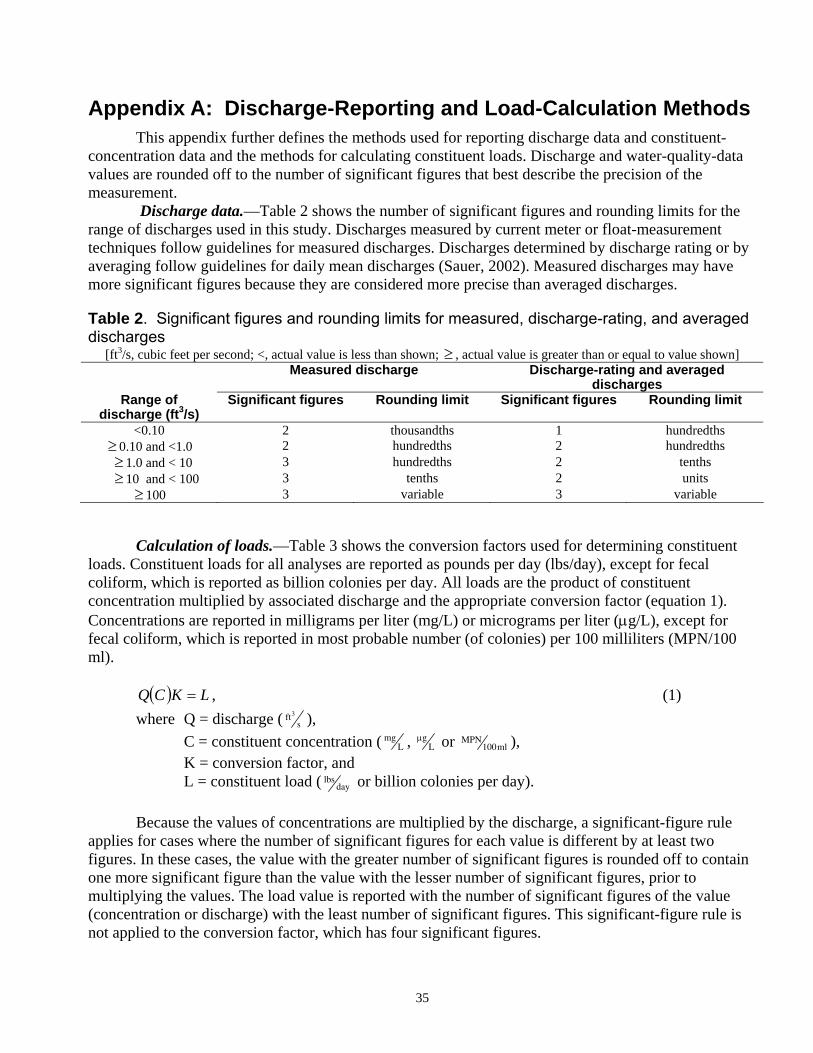
Appendix A: Discharge-Reporting and Load-Calculation Methods This appendix further defines the methods used for reporting discharge data and constituent-
concentration data and the methods for calculating constituent loads. Discharge and water-quality-data values are rounded off to the number of significant figures that best describe the precision of the measurement.
Discharge data.—Table 2 shows the number of significant figures and rounding limits for the range of discharges used in this study. Discharges measured by current meter or float-measurement techniques follow guidelines for measured discharges. Discharges determined by discharge rating or by averaging follow guidelines for daily mean discharges (Sauer, 2002). Measured discharges may have more significant figures because they are considered more precise than averaged discharges.
Table 2. Significant figures and rounding limits for measured, discharge-rating, and averaged
[ft3/s, cubic feet pdischarges
er second; <, actual value is less than shown; ≥ , actual value is greater than or equal to value shown] Measured discharge Discharge-rating and averaged
discharges Range of Significan g limit Sign it t figures Roundin ificant figures Rounding lim
dischar e (ft3/s) g<0.10 2 thousandths 1 hundredths
≥ 0.10 and <1.0 ≥ 1 10
2 hundredths 2 hundredths 3 hundredths 2 tenths .0 and <
≥ 10 and < 100 3 tenths 2 units v≥ 100 3 variable 3 ariable
Calculation of loads.—Table 3 shows the conversion factors used for determining constituent
loads. Constituent loads for all analyses are reported as pounds per day (lbs/day), except for fecal coliform
). t for
, (1) here Q = discharge (
, which is reported as billion colonies per day. All loads are the product of constituent concentration multiplied by associated discharge and the appropriate conversion factor (equation 1Concentrations are reported in milligrams per liter (mg/L) or micrograms per liter (μg/L), excepfecal coliform, which is reported in most probable number (of colonies) per 100 milliliters (MPN/100ml).
( ) LKCQ =
w s
constituent concentration (
ft3 ), C = L
mg , Lgμ or ml100
MPN ), K = conversion torfac , and L = constituent load ( day
lbs or bi n lonie ay)llio co s per d .
trati nificant-figure rule applies for cases where the number of significant figures for each value is different by at least two figures n
ule is
Because the values of concen ons are multiplied by the discharge, a sig
. In these cases, the value with the greater number of significant figures is rounded off to contaione more significant figure than the value with the lesser number of significant figures, prior to multiplying the values. The load value is reported with the number of significant figures of the value (concentration or discharge) with the least number of significant figures. This significant-figure rnot applied to the conversion factor, which has four significant figures.
35
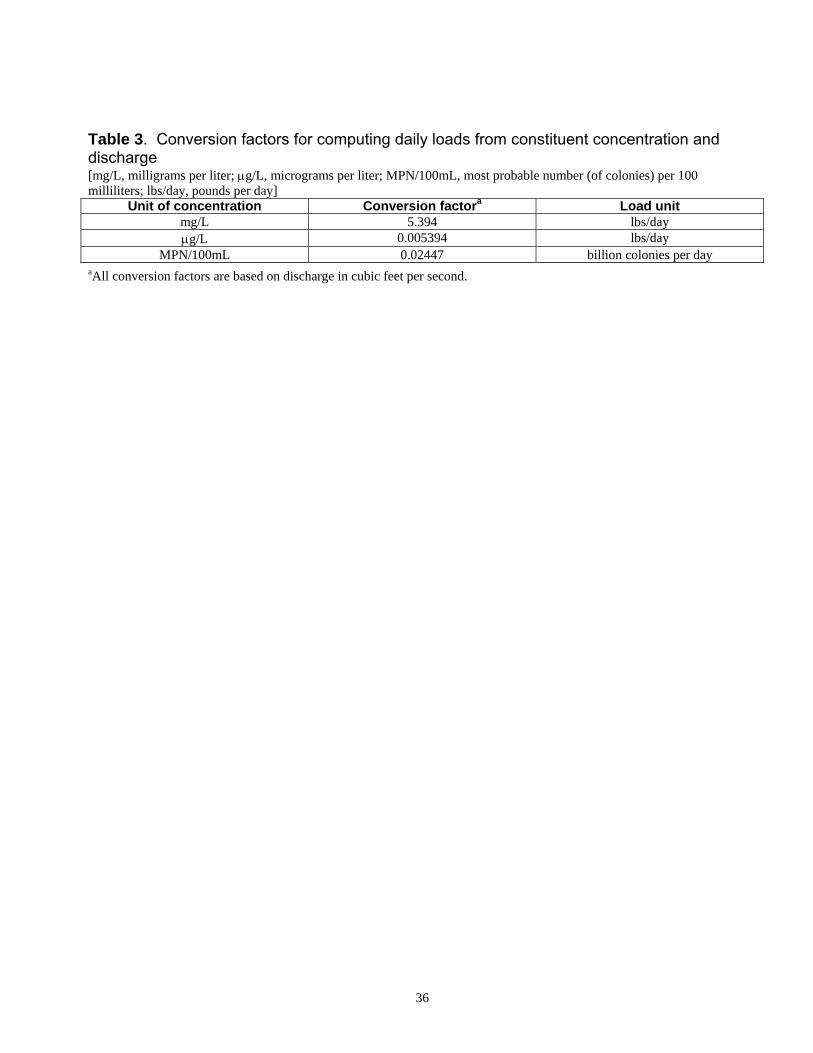
Table 3. Conversion factors for computing daily loads from constituent concentration and ischarge
[mg/L, milligrams per liter; μg/L, micrograms per liter; MPN/100mL, most probable number (of colonies) per 100 milliliters; lbs/day, pounds per day]
d
Unit of concentration Conversion factora Load unit mg/L 5.394 lbs/day μg/L 0.005394 lbs/day
MPN/100mL 0.02447 billion colonies per day aAll conversion factors are based on discharge in cubic feet per second.
36
Appendix B: Physical Properties, Concentrations, and Loads for All Samples Collected from Halawa Stream Drainage Basin and H-1 Storm Drain During the Period from July 1, 2006, to June 30, 2007, Oahu, Hawaii
37

Table 4. Physical properties, concentrations, and loads for all samples collected from Halawa Stream drainage basin during the period from July 1, 2007 to June 30, 2008, Oahu, Hawaii[hh:mm, hours and minutes; Instant., value of instantaneous discharge; Avg., value of average discharge for flow-weighted time-composite samples; Conc., concentration; Load, computed from concentration value and discharge valuefor each sample, loads associated with grab samples are instantaneous loads, loads associated with composite samples are average loads; <, actual value is less than the value shown; ≤, actual value is less than or equal to the value shown;#, discharge value from streamflow rating, all others are measured; e, value is estimated; --, not analyzed or measured; composite, flow-weighted time-composite sample; M, presence of material verified but not quantified; N, nitrogen;
µS/cm, microsiemens per centimeter; ºC, degrees Celsius; ft3/s, cubic feet per second; mg/L,milligrams per liter; lbs/day, pounds per day; µg/L,micrograms per liter; MPN/100 mL, most probable number (of colonies) per 100 milliliters]
Instant. Avg. Conc.(mg/L)
Load(lbs/day)
Conc.(mg/L)
Load(lbs/day)
Storm of November 4, 2007Bridge 8 November 4, 2007 12:53 Grab 167 7.7 120 21.3 96 86,000 88 79,000Storm drain November 4, 2007 01:44 Composite #48 7.5 32 <10. <2,600 16 4,100Storm drain November 4, 2007 11:06 Grab #0.81 7.2 179 23.1 <10. <44 117 510Xeriscape November 4, 2007 01:58 Composite #420. 7.2 80 3670 8,310,000 47 110,000Xeriscape November 4, 2007 12:06 Grab #225 7.4 131 21.2 197 239,000 86 100,000Quarantine November 4, 2007 14:09 Composite #133 7.7 162 59 42,000 104 74,600Quarantine November 4, 2007 14:18 Grab 139 7.6 163 22.6 92 69,000 99 74,000Stadium November 4, 2007 10:43 Grab 1280 7.5 145 21.6 240. 1,660,000 96 660,000
Storm of May 21-22, 2008Bridge 8 May 22, 2008 13:23 Grab 11.8 7.8 129 21.5 <10. <640 108 6,870Storm drain May 21, 2008 20:44 Composite #22 7.7 46 <10. <1,200 -- --Storm drain May 22, 2008 02:33 Composite #24 7.7 42 -- -- -- --Storm drain May 22, 2008 04:12 Composite #7.8 7.7 62 -- -- -- --Xeriscape May 22, 2008 00:11 Composite #51 7.6 93 94 26,000 79 22,000Xeriscape May 22, 2008 12:20 Grab 16.6 7.8 131 21.7 <10. <900 109 9,760Quarantine May 21, 2008 20:32 Composite #62 7.1 139 454 150,000 -- --Quarantine May 22, 2008 14:20 Grab 10.6 8.3 151 22.1 <10. <570 125 7,150
Station name Date Median time (hh:mm)
Sampletype
Discharge(ft3/s)
pH, labreported tonearest 0.1
Specific conductance
(µS/cm at 25ºC)reported to nearest
whole number
Temperature (ºC)reported to
nearest 0.1 ºC
Total suspended solids Total dissolved solids
38

Table 4. Physical properties, concentrations, and loads for all samples collected from Halawa Stream drainage basin during the period from July 1, 2007 to June 30, 2008, Oahu, Hawaii--Continued[hh:mm, hours and minutes; Instant., value of instantaneous discharge; Avg., value of average discharge for flow-weighted time-composite samples; Conc., concentration; Load, computed from concentration value and discharge valuefor each sample, loads associated with grab samples are instantaneous loads, loads associated with composite samples are average loads; <, actual value is less than the value shown; ≤, actual value is less than or equal to the value shown;#, discharge value from streamflow rating, all others are measured; e, value is estimated; --, not analyzed or measured; composite, flow-weighted time-composite sample; M, presence of material verified but not quantified; N, nitrogen;
µS/cm, microsiemens per centimeter; ºC, degrees Celsius; ft3/s, cubic feet per second; mg/L,milligrams per liter; lbs/day, pounds per day; µg/L,micrograms per liter; MPN/100 mL, most probable number (of colonies) per 100 milliliters]
Conc.(mg/L as N)
Load(lbs/day)
Conc.(mg/L as N)
Load(lbs/day)
Conc.(mg/L as N)
Load(lbs/day)
Conc.(mg/L as N)
Load(lbs/day)
Storm of November 4, 2007Bridge 8 November 4, 2007 12:53 Grab e0.57 e510 ≤0.44 ≤400 <0.020 <18 0.44 400Storm drain November 4, 2007 01:44 Composite <0.24 <62 <0.11 <28 0.029 7.5 <0.14 <36Storm drain November 4, 2007 11:06 Grab e1.16 e5.1 e0.15 e0.66 e0.013 e0.057 0.16 0.70Xeriscape November 4, 2007 01:58 Composite e24 e54,000 ≤24 ≤54,000 <0.020 <45 24 54,000Xeriscape November 4, 2007 12:06 Grab e1.38 e1,670 e0.87 e1,100 e0.020 e24 0.89 1,100Quarantine November 4, 2007 14:09 Composite e1.14 e818 e0.48 e340 e0.019 e14 0.50 360Quarantine November 4, 2007 14:18 Grab e1.17 e877 ≤0.55 ≤410 <0.020 <15 0.55 410Stadium November 4, 2007 10:43 Grab e2.2 e15,000 e1.1 e7,600 e0.015 e100 1.1 7,600
Storm of May 21-22, 2008Bridge 8 May 22, 2008 13:23 Grab 0.45 29 ≤0.19 ≤12 <0.020 <1.3 0.19 12Storm drain May 21, 2008 20:44 Composite ≥0.16 ≥19 ≤0.16 ≤19 -- -- 0.16 19Storm drain May 22, 2008 02:33 Composite -- -- -- -- -- -- -- --Storm drain May 22, 2008 04:12 Composite -- -- -- -- -- -- -- --Xeriscape May 22, 2008 00:11 Composite 1.8 500 ≤1.4 ≤390 <0.020 <5.5 1.4 390Xeriscape May 22, 2008 12:20 Grab 0.49 44 ≤0.26 ≤23 <0.020 <1.8 0.26 23Quarantine May 21, 2008 20:32 Composite ≥3.4 ≥1,100 <3.4 <1,100 -- -- 3.4 1,100Quarantine May 22, 2008 14:20 Grab 0.53 30. ≤0.24 ≤14 <0.020 <1.1 0.24 14
Station name Date
Organic nitrogenbTotal nitrogena
Median time (hh:mm)
Sampletype
Ammoniadissolved Nitrogen, total organic + ammonia
39
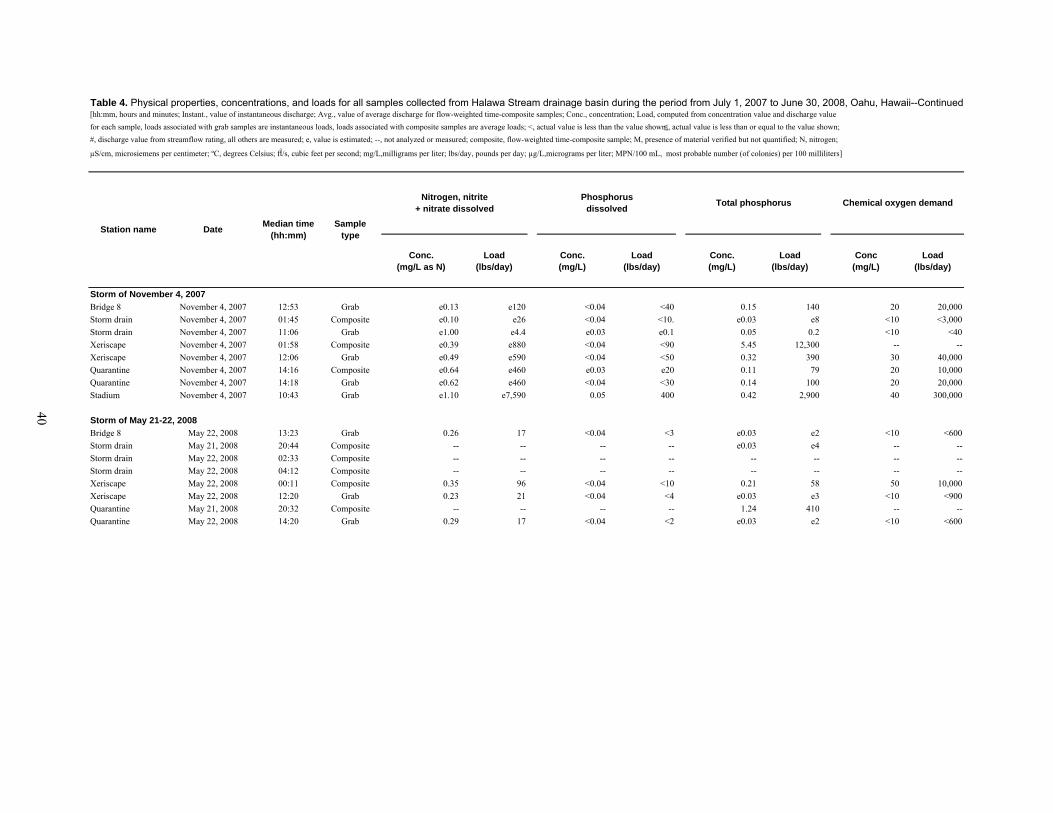
Table 4. Physical properties, concentrations, and loads for all samples collected from Halawa Stream drainage basin during the period from July 1, 2007 to June 30, 2008, Oahu, Hawaii--Continued[hh:mm, hours and minutes; Instant., value of instantaneous discharge; Avg., value of average discharge for flow-weighted time-composite samples; Conc., concentration; Load, computed from concentration value and discharge valuefor each sample, loads associated with grab samples are instantaneous loads, loads associated with composite samples are average loads; <, actual value is less than the value shown; ≤, actual value is less than or equal to the value shown;#, discharge value from streamflow rating, all others are measured; e, value is estimated; --, not analyzed or measured; composite, flow-weighted time-composite sample; M, presence of material verified but not quantified; N, nitrogen;
µS/cm, microsiemens per centimeter; ºC, degrees Celsius; ft3/s, cubic feet per second; mg/L,milligrams per liter; lbs/day, pounds per day; µg/L,micrograms per liter; MPN/100 mL, most probable number (of colonies) per 100 milliliters]
Conc.(mg/L as N)
Load(lbs/day)
Conc.(mg/L)
Load(lbs/day)
Conc.(mg/L)
Load(lbs/day)
Conc(mg/L)
Load(lbs/day)
Storm of November 4, 2007Bridge 8 November 4, 2007 12:53 Grab e0.13 e120 <0.04 <40 0.15 140 20 20,000Storm drain November 4, 2007 01:45 Composite e0.10 e26 <0.04 <10. e0.03 e8 <10 <3,000Storm drain November 4, 2007 11:06 Grab e1.00 e4.4 e0.03 e0.1 0.05 0.2 <10 <40Xeriscape November 4, 2007 01:58 Composite e0.39 e880 <0.04 <90 5.45 12,300 -- --Xeriscape November 4, 2007 12:06 Grab e0.49 e590 <0.04 <50 0.32 390 30 40,000Quarantine November 4, 2007 14:16 Composite e0.64 e460 e0.03 e20 0.11 79 20 10,000Quarantine November 4, 2007 14:18 Grab e0.62 e460 <0.04 <30 0.14 100 20 20,000Stadium November 4, 2007 10:43 Grab e1.10 e7,590 0.05 400 0.42 2,900 40 300,000
Storm of May 21-22, 2008Bridge 8 May 22, 2008 13:23 Grab 0.26 17 <0.04 <3 e0.03 e2 <10 <600Storm drain May 21, 2008 20:44 Composite -- -- -- -- e0.03 e4 -- --Storm drain May 22, 2008 02:33 Composite -- -- -- -- -- -- -- --Storm drain May 22, 2008 04:12 Composite -- -- -- -- -- -- -- --Xeriscape May 22, 2008 00:11 Composite 0.35 96 <0.04 <10 0.21 58 50 10,000Xeriscape May 22, 2008 12:20 Grab 0.23 21 <0.04 <4 e0.03 e3 <10 <900Quarantine May 21, 2008 20:32 Composite -- -- -- -- 1.24 410 -- --Quarantine May 22, 2008 14:20 Grab 0.29 17 <0.04 <2 e0.03 e2 <10 <600
Chemical oxygen demandTotal phosphorus Phosphorusdissolved
Nitrogen, nitrite+ nitrate dissolved
Station name Date Median time (hh:mm)
Sampletype
40
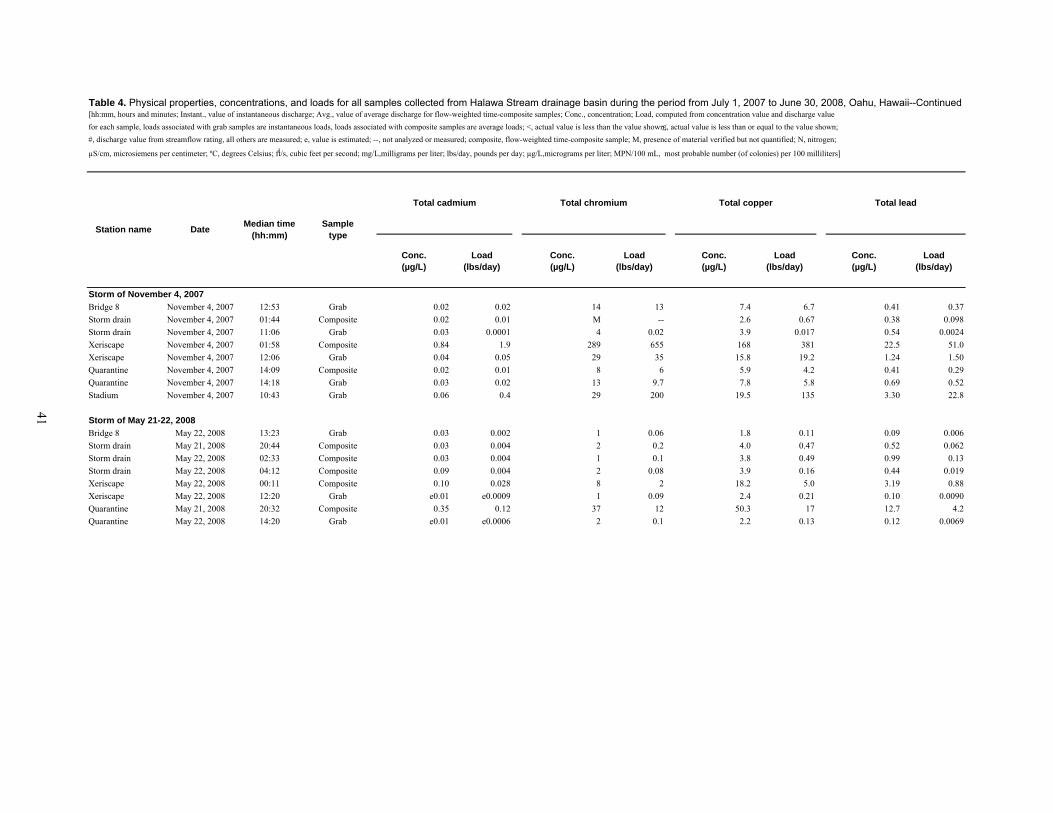
Table 4. Physical properties, concentrations, and loads for all samples collected from Halawa Stream drainage basin during the period from July 1, 2007 to June 30, 2008, Oahu, Hawaii--Continued[hh:mm, hours and minutes; Instant., value of instantaneous discharge; Avg., value of average discharge for flow-weighted time-composite samples; Conc., concentration; Load, computed from concentration value and discharge valuefor each sample, loads associated with grab samples are instantaneous loads, loads associated with composite samples are average loads; <, actual value is less than the value shown; ≤, actual value is less than or equal to the value shown;#, discharge value from streamflow rating, all others are measured; e, value is estimated; --, not analyzed or measured; composite, flow-weighted time-composite sample; M, presence of material verified but not quantified; N, nitrogen;
µS/cm, microsiemens per centimeter; ºC, degrees Celsius; ft3/s, cubic feet per second; mg/L,milligrams per liter; lbs/day, pounds per day; µg/L,micrograms per liter; MPN/100 mL, most probable number (of colonies) per 100 milliliters]
Conc.(µg/L)
Load(lbs/day)
Conc.(µg/L)
Load(lbs/day)
Conc.(µg/L)
Load(lbs/day)
Conc.(µg/L)
Load(lbs/day)
Storm of November 4, 2007Bridge 8 November 4, 2007 12:53 Grab 0.02 0.02 14 13 7.4 6.7 0.41 0.37Storm drain November 4, 2007 01:44 Composite 0.02 0.01 M -- 2.6 0.67 0.38 0.098Storm drain November 4, 2007 11:06 Grab 0.03 0.0001 4 0.02 3.9 0.017 0.54 0.0024Xeriscape November 4, 2007 01:58 Composite 0.84 1.9 289 655 168 381 22.5 51.0Xeriscape November 4, 2007 12:06 Grab 0.04 0.05 29 35 15.8 19.2 1.24 1.50Quarantine November 4, 2007 14:09 Composite 0.02 0.01 8 6 5.9 4.2 0.41 0.29Quarantine November 4, 2007 14:18 Grab 0.03 0.02 13 9.7 7.8 5.8 0.69 0.52Stadium November 4, 2007 10:43 Grab 0.06 0.4 29 200 19.5 135 3.30 22.8
Storm of May 21-22, 2008Bridge 8 May 22, 2008 13:23 Grab 0.03 0.002 1 0.06 1.8 0.11 0.09 0.006Storm drain May 21, 2008 20:44 Composite 0.03 0.004 2 0.2 4.0 0.47 0.52 0.062Storm drain May 22, 2008 02:33 Composite 0.03 0.004 1 0.1 3.8 0.49 0.99 0.13Storm drain May 22, 2008 04:12 Composite 0.09 0.004 2 0.08 3.9 0.16 0.44 0.019Xeriscape May 22, 2008 00:11 Composite 0.10 0.028 8 2 18.2 5.0 3.19 0.88Xeriscape May 22, 2008 12:20 Grab e0.01 e0.0009 1 0.09 2.4 0.21 0.10 0.0090Quarantine May 21, 2008 20:32 Composite 0.35 0.12 37 12 50.3 17 12.7 4.2Quarantine May 22, 2008 14:20 Grab e0.01 e0.0006 2 0.1 2.2 0.13 0.12 0.0069
Total cadmium
Median time (hh:mm)
Sampletype
Total chromium Total copper
Station name Date
Total lead
41
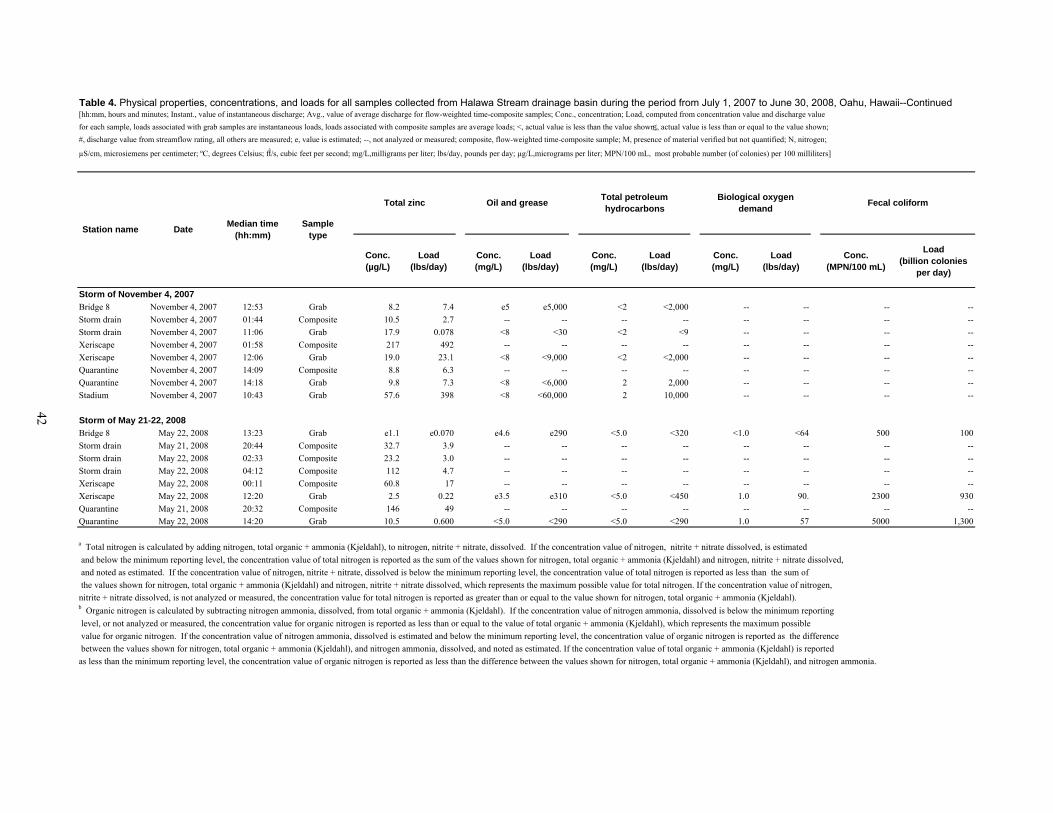
Table 4. Physical properties, concentrations, and loads for all samples collected from Halawa Stream drainage basin during the period from July 1, 2007 to June 30, 2008, Oahu, Hawaii--Continued[hh:mm, hours and minutes; Instant., value of instantaneous discharge; Avg., value of average discharge for flow-weighted time-composite samples; Conc., concentration; Load, computed from concentration value and discharge valuefor each sample, loads associated with grab samples are instantaneous loads, loads associated with composite samples are average loads; <, actual value is less than the value shown; ≤, actual value is less than or equal to the value shown;#, discharge value from streamflow rating, all others are measured; e, value is estimated; --, not analyzed or measured; composite, flow-weighted time-composite sample; M, presence of material verified but not quantified; N, nitrogen;
µS/cm, microsiemens per centimeter; ºC, degrees Celsius; ft3/s, cubic feet per second; mg/L,milligrams per liter; lbs/day, pounds per day; µg/L,micrograms per liter; MPN/100 mL, most probable number (of colonies) per 100 milliliters]
Conc.(µg/L)
Load(lbs/day)
Conc.(mg/L)
Load(lbs/day)
Conc.(mg/L)
Load(lbs/day)
Conc.(mg/L)
Load(lbs/day)
Conc.(MPN/100 mL)
Load(billion colonies
per day)
Storm of November 4, 2007Bridge 8 November 4, 2007 12:53 Grab 8.2 7.4 e5 e5,000 <2 <2,000 -- -- -- --Storm drain November 4, 2007 01:44 Composite 10.5 2.7 -- -- -- -- -- -- -- --Storm drain November 4, 2007 11:06 Grab 17.9 0.078 <8 <30 <2 <9 -- -- -- --Xeriscape November 4, 2007 01:58 Composite 217 492 -- -- -- -- -- -- -- --Xeriscape November 4, 2007 12:06 Grab 19.0 23.1 <8 <9,000 <2 <2,000 -- -- -- --Quarantine November 4, 2007 14:09 Composite 8.8 6.3 -- -- -- -- -- -- -- --Quarantine November 4, 2007 14:18 Grab 9.8 7.3 <8 <6,000 2 2,000 -- -- -- --Stadium November 4, 2007 10:43 Grab 57.6 398 <8 <60,000 2 10,000 -- -- -- --
Storm of May 21-22, 2008Bridge 8 May 22, 2008 13:23 Grab e1.1 e0.070 e4.6 e290 <5.0 <320 <1.0 <64 500 100Storm drain May 21, 2008 20:44 Composite 32.7 3.9 -- -- -- -- -- -- -- --Storm drain May 22, 2008 02:33 Composite 23.2 3.0 -- -- -- -- -- -- -- --Storm drain May 22, 2008 04:12 Composite 112 4.7 -- -- -- -- -- -- -- --Xeriscape May 22, 2008 00:11 Composite 60.8 17 -- -- -- -- -- -- -- --Xeriscape May 22, 2008 12:20 Grab 2.5 0.22 e3.5 e310 <5.0 <450 1.0 90. 2300 930Quarantine May 21, 2008 20:32 Composite 146 49 -- -- -- -- -- -- -- --Quarantine May 22, 2008 14:20 Grab 10.5 0.600 <5.0 <290 <5.0 <290 1.0 57 5000 1,300
a Total nitrogen is calculated by adding nitrogen, total organic + ammonia (Kjeldahl), to nitrogen, nitrite + nitrate, dissolved. If the concentration value of nitrogen, nitrite + nitrate dissolved, is estimated and below the minimum reporting level, the concentration value of total nitrogen is reported as the sum of the values shown for nitrogen, total organic + ammonia (Kjeldahl) and nitrogen, nitrite + nitrate dissolved, and noted as estimated. If the concentration value of nitrogen, nitrite + nitrate, dissolved is below the minimum reporting level, the concentration value of total nitrogen is reported as less than the sum of the values shown for nitrogen, total organic + ammonia (Kjeldahl) and nitrogen, nitrite + nitrate dissolved, which represents the maximum possible value for total nitrogen. If the concentration value of nitrogen, nitrite + nitrate dissolved, is not analyzed or measured, the concentration value for total nitrogen is reported as greater than or equal to the value shown for nitrogen, total organic + ammonia (Kjeldahl).b Organic nitrogen is calculated by subtracting nitrogen ammonia, dissolved, from total organic + ammonia (Kjeldahl). If the concentration value of nitrogen ammonia, dissolved is below the minimum reporting level, or not analyzed or measured, the concentration value for organic nitrogen is reported as less than or equal to the value of total organic + ammonia (Kjeldahl), which represents the maximum possible value for organic nitrogen. If the concentration value of nitrogen ammonia, dissolved is estimated and below the minimum reporting level, the concentration value of organic nitrogen is reported as the difference between the values shown for nitrogen, total organic + ammonia (Kjeldahl), and nitrogen ammonia, dissolved, and noted as estimated. If the concentration value of total organic + ammonia (Kjeldahl) is reportedas less than the minimum reporting level, the concentration value of organic nitrogen is reported as less than the difference between the values shown for nitrogen, total organic + ammonia (Kjeldahl), and nitrogen ammonia.
Fecal coliformTotal petroleum hydrocarbons
Biological oxygen demandOil and greaseTotal zinc
Station name Date Median time (hh:mm)
Sampletype
42
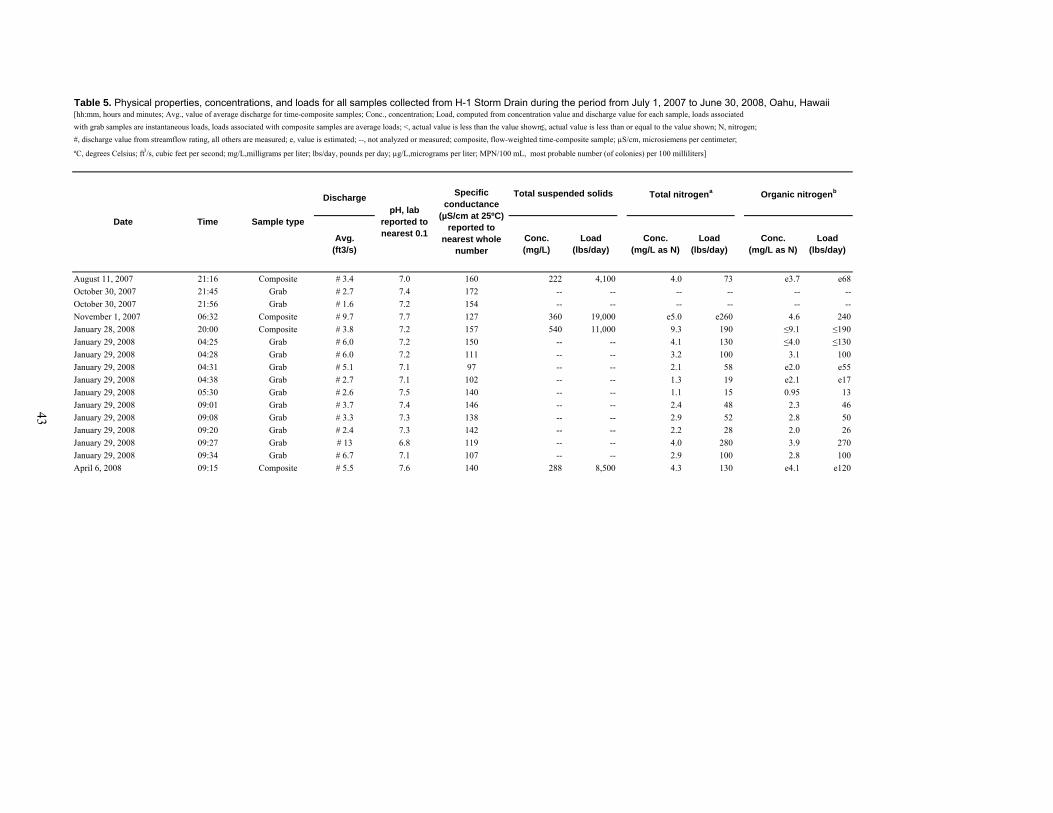
Table 5. Physical properties, concentrations, and loads for all samples collected from H-1 Storm Drain during the period from July 1, 2007 to June 30, 2008, Oahu, Hawaii[hh:mm, hours and minutes; Avg., value of average discharge for time-composite samples; Conc., concentration; Load, computed from concentration value and discharge value for each sample, loads associatedwith grab samples are instantaneous loads, loads associated with composite samples are average loads; <, actual value is less than the value shown; ≤, actual value is less than or equal to the value shown; N, nitrogen;#, discharge value from streamflow rating, all others are measured; e, value is estimated; --, not analyzed or measured; composite, flow-weighted time-composite sample; µS/cm, microsiemens per centimeter;
ºC, degrees Celsius; ft3/s, cubic feet per second; mg/L,milligrams per liter; lbs/day, pounds per day; µg/L,micrograms per liter; MPN/100 mL, most probable number (of colonies) per 100 milliliters]
Date Time Sample type
DischargepH, lab
reported tonearest 0.1
Specific conductance
(µS/cm at 25ºC)reported to
nearest whole number
Total suspended solids Total nitrogena Organic nitrogenb
Avg.(ft3/s)
Conc.(mg/L)
Load(lbs/day)
Conc.(mg/L as N)
Load(lbs/day)
Conc.(mg/L as N)
Load(lbs/day)
August 11, 2007 21:16 Composite # 3.4 7.0 160 222 4,100 4.0 73 e3.7 e68October 30, 2007 21:45 Grab # 2.7 7.4 172 -- -- -- -- -- --October 30, 2007 21:56 Grab # 1.6 7.2 154 -- -- -- -- -- --November 1, 2007 06:32 Composite # 9.7 7.7 127 360 19,000 e5.0 e260 4.6 240January 28, 2008 20:00 Composite # 3.8 7.2 157 540 11,000 9.3 190 ≤9.1 ≤190January 29, 2008 04:25 Grab # 6.0 7.2 150 -- -- 4.1 130 ≤4.0 ≤130January 29, 2008 04:28 Grab # 6.0 7.2 111 -- -- 3.2 100 3.1 100January 29, 2008 04:31 Grab # 5.1 7.1 97 -- -- 2.1 58 e2.0 e55January 29, 2008 04:38 Grab # 2.7 7.1 102 -- -- 1.3 19 e2.1 e17January 29, 2008 05:30 Grab # 2.6 7.5 140 -- -- 1.1 15 0.95 13January 29, 2008 09:01 Grab # 3.7 7.4 146 -- -- 2.4 48 2.3 46January 29, 2008 09:08 Grab # 3.3 7.3 138 -- -- 2.9 52 2.8 50January 29, 2008 09:20 Grab # 2.4 7.3 142 -- -- 2.2 28 2.0 26January 29, 2008 09:27 Grab # 13 6.8 119 -- -- 4.0 280 3.9 270January 29, 2008 09:34 Grab # 6.7 7.1 107 -- -- 2.9 100 2.8 100April 6, 2008 09:15 Composite # 5.5 7.6 140 288 8,500 4.3 130 e4.1 e120
43

Table 5. Physical properties, concentrations, and loads for all samples collected from H-1 Storm Drain during the period from July 1, 2007 to June 30, 2008, Oahu, Hawaii--Continued[hh:mm, hours and minutes; Avg., value of average discharge for time-composite samples; Conc., concentration; Load, computed from concentration value and discharge value for each sample, loads associatedwith grab samples are instantaneous loads, loads associated with composite samples are average loads; <, actual value is less than the value shown; ≤, actual value is less than or equal to the value shown; N, nitrogen;#, discharge value from streamflow rating, all others are measured; e, value is estimated; --, not analyzed or measured; composite, flow-weighted time-composite sample; µS/cm, microsiemens per centimeter;
ºC, degrees Celsius; ft3/s, cubic feet per second; mg/L,milligrams per liter; lbs/day, pounds per day; µg/L,micrograms per liter; MPN/100 mL, most probable number (of colonies) per 100 milliliters]
Date Time Sample type
Ammoniadissolved
Nitrogen, total organic + ammonia
Nitrogen, nitrite+ nitrate dissolved
Phosphorusdissolved Total phosphorus
Conc.(mg/L as N)
Load(lbs/day)
Conc.(mg/L as N)
Load(lbs/day)
Conc.(mg/L as N)
Load(lbs/day)
Conc.(mg/L)
Load(lbs/day)
Conc.(mg/L)
Load(lbs/day)
August 11, 2007 21:16 Composite e0.018 e0.33 3.7 68 0.25 4.6 0.15 2.8 1.05 19October 30, 2007 21:45 Grab -- -- -- -- -- -- -- -- -- --October 30, 2007 21:56 Grab -- -- -- -- -- -- -- -- -- --November 1, 2007 06:32 Composite 0.08 4 4.7 250 e0.35 e18 0.14 7.3 1.74 91January 28, 2008 20:00 Composite <0.020 <0.41 9.1 190 0.17 3.5 0.09 2 2.20 45January 29, 2008 04:25 Grab <0.020 <0.65 4.0 130 0.14 4.5 0.09 3 1.42 46January 29, 2008 04:28 Grab 0.021 0.68 3.1 100 0.09 3 0.09 3 1.04 34January 29, 2008 04:31 Grab e0.018 e0.50 2.0 55 0.09 2 0.07 2 0.72 20January 29, 2008 04:38 Grab e0.012 e0.17 1.2 17 0.11 1.6 0.09 1 0.43 6.3January 29, 2008 05:30 Grab 0.027 0.38 0.98 14 0.12 1.7 0.10 1.4 0.33 4.6January 29, 2008 09:01 Grab 0.034 0.68 2.3 46 0.12 2.4 0.08 2 0.80 16January 29, 2008 09:08 Grab 0.037 0.66 2.8 50 0.12 2.1 0.09 2 0.86 15January 29, 2008 09:20 Grab 0.034 0.44 2.0 26 0.17 2.2 0.09 1 0.67 8.7January 29, 2008 09:27 Grab 0.046 3.2 3.9 270 0.1 7 0.07 5 1.51 110January 29, 2008 09:34 Grab 0.044 1.6 2.8 100 0.1 4 0.10 3.6 0.94 34April 6, 2008 09:15 Composite e0.017 e0.50 4.1 120 0.16 4.7 0.11 3.3 1.15 34
44
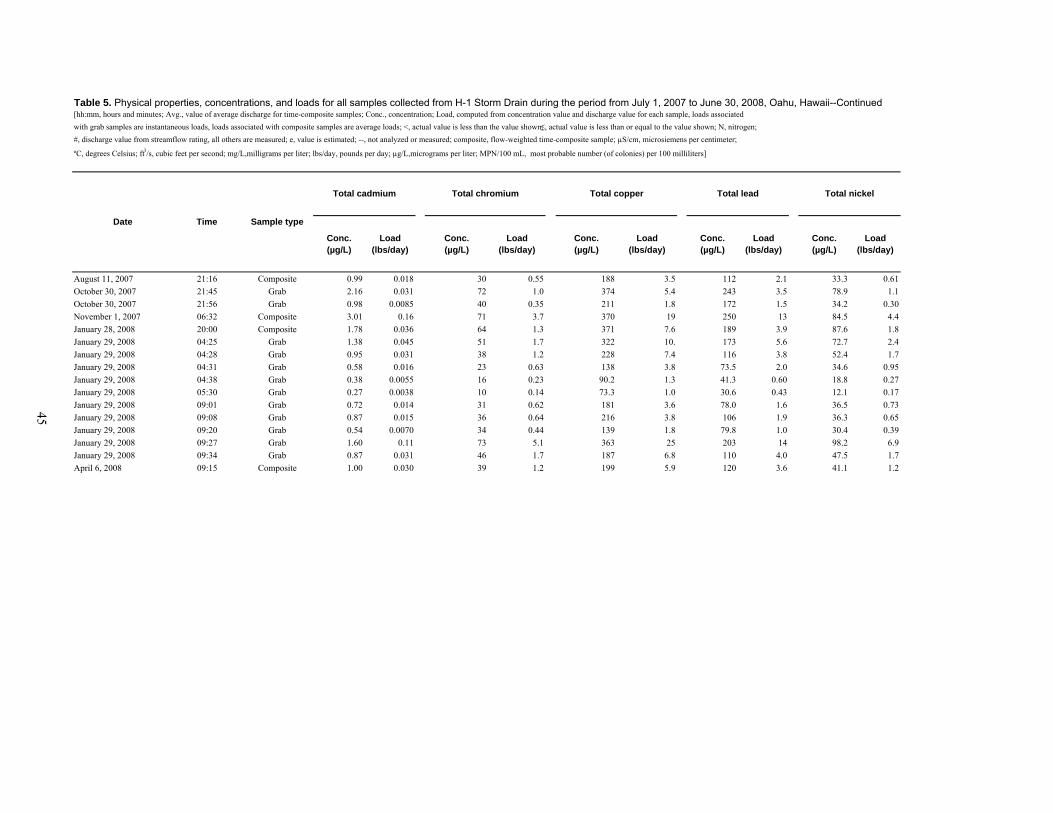
Table 5. Physical properties, concentrations, and loads for all samples collected from H-1 Storm Drain during the period from July 1, 2007 to June 30, 2008, Oahu, Hawaii--Continued[hh:mm, hours and minutes; Avg., value of average discharge for time-composite samples; Conc., concentration; Load, computed from concentration value and discharge value for each sample, loads associatedwith grab samples are instantaneous loads, loads associated with composite samples are average loads; <, actual value is less than the value shown; ≤, actual value is less than or equal to the value shown; N, nitrogen;#, discharge value from streamflow rating, all others are measured; e, value is estimated; --, not analyzed or measured; composite, flow-weighted time-composite sample; µS/cm, microsiemens per centimeter;
ºC, degrees Celsius; ft3/s, cubic feet per second; mg/L,milligrams per liter; lbs/day, pounds per day; µg/L,micrograms per liter; MPN/100 mL, most probable number (of colonies) per 100 milliliters]
Date Time Sample type
Total cadmium Total chromium Total copper Total lead Total nickel
Conc.(µg/L)
Load(lbs/day)
Conc.(µg/L)
Load(lbs/day)
Conc.(µg/L)
Load(lbs/day)
Conc.(µg/L)
Load(lbs/day)
Conc.(µg/L)
Load(lbs/day)
August 11, 2007 21:16 Composite 0.99 0.018 30 0.55 188 3.5 112 2.1 33.3 0.61October 30, 2007 21:45 Grab 2.16 0.031 72 1.0 374 5.4 243 3.5 78.9 1.1October 30, 2007 21:56 Grab 0.98 0.0085 40 0.35 211 1.8 172 1.5 34.2 0.30November 1, 2007 06:32 Composite 3.01 0.16 71 3.7 370 19 250 13 84.5 4.4January 28, 2008 20:00 Composite 1.78 0.036 64 1.3 371 7.6 189 3.9 87.6 1.8January 29, 2008 04:25 Grab 1.38 0.045 51 1.7 322 10. 173 5.6 72.7 2.4January 29, 2008 04:28 Grab 0.95 0.031 38 1.2 228 7.4 116 3.8 52.4 1.7January 29, 2008 04:31 Grab 0.58 0.016 23 0.63 138 3.8 73.5 2.0 34.6 0.95January 29, 2008 04:38 Grab 0.38 0.0055 16 0.23 90.2 1.3 41.3 0.60 18.8 0.27January 29, 2008 05:30 Grab 0.27 0.0038 10 0.14 73.3 1.0 30.6 0.43 12.1 0.17January 29, 2008 09:01 Grab 0.72 0.014 31 0.62 181 3.6 78.0 1.6 36.5 0.73January 29, 2008 09:08 Grab 0.87 0.015 36 0.64 216 3.8 106 1.9 36.3 0.65January 29, 2008 09:20 Grab 0.54 0.0070 34 0.44 139 1.8 79.8 1.0 30.4 0.39January 29, 2008 09:27 Grab 1.60 0.11 73 5.1 363 25 203 14 98.2 6.9January 29, 2008 09:34 Grab 0.87 0.031 46 1.7 187 6.8 110 4.0 47.5 1.7April 6, 2008 09:15 Composite 1.00 0.030 39 1.2 199 5.9 120 3.6 41.1 1.2
45
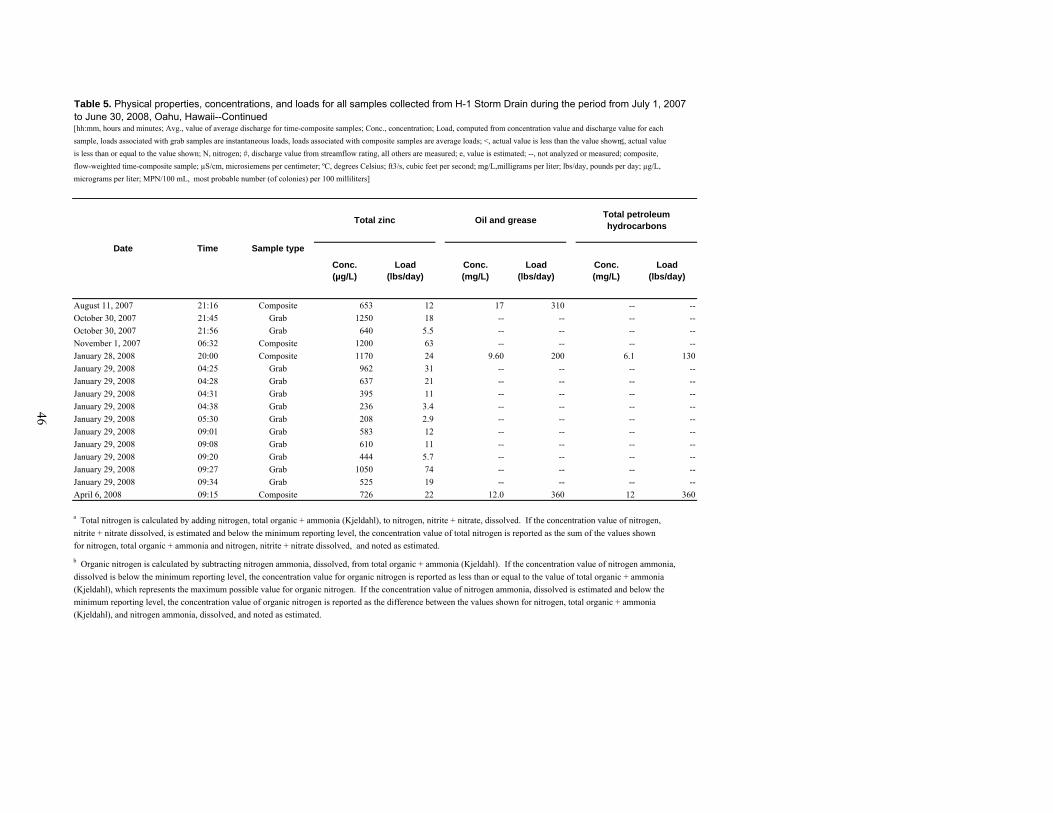
Table 5. Physical properties, concentrations, and loads for all samples collected from H-1 Storm Drain during the period from July 1, 2007 to June 30, 2008, Oahu, Hawaii--Continued[hh:mm, hours and minutes; Avg., value of average discharge for time-composite samples; Conc., concentration; Load, computed from concentration value and discharge value for each sample, loads associated with grab samples are instantaneous loads, loads associated with composite samples are average loads; <, actual value is less than the value shown; ≤, actual valueis less than or equal to the value shown; N, nitrogen; #, discharge value from streamflow rating, all others are measured; e, value is estimated; --, not analyzed or measured; composite, flow-weighted time-composite sample; µS/cm, microsiemens per centimeter; ºC, degrees Celsius; ft3/s, cubic feet per second; mg/L,milligrams per liter; lbs/day, pounds per day; µg/L,micrograms per liter; MPN/100 mL, most probable number (of colonies) per 100 milliliters]
Date Time Sample type
Total zinc Oil and grease Total petroleum hydrocarbons
Conc.(µg/L)
Load(lbs/day)
Conc.(mg/L)
Load(lbs/day)
Conc.(mg/L)
Load(lbs/day)
August 11, 2007 21:16 Composite 653 12 17 310 -- --October 30, 2007 21:45 Grab 1250 18 -- -- -- --October 30, 2007 21:56 Grab 640 5.5 -- -- -- --November 1, 2007 06:32 Composite 1200 63 -- -- -- --January 28, 2008 20:00 Composite 1170 24 9.60 200 6.1 130January 29, 2008 04:25 Grab 962 31 -- -- -- --January 29, 2008 04:28 Grab 637 21 -- -- -- --January 29, 2008 04:31 Grab 395 11 -- -- -- --January 29, 2008 04:38 Grab 236 3.4 -- -- -- --January 29, 2008 05:30 Grab 208 2.9 -- -- -- --January 29, 2008 09:01 Grab 583 12 -- -- -- --January 29, 2008 09:08 Grab 610 11 -- -- -- --January 29, 2008 09:20 Grab 444 5.7 -- -- -- --January 29, 2008 09:27 Grab 1050 74 -- -- -- --January 29, 2008 09:34 Grab 525 19 -- -- -- --April 6, 2008 09:15 Composite 726 22 12.0 360 12 360
a Total nitrogen is calculated by adding nitrogen, total organic + ammonia (Kjeldahl), to nitrogen, nitrite + nitrate, dissolved. If the concentration value of nitrogen, nitrite + nitrate dissolved, is estimated and below the minimum reporting level, the concentration value of total nitrogen is reported as the sum of the values shown for nitrogen, total organic + ammonia and nitrogen, nitrite + nitrate dissolved, and noted as estimated.b Organic nitrogen is calculated by subtracting nitrogen ammonia, dissolved, from total organic + ammonia (Kjeldahl). If the concentration value of nitrogen ammonia, dissolved is below the minimum reporting level, the concentration value for organic nitrogen is reported as less than or equal to the value of total organic + ammonia (Kjeldahl), which represents the maximum possible value for organic nitrogen. If the concentration value of nitrogen ammonia, dissolved is estimated and below the minimum reporting level, the concentration value of organic nitrogen is reported as the difference between the values shown for nitrogen, total organic + ammonia (Kjeldahl), and nitrogen ammonia, dissolved, and noted as estimated.
46