a report prepared for the institute of physics by ...iop institute of physics the impact of tuition...
TRANSCRIPT

A report prepared for the Institute of Physics by YouthSight | November 2013
The impact of tuition fees on prospectivephysics students 2013

The Institute of Physics is a leading scientific society. We are a charitable organisation with a worldwide membership of more than 50,000, working together to advance physics education, research and application. We engage with policymakers and the general public to develop awareness and understanding of the value of physics and, through IOP Publishing, we are world leaders in professional scientific communications.
This report was prepared by:Sarah NewtonSenior Research ExecutiveYouthSightE-mail [email protected]

I O P I n s t I t u t e O f P h y s I c s t h e I m P a c t O f t u I t I O n f e e s O n P r O s P e c t I v e P h y s I c s s t u d e n t s 2 01 3 n O v e m b e r 2 01 3 3
Contents
1. Background and introduction 4
2. Executive summary 5
3. Choosing to study physics at university 6
4. Preferred course structures 9
5. The impact of higher fees and debt 11
6. Career considerations, information and advice 14
7. Appendix : Metholology 16

I O P I n s t I t u t e O f P h y s I c s4 t h e I m P a c t O f t u I t I O n f e e s O n P r O s P e c t I v e P h y s I c s s t u d e n t s 2 01 3 n O v e m b e r 2 01 3
In 2012, the Institute of Physics (IOP) published the report Gravitating towards physics: How will higher fees affect the choices of prospective physics students?, which investigated how and why young people choose to study physics at degree level and whether the £9000 tuition fees introduced in England for the academic year 2012/13 would have an impact on these choices. The report established two key findings:●● Physics students overall are less price-sensitive than the average UK undergraduate.●● Those who are traditionally under-represented in physics are more likely to be impacted by fee and debt considerations.
One of the key conclusions therefore was that physics would not suffer a decline in undergraduate student numbers as a result of higher fees. However, a concern was that higher fees and debt levels could adversely impact diversity in physics, with “non-traditional” physics students being drawn towards competitor subjects.
Research objectivesThe overall aim of the present report was to provide the IOP, one year on from the introduction of £9000 tuition fees, with trend data on the attitudes and choices of university applicants who considered physics and either applied for it, or applied for a different subject instead.
A second aim was to assess whether there are differences between “traditional” physics students and “non-traditional” ones (e.g. variations by gender, ethnicity and social grade), as was the case with the 2012 study.
Brief overview of methodologyTo gather reliable trend data, the methodology used was identical to that of the 2012 study. This involved an online quantitative survey with 483 university applicants who intended to start their studies in the academic year 2013/14. Fieldwork took place between 28 January and 2 March 2013, falling shortly after applicants made their UCAS submissions, i.e. after they had made their subject choices.
The sample included university applicants who considered applying for one of the following subjects: physics, astronomy, or combined
courses/broad-based programmes in the physical sciences that have physics or astronomy as a major component. Quotas were used to split the sample roughly equally into “accepters” (those who actually applied to study these subjects) and “rejecters” (those who considered these subjects but did not apply for them). Quotas were used to ensure a fairly even gender split within the sample to enable robust comparisons on the basis of gender.
About this reportFindings from the 2012 and 2013 surveys are compared to assess young peoples’ interest and choices in relation to studying physics at degree level and the influences on their views and decision-making.
A comparison is made between the responses of physics accepters and rejecters. Comparing these groups is essential to understand fully what is and is not attracting young people to physics.
By comparing the responses of “non-traditional” physics applicants – i.e. women, ethnic minorities, those from lower social grades and those from lower POLAR quintiles – with applicants from a more “traditional” physics background, the issue of diversity is also examined.
DefinitionsThe sample for this research was physics accepters and rejecters.
Survey data were analysed by an applicant’s social grade. Higher social grades are those falling into the AB categories, whereas those from lower social grades fall into C1C2DE1.
Data were also analysed by the widening participation POLAR quintile. The POLAR (Participation of Local Areas) is a classification of small areas across the UK and is available from the Higher Education Funding Council for England as a series of maps and data sets illustrating how the chances of young people entering higher education vary by where they live. Respondents in the lowest quintile are least likely to enter higher education, and those in the next quintile are the next least likely; the upper three quintiles have been grouped together for the purposes of this study because these respondents are more likely to enter higher education.
Background and introduction
11 The National Readership Survey’s social grade classification system was used, which is based on the occupation of the chief income earner in a household. In the context of surveys with university applicants, this is usually the highest-earning individual in the parental/guardian household.

I O P I n s t I t u t e O f P h y s I c s t h e I m P a c t O f t u I t I O n f e e s O n P r O s P e c t I v e P h y s I c s s t u d e n t s 2 01 3 n O v e m b e r 2 01 3 5
2 Fees are capped at £9000 in England, but because there are cross-border flows of students, the impact is also felt outside England.
The majority of applicants still view physics as a prestigious, well-respected and fundamental subject. As was the case with the 2012 sample of applicants, physics continues to have a very positive brand image, and those accepting to study physics at university still favour opting for the four-year integrated masters over three-year degree courses.
However, the challenges for physics remain the same: encouraging diversity and disseminating careers information. Applicants, particularly accepters, want more information about careers in physics.
Higher tuition fees are having a modest impact on behaviour. As in 2012, fees of up to £90002 had no impact on the decision of the majority of
those considering to study physics at university. Women and non-white applicants and those from lower social grades were slightly more likely across the 2012 and 2013 samples to be deterred. These groups stated that they were more likely in 2013 to take action to mitigate higher fees by, for example, choosing a subject that promises higher graduate salaries or higher lifetime earnings, or choosing a more applied/vocational subject.
Overall, concerns about debt remained high in 2013, although they decreased slightly compared with 2012. Ethnic minority applicants were more concerned in 2013 about debt, with a wider gap emerging between them and white applicants across the 2012 and 2013 samples.
Executive summary
2

I O P I n s t I t u t e O f P h y s I c s6 t h e I m P a c t O f t u I t I O n f e e s O n P r O s P e c t I v e P h y s I c s s t u d e n t s 2 01 3 n O v e m b e r 2 01 3
Choosing to study physics at university
3Competitor subjects and considerationsThere is a high level of similarity between the 2012 and 2013 samples in terms of applicant decision-making on which subject to study. Figure 1 shows that mathematics and engineering remain the most popular competitor subjects both among physics accepters (i.e. those who accepted a physics place at university) and among physics rejecters (those who considered physics but instead chose a competitor subject). Chemistry, medicine and biological sciences also drew the consideration of a sizeable proportion of rejecters.
Applicants in the 2013 sample were more certain about what they wanted to study at university. They included fewer subjects in their consideration set and expressed less interest in physics’ main competitor subjects. Consideration
of mathematics, chemistry, medicine and broad-based programmes in the physical sciences dropped among accepters compared with the 2012 sample. This trend was less pronounced, but was still apparent among rejecters (who tend to consider a wider range of subjects).
However, a wider gender gap appeared in the subjects considered and applied for. The women in the 2013 sample versus the 2012 sample were even more likely to consider broad-based programmes in the physical sciences and education than the men, who were now even more likely to consider engineering and computer science than the women. Looking at the subjects that men and women actually applied for rather than only considered, there was a noteworthy change in that more women in the 2013 sample applied for physics/astronomy than in the 2012 sample.
96%94%
43%45%
37%48%
23%15%
19%32%
16%22%
14%33%
14%30%
14%15%
7%13%
7%10%
6%11%
6%10%
5%13%
9%17%
biological sciences (inc. sports science and psychology)
combined programme/joint honours
architecture, building and planning
geography
economics
business and administrative studies
education
other
physics/astronomy
mathematics and mathematical sciences
engineering and technology
broad-based programmes in the physical sciences
chemistry
computer science
medicine and dentistry
accepters
rejecters
= a fall of ≥5% among accepters since 2012 = a fall of ≥5% among rejecters since 2012
Figure 1: Subjects considered at university, accepters versus rejecters 2013
QS1 Which subjects did you consider studying at university?All respondents n=483; accepters n=243;rejecters n=240.

I O P I n s t I t u t e O f P h y s I c s t h e I m P a c t O f t u I t I O n f e e s O n P r O s P e c t I v e P h y s I c s s t u d e n t s 2 01 3 n O v e m b e r 2 01 3 7
The appeal of studying physicsBeing interested in and good at the subject, as well as wanting to learn more, remained the strongest motivations for studying physics, as shown in figure 2. Accepters tend to feel more strongly about each factor than rejecters. Compared with the 2012 sample, respondents in the 2013 sample were more likely to cite a range of factors explaining their interest in studying physics. In particular, interesting course content was cited more frequently by both accepters and rejecters.
As in 2012, factors relating to money had little importance. Indeed, the new fee structure continued to have little impact on most rejecters’ decision not to study physics in England. However, ethnic minority applicants in the 2013 sample were more sensitive to fees and more likely to take steps to mitigate against the impact of higher fees in the long term through their subject choice.
One in five applicants across both sample years stated that they had received no support, guidance or encouragement to study physics at university. This was particularly apparent in those from the lowest widening participation POLAR quintile in 2013 and supports the argument that young people from less traditional higher-
education backgrounds, such as ethnic minority applicants, are not receiving the same levels of support and direction as those from more traditional backgrounds.
Choosing physics over other subjectsCompared with 2012, the number of young people in the 2013 sample who stated that they chose to study physics because of better/more interesting career opportunities fell3. Additionally, as in the 2012 sample, the top two reasons for not choosing physics were insufficient interest in physics and a greater interest in other subjects. However, a far larger proportion of rejecters in the 2013 sample compared with the 2012 sample cited more obvious career paths offered by other subject areas, and this is now the third most frequently cited reason for not choosing to study physics. Having a clear idea of the careers available with a physics degree remains the main way to appeal to applicants who decide not to study physics. Despite the wealth of available careers information such as Unistats and material from the IOP, it appears that these are not being fully used, and work needs to be done on their promotion.
provides highlysought-after skills
it’s a reputable/prestigious subject
good/interestingcareer opportunities
it’s a challenging subject
interesting course content
keen to learn more aboutphysics/how things work
good at/enjoy physicsinterested in physics as a subject
good graduate salaries
inspired by teacher/role model
accepters
rejecters
= a rise of ≥5% among accepters since 2012 = a rise of ≥5% among rejecters since 2012
20%
40%
60%
100%
80%
Figure 2: Reasons for interest in physics, accepters versus rejecters 2013
3: Choosing to study physics at university
QA1 Why did you consider studying physics at university?All respondents n=483; accepters n=243;rejecters n=240.
3 28% in 2013 versus 39% in 2012.

I O P I n s t I t u t e O f P h y s I c s8 t h e I m P a c t O f t u I t I O n f e e s O n P r O s P e c t I v e P h y s I c s s t u d e n t s 2 01 3 n O v e m b e r 2 01 3
Reputation of physics as a subjectThe reputation of the university and that of the course/department continued to be the most important factors in the decision of applicants to study at university in 2013 among both accepters and rejecters. Figure 3 shows that the reputation of physics remains strong and that the vast majority of applicants continue to see it as being prestigious, well respected and fundamental.
Subject reputation remains an important factor in higher-education decision-making, but it appears to have declined in importance since 2012, particularly among rejecters and women. In particular, women across both sample years had less positive perceptions of physics compared with men, and the gender gap was wider in the 2013 sample.
3: Choosing to study physics at university
prestigious/well-respected subject
not as prestigious as other subjects
a fundamental/important subject
one of the hardest subjects
male-dominated
nerdy/geeky but in a good way
nerdy/geeky but in a bad way
boring
accepters
rejecters= a rise of ≥5% among accepters since 2012
20%
40%
60%
100%
80%
Figure 3: Perceptions of physics, accepters versus rejecters 2013
QC2 What reputation does physics have as a subject?All respondents n=483; accepters n=243;rejecters n=240.

I O P I n s t I t u t e O f P h y s I c s t h e I m P a c t O f t u I t I O n f e e s O n P r O s P e c t I v e P h y s I c s s t u d e n t s 2 01 3 n O v e m b e r 2 01 3 9
Preferred course structures
4Course structures/lengths considered by applicantsFigure 4 shows that the two types of course most commonly considered by applicants were integrated masters degree courses and three-year (four-year in Scotland) degree courses; this applied to both accepters and rejecters. Unsurprisingly, accepters were more likely to consider an integrated masters course that specialised in physics. There were no noteworthy
differences by gender, ethnicity, social grade or widening participation quintile.
It is difficult to draw comparisons with the 2012 data because the question posed in this year’s study has been restructured, but it appears that the sandwich course was less popular with accepters in 2013 than in 2012. The three-year degree courses appear to have increased in popularity, with 52% of applicants overall considering these in 2012 versus 72% in 20134.
4-year (or, in Scotland,5-year) integrated masters courses specialising in physics (e.g. MPhys or MSci)
4-year (or, in Scotland,5-year) course (excluding integrated masters courses specialising in physics)
4-year (or 5-year)sandwich course
3-year course (or 4-year Scottish degree course)
67%
76%69%
50%
20%27%
17%
29%
accepters
rejecters
4-year (or, in Scotland,5-year) integrated masters courses specialising in physics (e.g. MPhys or MSci)
4-year (or, in Scotland,5-year) course (excluding integrated masters courses specialising in physics)
4-year (or 5-year)sandwich course
3-year course (or 4-year Scottish degree course)
51%55% 54%
0% 9%
31%
8%
23%
accepters
rejecters
Figure 4: Course types considered by applicants, accepters versus rejecters 2013
Figure 5: Course types applied for, accepters versus rejecters 2013
QB1 Did you consider any of the following course types?All respondents n=483; accepters n=243;rejecters n=240.
QB2 Which course structures best describe the courses you’ve applied for?All respondents n=483; accepters n=243;rejecters n=240.
4 However, this could in part be due to the change in the wording of the question posed to the applicants in the survey.

I O P I n s t I t u t e O f P h y s I c s10 t h e I m P a c t O f t u I t I O n f e e s O n P r O s P e c t I v e P h y s I c s s t u d e n t s 2 01 3 n O v e m b e r 2 01 3
4: Preferred course structures
Course structures/lengths applied forWhen it came to actually applying to courses, figure 5 shows that accepters tended to apply to integrated masters degrees and three-year degrees in almost equal proportions. Rejecters favoured three-year degrees and a mixture of integrated masters degrees and sandwich courses. Again, although year-on-year comparisons are difficult, the proportion of applicants who applied for standard-length courses (i.e. three-year, or four-year Scottish degree) appeared to rise in 20135, and sandwich courses gained in popularity among rejecters6.
Reasons for choosing different course structuresFigure 6 shows that applicants prefer integrated masters degrees mainly because they want a masters-level qualification and it offers the chance to gain in-depth knowledge of their subject. Prestige and employability are also considerations. The attractions of three-year degree courses include lower-entry requirements, less debt and the ability to move into employment quickly. As would be expected, a work placement/year abroad and the concomitant increase in employability prospects were the main drivers for applicants to consider a sandwich course.
5 53% having applied for one in 2013 versus 37% in 2012.
6 23% having applied for one in 2013 versus 18% in 2012.
73%63%
61%45%
39%41%
46%27%
36%41%
I want a masters degree, i.e. a four- (or five-year)integrated masters degree
offers detailed/in-depth understanding of my subject
covers a good variety of topics/interesting topics
offers better employability prospects than other course structures
it’s a prestigious/more academic degreeaccepters
rejecters
Figure 6: Top five reasons for applying to integrated masters courses, accepters versus rejecters 2013
QB3E&F What was it about the course structure and length that made you choose to apply for a four-year (or, in Scotland, five-year) integrated masters course?Accepters who applied to an integrated masters course specialising in physics n=132; rejecters who applied to an integrated masters course not specialising in physics n=75.
I O P I n s t I t u t e O f P h y s I c s t h e I m P a c t O f t u I t I O n f e e s O n P r O s P e c t I v e P h y s I c s s t u d e n t s 2 01 3 n O v e m b e r 2 01 3 11
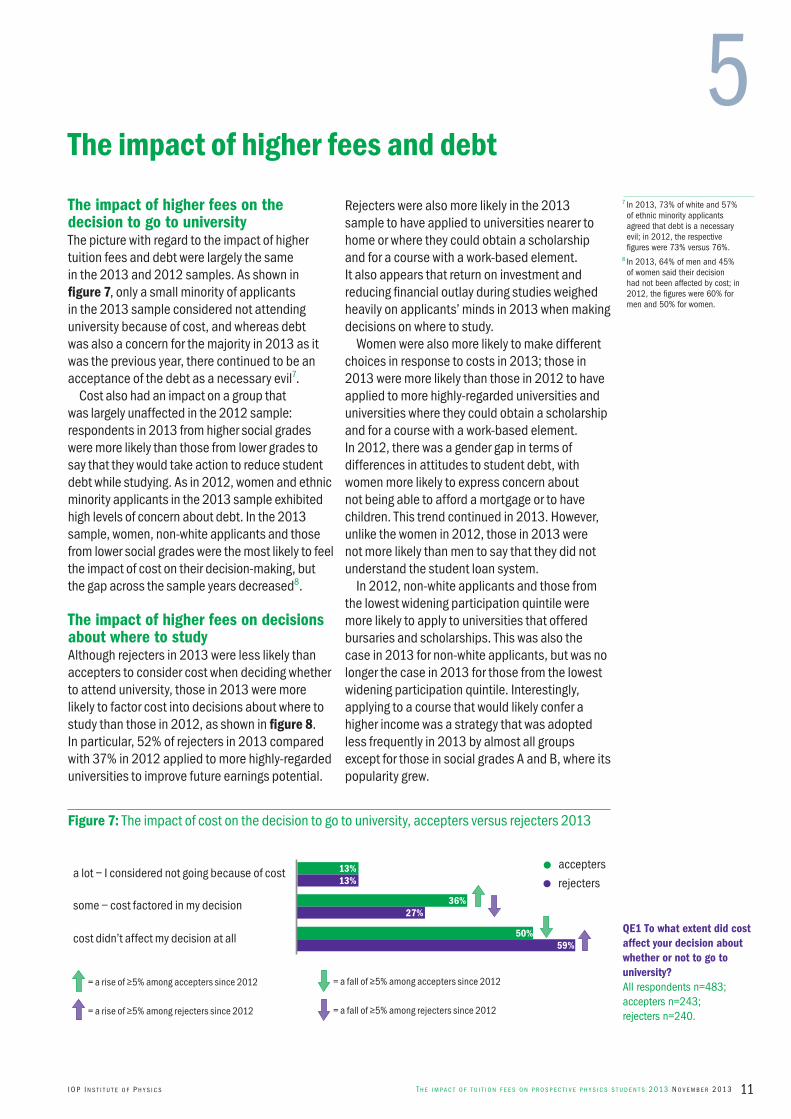
The impact of higher fees on the decision to go to universityThe picture with regard to the impact of higher tuition fees and debt were largely the same in the 2013 and 2012 samples. As shown in figure 7, only a small minority of applicants in the 2013 sample considered not attending university because of cost, and whereas debt was also a concern for the majority in 2013 as it was the previous year, there continued to be an acceptance of the debt as a necessary evil7.
Cost also had an impact on a group that was largely unaffected in the 2012 sample: respondents in 2013 from higher social grades were more likely than those from lower grades to say that they would take action to reduce student debt while studying. As in 2012, women and ethnic minority applicants in the 2013 sample exhibited high levels of concern about debt. In the 2013 sample, women, non-white applicants and those from lower social grades were the most likely to feel the impact of cost on their decision-making, but the gap across the sample years decreased8.
The impact of higher fees on decisions about where to studyAlthough rejecters in 2013 were less likely than accepters to consider cost when deciding whether to attend university, those in 2013 were more likely to factor cost into decisions about where to study than those in 2012, as shown in figure 8. In particular, 52% of rejecters in 2013 compared with 37% in 2012 applied to more highly-regarded universities to improve future earnings potential.
Rejecters were also more likely in the 2013 sample to have applied to universities nearer to home or where they could obtain a scholarship and for a course with a work-based element. It also appears that return on investment and reducing financial outlay during studies weighed heavily on applicants’ minds in 2013 when making decisions on where to study.
Women were also more likely to make different choices in response to costs in 2013; those in 2013 were more likely than those in 2012 to have applied to more highly-regarded universities and universities where they could obtain a scholarship and for a course with a work-based element. In 2012, there was a gender gap in terms of differences in attitudes to student debt, with women more likely to express concern about not being able to afford a mortgage or to have children. This trend continued in 2013. However, unlike the women in 2012, those in 2013 were not more likely than men to say that they did not understand the student loan system.
In 2012, non-white applicants and those from the lowest widening participation quintile were more likely to apply to universities that offered bursaries and scholarships. This was also the case in 2013 for non-white applicants, but was no longer the case in 2013 for those from the lowest widening participation quintile. Interestingly, applying to a course that would likely confer a higher income was a strategy that was adopted less frequently in 2013 by almost all groups except for those in social grades A and B, where its popularity grew.
The impact of higher fees and debt
5
a lot – I considered not going because of cost
some – cost factored in my decision
cost didn’t affect my decision at all
accepters
rejecters13%13%
36%27%
50%59%
= a fall of ≥5% among accepters since 2012
= a fall of ≥5% among rejecters since 2012
= a rise of ≥5% among accepters since 2012
= a rise of ≥5% among rejecters since 2012
Figure 7: The impact of cost on the decision to go to university, accepters versus rejecters 2013
QE1 To what extent did cost affect your decision about whether or not to go to university?All respondents n=483; accepters n=243;rejecters n=240.
7 In 2013, 73% of white and 57% of ethnic minority applicants agreed that debt is a necessary evil; in 2012, the respective figures were 73% versus 76%.
8 In 2013, 64% of men and 45% of women said their decision had not been affected by cost; in 2012, the figures were 60% for men and 50% for women.

I O P I n s t I t u t e O f P h y s I c s12 t h e I m P a c t O f t u I t I O n f e e s O n P r O s P e c t I v e P h y s I c s s t u d e n t s 2 01 3 n O v e m b e r 2 01 3
5: The impact of higher fees and debt
Attitudes to student debtOverall, concern about student loan debt was as high in 2013 as it was in 2012. In spite of these concerns, as with applicants in 2012, those in 2013 were fairly reconciled to the level of debt that they would take on as undergraduates, as shown in figure 9, and it was interesting that, although they were the second cohort to have considered higher tuition fees in the new higher-education reforms, levels of understanding had not increased between the sample years.
However, a greater difference was evident between white and ethnic minority applicants in 2013 than in 2012, with ethnic minority applicants displaying more concern about debt. White applicants in both years’ samples were more likely than ethnic minority applicants to agree that repayments are reasonable and that the debt is worth it.
Plans to minimise student debtAs in 2012, the majority of applicants in 2013 (accepters and rejecters) planned to take steps during their studies to reduce the debt that they will incur. However, this intention was greater among accepters in 2013 than among those in 20129, making the difference in behaviour between these two groups of applicants smaller than that in the 2012 sample.
Those applicants who intended to reduce their debt while studying were, as in the 2012 sample, to be most likely to do so by working part time during the semester. This intention was greater among accepters in 2013 than among those in 201210. The second most popular strategy, undertaking part-time holiday work, increased between the sample years as a way to reduce debt among rejecters11. Women in 2013 were more likely than men to intend to do something to reduce their debt while studying.
applied to more reputable universities to improvefuture earning potential
applied to universities nearer my home
applied to courses where I would be more likely toearn a higher income
applied to universities where I’d get a scholarship
applied to universities where I’d get a higher bursary
applied to universities in Scotland
other
none of the above
applied to a course that includes a work-based element, e.g. an industry year
accepters
rejecters
51%52%
30%35%
23%32%
22%26%
18%28%
18%19%
9%3%
5%5%
12%13%
= a fall of ≥5% among accepters since 2012
= a fall of ≥5% among rejecters since 2012= a rise of ≥5% among rejecters since 2012
Figure 8: The impact of cost on the decision of where to study, accepters versus rejecters 2013
QE2 Did the cost of university affect your choice of where to study in any of these ways?Students whose decision about going to university was either affected “a lot” or “to some extent” by cost n=215; accepters n=120; rejecters n=95.
9 67% in 2013 versus 57% in 2012.
10 81% in 2013 verus 73% in 2012.
11 61% in 2013 versus 55% in 2012.

I O P I n s t I t u t e O f P h y s I c s t h e I m P a c t O f t u I t I O n f e e s O n P r O s P e c t I v e P h y s I c s s t u d e n t s 2 01 3 n O v e m b e r 2 01 3 13
5: The impact of higher fees and debt
Ethnic minority applicants were more likely in 2013 than in 2012 to plan to live at home while studying12, whereas white applicants were more likely in 2013 than in 2012 to plan on working during term time13.
Effect of higher debt on four-year degree optionApplicants who had applied for a four-year (five-year in Scotland) course were asked to comment on whether or not debt might cause them to cut their studies short if this were an option on their course.
A large majority14 said that this would not be the case, but approximately one in five (20% in both 2013 and 2012) said that they might do so.
I worry that I won’t be able to afford having children because of my student debt
studying a subject I love makes it worth the debt
the repayments are resonable and I won’t have torepay if I’m not earning a lot
I’ve got to have a degree to compete in the job market, the debt is a necessary evil
everyone else with a degree will be in debt, so why worry?
my parents/carers will help me out, so student debtisn’t a big problem for me
I don’t really understand the student loan system
there’s nothing I can do about student debt, so why worry?
I worry that I won’t be able to afford a mortgage because of my student debts
net: agree
77%
71%
70%
54%
29%
39%
25%
23%
15%
Figure 9: Attitudes towards tuition fees and student debt, 2013
QE4 Which of these statements best describes your attitude towards tuition fees and student debt?All respondents n=483; accepters n=243;rejecters n=240.
12 28% ethnic minority versus 16% white in 2013; 16% ethnic minority versus 15% white in 2012.
13 84% white versus 73% ethnic minority in 2013; 79% white versus 74% ethnic minority in 2012.
14 64% in 2013 and 67% in 2012.

I O P I n s t I t u t e O f P h y s I c s14 t h e I m P a c t O f t u I t I O n f e e s O n P r O s P e c t I v e P h y s I c s s t u d e n t s 2 01 3 n O v e m b e r 2 01 3
Sectors and roles of interest to applicantsFigure 10 shows that applicants were very interested in careers in traditional physics sectors (e.g. energy, space science, instrumentation), followed by engineering and medicine. In 2013, accepters in particular were keener on traditional physics sectors. As was the case in 2012, accepters were more interested than rejecters in research roles, but the most compelling aspect about any role continues to be that it is challenging and interesting, regardless of what the role itself is. For those who would not consider a research role, the most common reason cited was that they are not interested in such a role/career path, a trend that is more pronounced among rejecters.
Information received and desired on physics careersThe amount of information received about careers in physics by applicants and their satisfaction with the quantity received were the same across both sample years. As in 2012, most applicants received “some” or “a lot” of information, yet a majority also stated that they wanted more information. On a related note, the data indicate that ethnic minority applicants receive less information than white applicants15.
The desire to see more information about potential careers was greater than in 2012, although there were noteworthy differences between accepters and rejecters, as shown in figure 11. Among accepters, the desire for
more specific information about the careers that are possible with a physics degree was greater than in 2012, whereas rejecters wanted more communications with/from real employers in physics sectors.
Perceptions of graduate employabilityApplicants’ confidence in their employability was the same across the sample years: around half of applicants believe that it will be easy to find any type of job after graduation, but only around a third believe that it will be easy to find a graduate job or a job related to their degree. The top two reasons for being confident about job prospects were also the same across the sample years: having a degree in a reputable/desired subject and having the skills that employers are looking for.
Figure 12 shows that the top five skills believed by applicants to be wanted by employers are the same across both sample years: problem-solving skills, intelligence, numeracy, teamworking skills and good knowledge of the degree subject. Differences between accepters and rejecters were the same in 2013, with accepters placing a greater emphasis on numeracy, an analytic approach and curiosity, and rejecters emphasising communication skills and work experience. This is probably a result of a high proportion of rejecters choosing engineering, which often has a work-experience element. In 2013, women were more likely than men to believe that employers expect graduates to have skills in teamworking, communication and leadership.
Career considerations, information and advice
615 22% of white versus 38% non-white applicants did not receive any information in 2013.
91%71%
66%64%
37%46%
32%39%
23%38%
22%25%
physics sectors perceived to be “traditional”, e.g. energy, space, instrumentation
engineering or related area
medicine or related area
finance/banking or related area
business/management
IT/telecoms or related areaaccepters
rejecters
= a fall of ≥5% among accepters since 2012
Figure 10: Sectors respondents are interested in working in after graduation, accepters versus rejecters 2013
QD1 Which sectors are you interested in working in after you graduate?All respondents n=483; accepters n=243;rejecters n=240.

I O P I n s t I t u t e O f P h y s I c s t h e I m P a c t O f t u I t I O n f e e s O n P r O s P e c t I v e P h y s I c s s t u d e n t s 2 01 3 n O v e m b e r 2 01 3 15
6: Career considerations, information and advice
74%75%
69%63%
62%61%
54%55%
53%47%
47%52%
45%43%
2%1%
job descriptions showing the kinds of jobs you can doin physics
more specific information about careers possible with a physics degree
salary information for jobs in physics
communication with/from real employers in physics sectors
information from experienced/trustworthy sources
case studies of real physics graduates
talks or Q&A sessions with graduates who have a physics degree
other
= a fall of ≥5% among accepters since 2012= a rise of ≥5% among accepters since 2012
= a rise of ≥5% among rejecters since 2012
accepters
rejecters
Figure 11: Physics careers information wanted by respondents, accepters versus rejecters 2013
adaptability analytical approach
communication skills
curiosity
intelligence
interests outside of degree
language skills
leadership skillsnumeracy/maths skills
persistence
presentation skills
problem-solving skills
programming skills
teamwork skills
work experience
good knowledge of degree subject
= a fall of ≥5% among accepters since 2012= a rise of ≥5% among accepters since 2012
= a rise of ≥5% among rejecters since 2012
accepters
rejecters
20%
40%
60%
100%
80%
= a fall of ≥5% among rejecters since 2012
Figure 12: Perceptions of skills and attributes employers expect from graduates, accepters versus rejecters 2013
QD9 What skills and attributes do you think employers will expect of you when you graduate?All respondents n=483; accepters n=243;rejecters n=240.
QD6: What careers information related to physics would you have wanted? What careers information did you get and appreciate, or didn’t you get but would have wanted?All respondents n=483; accepters n=243;rejecters n=240.
I O P I n s t I t u t e O f P h y s I c s16 t h e I m P a c t O f t u I t I O n f e e s O n P r O s P e c t I v e P h y s I c s s t u d e n t s 2 01 3 n O v e m b e r 2 01 3
OverviewThis project was commissioned as a follow-up study to the 2012 report Gravitating towards physics: How will higher fees affect the choices of prospective physics students? In this second wave of quantitative research, an identical methodological approach was followed to ensure that valid and reliable comparisons could be made between the findings of 2012 and those of 2013.
Sample size and compositionThe sample for this research was selected from YouthSight’s Applicant Panel. The final sample size was 483 (489 young people completed the survey, but 6 participants were removed from the data set as part of our quality-assurance process).
All respondents met the following criteria:●● Have considered applying to one of the following:– physics– astronomy– combined courses that have physics or
astronomy as a major component– broad-based programmes in the physical
sciences that have physics or astronomy as a major component.
●● Intend to start university in the academic year 2013/14.
Screening questions were used at the beginning of the survey to confirm that respondents fulfilled the criteria.
QuotasQuotas were used to split the survey sample roughly equally into two groups:●● Accepters: those who have applied to study physics, astronomy or combined courses/broad-based programmes in the physical sciences that have physics or astronomy as a major component.●● Rejecters: those who considered physics or related subjects as outlined above but did not apply to study for any of these.
The final sample was split between 243 “accepters” and 240 “rejecters”. Additionally, quotas were used to ensure a fairly even gender split within the sample. The reason for this was to allow for robust comparisons on the basis of gender. The 2012 sample achieved a fairly even gender split; replication of this in 2013 was therefore important to ensure that the data could be reliably compared. The final sample was split between 250 men and 233 women.
IncentivesRespondents received £1 in Bonus Bond vouchers for completing the survey, which can be spent like cash at a wide range of high-street shops.
QuestionnaireThe questionnaire used for this wave of research was virtually identical to the 2012 version. No new questions were added, one was removed and four had either their question wording or answer categories revised to ensure their appropriateness for this wave of research.
The same screening questions were used for both 2012 and 2013 so that the samples were structured in the same way in both waves.
Fieldwork timingFieldwork took place between 28 January and 2 March 2013, shortly after the date that applicants made their UCAS submissions, i.e. after they had made their subject choices.
Data processingData processing was carried out in-house by our team of data-processing and IT professionals. The data were checked for consistency with automated logic checks during collection on the internet. At the analysis stage, the data were again checked both with industry-standard automated methods and with manual, visual and sense checks. Client deliverables were thoroughly compared with raw data toplines to ensure they reflected the collected data. Six respondents were removed from the data set because of “speeding” through the survey.
Appendix: Methodology
7

I O P I n s t I t u t e O f P h y s I c s t h e I m P a c t O f t u I t I O n f e e s O n P r O s P e c t I v e P h y s I c s s t u d e n t s 2 01 3 n O v e m b e r 2 01 3 17
Data analysisThe data was processed to produce a set of data tables with analysis breaks by trend (2012 and 2013), applicant type (accepters, rejecters), gender, ethnicity (white, non-white), social grade (AB, C1C2DE, other) and widening participation quintile (lowest 20%, next 20% and top 60%). The data tables indicate significant differences within data breaks (e.g. between male and female respondents).
This report is accompanied by a set of customised tables in electronic format. Each question is shown as a table analysed by key variables. Nets, means and significance testing are included. The findings in this report are based on a systematic analysis of these custom data tables, a process that involves identifying frequencies, commonalities and significant differences.
Placing your findings in the public domainIf the results of the commissioned research accredit YouthSight and the results are intended for the public domain, we have an obligation to check whether the report’s conclusions are supported by the data. We charge a modest fee for this; please ask for more details.
Citing the researchIf you are using any of the research in any literature, reports or press releases, we would be grateful if reference is made to YouthSight as the research provider. To comply with the MRS Code of Conduct (2010), the following information needs to be included in the publication:●● Name of research organisation that conducted the survey●● Fieldwork dates●● Data-collection method●● The “universe” effectively represented●● The sample size and its geographical coverage.
For example: “Fieldwork for this research was conducted by YouthSight between 1–6 March 2010. The sample consisted of 1024 interviews with students at 119 Higher Education (HE) institutions representative of the UK HE population in terms of gender, year group and university type.”
Contact for further informationSarah NewtonSenior Research ExecutiveYouthSightHighbury Crescent Rooms70 Ronalds RoadLondon N5 1XATel 020 7288 8789E-mail [email protected]
7: Appendix: Methodology

For further information contact:Tajinder Panesor
76 Portland Place, London W1B 1NT Tel +44 (0)20 7470 4800E-mail [email protected]
Charity registration number 293851 Scottish Charity Register number SC040092
The report is available to download from our website and if you require an alternative format please contact us to discuss your requirements.
The Kitemark is a symbol of certification by BSI and has been awarded to the Institute of Physics for exceptional practice in environmental management systems.
Certificate number: EMS 573735