a review of gas-fed pulsed plasma thruster research over...
TRANSCRIPT

A Review of Gas-Fed Pulsed Plasma Thruster
Research over the Last Half-Century
John K. ZiemerElectric Propulsion and Plasma Dynamics Lab (EPPDyL)
Princeton University
Introduction
This is summary of gas-fed pulsed plasma thruster (GFPPT) work from the late1950’s until the present year. The scope includes coaxial, parallel-plate, z-pinchand hybrid geometries using ambient fill or pulsed gas injection techniques withhydrogen, nitrogen, argon, and xenon propellants. The topic is generally limitedto “pulsed” devices where the total operation time is less than any plasma orcurrent stabilization time, that is, excluding any “quasi-steady” thrusters. Bothcapacitor and transmission line (lumped inductor-capacitor) energy sources areconsidered, however, purely inductive discharges are not due to the absence ofelectrode effects that may be very important in more prevalent GFPPT designs.
This review is divided into three parts according to the place where theresearch was conducted, the overall subject matter, and then an overview anddiscussion. In the first part, each section individually covers the work at GeneralDynamics, General Electric, Lockheed, Republic Aviation, NASA, and Prince-ton. In the second part, using a combination of repeated information from theprevious part as well as new citations from other laboratories, the subjects ofcurrent sheet structure and stability (including canting), current sheet accel-eration models, theoretical performance scaling, and experimental performancemeasurement. Both of these parts are designed to stand alone for the conve-nience of the reader although the first part is designed to provide a much moredetailed coverage while the second part is more of a summary. Finally, in thelast part, a brief overview of research from over the last half-century and adiscussion on the current and future GFPPT research will be presented.
In general, this review tries to make use of peer-reviewed journal publicationsinstead of non-reviewed conference papers or technical reports. Although some-times these will be used to supplement the information contained in the journalarticles, frequently the content is very similar. For each section, there will be asummary of the research data and proposed theories presented in the reviewedarticles as well as a separate discussion sub-section consisting of this author’srelevant theories and opinions on the topic. Previous reviews of GFPPTs havefollowed a similar, although perhaps more compressed, format [1, 2, 3]. In this
1

case, the author is trying to summarize more than simply the best or final re-sults from each group, rather, the history, lineage, progress, and lessons learnedalong the way are also explained in detail. With this approach, both the readerwho is interested in a detailed chronology or a simple summary should both besatisfied.
At this point, it should be noted that with the many ways to measure GF-PPT performance used in the literature including calorimetry, ballistic pendu-lums, streak and Kerr-cell photographs, electric probes, and thrust stands, onlythe thrust stand provides a direct measurement that has been accepted by theresearch community [2] and is not influenced by assumptions of sweeping effi-ciency, initial propellant density distribution, ionization fraction, etc. However,this technique along with all the others are susceptible to the influences of ad-sorbed gas and organic mono-layers on the electrode surfaces [4, 5] common tomany vacuum facilities and pump-down procedures. Except where noted, theauthor will only use thrust stand data to compare performance (impulse, spe-cific impulse, thrust-to-power ratio, efficiency) while elucidating the degree towhich, if at all, the investigators took into account the possibility of this typeof contamination in their observations.
Part I
Research by Laboratory
1 General Dynamics
D.E.T.F. Ashby, R. Dethlefsen, T.J. Gooding, B.R. Hayworth, A.V. Larson, L.Liebing, R.H. Lovberg, and L.C. Burkhardt (Los Alamos). 1962-1966
Burkhardt and Lovberg began researching “plasma guns” (see Ref. [6]) asa high velocity source of plasma for fusion research in 1962 at Los Alamos [7].Investigating a coaxial geometry, they used deuterium for propellant that wascontrolled and radially injected by a solenoid valve through ports approximatelyhalf-way down the center electrode. Fast ion-gauge pressure measurementsshowed that the propellant distribution was relatively gaussian around the in-jection ports (with all the propellant contained within the electrode volume)just before the discharge. The discharge was initiated when the pressure be-tween the electrodes became high enough for a Paschen breakdown. The overalldensity and mass bit were controlled by the plenum pressure upstream of thesolenoid valve. Depending on pressure, the breakdown occurred near the breach(low pressure with long times before paschen breakdown) or near the propel-lant ports (high pressure with almost immediate breakdown, frequently asym-metric) [8]. For this accelerator design, the center electrode was the cathode(router = 4.7 cm, rinner = 2.5 cm, radius ratio= 1.88) using a 15 µF capacitorbank charged to 16 kV (1.92 kJ) for each pulse. At a low-pressure test condition
2

using about 40 µg of propellant, the peak current (110 kA) was reached in 0.7 µssuggesting about 100 nH of parasitic inductance and yielding a very oscillatorycurrent waveform.
At these conditions, the sheet speed was observed to asymptote to 125 km/sindicating that the current sheet was permeable and not acting like a “snow-plow”. An effective sweeping efficiency of 50% was estimated based on a pre-dicted computer model of the acceleration process. The peak current and cur-rent density were observed to decrease monotonically with decreasing initialpropellant density. Electric field probe data showed that the radial electric fieldwas close to zero, which is to say that almost the entire capacitor potential wastaken up by the expanding magnetic fields and back emf with almost no resistivevoltage drop, only 80 V out of 16 kV. Other E-probe data showed that an axialelectric field exists within the current sheet, along the direction of acceleration.The average value of the integrated axial field, 167 V, is just enough to prediction velocities of 125 km/s if only half the ions were accelerated to that speed(consistent with a 50% sweeping efficiency). The axial field value was less nearthe outer electrode (anode), only 50 V, which is consistent with the 1/r2 Lorentzforce profile, however, the current sheet itself was seen to be very planar frommagnetic field data at different radii. The authors suggested this was either dueto higher propellant densities near the center electrode or possibly because of in-creased ion current near the anode with more research being indicated. Lovbergconducted the same kind of measurements using nitrogen and argon in the samedevice at a later time and found similar, permeable, shock-like behavior [9].
In 1963 Lovberg joined General Dynamics and continued his work alongwith Gooding and Hayworth on GFPPTs for propulsion applications. Theydeveloped a similar GFPPT design using, again, radial propellant injection (thistime, located closer to the backplate) and paschen breakdown initiation [8].The thruster was slightly smaller with router = 3.8 cm, rinner = 1.9 cm, andradius ratio= 2 with a 5 µF capacitor bank charged between 10-20 kV (0.25-1.0 kJ) for each pulse. At low mass bits they once again reached 105 m/s sheetspeeds, however spoking instabilities made measurements at higher mass bitsdifficult to interpret with streak photos. They suggested that when a GFPPThas a “slug-like” propellant distribution, as one would like for dynamic efficiencyconsiderations, it is subject to spoking instabilities. Also, they suspected thattheir stainless-steel electrodes contributed to the spoking by forming residual“magnetic spots” where the current-spoke would always return. They tested thistheory by rotating the center electrode and observing that the spoke attachmentfollowed the rotation1
Subsequent thruster designs used more injection ports that were equallyspaced down the center electrode to provide a more uniform propellant fill [11](see Figure 1). General Dynamics also developed their own capacitor with dis-tributed internal inductance to give more of a square-wave current pulse (200 kA
1Author’s note: this could have also been caused by the propellant distribution comingfrom the cathode propellant injection ports. If one injection port was favored over anotheryielding a slightly higher mass flow rate and pressure, the spoking instability might followthat injection port. This has been noticed in other GFPPTs more recently as well [10].
3

Figure 1: Schematic drawing of General Dynamics GFPPT. Taken fromRef. [11].
peak). With a total capacitance of 22 µF charged to 6.3 kV (437 J) and us-ing nitrogen for propellant, they measured sheet velocities of 105 m/s and 30%efficiency from a calorimeter. They also saw a significant improvement in per-formance by reducing the electrode length from 13 to 8 cm, largely attributedto decreased wall loses. The 30% efficiency point was taken with the shorterelectrodes which were “tuned” so that the discharge reaches the end of the elec-trodes when the current crosses through zero. These measurements of sheetvelocity suggested that the current sheet in this thruster did behave as a snow-plow with close to a 100% sweeping efficiency. Faraday cups placed into theexhaust beams measured ion velocities consistent with the previous sheet speedmeasurements and calorimetry data [12]. The losses in this thruster were at-tributed to low dynamic efficiency and the inability to recover much, if any,thermal energy in the plasma as a significant fraction of it was thought lostthrough inelastic electron-ion collisions and the subsequent radiation [13].
In 1964 Lovberg began experiments investigating the current sheet structureincluding the use of Schlieren photography [14, 15]. In the first set of experi-ments [14], a parallel-plate geometry was studied for the ease of optical access.With a height of 3.8 cm and a width of 8 cm, Lovberg believed that field fringingeffects would be negligible due to the small aspect ratio of less than two. Theaccelerator was powered by a 3 µF capacitor charged to 16 kV (384 J) withabout 64 nH of measured parasitic inductance. The accelerator exhausted intoa small vacuum chamber with the entire volume prefilled to 0.3 Torr of hydro-gen (26 µg in 6 cm long electrode volume, n0 = 1016 cm−3). The speed of the
4

first current sheet was measured using photographs at 80 km/s which agreedwell with a snowplow model and 100% sweeping efficiency. The second sheet,coming from the second period of current oscillation, traveled at 110 km/s withbarely any density gradient detectable by the Schlieren system suggesting thatthe first sheet had indeed swept up most of the gas between the electrodes.
The Schlieren photographs showed a very planar, thin (0.5 to 1 cm) currentsheet with electron densities of 1017 cm−3 (about 10 times larger than the initialambient fill) indicating that most of the propellant mass was compressed into athin layer as a snowplow model would suggest. There were also strong densitygradients observed in a very thin layer all along the cathode suggesting thata small part of the plasma was being left behind there. Lovberg speculatedthat the electrons are trapped in their gyro-orbits and cannot conduct sufficientcurrent to the cathode. He believed that either the cathode would have to beemitting a large amount of electrons to make up for this lack of conduction orthat the ions were conducting a bulk of the current near the cathode producinga larger, localized density. Finally, Lovberg noticed that the sheet began to“bifurcate” as the electrodes became more and more “discolored” from eachpulse2. Cleaning the electrode corrected the problem, however, in tests withnitrogen, the bifurcation always existed with a thin, diagonal sheet leading themain sheet at the anode. He suggested this was “almost certainly related to thelarger ion gyro-radius” of the molecules with no further explanation.
His second Schlieren experiment used a specially designed coaxial electrodeset with a slotted outer electrode for optical access [15]. Again, the slightlylarger thruster (router = 7.5 cm, rinner = 2.5 cm, radius ratio= 3) was backedwith the same 3 µF capacitor charged to 16 kV (384 J) to produce a 105 A peakcurrent oscillatory waveform. The ambient hydrogen density, however, was veryhigh for this large electrode set giving about 250 µg within the discharge volume.Still, the current sheet reached the end of the electrodes in about 1 µs (6.5 cmlong, 65,000 km/s on average) just as the current was crossing through zero.
For the coaxial thruster, the Schlieren photographs showed a very complexdistribution of density with a parabolic shaped front centered on the centerelectrode (anode) followed closely by a ticker, planar front, as shown in Figure 2.Throughout the course of the discharge, the parabolic front moved out aheadof the planar front (120 km/s compared to 50 km/s) while the planar front’sthickness increased. Although reversing polarity showed minimal effects (theparabolic front always moved out on the center electrode faster), when the centerelectrode was negatively charged (cathode) the planar front became much morediffuse. In both cases, the parabolic front moved much faster than expected (>2x) from a snowplow model with the ambient mass density, although it did havethe shape expected from the non-uniform Lorentz force. The parabolic front wasalso found to contain between 80-90% of the current with B-dot probes. Plasmadensities were estimated to be about 1016 cm−3, almost the same as ambientconditions. Once again, Lovberg reached the conclusion that the current sheet
2Please see the following discussion subsection for a possible contamination concern ofthese measurements
5

Figure 2: Schlieren photographs taken of discharge in slotted, coaxial acceleratorusing hydrogen propellant at 0.5, 0.7 and 1.0 µs (left to right) after initiation.These figures show positive polarity (center electrode is anode). Taken fromRef. [15].
in this thruster was permeable and did not act like a perfect snowplow, ratherlike a strong shock-wave. Lovberg also saw large radial density gradients nearthe outer electrode (cathode) which could have been caused by either plasmaleaking through the optical access slits or by plasma building up near the outerelectrode (cathode) walls. Finally, shortening the center electrode had relativelyno effect on the plasma front shape or speed with the pinch column beyondthe shorter electrode forming a “virtual electrode” with strong radial densitygradients.
Lovberg’s final current sheet structure experiment used both a capacitordriven discharge with parallel-plate electrodes, and an inductively driven theta-pinch that sought to eliminate the effects of electrodes altogether [16]. Asthe second apparatus showed very different behavior than conventional dis-charges with electrodes, those results will not be included here. Returningto the parallel-plate geometry for its more efficient snowplow behavior and one-dimensional nature, Lovberg used electric field and B-dot probes to infer currentconduction through a generalized Ohm’s law. Assuming the gas is already fullyionized and in the moving reference frame of the current sheet:
~E + ~vi × ~B − 1nee
[~× ~B −∇pe
]− η~ = 0, (1)
which includes the Hall effect. Using a right-handed coordinate system withthe z-axis in the direction of current sheet motion and the x-axis perpendicularto the electrode surfaces, the vector equation can be broken down into twoequations,
Ez + vixBy − 1nee
[jxBy − ∂pe
∂z
]= 0, (2)
Ex − vsheetBy − ηjx = 0, (3)
with the following assumptions: uniformity in the y-direction and current car-ried only in the x-direction. Neglecting ion current and assuming the pressure
6
gradient is small,neeEz = jxBy. (4)
This relation infers that the electron current creates an axial Hall electric fieldwhich subsequently accelerates the ions. Lovberg goes on to say that, in general,GFPPTs could be called “pulsed Hall accelerators”. If the current sheet itself isthe ionization source, then Lovberg postulates a slightly different story. Uponentering the sheet, a neutral atom is ionized and both particles begin to rotateabout their gyro-centers in the strong magnetic field. Without collisions andassuming that the thruster geometry dimensions are much bigger than the iongyro-radius, the separation of the ion and electron gyro-centers in the x-directionwill cause a displacement current proportional to the rate at which the sheetpicks up and ionizes more atoms. In this case, there is no polarization field(the gyro-centers do not separate in the axial direction), and both the ions andelectrons effectively carry the current and feel a Lorentz force on ion cyclotrontime scales. Near the electrodes, the finite gyro-radius effects dominate with ahigh voltage sheath required to bring in electrons near the anode, and an axialelectric field developing near the cathode where the ions cannot complete a fullgyro-orbit. Qualitatively, Lovberg found this to be the case using hydrogen,with strong density gradients near the cathode and about a 100 V sheath nearthe anode. Using Nitrogen, or any other higher molecular weight propellant,however, he found that “electrode effects” dominated the discharge pattern asthe gyro-radius for the ions became on the same order as the thruster’s electrodespacing.
The last two publications from General Dynamics included a summary ofthe work from 1963-1965 in a NASA contract report [17] and a final journalpaper which suggested that a longer, quasi-steady discharge would have a higherefficiency while still benefitting from the arbitrary low power consumption dueto the pulsed nature of the device [18]. Without going into further details ofthe quasi-steady thruster development, and without repeating the informationalready provided above, the contract report brought out the following pointsthat were not published elsewhere:
• Spoking and other discharge initiation instabilities went away when the de-pendence on gas pressure and corresponding paschen breakdown to controlthe initiation timing was removed with the addition of an gas-dischargeswitch.
• Efficiency of uniformly filled thrusters never exceeded 50% due to dynamicefficiency (calorimetry data).
• A steady-state thrust stand was develop and showed that with pulsed,non-uniform, gas injection the efficiency could be greater than 50%.
• Confirmed Guman’s discovery (Ref. [4] of impulse decay with successivepulses and took thrust stand data accordingly, after at least 100 pulses.
7

• Used a limited number of different charging voltages and gas pressuresto determine optimum operating conditions from thrust stand measure-ments using nitrogen and xenon (see next subsection for a summary ofperformance data.)
• Found that calorimetry data over-estimated the performance by a sig-nificant amount due to inclusion of plasma internal energy captured bycalorimeter that is not recovered as thrust.
• The average axial velocity of ions in the exhaust was found to be greaterthan the average velocity calculated from thrust measurements by as muchas a factor of two.
• Duplicated General Electric’s A-7D thruster (see next section on workat GE) in geometry, capacitance level, propellant delivery, and dischargeinitiation scheme to find it delivered only about 1/3-1/2 the reportedperformance.
1.1 Summary of GD Performance Measurements
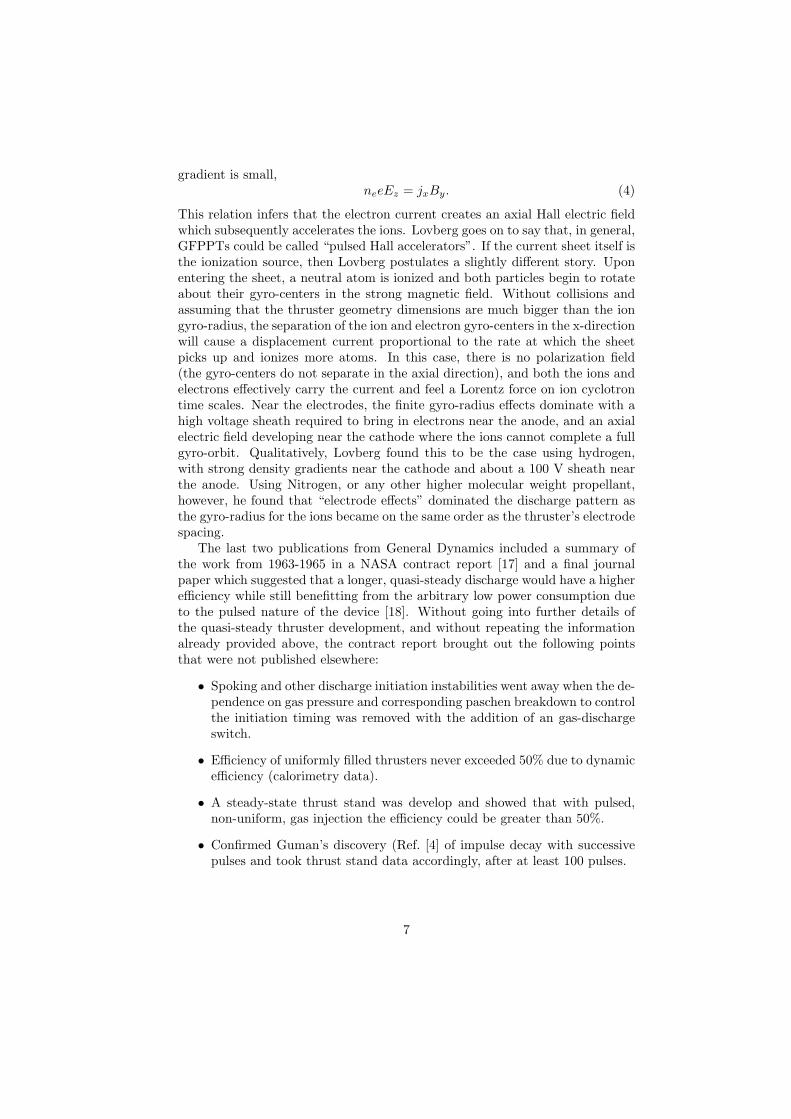
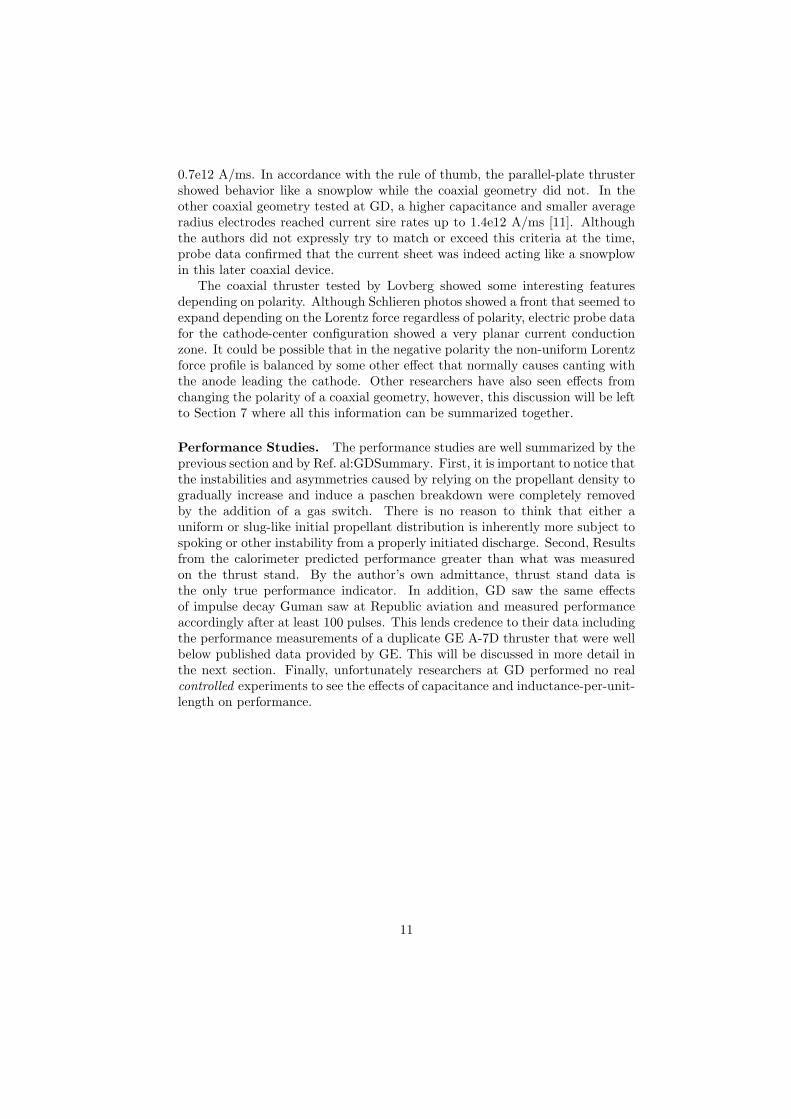
The measurements presented here were performed during the later stages ofGFPPT development at General Dynamics [17] using a thrust stand (pulsedoperation at 10 Hz gave effective “steady” measurement and average impulse bit)and an appropriately conditioned thruster to eliminate contamination effects.The capacitance was increased to a final value of 140 µF with a distributedinductance giving nearly a square current pulse. The geometry of this thrusterwas slightly different than that of Figure 1. The length of the center electrodewas shorter (5.5 cm) with the same radius (1.9 cm) while the outer electrodewas about the same length (15.8 cm) but had a larger radius (6.25 cm). Thenew radius ratio was about 3.3. The propellant was injected radially at thebreech with the discharge initiation timing controlled by a gas-discharge switch.Propellant utilization was measured to be just over 60% with nitrogen and a350 µs delay. The mass bit was controlled by changing the feed pressure andthe quantity was determined by integrating measured density profiles. Bothnitrogen and xenon data were used in this study as shown in Tables 1 and 2and Figures 3 and 4. In general, the efficiency varied from 6 to 56%, the specificimpulse varied from 350 to 13,000 s, and the thrust-to-power ratio varied from33.5 to 8.7 µN/W, respectively, depending mass bit and energy. As expected,the highest efficiencies corresponded to the highest energy and lowest mass bitvalues, however, the thrust-to-power ratio is largest at the lowest energy andhighest mass bit values.
Thrust stand data was also obtained using a GFPPT very similar in designto General Electric’s A-7D GFPPT with axial propellant flow (xenon) and a sep-arate high-voltage discharge initiation system. GE’s mass injection scheme wasduplicated very closely to insure the same propellant utilization (> 90%) anddensity profiles. While faraday cup measurements of ion velocity and exhaustbeam divergence were very similar to those obtained at GE (see next section),
8

thrust stand and performance measurement data disagreed with significantlylower values measured at General Dynamics [17]. Table 3 shows performancevalues at four energy levels. For this device, the efficiency is relatively con-stant at a fixed energy while the thrust-to-power ratio still shows a tendency todecrease with increasing energy and decreasing mass bit.
1.2 Discussion of Research at GD
The research at General Dynamics can be broken into two related subject areas:current sheet studies (mainly conducted by Lovberg) and performance studies.
Current Sheet Studies. In the current sheet studies, Lovberg used electricfield and B-dot probes [7, 9] as well as Schlieren photography to investigate thenature of the current sheet and acceleration process in both parallel-plate [14]and coaxial [15] geometries using mainly hydrogen for propellant. One of themain questions he was trying to answer was if the current sheet behaved as asnowplow or a strong shock-wave.
In the parallel-plate geometry, he saw a very planar, thin current sheet thathad an electron density ten times that of the ambient pre-pulse density. Inaddition, probe data on arrival time agreed well with the visual indications ofthe front. He concluded that the sheet did behave as a snowplow effectivelysweeping up all the gas in front of it. He also found that there was a strongpolarization field and speculated that the electrons were conducting all of thecurrent, experiencing a Lorentz force which then slightly separated them fromthe ions. The polarization field that develops as a result of this separation wasmeasured to be enough to explain the subsequent ion acceleration. Using gasessuch as nitrogen and argon he saw the sheet “bifurcate” with the bulk of the cur-rent being carried on a canted sheet, anode leading cathode. He did not studythis phenomenon in depth but suggested that it was a result of the higher molec-ular weight, and subsequent larger gyro-radii, of nitrogen and argon molecules.It should be noted at this point, however, that the absence of any canting inLovberg’s parallel-plate Schlieren experiments with hydrogen could have beendue to surface effects on the electrodes. Lovberg did, in fact, notice the same“bifurcation” in hydrogen after many pulses. He blamed the appearance ofthis“unstable” behavior on dirty electrodes and cleaned them to find repeatablebehavior. Other authors, however, have noticed that discharge behavior onlybecomes repeatable after many pulses due to adsorbed gases collected whilethe vacuum vessel is exposed to atmosphere and organic monolayers (pump-oil) deposited during pumping [4, 5]. These “contaminants” are blown off theelectrode surfaces after a number of pulses, and “cleaning” them as Lovbergdid to re-produce the planar sheet would have to include venting the vacuumvessel and going through another pump-down procedure. The extra gas emittedfrom the surface of the electrodes during a discharge could radically change theoverall behavior of the current sheet, especially near the cathode. Still, Lovbergdid see the canting using nitrogen and argon by, more than likely, using the
9

same procedure as in those studies with hydrogen. To date, the effects of theelectrode surface condition on current sheet canting are still unresolved.
In the coaxial geometry using hydrogen, nitrogen, and argon, he saw verydifferent features depending on polarity. In some of his earliest papers, Ref. [7,9], the center electrode was at cathode potential and the current sheet seemed tobe planar from field probe measurements. With the sheet speed measured fromprobe data being about twice that expected from a snowplow model and the factthat the current sheet itself was not bowed due to the 1/r2 Lorentz force profile,he concluded that the sheet did not behave like a snowplow. Electric field datashowed a similar polarization field to that seen in the parallel-plate geometry,however, it dropped off towards the anode. Although this might be expectedwith a non-uniform Lorentz profile, the polarization field was no longer strongenough for the ions to be accelerated to sheet speed near the anode. Lovbergpostulated that that the current sheet was permeable and acted more like astrong shock-wave. In fact, what Lovberg might have been observing was asignificant contribution from ion conduction along with a permeable sheet.
In the case of the reverse polarity and using the Schlieren technique with aslotted outer electrode (Ref. [15]), the current sheet was seen to separate intotwo layers. The leading sheet was seen to bow out along the center electrode asshould be expected by the non-uniform Lorentz force in a coaxial accelerator. Inthe second, planar layer, he saw a much more diffuse region that did not conductmuch current, possibly from a small amount of ion conduction to the cathode.Integrating the gradient information from the Schlieren photos showed thatthe electron density was about the same as the ambient conditions indicatingthat this again did not behave like a snowplow, rather like a strong shock. Apossible explanation for this behavior was the possibility of ion conduction tothe cathode which could leave a large number of recombined molecules near thecathode moving only with thermal speed, much slower than the sheet speed.The presence of strong radial density gradients near the cathode seemed toagree with that theory, although Lovberg still did not rule out other possibilitiescorresponding to the electrons carrying all the current.
It is interesting to note that the current rise times are very similar in thetwo geometries Lovberg tested, however, the current rise per unit width (inthe case of a coaxial geometry the average circumference must be used) is verydifferent. To compare the two, consider unwrapping the coaxial geometry tomake it like a parallel-plate thruster. The effective width is equal to the averagecircumference of the electrodes. From this comparison, it is easy to see that theeffective width of the coaxial electrodes is much greater than the typical parallel-plate geometry. Distributing the same total current over the two geometries,the current density and inductance-per-unit length are much less in the coaxialthruster. Jahn has pointed out that thrusters with current rise rates per unitwidth of less than 1012A/(m · s) have empirically been shown to have less than100% sweeping efficiency [1]. In the case of Lovberg’s experiments, this criteriaalso holds true: the parallel-plate accelerator has a width of 8 cm and a currentrise rate of 250e9 A/s giving about 3e12 A/ms while the coaxial geometry hasan average width of 22.6 cm and a current rise rate of 160e9 A/s giving about
10
0.7e12 A/ms. In accordance with the rule of thumb, the parallel-plate thrustershowed behavior like a snowplow while the coaxial geometry did not. In theother coaxial geometry tested at GD, a higher capacitance and smaller averageradius electrodes reached current sire rates up to 1.4e12 A/ms [11]. Althoughthe authors did not expressly try to match or exceed this criteria at the time,probe data confirmed that the current sheet was indeed acting like a snowplowin this later coaxial device.
The coaxial thruster tested by Lovberg showed some interesting featuresdepending on polarity. Although Schlieren photos showed a front that seemed toexpand depending on the Lorentz force regardless of polarity, electric probe datafor the cathode-center configuration showed a very planar current conductionzone. It could be possible that in the negative polarity the non-uniform Lorentzforce profile is balanced by some other effect that normally causes canting withthe anode leading the cathode. Other researchers have also seen effects fromchanging the polarity of a coaxial geometry, however, this discussion will be leftto Section 7 where all this information can be summarized together.
Performance Studies. The performance studies are well summarized by theprevious section and by Ref. al:GDSummary. First, it is important to notice thatthe instabilities and asymmetries caused by relying on the propellant density togradually increase and induce a paschen breakdown were completely removedby the addition of a gas switch. There is no reason to think that either auniform or slug-like initial propellant distribution is inherently more subject tospoking or other instability from a properly initiated discharge. Second, Resultsfrom the calorimeter predicted performance greater than what was measuredon the thrust stand. By the author’s own admittance, thrust stand data isthe only true performance indicator. In addition, GD saw the same effectsof impulse decay Guman saw at Republic aviation and measured performanceaccordingly after at least 100 pulses. This lends credence to their data includingthe performance measurements of a duplicate GE A-7D thruster that were wellbelow published data provided by GE. This will be discussed in more detail inthe next section. Finally, unfortunately researchers at GD performed no realcontrolled experiments to see the effects of capacitance and inductance-per-unit-length on performance.
11

Impulse Bit Mass Bit Isp Energy T/P Ratio Efficiency(mNs) (µg) (s) (J) (µN/W) (%)
1.5 29 5,200 158 9.5 243.0 124 2,400 158 19.0 233.8 348 1,100 158 24.1 132.4 29 8,300 280 8.6 363.9 126 3,100 280 13.9 225.8 348 1,650 280 20.7 173.8 29 13,000 438 8.7 565.4 113 4,800 438 12.3 307.5 348 2,150 438 17.1 18
Table 1: General Dynamics GFPPT Performance using nitrogen. Taken fromRef. [17], runs 46a-46i.
Impulse Bit Mass Bit Isp Energy T/P Ratio Efficiency(mNs) (µg) (s) (J) (µN/W) (%)
2.8 120 2,360 158 17.7 213.9 543 710 158 24.7 95.3 1490 350 158 33.5 64.4 120 3,600 280 15.7 285.8 543 1,060 280 20.7 117.0 1490 460 280 25.0 65.4 120 4,500 438 12.3 288.1 543 1,500 438 18.5 1312.1 1490 810 438 27.2 11
Table 2: General Dynamics GFPPT Performance using xenon. Taken fromRef. [17], runs 45a-45i.
12
60
50
40
30
20
10
0
Eff
icie
ncy
(%
)
14x103 1086420
Specific Impulse, Isp (s)
N2 Xe Energy
158 J 280 J 438 J
Figure 3: Graph of efficiency vs. specific impulse for the General DynamicsGFPPT. Data taken from Ref. [17] and also presented in Tables 1 and 2.
35
30
25
20
15
10
5
0
Th
rust
-to
-Po
wer
Rat
io (
µN
/W
)
2 3 4 5 6 7 8 9100
2 3 4 5 6 7 8 91000
2
Mass Bit (µg)
N2 Xe Energy
158 J 280 J 438 J
Figure 4: Graph of thrust-to-power ratio vs. mass bit for the General DynamicsGFPPT. Data taken from Ref. [17] and also presented in Tables 1 and 2.
13

Impulse Bit Mass Bit Isp Energy T/P Ratio Efficiency(mNs) (µg) (s) (J) (µN/W) (%)0.65 29 2,200 63 10.3 110.72 35 2,100 63 11.4 120.73 52 1,400 63 11.6 80.86 29 2,900 109 7.9 121.03 35 3,000 109 9.4 141.15 29 3,900 158 7.3 141.32 35 3,800 158 8.4 161.46 52 2,800 158 9.2 131.73 69 2,500 158 10.9 142.04 98 2,100 158 12.9 131.73 29 5,900 280 6.2 182.05 42 4,900 280 7.3 182.02 47 4,300 280 7.2 162.22 52 4,300 280 7.9 173.33 98 3,400 280 11.2 20
Table 3: General Dynamics GFPPT Performance using a similar design to GE’sA-7D thruster with xenon propellant. Taken from Ref. [17], runs 80-93.
2 General Electric
P. Gloersen, B. Gorowitz, T.W. Karras, J.T. Kenney, and J.H. Rowe.1963-1970
General Electric started research in 1963 with a long, coaxial acceleratorclosely resembling the first Marshal (see Ref. [6]) plasma guns [19]. The “ModelR” accelerator has a two-stage design (similar to a conventional single-stagethruster with a gas switch as the first-stage) and used helium, argon, and mostoften nitrogen as propellants. The second stage provided most of the acceler-ation with router = 8.75 cm, rinner = 5 cm, radius ratio= 1.75, and length =47.5 cm from the propellant injection ports (themselves located 7.5 cm fromthe backplate). Using a 15 µF capacitor bank (for the R-1 and R-2 model)that could be charged up to 13 kV (1.27 kJ) for each pulse, the discharge wasinitiated with a paschen breakdown in the first stage when the propellant pres-sure became high enough. Small injection holes allowed some propellant to flowinto the main accelerating region before the breakdown in the first stage. Withnitrogen flowing at a steady rate of 100 mg/s, according to this author’s calcu-lations, only 10% of the propellant remained inside the accelerator at initiation.In this device, peak currents reached 100 kA in about 2 µs with about 90 nH
14

of parasitic inductance and a very oscillatory current waveform3. Calorimetrymeasurements showed an efficiency of about 12% at 100 J, and increasing the ca-pacitance to 45 µF led to a 26% efficiency at the same voltage. Non-conventionaldefinitions of performance using “energy at terminals” and “effective mass bit”,however, made comparing the performance difficult. In addition, although athrust-stand was operational at this point, it was not used extensively in thesefirst tests.
In 1964, General Electric began parametric performance studies on the ef-fects of changing energy, capacitance, and initial inductance in the Model Raccelerators [20]. First, a theoretical model for the acceleration process includ-ing a snowplow model for gas accumulation and a circuit equation neglecting theplasma resistance was used to show that reducing the initial inductance wouldlead to less oscillatory waveforms and better coupling between the driving circuitand the moving discharge. Their model also predicted that efficiency would scaleas the inverse of the mass bit with the energy and capacitance kept constant.Increasing energy and capacitance was also found to increase efficiency and spe-cific impulse. Modifications to the Model R gun led to a reduction in initialinductance (15 nH) and improved propellant utilization. Calorimeter measure-ments showed that the initial inductance drop corresponded to an increase inefficiency up to about 16% at 100 J (an increase by a factor of 1.5). Changesin capacitance (and hence energy at the same voltage) from 15 to 75 µF alsoimproved performance in close to a linear relation. Performance improvementswere also seen from increasing the radius ratio, going to a radial instead of axialgas-injection scheme, and shortening the length of the electrodes, especially theinner electrode.
These trends in performance led to the development of the “Model A” gunsthat were single stage, pulse injected, coaxial accelerators with much shorterelectrodes (20-30 cm), large radius ratios (7-10), and even a smaller initial in-ductance (about 15 nH) that lead to nearly critically damped current wave-forms [20]. The “first stage” of the Model R guns was replaced by a small plenumand solenoid valve combination with pulse times of about 100 ms. Please see Ta-ble 4 for more details of the accelerator properties and Ref. [20] for a completeaccount of modifications. Only the most clear and experimentally controlledconclusions will be summarized here.
In the A-1 and A-3 guns, two zones of performance scaling (again mea-sured with calorimetry) were noticed depending on initial capacitor voltage. Atlower energies, initial voltages below 4 kV, the efficiency scaled linearly withvoltage while at higher energies it remained relatively constant. Again, as thepaschen effect controls the breakdown time and hence the amount of propellantthat is able to flow before and after the discharge, higher voltages led to lowerpropellant utilization and hence the efficiency stopped increasing even as thedischarge energy was increasing. A small collection of calorimeter performancemeasurements below the voltage cut-off point for the A-1 accelerator with vary-
3Author’s note: initial inductance measured from the current trace (initial slope) actuallygives a lower value for the initial inductance close to 45 nH.
15

Model rinner router length Prop. Injection Capacitance Trigger(cm) (cm) (cm) Area (mm2) (µF)
R-1 5.0 8.75 55 - 15-75 gasA-1 1.27 8.75 35-20 8.6 15-45 gasA-3 1.27 12.5 20 8.6 45 gas
A-4(T) 1.27 12.5 20 95 45 gasA-6 1.27 12.5 20 95 45 elec.
A-7D 1.27 20† 20 540 45-145 elec.A-8D 1.27 20† 20 680 45 elec.A-9D 1.27 20† 20 830 45 elec.
Table 4: General Electric accelerator properties, † denotes flared outer electrodefrom 12.5 to 20 cm over the 20 cm length. Taken from Refs. [20, 21, 22].
ing energy and capacitance are shown in Table 5. The final design mentioned inRef. [20], the A-4, had a larger radius ratio, and short electrodes, 10 and 20 cmrespectively, with the highest reported energy conversion efficiency of 63% using45 µF charged to 3 kV (203 J). The A-4T modification had a teflon valve seatyielding higher propellant utilization at higher voltages.
Capacitance Voltage Energy Efficiency(µF) (kv) (J) (%)15 2 30.0 145 2 90.0 1815 3 67.5 1330 3 135 2145 3 203 27
Table 5: General Electrics calorimetry measurements for A-1 gun with varyingcapacitance and initial voltage.
In 1965, based on the success of the A-4 design, GE went through a numberof modifications to produce the A-6,A-7D,A-8D, and A-9D models [21]. Themajor modifications included:
• Electrical triggers (18 kV ”pins”) were introduced to eliminate initiationtiming dependence on paschen breakdown and increase propellant utiliza-tion.
• The outer electrode was flared to increase the inductance change anddecrease surface effects (surface to volume increased).
• Larger axial injection ports allowed better conductance of gas inside plenumto discharge volume and increased propellant utilization.
16

In addition, a steady-state thrust stand replaced calorimetric performance mea-surements with the thruster operating at 10 Hz, and performance measurementstaken as average quantities. General Electric’s definition of efficiency includeda “Q-factor” (depends only on capacitor type) that compensated for internalimpedance losses in the capacitor bank. The power supplied to the thruster wasdefined as,
P =12CV 2
0
(1− 1
Q
)fpulse. (5)
The 45 µF bank described here had a Q-factor of 7 leading to a power thatwas used in efficiency calculations to be 14% lower than that actually supplied.Erosion measurements showed only 0.25 µg per pulse were lost over 10,000pulses, and no impulse decay or other vacuum facility effect noticed in otherlabs were reported by GE. The electrode erosion rate was added to the mass flowrate for performance calculations, although this did not significantly alter theresults. With the higher propellant utilization efficiencies, overall performanceincreased to η = 70% at 9000 s, 81 J, and 7.4 µg Xe with the A-7D model.Figure 5 shows a schematic drawing of the A-7D model.
Figure 5: Schematic drawing of General Electrics A-7D GFPPT. Data takenfrom Ref. [22].
The increase in propellant utilization was explained in more detail in Ref. [22].Here the evolution of the mass injection system from the A-4T model to theA-9D was presented with the goal of high propellant utilization. The two majorchanges were to make the injection ports larger for better propellant conduc-tance and to make them face in more of an axial direction to prevent prematureself-triggering. Another major contributor to better propellant utilization was
17

the addition of a fast acting solenoid valve. The the o-ring sealed valve wasdriven by a 4.4 kV supply permitting a 1 ms cycle time. The discharge wasinitiated by six 18 kV trigger pins 0.7 ms after the valve cycle was started.With the relatively slow thermal velocity of xenon, over 90% of the gas injectedbefore each pulse remained within the electrode volume for the A-7D model.Fast ion-gauge neutral density measurements were used for the mass utilizationefficiency calculation and showed that most of the mass was near the cathode(center electrode) and well away from the backplate. The A-8D and A-9D hadsimilar results, however, not as high of performance with slightly more propel-lant loaded closer to the cathode for the A-8D and too much propellant ejectedtoo quickly (conductance was too large) in the A-9D.
After 1965, the only reports of GE performance came from conference pa-pers. In Ref. [23], Gorowitz, Gloersen, and Karras defended their A-7D perfor-mance measurements with detailed descriptions of experiments (but no tablesor graphs of data) that eliminated facility effects (except contamination to thisauthor’s satisfaction), thermal drifts in the thrust stand, spurious current con-duction to the tank or thrust stand, and contribution from electrode erosion.Once again, a 160 % performance improvement was shown from increasing thecapacitance from 45 to 145 µF (the Q-factor of the new capacitor bank wasgiven as 14). During a ten hour test running at 5 Hz (36,000 pulses total), theA-7D model used 30 µg xenon and 65.2 J (950 V) per shot to achieve a 57%overall efficiency with an Isp of 4930 s. The efficiency was seen to scale linearlywith specific impulse (constant thrust-to-power ratio of about 20 µN/W) andnot depend strongly on energy. Similar experiments using nitrogen showed aslightly smaller thrust-to-power ratio of 15 µN/W. A study of changing capaci-tance showed that efficiency scaled with the square-root of capacitance (within5-10%) for a constant specific impulse of about 5,000 s. The next subsectiongives more measurements with the A-7D model over a variety of mass flow ratesand initial voltages. Gorowitz left GE in mid-1966 with his final conferencepaper providing a mission study using the A-7D which, along with other, laterstudies, continually quote an efficiency of nearly 60% at 5,000 s [24, 25, 26].
The final journal paper published by GE dealing with GFPPTs was submit-ted in 1965 and published in 1966 [27]. It described a multi-grid ion collectiondevice that provided measurements of ion velocity and exhaust beam divergenceangle with the ability to distinguish between ions of different charge to massratios. Although the data agreed with predicted xenon velocities from impulsemeasurements, carbon and oxygen ions were also present in significant amounts.The amount of these “contaminant” ions varied with each pulse and were notbelieved to contribute significantly to the thruster impulse.
2.1 Summary of GE Performance Measurements
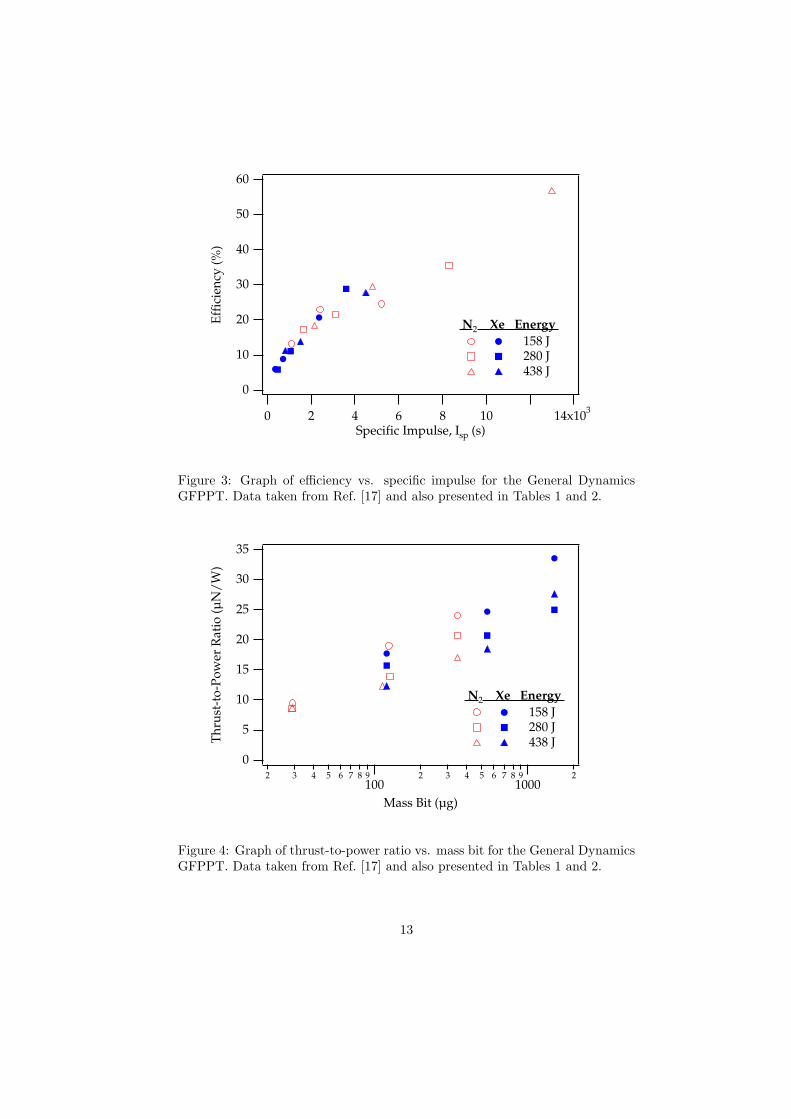
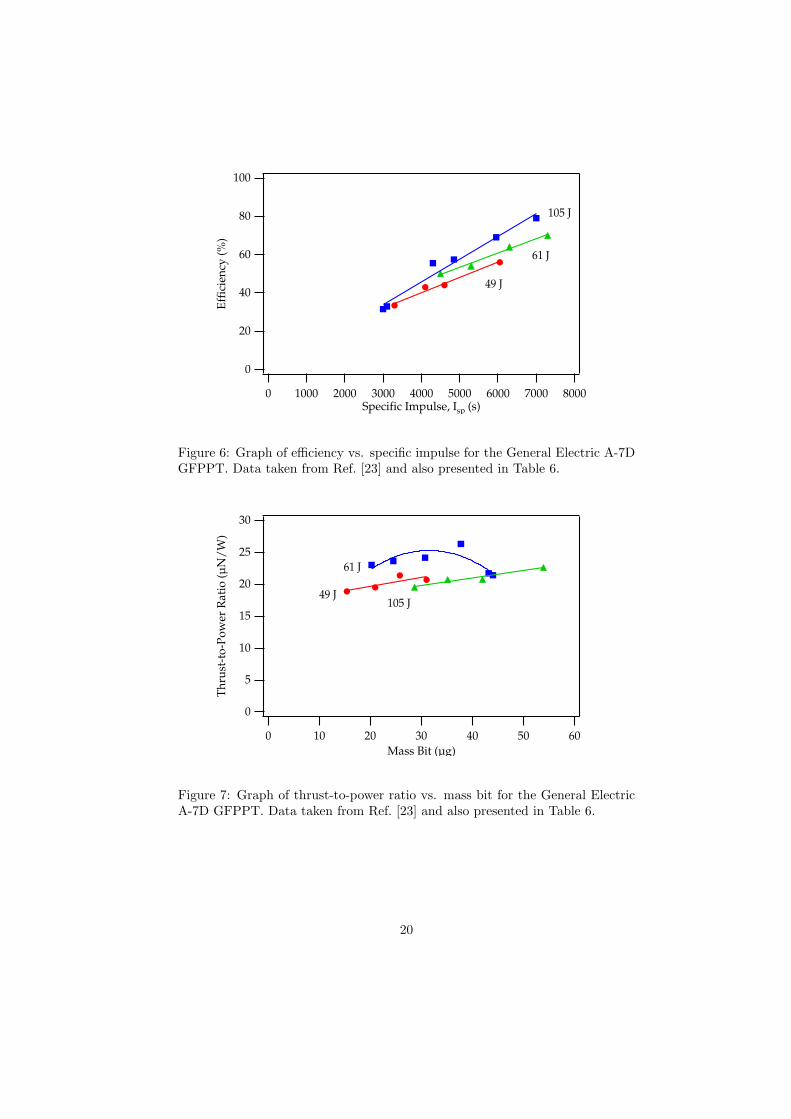
The measurements provided here in Table 6 and Figures 6 and 7 representthrust-stand measurements from GE’s A-7D model using xenon propellant anda 144.5 µF capacitor bank with a Q-factor of 14. Unfortunately, only energy(with Q-factor reduction), specific impulse, and efficiency were given in Ref. [23]
18

where all of this data is reported in graphic form. This is, however, the bestsource for pure data as GE did not frequently show many points in a dataset or any tabular presentation. The mass bit and impulse bit values must,therefore, be inferred from the reported specific impulse, voltage, and efficiencymeasurements,
I∗bit =2η
Ispg0
12CV 2
0
(1− 1
Q
), (6)
m∗bit =
I∗bit
Ispg0, (7)
where the star superscript indicates the inferred quantities. Finally, it must benoted that out of every lab conducting GFPPT performance measurements onthrust stands [4, 5, 17], GE is the only one that did not report any decreasein measured thrust or impulse over the first 100-1000 pulses after pump-down,including tests at similar mass bits and energies. As GE’s protocol for measuringthrust is not published explicitly except in very early publications, it is unclear ifany preconditioning of the thruster took place before the thrust measurements.More on this topic will be discussed in the following subsection.
Impulse Bit Mass Bit Isp Energy T/P Ratio Efficiency(mNs) (µg) (s) (J) (µN/W) (%)0.92 15 6,050 49 18.9 560.95 21 4,600 49 19.5 441.03 26 4,100 49 21.4 431.00 31 3,300 49 20.7 341.39 20 7,000 61 23.0 791.43 25 5,950 61 23.6 691.46 31 4,850 61 24.2 581.59 38 4,300 61 26.3 561.31 43 3,100 61 21.7 331.30 44 3,000 61 21.4 322.05 29 7,300 105 19.5 702.17 35 6,300 105 20.7 642.18 42 5,300 105 20.8 542.38 54 4,500 105 22.7 50
Table 6: General Electric A-7D GFPPT Performance with xenon propellant.The impulse bit and mass bit values have been inferred from published efficiency,specific impulse, and energy measurements. Taken from Ref. [23].
19
100
80
60
40
20
0
Eff
icie
ncy
(%
)
800070006000500040003000200010000Specific Impulse, Isp (s)
49 J
61 J
105 J
Figure 6: Graph of efficiency vs. specific impulse for the General Electric A-7DGFPPT. Data taken from Ref. [23] and also presented in Table 6.
30
25
20
15
10
5
0
Th
rust
-to
-Po
wer
Rat
io (
µN
/W
)
6050403020100
Mass Bit (µg)
49 J
61 J
105 J
Figure 7: Graph of thrust-to-power ratio vs. mass bit for the General ElectricA-7D GFPPT. Data taken from Ref. [23] and also presented in Table 6.
20

2.2 Discussion of Research at GE
General Electric has reported the highest efficiency measured on a thrust-standof any GFPPT. After many geometry and propellant injection schemes, theirbest design, the A-7D, had a large radius ratio of about 16, a 144 µF capacitorbank with only 15 nH of parasitic inductance, and a typical energy per pulseof close to 65 J. Using close to 30 µg of xenon per shot, the efficiency reached57.5% at a specific impulse of 4850 s. The efficiency was shown to be linear withexhaust velocity over a wide range of mass bits (smaller mass bits gave higherefficiency) with a relatively constant thrust-to-power ratio near 20 µN/W. Thepropellant utilization efficiency of this design exceeded 90% as a result of usingprimarily axial injection near the cathode, a 1 ms high-voltage solenoid valve,and separate discharge initiation timing allowed by using six 18 kV trigger pins.GE also conducted a performance survey over five different capacitance valuesfrom 50 to 200 µF to find that the performance scaled with the square-root ofthe capacitance to within 5-10%.
Unfortunately, the researchers at GE did not mention any impulse decay ef-fects that have been observed at three other laboratories testing the performanceof GFPPTs on thrust-stands in diffusion pumped chambers [4, 5, 17]. Althoughresearchers at GE did not notice any performance changes from changing thepulse frequency, details of the this experiment and its results were not given.It should be noted that rather than pulse rate, the total number of pulses hasbeen shown to be more important in conditioning the thruster for proper opera-tion. Without such conditioning, adsorbed gases from the electrode surfaces andorganic-monolayers from the roughing and diffusion pump oil can significantlyalter both the amount of mass in the discharge and the electrical conductionof the plasma near the electrode surface. Although these effects could indeedbe beneficial to performance, true performance as would be expected in spaceoperation, can only be measured after a conditioning period, and only as long aspump oil is not allowed to migrate to the thruster electrodes between dischargesor test runs.
Three other pieces of evidence suggest that the performance measured atGE might include contamination effects:
1. GE’s vacuum chamber used three 32” diffusion pumps that did not havebaffles of any kind to prevent back-streaming. The closest pump was lessthan one meter away from the thrust stand [19].
2. Gridded ion velocity measurements taken by researchers at GE showeda significant amount of carbon and oxygen ions that varied from pulse-to-pulse. Although the total mass of these atoms may not have beensignificant compared to the xenon ions, their source and their effect onthe current sheet structure remains unknown [27]. In addition, heaviermolecules from pump oil can appear to have the same charge-to-massratio as xenon and be mis-interpreted as normal results.
3. General Dynamics constructed a very similar thruster to that of GE’sA-7D and found, at best, a factor of two smaller performance [17].
21

That last item can best be visualized graphically with the results from Ta-bles 3 and 6 being plotted in Figure 8. From this graph, it is easy to see that thedata measured at General Dynamics has significantly lower performance thanthat measured at General Electric. It should be noted that General Dynamicsand General Electric were competitors, however, only General Dynamics tookthe effects of background contaminants into account [17]. After 1970, there areno more publications from GE on GFPPTs, however, research at GE began onablative pulsed plasma thrusters in the late 1960’s with LaRocca.
80
60
40
20
0
Eff
icie
ncy
(%
)
800070006000500040003000200010000Specific Impulse, Isp (s)
GE Data
GD Data
GE GD Energy 49 J ~60 J ~100 J
158 J 280 J
Figure 8: Graph of efficiency vs. specific impulse for the General Electric A-7Dand General Dynamics A-7D replica GFPPT. Data taken from Ref. [17, 23] andalso presented in Tables 3 and 6.
3 Lockheed
P.J. Hart. 1962-1964
Lockheed had a similar GFPPT development program compared to otherlabs. Thruster parametric studies along with computational models attemptedto explain and predict GFPPT performance. In his first paper, Hart used acomplete circuit model including a constant plasma resistance term and thenormal snowplow mass accumulation model to predict the performance of threedifferent accelerator designs. The first two, models A and B, tested the effectsof initial inductance, while the third model C tested the effects of capacitance,however, unfortunately, other parameters such as the electrode geometry andenergy were also changed simultaneously. In these accelerators, the outer elec-trode was actually made of a copper screen material to allow light from the
22

discharge to reach the rotating mirror of a streak camera. Table 7 shows thecharacteristics of the various designs.
Model rinner router length Init. Ind. Capacitance Energy(cm) (cm) (cm) (nH) (µF) (kJ)
A 0.64 2.38 7.0 90 2.0 1B 0.64 2.38 7.0 240 2.2 1C 0.74 7.40 84.0 150 300 15
Table 7: Lockheed accelerator designs. Taken from Ref. [28].
These parameters were inserted into his circuit-snowplow model and the re-sulting current sheet trajectory was compared to experimental measurements ofsheet speed with streak photographs. In the model, the circuit and momentumequations were integrated until the velocity of the sheet began to slow down orasymptote. Test results using both hydrogen and air showed general agreementwith the slope of the light trial (indicating the sheet velocity) front from streakphotographs. Subsequent sheets, due to the oscillatory nature of the currentwaveform, were generally seen to travel faster than the first sheet. The mea-surements of sheet speed agreed relatively well with the snowplow model at highmass bits (the sheet moved slightly faster than predicted at the highest massbit values) and fell well under the predicted speed at low mass bits, especially intests with air. Hart believed this was due to the addition of back-plate insula-tor material (Teflon) to the discharge having more of an effect at low mass bits.Hart used Teflon because he found it to be the only insulator that provided auniform, symmetric breakdown near the backplate.
Reducing the inductance and increasing the capacitance both seemed toincrease the sheet speed, however, Hart did not believe this trend would con-tinue indefinitely. He measured sheet speeds in the A and B configuration tosee that the efficiency of B was nearly half that of A with the correspondinginitial inductance gain of 2.7 times. Comparing relatively similar mass load-ing conditions in the C design, the increase in capacitance, initial inductance,inductance-per-unit-length, and energy led to a five fold increase in sheet speed.He also saw that the subsequent sheets were forming slightly before the currentzero-crossings, possibly due to inductive effects. Magnetic probe data showedthat “loop currents” were forming between each subsequent discharge.
Hart saw some polarity effects at low mass bits. With a positive polarity (an-ode at center) he saw a fainter, but faster, sheet that was overtaken by another,stronger sheet, possibly from the next current reversal cycle. He dubbed thisas “Mode II” operation and thought that it would be preferable for thrustersto work in this way. Unfortunately, it is impossible to distinguish whether thecurrent sheet is canted from streak photos which only show the first front ofluminosity on either the anode or the cathode. Mode I operation (higher massbits) did not show any polarity effects.
Slug-like mass distributions were used in the circuit model although they
23

Figure 9: Schematic of Lockheed GFPPT with large radius ratio and Teflonbackplate. Taken from Ref. [29] and modified to remove extraneous informationon distributed inductance and physical discharge switch.
could not be realized in the experimental accelerators. Hart showed, as ex-pected, that not as much energy goes into internal modes of the plasma forslug-like distributions with the predicted efficiency correspondingly higher. Cur-rent waveforms predicted from this slug-model were close to critically dampedin character indicating a large rate of inductance change which, in reality, wouldrequire long electrodes. Hart also showed that the snowplow model could bemodified slightly to account for the finite thickness of the current sheet althoughit did not significantly effect the results unless the thickness was on the sameorder as the thruster electrode length.
In later work, Hart tried many different electrode geometries varying pri-marily the inductance-per-unit-length by changing the radius ratio in coax-ial thrusters [29]. Figure 9 shows a very high radius ratio thruster tested atLockheed. Again, he used ambient filled thrusters with Teflon backplates andscreen-like outer electrodes to permit optical access for streak photography. Thecapacitance was set to the lower value of the designs tested perviously, 2 µF, andthe initial inductance was further reduced to 48 nH. In these thrusters, the dis-charge initiation was more stable and symmetric at the lowest gas pressures andsmallest inner electrode radius values corresponding to the most ablated massfrom the insulator. He also found that the snowplow model over-predicted theperformance of the 1” inner electrode case and under-predicted the performanceof the 0.063” inner electrode case (more exposed Teflon). He then presented amodified snowplow model that relied on only the force near the center electrodeto determine the sheet velocity. This modified model agreed well with the data,however, it did not take into account the effects of insulator ablation.
3.1 Discussion of Research at Lockheed
Hart may have been the first one to realize that a solid-propellant Teflon thrustercould have space-flight applications (see footnote in Ref. [29]). Although hetested a variety of geometries, capacitance, inductance, and mass bit values,unfortunately all of his experiments were influenced by the ablation of a sig-nificant amount of Teflon from the backplate. With gas propellant mass bits
24

between 10 and 500 µg and discharge energy levels being a 1 kJ or higher,The majority of the discharge could easily have been made up of Teflon at thelowest, middle, and even highest mass bits for the small inner electrodes. Al-though his computation models are valid (except possibly the modified form ofthe snowplow model), the results from streak photos that do not distinguish theradial position of the current sheet and should not be used as the only diag-nostic for these potentially canted sheet. Unfortunately, these results with theTeflon contribution do not provide an adequate comparison or verification of themodels that do not include its contribution. The “Mode II” operation show-ing the fastest sheet speed is probably a result of a very canted current sheetleading down the center electrode (anode) much faster than the true plasmacenter-of-mass.
4 Republic Aviation
L. Aronowitz, P.B. Carstensen, D.P. Duclos, F.P. Fessenden, W.J. Guman,P.M. Mostov, J.L. Neuringer, D.S. Rigney, and W. Truglio. 1961-1964
Research at Republic Aviation (more commonly know later as Fairchild-Republic for their later ablative pulsed plasma thruster work) began with atheoretical paper on the acceleration of a plasma slug [30]. They used a non-dimensional, constant mass model for the propellant eliminating any dynamicefficiency effects. They did not include any effects of plasma resistance, walleffects or radiation, although they did include a linearly distributed resistancefor the electrodes. They tested two cases depending on integration time, how-ever, they did not require a computer to solve the equations. Their “long time”model used asymptotic analysis to integrate the circuit and momentum equa-tions out to an effective infinite time after the discharge. As any solution to thethese equations shows a damped current waveform, the current flowing throughwill be zero and the velocity will be constant as time goes to infinity. Usingthis technique, the energy stored in the magnetic field and capacitor are alwayszero by the end of the integration. Along with the simple slug-mass assumptionand without including the plasma resistance (instead, using a constant elec-trode resistance), the equations were solved at t=∞. The solution given for theefficiency is,
η(t = ∞) = 1− 21 +
√1 + EL′2/2mbitR2
0
, (8)
where L′
is the inductance-per-unit-length, E is the energy per pulse, mbit isthe slug-mass accelerated, and R0 is the constant resistance of the electrodes.In another solution case, the “short time” model assumed that the sheet motionwas weekly coupled to the external circuit, i.e. that the inductance was constant.This assumption makes the problem linear with separate, analytic solutions to
25

the circuit and momentum equations. Again assuming a constant resistance,
ηst =18L′2 E
mbit
1R2
0
=1
2√
2L′
R0ue. (9)
Including the effects of linear electrode resistance introduces a small correctionand gives a cut-off for the initial inductance value where efficiency actuallybegins to slowly decrease for decreasing initial inductance,
L0 ≤ R20C
9. (10)
Otherwise, interestingly enough, the initial inductance does not enter into theefficiency solutions at all.
Researchers at Republic first ventured into the experimental realm of pulsedplasma acceleration with a z-pinch, coaxial hybrid thruster shown in a cut-awayside view in Figure 10 [31]. The average turn radius on the outer electrodeis about four inches with the initial break-down occurring at the minimum in-ductance point, near the outer insulator walls. The thruster was designed sothat as the current progressed, the stronger Lorentz force near the center elec-trode would help turn the current sheet to follow the electrodes. Propellant, inmost cases nitrogen, was injected radially outward toward the outer insulatorwalls with the initiation occurring at the paschen breakdown point. At volt-ages below 2 kV this method of initiation did not always produce symmetricdischarges. Therefore, typically 3 kV was used with a 120 µF capacitor bank(540 J) to produce a uniform current sheet. Maximum current in this devicewas 235 kA reached in about 1.3 µs indicating an initial inductance of about20 nH. Typically the discharge volume was filled with 1014 cm−3 molecules ofnitrogen before breakdown.
Photo-detectors, electric probes, and microwave interferometry all detected,with fairly good agreement (within 0.4 µs), the arrival of a plasma front travel-ing at about 90,000 m/s. The measured plasma density, however, was only onthe order of 1014 cm−3 indicating that a small fraction of the nitrogen was notswept up in the current sheet or was left behind as neutrals recombined on theelectrode walls. Still, the speed of this sheet was observed to be linearly propor-tional to energy, a result predicted by electromagnetic acceleration. The plasmaconductivity was also seen to increase with increasing voltage from the interfer-ometry measurements. Later measurements on the same thruster showed thatthis plasma front was close to perpendicular all along the electrodes although thesheet itself was spreading out as it propagated [32]. Also, a variety of differentpropellant types (hydrogen, helium, nitrogen, freon) were tried and photocellmeasurements showed a slight increase in velocity for smaller molecular weights,although all the velocities were relatively similar except in the extreme case ofhydrogen.
William Guman joined the group in 1964 and began thrust measurementsusing a swinging-gate type thrust-stand that could measure the impulse fromindividual discharges. He found that regardless of propellant type, electrode
26

Figure 10: Schematic of Republic Aviation GFPPT with z-pinch, coaxial hybridgeometry. Taken from Ref. [32].
27

material, or background tank pressure (up to 10−4) there was a decay in themeasured impulse bit as the total number of pulses since the last facility pump-down accumulated [4]. Tests using a sealed thruster showed that most of thisloss in impulse came from the subsequent loss of adsorbed gases obtained onthe electrode surface when they were exposed to atmosphere. He also suggestedthat organic-monolayers from pump-oil contaminants could play a role, althoughnoticeably smaller, in the decay phenomenon as well. Guman also showed thatany erosion rate experiments need to include outgassing effects for accurateresults.
In the final work at Republic, the delay due to the pulsed-gas and paschenbreakdown type of discharge initiation was seen to lead to significant lossesin propellant utilization [33]. If the breakdown did not occur quickly enough,propellant would leak out of the thruster electrode volume. If it occurred tooquickly, not all of the propellant would make it out into the discharge volumebefore the breakdown. Guman fixed this problem by adding a gas-dischargeswitch in series with the accelerator that could be properly timed with the pro-pellant flow [34]. Still, even with the subsequent propellant utilization efficiencyimprovement, it appears that switch lifetime issues and performance concernsdrove Republic Aviation towards a different type of pulsed plasma accelerator,the Teflon ablative pulsed plasma thruster.
4.1 Discussion of Research at Republic Aviation
The non-dimensional slug model for acceleration presented in Ref. [30] is inter-esting in that it provides a resistance that varies as the current sheet moves downthe electrodes, however, they found this to be a minimal effect. Their “shorttime” solutions do not include the effective resistance generated by the currentsheet motion. Although this uncoupled model does not represent the electro-mechanical system correctly, it does provide a basis for understanding the per-formance scaling. Their “long time” solution includes the effects of changinginductance, however, it does not include the effects of subsequent dischargestypically found in accelerators with an oscillatory current. It also does nottake into account the finite length of electrodes and corresponding maximumchange in inductance for a given geometry. Still, with all of these assumptionsin mind, it does produce an interesting scaling relation for a slug-like mass,Eq. 8, that with Eq. 9, shows a monotonic increase in efficiency with increasesin inductance-per-unit-length and energy, and decreases in mass bit and externalresistance.
Unfortunately, the experimental work with the z-pinch coaxial hybrid thrusternever produced an efficiency calculation in the journal publications. They weresuggested to be below 50% from calculations of the amount of energy going intothe internal losses of the capacitors [32]. Velocity measurements from probesdo not necessarily correspond to the mass averaged exhaust velocity, however,as the sweeping efficiency of the sheet may not be 100%. For this thruster ge-ometry, probably the most difficult thing to calculate was the mass bit whichcould explain the lack of efficiency data. In the summary produced by NASA
28

Lewis [2], efficiencies were shown to be around 14% at 3,000 s (9.5 µN/W) withnitrogen although the exact configuration of the thruster is unclear comparedto the thruster found in journal publications. In his last paper, Guman didmeasure the thrust-to-power ratio (without specific impulse) and found that itasymptotes to about 9 µN/W at small mass loadings (previously tested condi-tions) and reached almost an order of magnitude higher, 80 µN/W at highermass distributions. This was, by far, the largest thrust-to-power ratio mea-sured for any GFPPT at the time, although the efficiency and specific impulseat this condition were probably very low. Still, the lack of continuing researchon them at Republic after this measurement is puzzling, although Guman didbegin ablative pulsed plasma thruster research soon afterwards.
5 NASA Lewis (now NASA Glenn)
S. Domitz, J.E. Heighway, A.E. Johansen, H.G. Kosmahl, C.J. Michels, P.Ramins, N.J. Stevens, and D.J. Vargo. 1962-1965
Researchers at NASA Lewis began studying plasma guns soon after Marshal(see Ref. [6]) showed that such a device could be useful for propulsion [35]. Thecoaxial accelerator at Lewis used propellant injection and an ignitron switch toinitiate the discharge. The device itself, “Gun A,” had an router = 4.75 cm,rinner = 1.6 cm (a radius ratio of about three), and a length of 48 cm, as shownin Figure 11. The first 9 cm length of the outer electrode (anode) was Vycorinsulator with the propellant injection holes located 18.3 cm from the backplate.The capacitor bank was made up of eleven 1.1 µF capacitors charged up to be-tween 10-30 kV (605-5450 J). The bank alone had a measured initial inductanceof 10 nH although the initial slope from current traces predict a value closer to70 nH which includes the cabling between the capacitors and the accelerator aswell the inductance in the accelerator geometry itself. The propellant (hydro-gen, nitrogen, or argon) was injected through a fast solenoid valve (100 µs) atvarious pressures to fill the chamber volume near the propellant injection holeswith a 1.1 ms delay between the valve actuation and the ignitron switch clos-ing. The discharge was reported to initiate near the propellant injection holes,and not near the backplate. Faster injection times giving more slug-like massdistributions were later seen to be subject to “spoking instabilities” in Ref. [36].
In these devices, the sheet speed was determined by a series of magneticprobes along the accelerator’s outer electrode. The efficiency was calculatedusing a combination ballistic pendulum-calorimeter to measure the final plasmakinetic energy. Heading Guman’s observation of impulse decay [4], ten pulseswere fired before any measurements were taken to “outgas” the electrodes. Theyfound the sheet velocity from magnetic probe data to asymptote to a value thatwas independent of propellant density although there was a weak dependenceon molecular weight (VH2 = 160 km/s, VAr = 100 km/s). This velocity wasmeasured after a crow-bar discharge occurred near the backplate, approximately1.5 µs after initiation and in coincidence with the voltage reversal or maximum
29

Figure 11: Schematic of NASA Lewis “Gun A” GFPPT. Taken from Ref. [35].
current. The ballistic pendulum-calorimeter measurements showed that argonhad the best overall efficiency, 12%, which peaked at about 100 µg of propellant.Hydrogen reached its peak efficiency at a lower mass bit, 10 µg, with a valueof 9%. In general, the efficiency was seen to scale with the square root of theenergy to mass bit ratio.
These performance measurements along with others testing variations inpropellant injection location were later compared to a fairly complete, non-dimensional snowplow model [36]. This model originated from previous workdescribed in Ref. [37]) that used a slug-mass for the injected propellant and thesnowplow effect for mass that was eroded from the electrodes and accumulatedas the current sheet progressed. As can be expected, the performance in thisfirst model strongly depended on a mass ablation coefficient that determined theratio of ablated electrode mass to injected propellant mass. The overall trends,however, showed a similar global result to other one-dimensional models with thehighest predicted performance corresponding to large values of inductance-per-unit-length, initial voltage, capacitance and small values of initial inductanceand resistance.
The more advanced, non-dimensional model presented later in Ref. [36] useda distributed propellant mass and included terms for ionization energy losses, ra-diation losses, wall drag due to ion diffusion, and heat transfer from the plasmato the electrodes through the inclusion of a plasma energy equation4. Compar-ing results from a simplified model that did not include these effects showed thatthey consumed no more than 33% of the initial capacitor energy, with smallerdiscrepancies (less relative loss) at higher energies (see Fig. 12). Both familiesof solutions had a similar dependence on the mass profile with the highest per-formance predicted for more slug-like distributions. The simplified model alsoexamined the effects of crow-baring at a beneficial time when the current is zero(no energy is stored in the magnetic fields) and at the worst time when the cur-rent is maximum. In general, the effects of choosing an appropriate crow-barringtime were more pronounced than those observed from the addition of the various
4Please see the following discussion sub-section for a more detailed description on howthese terms were handled.
30

loss mechanisms with up to a 40% performance reduction predicted using the“maximum current” crow-bar time. Experimentally, the crow-bar time was seento depend on accelerator geometry, especially near the breech. Later geometriesincluded an “inhibitor ring” that delayed the crow-bar to when the total currentwas beyond the maximum value. The performance measurements are presentedin more detail in the next section, however, in general, they did not match thepredictions in either absolute values or functional form. The author’s explainthis discrepancy is based mainly on the incorrectly modeled initial mass densityprofiles.
Research on unsteady pulsed plasma thrusters at Lewis stopped in 1965 afterit was observed that the current sheet stabilized at the end of the acceleratorafter 12 µs [38] leading to further “quasi-steady” research. Also in 1965, Re-searchers at Lewis outside of the experimental group produced a comprehensivereview of GFPPT research at many laboratories which brought out the followingpoints [2]:
1. Calorimetry data from many labs did not agree with the subsequent perfor-mance data measured on thrust-stands. Thrust-stand data was generallyaccepted as the most accurate way to measure performance.
2. Crow-baring generally occurs in all unsteady devices sometime betweenthe voltage and current reversal points depending on thruster geometryand driving circuit parameters.
3. The main acceleration mechanism inside the current sheet was believed tobe primarily due to the polarization field created by the electrons trappedon an E ×B drift and the subsequent charge separation. The report alsomentioned, however, that many of the labs had very different results anddisagreed in this area, especially on the influence and existence of ionconduction.
4. The coaxial geometry (compared to pinch or parallel-plate) was suggestedto be the best because it trapped all of the electromagnetic fields althoughit has a large electrode surface area and small inductance-per-unit lengthwhich decreased efficiency.
5. Including an electric switch in the discharge initiation process (as apposedto using the Paschen break-down point alone) led to better repeatability,fewer spoking instabilities, and improved propellant utilization while, atthe same time, it introduced parasitic inductance and resistance as wellas adding reliability questions.
6. The report’s conclusion stated the need for a simple performance modelthat was confirmed by repetitive, experimental performance measurements.
7. The report also stated that the only thing keeping GFPPTs from beingused in space was their lack of “heat handling capability” and that researchwas shifting to quasi-steady devices which might have better performance.
31

5.1 Summary of NASA Lewis Performance Measurements
Researchers at NASA Lewis measured the performance (calorimetry) of fourdifferent accelerator designs, as shown in Table 8 and taken from Ref. [36]. Thethruster was conditioned by firing ten times prior to any measurement. All thedesigns used mainly argon for propellant and an ignitron switch for dischargeinitiation timing. The propellant utilization for these devices was estimated tobe 100% due to the short valve times (0.1 ms) and long gun barrels. The accel-erators were all backed by a 12.1 µF capacitor bank that could be charged upto as much as 30 kV. Reduction in parasitic inductance came from improvingthe connection between the capacitor bank and accelerator as well as modifi-cations to the gun geometry itself. Even with changes in propellant injectionlocation, initial inductance, and inductance-per-unit-length, no noticeable dif-ference in performance was measured until the electrode length was reduced byslightly more than 50%. Unfortunately, the inductance-per-unit-length was alsochanged in this configuration making the correlation with the stronger Lorentzforce or reduced wall losses difficult to differentiate.
Gun rinner router length Prop. Inject. Init. Ind. Max. Eff.(cm) (cm) (cm) Location (cm) (nH) (%)
A 1.6 4.75 48 18 80 12B 1.6 4.75 46 2 44 13C 0.64 4.75 46 2 23 13D 0.32 4.75 20 2 23 22
Table 8: NASA Lewis accelerator characteristics. The maximum efficiency pointis from calorimetry measurements using argon at close to 4000 J (25 kV) overa range of three to four mass bit values. Taken from Ref. [36].
5.2 Discussion of Research at NASA Lewis
Probably the two biggest contributions from NASA Lewis are the most inclusiveacceleration model published from any of the labs [36] and the review of GF-PPT research in 1965 [2]. Performance measurements at Lewis did not includethrust-stand data, although the thruster was pre-conditioned to eliminate elec-trode contamination. In addition, although changes were made in thruster ge-ometry, propellant distribution, and energy, they were not systematically testedso correlation between the modifications and performance improvements couldonly be speculated. Finally, with only a few mass bit values tested and noamount of error reported, the trends presented in the data are difficult to drawconclusions from.
Non-Dimensional Snowplow Model. NASA Lewis developed an accelera-tion model that included the effects of a variable mass distribution (from slug-
32

like to uniform), and losses from “wall drag”, heat transfer, ionization, andradiation [37, 36]. The exact details are left to the cited publication, however,the most important points are summarized here:
• The mass distribution function is not related to any physical phenomenon;that is, it does not have an exponential or linear nature that would beexpected from pulsed gas injection or a uniform fill.
• Wall drag includes the loss in forward momentum from ions diffusing tothe wall based solely on temperature and not current conduction.
• The internal energy of the plasma is based solely on temperature withoutincluding pressure effects. Energy is transferred to the plasma from themass accumulation process and ohmic heating. Energy is lost from theplasma through heat conduction to the electrodes, electron current con-duction, ion diffusion and recombination near the electrodes, ionizationand radiation. It should be noted (by the author’s own admission), how-ever, that although ohmic heating, ionization, and radiation losses appearin the equations, they are not included in the actual solutions.
• The initial temperature is not specified explicitly in Ref. [36] and no pro-files for plasma temperature are mentioned or displayed.
The effects of introducing the plasma energy equation are present in com-paring the results of the more advanced model with one that does not includethese losses, as shown in Figure 12. In general, the efficiency is found to fol-low a similar trend, peaking at a particular “Mass Loading Parameter” that isslightly smaller than what is predicted by the simplified model. The relative lossis smallest at small values of the Mass Loading Parameter. The Mass LoadingParameter is defined as,
M≡ 2`m0
L′Q20
=`m0
L′CE0(11)
which includes the amount of mass in the initial discharge (m0), the initial en-ergy (E0) or charge (Q0) on the capacitor, the capacitance (C), the inductance-per-unit-length (L
′), and the length of the electrodes (`), but not how the mass
is distributed. This definition makes it hard to differentiate between the variousparameters, and its experimental value strongly depends on the initial masstaken up by the current sheet, a very difficult quantity to determine. The au-thors suggest that the largest loss is through ion diffusion to the walls and thatradiation losses are negligible, although they do not provide magnitudes, relativeor absolute. They also suggest that radiation cooling could play a significantrole, although it is not included in the final plasma energy equation. Althoughthe model did not seem to match well with experimental data, this could havebeen as much a result of trusting calorimetry performance data then the faultof the model. Without more information on the temperature profile as a func-tion of time, it is hard to say if the plasma energy equation and the associated
33

Figure 12: Graph of Efficiency vs. Mass Loading Parameter (see Eq. 11) includ-ing theoretical curves (both simple and advanced) and measured performancedata (calorimetry) from “Gun D” using argon at 15, 20, and 25 kV. Taken fromRef. [32].
34

assumptions were reasonable. Finally, it should be noted that the advancedmodel did not take crow-baring into account and used a non-dimensionalizationscheme based on the final inductance of the current sheet at the end of theelectrodes, assuming it got there before the current reversed and a crow-bardischarge was formed. The integration was carried out until the current sheetreached the end of the electrodes.
GFPPT Review. The GFPPT review in Ref. [2] provides a very importantpicture in continuing GFPPT development. Besides presenting a research sum-mary shown in the itemized list of the previous section, it begins to explainwhy GFPPT research was not pursued much past 1966 in any laboratory atthe time besides Princeton. With most efficiencies being below 50% and thereliability of the electrical switches and fast-acting valves in question, researchshifted to higher performance quasi-steady pulsed plasma accelerators for mainpropulsion applications, and the simpler ablative pulsed plasma thruster for at-titude control applications. Until only recently, as described in the next sectionon research at Princeton, have GFPPTs resurfaced as an alternative electricpropulsion device once again, this time at lower energy (< 10 J).
6 Princeton
N.A. Black, R.L. Burton, E.Y. Choueiri, K.E. Clark, E.A. Cubbin, A.C. Eck-breth, W.R. Ellis, R.G. Jahn, W. von Jaskowsky, T.E. Markusic, P.J. Wilbur,T.M. York, J.K. Ziemer, and D. Birx (SRL Inc.). 1962-present
The research at Princeton on unsteady electromagnetic acceleration can bedivided in two categories based on research period, apparatus, and type of inves-tigation. From 1962 until 1970, the structure of the current sheet in a z-pinchwas examined including Kerr-cell photos, magnetic and electric field surveys,fast-response pressure probe measurements, and microwave interferometry. In1969, Jahn wrote “Physics of Electric Propulsion” (Ref. [1]) which included asummary of GFPPT work up to that point. From 1970 until about 1997, Prince-ton focused on quasi-steady and steady-state MPD thrusters as well as somework dealing with ablative pulsed plasma thrusters in the 1990’s. After 1997,in cooperation with Science Research Labs (SRL) Inc., GFPPT research beganagain focusing mainly on improving the performance of low-energy (< 10 J),low-mass versions of the coaxial guns of the past. In addition, a new studyof unsteady current sheet canting and stability began in 1999. As this part ofthe review includes work by this author, there will be no discussion subsection,rather, the work at Princeton is divided into two separate subsections based ontopic.
35

Figure 13: Drawing of Princeton Z-Pinch Apparatus. Taken from Ref. [39].
6.1 Basic Acceleration Scaling Studies at Princeton
Basic acceleration scaling studies began at Princeton in 1962 using a pre-filled z-pinch with a large outer radius [39] and investigating the basic scaling propertiesof the device. This device was used extensively in many of the studies andhas the following dimensions: router = 10.2 cm, electrode gap = 5 cm, asshown in Figure 13. Fifteen 1 µF capacitors were connected in parallel aroundthe circumference of the device and charged up to 10 kV (750 J) yielding adamped oscillatory waveform with a peak current of 200 kA. The peak currentwas reached in 0.4 µs after the activation of a gas-switch indicating an initialinductance of about 20 nH [40]. Argon was used for propellant with an ambientpressure of between 20 mT-10 T before the pulse. Optical measurements fromstreak-photographs showed that the sheet velocity depended on the inverse ofthe square-root of the density. From magnetic field measurements it was foundthat a bulk of the current was actually carried near the outside insulator, nearthe initiation point, soon after the first sheet moved slightly inward. In time,the formation of the second sheet corresponded to the maximum voltage, orcurrent zero-crossing. Internal current loops between the two sheets were foundthat maintained the same current direction in the first sheet. These circulatingcurrents did not appear to be conducted through the electrodes allowing a 7.6 cmradius circle to be cut out of the top electrode and replaced by a pyrex window.Kerr-cell photographs showed that the sheet broke down near the outer insulatoruniformly and propagated inward without instability and with no effect seenfrom the pyrex window. A C-channel like pyrex insert was used to examine theinitial breakdown. It was found that although the current sheet still formed nearthe lowest inductance points at the electrodes, it remained planer and did notbend outward along the inner surface of the channel. Once again, it propagateduniformly inward indicating that the magnetic effects were greater than the gas
36

dynamic effects.Studies continued on this device with more magnetic field measurements
and the development of a snowplow model for z-pinches based on Rosenbluth’swork at Los Alamos (see Ref. [41]). It was found that the luminous front fellslightly behind the current conduction zone of the first current sheet until thesecond sheet formed and subsequently conducted most of the current. It wasalso found the both the luminous front and the current conduction zone weretraveling faster than what was predicted based on a snowplow model. It wasconcluded that the current sheet formed with the router = 10.2 cm geometry waspermeable with less than a 100 % sweeping efficiency. Inserting an insulatingring at r = 5.1 cm was shown to increase the sweeping efficiency to 100 % withthe luminous front, current conduction zone, and snowplow model trajectoryall in close agreement. The sweeping efficiency was also found to increase withincreasing energy and decreasing mass bit. When the sweeping efficiency washigh, the sheet velocity was seen to scale as expected with the non-dimensional“magnetic interaction parameter” β,
β ≡ − µ0Q20
4π2ρ0r40
= −µ0
2π
h
r20
CE
mbit, (12)
where ρ0 is the initial density, r0 is the outer electrode radius, and h is thedistance between the electrodes. Various values of the β parameter were inves-tigated using different mass densities and outer electrode radii. The pinchingeffect was also found to be a strong function of β with the pinch occurring beforethe current reversal for tests with |β| > 0.2.
Research then turned to channeling the radially directed sheet into axial mo-mentum. First, Jahn and Black showed that the z-pinch is an inherently gooddevice for dynamic efficiency concerns as most of the propellant mass is sweptup in the beginning of the discharge. In Ref. [42], he laid out how the overallefficiency could be greater than 50% as long as the propellant mass was sweptup when the current sheet velocity was small. Next, Jahn and Burton built a15.24 cm diameter, 61 cm long vacuum chamber around the top electrode of thez-pinch and removed the pyrex window to allow the plasma to expand outwardfrom the pinch [43]. The electrode configuration was slightly changed for thisdevice to reduce the parasitic inductance further and improve the sweeping effi-ciency with an inner radius of 6.35 cm. The peak current was close to 300,000 Awith the same 15 µF, 10 kV capacitor bank. The entire volume (including thenew exhaust chamber) was filled with argon propellant between 30-1920 mTbefore the discharge. Various exit orifices were tested (0.95, 1.9, 3.8, 5.1, 7.6,and 10.2 cm diameter holes cut in the center of the top electrode) and it wasfound that the luminous front expanded with a speed that increased with in-creasing diameter until the 10.2 cm case. In that case, only a little over 1 cmof electrode was left near the outer insulator, possibly not providing enoughelectrode surface area for proper conduction. It was also found that the ex-panding axial front traveled with a little over half of the original inward radialsheet velocity until, eventually, the core of the pinched plasma caught up andpassed the front. The best case of radial velocity change to axial velocity came
37

for the 120 mT case where the ratio of the two velocities was near 80%. Again,current probe measurements showed that the sheet moved radially inward in avery similar fashion to the set-up with the pyrex window, and that the luminousfront corresponded well to the beginning of the current conduction front.
In more recent work at Princeton, two models for performance scaling havebeen developed for coaxial and parallel-plate electrode geometries: a simple,fixed element approximation [44], and a full, single axis, non-dimensional modelincluding the effects of a flared electrode geometry and an exponential massdistribution [45]. In the fixed element solution, primarily modeling a criticallydamped waveform, the inductance was assumed not to change (although it wasgiven an average value, < L >, greater than the initial inductance, L0), and theeffective resistance was also held constant. The impulse was assumed to dependsolely of the integral of the current squared with the final relation showing alinear dependence on the initial energy stored in the capacitor,
Ibit = L′√
C
< L >E. (13)
The efficiency was predicted as,
η =I2bit
2mbitE=
12L′2 C
< L >
E
mbit=
12L′√
C
< L >ue. (14)
Note that in this approximation, the average inductance quantity depends on theposition of the current sheet and the inductance-per-unit-length. In this way, theefficiency could also be considered to depend on
√L′/
√`elect. In any case, both
the impulse bit (thrust-to-power ratio) and the efficiency are expected to scalewith a square-root of capacitance. In the more complete non-dimensional model,the performance was seen to behave differently depending on the nature of thecurrent waveform. In general, the efficiency increased with decreasing circuitresistance, however, for the underdamped cases with a uniform propellant fill,a maximum in the efficiency was found with a Dynamic Impedance Parameter,α, value near unity,
α =L′3V 2
0 C2
18L20m
′ , (15)
where m′is the mass density gradient coefficient. For critically or overdamped
cases with a uniform fill, the efficiency increased with α1/4 yielding,
η ∝ 4
√8L′3V 2
0
9R40m
′ , (16)
with R0 (including only the internal capacitor resistance and the plasma resis-tance) having the strongest influence. The thrust-to-power ratio decreased withincreasing α for the underdamped cases and remained relatively constant over αfor the critically or overdamped cases. Using an exponential mass distributionincreased the efficiency and thrust-to-power ratio in accordance with the dy-namic efficiency improving. The character of the efficiency was also changed for
38
the underdamped case with the maximum point shifting to much higher valuesof α, > 10. Higher values of α, however, were also seen to require very longelectrodes with total inductance changes on the order of 100 × L0 which arevery difficult to achieve in reality. The nature of the thrust-to-power ratio didnot change for the exponential mass distribution. Using flared electrodes alsoimproved performance, but not to the same extent as the non-uniform propel-lant density. Further development of this model including crow-baring for theunderdamped cases and finite electrode effects are ongoing at Princeton.
6.2 Current Sheet Structure Studies at Princeton
Three PhD thesis [46, 47, 48] and three journal publications [49, 50, 51] byBurton, Ellis, and York, respectively, examined the structure of the currentsheet through electric and magnetic field probing, microwave interferometry,and fast-response pressure measurement. These three sources will be combined(Note: Ref. [50] provides the best summary of the work as it is published afterall the work had been completed) to form a coherent picture of current sheetstructure as developed at Princeton. Although all of these measurements aretaken at the midline of the z-pinch apparatus and at a radius half-way betweenthe outer insulator and the center, there is no reason to think that a similarstructure shouldn’t exist in other pulsed accelerators with different geometries.The reader should consult all of these references for the entire story includingthe model development between references. Only the most simple, coherentresults will be reproduced here.
First, the author’s start with a generalized Ohm’s Law in the frame of themoving current sheet (current sheet moves in radial direction in a z-pinch),
~ = σ0
(~E + ~vi × ~B +
∇Pe
nee
)− Ωe
|B|~×~B. (17)
where all the terms here have the familiar definitions. Note that the Hall con-ductivity for the electrons (but not the ions) was included because the cham-ber dimensions were assumed to be much larger than the electron gyro-radius,but smaller than the ion gyro-radius. Also, the effects of ion-slip were not in-cluded, and an assumption of complete, single ionization occurring as soon asthe molecule enters the sheet was held throughout the publications. The elec-tric and magnetic fields were measured with probes [49] while the scalar plasmaconductivity, plasma temperature, and density were measured by microwave in-terferometry [50]. The Hall parameter was inferred from these measurementsas was the electron pressure from the kinetic relation, Pe = nekTe. Only theazimuthal magnetic field was found to be significant while, similarly, only theradial and axial components of the electric field were important. In the movingframe of the current sheet, the radial ion velocity is assumed to start at sheetspeed (measured from streak and Kerr-cell photos as well as probe arrival timedata) and slow to zero, eventually traveling with the current sheet. As the axialcurrent density is known from total current measurements as well as magnetic
39

Figure 14: Radial electric field, azimuthal magnetic field, and heavy speciespressure profiles in the current sheet frame. Taken from Ref. [49] with modifica-tions to show regions identified in Refs. [50, 51]. The area of expected pressureincrease was confirmed in Ref. [51]
field probe data, only two unknowns remain: the radial current and the axialion velocity. Measurements of these parameters in the current sheet frame ofreference are presented in Figure 14.
It should be noted that the axial electric field should be expected to bevery nearly balanced by the back EMF of the moving current sheet so thatthe axial electric field actually dominates the conductivity. As seen from themeasurements, this was found to be true with the appearance of three regionsbounded by the character of the radial electric field. In Region I, the radialelectric field is very large and caused by the separation of the electrons caughton an E×B drift while the ions have a large amount of momentum and penetratedeeper into the sheet. This radial electric field does, however, slow down the ionsinto Region II, although it emphis not enough to slow the ions down completelyto sheet speed. Region I was found to be dominated by axial electron currentmaking up a significant fraction of the total current, but not enough for theentire current. Region I was found to be about 5 mm thick for argon. Asthe separation of the ions and electrons induces a radial polarization field, italso creates a radial current. This radial current, although relatively small,interacts with the azimuthal field enough to cause the ion trajectories to deflecttowards the cathode. In Region II, with the ions now moving slower and slightlydeflected, axial ion current dominates with ions recombining on the electrode
40

surface to complete the total current. This produces a jiz × Bθ that furtherdecelerates the ions to sheet speed. Region II was also found to be the locationof a large heavy species pressure gradient. As the radial electric field actuallyreverses sign (although not to the same magnitude) in Region II, the electronsactually try to drift against the current flow, however, with the greater iondensity, collisions dominate and they remain relatively stationary with respectto the sheet. In Region III, the axial electric field is still negative, althoughsmaller and returning to zero. As the ion density is low here, there is actuallythe possibility of a small reverse current being carried by the electrons in thetrailing edge of the current sheet. The total sheet was found to be about 1 cmthick at the center line with a slight tilt, anode front leading cathode.
This tilt or cant of the current sheet has been investigated in more recentwork at Princeton in a parallel plate accelerator [52]. In brief, optical mea-surements of sheet speed and tilting angle have qualitatively found that largermolecular weight propellants experience more canting, and that the canting an-gle is independent of initial voltage or peak current. Research is continuing withSchlieren photography.
6.3 Performance Measurements of Low-Energy GFPPTsat Princeton
In 1997 Princeton’s Electric Propulsion and Plasma Dynamics Laboratory (EP-PDyL) began developing low-energy GFPPTs in cooperation with Science Re-search Laboratory, Inc. (SRL). The research focused on the following goals [53]:
1. Developing a low-mass (low-energy) GFPPT with the same or better per-formance as GFPPTs at higher energy. A target was set for 50% efficiencyat 5000 s (thrust-to-power ratio of about 20 µN/W) based on the resultsfrom GE, but using only 1 J per pulse.
2. Designing a GFPPT that has a 100% mass utilization efficiency usingexisting, space-qualified valves that have greater than a one million cyclelifetime.
Achieving the these goal included:
• Using solid-state switching technology to increase pulses rates to above4 kHz for high propellant utilization.
• Grouping pulses together in bursts to allow thrust and power modulationwhile also reducing the total number of valve cycles over the lifetime ofthe device.
• Developing a highly accurate (< 10% error), low-impulse ((< 100µNs),thrust stand and high-speed current sheet visualization techniques.
• Rapid thruster prototyping to examine changes in geometry, propellantinjection, discharge initiation, and driving circuit.
41

τm τd
τp
mass pulse
discharge pulses
Burst 1 Burst 2
Figure 15: Schematic of a burst of pulses in an SRL-EPPDyL GFPPT.
• Creating a low-energy discharge initiation system that provides a reliable,uniform, symmetric current sheet without inducing a large amount of ero-sion.
• Deriving and testing performance scaling laws based on simple analyticand complex non-dimensional models for current sheet acceleration.
To date, nine generations of SRL-EPPDyL GFPPTs have been tested with manymodifications on each generation. Using a low-voltage (250 V), low-inductance(< 5 nH) capacitor bank (45-270 µF, 1.4-8.4 J), these GFPPTs have close tocritically-damped current waveforms with no noticeable crow-baring. Peak cur-rents are close to 10 kA with pulses lasting about 5 µs. As shown schematicallyin Figure 15, during a burst the valve is only cycled once, therefore, the ultra-fast, high energy valves used in previous GFPPT designs are not required. Asthe propellant flows at a constant rate, the propellant utilization is dictated bythe pulse frequency and the thermal velocity of the propellant. For example,using argon (vth ≈ 400 m/s) and a 4 kHz pulse frequency, the electrodes arerequired to be at least 10 cm long to ensure that none of the propellant escapesoutside of the discharge volume between pulses.
Although many different GFPPT designs have been tested at EPPDyL, thefifth-generation (designated as PT5) has undergone the most extensive perfor-mance measurements. Since its original design, changes have been made to itsdischarge initiation system and propellant distribution [10] as well as the per-formance measurement technique to insure proper conditioning [5]. As shownin Fig. 16, PT5 uses a stainless-steel, coaxial electrode set with an outer toinner electrode radius ratio of approximately four and a total volume of 350cm3. It uses four semi-conductor type surface-flashover spark plugs mountedon the inside of the outer electrode (cathode) at 90 degree azimuthal intervalsto initiate the discharge uniformly. The main discharge is driven by a low-inductance (10 nH) 130 or 270 µF capacitor bank which is capable of beingcharged to 250 V giving a maximum energy per pulse of 4 or 8 J, respectively.The entire thruster has a mass of approximately 6 or 8 kg depending on the
42

3.0 mm DIAMETER HOLES3.0 mm FROM BACKPLATE
8 HOLES, Ø3 mm
73 mm
20 mm
98
mm
4 IGNITOR MOUNTS10 mm FROM BACKPLATE
70
mm
21
mm
61 mm
CATHODE
BACKPLATE
INSULATOR
ANODE
28
mm
Figure 16: Schematic of SRL-EPPDyL PT5.
capacitance level and including the electrode mass as well as the thruster hous-ing mass. High-speed photographs of the discharge were taken with an ImaconFast-Framing Camera (IFFT) at rates of 500,000 frames per second. A series ofIFFT frames of PT5 showing the symmetrical discharge initiation are presentedin Fig. 17. Before the modifications to the gas manifold were made to makepropellant injection more uniform, the discharge initiation was seen to occurnear the region of highest pressure. This is a similar result to those researcherswho found spoking instabilities when the discharge was allowed to initiate basedsolely on a Paschen breakdown without an external switch.
Two energy levels for each of two capacitance values were tested over tendifferent mass bit values each yielding a 40-point GFPPT performance database.Four graphs which show PT5 performance as a function of mass bit and specificimpulse with the capacitance and the initial stored energy level as parametersare shown with error bars in Fig. 18. Each point represents at least twentytrials including separate measurements of impulse, mass bit, and energy at thesame conditions. Values of the performance data are given at the end of thissection in Table 9. It is evident from all the plots in Fig. 18 that for each curvethere is a transition with decreasing mass bit (or increasing Isp) from a mode(Mode I) where the efficiency and the impulse are respectively independent anddependent on the mass bit (and where the efficiency the thrust to power ratio
43

Figure 17: Unfiltered Imacon Fast-Framing Camera photos of a typical PT5discharge looking straight into the discharge chamber using 0.5 µg argon and4 J of energy per pulse. The photos seen here are spaced by 1 µs going fromright to left and top-right to bottom-left.
are respectively independent and dependent on Isp) to another mode (Mode II)where the converse statements hold.
Simple analytic models presented in the previous section show that the ef-ficiency and thrust-to-power ratio should scale with the square-root of capac-itance and not depend on the energy (at a constant exhaust velocity) for anelectromagnetic accelerator. These trends are evident in Mode II where theefficiency increases linearly with the specific impulse and the thrust-to-powerratio is relatively constant.
It is interesting to note that the performance scaling suggested for a thrusterwhere electrothermal acceleration is dominant are quite different[54]. In thatcase, the impulse bit is expected to scale with the square root of the dischargeenergy to mass bit ratio and not depend directly on capacitance or inductancechange. In addition, the efficiency of a pure electrothermal accelerator is ex-pected to be constant over wide range of specific impulse, energy and mass bitvalues. While the efficiency as seen in panels c and d of Fig. 18 is indeed inde-pendent of mass bit and Isp at high mass bit values (i.e. Mode I), it does showa dependence on energy, albeit a weaker one than for Mode II. This tends toindicate that the acceleration in Mode I may be due to a combination of bothelectrothermal and electromagnetic effects. Again, as the losses associated withsweeping up the propellant are not accounted for in these predictions, an expla-nation for trends in Mode I could be a function of improved dynamic efficiencyas well.
Later generations of SRL-EPPDyL GFPPTs were used to examine lifetimeissues and inductance-per-unit length effects. PT7, a parallel-plate “quad” de-sign (see Ref. [55]), was pulsed 1.5 million times at a discharge energy of 2 Jwith 0.3 µg of xenon propellant per shot. As seen in Figure 19, the single spark-plug initiation system used in this design was severely damaged with measurederosion rates of 0.2 µg per shot. Although the spark-plug did not short-outin this test as it did in a subsequent 100,000 pulse test, it is seen to be the
44

40
35
30
25
20
15
10
5
0
Imp
uls
e B
it (
µN
s)
3.02.52.01.51.00.50.0
Mass Bit (µg)
130 µF, 2J
270 µF, 4J
270 µF, 6J
130 µF, 4J
20
15
10
5
0
Eff
icie
ncy
(%
)
3.02.52.01.51.00.50.0
Mass Bit (µg)
270 µF, 6J
270 µF, 4J
130 µF, 4J
130 µF, 2J
8
6
4
2
0Th
rust
-to
-Po
wer
Rat
io (
µN
/W
)
130 µF, 2J130 µF, 4J
270 µF, 4J
270 µF, 6J
20
15
10
5
0
Eff
icie
ncy
(%
)
12x103 86420
Specific Impulse, Isp (s)
130 µF, 2J
130 µF, 4J
270 µF, 4J
270 µF, 6J
(a)
(d)(c)
(b)
Figure 18: Performance of PT5. Graphs (a) and (c) show the impulse bit andefficiency as a function of mass bit. Graphs (b) and (d) show the thrust-to-power ratio and efficiency as a function of specific impulse. All graphs containfour curves which show changes in performance due to changing capacitancevalues and initial stored energy levels.
45

Figure 19: Cathode of SRL-EPPDyL PT7 showing the damage to the surface-flashover spark-plug after 1.5 million pulses.
lifetime limiting component of this GFPPT design. Later designs switched toa lower-energy RF spark-plug (PT8, see Ref. [56]) and an even smaller surface-flashover plug (PT9, see Ref. [57]) that did not have an electrode in commoncontact with the thruster electrodes. Erosion rates have now been measuredto be below 0.1 µg per pulse in both systems, however, system mass and life-time concerns still need to be addressed. The latest design, PT9, was also usedto examine the effects of inductance-per-unit-length on performance althoughthe pyrex side-walls used to contain the plasma in the parallel-plate geometrywere suspected to induce a large amount drag on the current sheet, reducingperformance [57]. More recent studies at EPPDyL include testing PT9 withoutsidewalls, and will be presented later this year.
46

Cap. (µF) Energy (J) mbit (µg) Ibit (µN-s) Isp (s) η (%)0.20 11.6 5940 8.530.25 12.0 4890 7.200.30 11.9 4060 6.010.35 12.0 3500 5.22
4.0 0.40 12.0 3060 4.560.50 13.2 2680 4.350.75 16.9 2290 4.771.00 18.6 1900 4.351.50 22.3 1520 4.16
270 2.00 27.6 1410 4.700.20 19.5 9930 15.80.25 18.6 7600 11.60.30 19.8 6720 10.90.35 18.5 5400 8.16
6.0 0.40 18.6 4740 7.260.50 19.5 3990 6.420.75 23.2 3160 6.121.00 26.3 2680 5.911.50 31.1 2120 5.402.00 37.1 1890 5.790.20 3.32 1690 1.370.25 3.39 1380 1.150.30 3.64 1240 1.100.35 3.97 1160 1.11
2.1 0.40 4.00 1020 0.990.50 4.80 980 1.120.75 6.24 848 1.211.00 7.42 757 1.231.50 9.30 632 1.21
130 2.00 9.75 497 0.990.20 7.68 3920 3.810.25 7.38 3010 2.800.30 7.32 2490 2.310.35 7.74 2260 2.21
4.0 0.40 8.21 2090 2.160.50 9.29 1900 2.200.75 12.2 1670 2.501.00 14.7 1500 2.641.50 18.7 1270 2.762.00 21.4 1091 2.68
±1% ±2% ±2% ±8% ±5% ±10%
Table 9: PT5 performance data for capacitance values of of 130 and 270 ±2 µFand energy levels of 2.1, 4.0, and 6.0 ±0.1 J. The last row in the table is theaverage error from each measurement.
47

Part II
Research by SubjectThis part of the review is designed for those readers who would rather seeinformation presented by subject in GFPPT research rather than the entirebody of work from each particular laboratory alone. With that in mind, muchof the information presented in this part of the review is duplicated from Part Iincluding the relevant citations, but not figures or tables. Some additional workthat is not from any of the major laboratories or was related to work in otherfields and not presented in Part I are also cited in the sections on current sheetstructure and acceleration model development.
7 Current Sheet Structure
Two laboratories (General Dynamics run by Lovberg, and Princeton by Jahn inthe 1960’s) made investigating the current sheet structure their primary task.Their research will be presented, first, individually, then used in a discussionsubsection that covers all work related to current sheet canting that this authorcould find in the literature. Some interesting trends dealing with the perme-ability of the sheet and its effectiveness as a “snowplow” will be discussed in afollowing section on performance scaling.
7.1 Current Sheet Structure Research at GD
In the current sheet studies at General Dynamics, Lovberg used electric fieldand B-dot probes [7, 9] as well as Schlieren photography to investigate thenature of the current sheet and acceleration process in both parallel-plate [14]and coaxial [15] geometries using mainly hydrogen for propellant. One of themain questions he was trying to answer was if the current sheet behaved as asnowplow or a strong shock-wave.
In the parallel-plate geometry, he saw a very planar, thin current sheetthat had an electron density ten times that of the ambient pre-pulse density. Inaddition, probe data on arrival time agreed well with the visual indications of thefront. He concluded that the sheet did behave as a snowplow effectively sweepingup all the gas in front of it. He also found that there was a strong polarizationfield within the sheet and speculated that the electrons were conducting all ofthe current, experiencing a Lorentz force which then slightly separated themfrom the ions. The polarization field that develops as a result of this separationwas measured to be enough to explain the subsequent ion acceleration. Usinggases such as nitrogen and argon, however, he saw the sheet “bifurcate” nearthe anode with the bulk of the current being carried on a canted sheet, anodeleading cathode. He did not study this phenomenon in depth but suggested thatit was a result of the higher molecular weight, and subsequent larger gyro-radii,
48

of nitrogen and argon molecules. Regardless of propellant, Lovberg noticed athin but strong density gradient in a small layer all along the cathode surface.
In the coaxial geometry using hydrogen, nitrogen, and argon, he saw verydifferent features depending on polarity and molecular weight. In some of hisearliest papers using hydrogen, Ref. [7, 9], the center electrode was at negativepotential (cathode) and the current sheet seemed to be planar from field probemeasurements. With the sheet speed measured from probe data being abouttwice that expected from a snowplow model, and the fact that the current sheetitself was not bowed outward due to the 1/r2 Lorentz force profile, he concludedthat the sheet did not behave like a snowplow. Electric field data showed asimilar polarization field to that seen in the parallel-plate geometry, however, itdropped off towards the anode. Although this might be expected with a non-uniform Lorentz profile, the polarization field was no longer strong enough forthe ions to be accelerated to the observed sheet speed near the anode. Lovbergpostulated that that the current sheet was permeable and acted more like astrong shock-wave in this case. In another case with reverse polarity, using theSchlieren technique (with a slotted outer electrode, Ref. [15]) the current sheetwas seen to separate into two layers. The leading, thin sheet was seen to bowout along the center electrode as should be expected by the non-uniform Lorentzforce in a coaxial accelerator. In the second, planar layer, he saw a much morediffuse region that did not conduct much current, possibly from a small amountof ion conduction to the cathode. Integrating the gradient information from theSchlieren photos showed that the electron density was about the same as theambient conditions indicating that this again did not behave like a snowplow,rather like a strong shock. A possible explanation for this behavior was theneed for ion conduction to the cathode which could leave a large number ofrecombined molecules near the cathode moving only with thermal speed, muchslower than the sheet speed. The presence of strong radial density gradientsnear the cathode seemed to agree with that theory.
The coaxial thruster tested by Lovberg showed some interesting featuresdepending on polarity. Although Schlieren photos showed a front that seemed toexpand depending on the Lorentz force (bowed outward near the inner electrode)regardless of polarity, electric probe data for the cathode-center configurationshowed a very planar current conduction zone. It could be possible that inthe negative polarity the non-uniform Lorentz force profile is balanced by someother effect that normally causes canting with the anode leading the cathode.Other researchers have also seen effects from changing the polarity of a coaxialgeometry which will be covered in more detail in following subsections.
7.2 Current Sheet Structure Research at Princeton
Three PhD thesis [46, 47, 48] and three journal publications [49, 50, 51] byBurton, Ellis, and York, respectively, examined the structure of the currentsheet through electric and magnetic field probing, microwave interferometry,and fast-response pressure measurement. These three sources will be combined(Note: Ref. [50] provides the best summary of the work as it is published after
49

all the work had been completed) to form a coherent picture of current sheetstructure as developed at Princeton. Although all of these measurements aretaken at the midline of the z-pinch apparatus and at a radius half-way betweenthe outer insulator and the center, there is no reason to think that a similarstructure shouldn’t exist in other pulsed accelerators with different geometries.The reader should consult all of these references for the entire story includingthe model development between references. Only the most simple, coherentresults will be reproduced here.
First, the author’s start with a generalized Ohm’s Law in the frame of themoving current sheet (current sheet moves in radial direction in a z-pinch),
~ = σ0
(~E + ~vi × ~B +
∇Pe
nee
)− Ωe
|B|~×~B. (18)
where vi is with respect to the current sheet velocity, and E is the net fieldincluding the applied field and the back emf contribution from the moving sheet.Note that the Hall conductivity for the electrons (but not the ions) was includedbecause the chamber dimensions were assumed to be much larger than theelectron gyro-radius, but smaller than the ion gyro-radius. Also, the effects ofion-slip (sheet permeability) were not included, and an assumption of complete,single ionization occurring as soon as the molecule enters the sheet was heldthroughout the publications. The electric and magnetic fields were measuredwith probes [49] while the scalar plasma conductivity, plasma temperature, anddensity were measured by microwave interferometry [50]. The Hall parameterwas inferred from these measurements as was the electron pressure from thekinetic relation, Pe = nekTe. Only the azimuthal magnetic field was foundto be significant while, similarly, only the radial and axial components of theelectric field were found to be important. In the frame of the current sheet, theradial ion velocity is assumed to start at sheet speed (measured from streak andKerr-cell photos as well as probe arrival time data) and slow to zero, eventuallytraveling with the current sheet. As the axial current density is known from totalcurrent measurements as well as magnetic field probe data, only two unknownsremain: the radial current and the axial ion velocity. Measurements of theseparameters as a function of time as the current sheet sweeps by are presentedin Figure 14.
It should be noted that the axial electric field should be expected to bevery nearly balanced by the back EMF of the moving current sheet so thatthe axial electric field actually dominates the conductivity. As seen from themeasurements, this was found to be true with the appearance of three regionsbounded by the character of the radial electric field. In Region I, the radialelectric field is very large caused by the separation of the electrons caught on anEr ×Bθ drift while the ions have a large momentum and penetrate deeper intothe sheet with only a slight deflection towards the cathode. This radial electricfield does, however, slow down the ions into Region II, although it emphis notenough to slow the ions down completely to sheet speed. Region I was foundto be dominated by axial electron current making up a significant fraction ofthe total current, but not the entire current. Region I was found to be about
50

5 mm thick for argon. As the separation of the ions and electrons induces aradial polarization field, it also creates a radial current. This radial current,although relatively small, interacts with the azimuthal field enough to cause theion trajectories to deflect even more towards the cathode. In Region II, with theions now moving slower and slightly deflected, axial ion current dominates withions recombining on the electrode surface to complete the total current. Burtonsuggested that this produces a jiz × Bθ that further decelerates the ions tosheet speed. Region II was also found to be the location of a large heavy speciespressure gradient. As the radial electric field actually reverses sign (although notto the same magnitude) in Region II, the electrons actually try to drift againstthe current flow, however, with the greater ion density, collisions dominate andthey remain relatively stationary with respect to the sheet. In Region III, theaxial electric field is still negative, although smaller and returning to zero. Asthe ion density is low here, there is actually the possibility of a small reversecurrent being carried by the electrons in the trailing edge of the current sheet.The total sheet was found to be about 1 cm thick at the center line with a slighttilt, anode front leading cathode. At that time, no explanation was given forthe tilt.
This tilt or cant of the current sheet has been investigated in more recentwork at Princeton [52]. In brief, optical measurements of sheet speed and tiltingangle have qualitatively found that larger molecular weight propellants experi-ence more canting, and that the canting angle is independent of initial voltage orpeak current. Research is continuing with Schlieren photography and a furtherdiscussion is presented in the next subsection.
7.3 Current Sheet Canting
From Lovberg’s work and others it is clear that the molecular weight of thespecies plays an important role in determining the degree of canting. Usingthe same parallel-plate apparatus, Lovberg did not see canting with hydrogen,but did, in fact, see it using nitrogen and argon. Recent work at Princeton(Ref. [52]) has begun to study the degree of canting based on a parametricanalysis of propellant species, gas density, and magnetic field (initial voltageand current) strength.
Other researchers who have observed canting include Keck at Avco-Everettwho, like Lovberg, saw significant differences in magnetic probe data dependingon the polarity of his coaxial accelerator using argon [58]. For the positivepolarity, anode center, he noticed a 2 cm thick sheet that was tilted out alongthe anode. Although this result is to be expected from the stronger Lorentzforce near the center electrode (regardless of polarity), he observed differentbehavior with reverse polarity. With the cathode as the center electrode, henoticed a very planar but thicker, 4 cm, current sheet that moved slightly slowerthan the positive polarity. In the same company, Fishman and Petschek triedto explain this phenomenon by combining the non-uniform Lorentz force andthe assumption that the ions must carry a significant part of the current byrecombination on the cathode [59]. In both polarity case, the non-uniform
51

Lorentz force and potentially a precursor shock-wave were suspected to pushsome of the propellant towards the outer electrode. When the anode is thecenter electrode the ions are pushed toward the cathode which is considered the“normal” mode and the total current can be accounted for easily. If the centerelectrode is the cathode, however, now the ions are forced to moveaway fromthe cathode. With insufficient electrode emission at the cathode, the ions mustslowly diffuse to the cathode against the Lorentz force, potentially spreadingout and slowing down the current sheet due to the higher plasma resistance.Fishman and Petschek’s model also suggests that a relatively large amount ofmass might be left behind near the outer electrode in a “bubble” where thecurrent sheet has a smaller current density and is more permeable.
In yet another experiment, Liebing observed canting in a parallel plate ac-celerator using argon and a lumped transmission-line energy source [60]. Usingstreak cameras and magnetic field probes, Liebind found that the luminous frontmatched well with the current conduction zone and that the anode always ledthe cathode. He reversed polarity and found a similar result with evidence ofan “anode foot” that was spread out with a lower current density than thatobserved at the cathode. A bright spot noticed near the cathode was sug-gested to be from radiation of plasma left behind the sheet. Finally, in anotherseparate experiment using a ruby laser Schlieren system and a parallel-plate ge-ometry, MacLelland noticed similar canting effects, although more pronouncedwith argon than hydrogen [61]. Still, even in the hydrogen discharges, thesheet eventually becomes canted with long enough electrodes and pulse dura-tion. MacLelland also saw that, in a region near the cathode, the sheet was fairlyplanar and that an “anode foot” developed into the final canted structure.
With all of these researchers observing canting in pulsed accelerators, onlytwo really tried to explain the reasons why it occurred in detail. In Ref. [62],Bostick examined a coaxial geometry and suggested that Hall currents com-bine with the normal, radial electron conduction current to give a total currentdeflected an angle. He also suggested that the current loops required for thesenear-axial Hall currents could be accounted for through the inclusion of “plasmavortices” within the current sheet that result from the sheer as the tilt devel-ops. His evidence for such vortices was from the oscillating magnetic and axialelectric field data he (as well as others he cited) had collected. In Ref. [63] Jo-hansson, yet again at Avco-Everett, examined the current sheet tilt in an inversez-pinch with hydrogen and argon at similar pressures. In this experiment, UVphoto-detectors and magnetic field coils were used to measure the progressionof the sheet. Like MacLelland, Johansson noticed an eventual canting in bothhydrogen and argon discharges, although the tilt in hydrogen only occurred ina region near the anode. Near the cathode, the sheet was seen to be moreplanar with hydrogen, but the cant consumed the entire discharge in argon.At similar pressures, 100 mT (same H2 and Ar number density), and using aseparate high-voltage system to provide uniform initiation, Johansson saw thatthe tilt angle was similar between the two gases as a function of radius withthe hydrogen discharge traveling almost twice as fast. In more extensive testswith argon at low pressures, he found that the trajectory of the center-of-mass
52

of the sheet propagated as expected from a snowplow model. At higher pres-sures, the luminous region ran slightly ahead of the center-of-mass indicatinga slightly permeable current sheet. The tilt angle as a function of radius (tiltangle increases slightly with radius) was similar at all the pressures althoughthe current sheet was very diffuse at the highest pressures making it difficultto quantify exactly. Johansson postulated that since the cathode could not becapable of producing the necessary electrons to conduct the total current, thations must be the dominant current carriers near the cathode. He calculated theheight (distance from the anode) where ions were assumed to carry all of thecurrent as,
h0 =1q
√2Mw
µ0n, (19)
where q is the charge of the ion, Mw is the molecular weight, and n is theambient fill number density. He found this estimation to be roughly correctcompared to his own data, Lovberg’s and others.
In all of these research projects it seems that ion conduction, molecularweight (gyro-radius), number density, and the lack of sufficient electron con-duction from the cathode (possibly surface effects) are involved in the cantingeffect. Canting has been observed in parallel-plate, coaxial, z-pinch, and inversez-pinch geometries with the anode always leading the cathode. Although it ap-pears that many researchers are satisfied with their own explanation, a unifiedtheory that yields the canting angle (or how to eliminate it altogether) as a func-tion of accelerator design parameters such as electrode separation, propellanttype, total current, etc. requires further, more detailed, investigation.
8 Acceleration Model Development
Researchers in almost every program studying pulsed plasma accelerators usedan acceleration model (only the more detailed studies will be covered here) thatconsisted of an effective circuit equation representing the discharge elements,and a momentum equation that usually included a coupling term between themotion of the discharge and the effective driving circuit. It is this driving termthat makes the typically one-dimensional equation set non-linear and impossibleto solve analytically without making some severe approximations to uncouplethe equations. In general, there are two classes of solutions, those using aconstant mass (a “slug-mass” approximation) and those including the sweepingup of mass as the current sheet progresses. The earliest work which suggestedthat the current sheet acts like a “snowplow” can be found in Ref. [41] whereRosenbluth examined an infinitely thin sheet with no plasma resistance.
In one of the first papers on an acceleration model for plasma thrusters,Republic Aviation used a non-dimensional slug-model for the propellant elimi-nating any dynamic efficiency effects [30]. They also did not include any effectsof plasma resistance, wall effects or radiation, although they did include a lin-early distributed resistance for the electrodes. They tested two cases depending
53

on integration time, however, they did not use a computer to solve the equa-tions. The “long time” model used asymptotic analysis to integrate the circuitand momentum equations out to an effective infinite time later. As any solutionto the these equations shows a damped current waveform, the current flowingthrough will be zero and the velocity will be constant at the end of the integra-tion. Using this technique, the energy stored in the magnetic field and capacitorare also zero by the end of the integration. Along with the simple slug-massassumption and without including the plasma resistance (instead, using a con-stant electrode resistance), this allows the equations to solved at t=∞. Thesolution given for the efficiency is,
η(t = ∞) = 1− 21 +
√1 + EL′2/2mbitR2
0
, (20)
where L′
is the inductance-per-unit-length, E is the energy per pulse, mbit isthe slug-mass accelerated, and R0 is the constant resistance of the electrodes.The “short time” model assumed that the sheet motion was weekly coupled tothe external circuit, i.e. that the inductance was constant. This assumptionmakes the problem linear with separate, analytic solutions to the circuit andmomentum equations. Again assuming a constant resistance,
ηst =18L′2 E
mbit
1R2
0
=1
2√
2L′
R0ue. (21)
Including the effects of linear electrode resistance introduces a small correctionand gives a cut-off for the initial inductance value where efficiency begins todecrease,
L0 ≤ R20C
9. (22)
Otherwise, the initial inductance does not enter into the efficiency.The non-dimensional slug model for acceleration presented in Ref. [30] is
interesting in that it provides a resistance that varies as the current sheet movesdown the electrodes, however, they found this to be a minimal effect. Their“short time” solutions do not include the effective resistance generated by thecurrent sheet motion. Although this uncoupled model does not represent theelectro-mechanical system correctly, it does provide a base for understanding theperformance scaling. Their “long time” solution includes the effects of changinginductance, however, it does not include the effects of subsequent dischargestypically found in accelerators with an oscillatory current. It also does nottake into account the finite length of electrodes and corresponding maximumchange in inductance for a given geometry. Still, with all of these assumptions inmind, it does produce an interesting scaling relation for a slug-like mass, Eq. 20,that with Eq. 21, shows a monotonic increase in efficiency with increases ininductance-per-unit-length and energy, and decreases in mass bit and externalresistance.
In Ref. [28], Hart used a slug-mass circuit model that was solved using acomputer and only at a few conditions. Although Hart recognized that the
54

solutions could not be realized in the experimental accelerators with ambientfills, he thought that the results might apply reasonably well to pulse-injectedsystems. Hart showed, as expected, that not as much energy goes into internalmodes of the plasma for slug-like distributions with a corresponding increase inefficiency. Current waveforms predicted from this model were close to criticallydamped in character indicating a large rate of inductance change which, inreality, would require long electrodes. Hart also examined a constant massdistribution snowplow model and found very different waveforms dependingon gas density. Hart also showed that a snowplow model could be modifiedslightly to account for the finite thickness of the current sheet although it did notsignificantly effect the results unless the thickness was on the same order as thethruster electrode length. In later work [29] Hart presented a modified snowplowmodel for coaxial accelerators with very small inner electrodes. The modifiedmodel was required to explain his experimental sheet velocity measurements,although a significant amount of unaccounted for Teflon insulator was probablythe cause of the deviation from normal models.
Another slug-model developed at NASA Lewis and described in Ref. [37],actually included snowplow-like effect for mass that was eroded from the elec-trodes and accumulated as the current sheet progressed. As can be expected,the performance in this model strongly depended on a mass ablation coefficientthat determined the ratio of ablated mass to injected propellant mass. Theoverall trends, however, showed a similar global result to other one-dimensionalmodels with the highest predicted performance corresponding to large valuesof inductance-per-unit-length, initial voltage, capacitance and small values ofinitial inductance and resistance.
A more advanced, non-dimensional model developed later at Lewis and pre-sented in Ref. [36] used a distributed propellant mass and included terms forionization energy losses, radiation losses, wall drag due to ion diffusion, and heattransfer from the plasma to the electrodes through the inclusion of a plasmaenergy equation. The inclusion of the plasma energy equation included thefollowing assumptions:
• The mass distribution function is not related to any physical phenomenon;that is, it does not have an exponential or linear nature that would beexpected from pulsed gas injection or a uniform fill.
• Wall drag includes the loss in forward momentum from ions diffusing tothe wall based solely on temperature and not current conduction.
• The internal energy of the plasma is based solely on temperature withoutincluding pressure effects. Energy is transferred to the plasma from themass accumulation process and ohmic heating. Energy is lost from theplasma through heat conduction to the electrodes, electron current con-duction, ion diffusion and recombination near the electrodes, ionizationand radiation. It should be noted (by the author’s own admission), how-ever, that although ohmic heating, ionization, and radiation losses appearin the equations, they are not included in the actual solutions.
55

• The initial temperature is not specified explicitly in Ref. [36] and no pro-files for plasma temperature are mentioned or displayed.
The effects of introducing the plasma energy equation are present in com-paring the results of the more advanced model with one that does not includethese losses, as shown in Figure 12. In general, the efficiency is found to fol-low a similar trend, peaking at a particular “Mass Loading Parameter” that isslightly smaller than what is predicted by the simplified model. The relative lossis smallest at small values of the Mass Loading Parameter. The Mass LoadingParameter is defined as,
M≡ 2`m0
L′Q20
=`m0
L′CE0(23)
which includes the amount of mass in the initial discharge (m0), the initial en-ergy (E0) or charge (Q0) on the capacitor, the capacitance (C), the inductance-per-unit-length (L
′), and the length of the electrodes (`), but not how the mass
is distributed. This definition makes it hard to differentiate between the variousparameters, and its experimental value strongly depends on the initial masstaken up by the current sheet, a very difficult quantity to determine. The au-thors suggest that the largest loss is through ion diffusion to the walls and thatradiation losses are negligible, although they do not provide magnitudes, relativeor absolute. They also suggest that radiation cooling could play a significantrole, although it is not included in the final plasma energy equation. Althoughthe model did not seem to match well with experimental data, this could havebeen as much a result of trusting calorimetry performance data then the faultof the model. Without more information on the temperature profile as a func-tion of time, it is hard to say if the plasma energy equation and the associatedassumptions were reasonable. Finally, it should be noted that the advancedmodel did not take crow-baring into account and used a non-dimensionalizationscheme based on the final inductance of the current sheet at the end of theelectrodes. The integration was carried out until the current sheet reached theend of the electrodes.
The simplified model that did not include the plasma energy equation did,however examine the effects of crow-baring at a beneficial time when the currentis zero (no energy is stored in the magnetic fields) and at the worst time whenthe current is maximum. In general, the effects of choosing an appropriate crow-barring time were more pronounced than those observed from the addition ofthe various loss mechanisms with up a 40% performance reduction predictedusing the “maximum current” crow-bar time. Experimentally, the crow-bartime was seen to depend on accelerator geometry, especially near the breech.Later geometries included an “inhibitor ring” that delayed the crow-bar to whenthe total current was smaller. The performance measurements are presented inmore detail in the section on work at NASA Lewis in Part I, however, in general,they did not match the predictions in either absolute values or functional form.The author’s explain this discrepancy based mainly on the assumed initial massdensity profiles.
56

Researchers in Italy followed almost the same exact non-dimensional schemeas Lewis’ simplified model in their acceleration model studies [64]. Their model,however, also assumed infinite conductivity of the plasma and driving circuitleaving the expanding current sheet as the only impedance. This assumption ledto underdamped waveforms in almost every solution. A gaussian propellant dis-tribution was also examined and produced a result similar to the mass-loadingdistribution used by Lewis. The research at Italy mainly contributed two things:1.) As it was developed in 1972, computers were far enough along in their devel-opment to provide a large number of solutions for a wide range of parameters.2.) A second, quasi-2D model examined the non-uniform Lorentz force in coax-ial accelerators and found very different current sheet profiles depending on theradial propellant loading. This second model, however, did not make any cor-rection for the canting effect noticed in many coaxial geometries and discussedpreviously.
At Princeton, Jahn included a comprehensive study of acceleration models inhis book [1]. Pulling information from similar models in the literature, he useda non-dimensional approach based on the initial conditions for a parallel-plateaccelerator. He examined the current waveforms and resulting current sheettrajectories for both slug and uniform propellant distributions. In a later non-dimensional model developed at Princeton, the effects of an expanding electrodegeometry and an exponential mass distribution expected from kinetic theorywere included along with the normal constant plasma resistance and snowplowmodels [45]. In the results from this model, tested over a wide range of parame-ters, the performance was seen to behave differently depending on the nature ofthe current waveform. In general, the efficiency increased with decreasing circuitresistance, however, for the underdamped cases with a uniform propellant fill,a maximum in the efficiency was found with a Dynamic Impedance Parameter,α, value near unity,
α =L′3V 2
0 C2
18L20m
′ , (24)
where m′is the mass density gradient coefficient. For critically or overdamped
cases with a uniform fill, the efficiency increased with α1/4 yielding,
η ∝ 4
√8L′3V 2
0
9R40m
′ , (25)
with R0 (including only the internal capacitor resistance and the plasma resis-tance) having the strongest influence. The thrust-to-power ratio decreased withincreasing α for the underdamped cases and remained relatively constant over αfor the critically or overdamped cases. Using an exponential mass distributionincreased the efficiency and thrust-to-power ratio in accordance with the dy-namic efficiency improving. The character of the efficiency was also changed forthe underdamped case with the maximum point shifting to much higher valuesof α, > 10. Higher values of α, however, were also seen to require very longelectrodes with total inductance changes on the order of 100 × L0 which are
57

very difficult to achieve in reality. The nature of the thrust-to-power ratio didnot change for the exponential mass distribution. Using flared electrodes alsoimproved performance, but not to the same extent as the non-uniform propel-lant density. Further development of this model including crow-baring for theunderdamped cases and finite-length electrode effects are ongoing at Princeton.
9 Estimates of Performance Scaling
This section differs from the previous section on acceleration models in that itspecializes in how these acceleration models predict performance scaling. Manyof the models mentioned earlier were not used explicitly to determine perfor-mance scaling, rather to check the trajectories of current sheets observed experi-mentally and determine the sweeping efficiency. Part of the reason why the earlymodels did not search out more general trends is due to the lack of computerresources to examine a wide number of cases and develop trends. In addition,experimentally observed effects such as current sheet permeability as a functionof the driving circuit and propellant loading were not included in the models.Simple estimates of performance based on both empirical data as well as simpleacceleration models have paved the way for improvements in GFPPTs.
The first simple scaling relation came from the asymptotic solutions of aslug-model studied at Republic Aviation [30]. In that model, the efficiency wasseen to scale as:
η(t = ∞) = 1− 21 +
√1 + EL′2/2mbitR2
0
, (26)
where L′
is the inductance-per-unit-length, E is the energy per pulse, mbit isthe slug-mass accelerated, and R0 is the constant resistance of the electrodes.In another “short time” model, it assumed that the sheet motion was weeklycoupled to the external circuit, i.e. that the inductance was constant. Thisassumption makes the problem linear with separate, analytic solutions to thecircuit and momentum equations. Again assuming a constant resistance,
ηst =18L′2 E
mbit
1R2
0
=1
2√
2L′
R0ue. (27)
Including the effects of linear electrode resistance introduces a small correctionand gives a cut-off for the initial inductance value where efficiency begins todecrease,
L0 ≤ R20C
9. (28)
Otherwise, the initial inductance does not enter into their efficiency estimates.These results show a monotonic increase in efficiency with increases in inductance-per-unit-length and energy, and decreases in mass bit and external resistance.
In more recent work at Princeton, a similar, fixed element approximation [44]for performance scaling has been developed for coaxial and parallel-plate elec-trode geometries. In the fixed element solution, primarily modeling a critically
58

damped waveform, the inductance was assumed not to change (although it wasgiven an average value, < L >, greater than the initial inductance, L0), and theeffective resistance was also held constant. The impulse was assumed to dependsolely of the integral of the current squared with the final relation showing alinear dependence on the initial energy stored in the capacitor,
Ibit = L′√
C
< L >E. (29)
The efficiency was predicted as,
η =I2bit
2mbitE=
12L′2 C
< L >
E
mbit=
12L′√
C
< L >ue. (30)
Note that in this approximation, the average inductance quantity depends onthe position of the current sheet and the inductance-per-unit-length. In thisway, the efficiency could also be considered to depend on
√L′/
√`elect. In any
case, both the impulse bit (thrust-to-power ratio) and the efficiency are expectedto scale with a square-root of capacitance. A similar relation can be found inRef. [65].
In a more complicated snowplow model for a z-pinch at Princeton [40], themodel results were put together with experimental data to find that, when thesweeping efficiency was high, the sheet velocity was seen to scale with the non-dimensional “magnetic interaction parameter” β,
β ≡ − µ0Q20
4π2ρ0r40
= −µ0
2π
h
r20
CE
mbit, (31)
where ρ0 is the initial density, r0 is the outer electrode radius, and h is thedistance between the electrodes. Various values of the β parameter were inves-tigated using different mass densities and outer electrode radii. The pinchingeffect was also found to be a strong function of β with the pinch occurring beforethe current reversal for |β| > 0.2.
In another, non-dimensional model including the effects of a flared electrodegeometry and an exponential mass distribution [45], the performance was seento behave differently depending on the nature of the current waveform. In gen-eral, the efficiency increased with decreasing circuit resistance, however, for theunderdamped cases with a uniform propellant fill, a maximum in the efficiencywas found with a Dynamic Impedance Parameter, α, value near unity,
α =L′3V 2
0 C2
18L20m
′ , (32)
where m′is the mass density gradient coefficient. For critically or overdamped
cases with a uniform fill, the efficiency increased with α1/4 yielding,
η ∝ 4
√8L′3V 2
0
9R40m
′ , (33)
59

with R0 (including only the internal capacitor resistance and the plasma resis-tance) having the strongest influence.
In the non-dimensional model developed at NASA Lewis [36] and used againat the University of Pisa [64], the optimal performance over many operationalparameters occurred when the Mass Loading Parameter was near unity. TheMass Loading Parameter is defined as,
M≡ 2`m0
L′Q20
=`m0
L′CE0(34)
which includes the amount of mass in the initial discharge (m0), the initial en-ergy (E0) or charge (Q0) on the capacitor, the capacitance (C), the inductance-per-unit-length (L
′), and the length of the electrodes (`), but not how the mass
is distributed. This definition makes it hard to differentiate between the variousparameters, and its experimental value strongly depends on the initial masstaken up by the current sheet, a very difficult quantity to determine.
In experimental performance scaling experiments, it is interesting to notethat thrusters with current rise rates per unit width of less than 1012A/(m · s)have empirically been shown to have less than 100% sweeping efficiency [1, 40].In the case of Lovberg’s experiments where he found mixed results [7, 14], thiscriteria holds true: the parallel-plate accelerator has a width of 8 cm and acurrent rise rate of 250e9 A/s giving about 3e12 A/ms while the coaxial geometryhas an average width of 22.6 cm and a current rise rate of 160e9 A/s givingabout 0.7e12 A/ms. In accordance with the rule of thumb, the parallel-platethruster showed behavior like a snowplow while the coaxial geometry did not.In another coaxial geometry tested later at GD [11], a higher capacitance andsmaller average radius electrodes reached up to 1.4e12 A/ms [11]. Although theauthors did not expressly try to match or exceed this criteria at the time, probedata confirmed that the current sheet was indeed acting like a snowplow in thislater, coaxial device. This rule of thumb applies well to almost any geometryas demonstrated in other experiments as well, frequently without the authorsrealizing that they did meet the criteria [19, 35, 63]. It is also interesting tonote that in many experiments where the sheet was classified not to be aneffective sweeper [7, 28, 39], the sheet velocity scaled as the square-root of theenergy to mass ratio as apposed to an expected linear scaling as predicted foreffectively sweeping sheets [14, 31, 40, 63]. In Ref. [54], Guman showed witha relatively simple model that the square-root scaling would be expected foran electrothermal acceleration mechanism. The linear relation is expected forelectromagnetic acceleration as shown in Eq. 30.
Many experimental performance scaling studies have been completed in GF-PPT research, although, unfortunately, many of them have not been controlledexperiments. That is to say that instead of varying only one parameter (capac-itance, for example) at a time, most researchers enact many changes at once,sometimes without even realizing it. Therefore, any conclusions they makeabout their modifications cannot be attributed to a specific change in one pa-rameter and the specific scaling relation is unclear.
60

At General Electric, following many, multi-parameter modifications [20], theefficiency was shown to be linear with exhaust velocity over a wide range ofmass bits (smaller mass bits gave higher efficiency) with a relatively constantthrust-to-power ratio near 20 µN/W at similar capacitance and discharge en-ergy levels [21]. GE also conducted a performance survey over five differentcapacitance values from 50 to 200 µF to find that the performance scaled withthe square-root of the capacitance to within 5-10% [23]. As discussed in thesections on research at GE and GD in Part I, however, GE’s performance mea-surements have the possibility of including facility background-contamination.This may add doubt to their absolute performance measurements, but perhapstheir scaling trends are more acceptable.
Hart may have been the first one to realize that a solid-propellant Teflonthruster could have space-flight applications (see footnote in Ref. [29]. Al-though he tested a variety of geometries, capacitance, inductance, and massbit values, unfortunately all of his experiments were influenced by the ablationof a significant amount of Teflon from the backplate. With gas propellant massbits between 10 and 500 µg and discharge energy levels being a 1 kJ or higher,The majority of the discharge could easily have been made up of Teflon at thelowest, middle, and even highest mass bits for the small inner electrodes. Al-though his computation models are valid (except possibly the modified form ofthe snowplow model), the results from streak photos that do not distinguish theradial position of the current sheet do not provide an adequate comparison orverification of the models. The “Mode II” operation showing the fastest sheetspeed is probably a result of a canted current sheet leading down the centerelectrode (anode) much faster than the true plasma center-of-mass.
At Princeton, the performance of a low-energy, high-rep-rate GFPPT wasstudied parametrically. Two energy levels for each of two capacitance valueswere tested over ten different mass bit values each yielding a 40-point GFPPTperformance database. Four graphs which show PT5 performance as a functionof mass bit and specific impulse with the capacitance and the initial storedenergy level as parameters are shown with error bars in Fig. 18. Each pointrepresents at least twenty trials including separate measurements of impulse,mass bit, and energy at the same conditions. Values of the performance dataare given at the end of this section in Table 9. It is evident from all the plotsin Fig. 18 that for each curve there is a transition with decreasing mass bit(or increasing Isp) from a mode (Mode I) where the efficiency and the impulseare respectively independent and dependent on the mass bit (and where theefficiency the thrust to power ratio are respectively independent and dependenton Isp) to another mode (Mode II) where the converse statements hold.
Simple analytic models presented in the previous section show that the ef-ficiency and thrust-to-power ratio should scale with the square-root of capac-itance and not depend on the energy (at a constant exhaust velocity) for anelectromagnetic accelerator. These trends are evident in Mode II where theefficiency increases linearly with the specific impulse and the thrust-to-powerratio is relatively constant.
It is interesting to note that the performance scaling suggested for a thruster
61

where electrothermal acceleration is dominant are quite different (again, seeRef. [54]). In that case, the impulse bit is expected to scale with the square rootof the discharge energy to mass bit ratio and not depend directly on capacitanceor inductance change. In addition, the efficiency of a pure electrothermal ac-celerator is expected to be constant over wide range of specific impulse, energyand mass bit values. While the efficiency as seen in panels c and d of Fig. 18 isindeed independent of mass bit and Isp at high mass bit values (i.e. Mode I), itdoes show a dependence on energy, albeit a weaker one than for Mode II. Thistends to indicate that the acceleration in Mode I may be due to a combinationof both electrothermal and electromagnetic effects. Again, as the losses associ-ated with sweeping up the propellant are not accounted for in these predictions,an explanation for trends in Mode I could be a function of improved dynamicefficiency as well.
In general, all the models and experimental evidence points to using high-voltage, high-capacitance, high-inductance-per-unit-length, low mass dischargeswith a minimum of parasitic inductance or resistance and short electrodes. Cur-rent sheet permeability, propellant utilization efficiency, and the potential prob-lems of crow-bar discharges are important to consider when designing the drivingcircuit as well. Discharge symmetry, and the resulting decrease in performancefrom asymmetric discharges, are a result of proper discharge initiation.
10 Experimental Performance Measurements
Again, many of the experimental performance measurements have been pre-sented before, however they will be repeated here to some extent. The measure-ments are divided according to research laboratory and the results are sometimesshown graphically or with tables in Part I. More details on specific geometriesor the progression of GFPPT design at each laboratory can be found in Part I.
10.1 Summary of GD Performance Measurements
The measurements presented here were performed during the later stages ofGFPPT development at General Dynamics [17] using a thrust stand (pulsedoperation at 10 Hz gave effective “steady” measurement and average impulse bit)and an appropriately conditioned thruster to eliminate contamination effects.The capacitance was increased to a final value of 140 µF with a distributedinductance giving nearly a square current pulse. The geometry of this thrusterwas slightly different than that of Figure 1. The length of the center electrodewas shorter (5.5 cm) with the same radius (1.9 cm) while the outer electrodewas about the same length (15.8 cm) but had a larger radius (6.25 cm). Thenew radius ratio was about 3.3. The propellant was injected radially at thebreech with the discharge initiation timing controlled by a gas-discharge switch.Propellant utilization was measured to be just over 60% with nitrogen and a350 µs delay. The mass bit was controlled by changing the feed pressure andthe quantity was determined by integrating measured density profiles. Both
62

nitrogen and xenon data were used in this study as shown in Tables 1 and 2and Figures 3 and 4. In general, the efficiency varied from 6 to 56%, the specificimpulse varied from 350 to 13,000 s, and the thrust-to-power ratio varied from33.5 to 8.7 µN/W, respectively, depending mass bit and energy. As expected,the highest efficiencies corresponded to the highest energy and lowest mass bitvalues, however, the thrust-to-power ratio is highest at the lowest energy andhighest mass bit values.
Thrust stand data was also obtained using a GFPPT very similar in designto General Electric’s A-7D GFPPT with axial propellant flow (xenon) and a sep-arate high-voltage discharge initiation system. GE’s mass injection scheme wasduplicated very closely to insure the same propellant utilization (> 90%) anddensity profiles. While faraday cup measurements of ion velocity and exhaustbeam divergence were very similar to those obtained at GE (see next section),thrust stand and performance measurement data disagreed with significantlylower values measured at General Dynamics [17]. Table 3 shows performancevalues at four energy levels. For this device, the efficiency is relatively con-stant at a fixed energy while the thrust-to-power ratio still shows a tendency todecrease with increasing energy and decreasing mass bit.
10.2 Summary of GE Performance Measurements
The measurements provided in Table 6 and Figures 6 and 7 represent thrust-stand measurements from GE’s A-7D model using xenon propellant and a144.5 µF capacitor bank with a Q-factor of 14. Unfortunately, only energy (withQ-factor reduction), specific impulse, and efficiency were given in Ref. [23] whereall of this data is reported in graphic form. This is, however, the best source forpure data as GE did not frequently show many points in a data set or any tabu-lar information. The mass bit and impulse bit values must, therefore, be inferredfrom the reported specific impulse, voltage, and efficiency measurements,
I∗bit =2η
Ispg0
12CV 2
0
(1− 1
Q
), (35)
m∗bit =
I∗bit
Ispg0, (36)
where the star superscript indicates the inferred quantities. Finally, it must benoted that out of every lab conducting GFPPT performance measurements onthrust stands [4, 5, 17], GE is the only one that did not report any decreasein measured thrust or impulse over the first 100-1000 pulses, including tests atsimilar mass bits and energies. As GE’s protocol for measuring thrust is notpublished explicitly, it is unclear if any preconditioning of the thruster tookplace before the measurement.
Unfortunately, the researchers at GE did not mention any impulse decay ef-fects that have been observed at three other laboratories testing the performanceof GFPPTs on thrust-stands in diffusion pumped chambers [4, 5, 17]. Althoughresearchers at GE did not notice any performance changes from changing the
63

pulse frequency, details of the this experiment were not given. Rather thanpulse rate, the total number of pulses has been shown to be more importantin conditioning the thruster for proper operation. Without such conditioning,adsorbed gases from the electrode surfaces and organic-monolayers from theroughing and diffusion pumps can significantly alter both the amount of massin the discharge and the electrical conduction of the plasma near the electrodesurface. Although these effects could be beneficial, true performance as wouldbe expected in space operation can only be measured after a conditioning periodand as long as pump oil is not allowed to migrate to the thruster electrodes.
Three other pieces of evidence suggest that the performance measured atGE might include contamination effects:
1. GE’s vacuum chamber used three 32” diffusion pumps that did not havebaffles of any kind to prevent back-streaming. The closest pump was lessthan one meter away from the thrust stand [19].
2. Gridded ion velocity measurements taken by researchers at GE showeda significant amount of carbon and oxygen ions that varied from pulse-to-pulse. Although the total mass of these atoms may not have beensignificant compared to the xenon ions, their source and their effect onthe current sheet structure remains unknown [27].
3. General Dynamics constructed a very similar thruster to that of GE’sA-7D and found, at best, a factor of two smaller performance [17].
The last item can best be visualized graphically with the results from Ta-bles 3 and 6 being plotted in Figure 8. From this graph, it is easy to see that thedata measured at General Dynamics has significantly lower performance thanthat measured at General Electric. It should be noted that General Dynamicsand General Electric were competitors, however, only General Dynamics tookthe effects of background contaminants into account [17]. After 1970, there areno more publications from GE on GFPPTs, however, research at GE began onablative pulsed plasma thrusters in the late 1960’s.
10.3 Summary of Republic Performance Measurements
Unfortunately, the experimental work with the z-pinch, coaxial hybrid thrusternever produced an efficiency calculation in the journal publications. They weresuggested to be below 50% from calculations of the amount of energy going intothe internal losses of the capacitors [32]. Velocity measurements from probesdo not necessarily correspond to the mass averaged exhaust velocity as thesweeping efficiency of the sheet may not be 100%. For this thruster geometry,probably the most difficult thing to calculate was the mass bit which couldexplain the lack of efficiency data. In the summary produced by NASA Lewis [2],efficiencies were shown to be around 14% at 3,000 s (9.5 µN/W) with nitrogenalthough the exact configuration of the thruster is unclear compared to thejournal publications. In his last paper, Guman did measure the thrust-to-power
64

ratio (without specific impulse) and found that it asymptotes to about 9 µN/Wat small mass loadings (previously tested conditions) and reached almost anorder of magnitude higher, 80 µN/W at higher mass distributions. This was,by far, the largest thrust-to-power ratio measured for any GFPPT at the time,although the efficiency and specific impulse at this condition were probablyvery low. Still, the lack of continuing research on them at Republic after thismeasurement is puzzling, although Guman did begin ablative pulsed plasmathruster research soon afterwards.
10.4 Summary of NASA Lewis Performance Measurements
Researchers at NASA Lewis measured the performance (calorimetry) of fourdifferent accelerator designs, as shown in Table 8 and taken from Ref. [36]. Thethruster was conditioned by firing ten times prior to any measurement. All thedesigns used mainly argon for propellant and an ignitron switch for dischargeinitiation timing. The propellant utilization for these devices was estimated tobe 100% due to the short valve times (0.1 ms) and long barrels. The acceleratorswere all backed by a 12.1 µF capacitor bank that could be charged up to asmuch as 30 kV. Reduction in parasitic inductance came from improving theconnection between the capacitor bank and accelerator as well as modificationsto the gun geometry itself. Even with changes in propellant injection location,initial inductance, and inductance-per-unit-length, no noticeable difference inperformance was measured until the electrode length was reduced by slightlymore than 50%. Unfortunately, the inductance-per-unit-length was also changedin this configuration making the correlation with the stronger Lorentz force orreduced wall losses difficult to differentiate.
Probably the two biggest contributions from NASA Lewis are the most in-clusive acceleration model published from any of the labs [36] and the reviewof GFPPT research in 1965 [2]. Performance measurements at Lewis did notinclude thrust-stand data, although the thruster was pre-conditioned to elim-inate electrode contamination. In addition, although changes were made inthruster geometry, propellant distribution, and energy, they were not systemat-ically tested so correlation between the modifications and performance improve-ments could only be speculated. Finally, with only a few mass bit values testedand no amount of error reported, the trends presented in the data are difficultto distinguish.
10.5 Summary of Princeton Performance Measurements
To date, nine generations of SRL-EPPDyL GFPPTs have been tested with manymodifications on each generation. Using a low-voltage (250 V), low-inductance(< 5 nH) capacitor bank (45-270 µF, 1.4-8.4 J), these GFPPTs have close tocritically-damped current waveforms with no noticeable crow-baring. Peak cur-rents are close to 10 kA with pulses lasting about 5 µs. As shown schematicallyin Figure 15, during a burst the valve is only cycled once, therefore, the ultra-fast, high energy valves used in previous GFPPT designs are not required. As
65

the propellant flows at a constant rate, the propellant utilization is dictated bythe pulse frequency and the thermal velocity of the propellant. For example,using argon (vth ≈ 400 m/s) and a 4 kHz pulse frequency, the electrodes arerequired to be at least 10 cm long to ensure that none of the propellant escapesoutside of the discharge volume between pulses.
Although many different GFPPT designs have been tested at EPPDyL, thefifth-generation (designated as PT5) has undergone the most extensive perfor-mance measurements. Since its original design, changes have been made to itsdischarge initiation system and propellant distribution [10] as well as the per-formance measurement technique to insure proper conditioning [5]. As shownin Fig. 16, PT5 uses a stainless-steel, coaxial electrode set with an outer toinner electrode radius ratio of approximately four and a total volume of 350cm3. It uses four semi-conductor type surface-flashover spark plugs mountedon the inside of the outer electrode (cathode) at 90 degree azimuthal intervalsto initiate the discharge uniformly. The main discharge is driven by a low-inductance (10 nH) 130 or 270 µF capacitor bank which is capable of beingcharged to 250 V giving a maximum energy per pulse of 4 or 8 J, respectively.The entire thruster has a mass of approximately 6 or 8 kg depending on thecapacitance level and including the electrode mass as well as the thruster hous-ing mass. High-speed photographs of the discharge were taken with an ImaconFast-Framing Camera (IFFT) at rates of 500,000 frames per second. A series ofIFFT frames of PT5 showing the symmetrical discharge initiation are presentedin Fig. 17. Before the modifications to the gas manifold were made to makepropellant injection more uniform, the discharge initiation was seen to occurnear the region of highest pressure. This is a similar result to those researcherswho found spoking instabilities when the discharge was allowed to initiate basedsolely on a Paschen breakdown without an external switch.
Two energy levels for each of two capacitance values were tested over ten dif-ferent mass bit values each yielding a 40-point GFPPT performance database.Four graphs which show PT5 performance as a function of mass bit and specificimpulse with the capacitance and the initial stored energy level as parametersare shown with error bars in Fig. 18. Tables of the performance data are givenat the end of this section. It is evident from all the plots in Fig. 18 that for eachcurve there is a transition with decreasing mass bit (or increasing Isp) from amode (Mode I) where the efficiency and the impulse are respectively independentand dependent on the mass bit (and where the efficiency the thrust to power ra-tio are respectively independent and dependent on Isp) to another mode (ModeII) where the converse statements hold. More performance measurements withchanging inductance-per-unit-length are ongoing at Princeton.
66

Part III
Summary
11 Progression of GFPPT Designs
Gas-Fed Pulsed Plasma Thrusters have been developed in many laboratoriesover many years. Originally developing from the magnetic shock tubes [66, 67]and applications to fusion research [6], the first plasma guns of many labora-tories (see Refs. [8, 19, 28, 35] had long, coaxial electrodes with small radiusratios and propellant injection near the middle of the electrode volume. Typi-cally these first GFPPTs were also operated at high energy (> 1 kJ) and lowcapacitance (≈ 10µF) with the Paschen break-down controlling the dischargeinitiation. Many of the designs had relatively large amounts of parasitic induc-tance (≈ 100 nH) and lightly damped oscillatory current waveforms where thedynamics of the discharge were dominated by subsequent crow-baring. As thedesigns progressed, radius ratios were more than doubled, the electrodes wereshortened by almost a factor of four, the driving capacitance was increased byan order of magnitude the parasitic inductance and resistance were reduced asmuch as possible, and average energy was reduced to below 100 J. Some of theselater devices did not exhibit crowbarring with near critically damped currentwaveforms while others timed the crowbar (current reversal) to coincide withthe discharge reaching the end of the electrodes so that no energy stored inmagnetic fields was wasted. High speed, high voltage valves were introducedfrom improved propellant utilization, close to 100% in many designs. The dis-charge initiation process was also controlled with either a high current, lowinductance gas discharge switch or high-voltage spark triggers. Efficiencies ofthese devices were greater than 20 % at specific impulse values near 4000 s withthrust-to-power ratios close to 10 µN/W.
The progress was best summed up in 1965 where researchers at Lewis out-side of the experimental group produced a comprehensive review of GFPPTresearch [2]. It gave the following list of important lessons learned to date:
1. Calorimetry data from many labs did not agree with the subsequent perfor-mance data measured on thrust-stands. Thrust-stand data was generallyaccepted as the most accurate way to measure performance.
2. Crow-baring generally occurs in all unsteady devices sometime betweenthe voltage and current reversal points depending on thruster geometryand driving circuit parameters.
3. The main acceleration mechanism inside the current sheet was believed tobe primarily due to the polarization field created by the electrons trappedon an E ×B drift and the subsequent charge separation. The report alsomentioned, however, that many of the labs had very different results anddisagreed in this area, especially on the influence and existence of ionconduction.
67

4. The coaxial geometry (compared to pinch or parallel-plate) was suggestedto be the best because it trapped all of the electromagnetic fields althoughit has a large electrode surface area and small inductance-per-unit lengthwhich decreased efficiency.
5. Including an electric switch in the discharge initiation process (as apposedto using the Paschen break-down point alone) led to better repeatability,fewer spoking instabilities, and improved propellant utilization while, atthe same time, it introduced parasitic inductance and resistance as wellas adding reliability questions.
6. Stated the need for a simple performance model that was confirmed byrepetitive experimental performance measurements.
7. Stated that the only thing keeping GFPPTs from being used in space wastheir lack of “heat handling capability” and that research was shifting toquasi-steady devices which might have better performance.
Unfortunately, GFPPT research began to fade soon after this report. Thetwo main problems were the lifetime and performance issues associated with theultra-fast, high energy solenoid valves as well as relatively low performance andlarge system mass compared to other electric propulsion systems being devel-oped at the same time (ion thrusters for example) for main propulsion. Researchat General Dynamics, NASA Lewis, and Princeton shifted to quasi-steady gasfed devices where discharge times were increased and the current sheet was al-lowed to stabilize near the end of the electrodes. These devices did not requirethe fast valves of the past and showed promisingly better overall performancewith the ability to process many mega-watts of power in relatively small device.At the same time, as these devices are pulsed, they share the advantage of ar-bitrarily lower steady-state power consumption. Still, system mass was largeand this type of device did not experience in-space testing until recently withthe flight of the Japanese Space-Flier Unit. Research at General Electric andRepublic aviation shifted to ablative pulsed plasma thrusters that used muchlower energy and were geared more towards attitude control applications. Someof these US developed devices flew in space as early as the 1970’s on a Navysatellite.
Recently at Princeton, GFPPTs have resurfaced as a higher efficiency al-ternative to APPTs for attitude control applications, low-power deep spacemissions, and missions where a unique propellant requirement or contaminationissues are important. These GFPPTs operate at much lower energies than theirpredecessors and have similar, although slightly lower, performance. The fastacting valves have been replaced by using modern, solid-state pulse-formingtechnology that allows > 4 kHz pulse rates and steady mass flow during theburst of pulses. The performance scaling of the devices has been measured overa wide range of operational parameters, and two modes of operation depend-ing on propellant distribution, have been observed. The first mode has a highthrust-to-power ratio and relatively low efficiency while the second mode has
68

a relatively high efficiency and low thrust-to-power ratio. These thrusters arenow under consideration for various space missions.
12 Future of GFPPT Research
The future of GFPPT research still lies in the general category of improvingperformance. Although the modern, low energy devices have achieved simi-lar performance to the older, higher-energy devices while requiring much lessmassive systems, there are still areas where performance can be improved:
1. Understanding the permeability and canting of the current sheet as afunction of various operational parameters and, possibly controlling them.
2. Creating a more uniform, reliable discharge initiation system that reduceserosion rates.
3. Developing ways of further reducing parasitic inductance and resistanceor improving plasma conductivity especially at low energy.
4. Using higher inductance-per-unit-length electrode geometries, possibly withexternally applied fields.
5. Testing the devices in space examining potential contamination, perfor-mance, waste-heat processing, and EMI effects.
69

References
[1] R.G. Jahn. Physics of Electric Propulsion. McGraw-Hill, 1969.
[2] S. Domitz, H.G. Kosmahl, P. Ramins, and N.J. Stevens. Survey of electro-magnetic accelerators. Technical Report TN D-3332, NASA, 1965.
[3] O.K. Mawardi, editor. Proceedings of an International Symposium onPlasma Guns, Pysics of Fluids Supplement (Part II, Vol. 7(11)), November1964.
[4] W.J. Guman and W. Truglio. Surface effects in a pulsed plasma accelerator.AIAA Journal, 2(7):1342–1343, July 1964.
[5] J.K. Ziemer, E.Y. Choueiri, and D. Birx. Is the gas-fed PPT an electromag-netic accelerator? an investigation using measured performance. In 35th
Joint Propulsion Conference, Los Angeles, California, June 20-24 1999.AIAA 99-2289.
[6] J. Marshal. Performance of a hydromagnetic plasma gun. The Physics ofFluids, 3(1):134–135, January-February 1960.
[7] L.C. Burkhardt and R.H. Lovberg. Current sheet in a coaxial plasma gun.The Physics of Fluids, 5(3):341–347, March 1962.
[8] T.J. Gooding, B.R. Hayworth, and R.H. Lovberg. Instabilities in a coaxialplasma gun. AIAA Journal, 1(6):1289–1292, June 1963.
[9] R.H. Lovberg. Inference of plasma parameters from measurement of Eand B fields in a coaxial accelerator. In Proceedings of an InternationalSymposium on Plasma Guns, Pysics of Fluids Supplement (Part II, Vol.7(11)), pages S57–S61, November 1964.
[10] J.K. Ziemer, T.E. Markusic, E.Y. Choueiri, and D. Birx. Effects of ignitionon discharge symmetry in gas-fed pulsed plasma thrusters. In 34th JointPropulsion Conference, Cleveland, Ohio, July 13-15 1998. AIAA 98-3803.
[11] A.V. Larson, T.J. Gooding, B.R. Hayworth, and D.E.T.F. Ashby. Anenergy inventory in a coaxial plasma accelerator driven by a pulse lineenergy source. AIAA Journal, 3(5):977–979, May 1965.
[12] D.E.T.F. Ashby, T.J. Gooding, B.R. Hayworth, and A.V. Larson. Exhaustmeasurements on the plasma from a pulsed coaxial gun. AIAA Journal,3(6):1140–1142, June 1965.
[13] D.E.T.F. Ashby. Energy loss in pulsed coaxial plasma guns. AIAA Journal,3(6):1045–1047, June 1965.
[14] R.H. Lovberg. The measurement of plasma density in a rail accelerator bymeans of schlieren photography. IEEE Transactions on Nuclear Science,pages 187–198, January 1964.
70

[15] R.H. Lovberg. Schlieren photography of a coaxial acclerator discharge. ThePhysics of Fluids, 8(1):177–185, January 1965.
[16] R.H. Lovberg. Investigation of current-sheet microstructure. AIAA Jour-nal, 4(7):1215–1222, July 1966.
[17] A.V. Larson, L. Liebing, and R. Dethlefsen. Experimental and evaluationstudies of a coaxial plasma gun accelerator. Technical Report CR-54710,NASA, 1966.
[18] D.E.T.F. Ashby, L. Liebing, A.V. Larson, and T.J. Gooding. Quasi-steady-state pulsed plasma thrusters. AIAA Journal, 4(5):831–835, May 1966.
[19] P. Gloersen, B. Gorowitz, and J.H. Rowe. Some characteristics of a two-stage repetitively fired coaxial gun. IEEE Transactions on Nuclear Science,pages 249–265, January 1964.
[20] P. Gloersen, B. Gorowitz, and J.T. Kenney. Energy efficiency trends ina coaxial gun plasma engine system. AIAA Journal, 4(3):436–441, March1966.
[21] B. Gorowitz, T.W. Karras, and P. Gloersen. Performance of an electri-cally triggered repetitively pulsed coaxial plasma engine. AIAA Journal,4(6):1027–1031, June 1966.
[22] T.W. Karras, B. Gorowitz, and P. Gloersen. Neutral mass density measure-ments in a repetitively pulsed coaxial plasma accelerator. AIAA Journal,4(8):1366–1370, August 1966.
[23] B. Gorowitz, P. Gloersen, and T.W. Karras. Steady state operation of atwo-stage pulsed coaxial plasma engine. In 5th Electric Propulsion Confer-ence, San Diego, California, March 7-9 1966. AIAA 66-240.
[24] B. Gorowitz, P. Gloersen, and T.W. Karras. A 20 kW solor powered pulsedplasma engine system concept. In 3rd Aerospace Sciences Meeting, NewYork, New York, January 24-26 1966. AIAA 66-114.
[25] P. Gloersen. Current status of pulsed plasma engine development. In 2nd
Joint Propulsion Conference, Colorado Springs, Colorado, June 13-17 1966.AIAA 66-566.
[26] T.W. Karras and P. Gloersen. Consequences of the functional dependenceof performance on various factors in a systems weight analysis of a pulsedplasma transfer. In 8th Aerospace Sciences Meeting, New York, New York,January 19-21 1970. AIAA 70-168.
[27] T.W. Karras, B. Gorowitz, and P. Gloersen. Experimentally measuredvelocity distribution in the plasma stream of a pulsed coaxial accellerator.AIAA Journal, 4(8):1366–1370, August 1966.
71

[28] P.J. Hart. Plasma acceleration with coaxial electrodes. The Physics ofFluids, 5(1):38–47, January 1962.
[29] P.J. Hart. Modified snowplow model for coaxial plasma acclerators. Journalof Applied Physics, 35(12):3425–3431, December 1964.
[30] P.M. Mostov, J.L. Neuringer, and D.S. Rigney. Electromagnetic accelera-tion of a plasma slug. The Physics of Fluids, 4(9):1097–1104, September1961.
[31] L. Aronowitz and D.P. Duclos. Characteristics of the pinch discharge ina pulsed plasma accelerator. In E. Stuhlinger, editor, Electric PropulsionDevelopment, volume 9 of Progress in Astronautics and Rocketry. AcademicPress, 1963.
[32] D.P. Duclos, L. Aronowitz, F.P. Fessenden, and P.B. Carstensen. Diagnos-tic studies of a pinch plasma accelerator. AIAA Journal, 1(11):2505–2513,November 1963.
[33] L. Aronowitz. Delays in initiation of discharges in pulsed plasma accelera-tors. AIAA Journal, 2(11):2019–2020, November 1964.
[34] W.J. Guman. Switch-triggered pulsed plasma accelerator thrust measure-ments. AIAA Journal, 3(6):1158–1159, June 1965.
[35] C.J. Michels and P. Ramins. Performance of coaxial plasma gun with vari-ous propellants. In Proceedings of an International Symposium on PlasmaGuns, Pysics of Fluids Supplement (Part II, Vol. 7(11)), pages S71–S74,November 1964.
[36] C.J. Michels, J.E. Heighway, and A.E. Johansen. Analytical and experimen-tal performance of capacitor powered coaxial plasma guns. AIAA Journal,4(5):823–830, May 1966.
[37] D.J. Vargo. Electromagnetic acceleration of a variable-mass plasma. Tech-nical Report TN D-2164, NASA, 1964.
[38] C.J. Michels. Some transient electrical characteristics of the exhaust of aself-crowbarred coaxial plasma gun. Technical Report TN D-2571, NASA,1964.
[39] R.G. Jahn and W. von Jaskowsky. Structure of a large-radius pinch dis-charge. AIAA Journal, 1(8):1809–1814, August 1963.
[40] R.G. Jahn and W. von Jaskowsky. Current distributions in large-radiuspinch discharges. AIAA Journal, 2(10):1749–1753, October 1964.
[41] M. Rosenbluth. Infinite conductivity theory of the pinch. Technical ReportLA-1850, Los Alamos, 1954.
72

[42] N.A. Black and R.G. Jahn. Dynamic efficiency of pulsed plasma accelera-tors. AIAA Journal, 3(6):1209–1210, June 1965.
[43] R.G. Jahn, W. von Jaskowsky, and R.L. Burton. Ejection of a pinchedplasma from an axial orifice. AIAA Journal, 3(10):1862–1866, October1965.
[44] J.K. Ziemer, E.Y. Choueiri, and D. Birx. Trends in performance improve-ments of a gas-fed pulsed plasma thruster. In 25th International ElectricPropulsion Conference, Cleveland, Ohio, August 24-28 1997. IEPC 97-040.
[45] J.K. Ziemer and E.Y. Choueiri. Dimensionless performance model for gas-fed pulsed plasma thrusters. In 34th Joint Propulsion Conference, Cleve-land, Ohio, July 13-15 1998. AIAA 98-3661.
[46] R.L. Burton. Plasma Accleration in a Propagating Current Sheet. PhDthesis, Princeton University, 1966.
[47] W.R. Ellis. An Investigation of Current Sheet Structure in a CylindricalZ-pinch. PhD thesis, Princeton University, 1967.
[48] T.M. York. Pressure Distribution in the Current Sheet Structure of a Dy-namic Pinch Discharge. PhD thesis, Princeton University, 1968.
[49] R.L. Burton and R.G. Jahn. Acceleration of a plasma by a propagatingcurrent sheet. The Physics of Fluids, 11(6):1231–1237, June 1968.
[50] W.R. Ellis and R.G. Jahn. Ion density and current distributions in a prop-agating current sheet, determined by microwave reflection technique. Jour-nal of Plasma Physics, 3(2):189–213, February 1969.
[51] T.M. York and R.G. Jahn. Pressure distribution in the structure of apropagating current sheet. The Physics of Fluids, 13(5):1303–1309, May1970.
[52] T.E. Markusic and E.Y. Choueiri. Visualization of current sheet cantingin a pulsed plasma accelerator. In 26th International Electric PropulsionConference, Kitakyushu, JAPAN, October 17-21 1999. IEPC 99-206.
[53] J.K. Ziemer, E.A. Cubbin, E.Y. Choueiri, and D. Birx. Performance char-acterization of a high efficiency gas-fed pulsed plasma thruster. In 33rd
Joint Propulsion Conference, Seattle, Washington, July 6-9 1997. AIAA97-2925.
[54] W.J. Guman. Solid propellant pulsed plasma micro-thruster studies. In6th Aerospace Sciences Meeting, New York, New York, January 22-24 1968.AIAA 68-85.
[55] J.K. Ziemer and E.Y. Choueiri. Performance and erosion measurements ofgas-fed pulsed plasma thrusters at NASA jet propulsion laboratory. Tech-nical Report EPPDyL-JPL99a, Princeton University, March 1999.
73

[56] J. Blandino, D. Birx, J.K. Ziemer, and E.Y. Choueiri. Performance anderosion measurements of the pt8 gas-fed pulsed plasma thruster. TechnicalReport EPPDyL-JPL99b, NASA Jet Propulsion Laboratory, August 1999.
[57] J.K. Ziemer, E.Y. Choueiri, and D. Birx. Comparing the performance ofco-axial and parallel-plate gas-fed PPTs. In 26th International ElectricPropulsion Conference, Kitakyushu, JAPAN, October 17-21 1999. IEPC99-209.
[58] J.C. Keck. Current distribution in a magnetic annular shock tube. ThePhysics of Fluids, 5:630–632, 1962.
[59] F.J. Fishman and H. Petschek. Flow model for large radius-ratio magneticannular shock-tube operation. The Physics of Fluids, 5:632–633, 1962.
[60] L. Liebing. Motion and structure of a plasma produced in a rail spark gap.The Physics of Fluids, 6:1035–1036, 1963.
[61] J.R. MacLelland, A.S.V. MacKenzie, and J. Irving. Schlieren photographyof rail-tube plasmas. The Physics of Fluids, 9:1613–1615, 1966.
[62] W.H. Bostick. Hall currents and vortices in the coaxial plasma accelerator.The Physics of Fluids, 6(11):1598–1603, November 1963.
[63] R.B. Johansson. Current sheet tilt in a radial magnetic shock tube. ThePhysics of Fluids, 8(5):866–871, May 1965.
[64] M. Andrenucci, M. Caprili, and R. Lazzeretti. Theoretical performance ofpulsed coaxial plasma guns. Technical report, Universita di Pisa, 1972.
[65] D. Keefer and R. Rhodes. Electromagnetic acceleration in pulsed plasmathrusters. In 25th International Electric Propulsion Conference, Cleveland,Ohio, August 24-28 1997. IEPC 97-035.
[66] R.M. Patrick. High-speed shock waves in a magnetic annular shock tube.The Physics of Fluids, 2(6):589–598, November-December 1959.
[67] N.H. Kemp and H.E. Petschek. Theory of the flow in the magnetic annu-lar shock tube. The Physics of Fluids, 2(6):599–608, November-December1959.
74